Embed Size (px)
Citation preview

kpmg.ca
Economic Impact Assessment Study – British Columbia’s Rental Housing Sector November 2014 LandlordBC KPMG Canada

Table of Contents
Executive Summary i
1. Introduction 1
2. Methodology: Input-Output Modeling 4
3. Economic Impact of BC’s Rental-Housing Industry 11
4. Comparison of BC’s Rental–Housing Industry to Other Industries 19
5. Economic Impact of Capital Expenditures on Rental-Housing in BC 23

i
Executive Summary This study provides estimates of the economic impact in 2013 of BC’s rental-housing industry on the economies of BC and the rest of Canada. These are summarized at a high level in Exhibit 1 below. The Exhibit shows the sum of direct, indirect, and induced impacts.
Exhibit 1: Impact of BC’s Rental-Housing Industry
Note 1: includes property taxes
Note 2: includes deductions at source such as CPP, EI and QPIP deductions
Source: estimates from StatsCan I/O model using inputs from CANSIM, CMHC and
LandlordBC member questionnaire, KPMG calculations
As shown in Exhibit 1, this study estimates that BC’s rental-housing industry:
Contributed $12.25 billion to Canada’s GDP, of which $10.60 billion was generated in BC and $1.65 billion in other provinces.
Generated Labour Income of $5.82 billion and 98,937 Full-Time Equivalent (“FTE”) positions in Canada. In BC, the industry generated Labour Income of $4.87 billion and 82,851 FTEs.1 Labour income is a component of the GDP impact noted above.
Created $2.99 billion in government revenues in Canada, of which $2.56 billion accrued in BC. These amounts include sales taxes, personal income taxes, and property taxes collected by municipal and provincial governments as well as by the Government of Canada. Government revenues shown are a component of the GDP impact.
Generated Gross Output of $22.04 billion in Canada, of which $18.76 billion was generated in BC and $3.28 billion in other provinces.
1 In the remainder of this report will use the term “job” interchangeably with FTE. A job
is thus assumed to be equivalent to one full-time position that is held for one year.
BCRest of Canada Canada
GDP Impact 10.60 1.65 12.25Labour Income 4.87 0.94 5.82FTE Employment positions (No.) 82,851 16,086 98,937
Government Reveues
Taxes on Products and Taxes on Production (Note 1) 1.46 0.14 1.61Taxes on salaries (Note 2) 1.09 0.29 1.38
Total Gross Output 18.76 3.28 22.04
Summary of Economic Impacts ($ Billions)
This study estimates that in 2013, BC’s rental housing industry: Contributed $12.25
billion to Canada’s GDP.
Generated $5.82 billion of Labour Income in Canada.
Created 98 937 Full-
Time Employment Positions in Canada.
Contributed $2.99
billion to Government Revenues in Canada.
Created Total Gross
Output of $22.04 billion.

ii
To provide some context to these figures, Exhibit 2 below compares BC’s Rental Housing Industry to BC’s Mining Industry in terms of their economic impact. The Exhibit shows each sector’s impact on GDP and Gross Output across Canada. The impacts generated by the Rental Housing Industry significantly exceed those of the mining industry. A more detailed comparison to other industries is provided in Section 4.
Exhibit 2: Comparison of BC’s Rental Housing and Mining Industries
Source: estimates from StatsCan I/O model, Economic Impact Analysis Mining Association of British Columbia (PwC)
For this study, we have defined the rental housing industry to include rented apartments, houses, semi-detached houses, row houses, condominiums and other dwellings. This definition helps ensure that the full economic impacts of the rental-housing industry in BC are captured.
This study estimates that approximately 30 percent of BC households live in rented dwellings with the result that BC had about 540,000 rental units in 2013. Further, we estimate the industry generated approximately $7.08 billion of revenues in that year. This estimate of revenues includes rent as well as non-rent payments such as payments related to parking and laundry services. We also estimate that BC’s rental-housing industry made capital expenditures of approximately $4.65 billion in 2013; this includes both capitalized renovations and the construction of new rental-housing. The economic impacts outlined in this study are based on these estimates of rental revenues and capital expenditures.
The above estimates include direct, indirect and induced economic impacts. The definition of these impacts is provided in Section 2 of this study.
12.25
22.04
4.69
8.93
0.00
5.00
10.00
15.00
20.00
25.00
GDP Impact Gross Output
$Bill
iosn
GDP and Gross Output - Total Impacts in Canada
Rental Housing Mining

1
1. Introduction A. Background
LandlordBC2 retained KPMG LLP (“KPMG”) to undertake an assessment of the economic impact of BC’s rental housing industry. This study will help show that the rental housing industry is an important component of the BC economy , in addition to providing services that are critically important to many BC residents.
B. Approach to this Study
This study used information gathered from the 2011 National Household Survey, Statistics Canada’s (“StatsCan”) CANSIM database, the Canada Mortgage and Housing Corporation (“CMHC”) and an income and expense survey administered by LandlordBC.
Information from the sources above was used to develop estimates of the annual revenues and capital expenditures of the rental-housing industry in BC. These estimates were used as inputs to Statistics Canada’s Input/Output (“I/O”) model of the Canadian economy. The objective was to develop an assessment of the impact of the rental-housing industry on the economies of BC and Canada. In particular, this study provides estimates of the contribution of the rental-housing industry to British Columbia’s:
GDP;
Labour Income;
Employment levels;
Government revenues; and
Total Output.
C. Overview of the Rental-Housing Industry in BC
Data gathered from the National Household Survey and the CMHC indicates that there are approximately 1.81 million households in BC, of which about 30% or 539,434 occupy rental properties. It is important to note that this estimate includes all forms of rental housing units, including traditional rental units in purpose-built apartment buildings, as well as single and semi-
2 LandlordBC is the largest professional association in British Columbia representing the
interests of market rental-housing providers in the province. LandlordBC’s mission is to
educate and support its members to ensure that their tenant relationships are guided by
the principles of respect and professionalism. LandlordBC’s members represent a broad
spectrum of rental-housing owners and managers, from the small business person with
just a few, or less, rental units, to the largest owners and managers in the province.
Members share a commitment to the delivery of safe, secure and sustainable rental
housing for British Columbians. Visit www.landlordbc.ca to learn more.

2
detached homes, townhouse units, and condominium units (“condos”) that are rented. A detailed description of how this estimate of the number of rental properties was derived is presented in Section 2.
This study estimates that rental revenues in the province amounted to $6.89 billion in 2013. The estimate was calculated using information on the average rents for various different types of rental units in BC as reported in the CMHC’s Rental Market Report for Fall 2013. In addition to rental amounts, we estimate that the industry collected $185.3 million in non-rent revenues. Non-rent revenues accrued from services such as parking and laundry services, amongst other items, and were estimated using information from an income and expense survey of rental-housing providers administered by LandlordBC. Total revenues for the industry are estimated at $7.08 billion in 2013.
This study also developed an estimate of the capital expenditures in BC’s rental-housing industry. These expenditures include capitalized renovations and new rental-housing construction. This study estimates that these expenditures were approximately $4.65 billion in 2013. The estimate was derived using information from Statistics Canada’s CANISM database.
It is important to note that expenditures related to the construction of condominium (“condo”) units represent an important component of these capital expenditures. Based on data from CMHC’s Residential Building Activity Report, condo units constitute about 45% of the new rental dwellings constructed in 2013. There may be policy concerns associated with having such a large share of rental units dependent on individual investors, who are typically the owners of rented condo units. These concerns are discussed further in Part E of Section 2.
Exhibit 3 provides an overview of the revenues and capital expenditures used to inform this study.
Exhibit 3: Revenues and Capex of BC’s Rental-Housing Industry
Source : CANSIM Table 029-0005, 2014 Annual Apartment Income and Expense Survey, KPMG calculations
Total
Revenues
Rental Revenues 6.90
Non-Rental Revenues 0.19
Total - Revenues 7.08
Capital Expenditures
Total - Capital Expenditures 4.65
Total 11.74
Revenues and Capital Expenditures of Rental Housing Industry in BC for 2013 ($ billions)

3
D. Report Structure This report is structured as follows:
Section 2 provides an overview of the methodology used to derive the results presented in this report.
Section 3 presents detailed results of the economic impact analysis including the GDP, labour income, employment, tax revenues and gross output generated by BC’s rental-housing industry.
Section 4 provides a comparison of the economic impacts generated by BC’s rental-housing industry to those generated by other industries in BC
Section 5 provides a stand-alone estimate of the impacts of the rental-housing industry’s capital expenditures.
E. Limitations and Notice to Reader
The results presented in this study are based on information obtained from the CMHC, StatsCan’s CANSIM database and I/O model, the 2011 National Household Survey and the income and expense survey administered by LandlordBC. KPMG cannot confirm or warrant the completeness or accuracy of the information provided by these sources.
4
2. Methodology: Input-Output Modeling
A. Economic Impacts
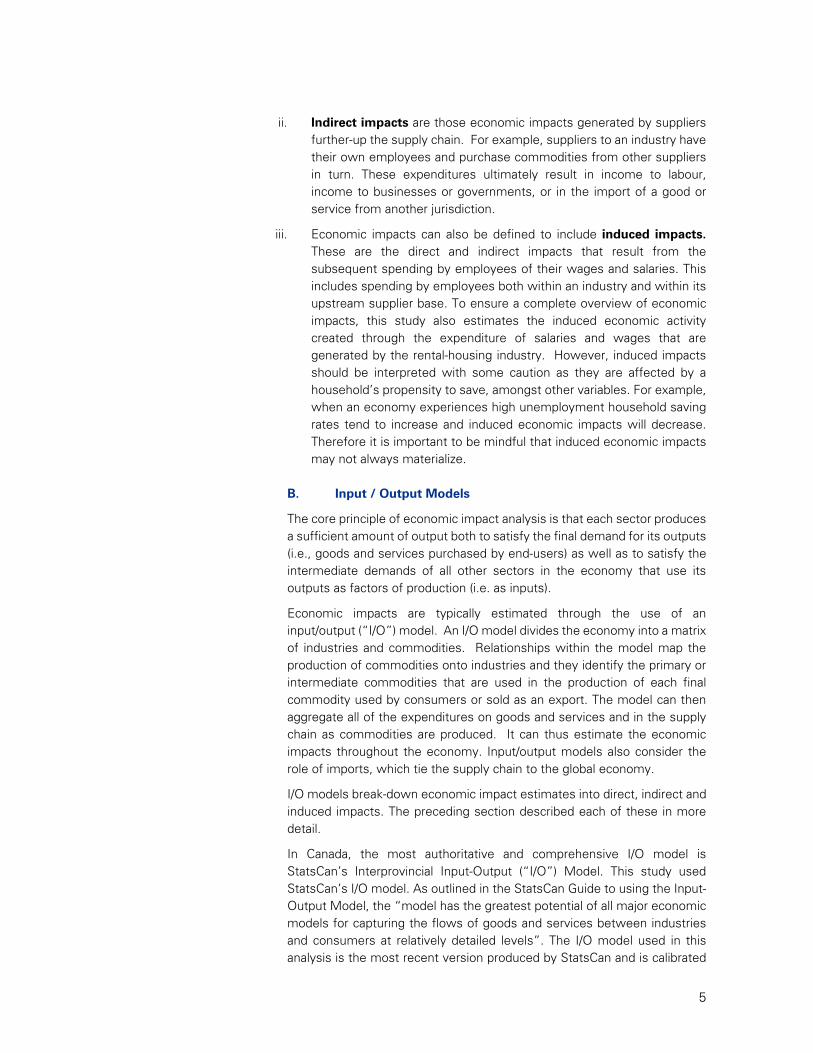
Economic impacts that are generated by an industry or entity within a geographic region are typically reported in terms of the GDP, Labour Income, Employment, Government Revenues and Gross Output generated by that industry. A short description of each of these metrics is provided below:
GDP impact is a measure of economic output from the production of goods and services. It measures the amount of “value-added” that individual producers contribute to their purchased inputs in order to generate their own output. GDP impact is measured in dollars. The GDP impact can be further broken down into labour income, government revenues, and income to business.
Labour income is defined as all compensation paid to employees (e.g. including wages, salaries, employer social contributions, bonuses and performance pay etc.). Labour income is measured in dollars. Labour income is a component of the GDP impact.
Employment estimates the number of jobs created and is measured in terms of Full-time Employment (FTE) positions.
Government revenues measures the amount of tax revenues collected by the different levels of government and includes tax revenues on products, production and income. Taxes on products include sales taxes, gas tax and import duties amongst other items. Taxes on production for the rental-housing industry consist mostly of property taxes. Further, this study also developed estimates of the provincial and federal personal income taxes and payroll contributions generated by the rental-housing industry in BC. Government revenues are measured in dollars. Government revenues are a component of GDP impact.
Gross output is a measure of the value of goods and services that are produced within an economy. In the measurement of Gross Output, intermediate purchases by industries within the supply chain are not netted out. As such, Gross Output exceeds the GDP impact described above. Gross Output is measured in dollars.
The economic impact estimates presented in this study are broken-down into: (i) direct; (ii) indirect; and (iii) induced impacts. A definition of each type of impact is provided below:
i. Direct impacts are those economic impacts generated by the industry in question and can be observed through an analysis of an industry’s employee base, payroll, taxes paid and the difference between the value of sales and purchased inputs.
This study provides
estimates of the GDP; Labour Income; Employment; Government Revenues and Gross Output generated by BC’s rental housing industry.
This study used data from CANSIM, CMHC, the 2011 National Household Survey as well as information from an income and expense survey administered by LandlordBC.
This study estimated
total revenues and capital expenditures generated by BC’s rental housing industry.
These estimates were
used as inputs in Statistics Canada’s Input/ Output model in order to estimate the economic impact of BC’s rental housing industry.
5
ii. Indirect impacts are those economic impacts generated by suppliers further-up the supply chain. For example, suppliers to an industry have their own employees and purchase commodities from other suppliers in turn. These expenditures ultimately result in income to labour, income to businesses or governments, or in the import of a good or service from another jurisdiction.
iii. Economic impacts can also be defined to include induced impacts. These are the direct and indirect impacts that result from the subsequent spending by employees of their wages and salaries. This includes spending by employees both within an industry and within its upstream supplier base. To ensure a complete overview of economic impacts, this study also estimates the induced economic activity created through the expenditure of salaries and wages that are generated by the rental-housing industry. However, induced impacts should be interpreted with some caution as they are affected by a household’s propensity to save, amongst other variables. For example, when an economy experiences high unemployment household saving rates tend to increase and induced economic impacts will decrease. Therefore it is important to be mindful that induced economic impacts may not always materialize.
B. Input / Output Models
The core principle of economic impact analysis is that each sector produces a sufficient amount of output both to satisfy the final demand for its outputs (i.e., goods and services purchased by end-users) as well as to satisfy the intermediate demands of all other sectors in the economy that use its outputs as factors of production (i.e. as inputs).
Economic impacts are typically estimated through the use of an input/output (“I/O”) model. An I/O model divides the economy into a matrix of industries and commodities. Relationships within the model map the production of commodities onto industries and they identify the primary or intermediate commodities that are used in the production of each final commodity used by consumers or sold as an export. The model can then aggregate all of the expenditures on goods and services and in the supply chain as commodities are produced. It can thus estimate the economic impacts throughout the economy. Input/output models also consider the role of imports, which tie the supply chain to the global economy.
I/O models break-down economic impact estimates into direct, indirect and induced impacts. The preceding section described each of these in more detail.
In Canada, the most authoritative and comprehensive I/O model is StatsCan’s Interprovincial Input-Output (“I/O”) Model. This study used StatsCan’s I/O model. As outlined in the StatsCan Guide to using the Input-Output Model, the “model has the greatest potential of all major economic models for capturing the flows of goods and services between industries and consumers at relatively detailed levels”. The I/O model used in this analysis is the most recent version produced by StatsCan and is calibrated
6
to Canada’s economy in 2010. The StatsCan I/O Model is recognized by many as the benchmark by which economic impact modeling is conducted in Canada. It is important to note that the model is independent to KPMG and LandlordBC.
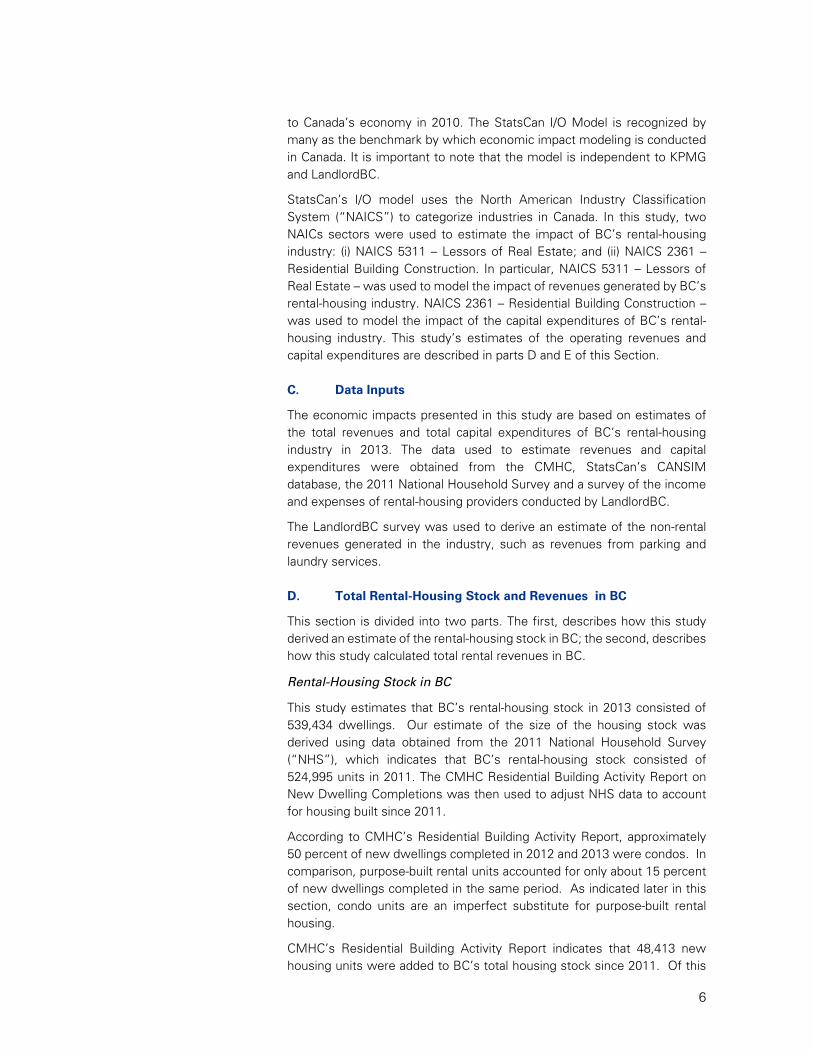
StatsCan’s I/O model uses the North American Industry Classification System (“NAICS”) to categorize industries in Canada. In this study, two NAICs sectors were used to estimate the impact of BC’s rental-housing industry: (i) NAICS 5311 – Lessors of Real Estate; and (ii) NAICS 2361 – Residential Building Construction. In particular, NAICS 5311 – Lessors of Real Estate – was used to model the impact of revenues generated by BC’s rental-housing industry. NAICS 2361 – Residential Building Construction – was used to model the impact of the capital expenditures of BC’s rental-housing industry. This study’s estimates of the operating revenues and capital expenditures are described in parts D and E of this Section.
C. Data Inputs
The economic impacts presented in this study are based on estimates of the total revenues and total capital expenditures of BC’s rental-housing industry in 2013. The data used to estimate revenues and capital expenditures were obtained from the CMHC, StatsCan’s CANSIM database, the 2011 National Household Survey and a survey of the income and expenses of rental-housing providers conducted by LandlordBC.
The LandlordBC survey was used to derive an estimate of the non-rental revenues generated in the industry, such as revenues from parking and laundry services.
D. Total Rental-Housing Stock and Revenues in BC
This section is divided into two parts. The first, describes how this study derived an estimate of the rental-housing stock in BC; the second, describes how this study calculated total rental revenues in BC.
Rental-Housing Stock in BC
This study estimates that BC’s rental-housing stock in 2013 consisted of 539,434 dwellings. Our estimate of the size of the housing stock was derived using data obtained from the 2011 National Household Survey (“NHS”), which indicates that BC’s rental-housing stock consisted of 524,995 units in 2011. The CMHC Residential Building Activity Report on New Dwelling Completions was then used to adjust NHS data to account for housing built since 2011.
According to CMHC’s Residential Building Activity Report, approximately 50 percent of new dwellings completed in 2012 and 2013 were condos. In comparison, purpose-built rental units accounted for only about 15 percent of new dwellings completed in the same period. As indicated later in this section, condo units are an imperfect substitute for purpose-built rental housing.
CMHC’s Residential Building Activity Report indicates that 48,413 new housing units were added to BC’s total housing stock since 2011. Of this

7
amount, we estimate that 14,439 units are rented out. This estimate was prepared by obtaining, for each type of dwelling, an estimate of the number of individually-owned units that are rented out and adding this estimate to the number of units purposely built for rental. The shares of individually-owned units that are rented out were based on our analysis of data from the 2011 National Housing Survey. The estimate of rental dwellings therefore includes traditional rental units as well as the pool of condos, townhouses, and single- and semi-detached dwellings that are rented.
Exhibit 4 summarizes our calculation of BC’s rental-housing stock.
Exhibit 4: Calculation of BC’s Rental-Housing Stock
Source: 2011 National Household Survey, CHS Residential Building Activity Report 2012 and 2013, Dwelling Completions and CMHC Occupied Housing Stock by Structure Type and Tenure
Rental-Housing Revenues in BC
This study estimates that rental revenues in BC amounted to approximately $6.90 billion in 2013. This estimate was calculated using average rent estimates for Vancouver, Victoria and the rest of British Columbia. In each market a rent premium was incorporated into our estimate of the rental rate for condo units to reflect higher rents charged for those dwellings compared to traditional rental apartments.
As indicated in Exhibit 5, the estimates of average monthly rents used to derive rental revenues in BC for traditional (non-condo) dwellings were: $1,067 for Vancouver; $898 for Victoria; and $837 for the rest of BC. For condo dwellings, the estimates of average rent were $1,521 for Vancouver, $1,245 for Victoria and $1,177 for the rest of BC. Weighting these estimates based on the size of the various housing markets yields an average rent in BC of $972 for traditional units and $1,422 for condominium units.
Total rental-housing revenues were estimated by multiplying the average rent estimates by the number of traditional and condo dwellings in BC. Using this approach, total rental payments in BC were calculated to be $6.90 billion in 2013. Exhibit 5 provides an overview of this calculation.
Owned % Rented % Total
Housing Stock in 2011 1,234,710 70% 524,995 30% 1,764,630
New Housing Completions
Completions in 2012 17,464 74% 6,156 26% 23,620
Completions in 2013 16,509 67% 8,284 33% 24,793
Total New Completions 33,974 70% 14,439 30% 48,413
Housing Stock in 2013 1,268,684 70% 539,434 30% 1,813,043
Total and Rented Housing Stock, BC, 2011 and 2013 (dwelling units)

8
Exhibit 5: Rental-Housing Revenues in BC
Source: 2011 National Household Survey, CMHC BC Rental Market Report Fall 2013, KPMG calculations
In addition to rental payments, KPMG estimated the amount of non-rental revenues generated by BC’s rental-housing industry. Non-rental revenues include revenues related to payments for parking and laundry services, amongst other items. Non-rent revenues were estimated using data obtained from a survey, administered by LandlordBC, of income and expenses of rental-housing providers in BC. More specifically, using data from the survey, we estimate that BC’s rental-housing industry generated $185.3 million of non-rental income in 2013.
Based on the above, this study estimates that total payments to providers of rental-housing in BC were approximately $7.08 billion in 2013. Exhibit 6 summarizes these findings.
Exhibit 6: Total Rental and Non-Rental Revenues in BC
Source: KPMG calculations, LandlordBC 2014 Annual Income and Expense Survey
2013 Estimate of Rental Revenues in B.C.
Monthly Rent ($ per unit)
Traditional CondoCondo
PremiumVancouver 1,067 1,521 43%Victoria 898 1,245 39%Rest of B.C. 837 1,177 41%Total - B.C. 972 1,422 42%
Rental Units (No.)
Traditional Condo Total
Vancouver 237,684 78,742 316,426 Victoria 48,026 6,654 54,679 Rest of B.C. 141,250 27,079 168,329 Total - B.C. 426,960 112,474 539,434
Rental Revenues ($ Billions)
Traditional Condo TotalVancouver 3.04 1.44 4.48 Victoria 0.52 0.10 0.62 Rest of B.C. 1.42 0.38 1.80 Total - B.C. 4.98 1.92 6.90
Total Rental and Non-Rental Revenues in BC (in $ billions)
Total Revenue % of Total
Rental Income (annual) 6.90 97%
Other Income (Parking, Laundry) 0.19 3%
Total 7.08 100%

9
E. The Role of Condominium Units in the Apartment Market
While the data show that condo units account for a large proportion of the new units that are entering the rental market, it is important to acknowledge that condos are not a good substitute for traditional, purpose-built rental housing. Disadvantages associated with condo rentals include:
Housing Tenure. Renters who occupy a rental unit do not have the same security of tenure as renters in a traditional rental unit. Individual owners of condo units can more easily evict tenants by claiming that they will use the unit for personal purposes or are planning to sell. This may lead to shorter housing stays. It also puts individual renters at the mercy of individual owner decisions.
Interest in Buildings’ Life Cycle. Developers of purpose-built rental buildings are responsible for managing and operating rental housing units long after their construction, which leads to more effective building life-cycle planning. Developers of condominium buildings, in contrast, have much less direct financial interest in minimizing long-term building operating costs and ensuring high-quality construction standards.
Foreign Investment in Condo Market: Many of the individual condos in BC are owned by foreign investors. As a result, the income stream associated with these investments is directed off-shore and tenants may suffer from having an absentee landlord.
Market Cycles: Condominium construction may be unduly influenced by real estate market cycles and individual investor preferences. For example, buyer preferences may lead to an over-supply of one-bedroom and bachelor units, at the expense of larger units that may be more suitable for families.
Because of the considerations above, the rental market would likely be strengthened by measures to promote more purpose-built rental apartment construction in BC.
F. Capital Expenditures for BC’s Rental-Housing Industry
This study estimates that total capital expenditures by BC’s rental housing industry were approximately $4.65 billion in 2013. For the purpose of this study, capital expenditures in the rental-housing industry comprise: (i) expenditures on the construction of new rental housing; and (ii) modifications, additions and major renovations or other expenditures that extend the normal life expectancy of an asset. The estimates of both expenditure types were calculated using CANSIM data as well as data from the CMHC’s Residential Building Activity report.
Information from CANISM indicates that capital expenditures for the entire residential housing industry in BC amounted to approximately $15.50 billion in 2013. This amount includes expenditures on owner-occupied dwellings and rental dwellings for both expenditure types described in the preceding paragraph.

10
This study estimates the share of new rental-housing starts as a proportion of total construction starts to be approximately 30 percent. The share of capital expenditures attributable to rental-housing was calculated by multiplying CANSIM’s estimate of expenditures on residential housing construction by the assumed share of new rental-housing starts as a proportion of total construction starts in 2013. Similarly, this study assumes that 30 percent of expenditures on modifications, additions and major renovations are attributable to BC’s rental-housing industry. This percentage reflects the share of housing stock that is rental-housing in BC. This approach resulted in an estimate of total capital expenditures for BC’s housing industry of $4.65 billion in 2013, as shown in Exhibit 7.
Exhibit 7: Capital Expenditures in the Rental-Housing Industry in BC
Source: CMHC Residential Building Activity Report 2013, CANSIM Table 029-0005 and KPMG Calculations
Total Expenses
Capital Expenditures on Housing 15.51
Rental-Housing Share 30%
Capital Expenditures on Rental Housing 4.65
Capital Expenditures in the Rental Housing Industry in BC ($ billions)

11
3. Economic Impact of BC’s Rental-Housing Industry
This section provides estimates of the impact of BC’s rental-housing industry on BC’s GDP, Labour Income, Employment, Government Revenue; and Gross Output. It is important to note that the economic impacts presented in this study cover both the rental revenues and capital expenditures of BC’s rental-housing industry.
As previously indicated, we estimate that BC’s rental-housing industry generates approximately $7.08 billion worth of annual rental and non-rental revenues as well as approximately $4.65 billion of capital expenditures. Section 3 of this report provides more detail on how these amounts were estimated.
The economic impacts presented in this section are separated into direct, indirect and induced economic impacts. A brief overview of each type of impact is provided below.
Direct impacts are those economic impacts generated by the industry in which revenues are first received (or expenditures first made). Direct impacts can be observed through an analysis of an industry’s employee base, payroll, taxes paid and the difference between the value of sales and purchased inputs. For this study, which examines impacts of the rental housing industry, direct impacts are those that occur within the industry defined by NAICS 5311 and, to the extent that some dwellings are rented by other investors (e.g. individual condominium or home owners), within the personal or corporate accounts of these investors.
Indirect impacts are those economic impacts generated by suppliers further-up the supply chain. For example, suppliers to an industry have their own employees and purchase commodities from other suppliers. These expenditures result in income to labour, income to businesses or governments, or in the import of a good or service from another jurisdiction. For the rental housing industry, relevant suppliers include utilities, construction and maintenance contractors, professional service firms, and suppliers of items such as cleaning supplies, amongst other industries.
Economic impacts can also be defined to include Induced impacts. These are the direct and indirect impacts that result from the subsequent spending by employees of their wages and salaries. This includes spending by employees both within an industry and within its upstream supplier base. Analyzing only the direct and indirect impacts from an input/output model does not capture these incremental impacts from induced household spending activities. To ensure that this study provides a complete overview of the impact of BC’s rental-housing industry, this report also estimates the induced economic activity created through the expenditure of salaries and wages that are generated by the industry. As previously described, induced impacts
This study estimates that, in 2013, BC’s rental housing industry : Generated a total GDP
contribution of $12.25 billion in Canada
Created $5.82 billion of Labour Income in Canada
Generated $1.60
billion of taxes on production and products in Canada
Created $1.38 billion
of tax revenues from salaries and payroll contributions in Canada
Produced $22.04
billion of gross output in Canada

12
should be interpreted with some caution as they are a function of household saving rates, amongst other factors, and can vary.
A. GDP Impact
This study estimates that BC’s rental-housing industry contributes approximately $12.25 billion to Canada’s GDP, of which $10.60 billion or approximately 86 percent accrues to BC and the remaining $1.65 billion, or 14 percent, to the GDP of other provinces. Exhibit 8 summarize the direct, indirect and induced impacts of the rental-housing industry on the GDPs of BC and for Canada overall. (Differences between impacts for Canada and for BC reflect impacts that occur in the rest of Canada.) As shown in Exhibit 8, a very large proportion (86%) of the GDP impact of the BC rental housing industry occurs within the province.
Exhibit 8: GDP Impact of BC’s Rental-Housing Industry
Source: Statistics Canada I/O model, KPMG calculations
B. Labour Income
For the purposes of this study, Labour Income is defined as all compensation paid to employees including wages, pension contributions, healthcare benefits and employer-paid social contributions.
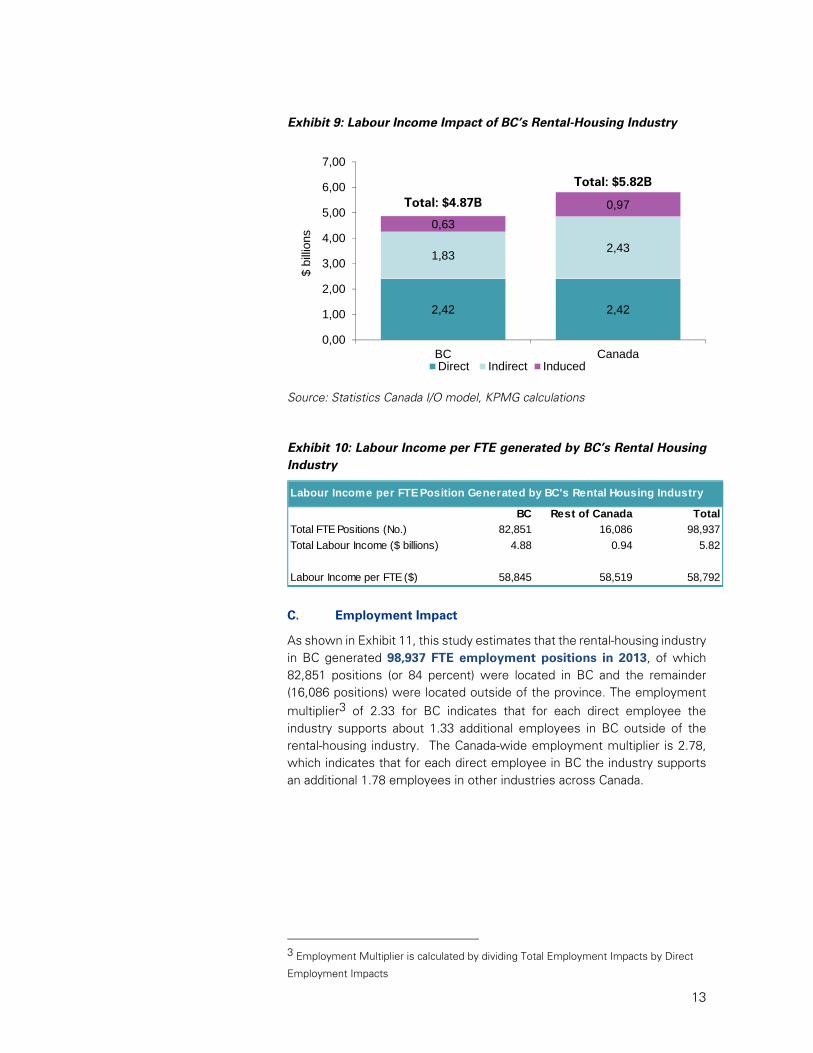
As indicated in Exhibit 9, it is estimated that total Labour Income generated by the rental-housing industry in BC in 2013 was $5.82 billion. Of this impact, approximately $4.87 billion, or 84 percent, was generated within BC. The remaining $0.94 billion, or 16 percent, was generated in other provinces. It is also interesting to note that the average Labour Income per FTE generated by BC’s rental housing industry is $58,792. This is illustrated in Exhibit 10. As indicated above, this represents the average total compensation paid to FTEs in the industry, where total compensation includes employee wages and non-wage payments such as pension, healthcare and employment insurance contributions, amongst other items.
6,44 6,44
2,68 3,66
1,48
2,15
0,00
2,00
4,00
6,00
8,00
10,00
12,00
14,00
BC Canada
$ bi
llion
s
Direct Indirect Induced
Total: $12.25B
Total: $10.60B
13
Exhibit 9: Labour Income Impact of BC’s Rental-Housing Industry
Source: Statistics Canada I/O model, KPMG calculations
Exhibit 10: Labour Income per FTE generated by BC’s Rental Housing Industry
C. Employment Impact
As shown in Exhibit 11, this study estimates that the rental-housing industry in BC generated 98,937 FTE employment positions in 2013, of which 82,851 positions (or 84 percent) were located in BC and the remainder (16,086 positions) were located outside of the province. The employment multiplier3 of 2.33 for BC indicates that for each direct employee the industry supports about 1.33 additional employees in BC outside of the rental-housing industry. The Canada-wide employment multiplier is 2.78, which indicates that for each direct employee in BC the industry supports an additional 1.78 employees in other industries across Canada.
3 Employment Multiplier is calculated by dividing Total Employment Impacts by Direct
Employment Impacts
2,42 2,42
1,832,43
0,63
0,97
0,00
1,00
2,00
3,00
4,00
5,00
6,00
7,00
BC Canada
$ bi
llion
s
Direct Indirect Induced
Total: $4.87B
Total: $5.82B
Labour Income per FTE Position Generated by BC's Rental Housing Industry
BC Rest of Canada Total
Total FTE Positions (No.) 82,851 16,086 98,937
Total Labour Income ($ billions) 4.88 0.94 5.82
Labour Income per FTE ($) 58,845 58,519 58,792

14
Exhibit 11: Employment Impact of BC’s Rental-Housing Industry
Source: Statistics Canada I/O model, KPMG calculations
D. Government Revenue
This section summarizes government revenues generated by BC’s rental-housing industry and is divided into two parts. The first part summarizes government revenues generated by taxes on products and taxes on production; the second provides an estimate of the income tax revenues and deductions at source generated by BC’s rental-housing industry.
Taxes on Products and Taxes on Production
For the purposes of this study, taxes on products cover sales taxes, gas taxes, excise taxes and custom duties, amongst other items. Taxes on production include property taxes, business taxes, licensing and permitting fees, amongst other items.
This study estimates that the rental-housing industry in BC generates approximately $1.61 billion of taxes on products and taxes on production in 2013. Of this amount $673 million is collected by the Government of BC, $197 million by the Government of Canada and $625 million by municipal governments in BC. The significant share of tax revenues collected by municipalities reflects the large payments of property taxes made by the rental-housing industry, which are included in taxes on production. Unfortunately, StatsCan’s I/O model does not separate property taxes from other taxes on production.
In order to contextualize the estimate of tax revenues generated by the rental-housing industry in BC a comparison to other industries is provided in Section 5 of this report.
Exhibit 12 provides a breakdown of the taxes generated by level of government and Exhibit 13 provides a detailed overview of the tax revenues from the rental-housing industry.
35 615 35 615
33 89043 697
13 346
19 625
0
20 000
40 000
60 000
80 000
100 000
120 000
BC Canada
No.
of F
TE
Pos
ition
s
Direct Indirect Induced
Total: 98,937 FTE JobsTotal: 82,851 FTE Jobs

15
Exhibit 12: Taxes on Products and Production by Level of Government

16
Exhibit 13: Taxes on Products and Taxes on Production - BC’s Rental-housing Industry
Note 1: includes property taxes Source: Statistics Canada I/O model, KPMG calculations
Taxes on Salaries and Deduction at Source
This study estimates that the rental-housing industry generated about $834 million in personal income taxes in 2013, of which $243 million accrued to provincial governments and $590 million to the Government of Canada. Of the $243 million collected by provincial governments, $172 million was collected by the Government of BC. In addition to income tax revenues, BC’s rental-housing industry generates total CPP contributions of $398 million, EI contributions of $152 million and other non-tax payments such as contributions to Quebec Parental Insurance Plan (QPIP) of $2 million. Exhibit 14 provides more detail.
The calculation of personal income tax and deductions at source is based on the number of employment positions generated by BC’s rental-housing industry multiplied by the average salary in the industry. The appropriate tax rates for each province as well as CPP, EI and QPIP rates were then applied
BC %
Rest of Canada % Total %
Provincial
Environment tax 22 1% 0.33 0% 23 1%
Gallon tax 0 0% 0.68 0% 1 0%
Trading profits 41 3% 7.68 0% 48 3%
Gas tax 35 2% 7.80 0% 43 3%
Amusement tax 0 0% 0.31 0% 0 0%
Other consumption taxes 18 1% 3.72 0% 21 1%
Sales tax 100 6% 12.66 1% 113 7%
Harmonized sales tax (H.S.T.) 103 6% 10.11 1% 113 7%
Taxes on production 353 22% 20.57 1% 374 23%
Total Provincial 672 42% 63.88 4% 736 46%
Federal
Trading profits 0 0% 0.05 0% 0 0%
Gas tax 16 1% 5.32 0% 22 1%
Excise tax 1 0% 0.15 0% 1 0%
Duty tax 12 1% 2.59 0% 14 1%
Environment tax 0 0% 0.00 0% 0 0%
Air transportation tax 2 0% 0.37 0% 2 0%
Sales tax (GST and HST) 116 7% 18.73 1% 135 8%
Import duties 11 1% 2.09 0% 13 1%
Taxes on production 9 1% 0.24 0% 9 1%
Total Federal 167 10% 29.54 2% 197 12%
Municipal
Municipal amusement tax 0 0% 0.01 0% 0 0%
M.S.T. 0 0% 0.09 0% 1 0%
Taxes on production (Note 1) 624 39% 48.67 3% 673 42%
Total Municipal 625 39% 49 3% 673 42%
Total 1 464 91% 142 9% 1 606 100%
Taxes on Products and Taxes on Production Generated by BC's Rental-Housing Industry (in $ millions)

17
to the average salary estimate to generate an estimate of federal and provincial income tax revenues as well as deductions at source. These calculations were completed by KPMG.
Exhibit 14: Taxes on Salaries and Deductions at Source Generated by BC’s Rental-Housing Industry
Source: Statistics Canada I/O model, Canada Revenue Agency, Canadian Personal Tax Rate Tables (KPMG), KPMG calculations
E. Gross Output
This section provides an overview of the gross output i.e. the total value of the goods and services produced as a result of the provision of rental housing in BC. Gross output is a summation of the revenues received by each industry in the supply chain. It is important to note that intermediate purchases from other industries are not netted out in measures of gross output. As a result, the impacts of an industry on gross output are significantly greater than its GDP impact.
This study estimates that BC’s rental-housing industry generates about $22.04 billion of gross output in 2013. Of this amount, $18.76 billion, or 85 percent, is generated in BC and $3.27 billion is generated outside of the province. Exhibit 15 provides a detailed breakdown of the gross output of the industry by direct, induced and indirect impact.
0,17 0,24
0,470,59
0,33
0,400,12
0,15
0,00
0,20
0,40
0,60
0,80
1,00
1,20
1,40
1,60
BC Canada
$ bi
llion
s
Provincial Income Tax Federal Income tax
Total Canada Pension Plan Total Employment Insurance
Total: $1.09B
Total: $1.38B

18
Exhibit 15: Gross Output Impact of BC’s Rental-Housing Industry
Source: Statistics Canada I/O model, KPMG calculations
11,65 11,65
4,856,85
2,26
3,54
0,00
5,00
10,00
15,00
20,00
25,00
BC Canada
$ bi
llion
s
Direct Indirect Induced
Total: $18.76B
Total: $22.04B

19
4. Comparison of BC’s Rental–Housing Industry to Other Industries
This section provides a comparison of the economic impacts generated by BC’s rental-housing industry to those generated by a number of other important BC industries, including the tourism, mining and forestry industries. The data on the economic impacts of other industries were gathered from public sources. Sources are listed under each Exhibit in the sub-sections that follow.
A. Approach to the Analysis
As information on the indirect and induced impacts are not always available we have focused on the direct economic impacts generated by the industries. This approach facilitates the comparison of the rental-housing industry to other industries.
The comparisons of tax revenues generated by the tourism and forestry industries are limited to provincial tax revenues, as information on federal and municipal taxes attributable to these industries is not available. The notes under each Exhibit provide additional detail regarding the nature of the economic impacts presented.
B. Findings Exhibit 16 provides an overview of the direct GDP impacts generated by BC’s rental-housing, tourism, mining and forestry industries. As shown in the exhibit, rental-housing in BC generates a greater direct GDP impact than BC’s mining and forestry industries; however, the direct GDP generated by BC’s tourism industry exceeds that of the rental housing industry. The sections that follow provide a more detailed comparison of the economic impacts generated by each industry.

20
Exhibit 16: Comparison to Direct GDP Generated by Other BC Industries
BC’s Tourism Industry:
A report prepared by Destination British Columbia indicates that, in 2012, BC’s tourism industry contributed $7.58 billion of direct GDP to the province’s economy and created approximately 127,300 jobs in BC. The tourism industry also generated $1.2 billion of tax revenues for the Government of BC. These economic impacts appear greater than those generated by the rental-housing industry. Exhibit 17 provides an overview of the estimates. It is important to note that the GDP contributions in Exhibit 17 are limited to the direct GDP generated in both industries.
The large economic impacts of the tourism sector can be explained by the broad scope of industries that benefit from tourism. For example, the employment impact of the tourism sector covers job creation in the transportation, food and beverage, accommodation, performing arts and amusement sectors, amongst other sectors. Further, the provincial tax revenues attributable to the tourism industry are broad in scope and include gas and air transportation taxes attributable to the tourism industry, as well as the Municipal and Regional District Tax – a two percent tax on short-term accommodations that is collected by the province on behalf of municipalities in BC. Further, we note that the tax revenues listed in Exhibit 17, which focus on provincial taxes, exclude property taxes paid to municipalities. Property taxes, which are estimated at $624 million for the rental housing industry, are a very significant component of the rental housing industry’s total contribution to government revenues..

21
Exhibit 17: Economic Impacts Generated by BC’s Tourism Industry
Note 1: Total Employment in BC Note 2: Provincial tax revenues only Source: The Value of Tourism in British Columbia (Destination British Columbia)
BC’s Mining Industry
BC’s mining industry generated a total GDP contribution of $4.69 billion, 45,703 jobs, $938.6 million of tax revenues and total Gross Output of $8.93 billion in 2010. A more recent estimate of the industry’s impacts is not publicly available. These impacts are all lower than those generated by BC’s rental-housing industry, which generated more GDP, more jobs, more tax revenues and more gross output than the mining industry. Exhibit 18 provides a comparison of the total economic impacts of both industries. It is important to note that the economic impacts listed in Exhibit 18 include the direct, indirect and induced impacts of both industries.
Exhibit 18: Economic Impacts Generated by BC’s Mining Industry
Note 1: Total employment in Canada Note 2: Total tax revenues Source: Economic Impact Analysis Mining Association of British Columbia (PwC)
BC’s Forestry Industry
The forestry industry in BC generated a direct GDP impact of $1.83 billion and tax revenues for the Government of BC of $757 million in 2012. The industry also created a direct employment impact of 17,700 jobs. The economic impacts generated by the rental-housing industry exceed those of the forestry industry and Exhibit 19 provides an overview of the impacts generated by the two industries.
Economic Impacts Generated by BC's Toursim Industry (in $billions)
BC Tourism Industry
BC Rental-Housing Industry
GDP - Direct Impact 7.59 6.44
Employment (FTEs) - Total Impact (Note 1) 127,300 82,851
Government Revenues (Note 2) 1.20 0.84
Total Gross Output n/a 22.04
Economic Impacts Generated by BC's Mining Industry (in $billions)
BC Mining Industry
BC Rental-Housing Industry
GDP - Total Impact 4.69 12.25
Employment (FTEs) - Total Impact (Note 1) 45,703 98,937
Government Revenues (Note 2) 0.94 2.99
Total Gross Output 8.93 22.04

22
Exhibit 19: Economic Impacts Generated by BC’s Forestry Industry
Note 1: Adjusted for inflation since 2007 Note 2: Direct job impact in BC Note 3: Provincial tax revenues only Source: BC Forest Products Industry at a Glance June 2013 (Council of Forest Industries)
Economic Impacts Generated by BC's Forestry Industry (in $billions)
BC Forestry Industry
BC Rental-Housing Industry
GDP - Direct Impact (Note 1) 1.83 6.44
Employment (FTEs) - Direct Impact (Note 2) 17,700 35,615
Government Revenues (Note 3) 0.76 0.84
Total Gross Output n/a 22.04

23
5. Economic Impact of Capital Expenditures on Rental-Housing in BC
This section provides an overview of the economic impacts generated by the construction of rental housing in BC. Exhibit 20 summarizes impacts on GDP, Labour Income, Government Revenues and Gross output. A more detailed breakdown of these impacts is provided in Exhibit 21.
Exhibit 20: Summary of Economic Impacts Generated by Capital Expenditures in BC’s Rental-Housing Industry
Source: Statistics Canada I/O model, KPMG calculations
As indicated in Section 2, this study estimates that capital expenditures in BC’s rental housing industry amounted to $4.65 billion in 2013. Capital expenditures include spending on: (i) construction of new residential housing; and (ii) renovations, modification and alterations or additions that extend the life of a rental-housing asset. A detailed explanation of how capital expenditures were estimated is provided in Section 2.
According to CMHC’s Residential Building Activity Report, approximately 50 percent of new dwellings completed in 2012 and 2013 were condos. In comparison, purpose-built rental units accounted for only 15% of new dwellings completed in 2012 and 2013. It should be noted that capital expenditures for the rental-housing industry could significantly increase if there were changes in rent legislation such as amendments to the province’s rent controls that would promote the construction of new purpose-built rental buildings.
The stand-alone estimate of capital expenditures is provided because capital expenditures can fluctuate from year to year. This section enables
This study estimates that in 2013 capital expenditures in BC’s rental-housing industry: generated a GDP impact
of $4.87 billion in Canada
created labour income of $3.27 billion in Canada
resulted in the creation of
57,080 FTE in Canada
generated government revenues of $1.28 billion in Canada
produced total gross
output of $10.01 billion in Canada
Total: $4.87B Total: $3.27B
Total: $1.28B
Total: $10.01B

24
the reader to separate impacts from construction from those associated with ongoing building operation.
The economic impact estimates presented in this section were provided by Statistics Canada’s I/O model. It is important to note that the impacts summarized in this Section and in Exhibits 20 and 21 were already included in the estimates described in Section 3 (i.e. they should not be considered in addition to these estimates).
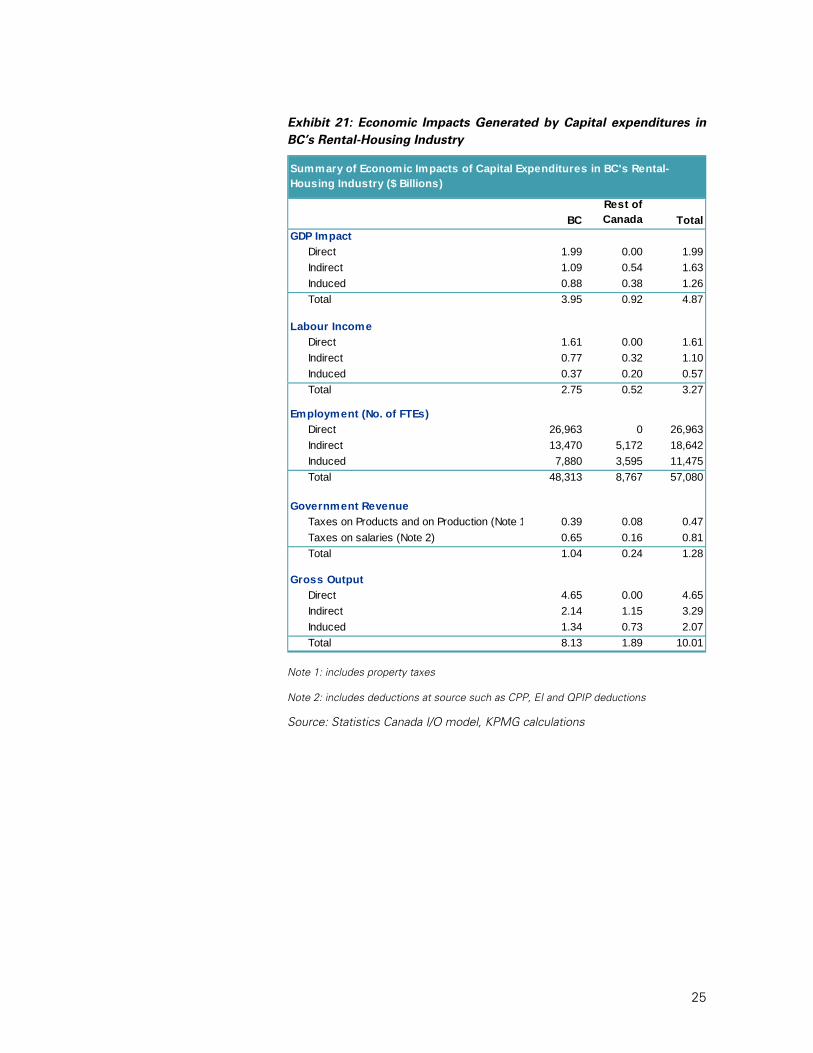
Exhibit 21 provides a more detailed breakdown of these impacts. the bullet points below provide an overview of our results. In particular, this study estimates that capital expenditures in BC rental-housing industry generated:
A total GDP impact of $4.87 billion in 2013, of which $3.95 billion was generated in BC.
Total Labour Income of $3.27 billion and employment of 57,080 FTEs in 2013. Of this amount, Labour Income in BC was $2.75 billion and the number of FTEs created in BC was 48,813.
$1.28 billion in government revenues, of which $1.04 billion was generated in BC.
Gross output of $10.01 billion from which $8.12 billion was generated in BC.
25
Exhibit 21: Economic Impacts Generated by Capital expenditures in BC’s Rental-Housing Industry
Note 1: includes property taxes
Note 2: includes deductions at source such as CPP, EI and QPIP deductions
Source: Statistics Canada I/O model, KPMG calculations
BC
Rest of Canada Total
GDP Impact
Direct 1.99 0.00 1.99
Indirect 1.09 0.54 1.63
Induced 0.88 0.38 1.26
Total 3.95 0.92 4.87
Labour Income
Direct 1.61 0.00 1.61
Indirect 0.77 0.32 1.10
Induced 0.37 0.20 0.57
Total 2.75 0.52 3.27
Employment (No. of FTEs)
Direct 26,963 0 26,963
Indirect 13,470 5,172 18,642
Induced 7,880 3,595 11,475
Total 48,313 8,767 57,080
Government Revenue
Taxes on Products and on Production (Note 1 0.39 0.08 0.47
Taxes on salaries (Note 2) 0.65 0.16 0.81
Total 1.04 0.24 1.28
Gross Output
Direct 4.65 0.00 4.65
Indirect 2.14 1.15 3.29
Induced 1.34 0.73 2.07
Total 8.13 1.89 10.01
Summary of Economic Impacts of Capital Expenditures in BC's Rental-Housing Industry ($ Billions)

Proposal to the Ontario Association of Non-Profit Homes and Services for Seniors (“OANHSS”) B - 1
At KPMG Our Communities Matter
As one of Canada’s leading professional services
firms, we have an incredible opportunity to help our communities
thrive by engaging our skills, knowledge, passions and financial
resources to make a real difference.
As a firm with locations in more than 30 cities across Canada,
we are actively connected to the communities where we
operate – as a business, as an employer – in every sense.
The issues that impact our communities are the same
issues that impact our people and their families, our
clients and our operations. So making a commitment
to having a positive impact is how we recognize the
significance of our relationship with the communities
where we operate and live.
Being actively engaged in our communities has
always been an important part of KPMG’s culture.
In 2009, we elevated our existing engagement to
a whole new level by incorporating Community
Leadership as one of the four key components
of our overall business strategy.

Proposal to the Ontario Association of Non-Profit Homes and Services for Seniors (“OANHSS”) B - 2
www.kpmg.ca This proposal is made by KPMG LLP, a Canadian limited liability partnership and a member firm of the KPMG network of independent firms affiliated with KPMG International Cooperative (“KPMG International”), a Swiss entity, and is in all respects subject to the satisfactory completion of KPMG’s client acceptance procedures, as well as negotiation, agreement, and signing of a specific engagement letter or contract. KPMG International provides no client services. No member firm has any authority to obligate or bind KPMG International or any other member firm vis-à-vis third parties, nor does KPMG International have any such authority to obligate or bind any member firm.
The KPMG name, logo and “cutting through complexity” are registered trademarks or trademarks of KPMG.
© 2013 KPMG LLP, a Canadian limited liability partnership and a member firm of the KPMG network of independent member firms affiliated with KPMG International Cooperative (“KPMG International”), a Swiss entity. All rights reserved. Printed in Canada.