Embed Size (px)
Citation preview

District Information System for Education
Report On
Post Enumeration Survey (Sample Check on DISE Data)
2008-2009
District : TIRUCHIRAPPALLI State : TAMILNADU
ALAGAPPA UNIVERSITY, Karaikudi
(Accredited with ‘A’ Grade by NAAC) DEPARTMENT OF EDUCATION


PREFACE
Dr. Prema, Professor & Head, Deparment of Education, Dean, Faculty of Education, Chair Person, Alagappa School of Education, Alagappa University, Karaikudi, Sivagangai District, Tamilnadu.
SSA is the major time bound intervention for Universalization of Elementary Education in India being implemented from 2001 onwards on a mission mode with Central and State Government funding. Since SSA framework stresses the micro level planning and also gives much importance of the quality of data, large child population data base and school data base have been created in Tamilnadu. Since NUPEA has been entrusted to create and update the school database at National level it has initiated PES on DISE data to improve the quality of school database.
The State Project Directorate-SSA Tamilnadu has selected the University to undertake Post Enumeration Survey on 5% data sample check in Tiruchirapalli District.
I constituted a team of of 5 field workers to carry out Post - Enumeration Survey on 5% data sample check. The coordinator’s team consisting of Dr.P.Prema and Dr. S.Subbiah, Lecturer, Alagappa University College of Education went to SSA office at Tiruchirappalli District and obtained block wise data about the different types and numbers of schools.
After the coordinators gave a one day orientation to the field workers’ team, the sample check work commenced in the second week of Nov 2008 and it was completed by the end of Feb 2009.
The data entry and preliminary analysis were done by Mr.S.Subramanian, UGC Guest Faculty, Department of Education, Alagappa University. The overall review of the report was done by Mr. R.Ramnath, Lecturer, Department of Education for which I am thankful to him.

I am thankful to Thiru M.P.Vijayakumar, I.A.S., former Director SSA and Thiru.R.Venkatesan I.A.S., present Director SSA for their financial support and encouragement for carrying out this survey.
The investigators’ team wishes to acknowledge with thanks the excellent support rendered by the SSA Officials of Tiruchirappalli District. The heads and the teachers of the schools were cooperative which made this PES a success.
The unparalleled support rendered by Prof. P.Ramasamy, Vice-Chancellor, Alagappa University, Prof..Dr.E.Ilamathian, Registrar, Alagappa University is gratefully acknowledged..
I wish to thank Mrs.J.Meenal, Junior Assistant and Mrs.S.Vidhya Programme Assistant, UGC Innovative Course, Mrs.R.Amutha Sundari typist, and Mrs. S. Vasanthi, Office Assistant from the Department of Education for preparing the draft report.
This survey report consists of six chapters. The first chapter deals with the “Outline of the PES”. The PES highlights are presented in the second chapter. The investigators’ feed back, objectives, findings of the survey and suggestions and recommendations are also presented in the III, IV, V, and VI chapters respectively.
I hope this comprehensive report will be useful to maintain the high quality of DISE data for future planning and monitoring.
Date : 20.3.2009
Place : KARAIKUDI.
(Dr S. SUBBIAH) (Dr. PREMA)
Assistant Project Coordinater Project Coordinater

TABLE OF CONTENTS
CHAPTER I
INTRODUCTION
Sub Heading
No. Title Page
No.
1.1 Introduction 1
1.2.1 Post Enumeration Survey 4
1.2.2 Formation of Team and Training to Team members 5
1.2.3 Sample Technique 5
1.2.4 Selection of Sample Schools 6
1.2.5 Data Collection 7
1.2.6 Verification of Records 8
1.2.7 Data Processing 8
1.2.8 Report Generation 8

CHAPTER II
PES & DISE HIGHLIGHTS
Sub Heading
No. Title Page
No.
2.1 Introduction 9
2.2.1 Location of the School 9
2.2.2 School particulars 10
2.3.1 Enrolment 10
2.3.2 Enrolment by class 12
2.3.3 Repeaters 13
2.3.4 Students given free textbooks 14
2.3.5 Children with disabilities 15
2.4 Teachers in position 16
2.5.1 School Facilities 16
2.5.2 No. of Class rooms 17

CHAPTER III
INVESTIGATOR FEEDBACK HIGHLIGHTS
Sub Heading
No. Title Page
No.
3.1 Introduction 18
3.2 School Visit 18
3.3 Teachers’ response 18
3.4.1 Availability of School Records 19
3.4.2 Condition of records 19
3.5.1 Children Enrolled & Attendance 20
3.5.2 Examination Results 21

CHAPTER IV
INVESTIGATORS’ SCHOOL OBSERVATION – HIGHLIGHTS
Sub Heading
No. Title Page
No.
4.1 Introduction 22
4.2.1 DISE Training 22
4.2.2 Teachers who attended DISE training 23
4.2.3 DCF/Concept 23
4.3.1 School visit by BRTE 24
4.4 Teachers’ in-service training 24

CHAPTER V
FINDINGS OF THE SURVEY
Sub Heading
No.
Title Page No.
5.1 Introduction 25
5.2.1 School Location 25
5.2.2 School Particulars 25
5.3 Teachers in Position 25
5.4.1 Enrolment and Student Attendance 25
5.4.2 Examination Pass Percentage 26
5.4.3 Repeaters 26
5.4.4 Distribution of Textbooks 26
5.45.5 Disabled Children 26
5.5 Teachers’ Response 27
5.6 Availability of Records 27
5.7 Schools Facilities 27
5.8.1 Children Enrolled and Attendance 27
5.8.2 Examination Results 28
5.9 DISE Training 28
5.10.1 Data Quality 28
5.10.2 Data Sharing 29
5.10.3 Usage of Data 29
5.11 Visit of BRTEs 29
5.12 Teachers in-service Training 29
5.13 General 29

CHAPTER VI
SUGGESTIONS AND RECOMMENDATIONS
Sub Heading
No. Title Page
No.
6.1 Introduction 30
6.2.1 DISE Training 30
6.2.2 Data collection and data processing 30
6.2.3 Data quality 30
6.2.4 Maintenance and updation of records. 31
6.2.5 Data sharing 31
6.2.6 Data usage – monitoring 31
6.2.7 Any other 31
6.2.8 General Observations 31

LIST OF TABLES
S.No. Table No. Title P.No.
1. Table 1.1 Selection of Sample Schools 6
2. Table 1.2 List of Enumerators for data Collection 8
3. Table 2.1 School Location Particulars - Deviation as per PES 9
4. Table 2.2 School Identification Particulars - Deviation as per PES 10
5. Table 2.3 Enrolment Deviation as per PES 10
6. Table 2.4 Enrolment by Class as per PES & DISE 12
7. Table 2.5 Repeaters by Class - Deviation as per PES 13
8. Table 2.6 Class wise No. of Children Given Free Text books 14
9. Table 2.7 Children with Disabilities - Deviation as per PES 15
10. Table 2.8 Teachers in Position - Deviation as per PES 16
11. Table 2.9 Deviation in School Building Type 16
12. Table.2.10 Deviation in No. of Classrooms 17
13. Table 3.1 Status of Teachers Response 18
14. Table 3.2 Status of Availability of School Records 19
15. Table 3.3 Status of updation of School Records 19
16. Table 3.4 Children Enrolled/attending School on the date of visit 20
17. Table 3.5 Annual Examination Results 21
18. Table 4.1 Centre wise Teachers’ attendance of DISE Training 22
19. Table 4.2 Teachers Attendance by No. of Training Days 23
20. Table 4.3 No. of Teachers who understood DCF & Concepts 23
21. Table 4.4 BRTE’s School Visits 24
22. Table 4.5 No. of Teachers who attended in–service Training 24

CHAPTER I
OUTLINE OF THE SURVEY
1.1 Introduction
Alagappa University – A Profile
Alagappa University, named after Dr.Alagappa Chettiar, the munificent and multifaceted personality (late) was established in the year 1985 at Karaikudi in Sivagangai District in Tamilnadu. It has as its motto “Excellence in Action” and keeps before it the vision of excellence in all spheres of education. It is a happy coincidence that the Birth centenary of this great visionary falls this year.
Alagappa University established with 4 Departments and 2 Constituent Colleges in 1985, has grown in stature through committed service to the learner society. Now, the University has 15 schools of learning, comprising 20 Departments, 9 Centres and 2 Constituent Colleges. Besides it has 4 Evening Colleges and 26 affiliated Colleges / Institutions. The University is also in collaboration with private professional institutes offering over 40 career oriented programs. The Directorate of Distance Education of the University is very popular all over the nation and abroad as well offering over 60 programs. The University is accredited with ‘A’ grade by the National Assessment and Accreditation Council of the country in 2005. The University’s student strength, from all modes (regular, part-time, collaborative and distance) is reaching 150,000 The University has over 180 competent and qualified teachers.
The faculties of the university have published over 80 books and more than 2000 research papers in the reputed national and international journals and have won awards and honours in recognition of their exemplary service in teaching and research. Many faculty members in Science and Management disciplines are invited by foreign universities to utilize their teaching and research expertise. The Department of Education has received funds from The Netherlands for carrying out research in child care, in addition to research grants from ICSSR,UGC, MHRD,NCERT,IGNOU,DST and other agencies.
1

The University Grants Commission identified the potential of Alagappa
University and sanctioned grants through many special schemes.
• Adult, Continuing Education and Extension
• Higher Education Persons with Special Needs [HEPSN]
• Centre for Women’s studies
• Promotion of Ethics and Human Values
• Establishment of Special Cell for SC/ST
• Special Assistance Programme [SAP]
• Fund for Improvement of Science and Technology [FIST]
• Teacher Preparation in Special Education [TEPSE]
• General Development Assistance
• Umayal Day Care Centre
Programmes of Study
The University with 29 academic Departments/Centres of study and
research is offering courses in varied areas like Bio-technology, Animal
Husbandry, Nanotechnology, Bioinformatics, Bioelectronics, Biosensors,
Oceanography and Costal Area Studies, Physics and Crystal Research,
Industrial Chemistry, Mathematics, Computer Science and Engineering,
Library and Information Science, Business Administration and e-commerce,
Corporate Secretary ship, Bank Management, Management, Tamil, English,
Women’s Studies, Education and Physical Education at P.G., M.Phil and Ph.D.
levels.
Central Library
The University Library has a very rich collection of 85,000 carefully
culled volumes and 132 periodicals including 28 international journals. E-
journals numbering 200 are accessed through UGC-INFONET, which is very
much used by the research scholars and faculty members. Air conditioned
internet browsing centre with 30 systems is functioning from 8.00 am to 8.00
pm. On an average, 400 users are using this facility. The library has been
2

using the SOUL an Integrated Library Management software package with all
the modules for the library housekeeping operations. Online Public Access
Catalogue (OPAC) available in the library is very much useful to the users to
search library online catalogue by Author, Title, Subject and Keywords. Also
users can know the latest additions of periodicals and books and the status of a
document. The Talking Book Library is catering to the requirements of visually
impaired in this area.
Distance Education Programmes
There is a giant leap in the enrolment for Distance Education in the
Alagappa University with the cumulative admissions crossing the 1.75 lakhs
mark during the current academic year (2008-09). The University has a vast
Network of 189 Study Centres throughout the country and abroad in Singapore,
Malaysia, Sri Lanka, Dubai, Kingdom of Bahrain, Qatar to provide services to
the student community.
There are seven new courses that are introduced in the DDE mode and
they are:
(i) M.Sc. Physics
(ii) M.Sc. Chemistry
(iii) M.Sc. (Botany with Specialisation on Plant Biotechnology)
(iv) M.B.A. (Human Resource Management
(v) P.G. Diploma in Human Resource Management
(vi) P.G. Diploma in Library and Networking
(vii) Certificate course in Library and Information Science
Collaborative Programmes
Under the stream of Collaborative mode, need based and socially
relevant academic programmes are being offered in collaboration with some of
the private institutions. As of now, 54 programmes under different levels in the
specialization of Hotel Management, Textile Designing, Paramedical Sciences,
Nautical and Aeronautical Sciences are being offered through collaborative
3

mode. During the year 2007-08, the University has collaborated with Seven
Institutions to offer B.Sc.(Catering and Hotel Administration) Programme.
M.Sc.(Biotechnology) has been introduced in collaboration with M/s Medic
lone Biotech (P) ltd., Chennai.
. Postgraduate Diploma in Dialysis Technology
. Postgraduate Diploma in Perfusion Technology
. Diploma in Medical Records Technology
. Postgraduate Diploma in Games Programming
. Diploma in Animation
. Certificate in 3D Animation
. Certificate in Web Design
. The Directorate of collaborative Programmes is going to launch Diploma course in Catering and Hotel Administration from the Year 2008 – 2009.
It is a matter of immense elation that Alagappa University is the only
institution in Tamil Nadu which has been chosen by the MHRD for
monitoring and evaluating the SSA programme from 2002-2008.
1.2.1 Post Enumeration Survey
The State Project Director of the Tamil Nadu State Mission of
Education for All selected Alagappa University for Post Enumeration Survey
on 5% DISE Data Sample Checking in Tiruchirappalli District, in Tamilnadu.
Since the university has all infrastructure facilities and experienced faculties to
conduct studies and sample surveys, it undertook the job after executing an
MoU.
4

1.2.2 Formation of Team and Training to Team members
Dr. Prema, Professor & Head, Department of Education accepted the
responsibility and formed teams at the rate of Five research scholars for data
collection in the sample schools from the above districts. Dr.S.Subbiah, Reader,
DDE, Alagappa University was the Co-Supervisor for the project.
The team members were given one day training in selection of schools,
data collection, concepts and definitions, data source, verification of registers
etc. in detail.
1.2.3 Sample Technique
Circular Random Sampling Technique was adopted for selection of 5%
of Primary, Middle, High and Hr. Sec. Schools in Rural and Urban area and in
all categories of Management such as Govt., Local Body and Welfare
Department, Private aided and Private Unaided in the sample district.
LIST OF BLOCKS AND TOTAL NUMBER OF SCHOOLS IN
TIRUCHIRAPPALLI DISTRICT
S.No Name of the Block Total No. of Schools
1. Marungapuri 157 2. Manapparai 133 3. Manikandam 117 4. Musiri 89 5. T.Pet(Thathayangar pettai) 86 6. Thottiyam 125 7. Manachanallur 158 8. Vaiyampatti 84 9. Pullampadi 84 10. Andhanallur 114 11. Lalgudi 138 12. Tiruchirappalli West 86 13. Thriuvarambur 164 14. Uppiliayapuram 91 15. Thuraiyur 131 16 . Tiruchirappalli (Urban) 142
Total 1899
5

1.2.4 Selection of Sample Schools
The number of sample schools in the selected districts for Post
Enumeration Survey is presented in the table below.
Table 1.1
Selection of Sample Schools - Tiruchirappalli District
S.No.
No. of Blocks
School Management
Category
No. of Schools
Sample Schools
Grand Total
% of sample school
Pri Mid HS HSS
Rural urban Total
1 Local Body 3 1 3 1 - - 3 1 4 4
2 Welfare Dept. 2 21 2 18 - 3 2 21 23 23
3 Pvt.Aided 13 15 14 11 - 3 14 14 28 28
4 Pvt.unaided 13 16 10 12 3 4 13 16 29 29
5 other 6 9 5 2 1 7 6 9 15 15
6 Unrecognized 1 - 1 - - - 1 - 1 1
Total 38 62 35 44 4 17 39 61 100 5
School Management Category
Local Body, 4Welfare Dept.,
23
Pvt.Aided, 28
Pvt.unaided, 29
other, 15
Unrecognized, 1
Local BodyWelfare Dept.Pvt.AidedPvt.unaidedotherUnrecognized
6

List of Blocks
S.No Name of the Block
1. Marungapuri 2. Manapparai 3. Manikandam 4. Musiri 5. T.Pet(Thathayangar pettai) 6. Thottiyam 7. Manachanallur 8. Vaiyampatti 9. Pullampadi 10. Andhanallur 11. Lalgudi 12. Tiruchirappalli West 13. Thriuvarambur 14. Uppiliayapuram 15. Thuraiyur 16. Tiruchirappalli (Urban)
Tiruchirappalli District
In the selected district all the blocks were selected and 5% of schools in every
category and in all management in all blocks were chosen for data
collection/enumeration. In Tiruchirappalli district 100 number of schools were
selected of which, 39 were primary schools and 61 were upper primary schools.
1.2.5 Data Collection
Under the supervision of Dr. Prema, and Dr.S. Subbiah, the following
team members were assigned data collection work from the sample schools in the
districts.
Table 1.2
List of Enumerators for data collection
Tiruchirappalli (District) 1. K. Mahalingam 2. S. Anandha Murugan 3. R. Alagar Samy 4. M. Anbarasan 5. R. Albertraj
7

The team personally visited the schools and gathered data in the special
data collection format without any bias. The team collected data from the
sample schools during the period, December 2008 in the selected districts as
per the schedule fixed.
1.2.6 Verification of Records
The State Project Director had already instructed the District
Programme Co-ordinators in the selected district to inform the field staff and
teachers to provide the relevant records and registers to the team members
when they visited the schools for data collection and verification. Therefore,
the team members got easy access to records and collected data.
1.2.7 Data Processing
The filled in formats were properly scrutinized by the team trained. The
PES data DISE data of the sample schools were entered into the computers and
validation reports were generated.
1.2.8 Report Generation
After complete validation, reports were generated . Based on the reports
and enumerators’ feed back a comparative analysis has been presented in the
following chapters.
8

CHAPTER II
PES & DISE HIGHLIGHT
2.1 Introduction
The objectives of DISE are to create and update the school Database
every year for educational planning and management. DISE data and Reports
are also used as Monitoring tools for enhancing effectiveness of schools in
achieving the objectives of SSA. Therefore it is felt that data quality must be
ensured at all levels. To ensure data quality, post enumeration survey on 5%
DISE data sample check is resorted. As such the team was adequately oriented
to collect the data and also to furnish feed back. In this chapter the PES and
DISE data related to school location, enrolment, teachers, VEC Composition,
school facilities, classrooms, repeaters, children given free textbooks, children
with disabilities are compared and highlighted.
2.2.1 Location of the School
For Post Enumeration Survey, 100 schools out of 1914 schools from
Tiruchirappalli district, were selected. A comparison of the address and
location of the sample schools with location particulars as per DISE filled-in-
formats, showed that there is no deviation in the list of schools thus ensuring
that data were compiled perfectly.
Table 2.1
School Location Particulars : Deviation as per PES
School Location No. of
Sample
Schools Correct Not correct
% of deviation
100 100 - -
9
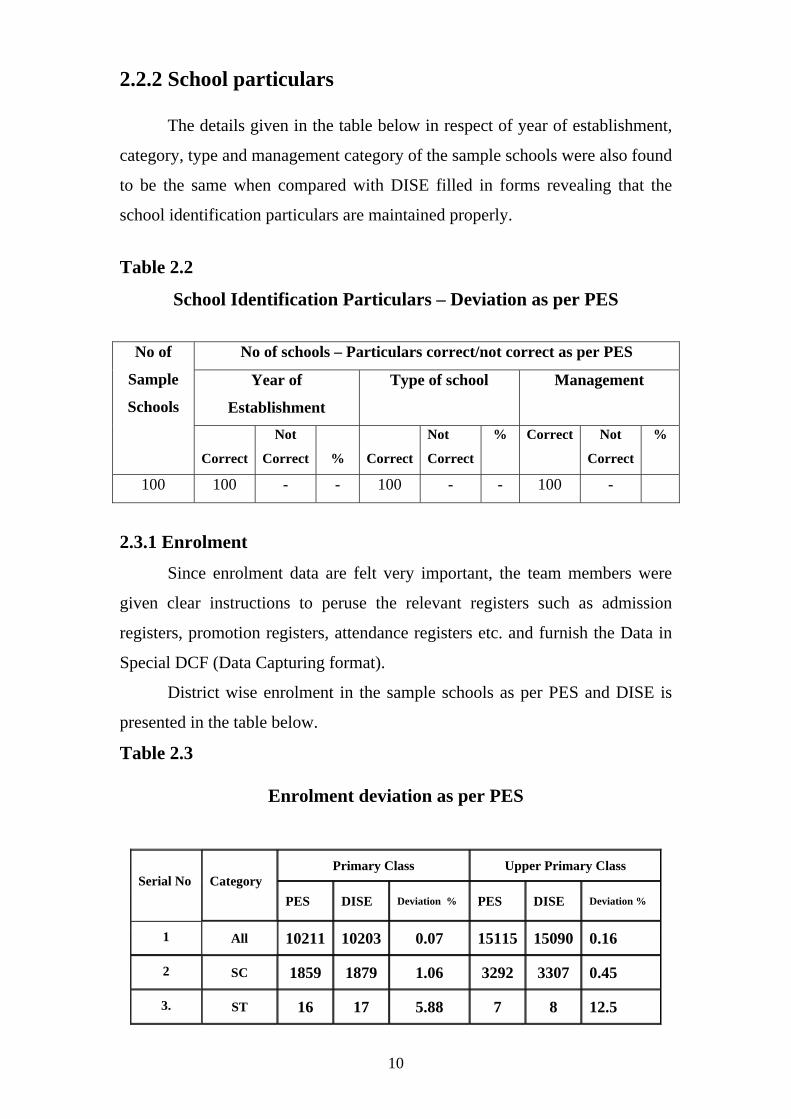
2.2.2 School particulars
The details given in the table below in respect of year of establishment,
category, type and management category of the sample schools were also found
to be the same when compared with DISE filled in forms revealing that the
school identification particulars are maintained properly.
Table 2.2
School Identification Particulars – Deviation as per PES
No of schools – Particulars correct/not correct as per PES
Year of
Establishment
Type of school Management
No of
Sample
Schools
Correct
Not
Correct
%
Correct
Not
Correct
% Correct Not
Correct
%
100 100 - - 100 - - 100 -
2.3.1 Enrolment
Since enrolment data are felt very important, the team members were
given clear instructions to peruse the relevant registers such as admission
registers, promotion registers, attendance registers etc. and furnish the Data in
Special DCF (Data Capturing format).
District wise enrolment in the sample schools as per PES and DISE is
presented in the table below.
Table 2.3
Enrolment deviation as per PES
Primary Class Upper Primary Class
Serial No Category PES DISE Deviation % PES DISE Deviation %
1 All 10211 10203 0.07 15115 15090 0.16
2 SC 1859 1879 1.06 3292 3307 0.45
3. ST 16 17 5.88 7 8 12.5
10

Enrolment Deviation as per PES & DISE Primary Class
The deviation between PES data and DISE data with regard to enrolment is + 0.07% only for all the categories and is negligible. For ST category it is + 5.8% at primary level But actual number as per DISE is 17 and PES is 16. For SC category it is 1.06 at primary level.
Enrolment as per PES & DISE Tiruchirappalli District
10211
1859
16
10203
1879
170
2000
4000
6000
8000
10000
12000
All SC ST
PESDISE
Upper Primary Class
In the upper primary classes the deviation in the enrolment for all the categories combined is 0.16 % and for ST it is 12.5% but the actual number in DISE is 8 and PES is 7 hence it is negligible. For SC it is 0.45%.
Enrolment Devitation -Upper Primary Class
15115
3292
7
15090
3307
80
2000
4000
6000
8000
10000
12000
14000
16000
All SC ST
PESDISE
11
A comparative account of enrolment data in Primary classes
(Std. I-V) and in upper primary classes (Std. VI-VIII) showed that they are almost same as per PES and DISE in the district; however the deviation is little high in ST candidates of Upper Primary classes in Tiruchirappalli district. It is ascertained that BRTEs are themselves collecting the filled-in-DISE formats from the schools in their cluster and compare the data with the registers then and there.
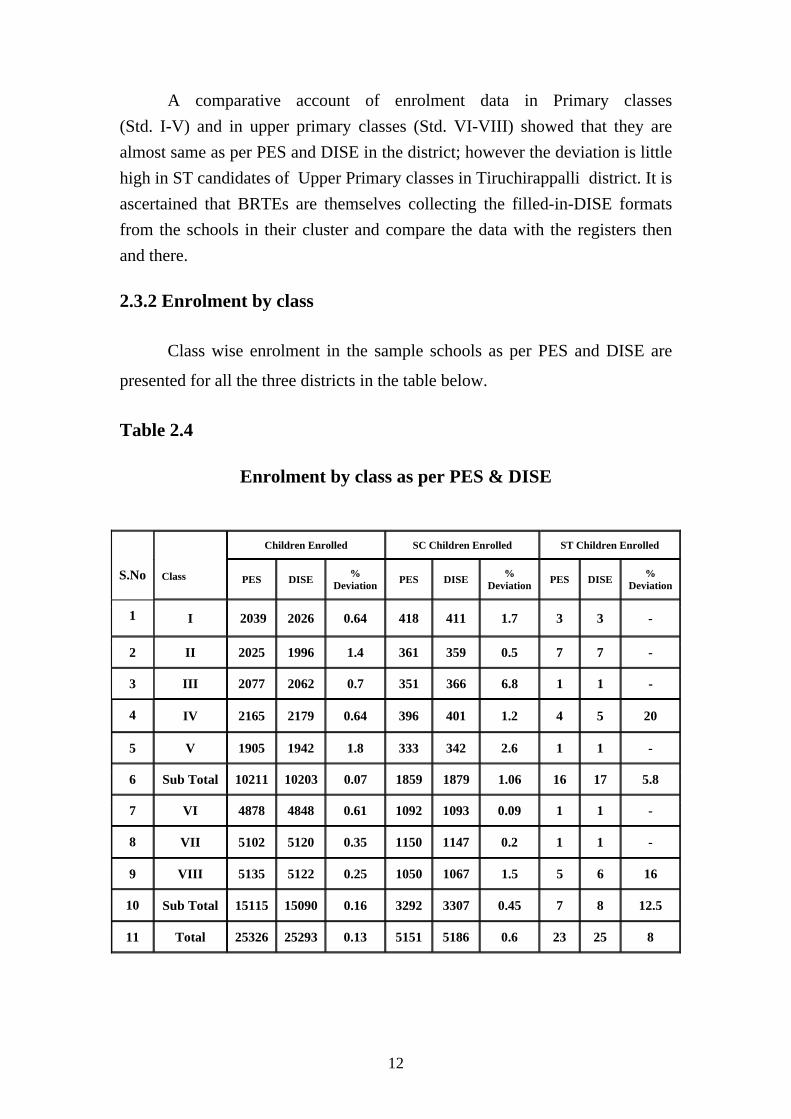
2.3.2 Enrolment by class
Class wise enrolment in the sample schools as per PES and DISE are
presented for all the three districts in the table below.
Table 2.4
Enrolment by class as per PES & DISE
Children Enrolled SC Children Enrolled ST Children Enrolled
S.No
Class PES DISE % Deviation PES DISE %
Deviation PES DISE % Deviation
1 I 2039 2026 0.64 418 411 1.7 3 3 -
2 II 2025 1996 1.4 361 359 0.5 7 7 -
3 III 2077 2062 0.7 351 366 6.8 1 1 -
4 IV 2165 2179 0.64 396 401 1.2 4 5 20
5 V 1905 1942 1.8 333 342 2.6 1 1 -
6 Sub Total 10211 10203 0.07 1859 1879 1.06 16 17 5.8
7 VI 4878 4848 0.61 1092 1093 0.09 1 1 -
8 VII 5102 5120 0.35 1150 1147 0.2 1 1 -
9 VIII 5135 5122 0.25 1050 1067 1.5 5 6 16
10 Sub Total 15115 15090 0.16 3292 3307 0.45 7 8 12.5
11 Total 25326 25293 0.13 5151 5186 0.6 23 25 8
12

Enrolment as per PES & DISE Tiruchirappalli DIstrict
0
1000
2000
3000
4000
5000
6000
PESDISE
PES 2039 2025 2077 2165 1905 4878 5102 5135
DISE 2026 1996 2062 2179 1942 4848 5120 5122
I II III IV V VI VII VIII
Regarding class wise enrolment of children at the primary and upper
primary levels in Tiruchirappalli District, a maximum deviation of + 1.8 was
observed at the V standard level and 1.4 at II standard level and the overall
deviation is less than 1%. As for the enrolment of SC children, the maximum
deviation of (+)6.8% was found at III standard class. There is maximum
deviation of 20% was found in IV standard and 16% was found in VIII
standard for the ST children enrolled in the Tiruchirappalli District. This
deviation is a cause for concern and in further extra care should be taken while
doing enumeration.
2.3.3 Repeaters
Class wise repeaters in the sample schools as per PES and DISE in the
selected districts are presented in the table below.
Table 2.5
Repeaters by Class - Deviation as per PES
Total Repeaters by class as per PES Total Repeaters by class as per DISE
I II III IV V VI VII VIII I II III IV V VI VII VIII
- 10 - - - 11 13 6 - 10 - - - 13 10 11
13

Table 2.5 (Contd…)
% of Deviation as per PES
Total Repeaters by class as per PES
I II III IV V VI VII VIII
- - - - - 15.38 30 45
Repeaters as per PES & DISE Tiruchirappalli District
0
10
0 0 0
11
13
6
0
10
0 0 0
13
10
11
0
2
4
6
8
10
12
14
I II III IV V VI VII VIII
PESDISE
It is observed that a deviation of 15.38% at the VI standard level. In fact
the actual variation is only two, that is, as per the PES data, the number is 11
whereas as per DISE data, it is 13.The Deviation observed in VIII Standard is
45% but the actual number as per DISE is 11 and PES is 6 and VII standard is
30%. However, considering the total number of repeaters in the District, this is
negligible.
2.3.4 Students given free textbooks
Class wise number of children given free textbooks is presented in the table below.
Table 2.6
Class wise No. of children given free text books
I II III IV V VI VII VIII
2039 2025 2077 2165 1905 4878 5102 5135
14

All the children in Government, Local Body, Private Aided schools were
given free textbooks. However the children enrolled in private schools are not given
free textbooks. Therefore the question of deviation does not arise.
2.3.5 Children with disabilities
Class wise number of children with disabilities as per PES and DISE in the
selected sample schools are presented in the table below.
Table 2.7
Children with Disabilities – Deviation as per PES
Children with disabilities as per PES Children with disabilities as per DISE
I II III IV V VI VII VIII I II III IV V VI VII VIII
7 6 7 11 12 24 16 11 7 5 7 10 11 24 15 11
Table 2.7 (Contd…)
% of Deviation for children with disabilities
Children with disabilities
I II III IV V VI VII VIII
- 20 - 10 9 - 6.6 -
The percentage of deviation is highest which is (+) 20% in II std,
(+) 10% in IV std, (+) 9% in V std, and 6.6% in VII std. However the children
with disabilities are actually less in number.
15

2.4 Teachers in position
All the sample schools are maintaining Teacher Attendance Registers
and Leave Registers. The number of posts sanctioned for the schools are not
known by the HMs in a few schools. However all the primary schools selected
in the sample district are having at least two teachers but due to vacancy
position, one teacher is continuing and another teacher is appointed on
deputation basis from other schools with more than two teachers.
The number of teachers in position in the sample schools as per DISE
and PES are given below.
Table 2.8
Teachers in position - Deviation as per PES
No.Teachers as per PES No.Teachers as per DISE
Primary Upper Primary Primary Upper Primary
Deviation
No. Sample Schools
M F T M F T M F T M F T Pri Upp. Pri.
100 46 240 286 149 311 460 46 240 286 149 311 460 - -
There is no deviation of the primary and upper primary level as per
DISE & PES data.
2.5.1 School Facilities
The details of the type of buildings in which the selected sample schools
are functioning is given in the table.
Table 2.9
Deviation in School Building Type
No. of schools by type of Buildings As per PES As per DISE
Pucca Partially Pucca Kucha Tent No Builg. Pucca Partially
Pucca Kucha Tent No Builg.
%
devi
ation
100 - - - - 100 - - - - -
16

All the schools surveyed in the Tiruchirappalli district are functioning in
100% pucca buildings. There is no deviation from DISE data. It is also
revealed that all the PES sample Government and Local Body schools are
functioning in Government buildings only.
2.5.2. No. of Class rooms
The number of class rooms available in the selected sample schools are
given in the table below. The number of classrooms is found more in PES than
DISE. The deviation is 11%.
Table 2.10
Deviation in No. of classrooms
No. of Class rooms
As per PES AS per DISE % deviation
1043 934 11.67
17

CHAPTER III
INVESTIGATOR FEEDBACK HIGHLIGHTS
3.1 Introduction
The team members were asked to collect data in the investigator’s feed
back schedules. All the team members furnished the data almost accurately.
The information were computerized and the reports were also generated to
highlight the real situation.
This chapter presents a report of data on frequency of visits done by the
team in Tiruchirappalli District, teachers’ response, availability and condition
of records, children enrolled and those actually present on the day of the visit
by the team and examination results.
3.2 School Visit
100 Schools in Tiruchirappalli District were visited once and no school
remained closed on the day of the visit.
3.3 Teachers’ response
Table 3.1
Status of Teachers’ Response
Teacher Response
Very Good Good Average Poor Very Poor
59
41 - - -
Head teacher / teacher was available at the time of visit. In all the
schools in the District majority of the responses of the teachers ranged from
Very Good to Good.
18

3.4.1 Availability of School Records
Table 3.2
Status of Availability of School Records
Availability of School Records
Very Good Good Average Poor Very Poor
54 46 - - -
As far as the availability of records in the District, in 100 schools they
are good and very good. The teachers of the selected sample schools produced
relevant registers for verification and the registers were found to be updated
properly.
3.4.2 Condition of records
Table 3.3
Status of updation of School Records
updation & condition of School Records
Yes No
100 -
Again it is seen from the table that the condition of the records and
updating of records are highly satisfying to the investigators.
19

3.5.1 Children Enrolled & Attendance
Table 3.4
As per PES Enrolment (as per record ) Attendance at the time of visit
Total SC ST Total SC ST Class
B G B G B G B G B G B G
Over all
% of
attendance
I 997 1042 210 208 3 - 969 1010 182 202 1 - 97%
II 1003 1022 186 175 3 4 943 998 182 168 3 4 96%
III 1050 1027 185 166 1 - 1013 974 185 161 1 - 95%
IV 1010 1155 214 182 2 2 1029 1077 185 164 2 2 97%
V 908 997 171 162 1 - 905 978 178 155 1 - 99%
VI 2412 2466 620 472 1 1 2662 2075 580 433 1 1 97%
VII 2966 2136 672 478 1 1 2905 2110 551 433 1 1 98%
VIII 2953 2182 597 453 3 2 2890 2140 621 429 3 2 98%
The table tacitly shows in Tiruchirappalli District and for all the classes right from I standard to VIII standard the percentage of attendance of children exceeds 95% which is encouraging indeed. Thanks to the sincere efforts of SSA functionaries at all levels. Children’s attendance in III standard is 95% and II standard is 96%. In I, IV, VI standard is 97% each and VII, VIII standard is 98% and V standard is 99%. But for the attempts by teachers, CRC coordinators, BRC supervisors and other functionaries such a high percentage of attendance is not possible.
When the report of the MI was discussed with the Secretary, MHRD while finalizing the SSA grant for Tamil Nadu state during Feb 2008 secretary explicitly expressed his happiness about the percentage of attendance. To quote him “ Tamil Nadu is a child- friendly state. Listening to the performance of Tamil Nadu was a treat officials to the ears”. This statement speaks volumes about the commitment of SSA.
The data obtained by the monitoring and evaluating team, the one as revealed by the PES record are very close to each other without much deviation. This crucial index of educational development is a matter of high elation for every one of us.
20
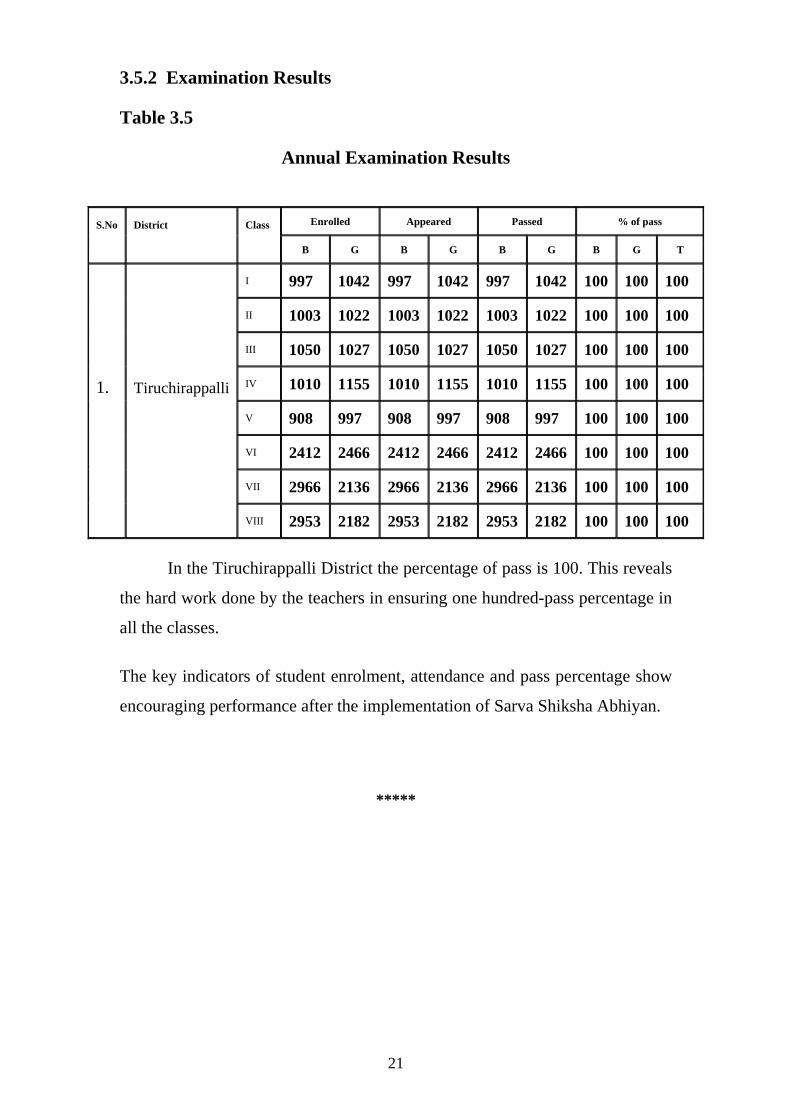
3.5.2 Examination Results
Table 3.5
Annual Examination Results
Enrolled Appeared Passed % of pass S.No District Class
B G B G B G B G T
I 997 1042 997 1042 997 1042 100 100 100
II 1003 1022 1003 1022 1003 1022 100 100 100
III 1050 1027 1050 1027 1050 1027 100 100 100
IV 1010 1155 1010 1155 1010 1155 100 100 100
V 908 997 908 997 908 997 100 100 100
VI 2412 2466 2412 2466 2412 2466 100 100 100
VII 2966 2136 2966 2136 2966 2136 100 100 100
1. Tiruchirappalli
VIII 2953 2182 2953 2182 2953 2182 100 100 100
In the Tiruchirappalli District the percentage of pass is 100. This reveals
the hard work done by the teachers in ensuring one hundred-pass percentage in
all the classes.
The key indicators of student enrolment, attendance and pass percentage show
encouraging performance after the implementation of Sarva Shiksha Abhiyan.
*****
21

CHAPTER IV
INVESTIGATORS SCHOOL OBSERVATION – HIGHLIGHTS
4.1 Introduction
All the team members were also trained to interview the teachers and to
collect information through observation. The teams furnished information such
as in-service training given to school teachers and heads in capturing data,
using DISE format, details of duration of the training programmes organized,
kind of resource persons who conducted such training courses, frequency of
visits by BRTE in the last three months and number of teachers who attended
in-service training programmes etc. in the observation schedules. The
highlights are presented in this chapter.
4.2.1 DISE Training
One-day training was conducted for all school HM/teachers in charge of
filling-up of DISE forms.
The table below shows that more than 100% of the teachers and heads
had attended the DISE training organized at Block level.
Table 4.1
Centre wise Teachers’ attendance in DISE training
No. of School teacher/HM attended DISE training at No. of
Sample Schools Cluster Block % District Not attended training
100 - 16 100 Tiruchirappalli -
22

4.2.2 Teachers who attended DISE training
Table 4.2
Teachers’ attendance by No. of Training Days (These teachers are in charge of filling up of DCF)
Training attended No. of Sample Schools One day Two days More than
two days Training conducted by BRTE&
SO /Resource Persons/Both
100 20 37 43
4.2.3 DCF/Concept
The Table below reveals that all the teachers / heads in this District who
have undergone the training course have understood the DCF concept and it is
seen that the concept and DISE format was explained quite clearly during the
training.
Since DISE training is being conducted every year the HM and the
teacher in-charge of filling-up-of forms are familiar with the concept and
definitions.
Table 4.3
No. of Teachers who have understood the DCF & Concepts
No. of Teachers/HM understood DCF/Concept No. of Sample
Schools
Yes No Partly
No. of Teachers by understanding DCF &
concepts
100 80 - 20 100
Though 80% teachers have fully understood DCF concept ,the rest
20% have only partly understood this points out to the need for additional
training.
23

4.3.1 School visits by BRTE
Table 4.4
BRTE’s School Visits
No. of schools visited by BRTE in the
last 3 months
No. of Sample Schools
Not visited One time
Two times
Three times
Four times
More than four times
100 - - - - - 100
From the table it may be inferred that all the schools selected for PES
have been visited by the BRTE more than four times in the last three months.
This is an evidence of commitment of BRTES.
4.4 Teachers’ in-service training
Table 4.5
No. of Teachers attended in-service Training
No. of Sample Schools No, of teachers in position
No. of teachers attended
in service training Percentage of Attendance
100 746 746 100
The table shows that all the teachers have attended in-service training
programmes. When many states have difficulty in training the teachers in
service, it is a matter of high pride that almost all the teachers have undergone
training. This will certainly boost the quality of teaching and teacher – child
interaction. Training on a massive scale has been responsible for such a grand
success as this.
24
CHAPTER V
FINDINGS OF THE SURVEY
5.1 Introduction
This project was intended to do a sample check survey of 5% of the
schools in each block of Tiruchirappalli district, 5% of each category of
schools i.e., Primary, Middle, High and Higher Secondary schools. Care was
taken to select 5% of schools based on management category i.e, Government,
Local body, Private aided and Private unaided. The sample consisted of 100
schools, all selected through circular random sampling technique. After an
intensive training for one day in data capturing, the team was made to visit
Tiruchirappalli District for verification of school related data.
5.2.1 School Location
The details regarding the location of the schools such as village name/
ward number, Name of the block / Municipality and Rural/ Urban showed that
there is no discrepancy between PES data and DISE data and the PES data are
matching with the DISE data.
5.2.2 School Particulars
The information relating to school particulars such as school category,
type, management, year of establishment etc. are found correct and there is no
deviation between PES & DISE data.
5.3 Teachers in position
As far as the data regarding teachers in position is concerned, the
difference between PES data and DISE data ranges from 0.21 to 0.34.
5.4.1 Enrolment and Student Attendance
In all the classes from I to VIII standard, the percentage of attendance of children exceeds 95% which is an encouraging trend indeed. Children’s attendance in III standard is 95% and II standard is 96%. In I, IV, VI standard
25

is 97% each and VII, VIII standard is 98% and V standard is 99%. But for the attempts by teachers, CRC coordinators, BRC supervisors and other functionaries such a high percentage of attendance is not possible. Thanks to the sincere efforts by SSA functionaries at all levels such as the SPD, DPCs, CEOs, ADPCs, AEEOs, BRC supervisors BRTEs, CRC Co-ordinators, teachers, and education volunteers.
Attendance rate of children, as we all know, is a crucial index of
educational development and the figures do not show any deviation from actual
enrolment, thanks to the honest functionaries who have given reliable data.
The attendance rate also reveals gender equity in general and
community wise equity in particular. This indeed is one of the greatest
achievements of SSA, which aims to achieve gender equity by 2010 both at
primary and upper primary levels.
5.4.2 Examination pass percentage
In all the Schools in Tiruchirappalli district the percentage of pass is
close to 100. From I std. to VIII std. The pass percentage ranges is 100. Here
also there is no gender or community disparity in the results of annual
examination.
5.4.3 Repeaters
The actual variation between PES and DISE data is very negligible.
5.4.4 Distribution of Textbooks
All the needy children have been provided with free text- books from I
std. to VIII std.
5.4.5 Disabled Children
A total number of 90 children are disabled in Tiruchirappalli district.
The PES- DISE data discrepancy is very negligible when the actual number of
children is considered.
26

5.5 Teachers’ Response
In general the cooperation and the response of the teachers were very
good.
All of the teachers and heads of schools have attended the DISE training
conducted at Block level.
The DISE training programmes of one-day duration each were much
useful to the teachers to understand the DCF concept.
5.6 Availability of Records
The PES revealed that the grading for availability of records mostly
ranged from ‘very good’ to ‘good’ and this is one of the reasons for Tamil
Nadu being strong in data base with reference to SSA. In almost all the schools,
full co-operation was rendered during the sample check survey. Necessary
registers/records were made available quite readily and were maintained in
good condition with regular updation much to the delight of the team members.
The team wishes to record the excellent cooperation rendered by the entire
staff of SSA Districts, Head Quarters.
5.7 School Facilities
Classroom Building and Status of Buildings
There is no significant discrepancy between PES and DISE data
regarding school facilities such as classroom and status of buildings. It is
heartening to note that all school buildings were pucca in this District. Further
the data regarding the number of classrooms as per PES is more than DISE.
5.8.1 Children Enrolled and Attendance
This District shows an encouraging trend in the enrolment with the percentage of attendance exceeding 95% from I Standard to VIII Standard. There is not much deviation of PES data from the DISE data as shown by the PES data. Children’s attendance in III standard is 95% and II standard is 96%.
27

In I, IV, VI standard is 97% each and VII, VIII standard is 98% and V standard is 99%.
During the meeting of the Project Approval Board held, during March 2007 and February 2008 where the performance of Tamil Nadu with reference to SSA was shared with the Secretary, MHRD, after appraisal, the attendance issue was discussed. The secretary, MHRD was happy about the attendance percentage in Tamil Nadu which is a crucial index of educational development. There was very negligible deviation in the enrolment particulars of PES and DISE.
5.8.2 Examination Results
In Tiruchirappalli district the percentage of pass is 100. Though on
account of no detention policy at the primary level, the percentage of pass is
100. This reveals the hard work done by the teachers in ensuring near one
hundred pass percentage in all the classes.
The key indicators of student enrolment, attendance and pass percentage
show encouraging performance after the implementation of Sarva Shiksha
Abhiyan.
5.9 DISE Training
All the teachers and heads of schools selected in Tiruchirappalli District
have undergone DISE training at Block level. DISE training programmes were
of one day duration each. It is interesting to note that all the teachers and heads
have understood the DCF concept which can be inferred from the absence of
any major discrepancy between the DISE and PES data.
5.10.1 Data Quality
The quality of data regarding school particulars, infrastructure facilities
(classroom and building), enrolment, attendance and pass percentage of
children, teachers’ response, availability and maintenance of school records,
DISE training, in- service training, disabled children, repeaters and distribution
28

of books is very high and appreciable. The data discrepancy is only minimal,
which shows the effectiveness of training in capturing relevant information.
5.10.2 Data Sharing
Reports have been generated at CRC, BRC and district levels and shared
with offices of various departments for their use. Sharing of data goes a long
way in ensuring overall quality of education providing opportunity for mutual
learning.
5.10.3 Usage of Data
An encouraging trend is that the DISE data are also used for Monitoring
and Planning at all levels.
5.11 Visit of BRTEs
The sincerity and commitment of the BRTEs in Tamil Nadu are
revealed in the finding that all the schools in Tiruchirappalli District have been
visited by the BRTEs more than four times in the last three months.
5.12 Teacher’s in service Training
The greatest achievement of Tamil Nadu lies in the fact that nearly
100% of the teachers have attended in-service training programmes in
Tiruchirappalli District. While several States are lagging behind in this
component, the state of Tamil Nadu has made it possible to cover almost all the
teachers.
5.13 General
The overall findings of the Post Enumerative survey are that the data
captured through DISE on all the key components and indicators of educational
development are of excellent quality without any significant discrepancy. This
has enabled Tamil Nadu to develop in all the educational indices of SSA.
29

CHAPTER VI
SUGGESTIONS AND RECOMMENDATIONS
6.1. Introduction
The following suggestions and recommendations have emerged from the report given in the preceding five chapters.
6.2.1 DISE training
In order to have a holistic and meaningful picture of the achievement of Education for All Scheme (SSA), it is essential to give DISE training to the heads and teachers of all the government heads and teachers of all the government aided and unaided schools. Inservice training should also be given to these teachers for enhancing the quality of instruction. A complete picture of the educational status of all the primary and upper primary children can be obtained only with the teamwork of teachers of government aided and unaided schools.
6.2.2 Data collection and data processing
It is necessary to encourage the sharing of the data with all the VEC members and others facilitating school administration. This sharing of experience will strengthen the various components of SSA and mutual learning in overcoming problems.
Regular monitoring of data capture, data sharing and data usage will be helpful in filling the gaps in the implementation of SSA.
6.2.3 Data quality
DISE data quality is good and the quality must be maintained at all levels.
30

6.2.4 Maintenance and Updation of records
As far as PES reveals that the HMs of the sample schools are maintaining all the records satisfactorily. In all the schools the maintenance is satisfactory.
6.2.5 Data sharing
Data sharing is done by way of distribution of reports generated for their requirement.
6.2.6 Data usage – monitoring
DISE data are used very much in preparation of AWP&B; however data are not much used for monitoring.
6.2.7 Any other
SPO has created a very good school database which may be published in website for public access and for researchers.
6.2.8 General Observations
The Post Enumerative Survey of 5% of schools in Tiruchirappalli District was a soul – satisfying experience because when many states face the problem of data discrepancy, Tamil Nadu is an exemplary state in providing objective and holistic data.
This is possible on account of rigorous training given to the functionaries in data capturing, data recording, data monitoring and data updating. Tamil Nadu is a role model in the successful implementation for Education for All scheme due to the commitment of functionaries at all levels. However, there is no justification for any compliancy because the ASER and PROBE reports of 2008-2009 point to the need for focus on the quality of classroom instruction.
If this tempo is continued and extended for secondary education also, our great nation will be able to fulfil the vision of India as a self–sustained superpower by 2020.
31