Embed Size (px)
Citation preview
January 12, 2018 1January 12, 2018 1
Distribution System Control and
Automation
NREL and PNNLDistribution Systems and Planning Trainingfor Midwest Public Utility Commissions, Jan. 16-17, 2018, St. Paul, MN
Barry Mather and Kevin Schneider
January 12, 2018 2January 12, 2018 2
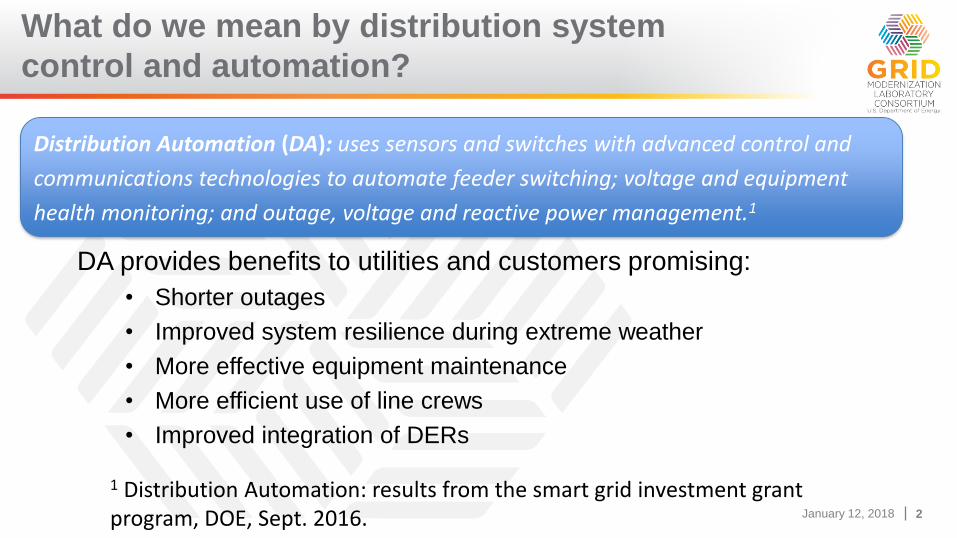
What do we mean by distribution system
control and automation?
DA provides benefits to utilities and customers promising:
• Shorter outages
• Improved system resilience during extreme weather
• More effective equipment maintenance
• More efficient use of line crews
• Improved integration of DERs
Distribution Automation (DA): uses sensors and switches with advanced control and
communications technologies to automate feeder switching; voltage and equipment
health monitoring; and outage, voltage and reactive power management.1
1 Distribution Automation: results from the smart grid investment grant program, DOE, Sept. 2016.
January 12, 2018 3January 12, 2018 3
Spectrum of DA – Simple Systems to
Complex System of Systems
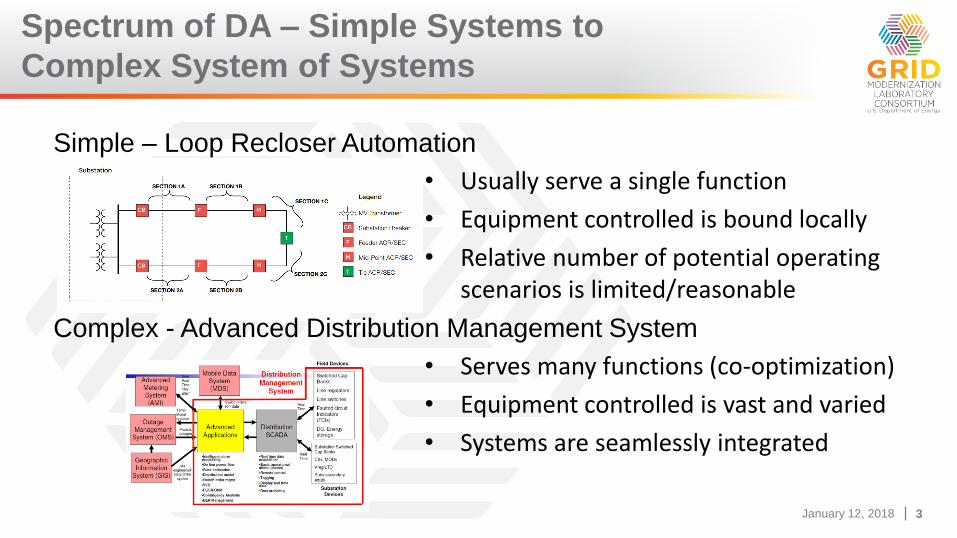
Simple – Loop Recloser Automation
• Usually serve a single function
• Equipment controlled is bound locally
• Relative number of potential operating scenarios is limited/reasonable
Complex - Advanced Distribution Management System
• Serves many functions (co-optimization)
• Equipment controlled is vast and varied
• Systems are seamlessly integrated
January 12, 2018 4January 12, 2018 4
DA Example: Loop Recloser Automation
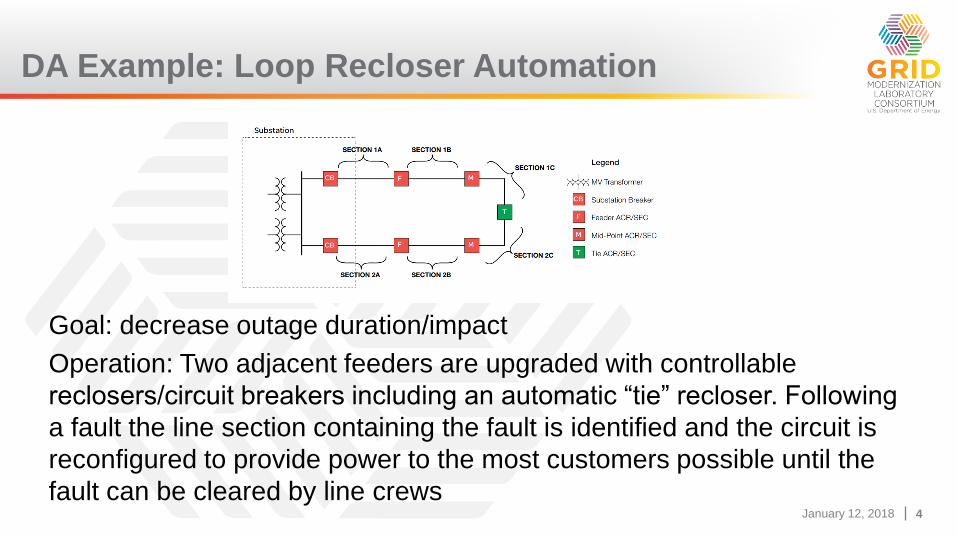
Goal: decrease outage duration/impact
Operation: Two adjacent feeders are upgraded with controllable
reclosers/circuit breakers including an automatic “tie” recloser. Following
a fault the line section containing the fault is identified and the circuit is
reconfigured to provide power to the most customers possible until the
fault can be cleared by line crews
January 12, 2018 5January 12, 2018 5
DA Example: Automatic Reconfiguration
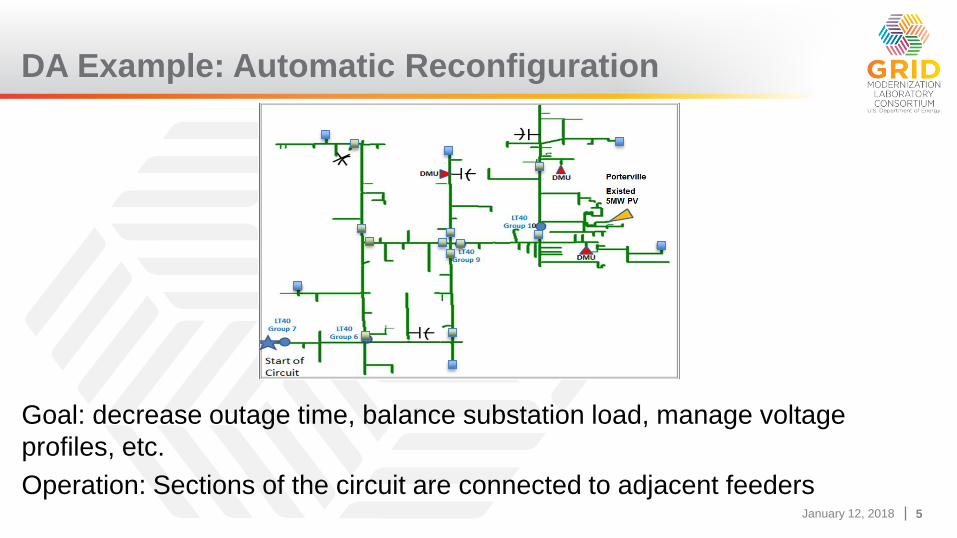
Goal: decrease outage time, balance substation load, manage voltage
profiles, etc.
Operation: Sections of the circuit are connected to adjacent feeders
January 12, 2018 6January 12, 2018 6
DA Example: Conservation Voltage
Reduction (CVR)
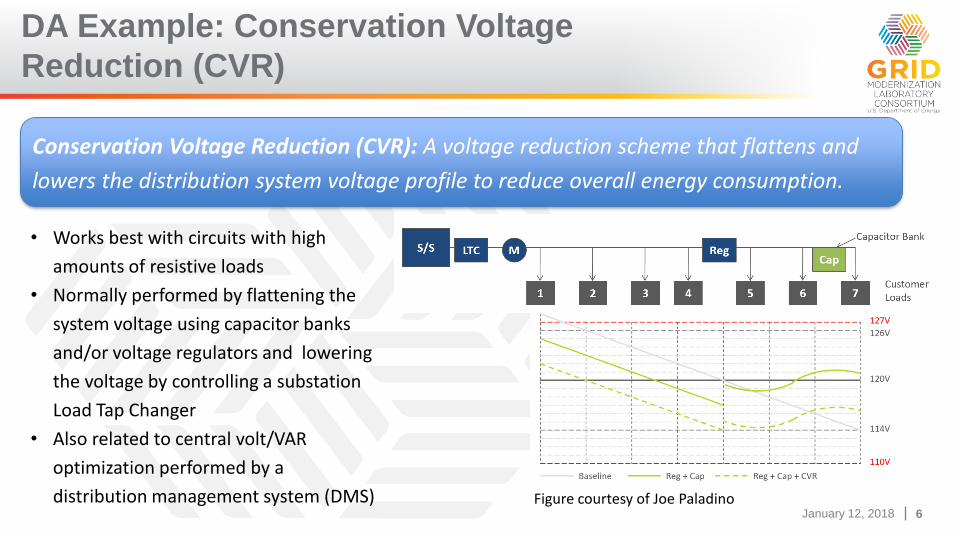
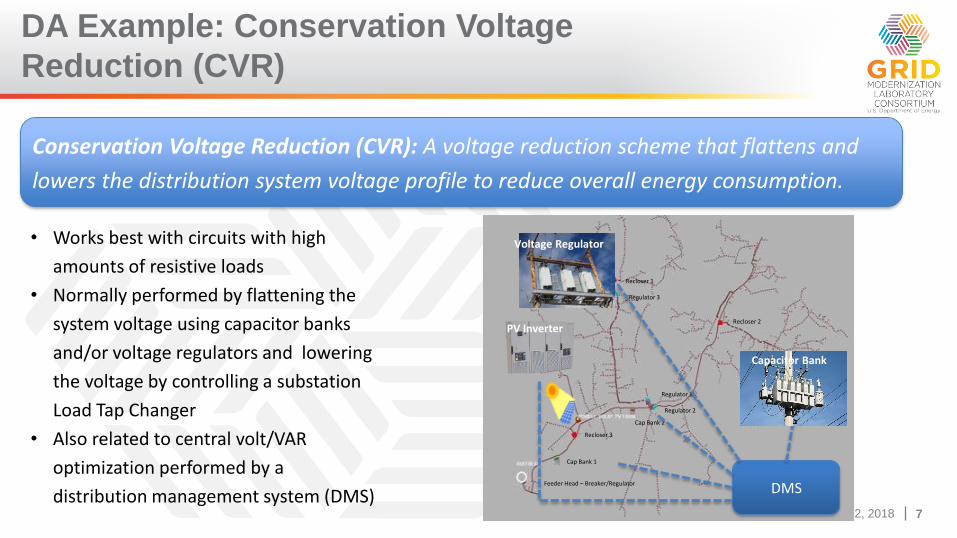
Conservation Voltage Reduction (CVR): A voltage reduction scheme that flattens and
lowers the distribution system voltage profile to reduce overall energy consumption.
• Works best with circuits with high
amounts of resistive loads
• Normally performed by flattening the
system voltage using capacitor banks
and/or voltage regulators and lowering
the voltage by controlling a substation
Load Tap Changer
• Also related to central volt/VAR
optimization performed by a
distribution management system (DMS) Figure courtesy of Joe Paladino
January 12, 2018 7January 12, 2018 7
DA Example: Conservation Voltage
Reduction (CVR)
Conservation Voltage Reduction (CVR): A voltage reduction scheme that flattens and
lowers the distribution system voltage profile to reduce overall energy consumption.
• Works best with circuits with high
amounts of resistive loads
• Normally performed by flattening the
system voltage using capacitor banks
and/or voltage regulators and lowering
the voltage by controlling a substation
Load Tap Changer
• Also related to central volt/VAR
optimization performed by a
distribution management system (DMS)
Recloser 1
Recloser 2
Recloser 3
Cap Bank 1
Cap Bank 2
Regulator 1
Regulator 2
Regulator 3
Feeder Head – Breaker/Regulator DMS
PV Inverter
Capacitor Bank
Voltage Regulator
January 12, 2018 8January 12, 2018 8
DA Example of Value: CVR at AEP
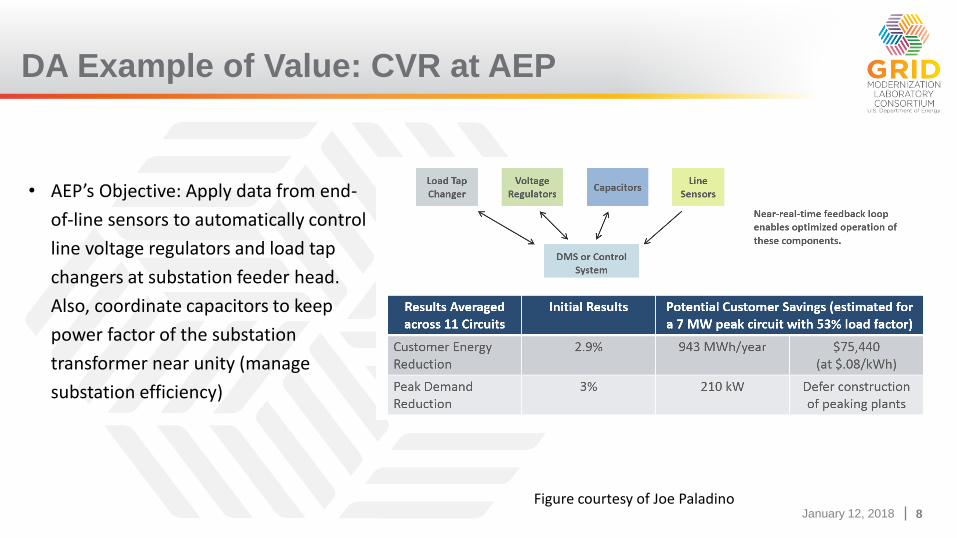
• AEP’s Objective: Apply data from end-
of-line sensors to automatically control
line voltage regulators and load tap
changers at substation feeder head.
Also, coordinate capacitors to keep
power factor of the substation
transformer near unity (manage
substation efficiency)
Figure courtesy of Joe Paladino
January 12, 2018 9January 12, 2018 9
DA Example of Value: CVR Business Case
at Dominion Virginia Power
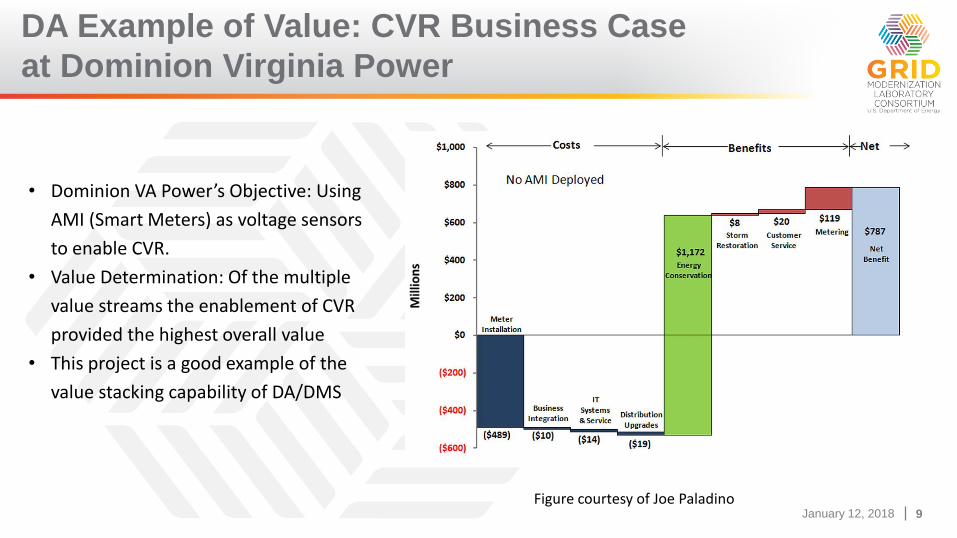
• Dominion VA Power’s Objective: Using
AMI (Smart Meters) as voltage sensors
to enable CVR.
• Value Determination: Of the multiple
value streams the enablement of CVR
provided the highest overall value
• This project is a good example of the
value stacking capability of DA/DMS
Figure courtesy of Joe Paladino
January 12, 2018 10January 12, 2018 10
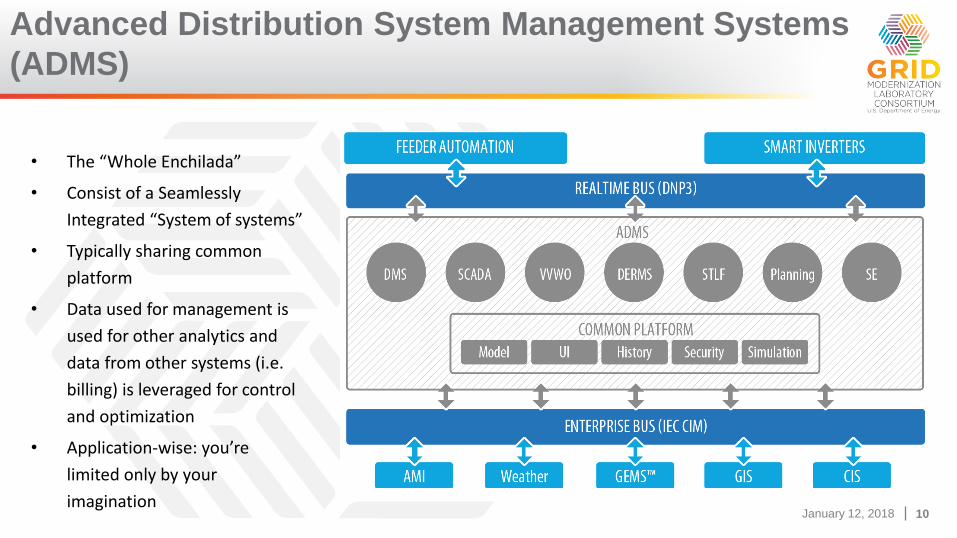
• The “Whole Enchilada”
• Consist of a Seamlessly
Integrated “System of systems”
• Typically sharing common
platform
• Data used for management is
used for other analytics and
data from other systems (i.e.
billing) is leveraged for control
and optimization
• Application-wise: you’re
limited only by your
imagination
Advanced Distribution System Management Systems
(ADMS)
January 12, 2018 11January 12, 2018 11
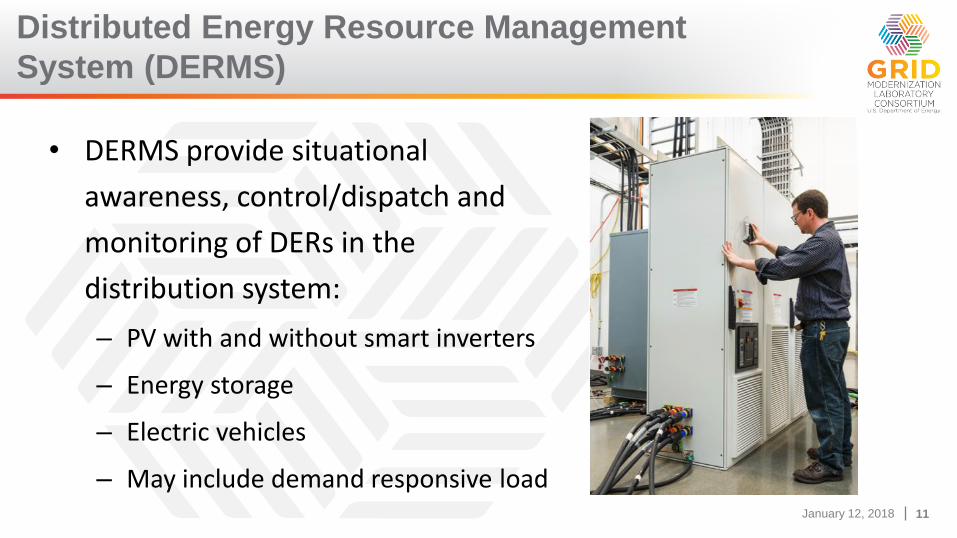
• DERMS provide situational
awareness, control/dispatch and
monitoring of DERs in the
distribution system:
– PV with and without smart inverters
– Energy storage
– Electric vehicles
– May include demand responsive load
Distributed Energy Resource Management
System (DERMS)
January 12, 2018 12January 12, 2018 12
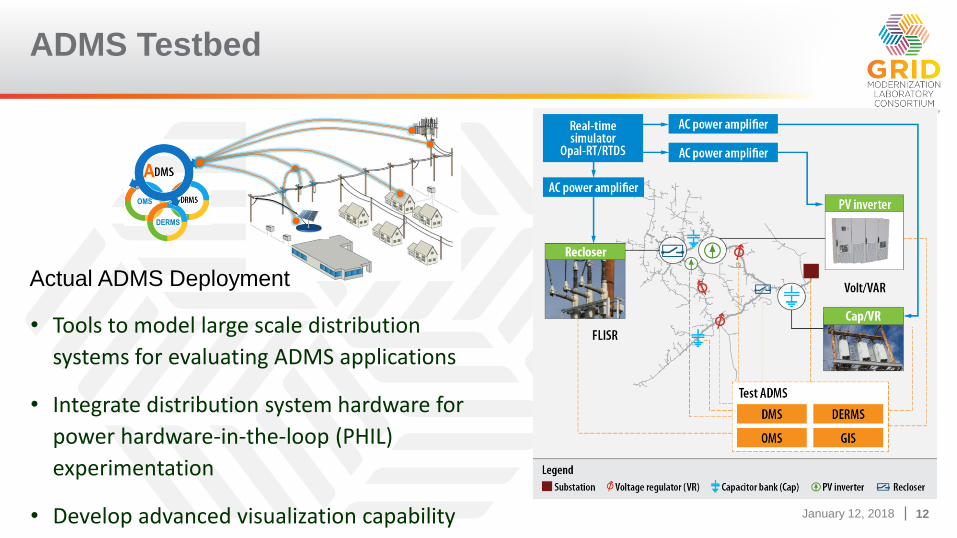
• Tools to model large scale distribution
systems for evaluating ADMS applications
• Integrate distribution system hardware for
power hardware-in-the-loop (PHIL)
experimentation
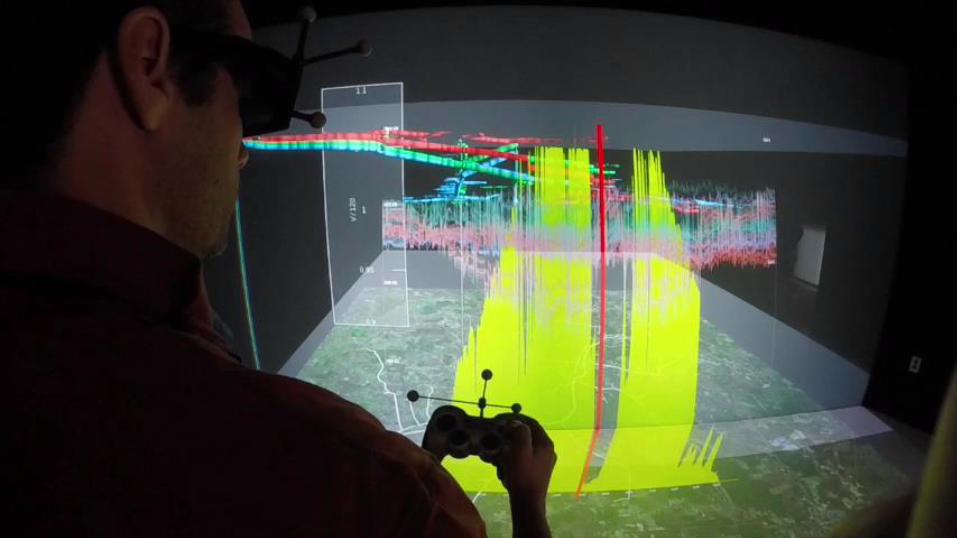
• Develop advanced visualization capability
ADMS Testbed
OMS
DERMS
A
Actual ADMS Deployment

January 12, 2018 13
ADMS Case Study
January 12, 2018 14January 12, 2018 14
Case Study: Feeder Voltage using Advanced
Inverters and a DMS
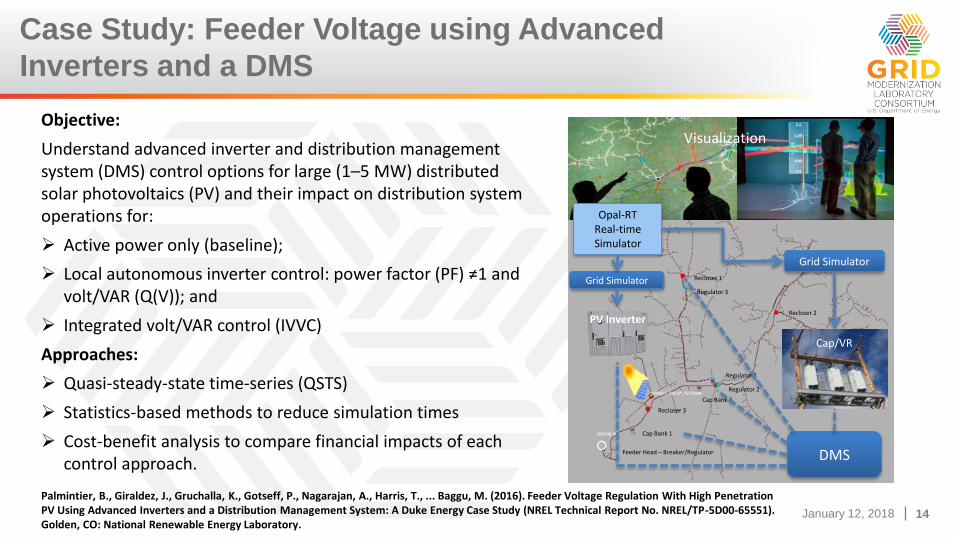
Objective:
Understand advanced inverter and distribution management system (DMS) control options for large (1–5 MW) distributed solar photovoltaics (PV) and their impact on distribution system operations for:
Active power only (baseline);
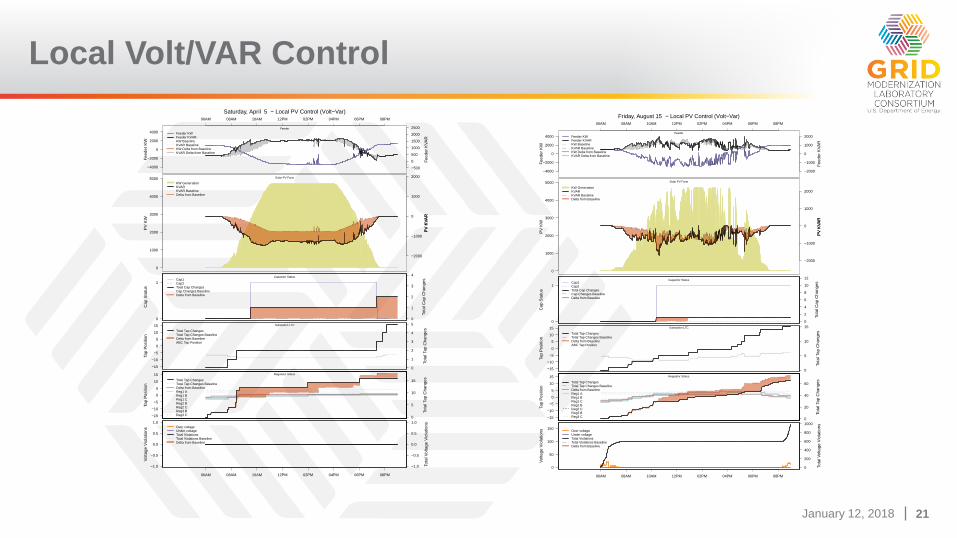
Local autonomous inverter control: power factor (PF) ≠1 and volt/VAR (Q(V)); and
Integrated volt/VAR control (IVVC)
Approaches:
Quasi-steady-state time-series (QSTS)
Statistics-based methods to reduce simulation times
Cost-benefit analysis to compare financial impacts of each control approach.
Energy Systems
Integration
Recloser 1
Recloser 2
Recloser 3
Cap Bank 1
Cap Bank 2
Regulator 1
Regulator 2
Regulator 3
Feeder Head – Breaker/Regulator DMS
Opal-RTReal-time Simulator
Grid Simulator
Grid Simulator
Visualization
PV Inverter
Cap/VR
Palmintier, B., Giraldez, J., Gruchalla, K., Gotseff, P., Nagarajan, A., Harris, T., ... Baggu, M. (2016). Feeder Voltage Regulation With High Penetration PV Using Advanced Inverters and a Distribution Management System: A Duke Energy Case Study (NREL Technical Report No. NREL/TP-5D00-65551). Golden, CO: National Renewable Energy Laboratory.
January 12, 2018 15January 12, 2018 15
The Problem!
January 12, 2018 16January 12, 2018 16
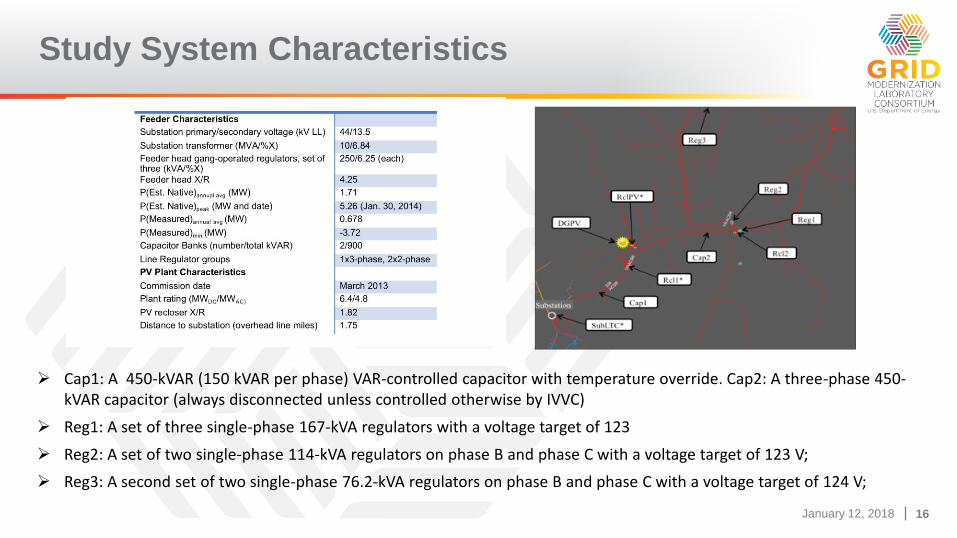
Study System Characteristics
Cap1: A 450-kVAR (150 kVAR per phase) VAR-controlled capacitor with temperature override. Cap2: A three-phase 450-kVAR capacitor (always disconnected unless controlled otherwise by IVVC)
Reg1: A set of three single-phase 167-kVA regulators with a voltage target of 123
Reg2: A set of two single-phase 114-kVA regulators on phase B and phase C with a voltage target of 123 V;
Reg3: A second set of two single-phase 76.2-kVA regulators on phase B and phase C with a voltage target of 124 V;
January 12, 2018 17January 12, 2018 17
PF limit
P generated
P curtailedQ
(k
VA
R)
S (k
VA
)
Q
P
PF = 0 night mode
Operating point
with active power curtailed
Operating point with
oversized inverter
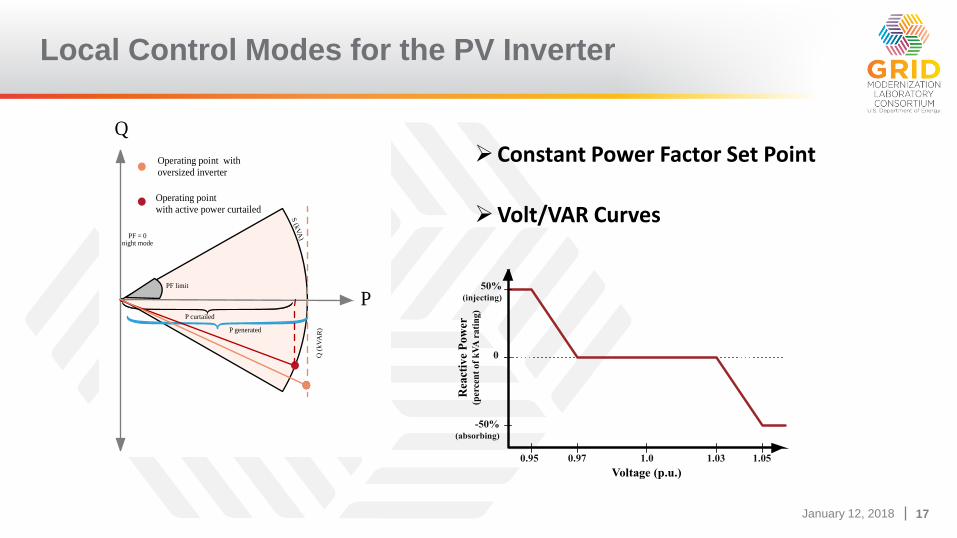
0.97 1.03
Voltage (p.u.)R
eact
ive
Po
wer
(per
cen
t of
kV
A r
ati
ng)
0
0.95 1.051.0
-50%(absorbing)
50%(injecting)
Constant Power Factor Set Point
Volt/VAR Curves
Local Control Modes for the PV Inverter
January 12, 2018 18January 12, 2018 18
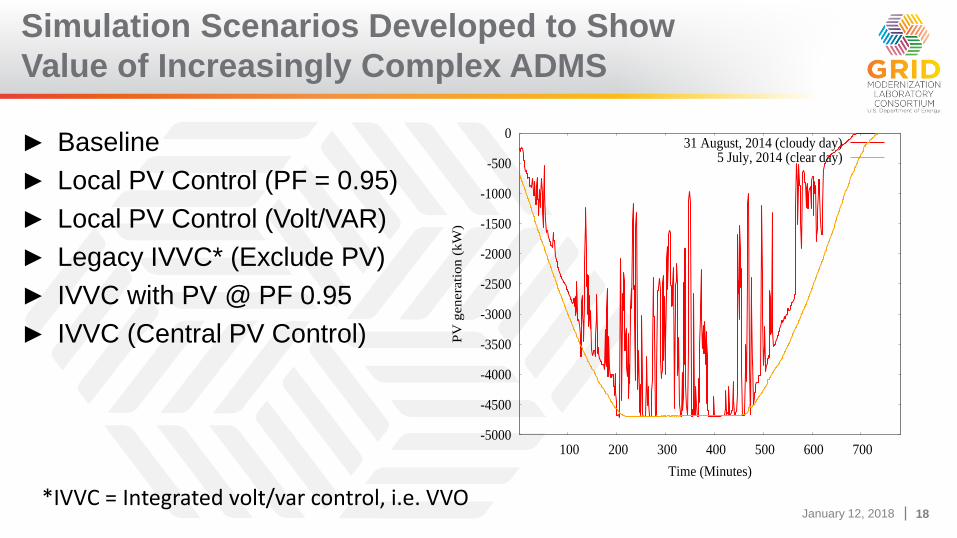
Simulation Scenarios Developed to Show
Value of Increasingly Complex ADMS
► Baseline
► Local PV Control (PF = 0.95)
► Local PV Control (Volt/VAR)
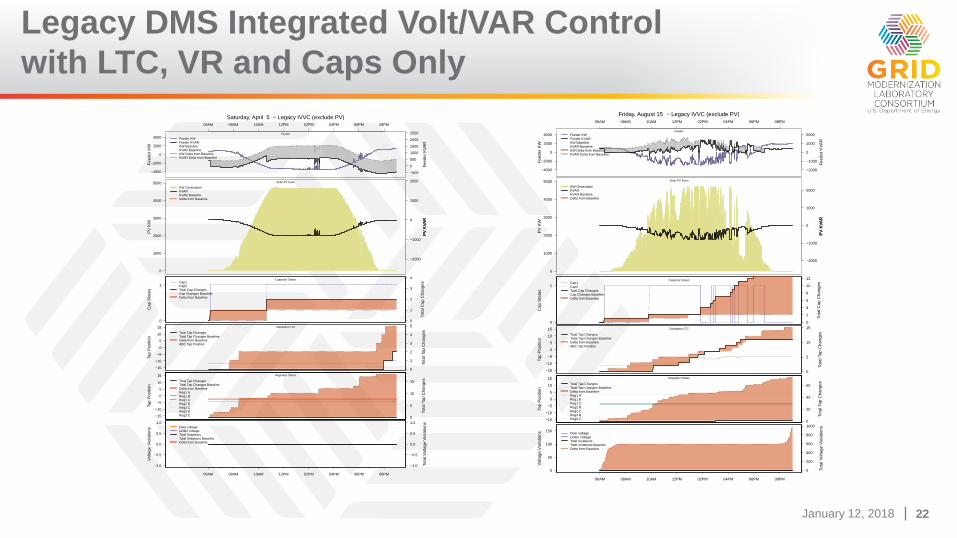
► Legacy IVVC* (Exclude PV)
► IVVC with PV @ PF 0.95
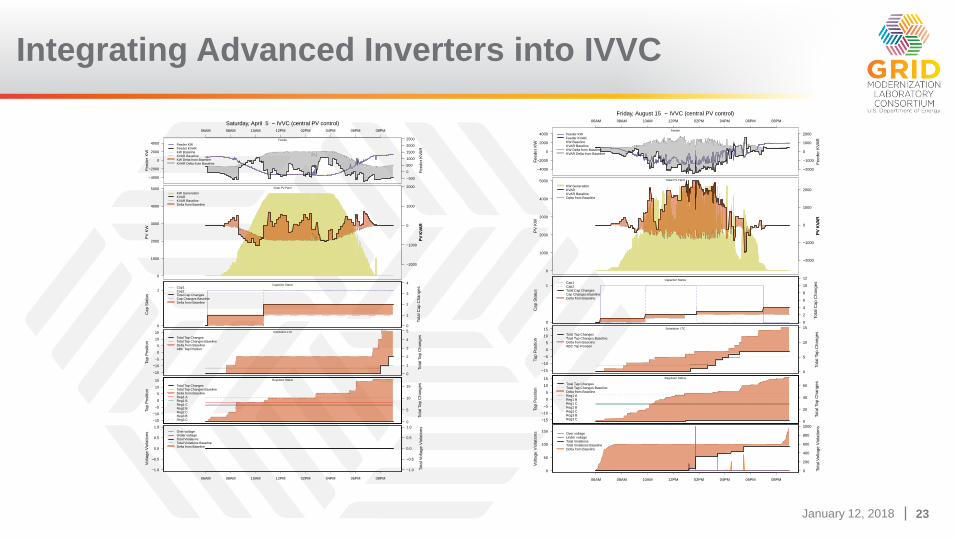
► IVVC (Central PV Control)
-5000
-4500
-4000
-3500
-3000
-2500
-2000
-1500
-1000
-500
0
100 200 300 400 500 600 700P
V g
enera
tio
n (
kW
)
Time (Minutes)
31 August, 2014 (cloudy day)5 July, 2014 (clear day)
*IVVC = Integrated volt/var control, i.e. VVO
January 12, 2018 19January 12, 2018 19
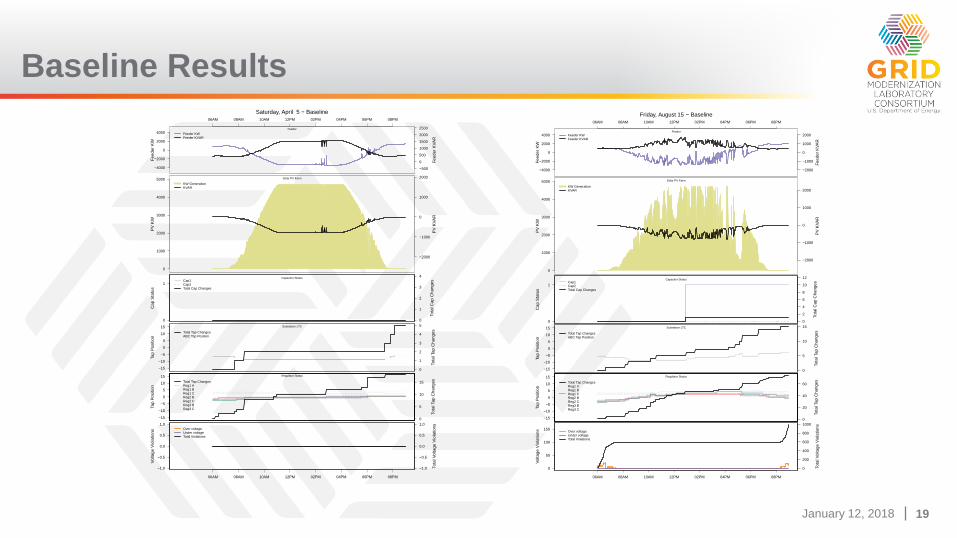
Baseline Results
−4000
−2000
0
2000
4000
06AM 08AM 10AM 12PM 02PM 04PM 06PM 08PM
Saturday, April 5 − Baseline
Fe
ede
r K
W
Fe
ed
er
KV
AR
KV
AR
−500
0
500
1000
1500
2000
2500
Feeder KWFeeder KVAR
Feeder
0
1000
2000
3000
4000
5000
PV
KW
PV
KV
AR
KV
AR
−2000
−1000
0
1000
2000
KW GenerationKVAR
Solar PV Farm
0
1
0
1
2
3
4Cap1Cap2Total Cap Changes
Capacitor Status
Ca
p S
tatu
s
To
tal C
ap
Ch
ang
es
−15
−10
−5
0
5
10
15
Total Tap ChangesABC Tap Position
0
1
2
3
4
5Substation LTC
Ta
p P
ositio
n
To
tal Tap C
han
ge
s
−15
−10
−5
0
5
10
15
Total Tap ChangesReg1 AReg1 BReg1 CReg2 BReg2 CReg3 BReg3 C
0
5
10
15
Regulator Status
Ta
p P
ositio
n
Tota
l Tap
Cha
ng
es
−1.0
−0.5
0.0
0.5
1.0Over voltageUnder voltageTotal Violations
−1.0
−0.5
0.0
0.5
1.0
06AM 08AM 10AM 12PM 02PM 04PM 06PM 08PM
Volta
ge
Vio
lation
s
To
tal V
olta
ge V
iola
tion
s
−4000
−2000
0
2000
4000
06AM 08AM 10AM 12PM 02PM 04PM 06PM 08PM
Friday, August 15 − Baseline
Fe
ede
r K
W
Fe
ed
er
KV
AR
KV
AR
−2000
−1000
0
1000
2000Feeder KWFeeder KVAR
Feeder
0
1000
2000
3000
4000
5000
PV
KW
PV
KV
AR
KV
AR
−2000
−1000
0
1000
2000KW GenerationKVAR
Solar PV Farm
0
1
0
2
4
6
8
10
12Cap1Cap2Total Cap Changes
Capacitor Status
Ca
p S
tatu
s
To
tal C
ap
Ch
ang
es
−15
−10
−5
0
5
10
15
Total Tap ChangesABC Tap Position
0
5
10
15Substation LTC
Ta
p P
ositio
n
To
tal Ta
p C
ha
nge
s
−15
−10
−5
0
5
10
15
Total Tap ChangesReg1 AReg1 BReg1 CReg2 BReg2 CReg3 BReg3 C
0
20
40
60
Regulator Status
Ta
p P
ositio
n
Tota
l Ta
p C
ha
ng
es
0
50
100
150Over voltageUnder voltageTotal Violations
0
200
400
600
800
1000
06AM 08AM 10AM 12PM 02PM 04PM 06PM 08PM
Volta
ge
Vio
lation
s
To
tal V
olta
ge V
iola
tion
s
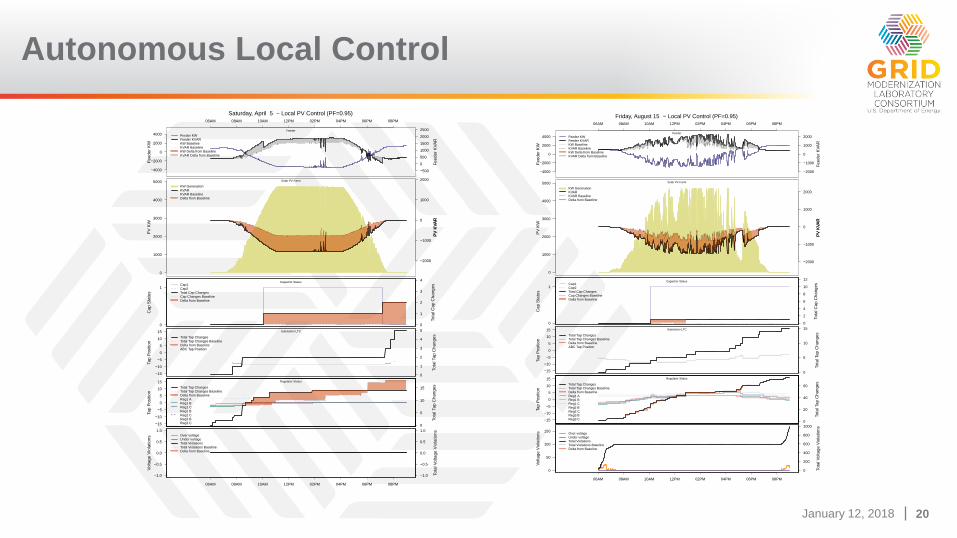
January 12, 2018 20January 12, 2018 20
Autonomous Local Control
−4000
−2000
0
2000
4000
06AM 08AM 10AM 12PM 02PM 04PM 06PM 08PM
Saturday, April 5 − Local PV Control (PF=0.95)
Fee
de
r K
W
Fe
ed
er
KV
AR
KV
AR
−500
0
500
1000
1500
2000
2500
Feeder KWFeeder KVARKW BaselineKVAR BaselineKW Delta from BaselineKVAR Delta from Baseline
Feeder
0
1000
2000
3000
4000
5000
PV
KW
PV
KV
AR
KV
AR
−2000
−1000
0
1000
2000
PV
KV
AR
KW GenerationKVARKVAR BaselineDelta from Baseline
Solar PV Farm
0
1
0
1
2
3
4Cap1Cap2Total Cap ChangesCap Changes BaselineDelta from Baseline
Capacitor Status
Ca
p S
tatu
s
To
tal C
ap C
ha
ng
es
−15
−10
−5
0
5
10
15
Total Tap ChangesTotal Tap Changes BaselineDelta from BaselineABC Tap Position
0
1
2
3
4
5Substation LTC
Ta
p P
ositio
n
To
tal Tap C
han
ge
s
−15
−10
−5
0
5
10
15
Total Tap ChangesTotal Tap Changes BaselineDelta from BaselineReg1 AReg1 BReg1 CReg2 BReg2 CReg3 BReg3 C
0
5
10
15
Regulator Status
Ta
p P
ositio
n
Tota
l Tap
Chan
ges
−1.0
−0.5
0.0
0.5
1.0Over voltageUnder voltageTotal ViolationsTotal Violations BaselineDelta from Baseline
−1.0
−0.5
0.0
0.5
1.0
06AM 08AM 10AM 12PM 02PM 04PM 06PM 08PM
Volta
ge
Vio
lation
s
To
tal V
olta
ge V
iola
tion
s
−4000
−2000
0
2000
4000
06AM 08AM 10AM 12PM 02PM 04PM 06PM 08PM
Friday, August 15 − Local PV Control (PF=0.95)
Fe
ede
r K
W
Fe
ed
er
KV
AR
KV
AR
−2000
−1000
0
1000
2000Feeder KWFeeder KVARKW BaselineKVAR BaselineKW Delta from BaselineKVAR Delta from Baseline
Feeder
0
1000
2000
3000
4000
5000
PV
KW
PV
KV
AR
KV
AR
−2000
−1000
0
1000
2000
PV
KV
AR
KW GenerationKVARKVAR BaselineDelta from Baseline
Solar PV Farm
0
1
0
2
4
6
8
10
12Cap1Cap2Total Cap ChangesCap Changes BaselineDelta from Baseline
Capacitor Status
Ca
p S
tatu
s
To
tal C
ap
Ch
ang
es
−15
−10
−5
0
5
10
15
Total Tap ChangesTotal Tap Changes BaselineDelta from BaselineABC Tap Position
0
5
10
15Substation LTC
Ta
p P
ositio
n
To
tal Ta
p C
ha
nge
s
−15
−10
−5
0
5
10
15
Total Tap ChangesTotal Tap Changes BaselineDelta from BaselineReg1 AReg1 BReg1 CReg2 BReg2 CReg3 BReg3 C
0
20
40
60
Regulator Status
Ta
p P
ositio
n
Tota
l Ta
p C
ha
ng
es
0
50
100
150Over voltageUnder voltageTotal ViolationsTotal Violations BaselineDelta from Baseline
0
200
400
600
800
1000
06AM 08AM 10AM 12PM 02PM 04PM 06PM 08PM
Volta
ge
Vio
lation
s
To
tal V
olta
ge V
iola
tion
s
January 12, 2018 21January 12, 2018 21
−4000
−2000
0
2000
4000
06AM 08AM 10AM 12PM 02PM 04PM 06PM 08PM
Saturday, April 5 − Local PV Control (Volt−Var)
Fee
de
r K
W
Fe
ed
er
KV
AR
KV
AR
−500
0
500
1000
1500
2000
2500
Feeder KWFeeder KVARKW BaselineKVAR BaselineKW Delta from BaselineKVAR Delta from Baseline
Feeder
0
1000
2000
3000
4000
5000
PV
KW
PV
KV
AR
KV
AR
−2000
−1000
0
1000
2000
PV
KV
AR
KW GenerationKVARKVAR BaselineDelta from Baseline
Solar PV Farm
0
1
0
1
2
3
4Cap1Cap2Total Cap ChangesCap Changes BaselineDelta from Baseline
Capacitor Status
Ca
p S
tatu
s
To
tal C
ap C
ha
ng
es
−15
−10
−5
0
5
10
15
Total Tap ChangesTotal Tap Changes BaselineDelta from BaselineABC Tap Position
0
1
2
3
4
5Substation LTC
Ta
p P
ositio
n
To
tal Tap C
han
ge
s
−15
−10
−5
0
5
10
15
Total Tap ChangesTotal Tap Changes BaselineDelta from BaselineReg1 AReg1 BReg1 CReg2 BReg2 CReg3 BReg3 C
0
5
10
15
Regulator Status
Ta
p P
ositio
n
Tota
l Tap
Chan
ges
−1.0
−0.5
0.0
0.5
1.0Over voltageUnder voltageTotal ViolationsTotal Violations BaselineDelta from Baseline
−1.0
−0.5
0.0
0.5
1.0
06AM 08AM 10AM 12PM 02PM 04PM 06PM 08PM
Volta
ge
Vio
lation
s
To
tal V
olta
ge V
iola
tion
s
−4000
−2000
0
2000
4000
06AM 08AM 10AM 12PM 02PM 04PM 06PM 08PM
Friday, August 15 − Local PV Control (Volt−Var)
Fee
de
r K
W
Fe
ed
er
KV
AR
KV
AR
−2000
−1000
0
1000
2000Feeder KWFeeder KVARKW BaselineKVAR BaselineKW Delta from BaselineKVAR Delta from Baseline
Feeder
0
1000
2000
3000
4000
5000
PV
KW
PV
KV
AR
KV
AR
−2000
−1000
0
1000
2000
PV
KV
AR
KW GenerationKVARKVAR BaselineDelta from Baseline
Solar PV Farm
0
1
0
2
4
6
8
10
12Cap1Cap2Total Cap ChangesCap Changes BaselineDelta from Baseline
Capacitor Status
Ca
p S
tatu
s
To
tal C
ap C
ha
ng
es
−15
−10
−5
0
5
10
15
Total Tap ChangesTotal Tap Changes BaselineDelta from BaselineABC Tap Position
0
5
10
15Substation LTC
Ta
p P
ositio
n
To
tal Tap C
han
ge
s
−15
−10
−5
0
5
10
15
Total Tap ChangesTotal Tap Changes BaselineDelta from BaselineReg1 AReg1 BReg1 CReg2 BReg2 CReg3 BReg3 C
0
20
40
60
Regulator Status
Ta
p P
ositio
n
Tota
l Tap
Chan
ges
0
50
100
150Over voltageUnder voltageTotal ViolationsTotal Violations BaselineDelta from Baseline
0
200
400
600
800
1000
06AM 08AM 10AM 12PM 02PM 04PM 06PM 08PM
Volta
ge
Vio
lation
s
To
tal V
olta
ge V
iola
tion
s
Local Volt/VAR Control
January 12, 2018 22January 12, 2018 22
−4000
−2000
0
2000
4000
06AM 08AM 10AM 12PM 02PM 04PM 06PM 08PM
Saturday, April 5 − Legacy IVVC (exclude PV)
Fee
de
r K
W
Fe
ed
er
KV
AR
KV
AR
−500
0
500
1000
1500
2000
2500
Feeder KWFeeder KVARKW BaselineKVAR BaselineKW Delta from BaselineKVAR Delta from Baseline
Feeder
0
1000
2000
3000
4000
5000
PV
KW
PV
KV
AR
KV
AR
−2000
−1000
0
1000
2000
PV
KV
AR
KW GenerationKVARKVAR BaselineDelta from Baseline
Solar PV Farm
0
1
0
1
2
3
4Cap1Cap2Total Cap ChangesCap Changes BaselineDelta from Baseline
Capacitor Status
Ca
p S
tatu
s
To
tal C
ap C
ha
ng
es
−15
−10
−5
0
5
10
15
Total Tap ChangesTotal Tap Changes BaselineDelta from BaselineABC Tap Position
0
1
2
3
4
5Substation LTC
Ta
p P
ositio
n
To
tal Tap C
han
ge
s
−15
−10
−5
0
5
10
15
Total Tap ChangesTotal Tap Changes BaselineDelta from BaselineReg1 AReg1 BReg1 CReg2 BReg2 CReg3 BReg3 C
0
5
10
15
Regulator Status
Ta
p P
ositio
n
Tota
l Tap
Chan
ges
−1.0
−0.5
0.0
0.5
1.0Over voltageUnder voltageTotal ViolationsTotal Violations BaselineDelta from Baseline
−1.0
−0.5
0.0
0.5
1.0
06AM 08AM 10AM 12PM 02PM 04PM 06PM 08PM
Volta
ge
Vio
lation
s
To
tal V
olta
ge V
iola
tion
s
−4000
−2000
0
2000
4000
06AM 08AM 10AM 12PM 02PM 04PM 06PM 08PM
Friday, August 15 − Legacy IVVC (exclude PV)
Fe
ede
r K
W
Fe
ed
er
KV
AR
KV
AR
−2000
−1000
0
1000
2000Feeder KWFeeder KVARKW BaselineKVAR BaselineKW Delta from BaselineKVAR Delta from Baseline
Feeder
0
1000
2000
3000
4000
5000
PV
KW
PV
KV
AR
KV
AR
−2000
−1000
0
1000
2000
PV
KV
AR
KW GenerationKVARKVAR BaselineDelta from Baseline
Solar PV Farm
0
1
0
2
4
6
8
10
12Cap1Cap2Total Cap ChangesCap Changes BaselineDelta from Baseline
Capacitor Status
Ca
p S
tatu
s
To
tal C
ap C
ha
ng
es
−15
−10
−5
0
5
10
15
Total Tap ChangesTotal Tap Changes BaselineDelta from BaselineABC Tap Position
0
5
10
15Substation LTC
Ta
p P
ositio
n
To
tal Ta
p C
ha
nge
s
−15
−10
−5
0
5
10
15
Total Tap ChangesTotal Tap Changes BaselineDelta from BaselineReg1 AReg1 BReg1 CReg2 BReg2 CReg3 BReg3 C
0
20
40
60
Regulator Status
Ta
p P
ositio
n
Tota
l Tap
Cha
ng
es
0
50
100
150Over voltageUnder voltageTotal ViolationsTotal Violations BaselineDelta from Baseline
0
200
400
600
800
1000
06AM 08AM 10AM 12PM 02PM 04PM 06PM 08PM
Volta
ge
Vio
lation
s
To
tal V
olta
ge V
iola
tion
s
Legacy DMS Integrated Volt/VAR Control
with LTC, VR and Caps Only
January 12, 2018 23January 12, 2018 23
−4000
−2000
0
2000
4000
06AM 08AM 10AM 12PM 02PM 04PM 06PM 08PM
Saturday, April 5 − IVVC (central PV control)
Fee
de
r K
W
Fe
ed
er
KV
AR
KV
AR
−500
0
500
1000
1500
2000
2500
Feeder KWFeeder KVARKW BaselineKVAR BaselineKW Delta from BaselineKVAR Delta from Baseline
Feeder
0
1000
2000
3000
4000
5000
PV
KW
PV
KV
AR
KV
AR
−2000
−1000
0
1000
2000
PV
KV
AR
KW GenerationKVARKVAR BaselineDelta from Baseline
Solar PV Farm
0
1
0
1
2
3
4Cap1Cap2Total Cap ChangesCap Changes BaselineDelta from Baseline
Capacitor Status
Ca
p S
tatu
s
To
tal C
ap C
ha
ng
es
−15
−10
−5
0
5
10
15
Total Tap ChangesTotal Tap Changes BaselineDelta from BaselineABC Tap Position
0
1
2
3
4
5Substation LTC
Ta
p P
ositio
n
To
tal Tap C
han
ge
s−15
−10
−5
0
5
10
15
Total Tap ChangesTotal Tap Changes BaselineDelta from BaselineReg1 AReg1 BReg1 CReg2 BReg2 CReg3 BReg3 C
0
5
10
15
Regulator Status
Ta
p P
ositio
n
Tota
l Tap
Chan
ges
−1.0
−0.5
0.0
0.5
1.0Over voltageUnder voltageTotal ViolationsTotal Violations BaselineDelta from Baseline
−1.0
−0.5
0.0
0.5
1.0
06AM 08AM 10AM 12PM 02PM 04PM 06PM 08PM
Volta
ge
Vio
lation
s
To
tal V
olta
ge V
iola
tion
s
−4000
−2000
0
2000
4000
06AM 08AM 10AM 12PM 02PM 04PM 06PM 08PM
Friday, August 15 − IVVC (central PV control)
Fe
ede
r K
W
Fe
ed
er
KV
AR
KV
AR
−2000
−1000
0
1000
2000Feeder KWFeeder KVARKW BaselineKVAR BaselineKW Delta from BaselineKVAR Delta from Baseline
Feeder
0
1000
2000
3000
4000
5000
PV
KW
PV
KV
AR
KV
AR
−2000
−1000
0
1000
2000
PV
KV
AR
KW GenerationKVARKVAR BaselineDelta from Baseline
Solar PV Farm
0
1
0
2
4
6
8
10
12Cap1Cap2Total Cap ChangesCap Changes BaselineDelta from Baseline
Capacitor Status
Ca
p S
tatu
s
To
tal C
ap
Ch
ang
es
−15
−10
−5
0
5
10
15
Total Tap ChangesTotal Tap Changes BaselineDelta from BaselineABC Tap Position
0
5
10
15Substation LTC
Ta
p P
ositio
n
To
tal Ta
p C
ha
nge
s
−15
−10
−5
0
5
10
15
Total Tap ChangesTotal Tap Changes BaselineDelta from BaselineReg1 AReg1 BReg1 CReg2 BReg2 CReg3 BReg3 C
0
20
40
60
Regulator Status
Ta
p P
ositio
n
Tota
l Ta
p C
ha
ng
es
0
50
100
150Over voltageUnder voltageTotal ViolationsTotal Violations BaselineDelta from Baseline
0
200
400
600
800
1000
06AM 08AM 10AM 12PM 02PM 04PM 06PM 08PM
Volta
ge
Vio
lation
s
To
tal V
olta
ge V
iola
tion
s
Integrating Advanced Inverters into IVVC
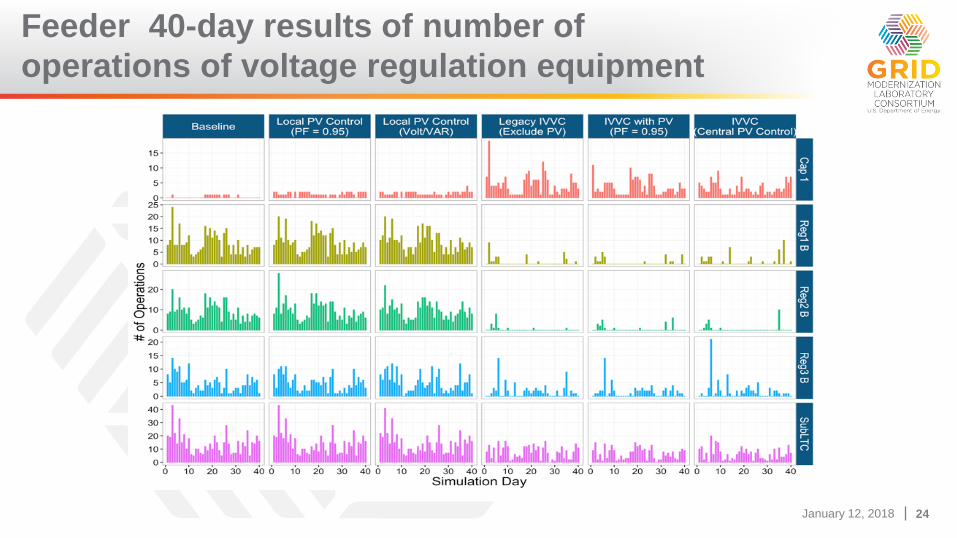
January 12, 2018 24January 12, 2018 24
Feeder 40-day results of number of
operations of voltage regulation equipment
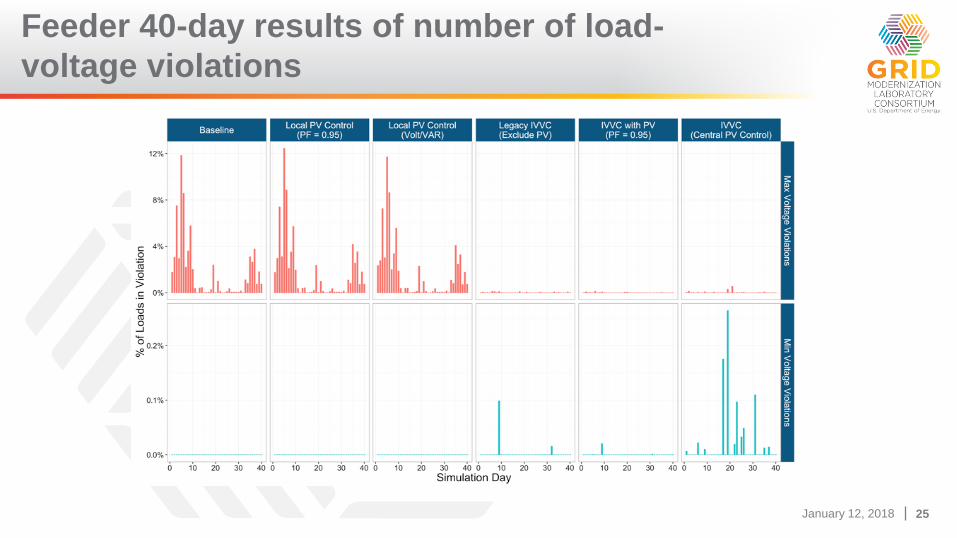
January 12, 2018 25January 12, 2018 25
Feeder 40-day results of number of load-
voltage violations
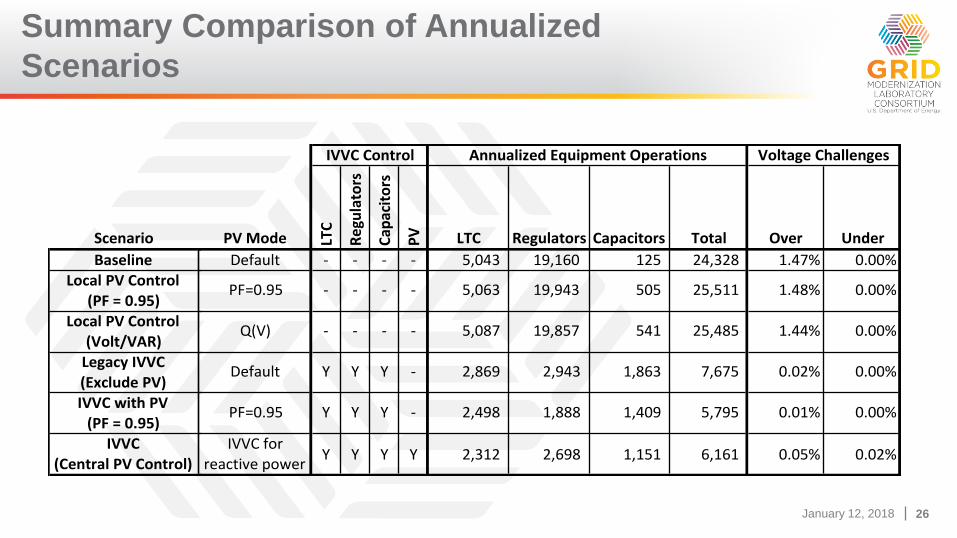
January 12, 2018 26January 12, 2018 26
Summary Comparison of Annualized
Scenarios
Scenario
BaselineLocalPVControl
(PF=0.95)
LocalPVControl(Volt/VAR)LegacyIVVC(ExcludePV)
IVVCwithPV(PF=0.95)
IVVC(CentralPVControl)
PVMode LTC
Regulators
Cap
acitors
PV LTC Regulators Capacitors Total Over Under
Default - - - - 5,043 19,160 125 24,328 1.47% 0.00%
PF=0.95 - - - - 5,063 19,943 505 25,511 1.48% 0.00%
Q(V) - - - - 5,087 19,857 541 25,485 1.44% 0.00%
Default Y Y Y - 2,869 2,943 1,863 7,675 0.02% 0.00%
PF=0.95 Y Y Y - 2,498 1,888 1,409 5,795 0.01% 0.00%
IVVCforreactivepower
Y Y Y Y 2,312 2,698 1,151 6,161 0.05% 0.02%
IVVCControl AnnualizedEquipmentOperations VoltageChallenges
January 12, 2018 27January 12, 2018 27
Case Study: Conclusion
► This work Illustrates the potential for coordinated control of voltage management equipment,
such as the central DMS-controlled IVVC by:
◼ Providing substantial improvement in distribution operations with large-scale PV systems
◼ Reducing regulator operations
◼ Decreasing the number of voltage challenges
► The preliminary cost-benefit analysis (not detailed in this presentation) showed operational
cost savings for the IVVC scenarios that were:
◼ Partially driven by reduced wear and tear on utility regulating equipment,
◼ Dominated by the use of CVR/Demand reduction objective
► Work needed in the area of integrating advanced inverters as controllable resources into
IVVC optimization strategies
◼ Event triggered operation of DMS IVVC
◼ Power factor set point in place of reactive power set point

January 12, 2018 28
Thank you
Questions?