Embed Size (px)
Citation preview
B F I R E S E A R C H A N D S T A T I S T I C S P U B L I S H E D J U L Y 2 0 1 7
DISTRIBUTION

The UK theatrical marketplace is dominated by a few very large companies. In 2016, the top 10 distributors generated over £1.2 billion in box office revenues, while the remainder made £53 million.
FACTS IN FOCUS The top 10 distributors had a 96% share of the market in 2016; Walt Disney was the top
earning distributor with theatrical revenues of £301 million.
The market share for the 97 distributors outside the top 10 was 4%.
The highest earning distributor of UK independent films was 20th Century Fox, but StudioCanal distributed the largest number of such films.
Almost one in seven films (68%) were released at fewer than 50 sites in 2016.
Opening weekends represented 30% of the total box office.
The estimated total amount spent by distributors on advertising films released theatrically was just over £213 million.
The average advertising spend for UK studio-backed films was £1.9 million, compared with £1.5 million in 2015; the average spend for UK independent films was £100,000, down from £200,000 in 2015.
DISTRIBUTIONImage: Captain America: Civil War © 2016 Marvel Studios. All Rights Reserved.
DISTRIBUTION
BFI STATISTICAL YEARBOOK 2017
2
DISTRIBUTORS
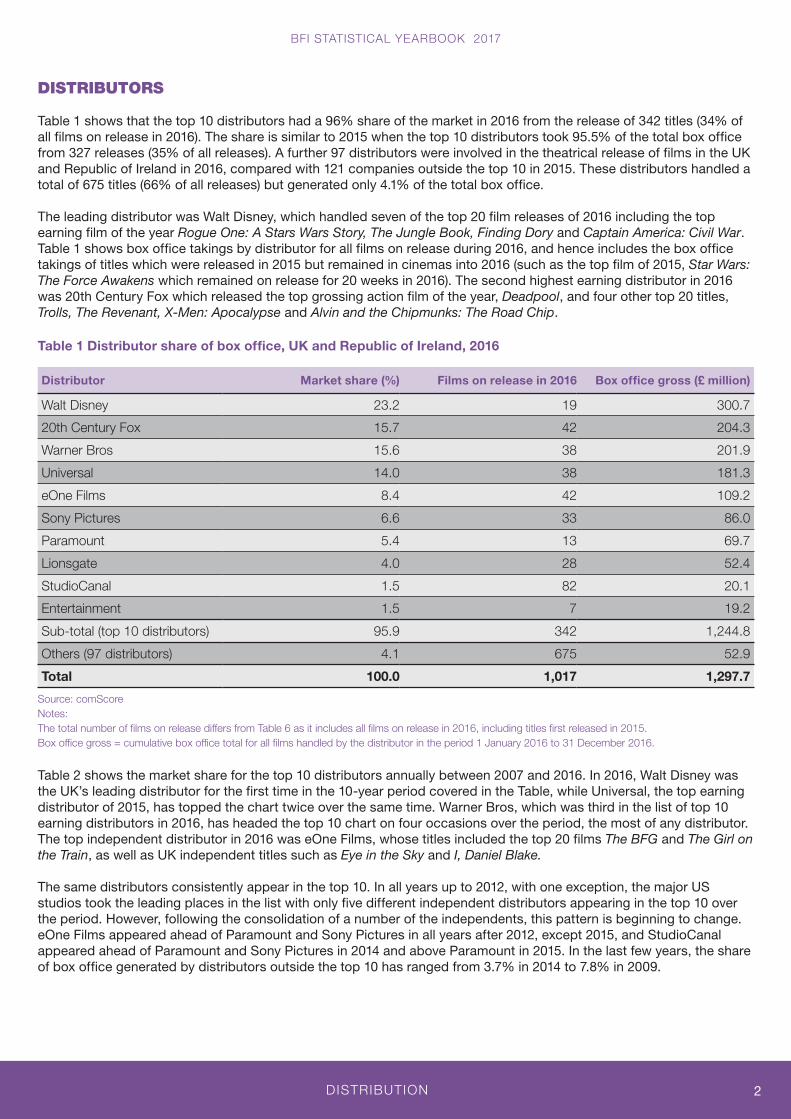
Table 1 shows that the top 10 distributors had a 96% share of the market in 2016 from the release of 342 titles (34% of all films on release in 2016). The share is similar to 2015 when the top 10 distributors took 95.5% of the total box office from 327 releases (35% of all releases). A further 97 distributors were involved in the theatrical release of films in the UK and Republic of Ireland in 2016, compared with 121 companies outside the top 10 in 2015. These distributors handled a total of 675 titles (66% of all releases) but generated only 4.1% of the total box office.
The leading distributor was Walt Disney, which handled seven of the top 20 film releases of 2016 including the top earning film of the year Rogue One: A Stars Wars Story, The Jungle Book, Finding Dory and Captain America: Civil War. Table 1 shows box office takings by distributor for all films on release during 2016, and hence includes the box office takings of titles which were released in 2015 but remained in cinemas into 2016 (such as the top film of 2015, Star Wars: The Force Awakens which remained on release for 20 weeks in 2016). The second highest earning distributor in 2016 was 20th Century Fox which released the top grossing action film of the year, Deadpool, and four other top 20 titles, Trolls, The Revenant, X-Men: Apocalypse and Alvin and the Chipmunks: The Road Chip.
Table 1 Distributor share of box office, UK and Republic of Ireland, 2016
Distributor Market share (%) Films on release in 2016 Box office gross (£ million)
Walt Disney 23.2 19 300.7
20th Century Fox 15.7 42 204.3
Warner Bros 15.6 38 201.9
Universal 14.0 38 181.3
eOne Films 8.4 42 109.2
Sony Pictures 6.6 33 86.0
Paramount 5.4 13 69.7
Lionsgate 4.0 28 52.4
StudioCanal 1.5 82 20.1
Entertainment 1.5 7 19.2
Sub-total (top 10 distributors) 95.9 342 1,244.8
Others (97 distributors) 4.1 675 52.9
Total 100.0 1,017 1,297.7
Source: comScore Notes: The total number of films on release differs from Table 6 as it includes all films on release in 2016, including titles first released in 2015. Box office gross = cumulative box office total for all films handled by the distributor in the period 1 January 2016 to 31 December 2016.
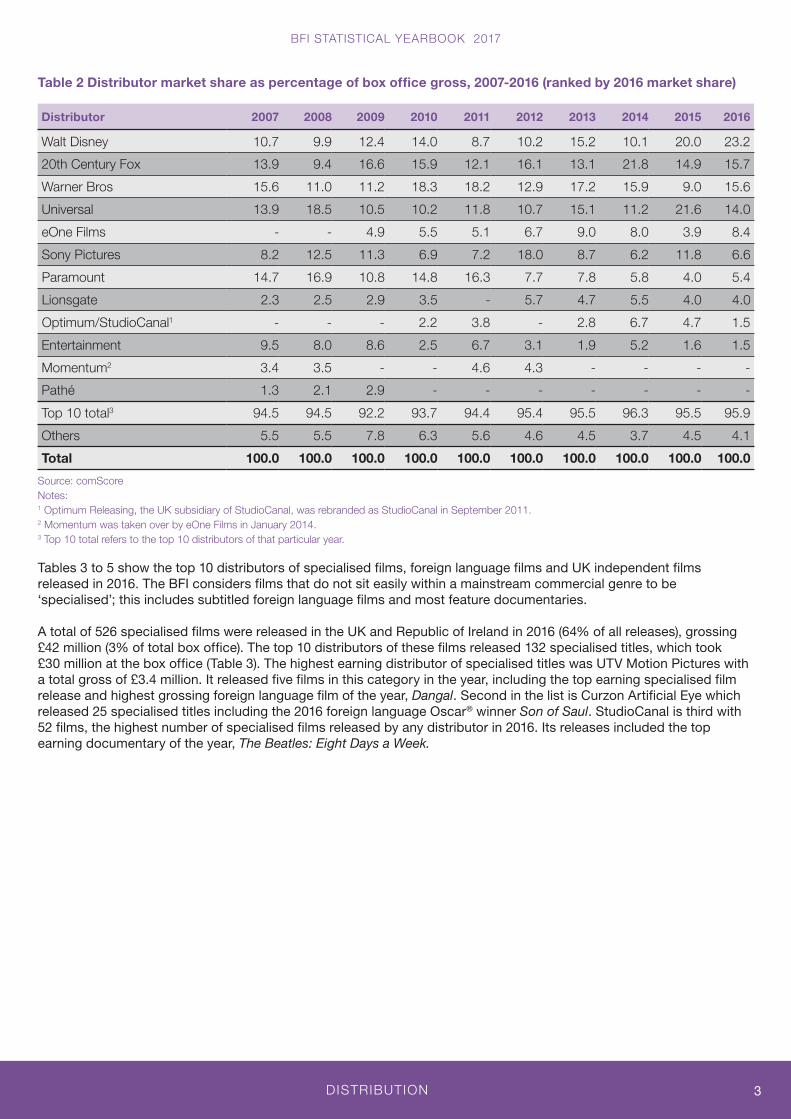
Table 2 shows the market share for the top 10 distributors annually between 2007 and 2016. In 2016, Walt Disney was the UK’s leading distributor for the first time in the 10-year period covered in the Table, while Universal, the top earning distributor of 2015, has topped the chart twice over the same time. Warner Bros, which was third in the list of top 10 earning distributors in 2016, has headed the top 10 chart on four occasions over the period, the most of any distributor. The top independent distributor in 2016 was eOne Films, whose titles included the top 20 films The BFG and The Girl on the Train, as well as UK independent titles such as Eye in the Sky and I, Daniel Blake.
The same distributors consistently appear in the top 10. In all years up to 2012, with one exception, the major US studios took the leading places in the list with only five different independent distributors appearing in the top 10 over the period. However, following the consolidation of a number of the independents, this pattern is beginning to change. eOne Films appeared ahead of Paramount and Sony Pictures in all years after 2012, except 2015, and StudioCanal appeared ahead of Paramount and Sony Pictures in 2014 and above Paramount in 2015. In the last few years, the share of box office generated by distributors outside the top 10 has ranged from 3.7% in 2014 to 7.8% in 2009.
DISTRIBUTION
BFI STATISTICAL YEARBOOK 2017
3
Table 2 Distributor market share as percentage of box office gross, 2007-2016 (ranked by 2016 market share)
Distributor 2007 2008 2009 2010 2011 2012 2013 2014 2015 2016
Walt Disney 10.7 9.9 12.4 14.0 8.7 10.2 15.2 10.1 20.0 23.2
20th Century Fox 13.9 9.4 16.6 15.9 12.1 16.1 13.1 21.8 14.9 15.7
Warner Bros 15.6 11.0 11.2 18.3 18.2 12.9 17.2 15.9 9.0 15.6
Universal 13.9 18.5 10.5 10.2 11.8 10.7 15.1 11.2 21.6 14.0
eOne Films - - 4.9 5.5 5.1 6.7 9.0 8.0 3.9 8.4
Sony Pictures 8.2 12.5 11.3 6.9 7.2 18.0 8.7 6.2 11.8 6.6
Paramount 14.7 16.9 10.8 14.8 16.3 7.7 7.8 5.8 4.0 5.4
Lionsgate 2.3 2.5 2.9 3.5 - 5.7 4.7 5.5 4.0 4.0
Optimum/StudioCanal1 - - - 2.2 3.8 - 2.8 6.7 4.7 1.5
Entertainment 9.5 8.0 8.6 2.5 6.7 3.1 1.9 5.2 1.6 1.5
Momentum2 3.4 3.5 - - 4.6 4.3 - - - -
Pathé 1.3 2.1 2.9 - - - - - - -
Top 10 total3 94.5 94.5 92.2 93.7 94.4 95.4 95.5 96.3 95.5 95.9
Others 5.5 5.5 7.8 6.3 5.6 4.6 4.5 3.7 4.5 4.1
Total 100.0 100.0 100.0 100.0 100.0 100.0 100.0 100.0 100.0 100.0
Source: comScore Notes: 1 Optimum Releasing, the UK subsidiary of StudioCanal, was rebranded as StudioCanal in September 2011. 2 Momentum was taken over by eOne Films in January 2014. 3 Top 10 total refers to the top 10 distributors of that particular year.
Tables 3 to 5 show the top 10 distributors of specialised films, foreign language films and UK independent films released in 2016. The BFI considers films that do not sit easily within a mainstream commercial genre to be ‘specialised’; this includes subtitled foreign language films and most feature documentaries.
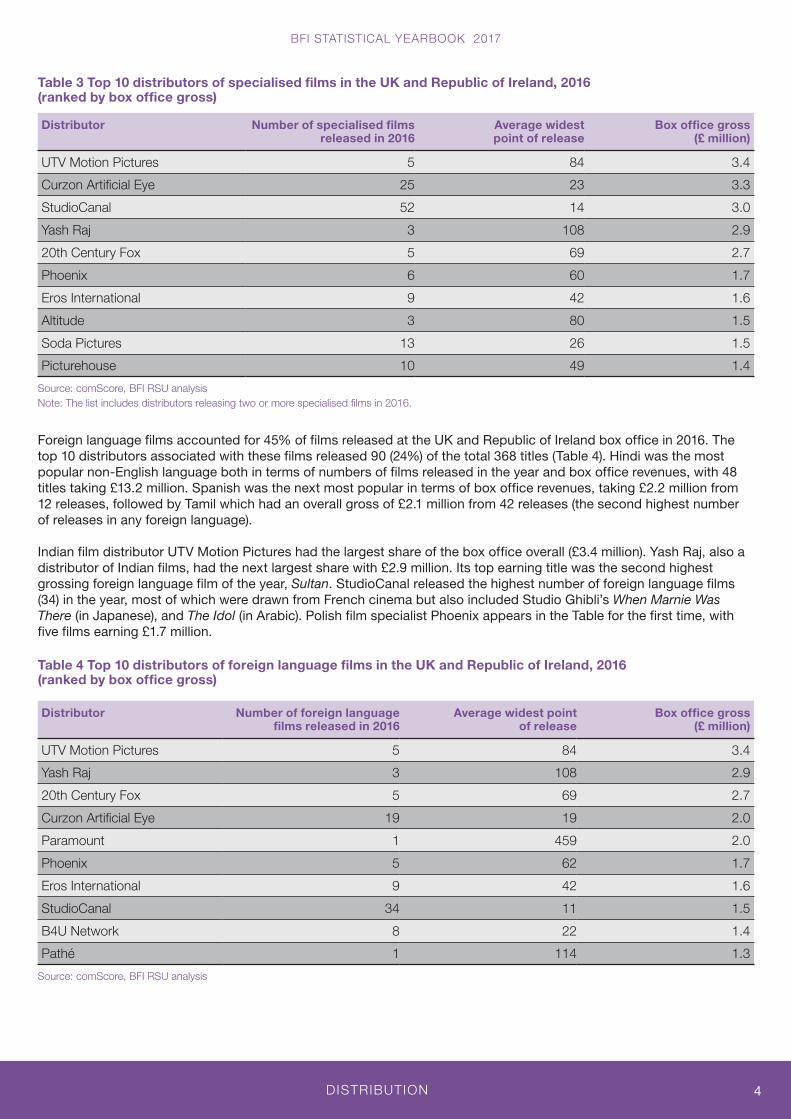
A total of 526 specialised films were released in the UK and Republic of Ireland in 2016 (64% of all releases), grossing £42 million (3% of total box office). The top 10 distributors of these films released 132 specialised titles, which took £30 million at the box office (Table 3). The highest earning distributor of specialised titles was UTV Motion Pictures with a total gross of £3.4 million. It released five films in this category in the year, including the top earning specialised film release and highest grossing foreign language film of the year, Dangal. Second in the list is Curzon Artificial Eye which released 25 specialised titles including the 2016 foreign language Oscar® winner Son of Saul. StudioCanal is third with 52 films, the highest number of specialised films released by any distributor in 2016. Its releases included the top earning documentary of the year, The Beatles: Eight Days a Week.
DISTRIBUTION
BFI STATISTICAL YEARBOOK 2017
4
Table 3 Top 10 distributors of specialised films in the UK and Republic of Ireland, 2016 (ranked by box office gross)
Distributor Number of specialised films released in 2016
Average widest point of release
Box office gross (£ million)
UTV Motion Pictures 5 84 3.4
Curzon Artificial Eye 25 23 3.3
StudioCanal 52 14 3.0
Yash Raj 3 108 2.9
20th Century Fox 5 69 2.7
Phoenix 6 60 1.7
Eros International 9 42 1.6
Altitude 3 80 1.5
Soda Pictures 13 26 1.5
Picturehouse 10 49 1.4
Source: comScore, BFI RSU analysis Note: The list includes distributors releasing two or more specialised films in 2016.
Foreign language films accounted for 45% of films released at the UK and Republic of Ireland box office in 2016. The top 10 distributors associated with these films released 90 (24%) of the total 368 titles (Table 4). Hindi was the most popular non-English language both in terms of numbers of films released in the year and box office revenues, with 48 titles taking £13.2 million. Spanish was the next most popular in terms of box office revenues, taking £2.2 million from 12 releases, followed by Tamil which had an overall gross of £2.1 million from 42 releases (the second highest number of releases in any foreign language).
Indian film distributor UTV Motion Pictures had the largest share of the box office overall (£3.4 million). Yash Raj, also a distributor of Indian films, had the next largest share with £2.9 million. Its top earning title was the second highest grossing foreign language film of the year, Sultan. StudioCanal released the highest number of foreign language films (34) in the year, most of which were drawn from French cinema but also included Studio Ghibli’s When Marnie Was There (in Japanese), and The Idol (in Arabic). Polish film specialist Phoenix appears in the Table for the first time, with five films earning £1.7 million.
Table 4 Top 10 distributors of foreign language films in the UK and Republic of Ireland, 2016 (ranked by box office gross)
Distributor Number of foreign language films released in 2016
Average widest point of release
Box office gross (£ million)
UTV Motion Pictures 5 84 3.4
Yash Raj 3 108 2.9
20th Century Fox 5 69 2.7
Curzon Artificial Eye 19 19 2.0
Paramount 1 459 2.0
Phoenix 5 62 1.7
Eros International 9 42 1.6
StudioCanal 34 11 1.5
B4U Network 8 22 1.4
Pathé 1 114 1.3
Source: comScore, BFI RSU analysis
DISTRIBUTION
BFI STATISTICAL YEARBOOK 2017
5
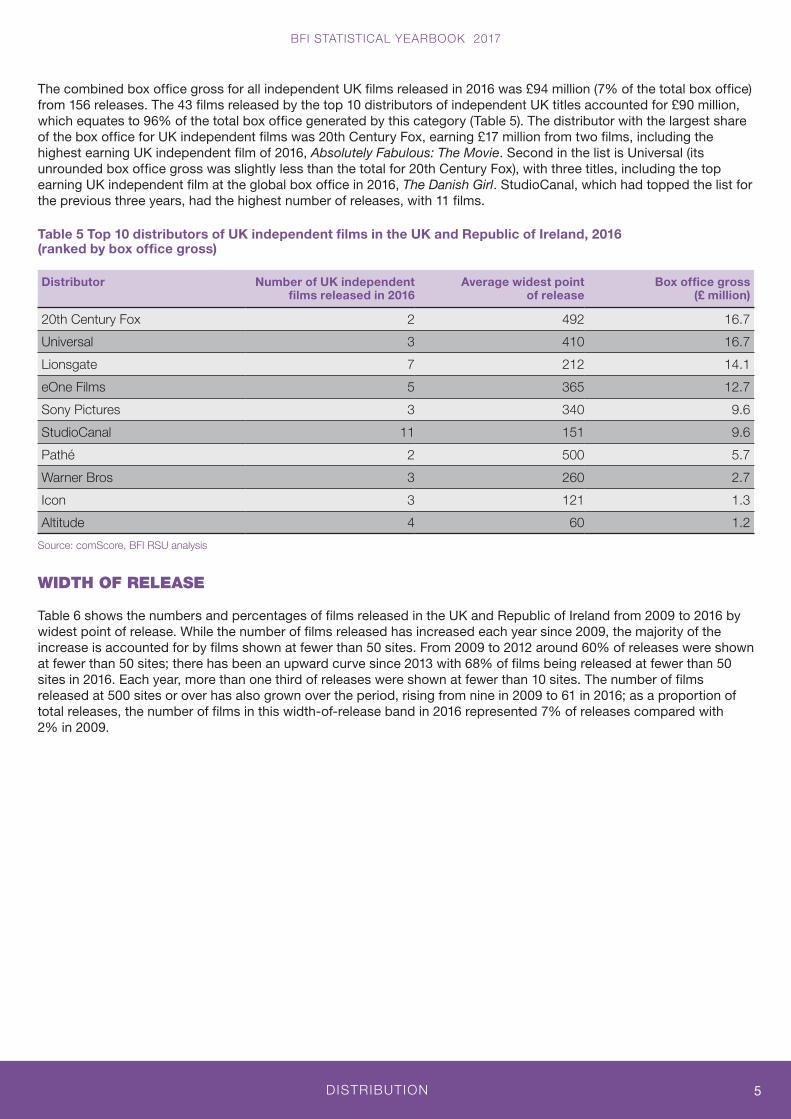
The combined box office gross for all independent UK films released in 2016 was £94 million (7% of the total box office) from 156 releases. The 43 films released by the top 10 distributors of independent UK titles accounted for £90 million, which equates to 96% of the total box office generated by this category (Table 5). The distributor with the largest share of the box office for UK independent films was 20th Century Fox, earning £17 million from two films, including the highest earning UK independent film of 2016, Absolutely Fabulous: The Movie. Second in the list is Universal (its unrounded box office gross was slightly less than the total for 20th Century Fox), with three titles, including the top earning UK independent film at the global box office in 2016, The Danish Girl. StudioCanal, which had topped the list for the previous three years, had the highest number of releases, with 11 films.
Table 5 Top 10 distributors of UK independent films in the UK and Republic of Ireland, 2016 (ranked by box office gross)
Distributor Number of UK independent films released in 2016
Average widest point of release
Box office gross (£ million)
20th Century Fox 2 492 16.7
Universal 3 410 16.7
Lionsgate 7 212 14.1
eOne Films 5 365 12.7
Sony Pictures 3 340 9.6
StudioCanal 11 151 9.6
Pathé 2 500 5.7
Warner Bros 3 260 2.7
Icon 3 121 1.3
Altitude 4 60 1.2
Source: comScore, BFI RSU analysis
WIDTH OF RELEASE
Table 6 shows the numbers and percentages of films released in the UK and Republic of Ireland from 2009 to 2016 by widest point of release. While the number of films released has increased each year since 2009, the majority of the increase is accounted for by films shown at fewer than 50 sites. From 2009 to 2012 around 60% of releases were shown at fewer than 50 sites; there has been an upward curve since 2013 with 68% of films being released at fewer than 50 sites in 2016. Each year, more than one third of releases were shown at fewer than 10 sites. The number of films released at 500 sites or over has also grown over the period, rising from nine in 2009 to 61 in 2016; as a proportion of total releases, the number of films in this width-of-release band in 2016 represented 7% of releases compared with 2% in 2009.

DISTRIBUTION
BFI STATISTICAL YEARBOOK 2017
6
Table 6 Numbers and percentages of releases by widest point of release, 2009-2016
2009 2010 2011 2012 2013 2014 2015 2016
Sites at widest point of release
Number % of releases
Number % of releases
Number % of releases
Number % of releases
Number % of releases
Number % of releases
Number % of releases
Number % of releases
≥500 9 1.8 13 2.3 19 3.4 26 4.0 31 4.4 39 5.5 46 6.1 61 7.4
400 – 499 46 9.1 51 9.2 57 10.2 43 6.6 53 7.6 46 6.5 50 6.6 45 5.5
300 – 399 53 10.5 48 8.6 44 7.9 51 7.9 42 6.0 49 6.9 33 4.3 19 2.3
200 – 299 30 6.0 28 5.0 26 4.7 24 3.7 19 2.7 21 2.9 22 2.9 18 2.2
100 – 199 32 6.4 37 6.6 41 7.3 36 5.6 36 5.2 30 4.2 41 5.4 59 7.2
50 – 99 31 6.2 36 6.5 41 7.3 56 8.7 64 9.2 58 8.1 52 6.9 58 7.1
10 – 49 105 20.9 129 23.2 138 24.7 166 25.7 210 30.1 190 26.7 236 31.1 244 29.7
<10 197 39.2 215 38.6 192 34.4 245 37.9 243 34.8 279 39.2 279 36.8 317 38.6
Total 503 100.0 557 100.0 558 100.0 647 100.0 698 100.0 712 100.0 759 100.0 821 100.0
Source: comScore, BFI RSU analysis Note: Percentages may not sum to totals due to rounding.
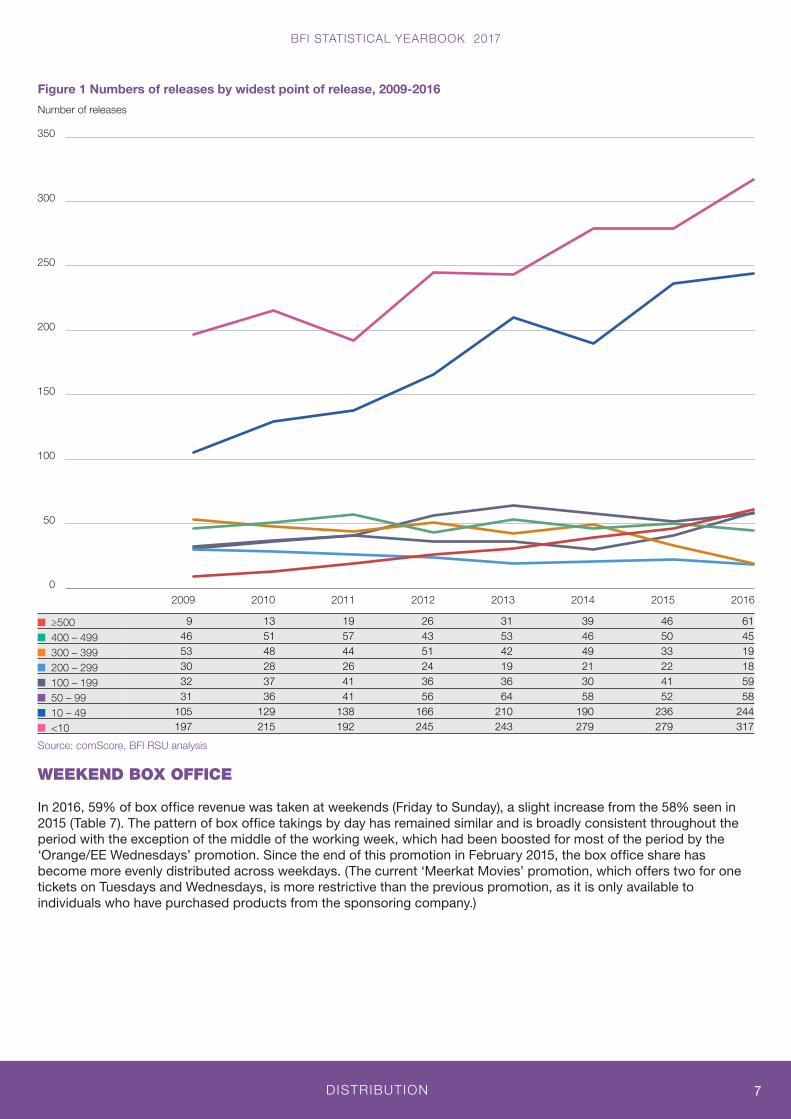
As outlined above, between 2009 and 2016 more films were shown at fewer than 50 sites at their widest point of release than any of the higher width-of-release bands. To 2011, films released at the greatest number of sites (500 or over) had the lowest number of releases, but the pattern is different for 2012-2016 with fewer films being released at 200-299 sites than released at 500 sites or over. As Figure 1 illustrates, during the period the trend in the number of films released at 200-299 sites has shown a gradual decrease, whilst the number of films released at the greatest number of sites has increased year on year. In the other width-of-release bands (50-99, 100-199, 300-399 and 400-499 sites) the numbers of releases vary and no consistent patterns are evident.
DISTRIBUTION
BFI STATISTICAL YEARBOOK 2017
7
Figure 1 Numbers of releases by widest point of release, 2009-2016
≥500 9 13 19 26 31 39 46 61
400 – 499 46 51 57 43 53 46 50 45
300 – 399 53 48 44 51 42 49 33 19
200 – 299 30 28 26 24 19 21 22 18
100 – 199 32 37 41 36 36 30 41 59
50 – 99 31 36 41 56 64 58 52 58
10 – 49 105 129 138 166 210 190 236 244
<10 197 215 192 245 243 279 279 317
Source: comScore, BFI RSU analysis
WEEKEND BOX OFFICE
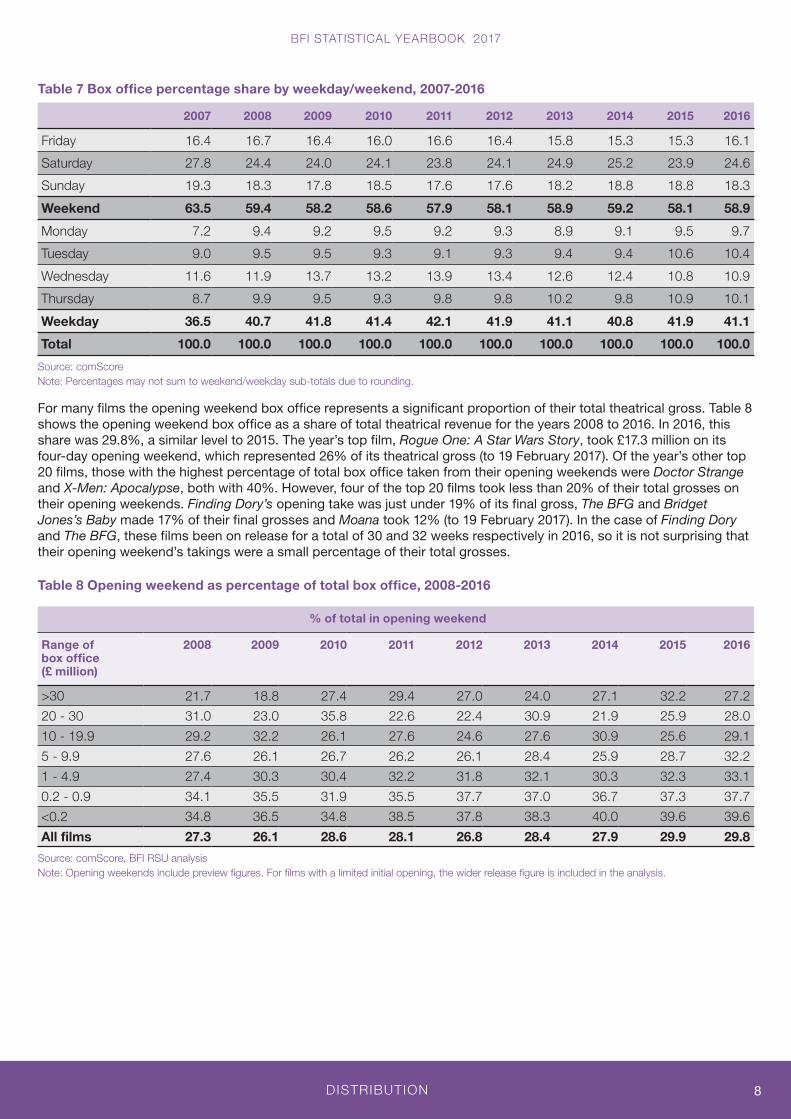
In 2016, 59% of box office revenue was taken at weekends (Friday to Sunday), a slight increase from the 58% seen in 2015 (Table 7). The pattern of box office takings by day has remained similar and is broadly consistent throughout the period with the exception of the middle of the working week, which had been boosted for most of the period by the ‘Orange/EE Wednesdays’ promotion. Since the end of this promotion in February 2015, the box office share has become more evenly distributed across weekdays. (The current ‘Meerkat Movies’ promotion, which offers two for one tickets on Tuesdays and Wednesdays, is more restrictive than the previous promotion, as it is only available to individuals who have purchased products from the sponsoring company.)
0
50
100
150
200
250
300
350
20162015201420132012201120102009
Number of releases
DISTRIBUTION
BFI STATISTICAL YEARBOOK 2017
8
Table 7 Box office percentage share by weekday/weekend, 2007-2016
2007 2008 2009 2010 2011 2012 2013 2014 2015 2016
Friday 16.4 16.7 16.4 16.0 16.6 16.4 15.8 15.3 15.3 16.1
Saturday 27.8 24.4 24.0 24.1 23.8 24.1 24.9 25.2 23.9 24.6
Sunday 19.3 18.3 17.8 18.5 17.6 17.6 18.2 18.8 18.8 18.3
Weekend 63.5 59.4 58.2 58.6 57.9 58.1 58.9 59.2 58.1 58.9
Monday 7.2 9.4 9.2 9.5 9.2 9.3 8.9 9.1 9.5 9.7
Tuesday 9.0 9.5 9.5 9.3 9.1 9.3 9.4 9.4 10.6 10.4
Wednesday 11.6 11.9 13.7 13.2 13.9 13.4 12.6 12.4 10.8 10.9
Thursday 8.7 9.9 9.5 9.3 9.8 9.8 10.2 9.8 10.9 10.1
Weekday 36.5 40.7 41.8 41.4 42.1 41.9 41.1 40.8 41.9 41.1
Total 100.0 100.0 100.0 100.0 100.0 100.0 100.0 100.0 100.0 100.0
Source: comScore Note: Percentages may not sum to weekend/weekday sub-totals due to rounding.
For many films the opening weekend box office represents a significant proportion of their total theatrical gross. Table 8 shows the opening weekend box office as a share of total theatrical revenue for the years 2008 to 2016. In 2016, this share was 29.8%, a similar level to 2015. The year’s top film, Rogue One: A Star Wars Story, took £17.3 million on its four-day opening weekend, which represented 26% of its theatrical gross (to 19 February 2017). Of the year’s other top 20 films, those with the highest percentage of total box office taken from their opening weekends were Doctor Strange and X-Men: Apocalypse, both with 40%. However, four of the top 20 films took less than 20% of their total grosses on their opening weekends. Finding Dory’s opening take was just under 19% of its final gross, The BFG and Bridget Jones’s Baby made 17% of their final grosses and Moana took 12% (to 19 February 2017). In the case of Finding Dory and The BFG, these films been on release for a total of 30 and 32 weeks respectively in 2016, so it is not surprising that their opening weekend’s takings were a small percentage of their total grosses.
Table 8 Opening weekend as percentage of total box office, 2008-2016
% of total in opening weekend
Range of box office (£ million)
2008 2009 2010 2011 2012 2013 2014 2015 2016
>30 21.7 18.8 27.4 29.4 27.0 24.0 27.1 32.2 27.2
20 - 30 31.0 23.0 35.8 22.6 22.4 30.9 21.9 25.9 28.0
10 - 19.9 29.2 32.2 26.1 27.6 24.6 27.6 30.9 25.6 29.1
5 - 9.9 27.6 26.1 26.7 26.2 26.1 28.4 25.9 28.7 32.2
1 - 4.9 27.4 30.3 30.4 32.2 31.8 32.1 30.3 32.3 33.1
0.2 - 0.9 34.1 35.5 31.9 35.5 37.7 37.0 36.7 37.3 37.7
<0.2 34.8 36.5 34.8 38.5 37.8 38.3 40.0 39.6 39.6
All films 27.3 26.1 28.6 28.1 26.8 28.4 27.9 29.9 29.8
Source: comScore, BFI RSU analysis Note: Opening weekends include preview figures. For films with a limited initial opening, the wider release figure is included in the analysis.

DISTRIBUTION
BFI STATISTICAL YEARBOOK 2017
9
RELEASE COSTS
The opening weekend is recognised as being crucial to the success of a film, both in cinemas and on subsequent release platforms. A good opening weekend, for example, may encourage exhibitors to continue to screen a film, and also have a positive impact on the rest of the value chain, which is particularly important for independent films which do not have the backing of the major studios.
Distributors invest heavily in advertising across all media (outdoor posters, print media, television, radio and online) in order to raise a film’s profile with potential audiences. The estimated total advertising spend by distributors in 2016 was £213 million, up from £192 million in 2015 (Table 9). However, there were 821 film releases in the UK and Republic of Ireland in 2016, compared with 759 in 2015, so the average advertising spend per film increased only very slightly, from £0.25 million to £0.26 million.
While the overall spend by distributors in 2016 was higher compared with 2015, the spend on traditional advertising platforms was lower. The spend on press advertising was the lowest of the entire period and was down 30% compared with 2015, while radio advertising spend (down 23% compared with 2015) was the second lowest of the period. The spend on outdoor advertising was also the lowest of the period (down 13% compared with 2015). TV was the only traditional medium to buck the trend; although down 8% on 2015, its 2016 spend was the third highest of the period. The internet was the only platform to see an increase in advertising spend compared with 2015. However, online advertising spend between 2013 and 2016 and in the years before 2013 is not comparable due to changes in the Nielson Media Research methodology in collecting this data. A new method, applied in October 2014, significantly reduced the estimation of online spend from Q2 2013 onwards while a further update to the methodology in 2015/16, which included changing the sampling approach and spend calculation, has led to a substantial increase in terms of the estimated spend. It should be noted, however, that the advertising industry’s own data indicate significant growth in online advertising revenues in the most recent years up to 2016.
Table 9 Estimated advertising spend 2007-2016 (£ million)
Medium 2007 2008 2009 2010 2011 2012 2013 2014 2015 2016
TV 74.1 79.3 74.3 76.0 90.8 89.1 89.2 101.0 102.2 93.3
Outdoor 65.3 56.2 57.0 61.0 69.1 67.2 71.2 64.2 60.5 52.8
Press 27.0 22.6 19.9 19.9 22.0 21.5 20.7 24.2 21.3 14.9
Radio 8.4 9.4 10.7 7.6 6.8 6.8 5.9 4.6 7.4 5.7
Sub-total 174.8 167.5 161.9 163.5 188.7 188.1 187.8 194.0 191.4 166.7
Internet 4.7 4.5 6.4 6.1 8.5 4.0 2.5 1.1 0.7 46.4
Total 179.5 172.0 168.3 170.6 197.2 188.6 189.4 195.1 192.1 213.1
Source: Nielsen Media Research Notes: Figures may not sum to totals due to rounding. The figures for 2013 onwards are not historically comparable as these were calculated on the basis of different methodologies.
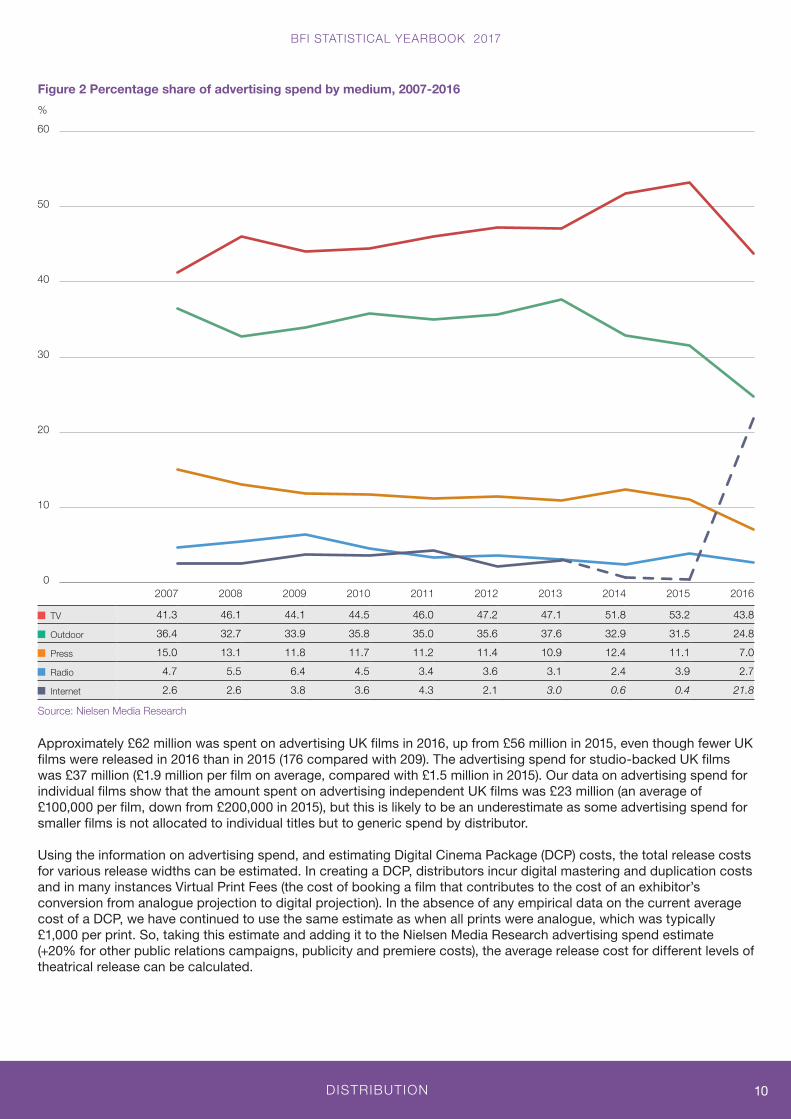
Figure 2 shows the share of advertising spend by medium between 2007 and 2016. Over the period the highest proportion of advertising spend has been allocated to TV and outdoor advertisements. In 2016, the percentage of spend on these advertising formats was 69% of the total spend, a decrease from 82% in 2015. This decrease is partly a reflection of the rise in internet advertising spend, which was 22% in 2016, compared with less than 1% in 2015. (As noted above, this change is primarily due to differences in methodology in collecting online data.) The share of spend on press advertising has been on a downward trend over the period; in 2016, it represented 7% of the total spend whereas, in 2007, it accounted for 15%. Throughout the period, the spend on radio advertising has accounted for between 3% and 6% of the total spend; in 2016 it was 3%.
DISTRIBUTION
BFI STATISTICAL YEARBOOK 2017
10
Figure 2 Percentage share of advertising spend by medium, 2007-2016
TV 41.3 46.1 44.1 44.5 46.0 47.2 47.1 51.8 53.2 43.8
Outdoor 36.4 32.7 33.9 35.8 35.0 35.6 37.6 32.9 31.5 24.8
Press 15.0 13.1 11.8 11.7 11.2 11.4 10.9 12.4 11.1 7.0
Radio 4.7 5.5 6.4 4.5 3.4 3.6 3.1 2.4 3.9 2.7
Internet 2.6 2.6 3.8 3.6 4.3 2.1 3.0 0.6 0.4 21.8
Source: Nielsen Media Research
Approximately £62 million was spent on advertising UK films in 2016, up from £56 million in 2015, even though fewer UK films were released in 2016 than in 2015 (176 compared with 209). The advertising spend for studio-backed UK films was £37 million (£1.9 million per film on average, compared with £1.5 million in 2015). Our data on advertising spend for individual films show that the amount spent on advertising independent UK films was £23 million (an average of £100,000 per film, down from £200,000 in 2015), but this is likely to be an underestimate as some advertising spend for smaller films is not allocated to individual titles but to generic spend by distributor.
Using the information on advertising spend, and estimating Digital Cinema Package (DCP) costs, the total release costs for various release widths can be estimated. In creating a DCP, distributors incur digital mastering and duplication costs and in many instances Virtual Print Fees (the cost of booking a film that contributes to the cost of an exhibitor’s conversion from analogue projection to digital projection). In the absence of any empirical data on the current average cost of a DCP, we have continued to use the same estimate as when all prints were analogue, which was typically £1,000 per print. So, taking this estimate and adding it to the Nielsen Media Research advertising spend estimate (+20% for other public relations campaigns, publicity and premiere costs), the average release cost for different levels of theatrical release can be calculated.
%
0
10
20
30
40
50
60
2016201520142013201220112010200920082007
DISTRIBUTION
BFI STATISTICAL YEARBOOK 2017
11
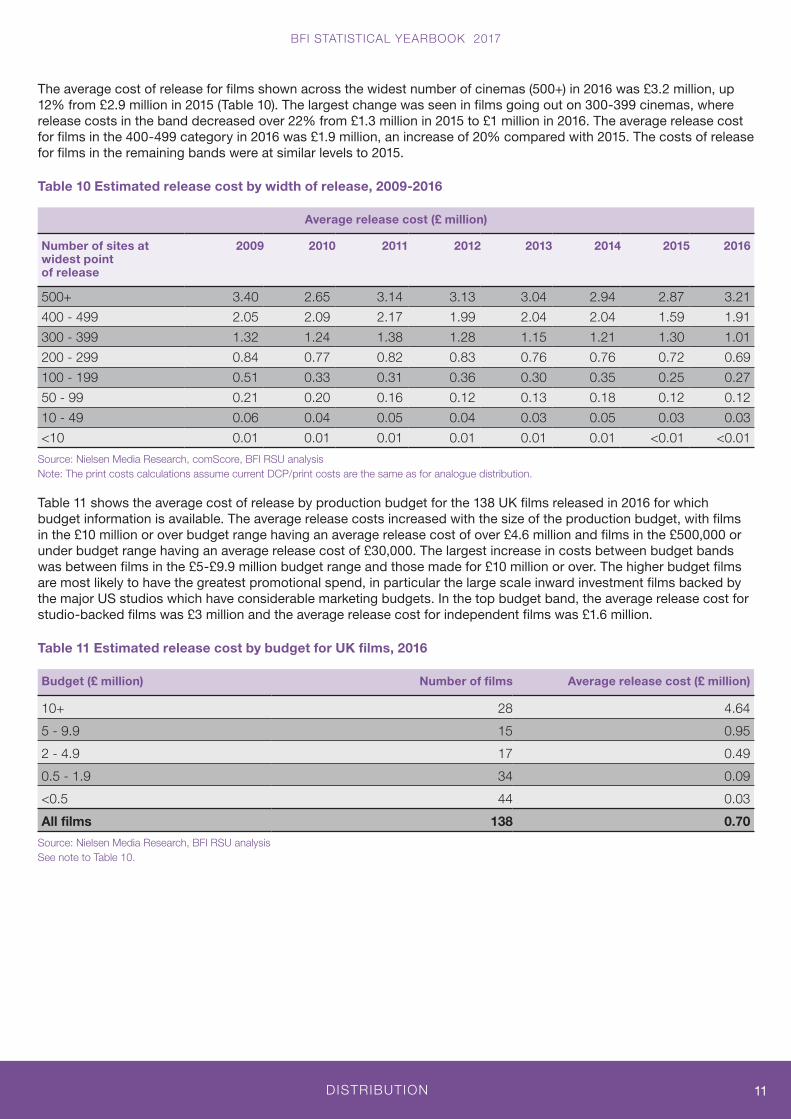
The average cost of release for films shown across the widest number of cinemas (500+) in 2016 was £3.2 million, up 12% from £2.9 million in 2015 (Table 10). The largest change was seen in films going out on 300-399 cinemas, where release costs in the band decreased over 22% from £1.3 million in 2015 to £1 million in 2016. The average release cost for films in the 400-499 category in 2016 was £1.9 million, an increase of 20% compared with 2015. The costs of release for films in the remaining bands were at similar levels to 2015.
Table 10 Estimated release cost by width of release, 2009-2016
Average release cost (£ million)
Number of sites at widest point of release
2009 2010 2011 2012 2013 2014 2015 2016
500+ 3.40 2.65 3.14 3.13 3.04 2.94 2.87 3.21
400 - 499 2.05 2.09 2.17 1.99 2.04 2.04 1.59 1.91
300 - 399 1.32 1.24 1.38 1.28 1.15 1.21 1.30 1.01
200 - 299 0.84 0.77 0.82 0.83 0.76 0.76 0.72 0.69
100 - 199 0.51 0.33 0.31 0.36 0.30 0.35 0.25 0.27
50 - 99 0.21 0.20 0.16 0.12 0.13 0.18 0.12 0.12
10 - 49 0.06 0.04 0.05 0.04 0.03 0.05 0.03 0.03
<10 0.01 0.01 0.01 0.01 0.01 0.01 <0.01 <0.01
Source: Nielsen Media Research, comScore, BFI RSU analysis Note: The print costs calculations assume current DCP/print costs are the same as for analogue distribution.
Table 11 shows the average cost of release by production budget for the 138 UK films released in 2016 for which budget information is available. The average release costs increased with the size of the production budget, with films in the £10 million or over budget range having an average release cost of over £4.6 million and films in the £500,000 or under budget range having an average release cost of £30,000. The largest increase in costs between budget bands was between films in the £5-£9.9 million budget range and those made for £10 million or over. The higher budget films are most likely to have the greatest promotional spend, in particular the large scale inward investment films backed by the major US studios which have considerable marketing budgets. In the top budget band, the average release cost for studio-backed films was £3 million and the average release cost for independent films was £1.6 million.
Table 11 Estimated release cost by budget for UK films, 2016
Budget (£ million) Number of films Average release cost (£ million)
10+ 28 4.64
5 - 9.9 15 0.95
2 - 4.9 17 0.49
0.5 - 1.9 34 0.09
<0.5 44 0.03
All films 138 0.70
Source: Nielsen Media Research, BFI RSU analysis See note to Table 10.
Research & Statistics Unit21 Stephen Street, London W1T 1LN
bfi.org.uk/statistics