Embed Size (px)
Citation preview

IBM® VisualAge® for Java™, Version 3.5
Distributed Debugger for OS/390®
���

Edition notice
This edition applies to Version 3.5 of IBM VisualAge for Java and to all subsequent releases and modifications untilotherwise indicated in new editions.
© Copyright International Business Machines Corporation 1999, 2000. All rights reserved.US Government Users Restricted Rights – Use, duplication or disclosure restricted by GSA ADP Schedule Contractwith IBM Corp.
Note!Before using this information and the product it supports, be sure to read the generalinformation under Notices.
Contents
Chapter 1. Distributed Debugger:Overview . . . . . . . . . . . . . . 1Distributed Debugger: Panes . . . . . . . . . 1Distributed Debugger: Monitors . . . . . . . 2Distributed Debugger and Debug Tool. . . . . . 4Program profiles . . . . . . . . . . . . . 5
Chapter 2. Preparing a program fordebugging. . . . . . . . . . . . . . 7Writing a program for debugging . . . . . . . 7
Recursion and debugging . . . . . . . . . 7UNIX call handling during debugging . . . . . . 7
exec() handling . . . . . . . . . . . . 7fork() handling . . . . . . . . . . . . 7system() handling. . . . . . . . . . . . 8
java.lang.Runtime.getRuntime().exec() handling. . . 8Compiling a program for debugging . . . . . . 8Preparing your OS/390 C/C++ application fordebugging . . . . . . . . . . . . . . . 9Preparing your OS/390 Java application fordebugging . . . . . . . . . . . . . . . 9
Chapter 3. Starting the debugger forOS/390 programs . . . . . . . . . . 11Setting environment variables for the debugger . . 11Debugging a CICS application . . . . . . . . 11Debugging a DB2 program or stored procedure . . 13Debugging a Webserver application . . . . . . 14Debugging an IMS application . . . . . . . . 16Starting the debugger for OS/390 interpreted Javaprograms . . . . . . . . . . . . . . . 17Starting the debugger for OS/390 Java programobjects . . . . . . . . . . . . . . . . 18Starting the Distributed Debugger user interfacedaemon . . . . . . . . . . . . . . . 18Starting applications with Debug Tool in OS/390batch . . . . . . . . . . . . . . . . 19Starting Java program objects with Debug Tool inOS/390 batch. . . . . . . . . . . . . . 20Starting applications with Debug Tool in OS/390UNIX . . . . . . . . . . . . . . . . 22Starting Java program objects with Debug Tool inOS/390 UNIX . . . . . . . . . . . . . 23Attaching to a running Java Virtual Machine . . . 25
When to attach to running JVM . . . . . . 25Registering a Java class or package . . . . . . 26
Chapter 4. Working with breakpoints 27Breakpoints . . . . . . . . . . . . . . 27Optional breakpoint parameters . . . . . . . 27Setting breakpoints . . . . . . . . . . . . 29
Setting a line breakpoint . . . . . . . . . 29Setting a function breakpoint . . . . . . . 30Setting a method breakpoint. . . . . . . . 31
Setting a storage change breakpoint . . . . . 32Setting a load occurrence breakpoint . . . . . 33Setting a deferred breakpoint . . . . . . . 33Setting multiple breakpoints . . . . . . . . 34
Viewing breakpoints . . . . . . . . . . . 35Modifying breakpoint properties . . . . . . . 35Enabling and disabling breakpoints . . . . . . 36Deleting a breakpoint . . . . . . . . . . . 37
Chapter 5. Controlling programexecution . . . . . . . . . . . . . 39Running a program. . . . . . . . . . . . 39Stepping through a program. . . . . . . . . 40
Step commands . . . . . . . . . . . . 40Skipping over sections of a program . . . . . . 42Halting execution of a program. . . . . . . . 42Restarting a program . . . . . . . . . . . 43Selecting debugger recognized exceptions . . . . 44Terminating a debug session without exiting thedebugger . . . . . . . . . . . . . . . 44Terminating a debug session without stopping thedaemon . . . . . . . . . . . . . . . 45
Chapter 6. Inspecting data . . . . . . 47Inspecting variables . . . . . . . . . . . 47
Adding a variable or expression to the Monitorspane. . . . . . . . . . . . . . . . 47Viewing the contents of a variable . . . . . . 47Changing the contents of a variable . . . . . 48
Inspecting registers . . . . . . . . . . . . 48Viewing the contents of a register . . . . . . 48Changing the contents of a register . . . . . 49Adding a new Storage Monitor pane for anexpression or register . . . . . . . . . . 49Adding a register to the Monitors pane . . . . 50
Inspecting storage . . . . . . . . . . . . 51Viewing a location in storage . . . . . . . 51Changing the representation of storage contents 51Changing the contents of a storage location. . . 52
Mapping storage . . . . . . . . . . . . 52Mapping Layouts . . . . . . . . . . . 52Mapping pointers, addresses and registers . . . 54Defining a mapping layout . . . . . . . . 54
Enabling and disabling a monitored variable,expression or register . . . . . . . . . . . 57Enabling hover help for variables . . . . . . . 58Changing the representation of monitor contents . . 58
Appendix A. Distributed Debuggercommands . . . . . . . . . . . . . 61idebug command . . . . . . . . . . . . 61irmtdbgj command . . . . . . . . . . . . 62
Appendix B. Supported expressions . . 65
© Copyright IBM Corp. 1999, 2000 iii

Interpreted Java expressions supported . . . . . 65Java program object expressions supported . . . . 65
Supported data types for Java program objects 65Supported expression operands for Java programobjects . . . . . . . . . . . . . . . 65Supported expression operators for Java programobjects . . . . . . . . . . . . . . . 65C/C++ supported data types . . . . . . . 66C/C++ supported expression operands . . . . 66C/C++ supported expression operators . . . . 67
Appendix C. Environment variables . . 69CLASSPATH environment variable . . . . . . 69DER_DBG_PATH environment variable . . . . . 69
Appendix D. Troubleshooting . . . . . 71Why the Distributed Debugger cannot find sourcefiles on the workstation . . . . . . . . . . 71Order of source file searching . . . . . . . . 71Exception levels . . . . . . . . . . . . . 72
Limits . . . . . . . . . . . . . . . 73
Notices . . . . . . . . . . . . . . 75
Programming interface information . . 79
Trademarks and service marks . . . . 81
iv Distributed Debugger for OS/390
Chapter 1. Distributed Debugger: Overview
The IBM Distributed Debugger is a client/server application that enables you todetect and diagnose errors in your programs. This client/server design allowsyou to debug programs running on OS/390 systems accessible through a networkconnection.
The debugger server, also known as a debug engine, runs on the OS/390 systemwhere the program you want to debug runs. The IBM Debug Tool serves as thedebug engine for most programming languages. For more information on how theDistributed Debugger user interface and Debug Tool work together, see the relatedtopic below.
There is a separate debug engine for debugging interpreted Java programs.The debug engine has a Jar file. The location of this Jar file must be specified in theCLASSPATH environment variable.
The Distributed Debugger client is a graphical user interface where you can issuecommands used by a debug engine to control the execution of your program. Forexample, you can set breakpoints, step through your code and examine thecontents of variables. The Distributed Debugger user interface lets you debugmultiple applications from a single debugger session. Each program you debug isshown on a separate program page with a tab on each page displaying programidentification information such as the name of the program being debugged. Thetype of information displayed depends on the debug engine that you areconnected to.
Each program page is divided into different sections, called panes. Each panedisplays different information about your program. There are panes to displayyour source code, breakpoints, the program’s call stack and various monitors.
For more information on the panes and monitors available in the DistributedDebugger user interface, see the related topics below.
Distributed Debugger: PanesDistributed Debugger: MonitorsDistributed Debugger and Debug Tool
Distributed Debugger: PanesThe following panes are available in the Distributed Debugger user interface:
Stacks paneThe Stacks pane provides a view of the call stack for the current program threadyou are debugging. Each thread in your program appears as a node in a tree list.Expanding a node will display the names of active functions for that thread.
When debugging a multithreaded application, the debugger serializes the eventsreported by the different active threads. For example, if your program runs as twotasks (Task A and Task B) and Task A has an event that needs to be reported (suchas a breakpoint is encountered), the debugger will handle the request and begin
© Copyright IBM Corp. 1999, 2000 1

operating on behalf of Task A. If, during that period, Task B has an event thatneeds to be reported again, the debugger will hold Task B until the event fromTask A is complete (such as you telling the debugger to run or step after thebreakpoint has been reached.) When Task A is complete the debugger releases itshold on Task B and handles the new event from Task B. The Distributed Debuggercan only provide program state information and interact with the thread for whichit is currently handling an event.
Breakpoints paneThe Breakpoints pane contains a view of information about the breakpoints youhave set in the program you are debugging. Use the Breakpoints pane to viewbreakpoints set in your program, delete them, or add new ones.
Source paneThe Source pane provides a view of the source code for the program you aredebugging. To view source code, the source code must be accessible from yourworkstation, either on a local or a network drive or accessible from OS/390.
Modules pane
The Modules pane displays a list of modules loaded while running your program.The items in the list can be expanded to show compile units, files and functions.
This pane appears when you debug Java program objects.
Packages pane
The Packages pane displays a list of the interpreted Java packages loaded whilerunning your program. The items in the list can be expanded to show class files,Java source files, and methods.
This pane appears when you debug interpreted Java programs.
The remaining panes are monitor panes. For more information on monitor panes,see the related topic below.
Distributed Debugger: MonitorsDistributed Debugger: Overview
Distributed Debugger: MonitorsThe Distributed Debugger provides you with monitors to view and modify variousaspects of your program. The following monitors are available in the DistributedDebugger user interface:
Variables and Expressions (Monitors pane)
The Monitors pane shows variables and expressions that you have selected tomonitor. You can enter the variables or expressions in a dialog box or select themfrom the Source pane. Use the Monitors pane to monitor global variables orvariables you want to see at all times during your debugging session. From theMonitors pane, you can also modify the content of variables or change therepresentation of values.
2 Distributed Debugger for OS/390

Tip: Enabling hover help for variables provides a quick way to view the contentsof variables in the Source pane. When you point at a variable, a pop-up appearsdisplaying the contents of that variable. If hover help for variables is disabled andyou want to enable it, see the related topic below.
Local Variables (Locals pane)
The Locals pane allows you to monitor local variables for the current thread. TheLocals pane is updated after each Step or Run command to show what variablesare currently in scope and the contents of those variables. It is also used to modifythe content of variables or to change the representation of values.
Registers (Registers pane)
The Registers pane allows you to view and change the contents of registers in thecurrent thread of your program. The registers are categorized, so you only need toexpand the category of registers that you wish to view.
The Registers pane is not available when debugging interpreted Java programs. Itis available when debugging Java program objects.
Storage (Storage pane and Storage Monitors pane)
The Storage pane and the Storage Monitors pane let you view and change thecontents of storage areas used by your program. You can also change the addressrange and the representation used to display storage.
The initial Storage pane shows the storage areas used by your program at itsstarting address. The starting address is the address at the entry to main() in thefirst load module or, for COBOL, at the load module’s initial entry point.
You can add additional Storage Monitor panes that start at the address of storageallocated to a register, variable, array, class object or expression.
The Storage pane and Storage Monitor panes are not available when debugginginterpreted Java programs. They are available when debugging Java programobjects.
Mapping (Mapping pane)
You can display the contents of a selected storage block according to a user-definedlayout specified in an XML file.
The Mapping pane is not available when debugging interpreted Java programs. Itis available when debugging Java program objects.
Distributed Debugger: OverviewDistributed Debugger: Panes
Enabling hover help for variables
Chapter 1. Distributed Debugger: Overview 3
Distributed Debugger and Debug ToolRestriction: This section applies to debugging Java program objects only. It doesnot apply to debugging interpreted Java programs.
The Distributed Debugger provides the client graphical user interface for thedebug information provided by Debug Tool running on OS/390. The DistributedDebugger client is invoked on the workstation as a daemon and waits for aTCP/IP connection from Debug Tool.
Your OS/390 application may be debugged with Debug Tool in any of theseenvironments:v TSOv Batchv OS/390 UNIX« System Services (formerly known as OpenEdition« MVSÖ)v CICS«v IMSv DB/2
Debug Tool is the OS/390 engine of the Distributed Debugger. The DistributedDebugger client sends requests to Debug Tool, receives the replies, and thendisplays the results in graphical windows. For example, to monitor a variable, theDistributed Debugger client asks Debug Tool for the value; Debug Tool respondswith a value and the Distributed Debugger client displays the value in theMonitors pane.
To invoke Debug Tool on OS/390, you may need to specify the LanguageEnvironment« run-time option, TEST, when starting your application. For example,in an OS/390 UNIX® System Services environment, you can set the_CEE_RUNOPTS environment variable to specify the TEST run-time option. Formore information on the TEST run-time option, see Debug Tool User’s Guide andReference, SC09-2137.
Debug Tool depends on compiler generated symbol table information and debughooks in your code such as:v Function entry hookv Function exit hookv Line hookv Statement hook
At least one of the compile units of your application must be compiled with thecompile-time TEST option. The units compiled with the TEST option are the onlyones which can be debugged.
For more information on Debug Tool, see Debug Tool User’s Guide and Reference,SC09-2137.
Starting the Distributed Debugger user interface daemonStarting applications with Debug Tool in OS/390 batchStarting Java program objects with Debug Tool in OS/390 UNIXStarting Java program objects with Debug Tool in OS/390 batch
4 Distributed Debugger for OS/390

Debugging a DB2® applicationDebugging an IMS applicationDebugging a CICS® application
Remote debug limitations
Program profilesUsing program profiles means that the Distributed Debugger will restore debuggerwindow size, fonts, monitor settings, and breakpoints for your program from thelast time you debugged the program. If you are debugging the program for thefirst time, the debugger windows start up with their default appearance, and nobreakpoints are set.
When you use program profiles, any changes you make to the windows, monitorsettings, and breakpoints are saved. If the debugger has saved a profile containinginformation on window, breakpoint, and monitor settings from a previous debugsession for a program, the profile is used to restore those settings. To delete themyou can use the Application Preferences dialog.
Attention: If you add or delete lines in your source file, recompile it, and thendebug the program again with a saved program profile, line breakpoints may nolonger match the code they were initially set for because line breakpointinformation is saved by line number, not by the content of the line.
Chapter 1. Distributed Debugger: Overview 5

6 Distributed Debugger for OS/390

Chapter 2. Preparing a program for debugging
Writing a program for debuggingYou can make your programs easier to debug by following these simple guidelines:v Do not hand-tune your source code for performance until you have fully
debugged and tested the untuned version. Hand-tuning may make the logic ofyour code harder to understand.
v Where possible, do not put multiple statements on a single line, because someDistributed Debugger features operate on a line basis. For example, you cannotstep over or set line breakpoints on more than one statement on the same line.
v Assign intermediate expression values to temporary variables to make it easierto verify intermediate results by monitoring the temporary variables.
To debug programs, you must specify the compiler options that generate debuginformation. In some cases, you must specify additional options that enable thedebug engine to work properly with your code. For information on these compileroptions and for other information on preparing your application for debugging,see Debug Tool User’s Guide and Reference, SC09-2137the online information for theET/390 feature of VisualAge for Java.
Recursion and debuggingRecursion does not have to involve a routine calling itself directly; for example:FUNC1 calls FUNC2 calls FUNC3 calls FUNC1. After the call to FUNC3, each timeyou step into one of these routines, the entry for that call shows a recursion countone higher than the previous entry for that call on the Stacks pane.
You can use the recursion value in the stack frame properties box to detectunintentionally recursive calls.
Limits to debugging recursive function calls
Only the copy of the variables from the most recent invocation of a function can bemonitored. Variables from previous invocations of the recursive function cannot bemonitored.
UNIX call handling during debugging
exec() handlingWhen a process calls exec(), a new process is loaded and replaces the originalprocess. The debugger will discard the original process and starts to debug thesecond process created by exec().
fork() handlingsystem() handling
fork() handlingWhen a process calls fork(), an exact copy of that process is created. The processthat forked is called the parent, and the new process is called the child. If a process
© Copyright IBM Corp. 1999, 2000 7
being debugged forks, the Distributed Debugger stops both the parent and childprocesses, and opens a dialog box that lets you choose whether to continuedebugging the parent process or switch to the child process.
Whichever choice you make (Parent or Child), the Distributed Debugger ignoresthe process you did not choose and allows it to continue running. Breakpoints setin the process you did not choose are ignored, and the page pertaining to thatprocess is closed. Execution stops at the next source code statement in the programthat contains debugging information.
If the process you did not choose performs an exec(), a new Distributed Debuggerpage will open for the new child process.
exec() handlingsystem() handling
system() handlingWhen a program starts another program using system() under the debugger thedebugger will switch the debug process to the second program and load it intoanother Source pane if it is debuggable. The first program is suspended and isresumed when the second program is completed.
exec() handlingfork() handling
java.lang.Runtime.getRuntime().exec() handlingThe Runtime class allows an application to interface with the environment inwhich the application is running. The Runtime.exec() method can be used toexecute non-Java applications in that environment.
When a program starts another program using Runtime.exec(), a new process isspawned. The debugger will start to debug the new process and load it into theSource pane if it is debuggable. Both the original and the new processes can bedebugged simultaneously by switching between the Source panes.
Compiling a program for debuggingIn order to debug your program at the source code level, you need to compileyour program with certain compiler options that instruct the compiler to generatesymbolic information and debug hooks in the object file. See your compilerreference documentation on how to compile your program with debuginformation. For information on these compiler options and for other informationon preparing your application for debugging, see Debug Tool User’s Guide andReference, SC09-2137the online information for the ET/390 feature of VisualAge forJava.
Writing a program for debugging
8 Distributed Debugger for OS/390

Preparing your OS/390 C/C++ application for debuggingTo be able to debug your application you must:v Compile your application program with the TEST option.v If you intend to specify the Language Environment® runtime TEST option using
the #pragma runopts directive in your source code, use the following syntax:#pragma runopts(“TEST(,,,VADTCPIP&wkst_id%portid:*)”)where:
wkst_idis the symbolic name of the workstation id or the numeric IP address ofthe workstation where Distributed Debugger client is waiting.
%portidis the TCP/IP port number which is optional and defaults to 8000; ifspecified, the value must match the port number that was entered whenDistributed Debugger client user interface daemon was started on theworkstation.
To begin debugging at a specific location within a program, you can use the__ctest()or ctest() function. Place one of these functions at the location in theprogram where you want to begin debugging. If you use this approach to debug aprogram, you need to specify the NOTEST run-time option with the workstation IPaddress. For example, you can specify the option as #pragmarunopts(“NOTEST(,,,VADTCPIP&wkst_id%portid:*)”). The __ctest() function is notsupported in CICS. For more information on the ctest()function, see Debug ToolUser’s Guide and Reference, SC09-2137.
Starting applications with Debug Tool in OS/390 batchDebugging a CICS applicationDebugging a DB2 program or stored procedureDebugging an IMS application
Preparing your OS/390 Java application for debuggingInterpreted Java applications
To be able to debug your interpreted Java application (bytebode), specify the -goption of the javac command when compiling your program. For example,compile helloWorld as follows:
javac -g helloWorld
Java source files are required for debugging. For OS/390 UNIX System Services,the source files can be either on the host or on the workstation. For CICS, thesource files must be on the workstation.
Java program objects
To be able to debug your Java program object (executable or DLL) you must:v Compile your Java source files that you want to debug using the -g option of
the javac command.v Build your Java program objects using the -g option of the hpj command.v You can specifiy the Language Environment runtime TEST option using the
-lerunopts option of the hpj command. For example:
Chapter 2. Preparing a program for debugging 9

hpj -g -lerunopts=“test(,,,VADTCPIP&wkst_id%portid:*)” myJavaprogram
If wkst_id is the numeric IP address, the subparameter must be put in quotes.%portid defaults to 8000, and if defined, must match the value that was specifiedwhen the Distributed Debugger client user interface daemon was started on theworkstation.
Restriction: You cannot bind Language Environment runtime options to JavaDLLs. Java DLLs called when debugging your Java executable can be debuggedif the Java DLLs have been built using the -g option of the hpj command.
Java source files are required for debugging. The source files can be either on thehost or on the workstation.
To begin debugging at a specific location within a program, you can use thecom.ibm.debug.Debug.start() method. Place this method at the location in theprogram where you want to begin debugging. If you use this approach to debug aprogram, you need to specify the NOTEST run-time option with the workstation IPaddress. For example, you can specify the option as-lerunopts=“NOTEST(,,,VADTCPIP&wkst_id%portid:*)”. Thecom.ibm.debug.Debug.start() method function is not supported in CICS. For moreinformation on the com.ibm.debug.Debug.start() method, see the onlineinformation for the ET/390 feature of VisualAge for Java.
Starting Java program objects with Debug Tool in OS/390 UNIXStarting Java program objects with Debug Tool in OS/390 batchDebugging a CICS applicationDebugging a DB2 program or stored procedureDebugging an IMS application
10 Distributed Debugger for OS/390

Chapter 3. Starting the debugger for OS/390 programs
Setting environment variables for the debuggerThe Distributed Debugger user interface running on the workstation uses theDER_DBG_PATH environment variable. For information about this environmentvariable, see the related reference below.
You may want to set this environment variable for the debug engine andDistributed Debugger. You can set this environment variable based on youroperating system. For instructions on setting an environment variable refer to youroperating system manuals.
If you set the workstation DER_DBG_PATH environment variable, you must set itbefore starting the Distributed Debugger user interface daemon. If you set theOS/390 DER_DBG_PATH environment variable, you must set it before invokingthe OS/390 program you wish to debug.
DER_DBG_PATH environment variable
Debugging a CICS applicationRestriction: This section applies to debugging Java program objects only. It doesnot apply to debugging interpreted Java programs.
Preparing the CICS environment
v Refresh the CICS definitions for Debug Tool. You can find these definitions inthe EQACCSD and EQACDCT members of Debug Tool’s SEQASAMP data set.
v Update the JCL that starts CICS:– To include Debug Tool’s SEQAMOD data set and the Language Environment
runtime library (in the DFHRPL concatenation).– To include EQA00DYN from Debug Tool’s SEQAMOD data set in the
STEPLIB concatenation by either:- APF authorizing the SEQAMOD data set and adding the data set to the
STEPLIB concatenation- Copying the EQA00DYN module from the SEQAMOD data set to a library
already in the STEPLIB concatenation.– To ensure that no DD cards exist for CINSPIN, CINSPLS, or CINSPOT.
Setting up, configuring, and starting CICS TCP/IP
For details on TCP/IP implementation and configuration in a CICS subsystem, seeIP CICS Sockets Guide, SC31-8518.
Setting compiler and run-time options
v Applications that you want to debug must be compiled with the TEST optionv To indicate the workstation where the Distributed Debugger client user interface
daemon is running, do one of the following:– Use Debug Tool transaction DTCN to identify the workstation.
© Copyright IBM Corp. 1999, 2000 11

– Include a #pragma runopts directive in your application’s source file. Forexample:#pragma runopts(TEST(,,,VADTCPIP&wkst_id%portid:*))
or#pragma runopts(TEST(,,,“VADTCPIP&9.11.22.33:*”))
If wkst_id is the numeric IP address, the subparameter must be put inquotes. %portid defaults to 8000, and if defined, must match the value thatwas specified when the Distributed Debugger client user interface daemonwas started on the workstation.
– Set the -lerunopts option of the hpj command when you build theJava program object. For example:hpj -g -lerunopts=“test(,,,VADTCPIP&wkst_id%portid:*)” myJavaprogram
If wkst_id is the numeric IP address, the subparameter must be put inquotes. %portid defaults to 8000, and if defined, must match the value thatwas specified when the Distributed Debugger client user interface daemonwas started on the workstation.
Tip: You must compile your Java source code using the javac -g commandbefore using the hpj command.
Note: If you identify the workstation in your source file, you will need torecompile each time you change the workstation location. DTCN allows you todefine the workstation location just prior to invoking the application. For detailson using DTCN to specify debugging requirements, see Debug Tool User’s Guide andReference, SC09-2137. Also note that the __ctest()functioncom.ibm.debug.Debug.start() method is not supported in CICS.
Initiating a CICS transaction
When you debug your program, the actual program statements are shown in theDistributed Debugger as they are executing. To accomplish this, the debugger usesthe data set input to the compiler. This might not be the original source, forexample, if the program has been prepared by the CICS translator. The data setinput to the compiler must be retained in a permanent data set.
To prepare for conducting the remote debug session, start the DistributedDebugger user interface in daemon mode, specifying the port that will be used inthe OS/390 TEST run-time option. The daemon only needs to be started once. Youcan then conduct as many remote debug sessions as needed without having torestart the daemon. When the daemon dialog displays indicating that it is listeningto a specified port where the daemon was started, run your CICS application.When Debug Tool establishes a connection with the debug daemon, the userinterface will be started on the workstation, and debugging may proceed.
Debugging a DB2 program or stored procedureDebugging an IMS applicationStarting applications with Debug Tool in OS/390 batchStarting Java program objects with Debug Tool in OS/390 UNIXStarting Java program objects with Debug Tool in OS/390 batchStarting the Distributed Debugger user interface daemon
12 Distributed Debugger for OS/390

Debugging a DB2 program or stored procedureRestriction: This section applies to debugging Java program objects only. It doesnot apply to debugging interpreted Java programs.
You can debug programs that perform SQL calls to access DB2 tables or call DB2stored procedures. The stored procedures may also be debugged, but they willappear as a process that is separate from the calling program.
Preparing the DB2 environment
Update the JCL that starts DB2:v To include Debug Tool’s SEQAMOD data set and the Language Environment
runtime library. This applies to debugging a DB2 program that accesses tablesand programs that call stored procedures.
v To debug stored procedures, the Debug Tool SEQAMOD data set must also beconcatenated to the STEPLIB of the startup JCL for the stored procedure addressspace. Read RACF® access to the Debug Tool library and the library thatcontains the stored procedure source must be given to DB2SYS, which owns thestored procedure process as it executes in the stored procedure address space.
Setting compiler and run-time options
v DB2 applications and stored procedures that you want to debug must becompiled with the TEST option.
v To indicate the workstation where the Distributed Debugger client user interfacedaemon is running, do one of the following:– In the application program or stored procedure source code (C/C++) , include
a #pragma runopts directive. For example:#pragma runopts(TEST(,,,VADTCPIP&wkst_id:*))
or#pragma runopts(TEST(,,,“VADTCPIP&9.11.22.33:*”))If wkst_id is the numeric IP address, the subparameter must be put in quotes.Since the #pragma runopts directive is imbedded into the source file, you willneed to change the directive and recompile, any time the DistributedDebugger user interface will be run on a different workstation.
– When submitting the DB2 program using the TSO RUN command, set thePARMS parameter as follows:RUN PROG (MYPROG)
PLAN (MYPLAN)LIB (’MY.TEST.LOAD’)PARMS (’TEST(,,,VADTCPIP&wkst_id:*)/’)
If wkst_id is the numeric IP address, the subparameter must be put inquotes. The TEST option must be followed by the slash (/), to show that it isa run-time option and not a program parameter.
– Set the -lerunopts option of the hpj command when you build theJava program object. For example:hpj -g -lerunopts=“test(,,,VADTCPIP&wkst_id%portid:*)” myJavaprogram
Chapter 3. Starting the debugger for OS/390 programs 13

If wkst_id is the numeric IP address, the subparameter must be put inquotes. %portid defaults to 8000, and if defined, must match the value thatwas specified when the Distributed Debugger client user interface daemonwas started on the workstation.
– For debugging the stored procedure itself, you may set the RUNOPTS columnin the row for your stored procedure, in the system tableSYSIBM.SYSPROCEDURES, to the following value:TEST(,,,VADTCPIP&wkst_id:*)
If wkst_id is the numeric IP address, the subparameter must be put inquotes. You must obtain an adequate DB2 privilege level to update this table.For more details on this table and stored procedures, see DB2 for OS/390Application Programming and SQL Guide, SC26-8958.
For the full syntax of the TEST run-time option for debugging, see DebugTool User’s Guide and Reference, SC09-2137.
Debugging a DB2 application program
When you debug your program, the actual program statements are shown in theDistributed Debugger as they are executing. To accomplish this, the debugger usesthe data set input to the compiler. This might not be the original source, forexample, if the program has been prepared by the DB2 preprocessor. The data setinput to the compiler must be retained in a permanent data set.
To prepare for conducting the remote debug session, start the DistributedDebugger user interface in daemon mode, specifying the port that will be used inthe OS/390 TEST run-time option. The daemon only needs to be started once. Youcan then conduct as many remote debug sessions as needed without having torestart the daemon. When the daemon dialog displays indicating that it is listeningto a specified port where the daemon was started, run your DB2 application.
When Debug Tool establishes a connection with the Distributed Debugger daemon,the user interface will be started on the workstation, and debugging may proceed.If the DB2 program calls a stored procedure, which has been set up for debuggingas outlined above, step into the DB2 function call that invokes the storedprocedure. A second debug program page appears, allowing you to debug thestored procedure itself. The debug session of the calling program will besuspended until the session for the stored procedure is complete.
Debugging a CICS applicationDebugging an IMS applicationStarting applications with Debug Tool in OS/390 UNIXStarting applications with Debug Tool in OS/390 batchStarting Java program objects with Debug Tool in OS/390 UNIXStarting Java program objects with Debug Tool in OS/390 batchStarting the Distributed Debugger user interface daemon
Debugging a Webserver applicationYou can debug Webserver applications as requested through a client Web browser.
Preparing the Webserver environment
14 Distributed Debugger for OS/390

Update the JCL or shell script which starts the Webserver to include Debug Tool’sSEQAMOD data set in its STEPLIB.
Setting compiler options
Applications that you want to debug must be compiled with the appropriate TESTcompiler option to include symbolic information for source-level debugging. Yourapplication must be compiled as a dynamic link library (DLL).
Setting Webserver environment options
To allow Debug Tool to establish a connection with the Distributed Debugger userinterface daemon running on a workstation, the network location of theworkstation must be specified. This location is specified in the Webserverconfiguration file, for example, httpd.conf as follows:debugtooladdr [workstation location] [debug port]
Note: The location of your workstation can be specified as a name for DNSresolution or as an IP address. The debug port number by default is 8000.
Debugging is done through the GWAPI debug Service directive. Each applicationyou wish to debug must be specified as a dbgService directive. This directive hasthe same syntax as the Service directive. The dbgService directive specifies thedebuggable entry point that the server calls during the service step. This in turnservices the client’s debug request. The syntax of this directive is as follows:dbgService [web path]* [real path]:[exported entry point]*
[web path]defines the virtual location of the application on the server as seen by theWeb browser.
[real path]is the actual location of the application on your web server.
[exported entry point]defines the entry function of your debuggable application.
Debugging the Webserver application
When you debug your program, the actual program statements are shown in theDistributed Debugger as they are executing. To accomplish this, the data set inputto the compiler is used. This might not be the original source, for example, if theprogram has been prepared by the CICS translator. The data set input to thecompiler must be retained in a permanent data set.
To start debugging a Webserver application program, start the DistributedDebugger user interface in daemon mode on the workstation, specifying the portto be used in the OS/390 TEST run-time option. The daemon only needs to bestarted once. You can then conduct as many remote debug sessions as neededwithout having to restart the daemon. When the daemon dialog displays indicatingthat it is listening to a specified port where the daemon was started, run your Webapplication. When Debug Tool establishes a connection with the daemon, the userinterface will be started on the workstation, and debugging may proceed.
Debugging a CICS applicationDebugging a DB2 program or stored procedure
Chapter 3. Starting the debugger for OS/390 programs 15

Debugging an IMS applicationStarting applications with Debug Tool in OS/390 batchStarting applications with Debug Tool in OS/390 UNIXStarting the Distributed Debugger user interface daemon
Debugging an IMS applicationRestriction: This section applies to debugging Java program objects only. It doesnot apply to debugging interpreted Java programs.
You can debug IMS DB (IMS database) programs submitted under OS/390 batch,IMS programs running under the control of IMS BTS (Batch Terminal Simulator),or IMS TM (IMS Transaction Manager) transactions that are not running under thecontrol of IMS BTS.
Preparing the IMS environment
To debug IMS DB and TM applications:1. With BTS, run in TSO in the foreground (IMS TM and DB)2. With BTS, run BTS as a batch job (IMS TM and DB)3. Without BTS, run as an IMS batch job (IMS DB only)
For BTS, you need to include the Debug Tool SEQAMOD data set in the STEPLIBor TASKLIB data set concatenations for BTS. For IMS batch, you need to putDebug Tool SEQAMOD in the STEPLIB concatenation, for example, in the STEPLIBconcatenation for DLIBATCH.
Setting compiler and run-time options
v Applications that you want to debug must be compiled with the TEST compileroption .
v To indicate the workstation where the Distributed Debugger client user interfacedaemon is running, do one of the following:– Include a #pragma runopts directive. For example:
pragma runopts(TEST(,,,VADTCPIP&wkst_id:*))
or#pragma runopts(TEST(,,,“VADTCPIP&9.11.22.33:*”))
If the wkst_id is numeric, the IP address of the subparameter must be put inquotes. Since the #pragma runopts directive is imbedded into the source file,you will need to change the directive and recompile, any time the DistributedDebugger user interface will be run on a different workstation. When runningBTS or an IMS batch program, you cannot code the TEST run-time option inthe JCL as you would when debugging an OS/390 batch program. For thefull syntax of the TEST run-time option for debugging, see Debug Tool User’sGuide and Reference, SC09-2137.
– Include a run-time options module when linking the program to bedebugged. The run-time options, including the TEST option, must be codedand assembled in a user-defined run-time option module. For example:CEEUOPT CSECTCEEUOPT AMODE ANYCEEUOPT RMODE ANYCEEXOPT TEST=(,,,“VADTCPIP&&9.11.22.33:*”)END
16 Distributed Debugger for OS/390

For instructions on how to create the CEEUOPT run-time options moduleusing the CEEXOPT macro, see Debug Tool User’s Guide and Reference,SC09-2137.
If you use the run-time options module method and you change theworkstation where the daemon is running, you do not have to recompile theprogram (as with #pragma runopts). Rather, you need to assemble a newrun-time options module and relink your program with the new run-timeoptions module.
v To indicate the workstation where the Distributed Debugger client user interfacedaemon is running, do the following:
Set the -lerunopts option of the hpj command when you build the Javaprogram object. For example:hpj -g -lerunopts=“test(,,,VADTCPIP&wkst_id%portid:*)” myJavaprogram
If wkst_id is the numeric IP address, the subparameter must be put in quotes.%portid defaults to 8000, and if defined, must match the value that was specifiedwhen the Distributed Debugger client user interface daemon was started on theworkstation.
Debugging an IMS application program
When you debug your program, the actual program statements are shown in theDistributed Debugger as they are executing. To accomplish this, the debugger usesthe data set input to the compiler. This might not be the original source. The dataset input to the compiler must be retained in a permanent data set.
To prepare for conducting the remote debug session, start the DistributedDebugger user interface in daemon mode, specifying the port that will be used inthe OS/390 TEST run-time option. The daemon only needs to be started once. Youcan then conduct as many remote debug sessions as needed without having torestart the daemon. When the daemon dialog displays indicating that it is listeningto a specified port where the daemon was started, run BTS, your IMS DB programor your IMS TM transaction. When Debug Tool establishes a connection with thedaemon, the user interface will be started on the workstation, and debugging mayproceed.
Debugging a CICS applicationDebugging a DB2 program or stored procedureStarting Java program objects with Debug Tool in OS/390 UNIXStarting Java program objects with Debug Tool in OS/390 batchStarting the Distributed Debugger user interface daemon
Starting the debugger for OS/390 interpreted Java programsTo start debugging an OS/390 interpreted Java program from the command line:1. On the host, set the CLASSPATH environment variable to point at all classes
and packages you will need to debug your program. You will only be able todebug classes and packages that have been compiled using the javac -gcommand.
2. On the local system, start the debugger user interface daemon with the idebugcommand with the user interface daemon parameters at a command lineprompt. For information on the idebug command parameters, see the relatedtopic below.
Chapter 3. Starting the debugger for OS/390 programs 17

3. On the host, start the debug engine daemon with the irmtdbgj command at acommand line prompt. If you issue this command without any parameters, youwill be prompted for required information in the Load Program dialog on thelocal system. For information on the irmtdbgj command parameters, see therelated topic below.
Warning: When debugging your interpreted Java program remotely,communication between the debugger and the program being debugged may beterminated prematurely by the JVM. If this happens, you will need to reload yourprogram. To reload your program, select File > Load Program and enter therequired information in to the Load Program dialog.
Starting the Distributed Debugger user interface daemon
idebug commandirmtdbgj command
Starting the debugger for OS/390 Java program objectsTo debug your Java program objects, follow the steps in the related topics below.
Debugging a CICS applicationDebugging a DB2 program or stored procedureDebugging an IMS applicationStarting Java program objects with Debug Tool in OS/390 batchStarting Java program objects with Debug Tool in OS/390 UNIX
Starting the Distributed Debugger user interface daemonTo debug an application running on OS/390, you must start the DistributedDebugger user interface daemon first. The daemon only needs to be started once.You can then conduct as many remote debug sessions as needed without having torestart the daemon. The Distributed Debugger user interface will appear only aftera remote debug session has connected to it from OS/390.
The application you want to debug runs on the host and causes LanguageEnvironment to load Debug Tool. Debug Tool connects to the DistributedDebugger user interface daemon running on your workstation and a program panewill display. Although the TCP/IP port number is optional and defaults to 8000, ifspecified, the value on the TEST option must match the port number that wasentered when the Distributed Debugger client user interface daemon was startedon the workstation.
You can start the Distributed Debugger daemon in any of the following ways:v By double-clicking on its icon from a program folder. If you start the Distributed
Debugger from an icon you must make sure the properties for the icon includethe -qdaemon and -quiport options.
v On a Windows® system you can select the: Start > Programs > IBM VisualAgeCOBOL >Tools - Remote Access > Remote Debugger
v By selecting Tools >ET390 > Debug Executable or Tools > ET390 > DebugMain from the VisualAge for Java IDE main menu bar.
18 Distributed Debugger for OS/390

v By entering the following command on a command line:idebug -qdaemon -quiport=<port>
where <port> is the port number where you want the Distributed Debuggeruser interface daemon to listen for Debug Tool or the interpreted Java debugengine. This port number must match the port number in the TEST run-timeoption or the -quiport option of the irmtdbgj command. The default portparameter of the TEST run-time option is 8000.
Distributed Debugger and Debug Tool
Starting applications with Debug Tool in OS/390 batchStarting Java program objects with Debug Tool in OS/390 UNIXStarting Java program objects with Debug Tool in OS/390 batchStarting the debugger for OS/390 interpreted Java programs
idebug command
Starting applications with Debug Tool in OS/390 batchYou must set your STEPLIB to point to Debug Tool SEQAMOD data set, theLanguage Environment runtime library, and the library which contains theapplication you intend to debug. You also need to specify the runtime TESToption. If you did not code #pragma runopts in your program, you need to specifythe runtime TEST option through the PARM parameter on the EXEC JCLstatement. One way of doing this is to create a JCL as shown below.
In the sample JCL below, the following names have been used:v MYPROG is the executable file for the program to be debugged.v USERID.PROJ1.LOAD is the load library where the executable file resides.v wkst_id is the numeric IP address of your workstation or the TCP/IP name
of your workstation.v %portid is the TCP/IP port number which is optional and defaults to 8000;
if specified, the value must match the port number that was entered whenDistributed Debugger client user interface daemon was started on theworkstation.
The example JCL below illustrates how you can invoke your host application(MYPROG) so that Debug Tool will connect with your workstation (wkst_id) for adebug session.//RUN EXEC PGM=MYPROG,// PARM='TEST(,,,VADTCPIP&wkst_id%portid:*)/'//STEPLIB DD DISP=SHR,DSN=USERID.PROJ1.LOAD /*Application executable library */// DD DISP=SHR,DSN=EQAW.V1R2M0.SEQAMOD /*Debug Tool library*/// DD DISP=SHR,DSN=SYSID.CEE.SCEERUN /*LE runtime library */// DD DISP=SHR,DSN=SYSID.CBC.SCLBDLL /*LE runtime class library *///SYSTCPD DD DISP=SHR,DSN=TCPIP.PROFILE(TCPDATA) /*TCP/IP data file */
Note: If your OS/390 batch environment is not using the default TCP/IP data setnamed TCPIP.TCPIP.DATA, you need to specify the name of your environment’sTCP/IP data set on the SYSTCPD DD statement. If your OS/390 batchenvironment is using the default data set name, you can omit the SYSTCPD DDstatement.
Chapter 3. Starting the debugger for OS/390 programs 19

You can also use the workstation IP address instead of your workstation’s TCP/IPname, for example:// PARM='TEST(,,,VADTCPIP&9.22.34.46:*)/' /* C/C++ program parm syntax */
In this statement, %portid is not specified and the default %portid of 8000 is usedby Debug Tool.
Distributed Debugger and Debug Tool
Starting Java program objects with Debug Tool in OS/390 batchJava program objects can be executed under OS/390 batch in two ways:v MVS™ batch (page 20)v Batch UNIX System Services (page 21)
Starting Java program objects with Debug Tool in OS/390 MVS batch
You must set your STEPLIB to point to Debug Tool SEQAMOD dataset, theLanguage Environment runtime library, and the Java runtime library, and the PDSEwhich contains the application you intend to debug. You also need to specify theruntime TEST option. If you did not specify the -lerunopts option of the hpjcommand when building your Java program object, you need to specify theruntime TEST option through the PARM parameter on the EXEC JCL statement.
In the sample JCL below, the following names have been used:v MYPROG is the executable file for the program to be debugged.v USERID.PROJ1.LOAD is the load library where the executable file resides.v wkst_id is the numeric IP address of your workstation or the TCP/IP name of
your workstation.v %portid is the TCP/IP port number which is optional and defaults to 8000; if
specified, the value must match the port number that was entered when theDistributed Debugger client user interface daemon was started on theworkstation.
The example JCL below illustrates how you can invoke your host application(MYPROG) so that Debug Tool will connect with your workstation (wkst_id) for adebug session.//RUN EXEC PGM=MYPROG,// PARM='ENVVAR(“_CEE_ENVFILE=DD:MYVARS”) TEST(,,,VADTCPIP&wkst_id%portid:*) POSIX(ON)/'//STEPLIB DD DISP=SHR,DSN=USERID.PROJ1.LOAD /* Application executable library */// DD DISP=SHR,DSN=EQAW.V1R2M0.SEQAMOD /* Debug Tool library */// DD DISP=SHR,DSN=SYSID.CEE.SCEERUN /* LE runtime library */// DD DISP=SHR,DSN=HPJAVA.JAVXRYM0.SHPJMOD /* Java library */// DD DISP=SHR,DSN=HPJAVA.JAVXRYM0.SHPOMOD /* Java library *///SYSTCPD DD DISP=SHR,DSN=TCPIP.PROFILE(TCPDATA) /* TCP/IP data file *///MYVARS DD *CLASSPATH=/u/usr/classes.zipJAVA_HOME=/u/java/jdk1.1.6/J1.1/*
Note: If your OS/390 batch environment is not using the default TCP/IP data setnamed TCPIP.TCPIP.DATA, you need to specify the name of your environment’sTCP/IP data set on the SYSTCPD DD statement. If your OS/390 batchenvironment is using the default data set name, you can omit the SYSTCPD DDstatement.
20 Distributed Debugger for OS/390

Starting Java program objects with Debug Tool in OS/390 UNIX SystemServices batch
Batch UNIX System Services is supported through the use of an MVS utility calledBPXBATCH. BPXBATCH allows you to run shell commands, shell scripts, andexecutable files in the hierarchical file system (HFS) through the MVS batchenvironment.
To start Java program objects with Debug Tool in OS/390 batch accessing OS/390UNIX System Services:1. Create a shell script to set STEPLIB, set _CEE_RUNOPTS, and execute your
Java program object.2. Submit your shell script using BPXBATCH.
Create a shell script
You must create a shell script to set your STEPLIB to point to Debug ToolSEQAMOD data set, the Language Environment runtime library, and the Javaruntime libraries. If you did not specify the -lerunopts option of the hpj commandwhen building your Java program object, your shell script must set_CEE_RUNOPTS to specify the runtime TEST option. You must set POSIX(ON) in_CEE_RUNOPTS. Finally, your shell script must start your Java program object.
In the sample shell script below, the following names have been used:v
– MYPROG is the executable file for the program to be debugged.– wkst_id is the numeric IP address of your workstation or the TCP/IP name of
your workstation.– %portid is the TCP/IP port number which is optional and defaults to 8000; if
specified, the value must match the port number that was entered when theDistributed Debugger client user interface daemon was started on theworkstation.
#test1.sh - shell script to run from BPXBATCHcd /home/user1export PATH=/bin:/home/user1export CLASSPATH=/u/usr/classes.zipexport JAVA_HOME=/u/java/jdk1.1.6/J1.1export _CEE_RUNOPTS=“POSIX(ON) TEST(,,,VADTCPIP&wkst_id%portid:*)”export STEPLIB=HPJAVA.VXRYM0.SHPJMOD:HPJAVA.VXRYM0.SHPOMOD:\EQAW.V1R2M0.SEQAMOD:SYSID.CEE.SCEERUNmyprog
Note: Depending on your installation, some or all of the datasets in this examplemay be in the LPA. You only need to export datasets not in the LPA.
Submit shell script using BPXBATCH
Your must submit your shell script as a batch job using BPXBATCH. BPXBATCH isa standard MVS utility for accessing UNIX System Services through OS/390 batch.For more information on using BPXBATCH, see OS/390 UNIX System ServicesUser’s Guide, SC28-1891 and OS/390 UNIX System Services Command Reference,SC28-1892.
Chapter 3. Starting the debugger for OS/390 programs 21

In the JCL below, the following names have been used:v
– test1.sh is the shell script to be run.– test1.out is the file that collects any output.– test1.err is the file that collects any error messages.
The sample JCL below illustrates how you can use BPXBATCH so that Debug Toolwill connect with your workstation for a debug session.//RUN EXEC PGM=BPXBATCH//STDIN DD PATH='/home/user1/test1.sh',// PATHOPTS=(ORDONLY)//STDOUT DD PATH='/home/user1/test1.out',// PATHOPTS=(OWRONLY,OCREAT),PATHMODE=SIRWXU//STDERR DD PATH='/home/user1/test1.err',// PATHOPTS=(OWRONLY,OCREAT),PATHMODE=SIRWXU//SYSTCPD DD DISP=SHR,DSN=TCPIP.PROFILE(TCPDATA) /*TCP/IP data file*/
Note: If your OS/390 batch environment is not using the default TCP/IP data setnamed TCPIP.TCPIP.DATA, you need to specify the name of your environment’sTCP/IP data set on the SYSTCPD DD statement. If your OS/390 batchenvironment is using the default data set name, you can omit the SYSTCPD DDstatement
Attention: Do not use DD STDENV to specify environment variables when usingBPXBATCH to debug a program. Runtime options set by _CEE_RUNOPTS in thisway will not be established in time for the Language Environment to know toinvoke Debug Tool.
Distributed Debugger and Debug Tool
Starting applications with Debug Tool in OS/390 UNIXYou must set your STEPLIB to point to Debug Tool SEQAMOD data set, theLanguage Environment runtime library, and the library which contains theapplication you intend to debug, if you intend to run the application from PDS.You also need to specify the runtime TEST option. If you did not code #pragmarunopts in your program, you need to specify the runtime TEST option through thesystem variable _CEE_RUNOPTS. One way of doing this is to create a shell script,for example, dbg in OS/390 UNIX System Services with the following statements:#dbg - shell script to debug programexport STEPLIB=USERID.PROJ1.LOAD:\EQAW.V1R2M0.SEQAMOD:\SYSID.CEE.SCEERUN:\SYSID.CBC.SCLBDLLexport _CEE_RUNOPTS=“TEST(,,,VADTCPIP&wkst_id%portid:*)”;“$*&
where:
wkst_idis the numeric IP address of your workstation or the TCP/IP name of yourworkstation.
%portidis the TCP/IP port number which is optional and defaults to 8000; if
22 Distributed Debugger for OS/390

specified, the value must match the port number value that was enteredwhen the Distributed Debugger user interface daemon was started on theworkstation.
To set up your environment and debug myprog, use the shell script dbg and executeas follows:>dbg myprog
The application being debugged (myprog) runs on the host and causes LanguageEnvironment to load Debug Tool. Debug Tool connects to the DistributedDebugger user interface daemon running on your workstation and a program panewill display.
If your program is an OS/390 PDS or PDSE member, you need to:v Create an OS/390 UNIX System Services file which has the same name as the
OS/390 load module (PDS/PDSE member), for example, touch myprog10.v Make the OS/390 UNIX file executable by setting the sticky bit on (for example,
chmod 1700 myprog10.v Concatenate your load library containing the program by exporting the STEPLIB
environment variable. See the dbg shell script example provided above.v Set up the environment and debug the program by using the dbg shell script.
For example, dbg myprog10.
For example, if the program you want to debug isUSERID.PROJ1.LOAD(MYPROG10), use the following commands:>touch /u/userid/myprog10>chmod 1700 /u/userid/myprog10>dbg myprog10
You can export STEPLIB and _CEE_RUNOPTS with the values shown in the abovedbg shell script either by issuing the export command in the current shell or bysetting these environment variables in your .profile file. However, doing so causesthe variable values to be used for all commands and applications run in thecurrent shell. For example, with the _CEE_RUNOPTS TEST option specified, if youissue an ls command, the system attempts to debug the ls command itself. Toprevent this situation, use a shell script such as dbg described above. For moreinformation on shell scripts, see OS/390 UNIX System Services User’s Guide,SC28-1891.
Distributed Debugger and Debug Tool
Starting Java program objects with Debug Tool in OS/390 UNIXTo start Java program objects with Debug Tool in OS/390 UNIX, you must create ashell script to set your STEPLIB to point to Debug Tool SEQAMOD data set, theLanguage Environment runtime library, the Java runtime libraries, and the librarywhich contain the application you intend to debug. If you did not specify the-lerunopts option of the hpj command when building your Java program object,your shell script must set _CEE_RUNOPTS to specify the runtime TEST option.Finally, your shell script must start your Java program object.
In the sample shell script below, the following names have been used:
Chapter 3. Starting the debugger for OS/390 programs 23

v– USERID.PROJ1.LOAD is the library containing the program to debug.– wkst_id is the numeric IP address of your workstation or the TCP/IP name of
your workstation.– %portid is the TCP/IP port number which is optional and defaults to 8000; if
specified, the value must match the port number that was entered whenDistributed Debugger client user interface daemon was started on theworkstation.
#dbg - shell script to debug programexport STEPLIB=USERID.PROJ1.LOAD:\HPJAVA.VXRYM0.SHPJMOD:HPJAVA.VXRYM0.SHPOMOD:\EQAW.V1R2M0.SEQAMOD:SYSID.CEE.SCEERUNexport _CEE_RUNOPTS=“POSIX(ON) TEST(,,,VADTCPIP&wkst_id%portid:*)”“$*&
Note: Depending on your installation, some or all of the datasets in this examplemay be in the LPA. You only need to export datasets not in the LPA.
To set up your environment and debug myprog, use the shell script dbg and executeas follows:>dbg myprog
The application being debugged (myprog) runs on the host and causes LanguageEnvironment to load Debug Tool. Debug Tool connects to the DistributedDebugger user interface daemon running on your workstation and a program panewill display.
If your program is an OS/390 PDSE member, you need to:v Create an OS/390 UNIX System Services file which has the same name as the
OS/390 load module (PDSE member), for example, touch myprog10.v Make the OS/390 UNIX file executable by setting the sticky bit on (for example,
chmod 1700 myprog10.v Concatenate your load library containing the program by exporting the STEPLIB
environment variable. See the dbg shell script example provided above.v Set up the environment and debug the program by using the dbg shell script.
For example, dbg myprog10.
For example, if the program you want to debug isUSERID.PROJ1.LOAD(MYPROG10), use the following commands:>touch /u/userid/myprog10>chmod 1700 /u/userid/myprog10>dbg myprog10
You can export STEPLIB and _CEE_RUNOPTS with the values shown in the abovedbg shell script either by issuing the export command in the current shell or bysetting these environment variables in your .profile file. However, doing so causesthe variable values to be used for all commands and applications run in thecurrent shell. For example, with the _CEE_RUNOPTS TEST option specified, if youissue an ls command, the system attempts to debug the ls command itself. Toprevent this situation, use a shell script such as dbg described above. For moreinformation on shell scripts, see OS/390 UNIX System Services User’s Guide,SC28-1891.
24 Distributed Debugger for OS/390

Distributed Debugger and Debug Tool
Attaching to a running Java Virtual MachineImportant: You can only attach to a Java Virtual Machine if you are debugging aninterpreted Java program. You cannot attach to a running Java program object.
You can attach to an already running Java Virtual Machine (JVM) if you run yourJava application with the java_g -debug command. When you start yourapplication with the java_g -debug command, an agent password is displayed.Take note of this password because it will be needed to attach to the running JVM.
Once your application is running and you have the agent password, you canconnect to the JVM from the debugger user interface or from the command line.
To attach to a running JVM from the debugger user interface:1. Select Attach JVM from the File menu. The Attach to Java Virtual Machine
dialog appears.2. Select the type of connection for the attach from the dialog.3. Enter the required parameters for the type of connection.4. Click Attach to attach to the JVM and close the dialog.
To attach to a running JVM from the command line:1. Start the debugger interface daemon in attach mode. Use a process_id of 0 for
the -a parameter when attaching to a JVM. For example:idebug -a0 -qlang=java -qdaemon -quiport=8001
2. Start the debug engine daemon for the host JVM using the irmtdbgj commandwith the JVM attach parameters. If you are debugging remotely, remember touse the engine daemon parameters as well. For example:irmtdbgj -qhost=workstation_id -quiport=8001 -host=hostname-password=agent_password
Where:v workstation_id is the TCP/IP name or TCP/IP address of the workstation
running the debugger interface daemon.v hostname is the TCP/IP name or TCP/IP address of the host running the
JVM. If the host running the JVM and the host running the debug engine arethe same, use localhost as the hostname.
v agent_password is the password printed when you start your Java programusing the java_g -debug command.
When to attach
idebug commandirmtdbgj command
When to attach to running JVMRestriction: This section applies to debugging interpreted Java programs only. Itdoes not apply to debugging Java program objects.
Chapter 3. Starting the debugger for OS/390 programs 25

You can attach the debugger to an already running Java Virtual Machine (JVM)where an error or failure has occurred.
There are two main reasons for attaching the debugger:v You anticipate a problem at a particular point in your program, and you do not
want to step through the program or set breakpoints. In this situation, you canrun your program, and at a program pause shortly before the anticipated failure(for example, while the program is waiting for keyboard input), you attach thedebugger. You can then provide the input, and debug from that point on.
v You are developing or maintaining a program that hangs sporadically, and youwant to find out why it is hanging. In this situation, you can attach thedebugger, and look for infinite loops or other problems that might be causingyour program to hang.
Attaching to a running JVM
Registering a Java class or package
Restriction: This section applies to debugging interpreted Java programs only. Itdoes not apply to debugging Java program objects.
You can only debug Java classes that have been registered with the debugger orclasses that are part of packages that have been registered with the debugger.Registered classes and packages are those that appear in the Packages pane.
To register a class or package with the debugger:1. Select Source > Open New Source.2. Check All packages.3. Enter the fully-qualified class name for the class you want to register in the
Class field of the Open New Source dialog box.4. Click OK to load the class and its associated package and close the dialog box.
If you want to register more than one class with the debugger, click Open toregister the class you just entered. Then register your next class. When you haveregistered all your classes, click OK.
If the class you entered is part of a package, the entire package is registered withthe debugger as well as the class you entered.
26 Distributed Debugger for OS/390

Chapter 4. Working with breakpoints
BreakpointsBreakpoints are temporary markers you place in your executable program to tell theDistributed Debugger to stop your program whenever execution reaches that point.For example, if a particular statement in your program is causing problems, youcould set a breakpoint on the line containing the statement, then run yourprogram. Execution stops at the breakpoint before the statement is executed. Withthe execution of your program stopped, you can check the contents of variables,registers, storage, and the stack. You can then step over (execute) the statement tosee how the problem arises or you can choose to skip the execution of thestatement in question.
The Distributed Debugger supports the following types of breakpoints:v Line breakpoints are triggered before the code at a particular line in a program
is executed. You can set conditions on line breakpoints. When you run theprogram, execution stops at the breakpoint if the specified condition is true.
v Function breakpoints are triggered when a particular function is entered.Function breakpoints are only supported when debugging Java program objects.
v Method breakpoints are triggered when a particular method is entered. Methodbreakpoints are only supported when debugging interpreted Java programs.
v Storage change breakpoints are triggered when storage at a specified address ischanged. Storage change breakpoints are only supported when debugging Javaprogram objects.
v Load occurrence breakpoints are triggered when a specified DLL or dynamicallyloaded module is loaded. Load occurrence breakpoints are only supported whendebugging Java program objects.
Setting a line breakpointSetting a function breakpointSetting a method breakpointSetting a storage change breakpointSetting a load occurrence breakpoint
Optional breakpoint parameters
Optional breakpoint parametersOptional breakpoint parameters are used to control the behavior of breakpoints.You can set the following parameters when you set a breakpoint:
Optional breakpointparameter
Description Type of breakpointsupported
Threads This selection list lets you choose what threads to set thebreakpoint in. To select a thread ID from the list,highlight the thread where you want to set thebreakpoint. This list is available only on platforms thatsupport multithreaded programs.
This parameter issupported by all breakpointtypes.
© Copyright IBM Corp. 1999, 2000 27
Optional breakpointparameter
Description Type of breakpointsupported
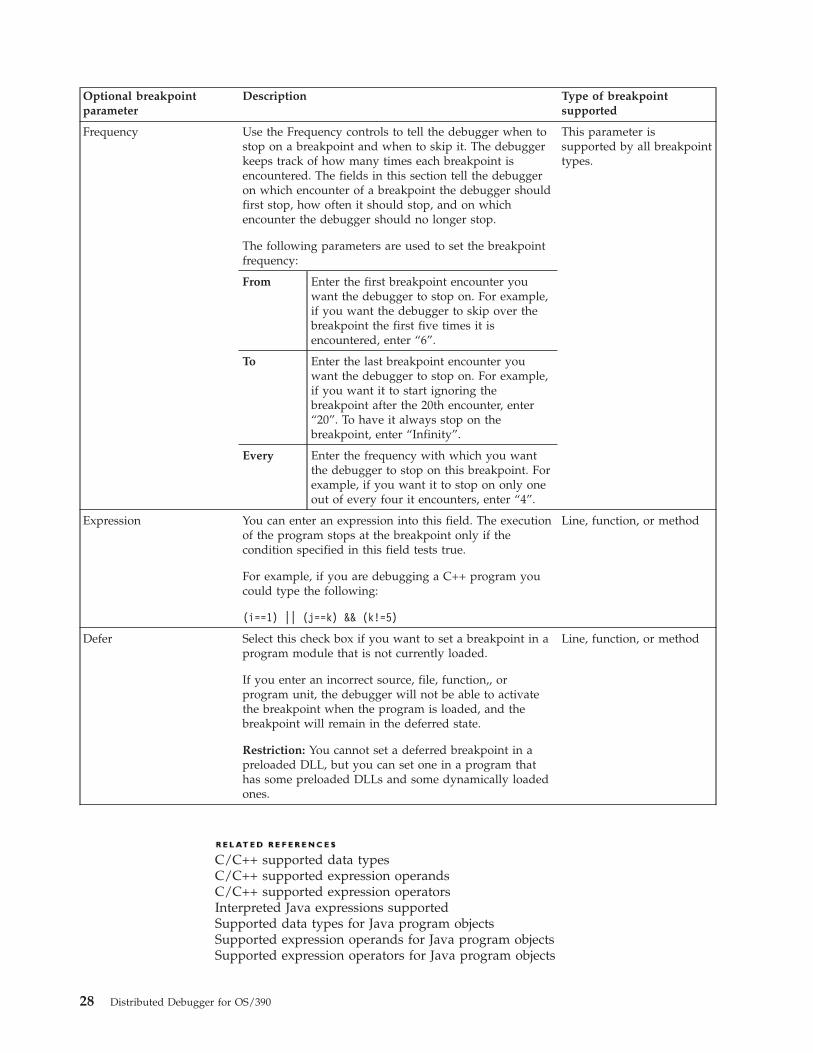
Frequency Use the Frequency controls to tell the debugger when tostop on a breakpoint and when to skip it. The debuggerkeeps track of how many times each breakpoint isencountered. The fields in this section tell the debuggeron which encounter of a breakpoint the debugger shouldfirst stop, how often it should stop, and on whichencounter the debugger should no longer stop.
The following parameters are used to set the breakpointfrequency:
This parameter issupported by all breakpointtypes.
From Enter the first breakpoint encounter youwant the debugger to stop on. For example,if you want the debugger to skip over thebreakpoint the first five times it isencountered, enter “6”.
To Enter the last breakpoint encounter youwant the debugger to stop on. For example,if you want it to start ignoring thebreakpoint after the 20th encounter, enter“20”. To have it always stop on thebreakpoint, enter “Infinity”.
Every Enter the frequency with which you wantthe debugger to stop on this breakpoint. Forexample, if you want it to stop on only oneout of every four it encounters, enter “4”.
Expression You can enter an expression into this field. The executionof the program stops at the breakpoint only if thecondition specified in this field tests true.
For example, if you are debugging a C++ program youcould type the following:
(i==1) || (j==k) && (k!=5)
Line, function, or method
Defer Select this check box if you want to set a breakpoint in aprogram module that is not currently loaded.
If you enter an incorrect source, file, function,, orprogram unit, the debugger will not be able to activatethe breakpoint when the program is loaded, and thebreakpoint will remain in the deferred state.
Restriction: You cannot set a deferred breakpoint in apreloaded DLL, but you can set one in a program thathas some preloaded DLLs and some dynamically loadedones.
Line, function, or method
C/C++ supported data typesC/C++ supported expression operandsC/C++ supported expression operatorsInterpreted Java expressions supportedSupported data types for Java program objectsSupported expression operands for Java program objectsSupported expression operators for Java program objects
28 Distributed Debugger for OS/390

Setting breakpoints
Setting a line breakpointYou can set line breakpoints from the Source pane, the Source menu and theBreakpoints menu.
To set a line breakpoint in the Source pane:1. Make sure the appropriate line is visible in the Source pane by using the scroll
bar or cursor keys to locate the line.2. Do one of the following:
v Double-click on the line number in the prefix area of the line.v Right-click on the line you want to set a breakpoint on, and select Set
Breakpoint from the pop-up menu.
To set a line breakpoint from a menu:1. Select Source > Set Line Breakpoint from the menu bar or select Breakpoints
> Set Line from the menu bar. To bring the Breakpoints menu in focus, click onthe Breakpoints pane.
2. Enter the name of the module or routine in which you want to set a breakpointin the Executable entry field in the Line Breakpoint dialog. If this module orroutine is loaded, you can select it from the pull-down list in the Executableentry field.
3. In the Source entry field, enter the object, class or source file that is associatedwith the module or routine specified in the Executable entry field and containsthe line where the breakpoint is to be set. If the module or routine specified inthe Executable entry field is loaded, you can select the file from the Sourcepull-down list.
4. In the Source entry field, enter the source file containing the code for the objector class file. If the module or routine specified in the Executable entry field isloaded, you can select the file from the Include File pull-down list. (This step isoptional if you have not selected to defer the breakpoint.)
5. Enter the line number where you want to place a breakpoint in the Line entryfield.
6. If the module or routine you entered in the Executable entry field is notcurrently loaded, click on the Defer breakpoint check box.
7. Set any optional parameters that you want for the breakpoint. Optionalparameters cannot be set when debugging interpreted Java programs.
8. Click OK to set the breakpoint and close the Line Breakpoint dialog.Alternatively, use the Set button to set the breakpoint without closing the LineBreakpoint dialog.
Note: If you use the Set push button to set the breakpoint, clicking OK willcause the breakpoint to be set in duplicate. To avoid this, use the Cancel pushbutton after setting the breakpoint with the Set push button. This will set thebreakpoint and close the Line Breakpoint dialog.
Breakpoints
Setting a function breakpointSetting a method breakpointSetting a storage change breakpoint
Chapter 4. Working with breakpoints 29

Setting a load occurrence breakpointSetting a deferred breakpointSetting multiple breakpointsModifying breakpoint propertiesEnabling and disabling breakpointsDeleting a breakpointViewing breakpoints
Optional breakpoint parameters
Setting a function breakpointRestriction: This section applies to debugging Java program objects only. It doesnot apply to debugging interpreted Java programs.
You can set function breakpoints from the Modules pane, the Source menu and theBreakpoints menu.
To set a function breakpoint from the Modules pane:1. Expand the list in the Modules pane until you see the function you want.2. Right-click on that function and select Set Function Breakpoint from the
pop-up menu.
To set a function breakpoint from a menu:1. Select Source > Set Function Breakpoint from the menu bar or select
Breakpoints > Set Function from the menu bar. To bring the Breakpoints menuin focus, click on the Breakpoints pane.
2. Enter the name of the executable which contains the function where you wantto set a breakpoint in the Executable entry field in the Function Breakpointdialog. If this executable is loaded, you can select it from the pull-down list inthe Executable entry field.
3. In the Source entry field, enter the object, class or source file that is associatedwith the module or routine specified in the Executable entry field and containsthe function where the breakpoint is to be set. If the module or routinespecified in the Executable entry field is loaded, you can select the file from theSource pull-down list.
4. In the Function entry field, enter the name of function where the breakpoint isto be set. If the function specified in the Executable entry field is loaded, youcan select the file from the Function pull-down list. (This step is optional if youhave not selected to defer the breakpoint.)
5. If the executable containing the function you want to debug is not currentlyloaded, click on the Defer breakpoint check box.
6. Set any optional parameters that you want for the breakpoint.7. Click OK to set the breakpoint and close the Function Breakpoint dialog.
Alternatively, use the Set push button to set the breakpoint without closing theFunction Breakpoint dialog.
Note: If you use the Set push button to set the breakpoint, clicking OK willcause the breakpoint to be set in duplicate. To avoid this, use the Cancel pushbutton after setting the breakpoint with the Set push button. This will set thebreakpoint and close the Function Breakpoint dialog.
Breakpoints
30 Distributed Debugger for OS/390

Setting a line breakpointSetting a method breakpointSetting a storage change breakpointSetting a load occurrence breakpointSetting a deferred breakpointSetting multiple breakpointsModifying breakpoint propertiesEnabling and disabling breakpointsDeleting a breakpointViewing breakpoints
Optional breakpoint parameters
Setting a method breakpointRestriction: This section applies to debugging interpreted Java programs only. Itdoes not apply to debugging Java program objects.
You can set method breakpoints from the Packages pane, the Source menu andfrom the Breakpoints menu.
To set a method breakpoint from the Packages pane:1. Expand the list in the Packages pane until you see the method you want to set
a method breakpoint on.2. Right-click on that method and select Set Method breakpoint from the pop-up
menu.
To set a method breakpoint from the Source menu or the Breakpoint menu:1. Select Source > Set Method Breakpoint or select Breakpoints > Set Method
from the menu bar. To bring the Breakpoints menu in focus, click on theBreakpoints pane.
2. Enter the name of the method you want to debug in the Method entry field inthe Method Breakpoint dialog. If this method is loaded, you can select it fromthe pull-down list in the Method entry field.
3. If the Method you chose in the Method pull-down list is not currently loaded,click on the Defer breakpoint check box.
4. Click OK to set the breakpoint and close the Method Breakpoint dialog.Alternatively, use the Set push button to set the breakpoint without closing theMethod Breakpoint dialog.
Note: If you use the Set push button to set the breakpoint, clicking OK willcause the breakpoint to be set in duplicate. To avoid this, use the Cancel pushbutton after setting the breakpoint with the Set push button. This will set thebreakpoint and close the Method Breakpoint dialog.
Restriction: Optional parameters cannot be set when debugging interpreted Javaprograms.
Breakpoints
Setting a line breakpointSetting a function breakpoint
Chapter 4. Working with breakpoints 31

Setting a storage change breakpointSetting a load occurrence breakpointSetting a deferred breakpointSetting multiple breakpointsModifying breakpoint propertiesEnabling and disabling breakpointsDeleting a breakpointViewing breakpoints
Optional breakpoint parameters
Setting a storage change breakpointRestriction: This section applies to debugging Java program objects only. It doesnot apply to debugging interpreted Java programs.
Storage change breakpoints halt execution of your program whenever storage at aspecific address is changed. For example, if a byte being watched contains X’40’and the program writes X’40’ to that byte, the storage change breakpoint is nottriggered. If the program writes X’41’, the storage change breakpoint is triggered.
To set a storage change breakpoint from the Breakpoints menu:1. Click on the Breakpoints pane to bring the Breakpoints menu in focus.2. Select Breakpoints > Set Storage Change from the menu bar.3. Enter an address or expression that evaluates to an address in the Address or
Expression field.Tip: You can enter the address of a variable by specifying the variable namepreceded by an ampersand (&).
4. Specify the number of bytes to be monitored in the Bytes to Monitor field.5. Set any optional parameters that you want for the breakpoint.6. Click OK to set the breakpoint and close the Storage Change Breakpoint dialog.
Alternatively, use the Set push button to set the breakpoint without closing theStorage Change Breakpoint dialog.
Note: If you use the Set push button to set the breakpoint, clicking OK willcause the breakpoint to be set in duplicate. To avoid this, use the Cancel pushbutton after setting the breakpoint with the Set push button. This will set thebreakpoint and close the Storage Change Breakpoint dialog.
Caution: If you set a storage change breakpoint for any address that is on the callstack, be sure to remove the breakpoint before leaving the routine associated withit. Otherwise, when you return from the routine, the routine’s stack frame will beremoved from the stack, but the breakpoint will still be active. Any other routinethat gets loaded on the stack will then contain the breakpoint.
Breakpoints
Setting a line breakpointSetting a function breakpointSetting a method breakpointSetting a load occurrence breakpointSetting a deferred breakpointSetting multiple breakpoints
32 Distributed Debugger for OS/390

Modifying breakpoint propertiesEnabling and disabling breakpointsDeleting a breakpointViewing breakpoints
Optional breakpoint parameters
Setting a load occurrence breakpointRestriction: This section applies to debugging Java program objects only. It doesnot apply to debugging interpreted Java programs.
Load occurrence breakpoints halt execution of your program when the DLL ordynamically loaded module specified is loaded into memory. You can set loadoccurrence breakpoints from the Breakpoints menu.
To set a load occurrence breakpoint from the Breakpoints menu:1. Click on the Breakpoints pane to bring the Breakpoints menu in focus.2. Select Breakpoints > Set Load Occurrence from the menu bar.3. Enter the name of the DLL or dynamically loaded module to set the breakpoint
for.4. Set any optional parameters that you want for the breakpoint.5. Click OK to set the breakpoint and close the Load Occurrence Breakpoint
dialog. Alternatively, use the Set push button to set the breakpoint withoutclosing the Load Occurrence Breakpoint dialog.
Note: If you use the Set push button to set the breakpoint, clicking OK willcause the breakpoint to be set in duplicate. To avoid this, use the Cancel pushbutton after setting the breakpoint with the Set push button. This will set thebreakpoint and close the Load Occurrence Breakpoint dialog.
Breakpoints
Setting a line breakpointSetting a function breakpointSetting a method breakpointSetting a storage change breakpointSetting a deferred breakpointSetting multiple breakpointsModifying breakpoint propertiesEnabling and disabling breakpointsDeleting a breakpointViewing breakpoints
Optional breakpoint parameters
Setting a deferred breakpointRestriction: This section applies to debugging Java program objects only. It doesnot apply to debugging interpreted Java programs.
Chapter 4. Working with breakpoints 33

A deferred breakpoint is a breakpoint set in a DLL or executable that is notcurrently loaded. You can defer the following types of breakpoints:v line breakpointsv function breakpoints
To set a deferred breakpoint, click on the Defer breakpoint check box when settingone of the above types of breakpoints.
Breakpoints
Setting a line breakpointSetting a function breakpointSetting a method breakpointSetting a storage change breakpointSetting a load occurrence breakpointSetting multiple breakpointsModifying breakpoint propertiesEnabling and disabling breakpointsDeleting a breakpointViewing breakpoints
Optional breakpoint parameters
Setting multiple breakpointsYou can set several breakpoints from any of the breakpoint dialogs.
To set multiple occurrences of a type of breakpoint:1. Select the type of breakpoints you want to set from either the Source menu or
the Breakpoints menu. To bring the Breakpoints menu in focus, click on theBreakpoints pane.
2. From the Breakpoint dialog, enter the required information for the firstbreakpoint. Change any fields in the Optional Parameters section of the dialog,as desired.Optional parameters are not available when debugging interpretedJava programs.
3. Click on Set. The settings are saved for the current breakpoint.4. For each additional breakpoint, change the information for the new breakpoint
(for example, new line number or function) and click on Set.5. After you have set the last breakpoint, click on Cancel to close the dialog.
Breakpoints
Setting a line breakpointSetting a function breakpointSetting a method breakpointSetting a storage change breakpointSetting a load occurrence breakpointSetting a deferred breakpointModifying breakpoint properties
34 Distributed Debugger for OS/390

Enabling and disabling breakpointsDeleting a breakpointViewing breakpoints
Optional breakpoint parameters
Viewing breakpointsA list of breakpoints you have set is kept in the Breakpoints pane. This list isoriginally collapsed and can be expanded to show your breakpoints. The list ofbreakpoints is divided into the types of breakpoints you may have set. Expandingeach type of breakpoint will provide you with a list of breakpoints for that type.
To view the list of breakpoints:1. Click on the Breakpoints tab for the process or program you are debugging.2. Expand or collapse the list of breakpoints to display the breakpoints you want
to see.
To view the properties of a breakpoint, right-click on the desired breakpoint andselect Breakpoint Properties from the pop-up menu.
Breakpoints
Setting a line breakpointSetting a function breakpointSetting a method breakpointSetting a storage change breakpointSetting a load occurrence breakpointSetting a deferred breakpointSetting multiple breakpointsModifying breakpoint propertiesEnabling and disabling breakpointsDeleting a breakpoint
Optional breakpoint parameters
Modifying breakpoint properties
Restriction: Modifying breakpoint properties is supported when debugginginterpreted Java programs only. When debugging any other programs, includingJava program objects, breakpoints cannot be modified. You must delete the existingbreakpoint and set a new breakpoint with the properties you want.
You can only change the Required parameters fields for a breakpoint set in aninterpreted Java program. Changing these fields results in the existing breakpointbeing deleted and a new breakpoint being set.
To change a breakpoint’s properties:1. Click on the Breakpoints tab to bring the Breakpoints pane to the foreground.
Chapter 4. Working with breakpoints 35

2. In the Breakpoints pane, expand the list of breakpoints until you see thebreakpoint you want to modify.
3. Right-click on the breakpoint you want to modify and select ModifyBreakpoint from the pop-up menu. A Breakpoint dialog corresponding to thebreakpoint type appears displaying the current settings for the breakpoint.
4. Change the breakpoint’s properties in the Breakpoint dialog.5. Click OK to apply the changes to the breakpoint and close the dialog.
Breakpoints
Setting multiple breakpointsEnabling and disabling breakpointsDeleting a breakpointViewing breakpoints
Optional breakpoint parameters
Enabling and disabling breakpointsYou can disable a breakpoint so that it does not stop execution and then laterenable it again. Information about the breakpoint (such as type, location, condition,and frequency) is saved by the Distributed Debugger when the breakpoint isdisabled. When you enable a breakpoint, the Distributed Debugger restores thesaved information. When you delete a breakpoint, however, the DistributedDebugger does not save any information about the breakpoint. If you decide toreinstate the breakpoint, you must add the breakpoint and reenter the information.
Enabled breakpoints are indicated with a red dot ( ). Disabled breakpoints are
indicated with a gray dot ( ).
You can enable or disable breakpoints from the Breakpoints pane or the Sourcepane.
To enable or disable a single breakpoint from the Breakpoints pane:1. Click on the Breakpoints tab to bring the Breakpoints pane to the foreground.2. In the Breakpoints pane, expand the list of breakpoints until you see the
breakpoint you want to enable or disable.3. Right-click on the breakpoint.4. Select Enable Breakpoint or Disable Breakpoint from the pop-up menu.
To enable or disable a breakpoint from the Source pane:1. Scroll to the line which contains the breakpoint you want to enable or disable.2. Right-click on the line which contains the breakpoint.3. Select Enable Breakpoint or Disable Breakpoint from the pop-up menu.
To enable all breakpoints, click on the Breakpoints tab to bring the Breakpointspane to the foreground and select Breakpoints > Enable All Breakpoints from themenu bar.
36 Distributed Debugger for OS/390

To disable all breakpoints, click on the Breakpoints tab to bring the Breakpointspane to the foreground and select Breakpoints > Disable All Breakpoints from themenu bar.
Deleting a breakpoint
Deleting a breakpointYou can delete single breakpoints from the Source pane and the Breakpoints pane.All breakpoints can be deleted at once from the Breakpoints menu. If you delete abreakpoint, all information about it is lost. If you do not want to lose yourbreakpoint information, but do not want the breakpoint to stop execution, disablethe breakpoint instead. For information on disabling breakpoints, see the relatedtopic below.
To delete a single breakpoint in the Source pane:1. Scroll to the line which contains the breakpoint you want to delete.2. Do one of the following to delete the breakpoint:
v Double-click on the line number in the prefix area of the line.v Right-click on the breakpoint and select Delete Breakpoint from the pop-up
menu.
To delete a single breakpoint in the Breakpoints pane:1. Click on the Breakpoints tab to bring the Breakpoints pane to the foreground.2. In the Breakpoints pane, expand the list of breakpoints until you see the
breakpoint you want to delete.3. Right-click on the breakpoint you want to delete.4. Select Delete Breakpoint from the pop-up menu.
To delete all breakpoints, click on the Breakpoints tab to bring the Breakpointspane to the foreground and select Breakpoints > Delete All Breakpoints from themenu bar.
If you want to temporarily prevent all breakpoints from stopping execution,disable them instead by clicking on the Breakpoints tab to bring the Breakpointspane to the foreground and selecting Breakpoints > Disable All Breakpoints.
Enabling and disabling breakpoints
Chapter 4. Working with breakpoints 37

38 Distributed Debugger for OS/390

Chapter 5. Controlling program execution
Running a programYou can have a program run until one of the following occurs:v end of program is reachedv an active breakpoint is hitv a specific line number is reachedv an exception occurs.
To run a program until an active breakpoint is encountered, end of program isreached, or an exception occurs, do one of the following:
v Click the run button ( ).v Select Debug > Run from the menu bar.v Press F5.
To run a program until a specific statement is encountered, end of program isreached, or an exception occurs, do the following:1. Make sure the line to run to is visible in the Source pane by using the scroll bar
or cursor keys to locate the line.2. Run the program to the line by doing one of the following:
v Right-click on the line to bring up the pop-up menu, then select Run ToLocation.
v Click on the line to select it, then select Debug > Run To Location from themenu bar.
v Click on the line to select it, then press F10.
Note: A reported exception is determined by the exception level specified in theDistributed Debugger exception filtering dialog.
Breakpoints
Stepping through a programSetting multiple breakpointsModifying breakpoint propertiesEnabling and disabling breakpointsDeleting a breakpointViewing breakpointsSelecting debugger recognized exceptions
Exception levels
© Copyright IBM Corp. 1999, 2000 39

Stepping through a programYou can use step commands to step through your program a single statement at atime. For an explanation of the step commands, see the related reference below.
To execute a Step Over command, do one of the following:
v Click the step over button ( ) on the toolbar.v Select Debug > Step Over from the menu bar.v Press F10.
To execute a Step Into command, do one of the following:
v Click the step into button ( ) on the toolbar.v Select Debug > Step Into from the menu bar.v Press F11.
To execute a Step Return command, do one of the following:
v Click the step return button ( ) on the toolbar.v Select Debug > Step Return from the menu bar.v Press Shift+F11.
When debugging an interpreted Java program, you can also execute a Step Debugcommand. For an explanation of Step Debug, see the “Step commands” topicbelow. To execute a Step Debug command, do one of the following:
v Click the step debug button ( ) on the toolbar.v Select Debug > Step Debug from the menu bar.v Press F7.
Running a program
Step commands
Step commandsYou can use step commands to step through your program a single line.
40 Distributed Debugger for OS/390

The following types of step commands are available:
Step Command Button Shortcut Description
Step Into
F11
Executes the currentstatement. Executionstops at the nextstatementencountered forwhich debuginformation isavailable. This couldbe in the currentfunction or routine,in the called functionor routine, or in afunction or routinecalled within thecalled function orroutine.
Step Over
F10
Executes the currentstatement, withoutstopping in anyfunctions or routinescalled within thestatement.
Step Return
Shift+F11
Executes from thecurrent executionpoint up to thestatementimmediatelyfollowing the linethat called thisfunction or routine. Ifyou issue a StepReturn commandfrom the main entrypoint (in C++, themain() program), theprogram runs tocompletion.
When debugging interpreted Java, you also have the Step Debug commandavailable:
Chapter 5. Controlling program execution 41

Step Command Button Shortcut Description
Step Debug
F7
Executes the currentline. Execution stopsat the next lineencountered forwhich debuginformation isavailable. This couldbe in the currentfunction or routine,in the called functionor routine, or in afunction or routinecalled within thecalled function orroutine.
Execution of your program may stop earlier than indicated in the step commanddescriptions, if the Distributed Debugger encounters an active breakpoint or anexception occurs.
You can use combinations of step commands to step through multiple calls on asingle line.
Stepping through a program
Skipping over sections of a programYou can skip over sections of code to avoid executing certain statements or tomove to a position so that certain statements can be executed again. If you attemptto jump to a line which is outside the section containing the current executionpoint, a message is displayed and the jump is not permitted.
To skip over a section of code:1. Scroll to the line after the statements that you want to skip or scroll to the line
of a statement that you want to execute again.2. Jump to the line by doing one of the following:
v Right-click on the line and select Jump to Location from the pop-up menu.v Click on the line to select it, then select Debug > Jump to Location from the
menu bar.
Running a program
Halting execution of a programRestriction: This section applies to debugging interpreted Java programs only. Itdoes not apply to debugging Java program objects.
Halting a program stops the execution of the program without terminating theexecution of the program. It allows you to pause and examine the program’sinternal state and then continue execution without restarting the program.
42 Distributed Debugger for OS/390
To halt execution of a program that is currently running in the debugger, do one ofthe following:
v Click on .v Select Debug > Halt from the menu bar.v Press Ctrl+F5.
You may find that execution halts in a function other than the one you aredebugging (for example, a system library routine). To run to the end of that routineand stop in your own code, do one of the following:v Issue a Step Return command.v If the previous technique results in the debugger displaying the message
“Cannot determine return address”, issue the Step Debug command untilexecution returns to your code
v If you know what line in your program will be the next to execute after thecurrent function returns, go to the source pane containing that line, set abreakpoint on it, and issue the Run command.
Important: The debugger cannot halt an applet or application that has all of itsthreads blocked.
Step commands
Running a programStepping through a programSetting a line breakpoint
Restarting a programRestriction: This section applies to debugging interpreted Java programs only. Itdoes not apply to debugging Java program objects.
To start debugging your program from the beginning when your program is
stopped, click on in the toolbar or select Debug > Restart from the menu bar.
To start debugging your program again from the beginning:
1. Issue a Halt command by clicking on in the toolbar or selecting Debug >Halt from the menu bar, if the program is currently executing within thedebugger.
2. Set a breakpoint at the location you want to run to, if it is not the beginning ofyour program and you have not already set a breakpoint there. Your programmust be stopped in order to set any breakpoints.
3. Click on in the toolbar or select Debug > Restart from the menu bar.
If the previous run of your program produced side effects such as the creation ofan output file and the program logic will be changed by the existence of such filesfrom a previous debug session, you may want to erase these files before restarting.
Halting execution of a programRunning a program
Chapter 5. Controlling program execution 43

Selecting debugger recognized exceptionsYou can select the types or the level of exceptions the Distributed Debuggerrecognizes for programs you are debugging, so that stepping or execution will stopwhen an exception occurs that matches one of the specified types or the specifiedlevel. By default, all unhandled exceptions are recognized by the DistributedDebugger.
To specify the types or level of exceptions to be recognized by the DistributedDebugger:1. Select File > Preferences from the menu bar.2. Expand the Debug item in the left-hand window of the Application Preferences
dialog.3. Locate the program you want to set the exceptions recognized for.4. Click on Exception Filter Preferences Settings.
5. Check the types or the level of exceptions you want the Distributed Debuggerto recognize.
6. Click OK to close the Application Preferences dialog.
Note: When debugging Java program objects andIf no exception level is selected,the Distributed Debugger defaults to the value specified in the TEST run-timeoption. If more than one level is selected, the one with the greater scope is used.For example, if TEST(NONE) and TEST(ALL) are selected, the TEST(ALL) selectionis used. These exception levels do not apply when debugging interpreted Javaprograms.
To cancel your exception filter preferences settings, click Reset.
To set your exception filter preferences to the default settings, click Default.
To set your new exception filter preferences as the default, check the DebuggerDefaults box before clicking OK.
Exception levels
Terminating a debug session without exiting the debuggerTo terminate the execution of a program that is currently running in the debuggerand not exit the debugger, do one of the following:
v Click on .v Select Debug > Terminate from the menu bar.
Running a programStarting applications with Debug Tool in OS/390 batchStarting Java program objects with Debug Tool in OS/390 UNIXStarting Java program objects with Debug Tool in OS/390 batch
44 Distributed Debugger for OS/390

Terminating a debug session without stopping the daemonTo terminate the execution of a program that is currently running in the debuggerand not exit the debugger, do one of the following:
v Click on .v Select Debug > Terminate from the menu bar.
Running a programStarting applications with Debug Tool in OS/390 UNIXStarting applications with Debug Tool in OS/390 batchStarting Java program objects with Debug Tool in OS/390 UNIXStarting Java program objects with Debug Tool in OS/390 batch
Chapter 5. Controlling program execution 45

46 Distributed Debugger for OS/390

Chapter 6. Inspecting data
Inspecting variables
Adding a variable or expression to the Monitors paneIf you want to keep track of the contents of variables and expressions duringprogram execution, add them to the Monitors pane. You can add variables andexpressions to the Monitors pane from the Monitors menu or the Source pane.
Local variables that are in scope can also be monitored in the Locals pane. Bydefault, all local variables in scope are added to the Locals pane.
To add a variable or expression to the Monitors pane from the Source pane:1. Double-click or highlight the variable or expression you want to monitor.2. Right-click on the highlighted variable, and select Add to Program Monitor
from the pop-up menu.
To add a variable or expression to the Monitors pane from the Monitors menu:1. Select Monitors > Monitor Expression from the menu bar.2. In the dialog, enter the variable or expression you want to monitor.3. Select the Program monitor radio button.4. Click OK to add the variable or expression to the monitor and close the dialog.
Alternatively, use the Monitor button to add the variable or expression to themonitor without closing the dialog.
C/C++ supported data typesC/C++ supported expression operandsC/C++ supported expression operatorsInterpreted Java supported expressionsJava program objects supported data typesJava program objects supported expression operandsJava program objects supported expression operators
Viewing the contents of a variableYou can view the contents of a variable or expression in the Locals pane or theMonitors pane, if you have added the variable there. By default, all local variablesin scope are added to the Locals pane.
To view the contents of a variable or expression in the Locals pane:1. Expand the thread in the Locals pane where the local variable you want to
view appears.2. If necessary, scroll the pane until the variable is visible.3. If your variable is a class, struct or array, it can be expanded to show its
individual elements.4. If desired, change the representation of the variable: right-click on the variable
and select a representation from the Monitor Representation menu.
To view the contents of a variable or expression you have already added to theMonitors pane:
© Copyright IBM Corp. 1999, 2000 47

1. If your variable’s type is a class, struct or array, it can be expanded to show itsindividual elements.
2. If desired, change the representation of the variable: right-click on the variableand select a representation from the Monitor Representation menu.
If a variable or expression is not in scope, a message displays in the Monitors paneinstead of a value.
You can also view the contents of variables in the Source pane with hover help. Toenable hover help, see the related topic below.
Enabling hover help for variablesAdding a variable or expression to the Monitors paneViewing a location in storageMapping pointers, addresses and registers
Changing the contents of a variableRestriction: This section applies to debugging Java program objects only. It doesnot apply to debugging interpreted Java programs.
To change the contents of a variable in a Locals pane or Monitors pane:1. Expand the monitor containing the variable whose value you want to modify.2. If your variable’s type is a class, struct or array, expand it to show its
individual elements.3. Scroll to the variable you want to change and do one of the following:
v Double-click on the variable or variable element.v Right-click on the variable and select Edit from the pop-up menu.
4. Enter a value that is valid for the current representation of that variable orvariable element.
5. Press Enter to submit the change.
Adding a variable or expression to the Monitors pane
Inspecting registers
Viewing the contents of a registerRestriction: This section applies to debugging Java program objects only. It doesnot apply to debugging interpreted Java programs.
You can view the contents of a register from the Registers pane, the Monitors paneif you have added the register there, or a Storage Monitor pane if you have addedthe register there.
To view the contents of a register in the Registers pane:1. Expand the thread for which you want to view the registers.2. Expand the register category that contains the register you want to view.3. If desired, scroll the pane until the register is visible.
To view the contents of a register you have already added to the Monitors pane:1. If necessary, scroll the Monitors pane until the register is visible.
48 Distributed Debugger for OS/390

2. If desired, change the representation of the register: right-click on the registerand select a representation from the Monitor Representation menu.
To view the contents of a register you have already added to a Storage pane:1. If necessary, scroll the Storage pane until the register is visible.2. If desired, change the representation of the register: right-click on the register
and select a representation from the Monitor Representation menu.
Adding a new Storage Monitor pane for an expression or registerAdding a register to the Monitors paneMapping pointers, addresses and registers
Changing the contents of a registerRestriction: This section applies to debugging Java program objects only. It doesnot apply to debugging interpreted Java programs.
To change the contents of a register in the Registers pane or Monitors pane:1. In the Registers pane or Monitors pane, expand the entry which contains the
register whose value you want to modify.2. Scroll to the register you want to change and do one of the following:
v Double-click on the register.v Right-click on the register and select Edit from the pop-up menu.
3. Enter a value that is valid for the current representation of that register.Changes do not take effect until the application regains control, for example, ifyou issue a step or run command. If you change the contents of a register morethan once before returning control to the application, the last value entered willbe used. Also changes to the IAR are ignored. You can enter a new value butthe application will not use it.
4. Press Enter to submit the change.
Viewing the contents of a registerAdding a register to the Monitors pane
Adding a new Storage Monitor pane for an expression orregister
Restriction: This section applies to debugging Java program objects only. It doesnot apply to debugging interpreted Java programs.
Tip: Registers and expressions can also be monitored using the Monitors pane. Ifyou want to view all registers at once, use the Registers pane.
If you want to monitor specific locations in storage or a few registers duringprogram execution, you can add a new Storage Monitor pane for an expression orregister.
Important: If there is a variable in scope which has the same name as the registerthat you are trying to use, the variable will be used.
To add a new Storage Monitor pane for a register from the Registers pane:1. Highlight the register you want to add a new Storage Monitor pane.
Chapter 6. Inspecting data 49

2. Right-click on the register and select Add to Storage Monitor from the pop-upmenu. A new Storage Monitor pane will appear with the name of the registerappearing in the monitor’s tab.
To add a new Storage Monitor pane for a variable, expression, or register from theMonitors pane:1. Select the variable, expression, or register from the source.2. Right-click and, from the pop-up menu, select Add to Storage Monitor.
or1. Click on the Monitors tab and do one of the following:
v Select Monitors > Monitor Expression from the menu bar.v Press Shift+F9.
2. In the dialog, enter the expression or register that you want to monitor.3. Select the Storage Monitor radio button.4. Click OK to add the new Storage Monitor pane. Alternatively, use the Monitor
button to add the expression or register to the Storage Monitor pane withoutclose the dialog.
A new Storage Monitor pane will appear with the name of the variable, expression,or register appearing in the monitor’s tab.
Tip: Check the Registers pane to see valid register names.
Changing the representation of storage contentsChanging the contents of a storage locationViewing a location in storage
Adding a register to the Monitors paneRestriction: This section applies to debugging Java program objects only. It doesnot apply to debugging interpreted Java programs.
You can add a register to the Monitors pane if you want to monitor only a fewregisters during the execution of your program. Registers can also be monitored inthe Registers pane and Storage Monitor pane. To monitor all registers duringprogram execution, use the Registers pane.
To add a register to the Monitors pane:1. Click on the Monitors tab and do one of the following:
v Select Monitors > Monitor Expression from the menu bar.v Press Shift+F9.
2. In the dialog, enter the name of the register you want to monitor.3. Select Program Monitor.4. Click OK to add the register to the Monitors pane and close the dialog.
Alternatively, use the Monitor button to add the register to the monitorwithout closing the dialog.
Tip: Check the Registers pane to see valid register names.
Viewing the contents of a registerAdding a new Storage Monitor pane for an expression or register
50 Distributed Debugger for OS/390

Inspecting storage
Viewing a location in storageRestriction: This section applies to debugging Java program objects only. It doesnot apply to debugging interpreted Java programs.
You can view the contents of storage from the Storage pane or from a new StorageMonitor pane that you have created.
To view the contents of storage from the Storage pane:1. If necessary, scroll in the Storage pane to view storage locations above or below
the starting address of the Storage pane.2. You can jump directly to an address in the Storage pane by doing the
following:v Double-click on any address field in the Storage pane.v Enter the address you want to view. This address can be an expression, for
example &x.v Press Enter. The storage contents now shown in the Storage pane are
centered around the address you just entered.3. If desired, change the representation of the storage contents in the Storage
pane.
To view the contents of storage from a Storage Monitor pane that you havecreated:1. If necessary, scroll bar in the Storage Monitor pane to view storage locations
above or below the starting address of the Storage Monitor pane.2. Use the Go to Address button to return to the starting address of the Storage
Monitor pane.3. If desired, change the representation of the storage contents in the Storage
Monitor pane.
Tip: To view the contents of a variable, such as an integer, in a Storage monitorprecede the variable with an ampersand (&), or select a pointer that points to thatvariable. For example, given the following source code:int i=10;
You can monitor the storage for the variable i by entering &i in the Monitorexpression dialog, then selecting the Storage monitor radio button in that dialog.
Changing the representation of storage contentsChanging the contents of a storage locationCreating a new Storage monitor for an expression or registerMapping pointers, addresses and registers
Changing the representation of storage contentsYou can change the representation of the storage and the number of columnsshown in the Storage monitor or Storage Monitor panes.
These settings affect only the Storage monitor or Storage Monitor pane you areviewing, so you can have multiple Storage Monitor panes with different settings.
Chapter 6. Inspecting data 51
v Select the representation of storage for the Storage pane or Storage Monitor paneyou are viewing from the Content style pull-down list.
v Select the number of columns shown in a Storage pane or Storage Monitor panefrom the Columns Per Line pull-down list.
Changing the contents of a storage locationRestriction: This section applies to debugging Java program objects only. It doesnot apply to debugging interpreted Java programs.
To change the contents of a storage location in a Storage pane or Storage Monitorpane:1. Select the Storage pane or Storage Monitor pane where you want to make the
change.2. Scroll down to the storage location you want to change.3. Double-click on the value you want to change or right-click on the value and
select Edit from the pop-up menu.4. Enter a valid value for that storage location.
Note: You cannot edit the left most column. Performing the above steps in the farleft column will cause the Storage pane to scroll and the Storage Monitor pane tomonitor the value you entered.
Tip: When modifying the contents of storage, be sure to display the storage in asingle representation according to the manner in which you will edit it. Forexample, if you plan to enter character data, display the storage as character only.
Mapping storage
Mapping LayoutsRestriction: This section applies to debugging Java program objects only. It doesnot apply to debugging interpreted Java programs.
You can display the contents of a storage block mapped according to auser-defined layout.
Selecting a storage block
You specify the starting address of the storage block either by selecting a pointerfrom the Monitors pane or the Locals pane, a register from the Registers pane, oran address from the Storage Pane or the Storage Monitors pane, or by typing it inan Add Layout dialog entry field. When selecting a pointer or a register, its currentvalue is used as a base address of the storage block. This means that if later on thevalue stored in the pointer variable or in the register changes, the layout does notchange. The size of the storage block is determined by the size of the selectedlayout.
Specifying layouts
Each predefined storage layout is stored in one XML file. The XML file formatprovides for describing either structures of predefined primitive type elements ornested layouts where a layout element can actually point to another storage layoutfile. The layout file also specifies the length of the storage block to be laid out. Alist of available layout files is contained in a master layout file namedUserViews.XML.
52 Distributed Debugger for OS/390

Layout definition and deployment
You need to create the XML layout files and the master layout file using a texteditor. The Distributed Debugger allows for specifying the location of the masterUserViews.XML file and of the layout files.
Mapping pane
When you map storage blocks, a Mapping pane appears. Initially this pane isempty. The Mapping pane displays a set of layout elements representing pairs(storage block address, user defined layout) each containing a set of sub-elementsrepresenting pairs (Header, Value) according to the description in a user-definedlayout file.
You can add layouts to this pane by either selecting the Map Storage action that isavailable for pointers from the Monitors pane or the Locals pane, registers from theRegisters pane, or addresses from the Storage Pane or the Storage Monitors pane,or by using the Add Layout action from a pop-up menu on the Mapping Pane.When the Map Storage action is invoked, you are prompted to select a mappinglayout from the list of available layouts specified in the master layout file:UserViews.XML.
If the specified storage block is protected or cannot be accessed, the display valueswill be shown as a number of “?”s.
The layout elements may be expanded or contracted by clicking on or at theleft of the layout element. Initially the layout element and any sub-elementsrepresenting nested layouts are not populated (no sub-elements are generated yet).The first time you expand a layout element it is populated according to the XMLlayout file. Populating the layout element means breaking the storage block intofragments corresponding to the layout elements specified in the XML. The valuesdisplayed for the layout sub-elements are formatted according to a defaultprimitive type specified in the XML file.
Hover help for the layout sub-elements displays the offset in bytes from the baseaddress represented as a HEX number.
You can take different actions for different objects from the Mapping pane. On theMapping pane you can add a new layout element by specifying both the baseaddress and the XML layout file. You must enter the base address as a HEXnumber and the name of the XML file. You can also expand all the layout elementsand sub-elements. This action does not populate them if they are empty. You must
click on to populate a sub-element. You can collapse all the layout elementsand sub-elements.
At the layout element level, you can update the mapped storage block’s contentsand refresh the layout element and its sub-elements. You can change the baseaddress or the XML layout file for the selected layout element (the address must bespecified as a HEX number) and refresh the layout element and its sub-elements.You can also remove the layout element and its sub-elements. Finally, you canselect a sub-element searching for either the header of a sub-element or its offset. Ifan offset is specified and it does not match the offset of any sub-element the Findaction will try to select the element with the closest starting offset.
Chapter 6. Inspecting data 53

At the layout sub-element level, you can select the display value representation forthe selected sub-element. You must select from a list of available representationswhich are specific to the type of the selected element. You can also edit the valueof the selected layout sub-element.
Mapping pointers, addresses and registersRestriction: This section applies to debugging OS/390 C/C++ programs only.
You can map pointers from the Monitors or Locals pane. You can map addressesfrom a Storage pane or Storage Monitor pane. You can map registers from theRegisters pane.
These elements are mapped according to user-defined layout. The layouts aredefined in XML. For more information on defining a mapping layout in XML, seethe related topic below.
To map a pointer, address or register:1. Highlight the pointer, address or register you want to map.2. Right-click on the highlighted pointer, address or register, and select Map
Storage from the pop-up menu.3. Select a desired storage mapping from the list.4. Click OK to add the storage layout of the item you selected to the Mapping
pane and close the dialog.
Mapping layouts
Defining a mapping layout
Defining a mapping layoutRestriction: This section applies to debugging OS/390 C/C++ programs only.
Defining a mapping layout is a two step process. In the first step you create thelayout XML file. In the second step you add it to the master UserViews.XML file.
The example below defines the layout for the following C language structure onOS/390:typedef struct {
char char_val;unsigned short ushort_val;short short_val;unsigned long ulong_val;long long_val;char string_val[32];
} _test;
Creating the layout XML file
The XML file format is defined in the layout.dtd document type definition (DTD)file as follows:<?xml version=“1.0” encoding=“ISO-8859-1”?>
<!ELEMENT LAYOUT (FIELD)+><!ATTLIST LAYOUT Header CDATA #REQUIRED length CDATA #REQUIRED ><!ELEMENT FIELD (FIELD)*>
54 Distributed Debugger for OS/390

<!ATTLIST FIELDHeader CDATA #REQUIREDType(16_BIT_INT|16_BIT_UINT|16_BIT_HINT|32_BIT_INT|32_BIT_UINT|32_BIT_HINT|32_BIT_FLOAT|
64_BIT_INT|64_BIT_FLOAT|CHARACTER|HEX|ASCII|EBCDIC|STRUCTURE|PADDING|BIT|BITMASK|MAP)
#REQUIREDlength CDATA #REQUIREDlayout CDATA #IMPLIED>
This means that the XML layout file would specify first a header (title) and thetotal length of the layout followed by a list of sub-elements (FIELD) described by aheader (name), length and primitive type which is used to determine the defaultrepresentation of that sub-element.
There are also special sub-element types:v STRUCTURE introduces a nested structure; the sub-element has no valuev PADDING used to define a block of bytes that does not need to be specifically
laid outv BITMASK used to define a bitmasked sub-element. Its sub-elements represent
bits, groups, or bits defined by the BIT type.
The XML file describing the _test structure and conforming to this format is:<?xml version=“1.0”?><!DOCTYPE LAYOUT SYSTEM “Layout.dtd” >
<LAYOUT Header = “A Layout” length=“17”><FIELD Header = “char_val” Type = “CHARACTER” length = “1” > </FIELD><FIELD Header = “ushort_val” Type = “16_BIT_UINT” length = “2” > </FIELD><FIELD Header = “short_val” Type = “16_BIT_INT” length = “2” > </FIELD><FIELD Header = “ulong_val” Type = “32_BIT_UINT” length = “4” > </FIELD><FIELD Header = “long_val” Type = “32_BIT_INT” length = “4” > </FIELD><FIELD Header = “string_val” Type = “ASCII” length = “32”> </FIELD>
</LAYOUT>
Note: The <!DOCTYPE LAYOUT SYSTEM “Layout.dtd” > line specifies whichDTD file is used to parse the contents of this file. If the Layout.DTD file is situatedin a different location then the full path to that location must be specified.
Defining padding fields
If you decide to ignore the long_val field but want to show the string_val type inthe layout, the XML file will look like:
<FIELD Header = “short_val” Type = “16_BIT_INT” length = “2” > </FIELD><FIELD Header = “ulong_val” Type = “32_BIT_UINT” length = “4” > </FIELD><FIELD Header = “” Type = “PADDING” length = “4” > </FIELD><FIELD Header = “string_val” Type = “ASCII” length = “32”> </FIELD>
The initial purpose for defining the PADDING sub-elements is to deal with bytealigned structures but it can also be used to skip a data area that does not need tobe detailed in the layout.
Defining structures
The following piece of XML shows the usage of STRUCTURE fields for mappingnested structures. A structure top element does not have an associated value and itcan be expanded to show its sub-elements. While the length of the STRUCTUREfield is added to the total size of the XML layout, the included field sizes areintended for display only. For example, the following structure would only mean344 bytes out of the total layout size.
Chapter 6. Inspecting data 55

<FIELD Header = “MACHINE CHECK LOG OUT AREA” Type = “STRUCTURE” length = “344” ><FIELD Header=“reserved” Type=“HEX” length=“16”></FIELD><FIELD Header=“FLCSID” Type=“HEX” length=“4”></FIELD><FIELD Header=“FLCIOFP” Type=“HEX” length=“4”></FIELD><FIELD Header=“reserved” Type=“HEX” length=“20”></FIELD><FIELD Header=“FLCESAR” Type=“HEX” length=“4”></FIELD><FIELD Header=“FLCCTSA” Type=“HEX” length=“8”></FIELD><FIELD Header=“FLCCCSA” Type=“HEX” length=“8”></FIELD><FIELD Header=“FLCMCIC” Type=“HEX” length=“8”></FIELD><FIELD Header=“reserved” Type=“HEX” length=“8”></FIELD><FIELD Header=“FLCFSA” Type=“HEX” length=“4”></FIELD><FIELD Header=“reserved” Type=“HEX” length=“4”></FIELD><FIELD Header=“FLCFLA” Type=“HEX” length=“16”></FIELD><FIELD Header=“FLCRV110” Type=“HEX” length=“16”></FIELD><FIELD Header=“FLCARSAV” Type=“STRUCTURE”length=“64”>
<FIELD Header=“AR0” Type=“HEX” length=“4”></FIELD><FIELD Header=“AR1” Type=“HEX” length=“4”></FIELD><FIELD Header=“AR2” Type=“HEX” length=“4”></FIELD><FIELD Header=“AR3” Type=“HEX” length=“4”></FIELD><FIELD Header=“AR4” Type=“HEX” length=“4”></FIELD><FIELD Header=“AR5” Type=“HEX” length=“4”></FIELD><FIELD Header=“AR6” Type=“HEX” length=“4”></FIELD><FIELD Header=“AR7” Type=“HEX” length=“4”></FIELD><FIELD Header=“AR8” Type=“HEX” length=“4”></FIELD><FIELD Header=“AR9” Type=“HEX” length=“4”></FIELD><FIELD Header=“AR10” Type=“HEX” length=“4”></FIELD><FIELD Header=“AR11” Type=“HEX” length=“4”></FIELD><FIELD Header=“AR12” Type=“HEX” length=“4”></FIELD><FIELD Header=“AR13” Type=“HEX” length=“4”></FIELD><FIELD Header=“AR14” Type=“HEX” length=“4”></FIELD><FIELD Header=“AR15” Type=“HEX” length=“4”></FIELD>
</FIELD><FIELD Header=“FLCFPSAV” Type=“HEX” length=“32”></FIELD><FIELD Header=“” Type=“PADDING” length=“64”></FIELD><FIELD Header=“” Type=“PADDING” length=“64”></FIELD>
</FIELD>
Defining bitmask fields
The following XML piece is a sample for describing BITMASK fields. The length ofthe BITMASK is specified in bytes and it contains a set of BIT fields for which thelength is specified in bits. The offset shown for the BIT fields is a bit offset withinthe BITMASK field. While the length of the bitmask field is added to the total sizeof the XML layout, the individual BIT field sizes are intended for display only.<FIELD Header=“byte_field” Type=“BITMASK”length=“2”>
<FIELD Header=“hi_byte” Type=“BIT” length=“8”></FIELD><FIELD Header=“lo_byte” Type=“BIT” length=“8”></FIELD>
</FIELD>
Defining nested layouts
The MAP field type together with the optional layout field, let you describe nestedlayouts as in the following OS/390 DSA layout example:<?xml version=“1.0”?><!DOCTYPE LAYOUT SYSTEM “Layout.dtd” ><LAYOUT Header = “DSA” length=“72”><FIELD Header = “FLAGS” Type = “HEX” length = “2”></FIELD><FIELD Header = “junk” Type = “HEX” length = “2”></FIELD><FIELD Header = “Back Chain” Type = “MAP” length = “4”layout=“dsa.xml” ></FIELD><FIELD Header = “Forward Chain” Type = “MAP” length =“4” layout=“dsa.xml” ></FIELD><FIELD Header = “R14” Type = “HEX” length = “4”></FIELD><FIELD Header = “R15” Type = “HEX” length = “4”></FIELD><FIELD Header = “R0” Type = “HEX” length = “4”></FIELD><FIELD Header = “R1” Type = “HEX” length = “4”></FIELD>
56 Distributed Debugger for OS/390

<FIELD Header = “R2” Type = “HEX” length = “4”></FIELD><FIELD Header = “R3” Type = “HEX” length = “4”></FIELD><FIELD Header = “R4” Type = “HEX” length = “4”></FIELD><FIELD Header = “R5” Type = “HEX” length = “4”></FIELD><FIELD Header = “R6” Type = “HEX” length = “4”></FIELD><FIELD Header = “R7” Type = “HEX” length = “4”></FIELD><FIELD Header = “R8” Type = “HEX” length = “4”></FIELD><FIELD Header = “R9” Type = “HEX” length = “4”></FIELD><FIELD Header = “R10” Type = “HEX” length = “4”></FIELD><FIELD Header = “R11” Type = “HEX” length = “4”></FIELD><FIELD Header = “R12” Type = “HEX” length = “4”></FIELD></LAYOUT>
This well-formed XML layout is stored in a file called DSA.XML. Since you knowthat fields 3 and 4 contain pointers to different DSA structures you add two nestedlayout definitions.
Note: The actual storage mapping for that layout is actually executed when youexpand the layout element for the first time in order to prevent recursive layoutexpansions.
Adding the new layout file to the list of available layouts
Once the XML layout file is ready it must be made visible to the DistributedDebugger through the UserViews.XML file. The DTD for this file follows:<?xml version=“1.0” encoding=“ISO-8859-1”?>
<!ELEMENT CLASSES (CLASS)+><!ATTLIST CLASSES Total CDATA #REQUIRED><!ELEMENT CLASS EMPTY ><!ATTLIST CLASS Name CDATA #REQUIRED ActionLabel CDATA #REQUIRED>
It defines a list of XML layout file and label pairs. The XML layout file is the fullpath to the required layout file while the label is used when you select a storagemapping.
If you want to add the TestLayout.XML file to the UserViews.XML file, the finalresult looks like:<?xml version=“1.0”?><!DOCTYPE CLASSES SYSTEM “Classes.dtd” ><CLASSES Total=“2”><CLASS Name = “OtherLayout.XML” ActionLabel = “other layout”></CLASS><CLASS Name = “TestLayout.XML” ActionLabel = “_test C structure”></CLASS></CLASSES>
Note: Specifying the .XML at the end of the XML layout file name is required.
Once the XML file is added to the UserViews.XML file it will be available from theMap Storage dialog.
Enabling and disabling a monitored variable, expression or registerYou can disable the monitoring of a variable, expression or register. The advantageof disabling a monitored expression, instead of deleting it, is that it is easier toenable a monitored expression than to recreate it.
You can enable or disable monitored variables, expressions or registers from eitherthe Monitor pane or Locals pane.
To enable or disable a monitored expression, variable or register:
Chapter 6. Inspecting data 57

1. Locate the variable, expression or register you want to disable or enable in theMonitors pane or Locals pane.
2. Right-click on the variable, expression or register you want to enable or disable.3. Select Enable or Disable from the pop-up menu.
Enabling hover help for variablesHover help for variables provides you with a quick way to view the contents ofvariables in the Source pane. When you point at a variable, a pop-up appearsdisplaying the contents of that variable. This feature is enabled by default whenyou first start the debugger.
To enable hover help for variables, select Source > Allow Tool Tip Evaluationfrom the menu bar.
A check mark will appear next to the Allow Tool Tip Evaluation menu item toindicate that hover help for variables is enabled.
To enable hover help for variables as the default:1. Select File > Preferences from the main menu.2. Select Debug from the list of preferences to set.3. Select Allow Tool Tip Evaluation from the Debugger Defaults section.4. Click OK to enable hover help and close the dialog.
Distributed Debugger: Monitors
Changing the representation of monitor contentsRestriction: This section applies to debugging Java program objects only. It doesnot apply to debugging interpreted Java programs.
You can change the representation of variables and expressions in the Monitorspane or Locals pane. You can change the representation for existing entries or thedefault representation for future entries in the Applications Preferences dialog.
To change the representation of a variable or expression:1. Right-click on the variable or expression you want to change the representation
of.2. Select Representation from the pop-up menu. The Monitor Representation
dialog appears.3. Select the representation you want from the list of available representations.4. Click OK to change the representation and close the Monitor Representation
dialog.
To change the default representation of the types of data:1. Select File > Preferences from the main menu bar. The Application Preferences
dialog appears.2. In the left-hand pane of the Application Preferences dialog, expand Debug >
program > Default Monitor Representation, where program is the name of aprogram loaded in the Distributed Debugger you want to change the defaultrepresentation for.
58 Distributed Debugger for OS/390

3. Change the representations for variable types by clicking on the representationassociated with a variable type and selecting a representation from the list.
4. If you want these representations to become the default for the DistributedDebugger, click Debugger Defaults.
5. Click OK to change the default representations and close the ApplicationPreferences dialog.
The default representations of variables and expressions in programs you havepreviously debugged will not be affected by these changes.
Chapter 6. Inspecting data 59

60 Distributed Debugger for OS/390

Appendix A. Distributed Debugger commands
idebug commandThe idebug command starts the Distributed Debugger user interface daemonwhich waits for Debug Tool on OS/390 to connect to it. The idebug command hasthe following syntax:
idebug [ui_daemon_parameters]
The ui_daemon_parameters are used when starting the Distributed Debugger userinterface as a daemon. When running as a daemon, the Distributed Debugger userinterface listens on a specific port number for a debug engine. Once a connection ismade, the Distributed Debugger user interface appears and you can begindebugging your program. The ui_daemon_parameters are:
Parameter Description
-qdaemon Tells the Distributed Debugger user interface to run as a daemon. You must use the-quiport option when specifying -qdaemon.
This is a required parameter.
-qlang=<dominant_language>
Specifies the dominant language to use for debugging.
These are the valid values for <dominant_language>:
Value Use when debugging:
c C programs
cpp C++ programsJava program objects
java interpreted Java programs
-quiport=<port> Specifies the port numbers where the Distributed Debugger user interface daemonshould listen for a debug engine. You can specify a single port or mulitple ports.When specifying multiple ports use a comma to delimit the port numbers.
This is a required parameter.
One of the port numbers specified here must be used as the port number in theport parameter of the TEST run-time option or the -quiport parameter of theirmtdbgj command.
-qterminate Closes any running user interface daemons before starting a new user interfacedaemon.
-qremotesource=<path> Specifies the location of source files on the OS/390 system where the OS/390application will be running and debugged. Locations can include HFS path namesor both sequential file names and HFS path names, PDS names, and sequential filenames.
If more than one name is specified, the names must be separated by a semicolon.For example,
-qremotesource=USER1.PROJ.C;/u/user1/dir2;
© Copyright IBM Corp. 1999, 2000 61

Parameter Description
-qremotesource=<path> Specifies the location of source files on the OS/390 system where the OS/390application will be running and debugged. Locations can only be HFS path names.
If more than one name is specified, the names must be separated by a semicolon.For example,
-qremotesource=/u/project1/source1;/u/user1/dir2;
irmtdbgj command
irmtdbgj commandRestriction: This command is only used when debugging interpreted Javaprograms. Java program objects can be debugged using the Distributed Debuggerwith Debug Tool.
Requirement: You must have the interpreted Java debug engine installed on thehost in order to use this command.
The irmtdbgj command starts the Java debug engine on the remote host. Oncestarted, the debug engine waits to connect to the debugger user interface on thelocal system. You can use the debugger Load Program on the local system or usethe idebug command with the remote debug parameters to start the debuggerinterface on the local system.
The irmtdbgj command has the following syntax:
irmtdbgj [irmtdbgj_options] [JVM_attach_parameters] [ui_daemon_parameters[class_name [class_parameters]]]
where irmtdbgj_options are zero or more of the following:
Parameter Description
-help Displays help for the irmtdbgj command.
-qquiet Suppresses console output.
-jvmargs=<jvm_arguments>
Specifies arguments passed to the JVM that will run the program you want todebug. If you specify more than one option, enclose the list of options in quotationmarks.
Using unsupported arguments will cause the debugger to exit. For a list ofsupported JVM arguments, see the related topic below.
Restriction: This option cannot be used when attaching to a running JVM. AnyJVM arguments must be specified when starting the JVM you want to attach to.
Use the JVM_attach_parameters if you want to attach the debugger to a runningJava Virtual Machine (JVM). You can attach to a JVM if you are starting a debugengine daemon or connecting to a debugger user interface daemon. Thejvm_attach_parameters are:
62 Distributed Debugger for OS/390

Parameter Description
-password=<agent_password>
Specifies the agent password.
This password is printed when you start your Java program using the java_g-debug command.
This parameter is required when attaching to a running JVM.
-host=<JVM_host>
Specifies the name or address of the machine where the JVM is running.
If the JVM is running on the same machine where the debug engine will run, use“localhost”.
Use the ui_daemon_parameters if you have started the debugger user interface as adaemon. As daemon, the debugger user interface listens on a port for a debuggerengine connection. Upon connecting, the debugger user interface starts and youcan begin debugging your program. The ui_daemon_parameters are:
Parameter Description
-qhost=<ui_daemon_host> Specifies the IP address or name of the machine where the user interface daemon isrunning.
This parameter is required when connecting to a debugger user interface daemon.
-qtitle=<ui_daemon_title> Specifies the title that will appear on the process tab
-quiport=<ui_daemon_port> Specifies the TCP/IP port used for the connection. The default port is 8001.
If you do not use the default port, specify the same port number you use here inthe -quiport parameter of the idebug command.
If you do not specify class_name when issuing the irmtdbgj command with theui_daemon_parameters, the debugger will prompt you for the required informationin the Load Program dialog of the debugger user interface.
Starting the debugger interface daemonAttaching to a running Java Virtual Machine
idebug commandSupported Java Virtual Machine arguments
Appendix A. Distributed Debugger commands 63

64 Distributed Debugger for OS/390

Appendix B. Supported expressions
Interpreted Java expressions supportedOnly expressions using the dot (.) operator are supported. The dot operator is usedto access instance and static variables within objects and classes.
Java program object expressions supported
Supported data types for Java program objectsYou can monitor an expression that includes a cast to any of the following types:v booleanv bytev charv shortv longv floatv doublev arraysv user defined classes
Supported expression operands for Java program objectsYou can monitor an expression that uses the following types of operands only:
Operand Definition
Variable A variable used in your program.
Constant The constant can be one of the following types:
v Fixed or floating-point constant within the rangessupported by the system the debuggee is running on.
v A character constant, enclosed in single quote marks(for example, ’x’)
Register Any of the processor registers that can be displayed inthe Registers Monitor. In the case of conflicting names,program variable names take precedence over registernames. For conversions that are done automaticallywhen the registers display in mixed-mode expressions,general-purpose registers are treated as unsignedarithmetic items with a length appropriate to the register.
Supported expression operators for Java program objectsYou can monitor an expression that uses the following operators only:
Operator Coded as
Subscripting a[b]
Logical not !a
Ones complement xa
© Copyright IBM Corp. 1999, 2000 65

Operator Coded as
Multiply a * b
Divide a / b
Modulo a % b
Add a + b
Subtract a - b
Left shift a << b
Right shift a >> b
Zero fill right shift a >>> b
Less than a < b
Greater than a > b
Less than or equal to a <= b
Greater than or equal to a >= b
Equal a == b
Not equal a != b
Bitwise AND a & b
Bitwise OR a | b
Bitwise exclusive OR a | b
Logical AND a && b
Logical OR a || b
C/C++ supported data typesYou can monitor an expression that includes a cast to any of the following types:v 8-bit signed charv 8-bit unsigned charv 16-bit signed integerv 16-bit unsigned integerv 32-bit signed integerv 32-bit unsigned integerv 64-bit signed integerv 64-bit unsigned integerv 32-bit floating-pointv 64-bit floating-pointv 80-bit floating-pointv Pointers
These data types include int, short, char and so on.
C/C++ supported expression operandsYou can monitor an expression that uses the following types of operands only:
Operand Definition
Variable A variable used in your program.
66 Distributed Debugger for OS/390

Operand Definition
Constant The constant can be one of the followingtypes:
v Fixed-point or floating-point constantwithin the ranges supported by thesystem the program you are debugging isrunning on.
v A string constant, enclosed in doublequotation marks (for example,“mystring”)
v A character constant, enclosed in singlequote marks (for example, ’x’)
If you monitor an enumerated variable, a comment appears to the right of thevalue. If the value of the variable matches one of the enumerated types, thecomment contains the name of the first enumerated type that matches the value ofthe variable. If the length of the enumerated name does not fit in the monitor, thecontents appear as an empty entry field.
The comment (empty or not) lets you distinguish between a valid enumeratedvalue and an invalid value. An invalid value does not have a comment to its right.
You cannot update an enumerated variable by entering an enumerated type. Youmust enter a value or expression. If the value is a valid enumerated value, thecomment to the right of it is updated.
You cannot look at variables that have been defined using the #definepreprocessor directive.
C/C++ supported expression operatorsYou can monitor an expression that uses the following operators only:
Operator Coded as
Global scope resolution ::a
Class or namespace scope resolution a::b
Subscripting a[b]
Member selection a.b or a->b
Size sizeof a or sizeof (type)
Logical not !a
Ones complement xa
Unary minus -a
Unary plus +a
Dereference *a
Type cast (type) a
Multiply a * b
Divide a / b
Modulo a % b
Add a + b
Appendix B. Supported expressions 67

Operator Coded as
Subtract a - b
Left shift a << b
Right shift a >> b
Less than a < b
Greater than a > b
Less than or equal to a <= b
Greater than or equal to a >= b
Equal a == b
Not equal a != b
Bitwise AND a & b
Bitwise OR a | b
Bitwise exclusive OR a | b
Logical AND a && b
Logical OR a || b
68 Distributed Debugger for OS/390

Appendix C. Environment variables
CLASSPATH environment variableRestriction: This section applies to debugging interpreted Java programs only. Itdoes not apply to debugging Java program objects.
The CLASSPATH environment variable tells the interpreted Java debug engine, aswell as the Java Virtual Machine and other Java applications, where to find yourclass libraries.
This variable must be set correctly for any of your Java applications to work.
Setting environment variables for the debugger
DER_DBG_PATH environment variableThe DER_DBG_PATH workstation environment variable is used to locate debugsource files on your client workstation. If your source code is stored in F:\SOURCEand F:\SOURCE\INCLUDE, you should set your DER_DBG_PATH variable asfollows:set DER_DBG_PATH=F:\SOURCE;F:\SOURCE\INCLUDE
Tip: Package names are taken into account when debugging interpreted Javaprograms. Only the path to the package, not the specific class you want to debugwithin that package, needs to be set. For example, if your Java packages are in/source, the full path for my.nifty.package.MyClass is/source/my/nifty/package/MyClass.java. Only /source should be added toDER_DBG_PATH in order to debug my.nifty.package.MyClass.
There is also an OS/390 DER_DBG_PATH environment variable which you can setto locate source files on your OS/390 system. If your source code is stored in/u/userid/source and /u/userid/source/include, you should set your OS/390DER_DBG_PATH variable as follows:set DER_DBG_PATH=/u/userid/source:/u/userid/source/include
If the source file is a PDS member, you may specify a PDS name in the OS/390DER_DBG_PATH variable and the member will be searched for in that PDS.
If the source file cannot be located in any of the OS/390 locations, the OS/390 filename is mapped as follows before proceeding with a search on the workstation:v A sequential data set name such as USER.PROJECT.SRC1.C is mapped to
.\user\project\src1.cv A PDS member name such as USER.PROJECT.CPP(PART1) is mapped to
.\user\project\part1.cppv A UNIX name such as /user/Project/Part1.cpp is mapped to
.\user\Project\Part1.cppv A UNIX name such as /com/acme/courses/computer/tutorial1.java is mapped
to .\com\acme\courses\computer\turorial1.java
© Copyright IBM Corp. 1999, 2000 69

If the source file cannot be found on the workstation a Source Filename dialogopens requesting the path name for the source file. The path name you enter issearched following the order described above.
Note: If you set the workstation DER_DBG_PATH environment variable, you mustset it before starting the Distributed Debugger user interface daemon. If you set theOS/390 DER_DBG_PATH environment variable, you must set it before invokingthe OS/390 program you wish to debug or before starting the interpreted Javadebug engine.
Setting environment variables for the debugger
Order of source file searching
70 Distributed Debugger for OS/390

Appendix D. Troubleshooting
Why the Distributed Debugger cannot find source files on theworkstation
You may not be able to open the source for an object, even though the code wascompiled with debug information, if the Distributed Debugger cannot find thesource code for it. When you start debugging such a program, or when executionlands in a part of the program that was compiled with debug information but theDistributed Debugger cannot find the source code for it, the Distributed Debuggeropens a Source Filename dialog. In this dialog you can enter the name of the file(HFS file, sequential data set, or PDS and member name) containing the sourcecode.
Another reason the source code might not display at your workstation is that youexpected the Distributed Debugger to look for source files on the workstation, buthave not downloaded the required source files, or have not told the DistributedDebugger where to find them.
If you want the Distributed Debugger to search for source files on the workstation,make sure that:v You have downloaded the necessary source files or mounted the necessary file
system as a Windows NT® drive using a remote file system such as NFS.v The DER_DBG_PATH environment variable on the workstation contains the
paths of all directories where such source files are stored. Ensure that you haveseparated entries with semicolons. For example, if you have files in directoriesunder F:\PRIVATE\SOURCE and G:\BUILD\SRC on your workstation, youshould set DER_DBG_PATH to:
F:\PRIVATE\SOURCE;G:\BUILD\SRC
Note: If you set the workstation DER_DBG_PATH environment variable, you mustset it before starting the Distributed Debugger user interface daemon. If you set theOS/390 DER_DBG_PATH environment variable, you must set it before invokingthe OS/390 program you wish to debug.
DER_DBG_PATH environment variableOrder of source file searching
Order of source file searchingRestriction: This section applies to debugging Java program objects only. It doesnot apply to debugging interpreted Java programs.
Debug Tool searches for source files in the following locations:1. Debug Tool will look for the source in the location specified at compile time
which is in the object code.2. If not found, Debug Tool will use the path set by the DER_DBG_PATH
environment variable on OS/390.3. If still not found, Debug Tool will use the locations specified by the Distributed
Debugger -qremotesource option.
© Copyright IBM Corp. 1999, 2000 71
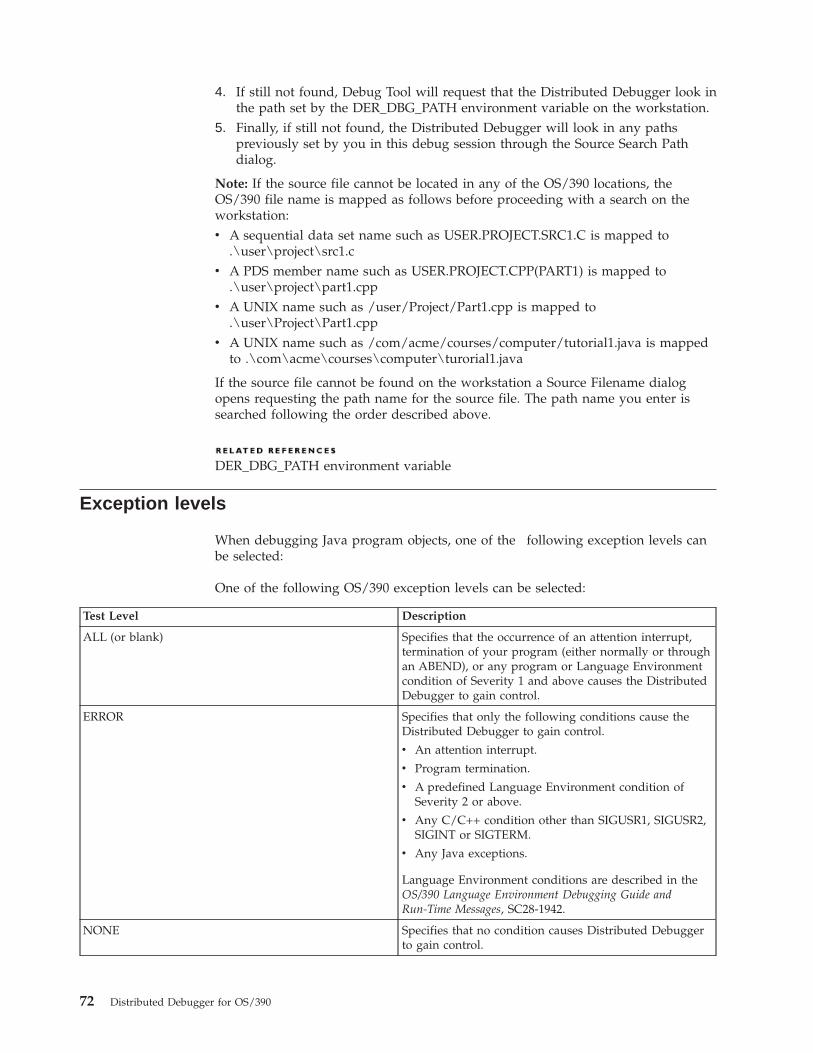
4. If still not found, Debug Tool will request that the Distributed Debugger look inthe path set by the DER_DBG_PATH environment variable on the workstation.
5. Finally, if still not found, the Distributed Debugger will look in any pathspreviously set by you in this debug session through the Source Search Pathdialog.
Note: If the source file cannot be located in any of the OS/390 locations, theOS/390 file name is mapped as follows before proceeding with a search on theworkstation:v A sequential data set name such as USER.PROJECT.SRC1.C is mapped to
.\user\project\src1.cv A PDS member name such as USER.PROJECT.CPP(PART1) is mapped to
.\user\project\part1.cppv A UNIX name such as /user/Project/Part1.cpp is mapped to
.\user\Project\Part1.cppv A UNIX name such as /com/acme/courses/computer/tutorial1.java is mapped
to .\com\acme\courses\computer\turorial1.java
If the source file cannot be found on the workstation a Source Filename dialogopens requesting the path name for the source file. The path name you enter issearched following the order described above.
DER_DBG_PATH environment variable
Exception levels
When debugging Java program objects, one of the following exception levels canbe selected:
One of the following OS/390 exception levels can be selected:
Test Level Description
ALL (or blank) Specifies that the occurrence of an attention interrupt,termination of your program (either normally or throughan ABEND), or any program or Language Environmentcondition of Severity 1 and above causes the DistributedDebugger to gain control.
ERROR Specifies that only the following conditions cause theDistributed Debugger to gain control.
v An attention interrupt.
v Program termination.
v A predefined Language Environment condition ofSeverity 2 or above.
v Any C/C++ condition other than SIGUSR1, SIGUSR2,SIGINT or SIGTERM.
v Any Java exceptions.
Language Environment conditions are described in theOS/390 Language Environment Debugging Guide andRun-Time Messages, SC28-1942.
NONE Specifies that no condition causes Distributed Debuggerto gain control.
72 Distributed Debugger for OS/390
When debugging interpreted Java programs, the debugger provides you a list ofexceptions types. You can select more than one of these exception types. Thedebugger will halt execution of your interpreted Java program if any of theselected exception types occur.
Selecting debugger recognized exceptions
Limits
Remote debug limitationsRemote debugging imposes the following limitations:v Browse only displays the file system on the local system. The file system on the
remote system cannot be displayed.
Distributed Debugger and Debug Tool
Interpreted Java debug limitationsLimitations exist in the JDK 1.1.X or lower that may cause problems whendebugging your interpreted Java classes. Be aware of the following limitations andproblems when debugging:v Console input is not accepted.v You cannot suspend, start, or stop threads.v Stepping behavior may be erratic when stepping into constructors, or when
stepping into or over SystemLoad library functions.v The debugger cannot halt an applet or application that has all of its threads
blocked.v You cannot modify the contents of monitored variables.v Breakpoints set on static initializers or static blocks will be ignored.v Breakpoints set on try statements are ignored.v Execution will not stop inside catch blocks for thrown errors.v The debugger will not notify the user when classes extending from
java.lang.Error are thrown. The debugger will notify the user when classesextending from java.lang.Exception are thrown.
v When debugging JAR files, the source code for classes contained in a JAR filemust be available outside of the JAR file.
v After exiting a program block, variables now out of scope may still be shown ina monitor.
v Debug-agent error messages may appear intermittently while debugging yourclasses.
v If you step into a class that has not been registered with the debugger, you mayreceive a “Cannot find source for null” message. If this happens, issue a stepreturn command to continue debugging. To avoid this problem, register theappropriate class source file or package containing the class source with thedebugger before you start debugging.
v When debugging remotely, communication between the debugger and theprogram being debugged may be terminated prematurely by the JVM.
Appendix D. Troubleshooting 73

74 Distributed Debugger for OS/390

Notices
Note to U.S. Government Users Restricted Rights — Use, duplication or disclosurerestricted by GSA ADP Schedule Contract with IBM Corp.
This information was developed for products and services offered in the U.S.A.IBM may not offer the products, services, or features discussed in this document inother countries. Consult your local IBM representative for information on theproducts and services currently available in your area. Any reference to an IBMproduct, program, or service is not intended to state or imply that only that IBMproduct, program, or service may be used. Any functionally equivalent product,program, or service that does not infringe any IBM intellectual property right maybe used instead. However, it is the user’s responsibility to evaluate and verify theoperation of any non-IBM product, program, or service.
IBM may have patents or pending patent applications covering subject matterdescribed in this document. The furnishing of this document does not give youany license to these patents. You can send license inquiries, in writing, to:
IBM Director of LicensingIBM CorporationNorth Castle DriveArmonk, NY 10504-1785U.S.A.
For license inquiries regarding double-byte (DBCS) information, contact the IBMIntellectual Property Department in your country or send inquiries, in writing, to:
IBM World Trade Asia CorporationLicensing2-31 Roppongi 3-chome, Minato-kuTokyo 106, Japan
The following paragraph does not apply to the United Kingdom or any othercountry where such provisions are inconsistent with local law:INTERNATIONAL BUSINESS MACHINES CORPORATION PROVIDES THISPUBLICATION “AS IS” WITHOUT WARRANTY OF ANY KIND, EITHEREXPRESS OR IMPLIED, INCLUDING, BUT NOT LIMITED TO, THE IMPLIEDWARRANTIES OR CONDITIONS OF NON-INFRINGEMENT,MERCHANTABILITY OR FITNESS FOR A PARTICULAR PURPOSE. Some statesdo not allow disclaimer of express or implied warranties in certain transactions,therefore, this statement may not apply to you.
This information could include technical inaccuracies or typographical errors.Changes are periodically made to the information herein; these changes will be
© Copyright IBM Corp. 1999, 2000 75

incorporated in new editions of the publication. IBM may make improvementsand/or changes in the product(s) and/or the program(s) described in thispublication at any time without notice.
Any references in this information to non-IBM Web sites are provided forconvenience only and do not in any manner serve as an endorsement of those Websites. The materials at those Web sites are not part of the materials for this IBMproduct and use of those Web sites is at your own risk.
IBM may use or distribute any of the information you supply in any way itbelieves appropriate without incurring any obligation to you.
Licensees of this program who wish to have information about it for the purposeof enabling: (i) the exchange of information between independently createdprograms and other programs (including this one) and (ii) the mutual use of theinformation which has been exchanged, should contact:
Lab DirectorIBM Canada Ltd.1150 Eglinton Avenue EastToronto, Ontario M3C 1H7Canada
Such information may be available, subject to appropriate terms and conditions,including in some cases, payment of a fee.
The licensed program described in this document and all licensed materialavailable for it are provided by IBM under terms of the IBM Customer Agreement,IBM International Program License Agreement or any equivalent agreementbetween us.
Information concerning non-IBM products was obtained from the suppliers ofthose products, their published announcements or other publicly available sources.IBM has not tested those products and cannot confirm the accuracy ofperformance, compatibility or any other claims related to non-IBM products.Questions on the capabilities of non-IBM products should be addressed to thesuppliers of those products.
This information contains examples of data and reports used in daily businessoperations. To illustrate them as completely as possible, the examples may includethe names of individuals, companies, brands, and products. All of these names arefictitious and any similarity to the names and addresses used by an actual businessenterprise is entirely coincidental.
COPYRIGHT LICENSE:
This information contains sample application programs in source language, whichillustrates programming techniques on various operating platforms. You may copy,modify, and distribute these sample programs in any form without payment toIBM, for the purposes of developing, using, marketing or distributing applicationprograms conforming to the application programming interface for the operatingplatform for which the sample programs are written. These examples have not
76 Distributed Debugger for OS/390

been thoroughly tested under all conditions. IBM, therefore, cannot guarantee orimply reliability, serviceability, or function of these programs. You may copy,modify, and distribute these sample programs in any form without payment toIBM for the purposes of developing, using, marketing, or distributing applicationprograms conforming to IBM’s application programming interfaces.
Each copy or any portion of these sample programs or any derivative work, mustinclude a copyright notice as follows:
© (your company name) (year). Portions of this code are derived from IBM Corp.Sample Programs. © Copyright IBM Corp. 1997, 2000. All rights reserved.
Notices 77

78 Distributed Debugger for OS/390

Programming interface information
Programming interface information is intended to help you create applicationsoftware using this program.
General-use programming interfaces allow the customer to write applicationsoftware that obtain the services of this program’s tools.
However, this information may also contain diagnosis, modification, and tuninginformation. Diagnosis, modification and tuning information is provided to helpyou debug your application software.
Warning: Do not use this diagnosis, modification, and tuning information as aprogramming interface because it is subject to change.
© Copyright IBM Corp. 1999, 2000 79

80 Distributed Debugger for OS/390

Trademarks and service marks
The following terms are trademarks of International Business MachinesCorporation in the United States, or other countries, or both:v AIXv AS/400v DB2v CICSv CICS/ESAv IBMv IMSv Language Environmentv MQSeriesv Network Stationv OS/2v OS/390v OS/400v RS/6000v S/390v VisualAgev VTAMv WebSphere
Lotus, Lotus Notes and Domino are trademarks or registered trademarks of LotusDevelopment Corporation in the United States, or other countries, or both.
Tivoli Enterprise Console and Tivoli Module Designer are trademarks of TivoliSystems Inc. in the United States, or other countries, or both.
Encina and DCE Encina Lightweight Client are trademarks of Transarc Corporationin the United States, or other countries, or both.
Java and all Java-based trademarks and logos are trademarks or registeredtrademarks of Sun Microsystems, Inc. in the United States and other countries.
ActiveX, Microsoft, SourceSafe, Visual C++, Visual SourceSafe, Windows, WindowsNT, Win32, Win32s and the Windows logo are trademarks or registered trademarksof Microsoft Corporation in the United States, or other countries, or both.
UNIX is a registered trademark in the United States and other countries licensedexclusively through X/Open Company Limited.
Intel and Pentium are trademarks of Intel Corporation in the United States, orother countries, or both.
Other company, product, and service names, which may be denoted by a doubleasterisk(**), may be trademarks or service marks of others.
© Copyright IBM Corp. 1999, 2000 81