Embed Size (px)
Citation preview

Intel® DebuggerCommand Reference
May 2009
Document Number: 319698-009US
World Wide Web: http://www.intel.com

2
Disclaimer and Legal InformationINFORMATION IN THIS DOCUMENT IS PROVIDED IN CONNECTION WITH INTEL® PRODUCTS. NO LICENSE, EXPRESS OR IMPLIED, BY ESTOPPEL OR OTHERWISE, TO ANY INTELLECTUAL PROPERTY RIGHTS IS GRANTED BY THIS DOCUMENT. EXCEPT AS PROVIDED IN INTEL’S TERMS AND CONDITIONS OF SALE FOR SUCH PRODUCTS, INTEL ASSUMES NO LIABILITY WHATSOEVER, AND INTEL DISCLAIMS ANY EXPRESS OR IMPLIED WARRANTY, RELATING TO SALE AND/OR USE OF INTEL PRODUCTS INCLUDING LIABILITY OR WARRANTIES RELATING TO FITNESS FOR A PARTICULAR PURPOSE, MERCHANTABILITY, OR INFRINGEMENT OF ANY PATENT, COPYRIGHT OR OTHER INTELLECTUAL PROPERTY RIGHT.
UNLESS OTHERWISE AGREED IN WRITING BY INTEL, THE INTEL PRODUCTS ARE NOT DESIGNED NOR INTENDED FOR ANY APPLICATION IN WHICH THE FAILURE OF THE INTEL PRODUCT COULD CREATE A SITUATION WHERE PERSONAL INJURY OR DEATH MAY OCCUR.
Intel may make changes to specifications and product descriptions at any time, without notice. Designers must not rely on the absence or characteristics of any features or instructions marked reserved or undefined. Intel reserves these for future definition and shall have no responsibility whatsoever for conflicts or incompatibilities arising from future changes to them. The information here is subject to change without notice. Do not finalize a design with this information.
The products described in this document may contain design defects or errors known as errata which may cause the product to deviate from published specifications. Current characterized errata are available on request.
Contact your local Intel sales office or your distributor to obtain the latest specifications and before placing your product order.
Copies of documents which have an order number and are referenced in this document, or other Intel literature, may be obtained by calling 1-800-548-4725, or by visiting Intel’s Web Site.
Intel processor numbers are not a measure of performance. Processor numbers differentiate features within each processor family, not across different processor families. See http://www.intel.com/products/processor_number for details.
BunnyPeople, Celeron, Celeron Inside, Centrino, Centrino Atom, Centrino Atom Inside, Centrino Inside, Centrino logo, Core Inside, FlashFile, i960, InstantIP, Intel, Intel logo, Intel386, Intel486, IntelDX2, IntelDX4, IntelSX2, Intel Atom, Intel Atom Inside, Intel Core, Intel Inside, Intel Inside logo, Intel. Leap ahead., Intel. Leap ahead. logo, Intel NetBurst, Intel NetMerge, Intel NetStructure, Intel SingleDriver, Intel SpeedStep, Intel StrataFlash, Intel Viiv, Intel vPro, Intel XScale, Itanium, Itanium Inside, MCS, MMX, Oplus, OverDrive, PDCharm, Pentium, Pentium Inside, skoool, Sound Mark, The Journey Inside, Viiv Inside, vPro Inside, VTune, Xeon, and Xeon Inside are trademarks of Intel Corporation in the U.S. and other countries.
* Other names and brands may be claimed as the property of others.

3
Copyright © 2001-2009, Intel Corporation. All rights reserved.
Portions Copyright © 2001, Hewlett-Packard Development Company, L.P.

5
Welcome to the Intel® Debugger 1Introducing the Intel® Debugger
The Intel® Debugger (IDB) is a full-featured symbolic source code application debugger that helps programmers:
• debug programs
• disassemble and examine machine code and examine machine register values
• debug programs with shared libraries
• debug multithreaded applications
A GUI and command-line interface are available on systems based on IA-32 or Intel® 64 architecture running Linux* OS.
A command-line interface is available on the following systems:
• Systems based on the IA-32 architecture running Mac OS* X
• Systems based on the Intel® 64 architecture running Mac OS X
• Systems based on IA-64 architecture running Linux OS
The debugger features include:
• C/C++ language support
• Fortran language support including Fortran 95/90
• Assembler language support
• Access to the registers your application accesses
• Bitfield editor to modify registers
• MMU support

6
1 Intel® Debugger Command Reference
The Intel® Debugger facilitates developing parallelism into applications based on the parallel C++ language extensions of the Intel® C++ compiler or the Intel® OpenMP* runtime environment. The Intel® Debugger offers the following parallel debugging features:
• Thread data sharing analysis, to detect accesses to identical data elements from different threads.
NOTE. Thread data sharing detection is limited to applications that use the parallel language extensions of the Intel® C++ Compiler. To analyze threading errors in other applications, it is recommended to use the Intel® Thread Checker. The Intel® Thread Checker includes a patented advanced error detection engine for finding data races and deadlocks.
• A smart breakpoint to stop program execution on re-entrant function calls from different threads.
• A mode for simulating serial execution of OpenMP* code, which is useful for debugging OpenMP code. You can enable or disable the creation of additional worker threads in OpenMP parallel loops dynamically.
• A set of OpenMP runtime information views for advanced OpenMP program state analysis.
• An SSE (Streaming SIMD Extensions) register view with extensive formatting and editing options for debugging parallel data using the SIMD (Single Instruction, Multiple Data) instruction set.
NOTE. The Intel Debugger is designed for and tested on Intel processors. Incompatible or proprietary instructions supported by non-Intel processors might cause the analysis capabilities of this product to function incorrectly. Attempts to analyze code not supported by Intel processors could result in failures in this product.
See AlsoRelated InformationNotational Conventions
Related InformationThe Release Notes contain product features or changes in the product that may not be documented elsewhere. Release Notes are included in the product installation.

-7
Notational Conventions Convention Explanation Example
Italic Italic is used for emphasis,the introduction of new terms,denotation of terms,placeholders,titles of manuals.
Do not close the project without saving.The filename consists of the basename and the extension.The expression and/or denotes an inclusive choice between two or more items.The bitmap is width pixels wide and len pixels high.For more information, refer to the Intel® Linker Manual.
Bold Text in boldface denotes elements of the graphical user interface.
The Cancel button of the Start dialog box
Monospace Monospace indicates filenames,directory names and pathnames,commands and command-line options,function names, methods, classes, data structures in body text,source code.
ippsapi.h\alt\includeecl -O2
Use the CreateObj() function to …
printf("hello, world\n");
Monospace italic
Italic monospace indicates source code parameters, arguments, or other placeholders.
ippiMalloc( int width, int* pStep);

-8
Intel® Debugger Command Reference
Monospace bold
Bold monospace indicates what you type as input on a command line
[c:] dir
or emphasizes parts of source code.
x = ( h > 0 ? sizeof(m) : 0xF ) + min;
[ ] Items enclosed in brackets are optional.
Fa[c]Indicates Fa or Fac.
{ | } Braces and vertical bars indicate the choice of one item from a selection of two or more items.
X{A | B | C}Indicates one of XA, XB, and XC.
"[" "]" "{""}" "|"
Writing a metacharacter in quotation marks negates the syntactical meaning stated above; the character is taken as a literal.
"[" X "]" [ Y ]denotes the letter X enclosed in brackets, optionally followed by the letter Y.
… The ellipsis indicates that the previous item can be repeated several times.
filename …Indicates that one or more filenames can be specified.
,… The ellipsis preceded by a comma indicates that the previous item can be repeated several times, separated by commas.
word ,…Indicates that one or more words can be specified. If more than one word is specified, the words are comma-separated.
> Indicates a menu item inside a menu.
File > Closeindicates to select the Close item from the File menu.
Convention Explanation Example

9
Before You Begin 2Preparing the Debugging Environment
When you start the debugger, it captures the environment of the shell that launches the debugger. When you debug an MPI application, the debugger uses the environment of the leaf debugger's shell, capturing this environment when you launch the debugger. The shell’s environment variables include PATH, LD_LIBRARY_PATH, SHELL and HOME.
To modify the captured enviroment, use the set environment command. To display the captured environment, use the show environment command.
Changes you make to the captured environment only affect debuggees that are started after you make the change. They have no effect on the debugger itself until you restart the debugger.
To see the list of environment variables, use the printenv shell command before starting the debugger.
See Alsoset environment (gdb mode only)show environment (gdb mode only)
Configuring the Debugger
Configuring Default Startup Actions Using Initialization FilesYou can use an initialization file to execute specific commands when the debugger starts up. For example, you can create an initialization file to load a debuggee as soon as the debugger starts.
10
2 Intel® Debugger Command Reference
You can have an initialization file in your home directory as well as in your project directory. You can connect to the target in the initialization file in your home directory, and use the project initialization file to open a specific executable file and set a breakpoint.
When you start the debugger, it reads .gdbinit. The debugger first looks for the initialization file in your home directory, and then in the current directory.
ExampleThe following .gdbinit file is stored in the project directory. It does the following:
1. Opens the executable app_name:
idb file app_name
2. Sets a breakpoint at main:
break main
3. Runs app_name:
run
Here is the full sample .gdbinit file:
file app_name
break main
run
How the Debugger Finds Source FilesThe debugger searches for a source file (dir_name/base_name) using the following algorithm:
1. If dir_name is mapped to another source directory (mapped_dir_name), look for mapped_dir_name/base_name.
2. If Step 1 fails to find a readable file:
a. Case 1: If dir_name is absolute, look for dir_name/base_name.
b. Case 2: If dir_name is relative, for each entry use_dir in use_list, look for use_dir/dir_name/base_name. The debugger attempts to use the directories in use_list in the order in which they appear.
3. If Step 2 fails, for each entry use_dir in use_list, look for use_dir/base_name. The debugger attempts to use the directories in use_list in the order in which they appear.
4. If Step 3 fails, the debugger cannot find any source file.
The debugger uses the first-found readable file as the source file.

Before You Begin 2
11
See AlsoSpecifying Source Directories
Specifying Source DirectoriesYou can change the source path information that the symbol file specifies. The debugger assumes that all source files are stored in the same directory as they were at compile time.
See Alsodirectory (gdb mode only)use (idb mode only)
Specifying Source Path Substitution RulesThe debugger assumes that all source files are stored in the same directory as they were at compile time. If the sources are placed in different directories, you can add a source path substitution rule. This rule will replace the source directory paths automatically.
TIP. To modify a source path substitution rule, select it and click the Modify… button.
See AlsoSpecifying Source Directoriesmap source directory (idb mode only)set substitute-path (gdb mode only)
TIP. To modify a shared library path substitution rule, select it and click the Modify… button.
Preparing a Program for Debugging
Preparing Your Source CodeYou do not need to make changes to the source code to debug the program. However, it is recommended to make the following items part of your source code:

12
2 Intel® Debugger Command Reference
— An initial stall point, if you cannot stop the process easily from within the debugger.
— Assertions sprinkled liberally through the sources to help locate errors early.
See AlsoPreparing the Compiler and Linker EnvironmentDebugging Optimized Code
Preparing the Compiler and Linker EnvironmentDebugging information is put into .o files by compilers. The level and format of information is controlled by compiler options.
With the Intel® C++ or Fortran Compiler, use the -g option. For example:
% icc -g hello.c
…
% icpc -g hello.cpp
…
With the GNU* Compiler Collection, (GCC) use the -g option. On some older versions of GCC, this option might generate DWARF-1. If so, use the -gdwarf-2 option. For example:
% gcc -gdwarf-2 hello.c
…
% g++ -gdwarf-2 hello.cpp
…
See your compiler's documentation for more details.
The debugging information is propagated into the a.out (executable) or .so (shared library) by the ld command.
If you are debugging optimized code, using -g automatically adds -O0.
See the Debugging Optimized Code section of this manual and the appropriate compiler documentation for information about -g and related extended debug options and their relationship to optimization.
See AlsoPreparing Your Source CodeDebugging Optimized Code

Before You Begin 2
13
Debugging Optimized CodeThe debugger can help debug an optimized program that is compiled with the -g option. However, some of the information about the program may be inaccurate. In particular, the locations and values of variables are often not correctly reported, because the common forms of debug information do not fully represent the complexity of the optimizations provided by the -O1, -O2, -O3 and other optimization options.
To avoid this limitation, compile the program with an Intel® compiler, specifying both the -g and -debug extended options, in addition to the desired -O1, -O2 or -O3 optimization option. This causes the generation of more advanced, but less commonly supported debug information, which enables the following:
• Giving correct locations and values for variables, even if they are in registers or at different locations at different times. Note the following:
— Some variables may be optimized away or converted to data of a different type, or their location may not be recorded at all points in the program. In these cases, printing a variable will yield <no value>.
— Otherwise, the values and locations will be correct, though registers have no address, so a print &i command may print a warning.
— Most variables and arguments are undefined during function prologues and epilogues, though a break main command will usually stop the program after the prologue.
• Shows inline functions in stack traces, identified by the inline keyword. Note the following:
— Only the function at the top of the stack and functions that make regular (non-inline) calls show instruction pointers, because other functions share a hardware-defined stack frame with the inline functions that they called.
— The return instruction will only return control to a function that made a non-inline call using a call instruction, because inline calls have no defined return address.
— The up, down, and call commands work as usual.
• Allows you to set breakpoints in inlined functions.
The following limitation exists:
Optimization often causes the instructions for a source line to be generated in an order that does not match the order of the source; the instructions for a line may be mixed in with instructions from other source lines as well. When stepping through such code, the program will tend not to stop at each source line in turn, but rather it will stop each time a change in source line occurs.
See AlsoPreparing Your Source Code

14
2 Intel® Debugger Command Reference
Preparing the Compiler and Linker Environment

15
Starting and Exiting the Debugger 3Starting the Debugger
On systems based on IA-32 or Intel® 64 architecture running Linux* OS, the debugger runs in GUI mode by default. You can also start the debugger in command line mode on these systems by specifying idbc instead of idb in the command line.
On all other systems, the debugger only runs in command line mode.
NOTE. The idb command is enabled when you run the script that sets up the compiler environment as described in the Getting Started document for the compiler.
To start the debugger:
Enter the following command in a shell:
idb
The debugger starts running.
See Also Exiting the Debugger
Starting the Debugger in Command Line ModeThe following information applies only to systems based on IA-32 or Intel® 64 architecture running Linux* OS.
By default, the debugger starts in GUI mode. You can also run the debugger without the GUI, in command line mode.

16
3 Intel® Debugger Command Reference
NOTE. The idbc command is enabled when you run the script that sets up the compiler environment as described in the Getting Started document for the compiler.
To start the debugger in command line mode, enter the following in a shell:
idbc
The debugger starts running.
To view a list of options for this command, enter the following command in a shell:
idbc --help
See Also Exiting the Debugger
Exiting the DebuggerTo exit the debugger:
• Select File > Exit.
• Enter quit.
The debugger and all output files are closed.
See Alsoquit

17
Session Handling 4About Session Handling
You can save information about a debugging session and subsequently restore it.
When you save a session, the debugger saves the following information.
• Source directory paths
• Substitute source directory paths
• Shared library substitution paths
• Environment variables that you changed for a debug session
• Debugger variables
• Debuggee arguments
• Breakpoints and watchpoints
In addition to enabling you to manually save a session, the debugger implicitly uses the following elements of the previous session's settings when you open the same debuggee without restarting the debugger:
• code breakpoints
• data breakpoints
• environment variables
This is true whether you open the debuggee with the GUI or the GDB mode file command. You can even use a recompiled debuggee, as long as its name and path are the same.
The debugger does not implicitly use these settings when you detach and reattach to the debuggee process, because it doesn’t recognize whether the process is the same debuggee.

18
4 Intel® Debugger Command Reference
See AlsoReloading a Debuggee Without Previous Session SettingsSaving a SessionRestoring a SessionAbout Session Handling in Command-line Mode
Reloading a Debuggee Without Previous Session Settings
Because the debugger implicitly uses the previous session’s breakpoints, watchpoints and environment variables, when you want to reload and restart the debuggee executable without these settings, you must explicitly remove them.
To restart debugging an executable you are already debugging without any of the existing settings:
1. Load the executable.
2. Run the executable.
See AlsoAbout Session Handling
Saving a SessionTo save a session:
1. Select File > Save Session….
The Save Session dialog box appears.
2. In the Name field, enter a name for the session file.
3. Click OK.
The debugger saves the session information.
Alternatively, you can use the idb session save command as follows:
idb session save session_file
See Alsoidb session save (gdb mode only)

Session Handling 4
19
Restoring a SessionTo restore a saved session:
1. Select File > Load Session….
The Load Session dialog box appears.
2. Select the session file you want to restore.
Alternatively, you can use the idb session save command as follows:
idb session restore session_file
See Alsoidb session restore (gdb mode only)
About Session Handling in Command-line ModeThe debugger variable $sessiondir is set to the directory in which the debugger saves session files:
• $HOME/.idb/sessions/ in command line mode.
• $PWD/workspace/sessions/ in GUI mode, where $PWD is the working directory in which the GUI was started.
You cannot change this directory.
To identify this directory, use the following command:
print $sessiondir
See AlsoSaving a SessionRestoring a Session

21
Debugging Parallel Applications 5Working With Thread and Process Sets
Working With Thread and Process Sets: OverviewWhen many processes are running, it can be annoying or impractical to enumerate all the processes when you need to focus on specific processes.
When defining stopping threads and thread filters for code breakpoints, you need to define sets of threads.
You can specify a set of processes or threads in a compact form, where a set includes one or more ranges. You can execute normal operations on process sets, and debugger variables can store both sets and ranges for manipulation, reference, or inspection.
See AlsoProcess and Thread Set NotationStoring Process and Thread Sets in Debugger VariablesProcess and Thread Set OperationsChanging the Current Process SetPredefined Thread SetsViewing Threads and Thread SetsSynchronizing a Set of Threads
Process and Thread Set NotationThe operating system assigns each process a process ID (pid). The debugger assigns each currently running thread an ID.

22
5 Intel® Debugger Command Reference
The debugger does not reuse thread IDs. For example, suppose there are five threads running, with IDs from 1-5. If you kill thread 3, and then create a new one, the new one has the ID 6, not 3.
NOTE. Brackets ([]) are part of the process set syntax, so this topic shows optional syntactic items enclosed in curly braces ({}).
Specifying Process and Thread Sets
A set of processes or threads comprises one or more contiguous ranges of process or thread IDs, separated by commas.
To specify a process set, use the following notation:
[ range {,…} ]
To specify a thread set, use the following notation:
t:[ range {,…} ]
You can express an empty set with empty brackets:
[ ]
You can specify process and thread sets using expressions, wildcards and by merging thread sets.
ExampleThe following example contains the first three threads in the current process.
t:[1,2,3]
The following example specifies a thread set using an expression:
t:[1:3+foo()]
The following example specifies a merged thread set:
t:[*] - t:[1]
The following example contains all the threads in the current process.
t:[*]
The following example contains all the threads in the current process except threads 1 and 6.
t:[2:5, 7:]
See AlsoWorking With Thread and Process Sets: OverviewStoring Process and Thread Sets in Debugger Variables

Debugging Parallel Applications 5
23
Process and Thread Set OperationsChanging the Current Process SetPredefined Thread SetsViewing Threads and Thread SetsSynchronizing a Set of Threads
Specifying a Range of Processes or Threads
To specify a consecutive range of processes or threads, use one of the following notations:
NOTE. The debugger ignores a range whose lower bound is greater than its upper bound.
Both the lower bound and the upper bound are optional, so you can specify ranges as follows:
* Specifies all processes or threads.
expression If expression evaluates to, or can be coerced into an integer p, then the set contains the thread or process with ID p only.
If expression evaluates to a range r, then the set is the same as r.
{ expression } : { expression }
Specifies a contiguous range of processes or threads.
For example, [10:12] specifies the processes associated with pids 10, 11, and 12, while t:[10:12] specifies the threads with IDs 10, 11, and 12.
:n All processes or threads whose ID is no greater than n.
For example, [:5] refers to all processes whose pid is less than or equal to 5.
n: All processes or threads whose pid is no less than n.
For example, t:[20:] refers to all processes whose ID is greater than or equal to 20.
: All processes or threads.

24
5 Intel® Debugger Command Reference
Storing Process and Thread Sets in Debugger VariablesYou can store process and thread sets in debugger variables using the set command. For example:
(idb) set $set1 = [:7, 10, 15:20, 30:]
(idb) print $set1
[:7, 10, 15:20, 30:]
You can use the print command and show process set commands to inspect the process set stored in a debugger variable.
If you do not specify the set name, or if you specify all, the debugger displays all the process sets that are currently stored in debugger variables, as the continued example shows:
(idb) set $set2 = [8:9, 5:2, 22:27]
‘5:2’ is not a legal process range. Ignored.
(idb) show process set $set2
$set2 = [8:9, 22:27]
(idb) show process set *
$set1 = [:7, 10, 15:20, 30:]
$set2 = [8:9, 22:27]
The following example sets a variable, $myset2, to a thread set that includes threads 3, 10-20, 50 and the value of $myset1.
(idb) set $myset2 = t:[3, 10:20, 50:] + $myset1
See AlsoAbout Debugger VariablesWorking With Thread and Process Sets: OverviewProcess and Thread Set NotationProcess and Thread Set OperationsChanging the Current Process SetPredefined Thread SetsViewing Threads and Thread Setsprintset (idb mode only)show process set

Debugging Parallel Applications 5
25
Process and Thread Set OperationsYou can use the following operations on process and thread sets:
ExampleThe following example demonstrates these three operations:
(idb) set $set1 = [:10, 15:18, 20:]
(idb) set $set2 = [10:16, 19]
(idb) set $set3 = $set1 + $set2
(idb) print $set3
[*]
(idb) print $set3 - $set2
[:9, 17:18, 20:]
(idb) print -$set2
[:9, 17:18, 20:]
Predefined Thread SetsBy default, the debugger includes the following set of debugger variables that enables you to easily access several thread sets. You can use these variables to define your own thread sets:
Table 5-1 Set Operators
Operation Represents Action
+ Set union Takes two sets S1 and S2 and returns a set whose elements are either in S1 or in S2.
- Difference Takes two sets S1 and S2 and returns a set whose elements are in S1 but not in S2.
unary - Negation Takes a single set S and returns the difference of [*] and S.
$allthreads All existing debuggee threads.

26
5 Intel® Debugger Command Reference
See AlsoWorking With Thread and Process Sets: OverviewProcess and Thread Set NotationStoring Process and Thread Sets in Debugger VariablesProcess and Thread Set OperationsChanging the Current Process SetViewing Threads and Thread Setsthread
Viewing Threads and Thread SetsTo view the contents of a thread set:
Use the info threads command.
See AlsoPredefined Thread Setsinfo threads (gdb mode only)
$currentlockstepthreads The threads that have the same program counter as the current thread.
$currentopenmpteam This does not apply to Mac OS* X
In OpenMP*, a parallel region creates a thread team. When the current thread is a member of a thread team, then $currentopenmpteam is set to all the threads that are in the same innermost team as the current thread.
$currentthread The current thread. When an event occurs, the debugger sets the current thread to the eventing thread.
To make a thread the current thread, double-click it in the Threads window or use the thread command.
$frozenthreads The threads that are currently frozen.
$lasteventingthread The thread that triggered the last debug event. A debug event is a breakpoint, syncpoint, signal raising or exception.
$uninterruptedthreads The threads that are marked as uninterrupted.

Debugging Parallel Applications 5
27
Synchronizing a Set of ThreadsUse thread syncpoints to synchronize a set of threads. When any thread in a thread set reaches a thread syncpoint, the debugger holds that thread, ignoring any attempt to step or continue execution, until all other threads in the thread set reach the thread syncpoint. When all threads in the thread set reach the thread syncpoint, they remain stopped until you continue the process.
If you manually stop execution before all threads in the thread set have reached the thread syncpoint, the debugger continues to hold all threads in the thread set until all of them reach the thread syncpoint.
To synchronize a set of threads:
Set a thread syncpoint.
See AlsoProcess and Thread Set Notationidb synchronize (gdb mode only)
Changing the Current Process SetYou can change the current process set using the focus command.
See Alsofocus (idb mode only)
Debugging Multi-Threaded Applications
Finding Bugs in OpenMP* and Serial CodeThis topic does not apply to Mac OS*
To determine whether a bug is caused by concurrency or whether it occurs within an algorithm, it is useful to serialize execution for OpenMP* parallel code regions and to restrict execution of these code regions to a single thread per region. You can serialize the code regions dynamically, so you do not need to recompile or restart the OpenMP* application.

28
5 Intel® Debugger Command Reference
NOTE. When you enable serialization while the program is executing a parallel region, this region is not serialized — only subsequent regions are. When you disable serialization, only regions subsequent to the current location are set back to parallel. To serialize a selected region, it is useful to set breakpoints before and after the region. This helps you to enable serialization before the selected region is executed, and disable it before other parallel regions are executed. With this selective serialization, the rest of the application can remain parallel, which reduces execution time.
To serialize an OpenMP* parallel region:
1. Go to the code region you want to serialize.
2. Set a breakpoint at the line preceding the region and another breakpoint at the line following the region.
This step helps you to serialize this particular code region.
3. Run or rerun the application.
The application stops at the first breakpoint.
4. Enable serialization: Enter idb set openmp-serialization on.
5. Continue debugging.
The application stops at the next breakpoint. Only a single thread executed the region.
6. Disable serialization: Enter idb set openmp-serialization off.
All subsequent OpenMP* parallel regions are executed by multiple threads until you enable serialization again.
NOTE. You must enable serialization at the first breakpoint and disable serialization at the second breakpoint each time you want to run this same region serially.
See Also idb set openmp-serialization (gdb mode only)idb show openmp-serialization (gdb mode only)
Viewing OpenMP* InformationThis topic does not apply to Mac OS* X

Debugging Parallel Applications 5
29
The debugger enables you to view the following information about an OpenMP application:
Detecting Thread Data Sharing EventsMultiple threads accessing the same data element can cause intermittent data corruption issues. With the Intel® Debugger, you can detect and analyze these thread data sharing events as part of a normal debugging session.
To detect thread data sharing events:
1. Enter the following sequence of commands:
a. (idb) idb sharing onThis command enables detection of data sharing events.
b. (idb) idb sharing stop onThis command stops the debuggee whenever a data sharing event occurs. This behavior is on by default, if you haven’t specified idb sharing stop off, then you can skip this step.
c. (idb) run
d. (idb) idb sharing event expandThis command displays detailed information for data sharing detection events.
The debugger executes your instrumented application and stops it when a data sharing event occurs. All thread data sharing events that occur during program execution appear when you enter idb sharing event expand.
NOTE. If you do not want the application to stop at a data sharing event, enter idb sharing stop off.
Table 5-2 Viewing OpenMP* Information
Information Use this command
threads idb info thread (gdb mode only)
tasks idb info task (gdb mode only)
barriers idb info barrier (gdb mode only)
taskwaits idb info taskwait (gdb mode only)
locks idb info lock (gdb mode only)
teams idb info team (gdb mode only)
parent/child relationship idb info openmp thread tree (gdb mode only)

30
5 Intel® Debugger Command Reference
See Also Excluding Thread Data Sharing Events from DetectionPreparing the Debugging Environmentidb sharing (gdb mode only)idb sharing stop (gdb mode only)idb sharing event expand (gdb mode only)
Excluding Thread Data Sharing Events from DetectionIt can be useful to prevent the debugger from detecting particular thread data sharing events, such as when the event displayed is a false positive result. You can filter the thread data sharing analysis for different access types and exclude them from further detection.
To exclude data sharing events from further detection:
1. Enter one of the following commands:
— idb sharing filter add file filename
This command tells the debugger to ignore data sharing events in the named file.
— idb sharing filter add function function_name
This command tells the debugger to ignore data sharing events in the named function.
— idb sharing filter add range start_address, end_address
This command tells the debugger to ignore data sharing events in the address range you specify.
— idb sharing filter add variable variable [, size]
This command tells the debugger to ignore data sharing events on the specified variable.
Intel® Debuggeridb sharing filter add file (gdb mode only)idb sharing filter add function (gdb mode only)idb sharing filter add range (gdb mode only)idb sharing filter add variable (gdb mode only)
A re-entrant call occurs when more than one thread accesses an expression at the same time. You can have the Intel® Debugger break the code execution at these re-entrant calls.
To break execution on a re-entrant call, enter the following command:
(idb) idb reentrancy specifier
This command enables re-entrancy detection on a line number, function or address.
When reentrancy detection is enabled, the debugger breaks code execution at these re-entrant calls.
Debugging Parallel Applications 5
31
See Also idb reentrancy (gdb mode only)
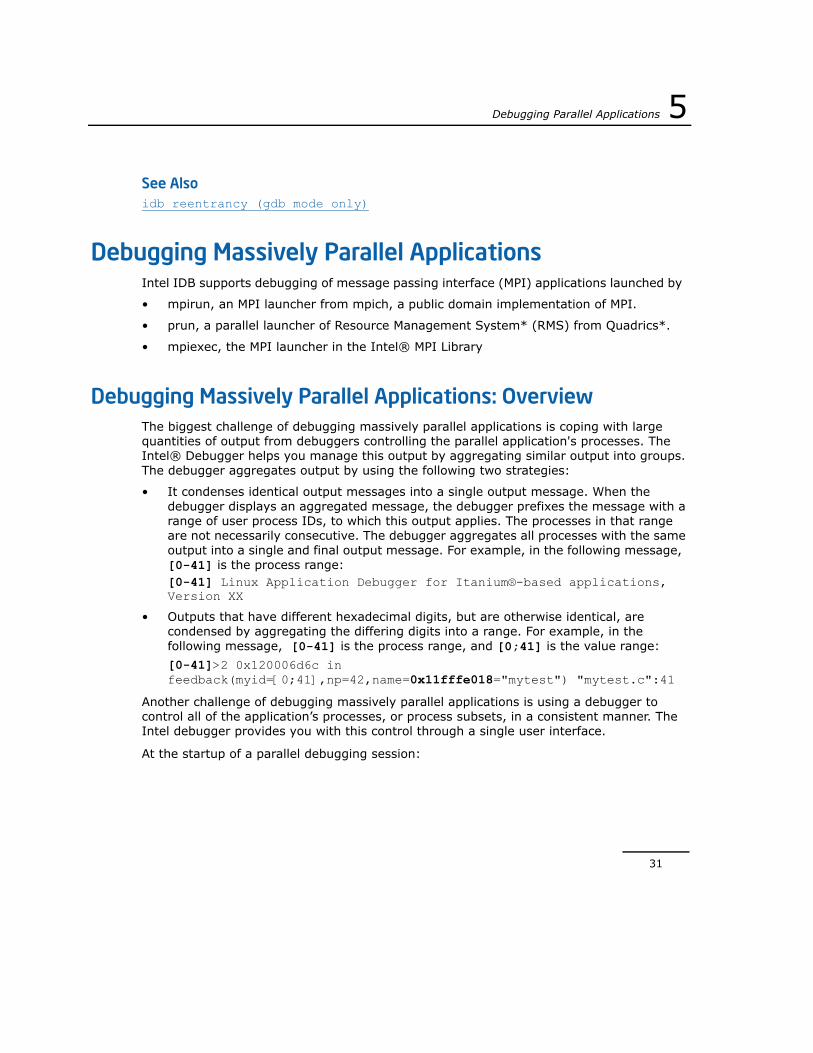
Debugging Massively Parallel ApplicationsIntel IDB supports debugging of message passing interface (MPI) applications launched by
• mpirun, an MPI launcher from mpich, a public domain implementation of MPI.
• prun, a parallel launcher of Resource Management System* (RMS) from Quadrics*.
• mpiexec, the MPI launcher in the Intel® MPI Library
Debugging Massively Parallel Applications: OverviewThe biggest challenge of debugging massively parallel applications is coping with large quantities of output from debuggers controlling the parallel application's processes. The Intel® Debugger helps you manage this output by aggregating similar output into groups. The debugger aggregates output by using the following two strategies:
• It condenses identical output messages into a single output message. When the debugger displays an aggregated message, the debugger prefixes the message with a range of user process IDs, to which this output applies. The processes in that range are not necessarily consecutive. The debugger aggregates all processes with the same output into a single and final output message. For example, in the following message, [0-41] is the process range:[0-41] Linux Application Debugger for Itanium®-based applications, Version XX
• Outputs that have different hexadecimal digits, but are otherwise identical, are condensed by aggregating the differing digits into a range. For example, in the following message, [0-41] is the process range, and [0;41] is the value range:
[0-41]>2 0x120006d6c in feedback(myid=[0;41],np=42,name=0x11fffe018="mytest") "mytest.c":41
Another challenge of debugging massively parallel applications is using a debugger to control all of the application’s processes, or process subsets, in a consistent manner. The Intel debugger provides you with this control through a single user interface.
At the startup of a parallel debugging session:

32
5 Intel® Debugger Command Reference
1. The debugger detects the topology of your application and attaches a debugger to each of your application's processes.
2. The debugger builds an n-nary tree with the debuggers as root and leaves with special processes called aggregators in the middle. You can specify the tree's branching factor and the aggregator time delay.
The root debugger is responsible for starting your parallel application and serves as your user interface. The aggregators perform output consolidation as described previously. The leaf debuggers control and query your application processes.
The branching factor is the factor used to build the n-nary tree and determine the number of aggregators in the tree. For example, for 16 processes:
• Using a branching factor of 8 creates 3 aggregators
• Using a branching factor of 2 creates 15 aggregators
You can set the value of the $parallel_branchingfactor variable from its default value of 8 to a value equal to or greater than 2 in the debugger initialization file.
When you delete $parallel_branchingfactor from the initialization file, the branching factor used in the startup mechanism is the default value.
Aggregator delay specifies the time that aggregators wait, when not all of the expected messages have been received, before they aggregate and send messages down to the next level.
You can change the value of the $parallel_branchingfactor variable from its default value of 3000 milliseconds in the debugger initialization file. For more information, see Parallel Debugging Tips.
When you delete $parallel_aggregatordelay from the debugger initialization file, the aggregator delay used in the startup mechanism is the default value.
NOTE. You can only change the values that are set for $parallel_branchingfactor and $parallel_aggregatordelay when you start the debugger, in the debugger initialization file. After the debugger has started, you cannot change these values.
NOTE. By default, the debugger uses rsh to create the leaf debugger and aggregator processes in the tree structure. To use a different remote shell to create those processes, set the environment variable IDB_PARALLEL_SHELL to the path of the desired shell. Make sure that every node in your cluster has the access privilege to all other cluster nodes for proper setup of the tree structure.

Debugging Parallel Applications 5
33
Before You Begin Debugging an MPI ApplicationBefore you begin, ensure that the environment variable IDB_HOME is set to the debugger’s install directory.
If you use MPICH, ensure that the script mpirun_dbg.idb that comes with the debugger is in the /bin/ directory of the MPICH installation.
If you use Intel® MPI 3.0, ensure that the environment variable MPIEXEC_DEBUG is defined so that MPI processes suspend their execution to wait for the debuggers to attach to them.
See AlsoStarting an MPI Debugging SessionAttaching to an Existing MPI Job
Starting an MPI Debugging SessionTo start a new MPI job under the debugger's control:
— If you use MPICH, enter the following command in a shell:
mpirun -dbg=idb -np number_of_processes [ other_MPICH_options ] executable_filename [ application_arguments ]
— If you use Intel® MPI 3.0
mpiexec -idb -n number_of_processes [ other_Intel_MPI_options ] executable_filename [ application_arguments ]
— If you use prun
idb [ idb_options ] -parallel ‘which prun` -n number_of_processes -N Number_of_nodes [ other_prun_options ] application [ application_arguments ]
When the debugger starts your parallel application, it detects and attaches to all of your application's processes. At this point, your application stops before executing any user code and the debugger displays a prompt.
You can now set any necessary breakpoints and use the continue command to continue the execution of your application.
See AlsoBefore You Begin Debugging an MPI ApplicationAttaching to an Existing MPI Job
34
5 Intel® Debugger Command Reference
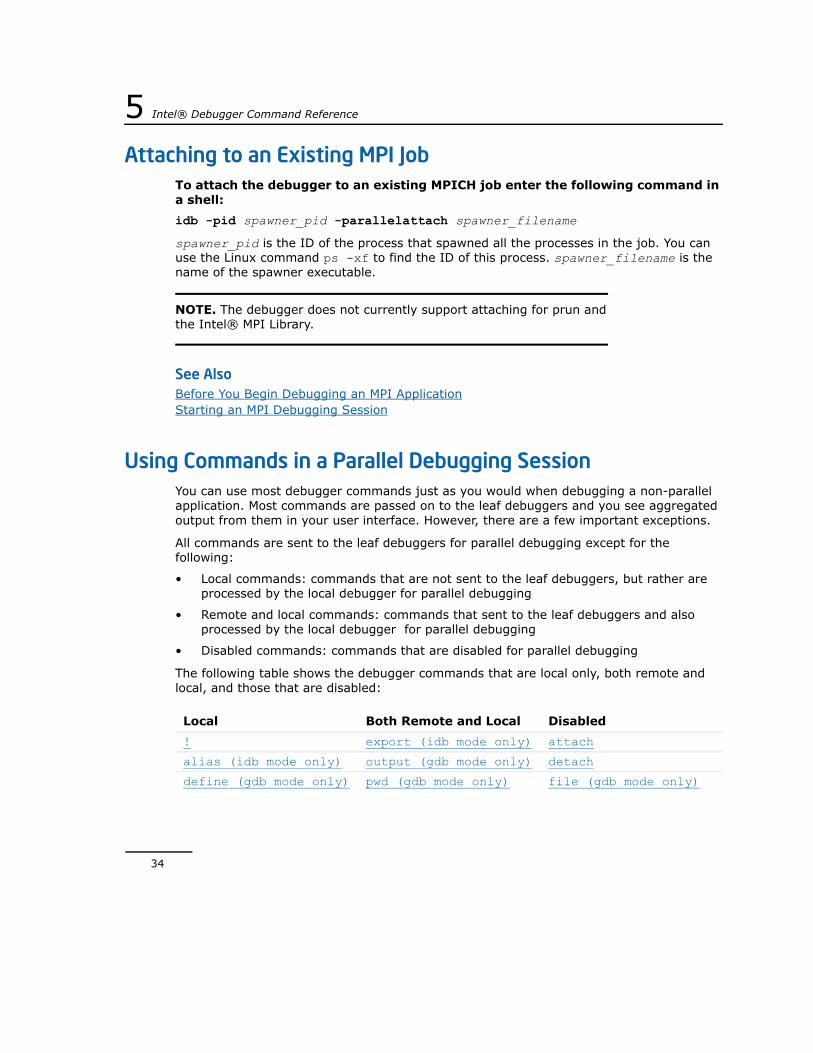
Attaching to an Existing MPI JobTo attach the debugger to an existing MPICH job enter the following command in a shell:
idb -pid spawner_pid -parallelattach spawner_filename
spawner_pid is the ID of the process that spawned all the processes in the job. You can use the Linux command ps -xf to find the ID of this process. spawner_filename is the name of the spawner executable.
NOTE. The debugger does not currently support attaching for prun and the Intel® MPI Library.
See AlsoBefore You Begin Debugging an MPI ApplicationStarting an MPI Debugging Session
Using Commands in a Parallel Debugging Session You can use most debugger commands just as you would when debugging a non-parallel application. Most commands are passed on to the leaf debuggers and you see aggregated output from them in your user interface. However, there are a few important exceptions.
All commands are sent to the leaf debuggers for parallel debugging except for the following:
• Local commands: commands that are not sent to the leaf debuggers, but rather are processed by the local debugger for parallel debugging
• Remote and local commands: commands that sent to the leaf debuggers and also processed by the local debugger for parallel debugging
• Disabled commands: commands that are disabled for parallel debugging
The following table shows the debugger commands that are local only, both remote and local, and those that are disabled:
Local Both Remote and Local Disabled
! export (idb mode only) attach
alias (idb mode only) output (gdb mode only) detach
define (gdb mode only) pwd (gdb mode only) file (gdb mode only)

Debugging Parallel Applications 5
35
edit (idb mode only) quit idb freeze (gdb mode only)
expand aggregated message
set (idb mode only) idb set openmp-serialization (gdb mode only)
help set environment (gdb mode only)
idb show openmp-serialization (gdb mode only)
history (idb mode only)
set variable (gdb mode only)
idb stopping threads (gdb mode only)
playback input (idb mode only)
setenv (idb mode only) idb synchronize (gdb mode only)
record (idb mode only) sh (idb mode only) idb target threads (gdb mode only)
set editing (gdb mode only)
shell (gdb mode only) idb thaw (gdb mode only)
set height (gdb mode only)
show convenience (gdb mode only)
idb uninterrupt (gdb mode only)
set max-user-call-depth (gdb mode only)
show environment (gdb mode only)
load (idb mode only)
set prompt (gdb mode only)
unset (idb mode only) patch (idb mode only)
set width (gdb mode only)
unset environment (gdb mode only)
printenv (idb mode only)
show aggregated message
unsetenv (idb mode only)
rerun (idb mode only)
show commands (gdb mode only)
run
show editing (gdb mode only)
set args (gdb mode only)
show height (gdb mode only)
target core (gdb mode only)
show max-user-call-depth (gdb mode only)
unload (idb mode only)
show process set
Local Both Remote and Local Disabled

36
5 Intel® Debugger Command Reference
See Also
In addition to the commands listed in the table, the focus command can assist parallel debugging.
Working with Aggregated Messages The root debugger collects the outputs from the leaf debuggers and presents you with an aggregated output. In most cases, this aggregation works fine, but it can be an impediment if you want to know the exact output from certain leaf debuggers.
To remedy this, the debugger assigns a unique message ID number to each aggregated message and saves the message in the message ID list. You can use the following commands to inspect the message list and expand its entries:
• show aggregated message
• expand aggregated message
See Alsoexpand aggregated messageshow aggregated message
show prompt (gdb mode only)
show user (gdb mode only)
show width (gdb mode only)
source
unalias (idb mode only)
unrecord (idb mode only)
Local Both Remote and Local Disabled

Debugging Parallel Applications 5
37
Parallel Debugging Tips
Tip 1. Obtaining Better Aggregate Outputs
If the debugger outputs are not aggregated as you would expect them to be, you can increase the value of the $parallel_aggregatordelay debugger variable, whose value is the expiration time, in milliseconds, for each of the aggregators when the aggregators have not received all the expected messages. Because the default value of the $parallel_aggregatordelay is 3000 milliseconds, you should not normally have a problem with the aggregation delay.
See Also$parallel_aggregatordelay
Tip 2. Synchronizing Processes
If the processes become unsynchronized in the debugging session, such as in a case where you use the focus command on a subset of the total set, and then use a next or some other command to advance execution, the easiest way to get the processes back together is to continue to a location where all processes have to go. The following example shows how the output from processes is not identical because different processes are at different locations in the program. Using the GDB mode until or the IDB mode cont to command synchronizes the processes and aggregates the messages.
Example(idb) next
(idb) [4:5,12] stopped at [int feedbackToDebugger(int, int, char*):17 0x120006bf4]
[0:3,6:11] [3] stopped at [int feedbackToDebugger(int, int, char*):15 0x120006bf0]
[4:5,12] 17 int pathSize = 1000;
[0:3,6:11] 15 int i = 0;
(idb) l
(idb) [0:3,6:11] 16 char path[1000];
[4:5,12] 18 char hostname[1000];
[0:3,6:11] 17 int pathSize = 1000;
[4:5,12] 19 int hostnameSize = 1000;
[0:3,6:11] 18 char hostname[1000];
[4:5,12] 20

38
5 Intel® Debugger Command Reference
[0:3,6:11] 19 int hostnameSize = 1000;
[4:5,12] 21 volatile int debuggerAttached = 0;
[0:3,6:11] 20
[4:5,12] 22
[0:3,6:11] 21 volatile int debuggerAttached = 0;
[4:5,12] 23 gethostname(hostname,hostnameSize);
%3 [0:12] [22;24]
[0:3,6:11] 23 gethostname(hostname,hostnameSize);
[4:5,12] 25 getcwd(path,pathSize);
[0:3,6:11] 24
[4:5,12] 26 strcat(path,"/");
[0:3,6:11] 25 getcwd(path,pathSize);
[4:5,12] 27 strcat(path,name);
[0:3,6:11] 26 strcat(path,"/");
[4:5,12] 28
[0:3,6:11] 27 strcat(path,name);
[4:5,12] 29 // Print myid pid into idbAttach.myid
[0:3,6:11] 28
[4:5,12] 30 sprintf(filename,"idbAttach.%d",myid);
[0:3,6:11] 29 // Print myid pid into idbAttach.myid
[4:5,12] 31 file = fopen(filename,"w");
[0:3,6:11] 30 sprintf(filename,"idbAttach.%d",myid);
[4:5,12] 32 if (file == NULL) {
[0:3,6:11] 31 file = fopen(filename,"w");
[4:5,12] 33 fprintf(stderr,"smg98: can't open %s for %s\n",filename, "w");
[0:3,6:11] 32 if (file == NULL) {
[4:5,12] 34 exit(1)
[0:3,6:11] 33 fprintf(stderr,"smg98: can't open %s for %s\n",filename, "w");
[4:5,12] 35 }
[12] 36 fprintf(file," %ld %ld %s %s\n", myid, getpid(), hostname, path);
[12] 37 fclose(file);

Debugging Parallel Applications 5
39
[12] 38
[4:5] 36 fprintf(file," %ld %ld %s %s\n", myid, getpid(), hostname, path);
[0:3,6:11] 34 exit(1);
[0:3,6:11] 35 }
[4:5] 37 fclose(file);
[0:3,6:11] 36 fprintf(file," %ld %ld %s %s\n", myid, getpid(), hostname, path);
[4:5] 38
(idb) until 36
[0:13] stopped at [int feedbackToDebugger(int, int, char*):36 0x120006cb8]
[0:13] 36 fprintf(file," %ld %ld %s %s\n", myid, getpid(), hostname, path);
(idb) next
(idb) [0:13] stopped at [int feedbackToDebugger(int, int, char*):37 0x120006d0c]
[0:13] 37 fclose(file);
See Alsountil (gdb mode only)cont (idb mode only)
Tip 3. Finding Source Files in a Parallel Debugging Session
The debugger is not able to display source code if it cannot find the source file in the directory specified in the application binary file, or in the directory in which the binary resides.
Specifying the -I option in the command line fixes the problem. When launching a debugging session using the mpirun command, this option should follow the -idbopt option.
Alternatively, applying the use command or the map source directory command to all the leaf debuggers can overcome the problem as well.
Example(idb) w

40
5 Intel® Debugger Command Reference
Source file not found or not readable, tried...
./cpi.c
/usr/users/smith/idb-sandbox/test/src/common/Funct/bin/cpi.c
(Cannot find source file mpirun.c)
(idb) use /usr/proj/debug/idb/test/src/common/Funct/src
[0:7] Directory search path for source files:
[0:7] . /usr/users/smith/idb-sandbox/test/src/common/Funct/bin /usr/proj/debug/idb/test/src/common/Funct/src
(idb) w
[0:7] 20
[0:7] 21 double f(double);
[0:7] 22
[0:7] 23 int main(int argc, char *argv[])
[0:7] 24 {
[0:7] 25 int done = 0, n, myid, numprocs, i;
[0:7] 26 double PI25DT = 3.141592653589793238462643;
[0:7] 27 double mypi, pi, h, sum, x;
[0:7] 28 double startwtime = 0.0, endwtime;
[0:7] 29 int namelen;
Parallel Debugging ExampleThe following command starts a parallel debugging session on an Intel® MPI job with 8 processes.
% mpiexec -idb -n 8 cpi
Intel(R) Debugger for applications running on Intel(R) 64, Version X
Attaching to program: /usr/bin/python, process 17717
Reading symbols from /usr/bin/python...(no debugging symbols found)...done.
[New Thread 182902515936 (LWP 17717)]
__select_nocancel () in /lib64/tls/libc-2.3.2.so
Info: Optimized variables show as <no value> when no location is allocated.
Continuing.

Debugging Parallel Applications 5
41
MPIR_Breakpoint () at /tmp/vgusev.xtmpdir.svsmpi020.1167/mpi2.32e.svsmpi020.2008
0917/dev/src/pm/mpd/mtv.c:100
No source file named /tmp/vgusev.xtmpdir.svsmpi020.1167/mpi2.32e.svsmpi020.20080
917/dev/src/pm/mpd/mtv.c.
(idb)
The following is a message from processes 0 to 7.
[0:7] Intel(R) Debugger for applications running on Intel(R) 64, Version X
%1 [0:7] Attaching to program: ~/test/cpi, process [17729
;17737]
[0:7] Reading symbols from ~/test/cpi...done.
The following aggregated message contains messages with differing portions, and 2 is the message ID. In this case, the LWP ID's are different from process to process.
%2 [0:7] [New Thread 182908720320 (LWP [17729;17737])]
[3,5] syscall () in /lib64/tls/libc-2.3.2.so
[0:2,4,6:7] MPIR_WaitForDebugger () at /tmp/vgusev.xtmpdir.svsmpi020.1167/mpi
2.32e.svsmpi020.20080917/dev/src/mpi/debugger/dbginit.c:139
(idb)
[0:7] stopped at [int main(int, char**):22 0x0000000000400ab1]
[0:7] 22 MPI_Comm_size(MPI_COMM_WORLD,&numprocs);
(idb)
[0:7] 18 char processor_name[MPI_MAX_PROCESSOR_NAME];
[0:7] 19 int gate = 0;
[0:7] 20
[0:7] 21 MPI_Init(&argc,&argv);
[0:7] > 22 MPI_Comm_size(MPI_COMM_WORLD,&numprocs);
[0:7] 23 MPI_Comm_rank(MPI_COMM_WORLD,&myid);
[0:7] 24 MPI_Get_processor_name(processor_name,&namelen);
[0:7] 25
[0:7] 26 fprintf(stderr,"Process %d on %s\n",

42
5 Intel® Debugger Command Reference
(idb)
(idb) b f
(idb)
[0:7] Breakpoint 1 at 0x400a41: file ~/test/cpi.c, line 8.
(idb) c
(idb)
[0:7] Continuing.
[0:7]
%3 [0:7] Breakpoint 1, f (a=[0.0050000000000000001;0.074999999999999997]) at ~/test/cpi.c:8
[0:7] 8 return (4.0 / (1.0 + a*a));
(idb) where
(idb)
%4 [0:7] #0 0x0000000000400a41 in f (a=[0.0050000000000000001;0.074999999999999997]) at ~/test/cpi.c:8
%5 [0:7] #1 0x0000000000400bf3 in main (argc=1, argv=0x7fbfe7d358) at ~/test/cpi.c:52
The following command sets the current process set to include processes 4, 5, 6, and 7.
(idb) focus [4:7]
(idb) c
(idb)
The following prompt shows the current process set.
[4:7] Continuing.
[4:7]
%6 [4:7] Breakpoint 1, f (a=[0.125;0.155]) at ~/test/cpi.c:8
[4:7] 8 return (4.0 / (1.0 + a*a));
(idb) where
(idb)

Debugging Parallel Applications 5
43
%7 [4:7] #0 0x0000000000400a41 in f (a=[0.125;0.155]) at ~/cchen
15/test/cpi.c:8
%8 [4:7] #1 0x0000000000400bf3 in main (argc=1, argv=0x7fbff7d7d8) at ~/test/cpi.c:52
(idb) focus [*]
(idb) n
(idb)
%9 [0:7] main (argc=1, argv=0x7fbff2a468) at ~/test/cpi.c
:52
[0:7] 52 sum += f(x);
(idb) where
(idb)
%10 [0:7] #0 0x0000000000400bf3 in main (argc=1, argv=0x7fbfe7d358) at ~/test/cpi.c:52
The following command displays all the aggregated messages saved in the message list.
(idb) show aggregated message
%1 [0:7] Attaching to program: ~/test/cpi, process [17729;17737]
%2 [0:7] [New Thread 182908720320 (LWP [17729;17737])]
%3 [0:7] Breakpoint 1, f (a=[0.0050000000000000001;0.074999999999999997]) at ~/test/cpi.c:8
%4 [0:7] #0 0x0000000000400a41 in f (a=[0.0050000000000000001;0.074999999999999997]) at ~/test/cpi.c:8
%5 [0:7] #1 0x0000000000400bf3 in main (argc=1, argv=0x7fbfe7d358) at ~/test/cpi.c:52
%6 [4:7] Breakpoint 1, f (a=[0.125;0.155]) at ~/test/cpi.c:8
%7 [4:7] #0 0x0000000000400a41 in f (a=[0.125;0.155]) at ~/tesast/cpi.c:8
%8 [4:7] #1 0x0000000000400bf3 in main (argc=1, argv=0x7fbff7d7d8) at ~/test/cpi.c:52
%9 [0:7] main (argc=1, argv=0x7fbff2a468) at ~/test/cpi.c:52
%10 [0:7] #0 0x0000000000400bf3 in main (argc=1, argv=0x7fbfe7d358) at ~/test/cpi.c:52
The following command expands the aggregated message with message ID 1.
(idb) expand aggregated message 1

44
5 Intel® Debugger Command Reference
%1 [0:7] Attaching to program: ~/test/cpi, process [17729;17737]
[3] Attaching to program: ~/test/cpi, process 17732
[5] Attaching to program: ~/test/cpi, process 17734
[2] Attaching to program: ~/test/cpi, process 17730
[4] Attaching to program: ~/test/cpi, process 17733
[0] Attaching to program: ~/test/cpi, process 17737
[1] Attaching to program: ~/test/cpi, process 17729
[7] Attaching to program: ~/test/cpi, process 17736
[6] Attaching to program: ~/test/cpi, process 17735
(idb) disable 1
(idb)
(idb) c
(idb)
[0:7] Continuing.s
pi is approximately 3.1416009869231245, Error is 0.0000083333333314
wall clock time = 120.800664
[0:7] Program exited normally.
(idb)
(idb) quit
Using the mpirun_dbg.idb Startup FileThe latest MPICH distribution should come with the Intel Debugger startup file mpirun_dbg.idb. If it does not, or if you are using an older distribution of MPICH, you can create the startup file by saving the following script as mpirun_dbg.idb in the directory in which mpirun resides:
#! /bin/sh
cmdLineArgs=""
p4pgfile=""
p4workdir=""
prognamemain=""
p4ssport=""

Debugging Parallel Applications 5
45
processedCmdLineArgs=""
#
# Extract -p4ssport info from the string passed in via -cmdlineargs.
#
function processCmdLineArgs()
{
while [ 1 -le $# ] ; do
arg=$1
shift
case $arg in
-p4ssport)
p4ssport="-p4ssport $1"
shift
;;
*)
processedCmdLineArgs="$processedCmdLineArgs $arg"
;;
esac
done
}
while [ 1 -le $# ] ; do
arg=$1
shift
case $arg in
-cmdlineargs)
cmdLineArgs="$1"
shift
;;
-p4pg)
p4pgfile="$1"

46
5 Intel® Debugger Command Reference
shift
;;
-p4wd)
p4workdir="$1"
shift
;;
-progname)
prognamemain="$1"
shift
;;
esac
done
#
#
# Need to `eval echo $cmdLineArgs` to undo evil quoting done in mpirun.args
#
processCmdLineArgs `eval echo $cmdLineArgs`
#
if [ -n "$IDB_HOME" ] ; then
ldbdir=$IDB_HOME
idb=$ldbdir/idb
if [ -f $ldbdir/idb.cat ] && [ -r $ldbdir/idb.cat ] ; then
if [ -n "$NLSPATH" ]; then
nlsmore=$NLSPATH
else
nlsmore=""
fi
NLSPATH=$ldbdir/$nlsmore
fi
else
idb="idb"
fi

Debugging Parallel Applications 5
47
#
$idb -parallel $prognamemain -p4pg $p4pgfile -p4wd $p4workdir -mpichtv $p4ssport $processedCmdLineArgs

49
Giving Commands to the Debugger 6Supporting Multiple Processes
The debugger supports concurrently debugging multiple processes at the same time, but at any given time, it is only operating on a single process, known as the current process. The debugger variable $curprocess contains the ID for this process. Naming and switching the debugger between processes is described in Debugging Multiple Processes.
See AlsoDebugging Multiple ProcessesList of Predefined Debugger Variables
Debugging Multiple ProcessesThe debugger does not support debugging multiple processes with the GUI. Use the command-line interface instead.
The debugger can find and control more than one process at a time. The debugger can find and control a process for one of the following reasons:
• It created the process.
• It attached to the process.
At any one time, you can examine or execute only one of the processes that the debugger controls. The rest are stalled. You must explicitly switch the debugger to the process you want to work with, stalling the one it was controlling.
To show the processes that the debugger controls:
1. If you are not already in IDB mode, switch to IDB mode using the following command.
(idb) $cmdset = "idb"
2. Enter the process or show process command.
The debugger displays any processes it controls.

50
6 Intel® Debugger Command Reference
3. If you want to switch to GDB mode, use the following command:
(idb) $cmdset = "gdb"
To switch the debugger to a specific process:
1. If you are not already in IDB mode, switch to IDB mode using the following command.
(idb) $cmdset = "idb"
2. Enter the process command.
The process you are switching away from remains stalled until either the debugger exits or until you switch to it and continue it.
3. If you want to switch to GDB mode, use the following command:
(idb) $cmdset = "gdb"
NOTE. The attach command and the IDB mode command load switch the debugger to the process on which they operate.
See Also Starting the Debuggerprocess (idb mode only)show process setshow process (idb mode only)attachload (idb mode only)
Supporting Multiple Call Frames, Threads, and SourcesProcesses contain one or more threads of execution. The threads execute functions. Functions are sequences of instructions that are generated by compilers from source lines within source files.
As you enter the debugger commands to manipulate your process, it would be very tedious to have to repeatedly specify which thread, source file, and so on, to which you want the command to be applied. To prevent this, each time the debugger stops the process, it reestablishes a static context and a dynamic context for your commands. The components of the dynamic context are dependent on this run of your program, while the components of the static context are independent of this run.
You can display the components of these contexts as debugger variables or by using other commands.

Giving Commands to the Debugger 6
51
The static context consists of the following:
The dynamic context consists of the following:
The debugger keeps the components of the static and dynamic contexts consistent as the contexts change. The debugger determines the current file and line according to where the process stops, but you can change the dynamic context directly using the following commands:
• frame (GDB mode)
• up or down
• func (IDB mode)
• process (IDB mode)
• thread
You can unload the program using the file (GDB mode) or unload (IDB mode) command.
See Alsoframe (gdb mode only)updownfunc (idb mode only)process (idb mode only)threadList of Predefined Debugger Variables
Current program info sharedlibrary (GDB mode) or listobj (IDB mode), info file
Current file print $curfile
Current line print $curline
where Current call frame
print $curprocess
Current process
print $curthread Current thread
thread The thread executing the event that caused the debugger to gain control of the process

52
6 Intel® Debugger Command Reference
Command, Filename and Variable CompletionGDB mode supports the completion of commands, filenames, and variables. Start typing a command, filename or variable and press Tab. If there is more than one alternative, the debugger sounds a bell. Pressing Tab again causes the debugger to list the alternatives.
Using single and double quotes influences the set of possible alternatives. Use single quotes to fill in C++ names, which contains special symbols (":", "<", ">", "(", etc.). Use double quotes to tell the debugger to look for alternatives among file names.
User-defined CommandsThe debugger supports user-defined commands.
GDB Mode:
Use the following commands to define and control user-defined commands:
• define
• set max-user-call-depth
• show max-user-call-depth
User-defined commands support if, while, loop_break, and loop_continue commands in their bodies. User-defined commands can have up to 10 arguments separated by whitespace. Argument names are $arg0, $arg1, $arg2, …, $arg9. The number of arguments is held in $argc.
To define a new command:
1. Enter define commandname.
2. Enter each command line separately.
3. Enter end.
NOTE. The debugger does not support user-defined hooks or the following commands: document, help user-defined, and dont-repeat.
IDB Mode:
Use the alias command to define or display your own commands.
The definition can contain:
• The name of another alias, if the nested alias is the first identifier in the definition.

Giving Commands to the Debugger 6
53
• A quoted string, specified with backslashes before the quotation marks. Two quotation marks cannot be together; they must be separated by a space or at least one character.
See Alsoalias (idb mode only)define (gdb mode only)set max-user-call-depth (gdb mode only)show max-user-call-depth (gdb mode only)
Changing the Debugger PromptBy default, the debugger prompt is (idb) . You can customize the debugger prompt by setting the $prompt debugger variable, or, in GDB mode, using the set prompt command.
ExampleThe following example changes the prompt by setting the $prompt debugger variable.
(idb) set $prompt = "newPrompt>> "
newPrompt>>
See Alsoset (idb mode only)set prompt (gdb mode only)
Processing Debugger Commands
Processing Debugger Commands: OverviewThe debugger processes commands as follows:
1. Prompts for input.
2. Obtains a complete line from the input file and performs:
a. History replacement of the line
b. Alias expansion of the line
3. Parses the entire line according to the parsing rules for the current language.
4. Executes the commands.

54
6 Intel® Debugger Command Reference
See AlsoEntering and Editing Command LinesHistory Replacement of the Line (IDB Mode Only)Environment Variable ExpansionSyntax of Commands: Overview
Entering and Editing Command LinesThe debugger reads lines from stdin. The debugger supports command line editing when processing stdin if stdin is a terminal and the debugger variable $editline is non-zero. If you are using the debugger’s command-line mode, use the set command to change the setting, and set the terminal width to the correct value.
After editing, press Enter to send the line to the debugger.
• Use the left and right arrow keys to edit parts of the line.
• Use the up and down arrow keys to recall and edit earlier commands.
NOTE. When you use the up and down arrow keys, the debugger skips duplicate commands. To see a complete list of the commands you have entered, use the history command.
When input is recorded, the debugger copies each line from stdin to the file you select with the record input command.
The debugger scans each line from the beginning, looking for backslash (\) characters, which escape the subsequent character. If the line ends in an escaped newline, then another line is similarly processed from stdin and appended to the first one, with the escaped newline removed.
Whether or not command line editing is enabled, you can always use your terminal's cut-and-paste function to avoid excessive typing while entering input.
See AlsoList of Predefined Debugger Variablesset height (gdb mode only)set width (gdb mode only)history (idb mode only)record (idb mode only)

Giving Commands to the Debugger 6
55
History Replacement of the Line (IDB Mode Only)You can access the debugger’s command history to execute repetitive commands more easily.
History in a command list is not limited by braces, but goes all the way back. For example:
idb) print 1
1
(idb) stop at 182 { print 2; history 3 }
[#1: stop at "src/x_list.cxx":182 { print 2; history 3 }]
(idb) run
2
11: print 1
12: stop at 182 {print 2; history 3}
13: run
[1] stopped at [int main(void):182 0x08051603]
182 List<Node> nodeList;
NOTE. Commands in breakpoint action lists are not entered into the history list.
See AlsoScripting or Repeating Previous Commands!^
Environment Variable ExpansionThe debugger expands environment variables and the leading tilde (~) in the following cases:
• As part of a command in which a file name or a directory is expected.
• In the arguments to run or rerun (IDB mode).
As in any shell, you can group an environment variable name using a pair of curly braces ({}), and quote a dollar sign ($) by preceding it with a backslash (\).

56
6 Intel® Debugger Command Reference
The following table shows how various environment variables expand. It assumes that the home directory is /usr/users/hercules and the environment variable BIN is /usr/users/hercules/bin.
Syntax of Commands
Syntax of Commands: OverviewThe debugger has different parsing rules for each of the different languages it supports. A line is processed according to the current language, even if executing the line will change the current language.
Lexical AnalysisFor the debugger to parse the line, it must first turn the line into a sequence of tokens, a process called tokenizing or lexical analysis. Tokenizing is done with a state machine.
As the debugger starts tokenizing a line into a command, it starts processing the characters using the lexical state LKEYWORD. It uses the rules for lexical tokens in this state, recognizing the longest sequence of characters that forms a lexical token.
After the lexical token is recognized, the debugger appends it to the tokenized form of the line, perhaps changes the state of the tokenizer, and starts on the next token.
Table 6-1
Command with Environment Variable Expands into
load ~/a.out load /usr/users/hercules/a.out
load $BIN/a.out load /usr/users/hercules/bin/a.out
load ${BIN}2/a\$b load /usr/users/hercules/bin2/a$b
map source directory $BIN ${BIN}2
map source directory /usr/users/hercules/bin /usr/users/hercules/bin2
stop at "$BIN/a.out":20 stop at "/usr/users/hercules/bin/a.out":20
run $BIN/a.out ~/core run /usr/users/hercules/bin/a.out /usr/users/hercules/core

Giving Commands to the Debugger 6
57
Grammar of CommandsSome pieces of the grammar were modified from a grammar originally written by James A. Roskind. Portions Copyright ©1989, 1990 James A. Roskind
Each command line must parse as one of the following:
The difference between a blank command line and a command line that is a comment is that a blank line entered from the keyboard causes the debugger to repeat the previous command and the comment line does not. The debugger treats blank lines that you do not not enter directly in the console as comment lines.
Keywords within CommandsIf the identifiers thread, in, at, and if occur within expression in the following commands, the debugger treats them as keywords unless they are enclosed within parentheses (()).
• where expression
• stopi expression
• wheni expression
For example, if your program has thread defined as an integer, enter the following command to inspect the first thread levels of the stack:
(idb) where (thread)
Using Braces to Make a Composite CommandYou can surround a list of commands with braces to make it work like a single command. Some parts of the debugger command language grammar require a braced command list either for readability, or to help the debugger understand your input.
Exampleif (foo) { p "true" } else { print "false" }
command list A command list is a sequence of one or more commands that the debugger are executes one after the other.
comment A comment is a line that begins with a pound (#) character.
The debugger ignores any text after an unquoted pound character. If the first non-whitespace character on a line is a pound character, the debugger ignores the whole line.

58
6 Intel® Debugger Command Reference
while (bar()) {print "bar is still true"}
stop in rtn { p "in routine" }
Conditionalizing Command ExecutionTo conditionalize command execution, use the if [else] and while commands.
ExampleThe following example demonstrates using the if command.
(idb) set $c = 1
(idb) assign pid = 0
(idb) if (pid < $c) { print "Greater" } else { print "Lesser" }
Greater
The following example demonstrates using the while command to continue the execution of the debuggee until the _data field in currentNode is 5.
Notice that if the commands in the braced command list do not change the state of the debuggee process, such as the value of a variable or the PC register, then the while command can go into an infinite loop. In this case, press Ctrl+C to interrupt the loop, or enter n when you see the More (n if no)? prompt if your while command generates output and the paging is turned on.
(idb) stop at 167
[#1: stop at "src/x_list.cxx":167]
(idb) run
The list is:
[1] stopped at [void List<Node>::print(void) const:167 0x0804af2e]
167 cout << "Node " << i ;
(idb)
(idb) while (currentNode->_data != 5) { print "currentNode->_data is ", currentNode->_data; cont }
currentNode->_data is 1
Node 1 type is integer, value is 1
[1] stopped at [void List<Node>::print(void) const:167 0x0804af2e]
167 cout << "Node " << i ;
currentNode->_data is 2
Node 2 type is compound, value is 12.345

Giving Commands to the Debugger 6
59
parent type is integer, value is 2
[1] stopped at [void List<Node>::print(void) const:167 0x0804af2e]
167 cout << "Node " << i ;
currentNode->_data is 7
Node 3 type is compound, value is 3.1415
parent type is integer, value is 7
[1] stopped at [void List<Node>::print(void) const:167 0x0804af2e]
167 cout << "Node " << i ;
currentNode->_data is 3
Node 4 type is integer, value is 3
[1] stopped at [void List<Node>::print(void) const:167 0x0804af2e]
167 cout << "Node " << i ;
currentNode->_data is 4
Node 5 type is integer, value is 4
[1] stopped at [void List<Node>::print(void) const:167 0x0804af2e]
167 cout << "Node " << i ;
(idb)
(idb) print currentNode->_data
5
See Alsoifwhile
About Debugger VariablesDebugger variables are pseudovariables that exist within the debugger instead of within your program. They have the following uses:
• Support some limited programming capabilities within the debugger command language
• Allow you to examine and change various debugger options
• Allow you to find out exactly what various debugger commands did
60
6 Intel® Debugger Command Reference
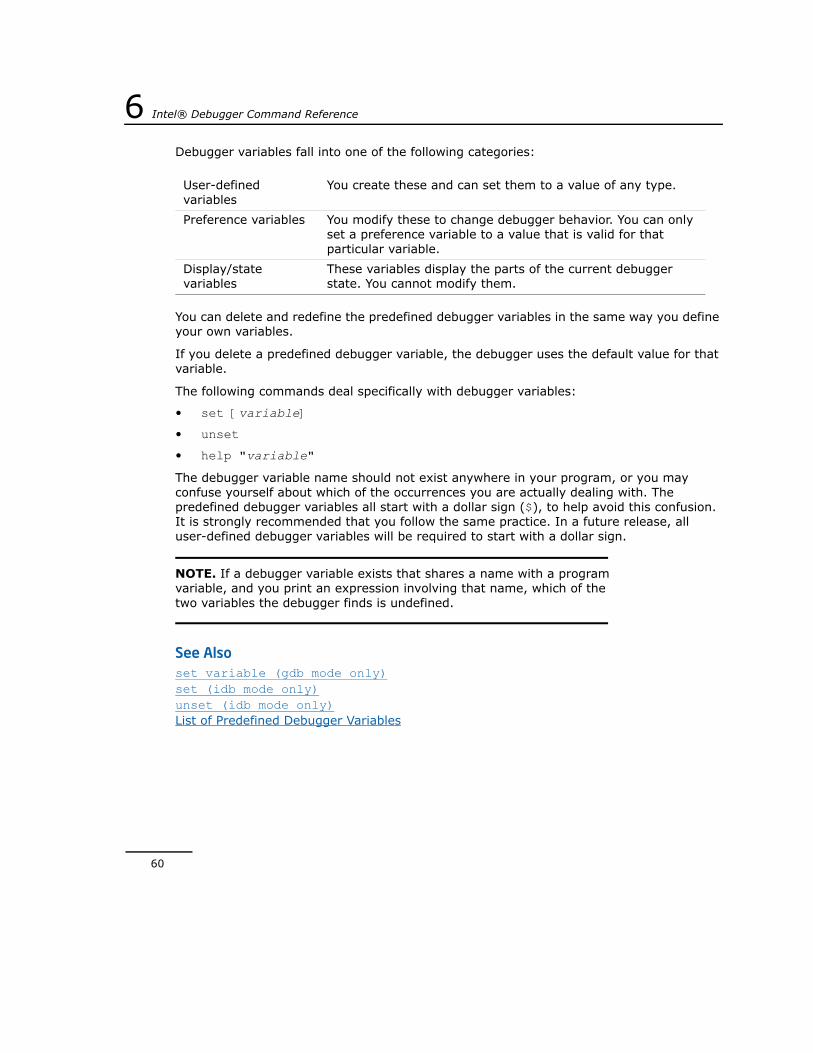
Debugger variables fall into one of the following categories:
You can delete and redefine the predefined debugger variables in the same way you define your own variables.
If you delete a predefined debugger variable, the debugger uses the default value for that variable.
The following commands deal specifically with debugger variables:
• set [variable]
• unset
• help "variable"
The debugger variable name should not exist anywhere in your program, or you may confuse yourself about which of the occurrences you are actually dealing with. The predefined debugger variables all start with a dollar sign ($), to help avoid this confusion. It is strongly recommended that you follow the same practice. In a future release, all user-defined debugger variables will be required to start with a dollar sign.
NOTE. If a debugger variable exists that shares a name with a program variable, and you print an expression involving that name, which of the two variables the debugger finds is undefined.
See Alsoset variable (gdb mode only)set (idb mode only)unset (idb mode only)List of Predefined Debugger Variables
User-defined variables
You create these and can set them to a value of any type.
Preference variables You modify these to change debugger behavior. You can only set a preference variable to a value that is valid for that particular variable.
Display/state variables
These variables display the parts of the current debugger state. You cannot modify them.

Giving Commands to the Debugger 6
61
Scripting or Repeating Previous Commands
Repeating Previous CommandsThe debugger maintains a command history, so you can repeat commands that you have already entered in the debugger. This command history persists across debugging sessions.
To repeat the last command line do one of the following:
— Press the up arrow once, then press Enter.
— Enter two exclamation points (!!).
— Press Enter.
— Enter !-1.
To repeat a command line entered during the current debugging session:
Enter an exclamation point (!) followed by either the integer or the first part of the string associated with the command line.
For example, to repeat the seventh command used in the current debugging session, enter !7. To repeat the third most recent command, enter !-3. To repeat a command that started with bp, enter !bp.
TIP. •Use a completely empty line to repeat the last command, as opposed to the last line, which could have been a comment or a syntactically invalid attempt at a command.•Use command line editing to recall and modify commands you have already entered. •It is often useful to have a text editor up and running while debugging, and use it to assemble short scripts that you can copy and paste to the debugger. Keep a separate text file that has such scripts in it, as well as other notes you want to keep. This provides continuity from one debugging session to the next, and from one day to the next.•If you place commands in a file, you can execute them directly from the file rather than cutting and pasting them to the terminal.
See AlsoHistory Replacement of the Line (IDB Mode Only)Viewing the Command History!

62
6 Intel® Debugger Command Reference
history (idb mode only)
Scripting CommandsYou can record input and output to help you make command files and to help you see what has happened before. You can record input only, or input and output. Input includes user actions, including GUI actions and commands you enter in the console.
You can use the GUI to record input and output, or the following commands:
• record
• unrecord
See Alsoplayback input (idb mode only)record (idb mode only)sourceunrecord (idb mode only)
Viewing the Command HistoryYou can see all the commands you have already entered by using the history command.
To view the command history:
1. If you are not already in IDB mode, switch to IDB mode using the following command.
(idb) set variable $cmdset = "idb"The debugger is now in IDB mode, so you can use the history command.
2. Enter the following command:
(idb) historyThe debugger displays the command history.
3. If you want to switch to GDB mode, use the following command:
(idb) set $cmdset = "gdb"
GDB Mode:
In GDB mode, the debugger reads the .gdb_history file by default.
To rename the history file:
Set the environment variable GDBHISTFILE to the name of the history file you want to use.
To turn history recording on and off:

Giving Commands to the Debugger 6
63
Use the set history save command.
To configure the history size:
Use the set history size command or set the environment variable HISTSIZE to the size you want. The default history size is 256.
See AlsoHistory Replacement of the Line (IDB Mode Only)history (idb mode only)set history saveset history size
Executing Shell or Command Prompt CommandsYou can have the debugger execute a call to the operating system's system function. This function is documented in system(3). The call results from the shell (GDB mode) or sh (IDB mode) commands.
See Alsoshell (gdb mode only)sh (idb mode only)

65
IDB Command Reference 7Click a command to see a detailed description.
Command Name Short Description
address / size format (idb mode only) Dump memory in a range you specify.
/ | ? [string] (idb mode only) Search in the source for a string, or repeat the last search.
! Repeat a command in the command history.
^ Find, and optionally change a command in the command history.
# Specify a comment.
advance (gdb mode only) Run until the debuggee reaches a specific line number.
alias (idb mode only) Define an alias for one or more commands.
assign (idb mode only) Change a program variable.
attach Connect to a running process.
awatch (gdb mode only) Set a watchpoint on a specified expression.
backtrace (gdb mode only) Print a backtrace of stack frames.
break (gdb mode only) Set a breakpoint at a specified location.
call Call a function in the debuggee.
catch (idb mode only) Catch a signal.
catch unaligned (idb mode only) Catch unaligned accesses.
class (idb mode only) Show or change the current class scope.

66
7 Intel® Debugger Command Reference
clear (gdb mode only) Delete a breakpoint at the specified location.
commands (gdb mode only) Create commands to be executed when the specified breakpoint is reached.
complete (gdb mode only) List all the possible completions for the beginning of a command.
condition (gdb mode only) Specify a condition for a breakpoint.
cont (idb mode only) Continue program execution.
continue (gdb mode only) Continue program execution.
core-file (gdb mode only) Specify a core file as a target, or specify not to use a core file.
define (gdb mode only) Create a user-defined command.
delete (idb mode only) Delete all or specific breakpoints.
delete breakpoint (gdb mode only) Delete all or specific breakpoints.
delsharedobj (idb mode only) Delete symbol information for a shared object.
detach Detach the debugger from a running process.
directory (gdb mode only) Add directories to the list of source directories.
disable Disable one or more breakpoints.
disassemble (gdb mode only) Disassemble and display machine instructions.
disconnect (gdb mode only) Disconnect from all running processes and remove all breakpoints.
down Move a number of frames down the stack and print them.
down-silently (gdb mode only) Move a number of frames down the stack but do not print them.
dump (idb mode only) List the parameters and local variables on the stack.
echo (gdb mode only) Print a string.
edit (idb mode only) Edit the current source file or a specified file.
enable Enable one or more breakpoints.
exit (idb mode only) Exit the debugger.
Command Name Short Description

IDB Command Reference 7
67
expand aggregated message Expand the specified or most recent message.
export (idb mode only) Set an environment variable or print all environment variables.
file (gdb mode only) Load an executable file for debugging, or unload.
file (idb mode only) Switch to the specified source file.
fileexpr (idb mode only) Switch to the specified source file.
finish (gdb mode only) Continue execution until the current function returns.
focus (idb mode only) Change or display the current process set.
forward-search (gdb mode only) Search forward in the source for a string or repeat last search.
frame (gdb mode only) Show or change the current function scope.
func (idb mode only) Show or change the current function scope.
goto (idb mode only) Skip to a specific line number.
handle (gdb mode only) Set signal handling actions.
help Display help for debugger commands.
history (idb mode only) Show the most recently used debugger commands.
idb directory (gdb mode only) Add a directory to the list of source directories or reset the list.
idb freeze (gdb mode only) Set the execution attribute of the specified threads to frozen.
idb info barrier (gdb mode only) Shows information for existing barriers in an OpenMP application.
idb info lock (gdb mode only) Shows information for existing locks in an OpenMP application.
idb info openmp thread tree (gdb mode only)
Display the threads in the process in a tree format.
idb info task (gdb mode only) Display information for existing tasks in an OpenMP application.
idb info taskwait (gdb mode only) Display information for any existing taskwait.
Command Name Short Description

68
7 Intel® Debugger Command Reference
idb info team (gdb mode only) Display information for any existing team.
idb info thread (gdb mode only) Show the specified threads in the process.
idb process (gdb mode only) Show or specify a process.
idb reentrancy (gdb mode only) Enable re-entrancy detection on a function.
idb session restore (gdb mode only) Load a session file to restore a session’s debug settings.
idb session save (gdb mode only) Save a session’s debug settings to a file.
idb set openmp-serialization (gdb mode only)
Enable or disable serial execution of parallel regions in an OpenMP* process.
idb set solib-path-substitute (gdb mode only)
Substitute a directory path when loading shared libraries.
idb sharing (gdb mode only) Disable or enable data sharing event detection.
idb sharing event expand (gdb mode only) Display detailed information for data sharing detection events.
idb sharing event list (gdb mode only) Display a summary of all data sharing detection events.
idb sharing filter add file (gdb mode only) Ignore data sharing events in the named file.
idb sharing filter add function (gdb mode only)
Ignore data sharing events in the named function.
idb sharing filter add range (gdb mode only)
Ignore data sharing events in an address range.
idb sharing filter add variable (gdb mode only)
Ignore data sharing events on the specified variable.
idb sharing filter delete (gdb mode only) Delete data sharing detection filters.
idb sharing filter disable (gdb mode only) Disable data sharing detection filters.
idb sharing filter enable (gdb mode only) Enable data sharing detection filters.
idb sharing filter list (gdb mode only) List all data sharing detection filters.
idb sharing filter toggle (gdb mode only) Toggle data sharing detection filters.
idb sharing reset (gdb mode only) Clear the data sharing event list.
idb sharing status (gdb mode only) Show if data sharing detection is on or off.
idb sharing stop (gdb mode only) Stop or continue the debuggee when a data sharing event occurs.
Command Name Short Description

IDB Command Reference 7
69
idb show openmp-serialization (gdb mode only)
Show if serialization of parallel regions in an OpenMP process is enabled.
idb show solib-path-substitute (gdb mode only)
Show the replacement directory for loading shared libraries.
idb stopping threads (gdb mode only) Specify the threads that stop when a breakpoint is hit.
idb synchronize (gdb mode only) Set a thread syncpoint at a location you specify.
idb target threads (gdb mode only) Specify the threads that subsequent mover commands apply to.
idb thaw (gdb mode only) Set the execution attribute of the specified threads to thawed.
idb uninterrupt (gdb mode only) Set the execution attribute of the specified threads to uninterrupt.
idb unset solib-path-substitute (gdb mode only)
Remove a path substitution rule.
if Conditionalize command execution.
ignore (gdb mode only) Set the ignore count of the specified breakpoint or watchpoint to the specified value.
ignore (idb mode only) Ignore the specified signal.
info args (gdb mode only) Print the arguments of the current frame.
info breakpoints (gdb mode only) Print information about one or more breakpoints.
info files (gdb mode only) Print the names of the files in the debuggee.
info functions (gdb mode only) Print names and types of functions.
info handle (gdb mode only) Print available signals and signal setting information.
info line (gdb mode only) Print start and end address of specified source line.
info locals (gdb mode only) Print local variables of the selected function.
info program (gdb mode only) Print information about the debuggee.
info registers (gdb mode only) Print registers and their contents.
info share (gdb mode only) Print the names of shared libraries.
Command Name Short Description

70
7 Intel® Debugger Command Reference
info sharedlibrary (gdb mode only) Print the names of shared libraries.
info signals (gdb mode only) Print signal setting information.
info source (gdb mode only) Print information about the current source file.
info sources (gdb mode only) Print names of all source files.
info stack (gdb mode only) Print a backtrace of stack frames.
info target (gdb mode only) Print the names of the files in the debuggee.
info threads (gdb mode only) Print all threads.
info types (gdb mode only) Print a description of types in the program.
info variables (gdb mode only) Print names and types of all global variables.
info watchpoints (gdb mode only) Print information about one or more watchpoints.
jump (gdb mode only) Jump to the specified line number or address.
kill Kill the current process.
list Display lines of source code.
listobj (idb mode only) List all loaded objects, including the main image and the shared libraries.
load (idb mode only) Load an executable and core file for debugging.
map source directory (idb mode only) Map one source directory to another one.
next Step forward in source, over any function calls.
nexti Step forward in assembler instructions, over any function calls.
output (gdb mode only) Print the value of an expression.
patch (idb mode only) Modify an executable by writing the value of an expression to a specific address or variable.
path (gdb mode only) Add specified directory to search path.
playback input (idb mode only) Execute commands from a file.
pop (idb mode only) Remove frames from the call stack.
print Print the value of an expression.
Command Name Short Description

IDB Command Reference 7
71
printenv (idb mode only) Display the value of one or all environment variables.
printf Display a complex structure with formatting.
printi Display the value as an assembly instruction.
printregs (idb mode only) Display the values of hardware registers.
printt (idb mode only) Interpret integer values as seconds since the epoch.
process (idb mode only) Show or change the current process.
ptype (gdb mode only) Print the type declaration of the specified type, or the last value in history.
pwd (gdb mode only) Display the current working directory.
quit Exit the debugger.
readsharedobj (idb mode only) Read symbol information for a shared object.
record (idb mode only) Record debugger interactions to a file.
rerun (idb mode only) Restart the program.
return (gdb mode only) Remove frames from the call stack.
return (idb mode only) Continue execution until the current or specified function returns.
reverse-search (gdb mode only) Search backward in the source for a string or repeat last search.
run Run the debuggee program.
rwatch (gdb mode only) Set a read watchpoint on the specified expression.
search (gdb mode only) Search forward in the source for a string or repeat last search.
set (idb mode only) Set a debugger variable to a value or show all debugger variables.
set args (gdb mode only) Specify arguments for the debuggee program.
set confirm (gdb mode only) Switch confirmation requests on or off.
set editing (gdb mode only) Enable or disable Emacs*-like control characters.
set environment (gdb mode only) Set an environment variable to a value.
Command Name Short Description

72
7 Intel® Debugger Command Reference
set height (gdb mode only) Set the height of the screen.
set history save Switch command-line history on or off.
set history size Specify the size of the command-line history.
set language (gdb mode only) Set the source language.
set listsize (gdb mode only) Set the default number of source lines for the list command to display.
set max-user-call-depth (gdb mode only) Set the maximum number of recursion levels a user-defined command may have.
set output-radix (gdb mode only) Set the default numeric base for numeric output.
set print address (gdb mode only) Set the debugger’s default to either print or not print the value of a pointer as an address.
set print elements (gdb mode only) Set a limit on the number of array elements to print.
set print repeats (gdb mode only) Limit the number of consecutive, identical array elements the debugger prints.
set print static-members (gdb mode only) Print static members when showing a C++ object.
set prompt (gdb mode only) Set a new string for the debugger prompt.
set substitute-path (gdb mode only) Set a substitution rule for finding source files.
set variable (gdb mode only) Set a debugger variable to a value.
set width (gdb mode only) Set the width of the screen.
setenv (idb mode only) Set the value of an environment variable.
sh (idb mode only) Execute a shell command.
shell (gdb mode only) Execute a shell command.
show aggregated message Print the specified aggregated messages.
show architecture (gdb mode only) Show the current architecture.
show args (gdb mode only) Show arguments and input and output redirections.
show commands (gdb mode only) Print commands in history.
show condition (idb mode only) List information about pthreads condition variables.
Command Name Short Description

IDB Command Reference 7
73
show convenience (gdb mode only) Show a list of debugger variables and their values.
show directories (gdb mode only) Show the list of source directories to search.
show editing (gdb mode only) Show whether command line editing is on or off.
show environment (gdb mode only) Show one or all environment variables.
show height (gdb mode only) Show the height of the screen.
show language (gdb mode only) Show the current source language.
show listsize (gdb mode only) Show the default number of lines for the list command.
show lock (idb mode only) List information about OpenMP* locks.
show max-user-call-depth (gdb mode only)
Show the maximum recursion level for user-defined commands.
show mutex (idb mode only) Show information about pthreads mutexes.
show openmp thread tree (idb mode only) Display the threads in the process in a tree format.
show output-radix (gdb mode only) Show the default numeric base for numeric output.
show print address (gdb mode only) Show whether the debugger is set to print or not print the value of a pointer as an address.
show print elements (gdb mode only) Show the maximum number of array elements the debugger is set to print.
show print repeats (gdb mode only) Show the current threshold of repeated identical elements that the debugger is set to print.
show print static-members (gdb mode only)
Show the current setting for printing static class members with the the print command.
show process (idb mode only) Show process information.
show process set List information about one or all process sets.
show prompt (gdb mode only) Show the current debugger prompt.
show source directory (idb mode only) List information about directory mappings.
show team (idb mode only) List information about OpenMP* teams.
Command Name Short Description

74
7 Intel® Debugger Command Reference
show thread (idb mode only) List information about a thread.
show user (gdb mode only) Show the definition of one or all user-defined commands.
show values (gdb mode only) Show ten values of the value history.
show width (gdb mode only) Show the width of the screen.
source Execute commands from a batch file.
status (idb mode only) Print info on all breakpoints and tracepoints.
step Step forward in source, into any function calls.
stepi Step forward in assembler instructions, into any function calls.
stop at (idb mode only) Set a breakpoint at a line number or expression.
stop every (idb mode only) Set a breakpoint on every function entry point or on every instruction.
stop in (idb mode only) Set a breakpoint in a function.
stop memory (idb mode only) Set a breakpoint on a region in memory.
stop pc (idb mode only) Set a breakpoint when PC equals a specific address.
stop signal (idb mode only) Set a breakpoint on a signal.
stop unaligned (idb mode only) Set a breakpoint on unaligned accesses.
stop variable (idb mode only) Set a breakpoint on a specific variable.
stopi (idb mode only)] Set a breakpoint at an instruction, or if a variable changes.
target core (gdb mode only) Specify a core file as a target.
tbreak (gdb mode only) Set a temporary breakpoint at specified location.
thread Show or change the current thread.
unalias (idb mode only) Remove an alias.
unload (idb mode only) Unload an image or a core file from the debugger.
unmap source directory (idb mode only) Remove a directory mapping.
unrecord (idb mode only) Stop recording debugger input, output, or both.
Command Name Short Description

IDB Command Reference 7
75
unset (idb mode only) Delete the specified debugger variable.
unset environment (gdb mode only) Delete the specified environment variable.
unset substitute-path (gdb mode only) Unset a source directory substitution rule.
unsetenv (idb mode only) Delete the specified environment variable, or all.
until (gdb mode only) Run until a specific line.
unuse (idb mode only) Remove the specified directories from the source path or set path to default.
up Move a specific number of frames up the stack and print them.
up-silently (gdb mode only) Move a specific number of frames up the stack but do not print them.
use (idb mode only) Add a directory to the source path, or show directories in the source path.
watch (gdb mode only) Set a write watchpoint on the specified expression.
watch (idb mode only) Set a watchpoint on the specified variable or memory range.
whatis Print the type of a variable.
when (idb mode only) Set a breakpoint that executes a command list when it is hit.
wheni (idb mode only) Set an instruction breakpoint that executes a command list when it is hit.
where (idb mode only) Show the current stack trace of currently active functions.
whereis (idb mode only) Show all declarations of a specific expression.
which (idb mode only) Show the full scope of an expression.
while Execute the command list while the specified expression is not zero.
x (gdb mode only) Print memory at the specified address.
Command Name Short Description

76
7 Intel® Debugger Command Reference
address / size format (idb mode only) Dump memory in a range you specify.
Syntaxstart_address / size format
start_address, end_address / format

IDB Command Reference 7
77
Parameters
Description
This command dumps memory in a specified range. It also enables you to specify the numerical format in which the debugger prints the memory range.
start_address The start address for the range of memory.
end_address The end address for the range of memory.
size The number of memory values of the specified format to dump. This number is an integer constant.
The default value is 1.
format The numerical format in which the debugger displays memory values.
Possible values are:
d Print a short word in decimal
dd Print a 32-bit (4-byte) decimal display
D Print a long word in decimal
u Print a short word in unsigned decimal
uu Print a 32-bit (4-byte) unsigned decimal display
U Print a long word in unsigned decimal
o Print a short word in octal
oo Print a 32-bit (4-byte) octal display
O Print a long word in octal
x (Default) Print a short word in hexadecimal
xx Print a 32-bit (4-byte) hexadecimal display
X Print a long word in hexadecimal
b Print a byte in hex
c Print a byte as a character
s Print a string of characters (a C-style string ending in null)
C Print a wide character as a character
S Print a null terminated string of wide characters
f Print a single-precision real number
g Print a double-precision real number
L Print a long double-precision real number
i Disassemble machine instructions
The default format is x.

78
7 Intel® Debugger Command Reference
Example(idb) 0x81c146f / 1 u
0x081c146f: 60547
(idb) 0x81c146f / 4 u
0x081c146f: 60547 63716 33540 30089
(idb) 0x81c146f, 0x81c147f / u
0x081c146f: 60547 63716 33540 30089 64605
See Alsodisassemble (gdb mode only)x (gdb mode only)

IDB Command Reference 7
79
/ | ? [string] (idb mode only) Search in the source for a string, or repeat the last search.
Syntax/[string]
?[string]
s
Parameters
Description
This command searches forward or backward, starting at the current position in the current source file, for the specified character string. If you do not specify a string, the debugger repeats the most recent search.
The debugger interprets anything on the same line after the / as the search string, so do not quote the string.
When a match is found, the debugger lists the line number and the line. That line becomes the starting point for any further searches, or for a list command.
TIP. Pressing the Enter key repeats the most recent forward or backward search, using the same pattern. You do not need to specify / or ?.
Note that the debugger performs alias expansion on the rest of the line before the /, possibly changing the search string. For example, suppose you have j = in your source code.
(idb) alias zzz "/j"
(idb) zzz =
zzz expands to /j = and finds the next instance of j = in the source code.
/ Tells the debugger to search forward.
? Tells the debugger to search backward.
string Specifies the string you want to search for.
If you do not specify string, the debugger repeats the most recent search.

80
7 Intel® Debugger Command Reference
Examples
This example demonstrates three separate forward searches and their results.
(idb) /_firstNode
60 NODETYPE* _firstNode;
(idb) /append
65 void append (NODETYPE* const node)
(idb) /
145 void List<NODETYPE>::append(NODETYPE* const node)
This example demonstrates three separate backward searches and their results.
(idb) ?append
145 void List<NODETYPE>::append(NODETYPE* const node)
(idb) ?
65 void append (NODETYPE* const node);
(idb) ?_firstNode
60 NODETYPE* _firstNode;
See Alsoforward-search (gdb mode only)reverse-search (gdb mode only)

IDB Command Reference 7
81
! Repeat a command in the command history.
Syntax!!
![-]step_number
!string
Parameters
Description
The exclamation point (!) repeats a command in the debugger’s command history.
The debugger assembles lines in the history into a new, usable command according to the following rules.
• If the second character is also an exclamation point, the assembled line is replaced by the most recent entry from the history list. The debugger appends any remaining characters after the exclamation point to the assembled line.
• The debugger ignores spaces and tabs immediately following the exclamation point, and executes one of the following actions:
— If the next character is a number, then the debugger reads the number as a decimal number, and replaces the assembled line with the line in the history list whose ID matches the number, where 1 is the oldest entry, 2 the second oldest and so on.
— If the next character is a minus (-) followed by a number, then the debugger reads the number as a decimal number, and replaces the assembled line with the line in the history list whose ID matches the number, where -1 is the most recent entry, -2 the second most recent entry and so on.
step_number The number of steps backward or forward in the history.
When you include a minus (-), the debugger starts with the most recent command in the history and counts backwards.
When you do not include a minus, the debugger starts with the oldest command in the history and counts foward.
string The string that begins the line in the history that you want to repeat.

82
7 Intel® Debugger Command Reference
— The debugger uses the rest of the line to find the most recent command that starts with those characters, and replaces the assembled line with that line from the history list.
In the first two cases, any remaining characters after the exclamation point or digits are appended to the assembled line.
You cannot use exclamation points in command lists built with braces ({}), although you can use them in scripts. For example, the command line {print 3; !!3} does not parse.
Examples
To repeat the seventh command used in the current debugging session, enter !7.
To repeat the third most recent command, enter !-3.
To repeat a command that started with bp, enter !bp.
To repeat the previous command, enter !!.
!!:$ designates the last parameter of the preceding command
!fi:2 designates the second parameter of the most recent command starting with the
characters fi.
See AlsoRepeating Previous CommandsViewing the Command Historyhistory (idb mode only)

IDB Command Reference 7
83
^ Find, and optionally change a command in the command history.
Syntax^ string1 [^ string2 [^ string3]]
Parameters
Description
The caret (^) finds, and optionally changes a command in the debugger’s command history.
The debugger ignores leading spaces and tabs and assembles lines in the history into a new, usable command in the following manner:
1. The debugger extracts the following:
— The string following the first caret, string1, the target string.
— The string following the second caret, string2, the replacement string.
— The string following the third caret, the string to append to the replacement string.
2. The debugger checks the most recent entry from the history list to see if it has an occurrence of the target string. If it does, the debugger appends string3 to string2. If it does not, an error is reported.
The assembled line is now appended to the history list.
You cannot use carets in command lists built with braces ({}), although you can use them in scripts. For example, the command line {print 3; ^3^4^} does not parse, while the command line {print 3; ^3^4^5} does parse.
See AlsoHistory Replacement of the Line (IDB Mode Only)!
string1 The target string.
string2 The replacement string. This string can have a zero length.
string3 The string to append.

84
7 Intel® Debugger Command Reference
# Specify a comment.
Syntax# string
Parameters
Description
The hash character (#) specifies a comment. The debugger ignores any text after an unquoted hash character.
When the first non-whitespace character on a line is a hash character, the debugger ignores the whole line.
Comments are useful in input files.
string A string ending with a newline.

IDB Command Reference 7
85
advance (gdb mode only)Run until the debuggee reaches a specific line number.
Syntaxadvance linenumber
Parameters
Description
This command advances the application until it reaches a specific line number in source code, or until a breakpoint, if a breakpoint comes earlier than linenumber.
This command does not skip over recursive function calls.
Example94 int factorial (int value)
95 {
96 if (value > 1) {
97 value *= factorial (value - 1);
98 }
99 return (value);
100 }
If the current location is line 96, issuing advance 99 continues the program up to line 99.
See Alsountil (gdb mode only)next
linenumber The line number in source code at which the debuggee should stop.

86
7 Intel® Debugger Command Reference
alias (idb mode only) Define an alias for one or more commands.
Syntaxalias [alias_name]
alias [alias_name [(argument)] "string"]
Parameters
Description
This command defines an alias for one or more commands, or displays one or all existing aliases.
To display all existing aliases and their definitions, enter this command without any parameters.
To display the definition of a specific alias, specify the alias_name parameter.
To define a new alias, or redefine an existing alias, use the string parameter, and optionally include an argument in the alias with the argument parameter.
The definition can contain:
• The name of another alias, if the nested alias is the first identifier in the definition.
• A quoted string, specified with backslashes before the quotation marks. Two quotation marks cannot be together; they must be separated by a space or at least one character.
The debugger does not give a warning if the alias_name already has a definition as an alias. The new definition replaces the old one.
Invoke the alias by entering the alias name.
Examples
The following example shows how to define and use an alias:
(idb) alias cs
alias cs is not defined
(idb) alias cs "stop at 186; run"
alias_name Name of the alias to display or define.
argument An argument for the alias.
string Value to assign to the alias.

IDB Command Reference 7
87
(idb) cs
[#1: stop at "x_list.cxx":186 ]
[1] stopped at [int main(void):186 0x120002420]
186 IntNode* newNode = new IntNode(1);
The following example further modifies the cs alias to specify the breakpoint's line number when you enter the cs command:
(idb) alias cs (x) "stop at x; run"
(idb) cs(186)
[#2: stop at "x_list.cxx":186 ]
Process has exited
[2] stopped at [int main(void):186 0x120002420]
186 IntNode* newNode = new IntNode(1);
The following example demonstrates defining an alias with and without an argument, nesting an alias, and invoking an alias with an argument:
(idb) alias begin "stop in main; run" # Define the alias "begin" to set a breakpoint in main, then run the application.
(idb) alias pv(x) "begin; print(x)" # Define the alias "pv" to invoke "begin", then print an argument.
(idb) pv(i) # Invoke "pv" with i as an argument.
The following two examples define aliases with definitions that contain quoted strings, and then display the definitions:
(idb) alias ada "ignore sigalrm; ignore sigfpe; set $lang=\"Ada\";"
(idb) alias ada
ada ignore sigalrm; ignore sigfpe; set $lang="Ada";
(idb) alias x "set $lang=\"C++\" "
(idb) alias x
x set $lang="C++"
Notice that in the first example there is a semicolon between the last two quotation marks. In the second example there is a space. The two quotation marks cannot be together. They must be separated by a space or character.
See Alsounalias (idb mode only)define (gdb mode only)

88
7 Intel® Debugger Command Reference
assign (idb mode only) Change a program variable.
Syntaxassign target = ["filename"]value
Parameters
Description
This command changes the value of a program variable, memory address, or expression that is accessible according to the scope and visibility rules of the language. The expression can be any expression that is valid in the current context.
For C++, use the assign command to modify static and object data members in a class, and variables declared as reference types, type const, or type static. You cannot change the address referred to by a reference type, but you can change the value at that address.
Do not use the assign command to change the PC. When you change the PC, no adjustment to the contents of registers or memory is made. Because most instructions change registers or memory in ways that can impact the meaning of the application, changing the PC is very likely to cause your application to calculate incorrectly and arrive at the wrong answer. Access violations and other errors and signals may result from changing the value in the PC.
Example(idb) assign x = 0
(idb) assign p->s.f[i] = 1
(idb) assign A::B::m = 2
target The variable, memory address, expression, or data member to be changed. This target can include a class name, object, pointer, or any other expression that describes how to access the memory that is to be assigned a value.
Use the normal language syntax to specify the target. For example, if you are targeting a class member variable, use classname::variable.
filename The name of the source code file that includes the variable you want change. You can include this parameter when you want to refer to a rescoped expression.
value The new value for the variable, memory address, or expression.

IDB Command Reference 7
89
(idb) assign *((int *) 0x12345678) = 4
See Alsoset variable (gdb mode only)

90
7 Intel® Debugger Command Reference
attach Connect to a running process.
Syntax
GDB Mode:
attach processid
IDB Mode:
attach processid [filename]
Parameters
Description
This command attaches the debugger to a process that is already running. You may find this necessary when you are debugging your application from outside of the debugger and find a bug.
Once you attach the debugger to a process, the process continues execution until it raises a signal that the debugger intercepts, such as SEGV. If you have set the $stoponattach debugger variable, the process stops immediately.
ExampleThe following example loads the symbol file a.out and then attaches it to the process with process ID 8492.
GDB Mode:
(idb) file a.out
(idb) attach 8492
IDB Mode:
(idb) attach 8492 a.out
processid The ID of the process to which you want to connect.
filename IDB mode only.
The name of the executable file of the process. You may omit filename only if the debugger has already loaded the file. If a file name is not specified, the debugger uses the current executable. If the executable contains symbolic debug information, the debugger reads it while attaching.

IDB Command Reference 7
91
See Alsodetachdisconnect (gdb mode only)“$stoponattach” in Chapter 8

92
7 Intel® Debugger Command Reference
awatch (gdb mode only) Set a watchpoint on a specified expression.
Syntaxawatch expr
Parameters
Description
This command sets a watchpoint on the specified expression. When the debuggee reads the value of the specified expression or writes to it, it stops.
Watchpoints are also referred to as data breakpoints.
See Alsorwatch (gdb mode only)watch (gdb mode only)watch (idb mode only)
expr The expression on which to set the watchpoint.

IDB Command Reference 7
93
backtrace (gdb mode only) Print a backtrace of stack frames.
Syntaxbacktrace [full] [num]
Parameters
Description
This command prints a backtrace, which illustrates how your program arrived at its present position.
When you do not include any parameters, the debugger displays a backtrace of the entire call stack, for all frames in the stack, printing one line per frame.
To stop the backtrace, press the Pause key.
ExampleThe following example prints the last three frames in the call stack.
(idb) backtrace 3
#0 0x08051c7c in IntNode::printNodeData (this=0x805c500) at src/x_list.cxx:94
#1 0x0804af73 in List<Node>::print (this=0xbfffa330) at src/x_list.cxx:168
#2 0x08051a3c in main () at src/x_list.cxx:203
See Alsodowndown-silently (gdb mode only)info stack (gdb mode only)upup-silently (gdb mode only)
full Instructs the debugger to print the values of the local variables.
num The number of stack frames to print, starting from the most recent.

94
7 Intel® Debugger Command Reference
break (gdb mode only) Set a breakpoint at a specified location.
Syntaxbreak [{func | line | *addr}] [if cond] [thread thread]
Parameters
Description
This command sets a breakpoint.
Whenever the program execution hits a breakpoint, the debugger suspends execution and waits for a command.
You can set a breakpoint at the entry of a particular function or at a source code line.
If you do not specify any parameters, the debugger sets the breakpoint at the next instruction to be executed.
Example(idb) break 200
Breakpoint 2 at 0x805197a: file src/x_list.cxx, line 200.
(idb) continue
Continuing.
Breakpoint 2, main () at src/x_list.cxx:200
200 CompoundNode* cNode2 = new CompoundNode(10.123, 5);
See Alsoclear (gdb mode only)commands (gdb mode only)condition (gdb mode only)
func The name of a function.
line A line number in a source code file.
addr An address.
cond A conditional expression. Execution stops when the debugger hits the specified location and this condition evaluates to TRUE.
thread A thread ID.

IDB Command Reference 7
95
delete breakpoint (gdb mode only)disableenablehelpidb synchronize (gdb mode only)ignore (gdb mode only)info breakpoints (gdb mode only)stop every (idb mode only)tbreak (gdb mode only)

96
7 Intel® Debugger Command Reference
call Call a function in the debuggee.
Syntaxcall expression (parmlist)
Parameters
Description
Specify the function as if you were calling it from within the application. If the function has no parameters, specify empty parentheses (()).
For multithreaded applications, the debugger calls the function in the context of the current thread. For C++ applications, when you set the $overloadmenu debugger variable to 1 and call an overloaded function, the debugger lists the overloaded functions and calls the function you specify. For class methods, you also need to specify the class instance. For example:
call classInstance.methodName( parmlist )
When the function you call completes normally, the debugger restores the stack and the current context that existed before the function was called.
The call command executes the specified function with the parameters you supply and then returns control to the debugger prompt when the function returns. The call command discards the return value of the function. If you embed the function call in the expression parameter of a print command, the debugger prints the return value after the function returns.
While the program counter is saved and restored, calling a function does not shield the program state from alteration if the function you call allocates memory or alters global variables. If the function affects global program variables, for instance, those variables will be changed permanently.
NOTE. Functions compiled without the debugger option to include debugging information may lack important parameter information and are less likely to yield consistent results when called.
expression Expression denoting a function.
parmlist List of parameters.

IDB Command Reference 7
97
ExampleIn the following example, the call command results in the return value being discarded while the embedded call passes the return value of the function to the print command, which in turn prints the value.
(idb) call earth->distance()
(idb) print earth->distance()
149600
See Alsoprint“$overloadmenu” in Chapter 8

98
7 Intel® Debugger Command Reference
catch (idb mode only)Catch a signal.
Syntaxcatch [signal_ID]
Parameters
Description
This command catches and handles the specified signal. You can specify the signal by integer number or by standard signal name, with or without the prefix SIG. The catch command is equivalent to the breakpoint command stop signal: For example, the command catch ILL is similar to stop signal SIGILL.
The catch and stop signal commands differ in the following ways:
• The debugger doesn’t make an entry in the breakpoint table for a catch command.
• A catch for a signal that is already being caught does not create an additional breakpoint for that signal.
A catch command without any parameter lists all signals currently being handled.
Example(idb) catch
INT, ILL, ABRT, FPE, SEGV, TERM, QUIT, TRAP, BUS, SYS, PIPE, URG, STOP, TTIN, TTOU, XCPU, XFSZ, PROF, USR1, USR2, VTALRM
See Alsocatch unaligned (idb mode only)ignore (idb mode only)stop signal (idb mode only)stop every (idb mode only)
signal_ID The signal for the debugger to catch and handle.

IDB Command Reference 7
99
catch unaligned (idb mode only)Catch unaligned accesses.
Syntaxcatch unaligned
Parameters
None
Description
This command catches unaligned accesses. It is very similar to the stop unaligned command.
This command differs from a normal catch command in the following ways:
• unaligned is not the name of a signal.
• There is no corresponding signal number.
• unaligned is never listed by either the catch or ignore commands without a parameter.
Like other catch commands, the following rules apply:
• The debugger doesn’t make an entry in the breakpoint table for a catch command.
• Repeating the command does not create an additional breakpoint.
You cannot specify unaligned in a signal detector of a normal breakpoint definition.
The default is catch unaligned. To override the default and tell the debugger to ignore unaligned accesses, use the following command:
(idb) ignore unaligned
However, if a breakpoint was defined using an unaligned access detector, then it must be disabled using a disable or delete breakpoint command.
Unaligned accesses are automatically handled and quietly corrected on Linux* OS. The debugger cannot catch these events.
See Alsoignore (idb mode only)catch unaligned (idb mode only)delete (idb mode only)disablestop every (idb mode only)

100
7 Intel® Debugger Command Reference
stop unaligned (idb mode only)

IDB Command Reference 7
101
class (idb mode only)Show or change the current class scope.
Syntaxclass [name]
Parameters
Description
This command lets you set the scope to a class in the program you are debugging. If you do not specify the class name, the command displays the current class context.
The new class context does not have to be a class on the current stack.
To set the scope to a function within a class, use the func command.
NOTE. You cannot have the scope set to a function and a class simultaneously. Setting the scope to a class moves the scope away from the function scope and vice versa. To return to the default (current function) scope, use the command func 0.
ExampleThis example shows how to use the class command to set the class scope to List<Node>. This makes member function append visible so a breakpoint can be set in append.
(idb) stop in appendSymbol "append" is not defined.append has no valid breakpoint address[#1: stop in append] pending(idb) class List<Node>class List<Node> {class Node* _firstNode;List(void);void append(class Node* const);void print(void) const;~List(void);(idb) stop in append[#2: stop in void List<Node>::append(class Node* const)]
name Name of a class. This parameter is optional only when there is a current class.

102
7 Intel® Debugger Command Reference
See Alsofunc (idb mode only)

IDB Command Reference 7
103
clear (gdb mode only) Delete a breakpoint at the specified location.
Syntaxclear [ { funcname | num } ]
Parameters
Description
This command removes any breakpoints at the specified line number or function entry. If you do not specify any parameter, it removes the breakpoints from the next instruction to be executed.
Example(idb) clear main
See Alsobreak (gdb mode only)delete (idb mode only)delete breakpoint (gdb mode only)disableignore (gdb mode only)info breakpoints (gdb mode only)
funcname The name of a function.
num The number of a source code line.

104
7 Intel® Debugger Command Reference
commands (gdb mode only) Create commands to be executed when the specified breakpoint is reached.
Syntaxcommands breakpointnum
command_list
end
Parameters
Description
This command associates a list of debugger commands with the specified breakpoint. Whenever the breakpoint stops execution, the debugger executes these commands.
This command only applies when you are using the debugger in command-line mode. It has no effect when you are using the Console window in the GUI.
To enter the list, write one command per line. End the list by typing a line that contains only the keyword end.
If the breakpoint already has a command list, this command list is overwritten by the new command list. You can enter an empty command list to remove a command list from a breakpoint.
Example(idb) commands 4
Type commands for when breakpoint 4 is hit, one per line.
End with a line saying just "end".
>print "the value of i is"
>print i
>disable 4
>end
breakpointnum ID of a breakpoint.
Default: Most recently-created breakpoint.
command_list List of IDB commands, one command per line. If you do not include this parameter, the debugger removes an existing command list from the breakpoint.

IDB Command Reference 7
105
See Alsobreak (gdb mode only)condition (gdb mode only)disableenableinfo breakpoints (gdb mode only)

106
7 Intel® Debugger Command Reference
complete (gdb mode only) List all the possible completions for the beginning of a command.
Syntaxcomplete string
Parameters
Description
This command lists all the possible completions for the beginning of a command.
Example(idb) complete p
path
p
printdbx
printf
ptype
pwd
See Alsohelp
string The beginning of the command to be completed.

IDB Command Reference 7
107
condition (gdb mode only) Specify a condition for a breakpoint.
Syntaxcondition breakpointnum [condexpr]
Parameters
Description
This command specifies a condition for breaking execution at a breakpoint.
When the specified breakpoint is encountered during execution, the debugger evaluates the specified expression. If the value of the expression is TRUE, the debugger stops executing the application. Otherwise, the debugger ignores the breakpoint.
See Alsobreak (gdb mode only)commands (gdb mode only)info breakpoints (gdb mode only)
breakpointnum ID of a breakpoint.
condexpr Expression denoting a logical condition.
If you do not specify this parameter, the debugger removes the condition from the breakpoint, and the breakpoint becomes an unconditional breakpoint.

108
7 Intel® Debugger Command Reference
cont (idb mode only) Continue program execution.
Syntaxcont [in loc]
cont [signal] [to source_line]
n cont [signal]
Parameters
Description
This command without a parameter continues program execution until the debugger encounters a breakpoint, a signal, an error, or normal process termination. Specify a signal parameter value to send an operating system signal to the process.
The signal parameter can be either a signal number or a string name, such as SIGSEGV. When you do not include this parameter, the process continues execution without specifying a signal. If you specify a signal, the process continues execution with that signal.
Use the in argument to continue until the debugger arrives at the function loc. The function name must be valid. If the function name is overloaded and you do not resolve the scope of the function in the command line, the debugger prompts you with the list of overloaded functions with that name from which to choose.
Use the to argument to resume execution and then halt when the debugger arrives at the source line source_line. The form of the optional to argument must be either:
• quoted_filename:line_number, which explicitly identifies both the source file and the line number where execution is to be halted.
• line_number, a positive number that indicates the line number of the current source file where execution is to be halted.
You can repeat the cont command n + 1 times by entering n cont.
loc A function name. Instructs the debugger to continue until it arrives at this function.
signal An integer constant or a signal name.
Default: 0
source_line A line specifier.
n The number of times to repeat the cont command.

IDB Command Reference 7
109
ExampleIn the following example, a cont command resumes process execution after it is suspended by a breakpoint.
(idb) list 195:7
> 195 nodeList.append(new IntNode(3)); {static int somethingToReturnTo; somethingToReturnTo++; }
196
197 IntNode* newNode2 = new IntNode(4);
198 nodeList.append(newNode2); {static int somethingToReturnTo; somethingToReturnTo++; }
199
200 CompoundNode* cNode2 = new CompoundNode(10.123, 5);
201 nodeList.append(cNode2); {static int somethingToReturnTo; somethingToReturnTo++; }
(idb) stop at 200
[#2: stop at "src/x_list.cxx":200]
(idb) cont
[2] stopped at [int main(void):200 0x0805197a]
200 CompoundNode* cNode2 = new CompoundNode(10.123, 5);
See Alsocontinue (gdb mode only)

110
7 Intel® Debugger Command Reference
continue (gdb mode only) Continue program execution.
Syntaxcontinue [number]
Parameters
Description
This command continues program execution until the debugger encounters a breakpoint, a signal, an error, or normal process termination.
The number parameter specifies the number of times to subsequently ignore a breakpoint at this location.
ExampleIn the following example, a continue command resumes process execution after it is suspended by a breakpoint.
(idb) list 195,+7
195 nodeList.append(new IntNode(3)); {static int somethingToReturnTo; somethingToReturnTo++; }
196
197 IntNode* newNode2 = new IntNode(4);
198 nodeList.append(newNode2); {static int somethingToReturnTo; somethingToReturnTo++; }
199
200 CompoundNode* cNode2 = new CompoundNode(10.123, 5);
201 nodeList.append(cNode2); {static int somethingToReturnTo; somethingToReturnTo++; }
(idb) break 200
Breakpoint 2 at 0x805197a: file src/x_list.cxx, line 200.
(idb) continue
Continuing.
Breakpoint 2, main () at src/x_list.cxx:200
number The number of times to ignore a breakpoint at this location.

IDB Command Reference 7
111
200 CompoundNode* cNode2 = new CompoundNode(10.123, 5);
See Alsocont (idb mode only)until (gdb mode only)

112
7 Intel® Debugger Command Reference
core-file (gdb mode only) Specify a core file as a target, or specify not to use a core file.
Syntaxcore-file [filename]
Parameters
Description
This command specifies a core file as a target or tells the debugger not to use a core file. Specify the file name of the core file to use it as a target.
Core file debugging is not supported on Mac OS* X.
This command without a filename parameter tells the debugger not to use a core file.
When you specify a core file, this command is the same as target core.
The debugger uses the core file as the contents of memory. Core files usually contain only some of the address space of the process that generated them. The debugger accesses the executable for the rest.
NOTE. The debugger ignores the core file when your program is actually running under the debugger. So if you have been running your program and you want to debug a core file instead, you must kill the subprocess in which the program is running, by using the kill command.
See Alsokilltarget core (gdb mode only)
filename filename of the target core file.

IDB Command Reference 7
113
define (gdb mode only) Create a user-defined command.
Syntaxdefine [commandname]
Parameters
Description
This command creates a new command that you define.
This command only applies when you are using the debugger in command-line mode. It has no effect when you are using the Console window in the GUI.
If a command with the name commandname already exists, the debugger prompts you to confirm the new definition.
The definition of a user-defined command may include:
• Commands.
• if, while, loop_break, and loop_continue commands.
• Up to 10 arguments separated by whitespace. Argument names are $arg0, $arg1, $arg2, ..., $arg9. The number of arguments is held in $argc.
To define a new command, enter define commandname, followed by each command on a separate line, and finally, enter end.
ExampleThe following example defines a new command, multiply, that prints the product of two numbers.
(idb) define multiply
> print $arg0 * $arg1
>end
To use the multiply command to find the product of 2 and 3, enter:
(idb) multiply 2 3
See AlsoUser-defined Commands
commandname Name of the command to create.

114
7 Intel® Debugger Command Reference
set max-user-call-depth (gdb mode only)show max-user-call-depth (gdb mode only)alias (idb mode only)show user (gdb mode only)

IDB Command Reference 7
115
delete (idb mode only) Delete all or specific breakpoints.
Syntaxdelete { all | ID,… }
Parameters
Description
This command deletes all breakpoints or the specified breakpoints.
ExampleThe following example deletes the breakpoints with the IDs 1 and 4. Use a comma to separate breakpoint IDs.
(idb) delete 1,4
See Alsodisableenablestatus (idb mode only)stop every (idb mode only)clear (gdb mode only)delete breakpoint (gdb mode only)
ID The ID of the breakpoint to be deleted.

116
7 Intel® Debugger Command Reference
delete breakpoint (gdb mode only) Delete all or a specific breakpoint.
Syntaxdelete breakpoint [ ID ]
Parameters
Description
This command deletes all breakpoints if you do not specify an ID, or it deletes the specified breakpoint if you do.
ExampleThe following example deletes the breakpoint with the ID 4.
(idb) delete breakpoint 4
See Alsobreak (gdb mode only)clear (gdb mode only)delete (idb mode only)disableignore (gdb mode only)info breakpoints (gdb mode only)
ID The ID of the breakpoint to be deleted.

IDB Command Reference 7
117
delsharedobj (idb mode only) Delete symbol information for a shared object.
Syntaxdelsharedobj filename
Parameters
Description
This command deletes symbol table information for a shared object from the debugger. That information was previously loaded using the readsharedobj command.
See Alsolistobj (idb mode only)readsharedobj (idb mode only)
filename File for which to remove the symbol information.

118
7 Intel® Debugger Command Reference
detach Detach the debugger from a running process.
Syntax
GDB Mode:
detach
IDB Mode:
detach [pid,…]
Parameters
Description
This command detaches the debugger from all running processes. When you detach, the debugger removes all breakpoints.
If you attached to a process using the attach command, the process continues to run, but the debugger can no longer identify or control it.
IDB Mode:
By default, the detach command detaches the debugger from the current process and, therefore, does not require a process ID. To detach a non-current process, specify the process ID.
ExampleGDB Mode:
(idb) detach
IDB Mode:
(idb) detach 12345, 789
See Alsoattachdisconnect (gdb mode only)
pid (IDB mode only.)
The process IDs of the processes from which to detach.

IDB Command Reference 7
119
directory (gdb mode only) Add directories to the list of source directories.
Syntaxdirectory [directory_name1[:…]]
Parameters
Description
This command deletes or adds directories to the list of source directories that the debugger uses to search for source and script files when opening an executable file.
The debugger maintains a list of source directories that it searches when opening an executable file.
To delete all directories that you have added to the list, use this command with no parameter.
To add one directory to the beginning of the list, specify directory_name.
To add multiple directories to the beginning of the list, specify directory_name separated by a colon (:) or whitespace.
When you specify a directory already in the list, the debugger moves that directory one position up in the list.
To get the full list of directories in the search list, use the show directories command.
Example(idb) show directories
Source directories searched: .:/home/hal/
(idb)
(idb) directory aa
Source directories searched: aa:.:/home/hal/
(idb)
(idb) directory cc:dd
Source directories searched: cc:dd:aa:.:/home/hal/
(idb)
directory_name Name of the directory to be prepended to the list of source directories.

120
7 Intel® Debugger Command Reference
(idb) directory ee:ff
Source directories searched: ee:ff:cc:dd:aa:.:/home/hal/
(idb)
(idb) directory aa
Source directories searched: aa:ee:ff:cc:dd:.:/home/hal/
See AlsoSpecifying Source DirectoriesSpecifying Source Path Substitution Rulesidb directory (gdb mode only)show directories (gdb mode only)unuse (idb mode only)use (idb mode only)

IDB Command Reference 7
121
disable Disable one or more breakpoints.
Syntax
GDB Mode:
disable [breakpointnum_1 breakpointnum_2 …]
IDB Mode:
disable { all | breakpointnum,… }
Parameters
Description
This command disables one or more breakpoints until you enable them.
When you set a breakpoint, it is enabled by default. When the debugger starts or resumes process execution, it first adapts the process so that it can detect when the specified events occur. You can disable a breakpoint so it does not interfere with determining when the process should next stop.
IDB Mode:
If you specify all, this command disables all breakpoints. Use a comma to separate breakpoint IDs.
GDB Mode:
If you don’t specify any parameter, this command disables all breakpoints. Use a space to separate breakpoint IDs.
ExampleThe following command disables the breakpoints with IDs 2 and 3.
IDB Mode:
(idb) disable 2,3
GDB Mode:
(idb) disable 2 3
See Alsobreak (gdb mode only)
breakpointnum The ID of a breakpoint.

122
7 Intel® Debugger Command Reference
clear (gdb mode only)delete (idb mode only)enablestop every (idb mode only)
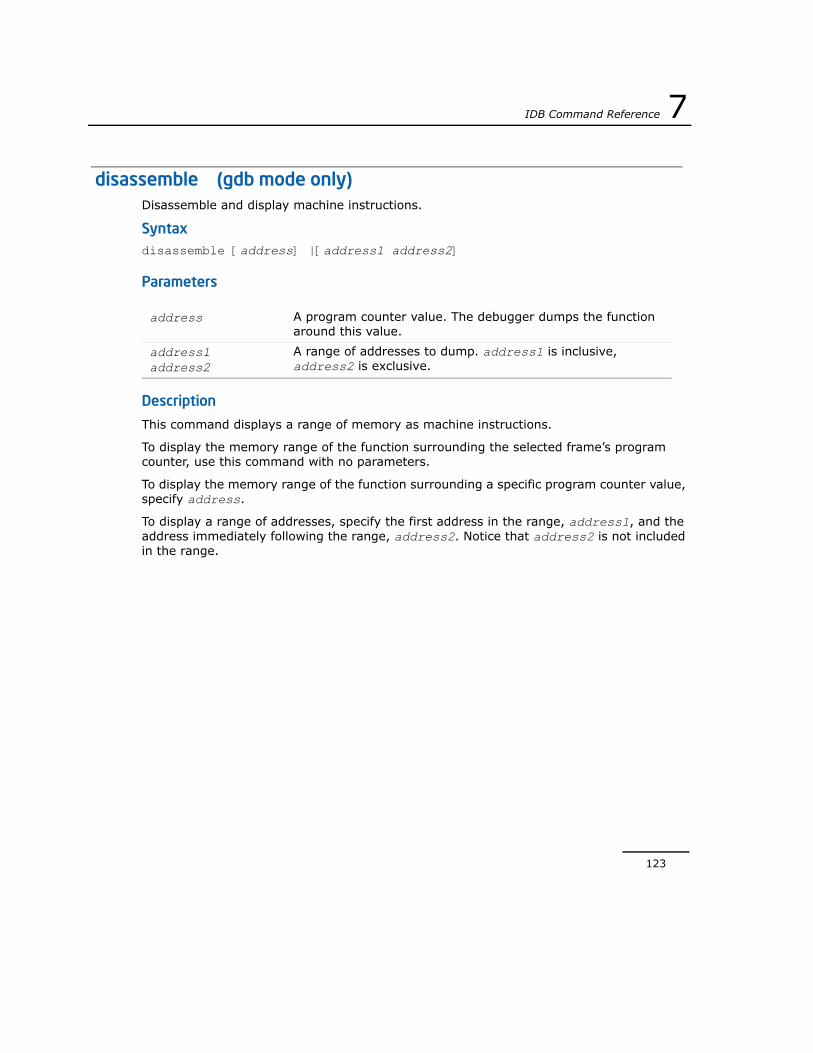
IDB Command Reference 7
123
disassemble (gdb mode only) Disassemble and display machine instructions.
Syntaxdisassemble [address] |[address1 address2]
Parameters
Description
This command displays a range of memory as machine instructions.
To display the memory range of the function surrounding the selected frame’s program counter, use this command with no parameters.
To display the memory range of the function surrounding a specific program counter value, specify address.
To display a range of addresses, specify the first address in the range, address1, and the address immediately following the range, address2. Notice that address2 is not included in the range.
address A program counter value. The debugger dumps the function around this value.
address1 address2
A range of addresses to dump. address1 is inclusive, address2 is exclusive.

124
7 Intel® Debugger Command Reference
disconnect (gdb mode only)Disconnect from all running processes and remove all breakpoints.
Syntaxdisconnect
ParametersNone.
Description
This command detaches the debugger from all running processes. When you detach, the debugger removes all breakpoints.
If you attached to a process using the attach command, the process continues to run, but the debugger can no longer identify or control it.
Example(idb) disconnect
See Alsoattachdetach
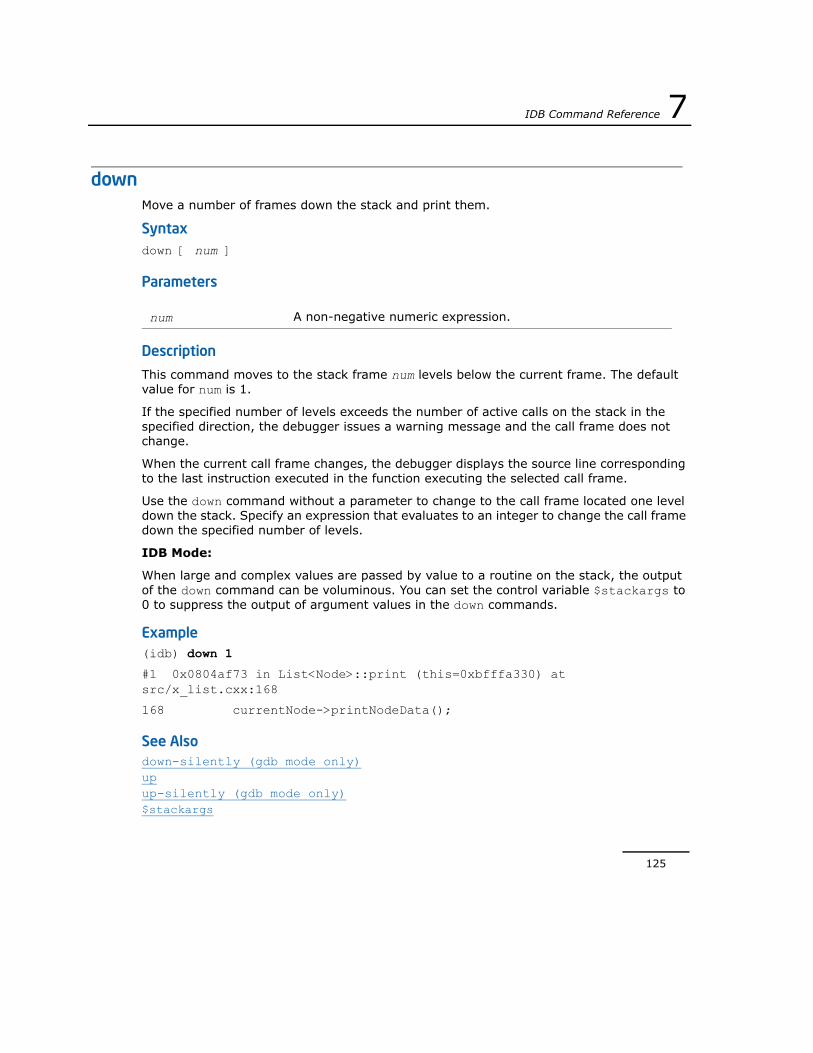
IDB Command Reference 7
125
down Move a number of frames down the stack and print them.
Syntaxdown [ num ]
Parameters
Description
This command moves to the stack frame num levels below the current frame. The default value for num is 1.
If the specified number of levels exceeds the number of active calls on the stack in the specified direction, the debugger issues a warning message and the call frame does not change.
When the current call frame changes, the debugger displays the source line corresponding to the last instruction executed in the function executing the selected call frame.
Use the down command without a parameter to change to the call frame located one level down the stack. Specify an expression that evaluates to an integer to change the call frame down the specified number of levels.
IDB Mode:
When large and complex values are passed by value to a routine on the stack, the output of the down command can be voluminous. You can set the control variable $stackargs to 0 to suppress the output of argument values in the down commands.
Example(idb) down 1
#1 0x0804af73 in List<Node>::print (this=0xbfffa330) at src/x_list.cxx:168
168 currentNode->printNodeData();
See Alsodown-silently (gdb mode only)upup-silently (gdb mode only)$stackargs
num A non-negative numeric expression.

126
7 Intel® Debugger Command Reference
down-silently (gdb mode only) Move a number of frames down the stack but do not print them.
Syntaxdown-silently [ num ]
Parameters
Description
This command moves to the stack frame num levels below the current frame. The default value for num is 1. This command is the same as down, except that it does not display the new frame.
If the specified number of levels exceeds the number of active calls on the stack in the specified direction, the debugger issues a warning message and the call frame does not change.
See Alsodownupup-silently (gdb mode only)
num A non-negative numeric expression.

IDB Command Reference 7
127
dump (idb mode only) List the parameters and local variables on the stack.
Syntaxdump [ {funcname|.} ]
Parameters
Description
This command lists all parameters and local variables of the specified function. If you specify a period (.), the debugger lists all parameters and local variables of all active functions (all functions currently on the stack). If you specify no parameter, the debugger assumes the current function.
Example(idb) dump
>0 0x08051a3c in main() "src/x_list.cxx":203
cNode=0x805c510
cNode1=0x805c528
cNode2=0x805c560
newNode=0x805c500
newNode2=0x805c550
nodeList=class List<Node> { ... }
See Alsoinfo locals (gdb mode only)
funcname Name of an active function in the debuggee.

128
7 Intel® Debugger Command Reference
echo (gdb mode only) Print a string.
Syntaxecho string
Parameters
Description
This command prints an expression.
This command only applies when you are using the debugger in command-line mode. It has no effect when you are using the Console window in the GUI.
You can include nonprinting characters in the string using C escape sequences such as \n to print a newline.
The debugger does not print a newline unless you specify one.
Typing a space does not require a backslash.
As in C, you can use a backslash at the end of text to continue the command onto subsequent lines.
ExampleThe following example illustrates using a backslash at the end of text to continue the command onto subsequent lines:
echo This text\n\
occupies\n\
multiple lines.\n
produces the same output as
echo This text\n
echo occupies\n
echo multiple lines.\n
string The string to print.

IDB Command Reference 7
129
edit (idb mode only) Edit the current source file or a specified file.
Syntaxedit [filename]
Parameters
Description
This command invokes the editor defined by the EDITOR environment variable.
The debugger passes the editor the file name to edit using filename. If you do not specify filename, the editor opens the current file. If no current file exists, the editor opens without a file.
If the EDITOR environment variable is undefined, the debugger invokes the vi editor.
ExampleThe following example opens the file chars.c in the Emacs* editor:
(idb) sh printenv EDITOR
emacs
(idb) file
chars.c
(idb) edit
The following example opens the file ~/foo/bar.f in the nedit editor:
(idb) sh printenv EDITOR
nedit
(idb) edit ~/foo/bar.f
See Alsofile (idb mode only)sh (idb mode only)
filename The name of the file to edit.

130
7 Intel® Debugger Command Reference
enable Enable one or more breakpoints.
Syntax
GDB Mode:
enable [breakpointnum_1 breakpointnum_2 …]
IDB Mode:
enable { all | breakpointnum_1,… }
Parameters
Description
This command enables one or more breakpoints until you disable them.
When you set a breakpoint, it is enabled by default. When the debugger starts or resumes process execution, it first adapts the process so that it can detect when the specified events occur. You can disable a breakpoint so that it is does not interfere with determining when the process should next stop.
IDB Mode:
If you specify all, this command enables all breakpoints. Use a comma to separate breakpoint IDs.
GDB Mode:
If you don’t specify any parameter, this command enables all breakpoints. Use a space to separate breakpoint IDs.
ExampleThe following command enables the breakpoints with IDs 2 and 3.
IDB Mode:
(idb) enable 2,3
GDB Mode:
(idb) enable 2 3
See Alsobreak (gdb mode only)
breakpointnum_n The ID of a breakpoint.

IDB Command Reference 7
131
clear (gdb mode only)delete (idb mode only)disablestop every (idb mode only)

132
7 Intel® Debugger Command Reference
exit (idb mode only)Exit the debugger.
Syntaxexit [exit_status]
Parameters
Description
This command exits the debugger. This command is equivalent to quit.
See Alsoquit
exit_status An expression for the exit status.

IDB Command Reference 7
133
expand aggregated message Expand the specified or most recent message.
Syntaxexpand aggregated message [msg,…]
Parameters
Description
This command is only useful when debugging massive parallel applications.
This command expands the specified messages. If you do not specify a message ID, the debugger expands the most recently added message.
The root debugger collects the outputs from the leaf debuggers and presents you with an aggregated output. In most cases, this aggregation works fine, but it can be an impediment if you want to know the exact output from certain leaf debuggers. To remedy this, the debugger assigns a unique message ID number to each aggregated message and saves the message in the message list.
You can control the length of the message list using the $aggregatedmsghistory debugger variable. If you set this variable to the default, 0, the debugger records as many messages as the system will allow.
See Alsoshow aggregated message$aggregatedmsghistory
msg A message ID.
Default: 0.

134
7 Intel® Debugger Command Reference
export (idb mode only) Set an environment variable or print all environment variables.
Syntaxexport [varname [ = value]]
Parameters
Description
This command sets an environment variable or prints all environment variables. The export and setenv commands without any variables are equivalent.
setenv is similar to export, except that export requires the equal sign to set a value, while setenv does not.
ExampleThe following example sets the environment variable EDITOR to use vi editor.
(idb) export EDITOR /usr/bin/vi
See Alsoprintenv (idb mode only)setenv (idb mode only)set environment (gdb mode only)
varname Name of the variable to be set or printed.
value The value to assign to the variable.

IDB Command Reference 7
135
file (gdb mode only) Load an executable file for debugging, or unload.
Syntaxfile [filename]
Parameters
Description
This command loads an executable file to execute under debugger control.
This command reads the symbolic information for an executable file and the shared libraries it uses, if available. Objects compiled without debug information do not have symbols to load.
If you specify filename, the debugger loads the specified executable. Without a parameter, the debugger unloads the current executable file.
Example(idb) file /home/user/examples/x_list
Reading symbols from /home/user/examples/x_list...done.
(idb) info files
Symbols from "/home/user/examples/x_list".
Unix child process:
Using the running image of child process 19438.
While running this, IDB does not access memory from...
Local exec file:
'/home/user/examples/x_list', file type <unknown>
0x8048000 - 0x8056e40 is .text
0x8057000 - 0x805deec is .data
0x805deec - 0x805dfb4 is .bss
Use the file command without any parameter to unload an executable file, as follows:
(idb) file
No executable file now.
filename The executable for the debugger to load.

136
7 Intel® Debugger Command Reference
No symbol file now.
See Alsoload (idb mode only)

IDB Command Reference 7
137
file (idb mode only) Switch to the specified source file.
Syntaxfile [filename]
Parameters
Description
This command displays the name of the current file scope, or switches the file scope. Change the file scope to see source code for or to set a breakpoint in a function not in the file currently being executed.
To display the name of the current file scope, do not include filename.
To change the name of the current file scope, include filename.
If the file name is not a literal, use the fileexpr command. For example, if you have a script that calculates a file name in a debugger variable or in a routine that returns a file name as a string, you can use fileexpr to set the file.
ExampleThe following example uses the file command to set the debugger file scope to a file different from the main program, and then stops at line number 26 in that file. This example also shows the fileexpr command setting the current scope back to the original file, which is solarSystem.cxx.
(idb) run
[1] stopped at [int main(void):114 0x080569f8]
114 unsigned int j = 1; // for scoping examples
(idb) file
/home/user/examples/solarSystemSrc/main/solarSystem.cxx
(idb) set $originalFile = "solarSystem.cxx"
(idb) list 36:10
36 Moon *enceladus = new Moon("Enceladus", 238, 260, saturn);
37 Moon *tethys = new Moon("Tethys", 295, 530, saturn);
38 Moon *dione = new Moon("Dione", 377, 560, saturn);
filename The name of the file for which you want to set the scope.
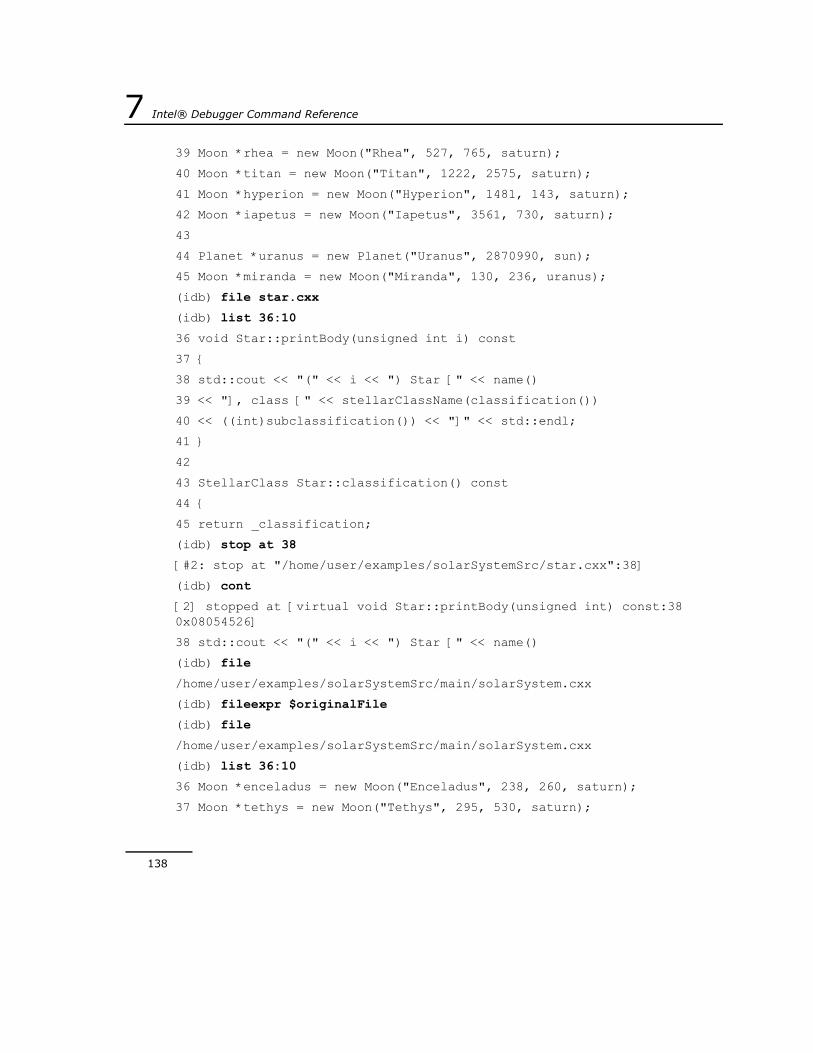
138
7 Intel® Debugger Command Reference
39 Moon *rhea = new Moon("Rhea", 527, 765, saturn);
40 Moon *titan = new Moon("Titan", 1222, 2575, saturn);
41 Moon *hyperion = new Moon("Hyperion", 1481, 143, saturn);
42 Moon *iapetus = new Moon("Iapetus", 3561, 730, saturn);
43
44 Planet *uranus = new Planet("Uranus", 2870990, sun);
45 Moon *miranda = new Moon("Miranda", 130, 236, uranus);
(idb) file star.cxx
(idb) list 36:10
36 void Star::printBody(unsigned int i) const
37 {
38 std::cout << "(" << i << ") Star [" << name()
39 << "], class [" << stellarClassName(classification())
40 << ((int)subclassification()) << "]" << std::endl;
41 }
42
43 StellarClass Star::classification() const
44 {
45 return _classification;
(idb) stop at 38
[#2: stop at "/home/user/examples/solarSystemSrc/star.cxx":38]
(idb) cont
[2] stopped at [virtual void Star::printBody(unsigned int) const:38 0x08054526]
38 std::cout << "(" << i << ") Star [" << name()
(idb) file
/home/user/examples/solarSystemSrc/main/solarSystem.cxx
(idb) fileexpr $originalFile
(idb) file
/home/user/examples/solarSystemSrc/main/solarSystem.cxx
(idb) list 36:10
36 Moon *enceladus = new Moon("Enceladus", 238, 260, saturn);
37 Moon *tethys = new Moon("Tethys", 295, 530, saturn);

IDB Command Reference 7
139
38 Moon *dione = new Moon("Dione", 377, 560, saturn);
39 Moon *rhea = new Moon("Rhea", 527, 765, saturn);
40 Moon *titan = new Moon("Titan", 1222, 2575, saturn);
41 Moon *hyperion = new Moon("Hyperion", 1481, 143, saturn);
42 Moon *iapetus = new Moon("Iapetus", 3561, 730, saturn);
43
44 Planet *uranus = new Planet("Uranus", 2870990, sun);
45 Moon *miranda = new Moon("Miranda", 130, 236, uranus);
See Alsofileexpr (idb mode only)info files (gdb mode only)list

140
7 Intel® Debugger Command Reference
fileexpr (idb mode only) Switch to the specified source file.
Syntaxfileexpr [expression]
Parameters
Description
This command is similar to file, but instead of specifying a literal file name, you can specify an expression. For example, if you have a script that calculates a file name in a debugger variable or in a routine that returns a file name as a string, you can use fileexpr to set the file.
Example(idb) set $originalFile = "solarSystem.cxx"
(idb) fileexpr $originalFile
See Alsofile (idb mode only)info files (gdb mode only)list
expression The name of the file to which you want to switch.

IDB Command Reference 7
141
finish (gdb mode only) Continue execution until the current function returns.
Syntaxfinish
ParametersNone.
Description
This command continues execution of the current function until it returns to its caller.
The finish command is sensitive to your location in the call stack. Suppose function A calls function B, which calls function C. Execution has stopped in function C, and you enter the up command, so you are now in function B, at the point where it called function C. Using the finish command here returns you to function A, at the point where function A called function B. Functions B and C have completed execution.
ExampleThe following example finishes the append method and returns control to the caller.
(idb) continue
Continuing.
Breakpoint 1, List<Node>::append (this=0xbfffcbe0, node=0x805c540) at src/x_list.cxx:151
151 Node* currentNode = _firstNode;
(idb) finish
main () at src/x_list.cxx:195
195 nodeList.append(new IntNode(3)); {static int somethingToReturnTo; somethingToReturnTo++; }
See Alsoreturn (idb mode only)run

142
7 Intel® Debugger Command Reference
focus (idb mode only) Change or display the current process set.
Syntaxfocus [ {expr|all} ]
Parameters
Description
This command changes or displays the current process set
The current process set is the set of processes that receive any commands you enter in the debugger.
To display the current process set, do not enter any parameters.
To change the process set to another set, specify the process set in expr.
To change the process set to the set that includes all processes, use the all parameter.
See AlsoWorking With Thread and Process Sets
expr The expression of the set to which you want to change.
all Sets the current set to the set that includes all processes.

IDB Command Reference 7
143
forward-search (gdb mode only) Search forward in the source for a string or repeat last search.
Syntaxforward-search [string]
Parameters
Description
This command searches forward, starting at the current position, in the current source file for the specified character string. If you do not specify string, the debugger uses the string of the most recent search. For example, if you search for the string ptr using the command forward-search ptr, and then enter forward-search without specifying a string, the debugger searches for the string ptr.
The debugger interprets the rest of the line to be the search string, so you do not need to quote the string. The debugger executes alias expansion on whatever precedes this command on the same line, possibly changing the search string.
When the debugger finds a match, it lists the line number and the line. That line becomes the starting point for any further searches, or for a list command.
Example(idb) forward-search _firstNode
69 NODETYPE* _firstNode;
In the following example, the second forward-search also searches for the next existence of 'ptr' on source file.
(idb) forward-search ptr
(idb) forward-search
See Alsoreverse-search (gdb mode only)search (gdb mode only)
string The character string to search for.

144
7 Intel® Debugger Command Reference
frame (gdb mode only) Show or change the current function scope.
Syntaxframe [expr]
Parameters
Description
This command shows or changes the current function scope.
The expr parameter can be a frame number or an address. Frame zero is the frame that is currently executing, frame one called frame zero, and so on. The frame with the highest number is for main.
You may find it useful to specify an address if a bug has damaged the stack frame chaining, making it impossible for the debugger to properly assign numbers to frames. You may also find it useful when your application switches between multiple stacks.
A running application maintains a call stack that contains information about its functions that have been called. Each item in the stack is a call frame, and each frame contains both the information needed to return to its caller and the information needed to provide the local variables of the function.
When your program starts, the call stack has only one frame, that of the function main. Each function call pushes a new frame onto the stack, and each function return removes the frame for that function from the stack. Recursive functions can generate many frames.
See Alsofunc (idb mode only)downup
expr The frame to use as the starting point.

IDB Command Reference 7
145
func (idb mode only) Show or change the current function scope.
Syntaxfunc [func_name | num ]
Parameters
Description
This command shows or changes the current frame.
To change the current frame to the call frame of a function in the call stack, specify the func_name parameter. If the function occurs more than once in the call stack, the most-recently entered call frame for that function becomes the current call frame.
To display the name of the current call frame's function, use the func command without any parameters.
To return to the current function scope, which is the default, use the command func 0.
If no frames are available to select, the debugger context is set to the static context of the named function. The current scope and current language are set based on that function. Types and static variables local to that function are now visible and can be evaluated.
To move the debugger to a specific frame level, specify that level with num. This is equivalent to entering up n at the level 0 function.
NOTE. You cannot have the scope set to a function and a class simultaneously. Setting the scope to a class moves the scope away from the function scope and vice versa. To return to the default (current function) scope, use the command func 0.
ExampleClass B is a context outside B::doAFoobar. The following example sets the context at the function doAFoobar, a function member of the class B:
(idb) func B::doAFoobar
func_name The name of the function to which you want to change the function scope.
num An integer, the debugger moves to the frame at level n.

146
7 Intel® Debugger Command Reference
See Alsoclass (idb mode only)downupframe (gdb mode only)
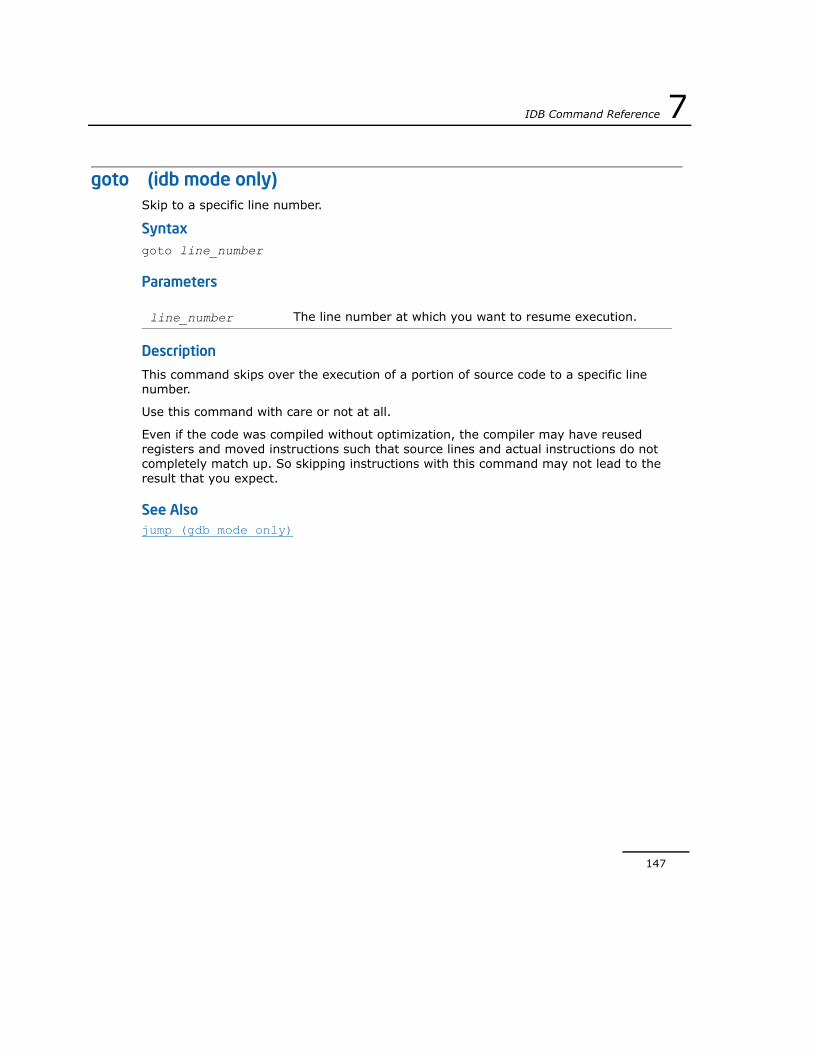
IDB Command Reference 7
147
goto (idb mode only) Skip to a specific line number.
Syntaxgoto line_number
Parameters
Description
This command skips over the execution of a portion of source code to a specific line number.
Use this command with care or not at all.
Even if the code was compiled without optimization, the compiler may have reused registers and moved instructions such that source lines and actual instructions do not completely match up. So skipping instructions with this command may not lead to the result that you expect.
See Alsojump (gdb mode only)
line_number The line number at which you want to resume execution.

148
7 Intel® Debugger Command Reference
handle (gdb mode only) Set signal handling actions.
Syntaxhandle signal_name [ handle_keyword ]
Parameters
Description
This command defines how the debugger handles signals.
signal_name The name of the signal to handle.
handle_keyword The action to take on the signal. Must be one of the following:• stop. The debugger should stop your program when this
signal occurs. This implies the print keyword as well.• nostop. The debugger should not stop your program
when this signal occurs. It may still print a message telling you that the signal has occurred.
• print. The debugger should print a message when this signal occurs.
• noprint. The debugger should not mention the occurrence of the signal at all. This implies the nostop keyword as well.
• pass. The debugger should allow your program to handle this signal. Your program can handle the signal, or else it may terminate if the signal is fatal and not handled. pass and noignore have the same effect.
• nopass. The debugger should not allow your program to see this signal. nopass and ignore are synonyms.
• ignore. The debugger should not allow your program to see this signal. nopass and ignore are synonyms.
• noignore. The debugger should allow your program to see this signal; your program can handle the signal, or else it may terminate if the signal is fatal and not handled. pass and noignore have the same effect.

IDB Command Reference 7
149
The debugger can detect any occurrence of a signal in your program. You can define in advance how the debugger should handle each kind of signal. Normally, the debugger is set up to let some signals like SIGUSR1 be silently passed to the debuggee, but to stop your program immediately whenever an error signal happens. This command changes these settings.
Example(idb) info handle ILL
Unrecognized or ambiguous flag word: "ILL".
(idb) handle SIGILL nostop noprint
Signal Stop Print Pass to program Description
SIGILL No No No Illegal instruction
(idb) info handle SIGSEGV
Signal Stop Print Pass to program Description
SIGSEGV Yes Yes Yes Segmentation fault
(idb) info handle SIGALRM pass
Signal Stop Print Pass to program Description
SIGALRM No No Yes Alarm clock
See Alsoinfo handle (gdb mode only)info signals (gdb mode only)

150
7 Intel® Debugger Command Reference
help Display help for debugger commands.
Syntax
GDB Mode:
help [ topic ]
h [ topic ]
IDB Mode:
help [ topic | idb | command ]
Parameters
Description
GDB Mode:
This command displays a list of command classes, or help for specific commands or classes of commands.
To see a list of command classes, do not include any parameters.
To see a list of commands in a specific class, specify a command class for topic.
To see help for a specific command, specify a command for topic.
To list all parameters for a command, use the complete command.
IDB Mode:
This command displays a list of help topics, help for a topic, or help for a specific command.
To see a list of help topics, do not include any parameters. The debugger displays all available topics and describes how to access them.
topic GDB Mode:
A command or a class of commands.
IDB Mode:
The command or topic for which you want to view help.
idb IDB Mode:
Displays a list of command classes.
command IDB Mode:
Lists all available debugger commands.

IDB Command Reference 7
151
To see help for a specific topic, specify a topic for topic.
To see a list of available debugger commands, enter help command.
To see help for a specific command, specify a command for topic.
To see a list of function-oriented debugger commands, enter help idb.
See Alsocomplete (gdb mode only)

152
7 Intel® Debugger Command Reference
history (idb mode only)Show the most recently used debugger commands.
Syntaxhistory [num]
Parameters
Description
This command displays commands you have already entered.
To specify the number of commands to show, use the num parameter. The debugger displays that number of commands, starting with the most recent.
If you do not specify a number, the debugger displays the number of previous commands defined in the $historylines debugger variable. The default is 20.
Example(idb) history 7
18: stop at 182
19: run
20: stop at 103
21: delete 1
22: cont
23: print "history_EXAMPLE START"
24: history 7
See AlsoViewing the Command Historyset history saveset history size
num The number of commands to show, starting with the most recent.

IDB Command Reference 7
153
idb directory (gdb mode only)Add a directory to the list of source directories or reset the list.
Syntaxidb directory [ directory ]
Parameters
Description
This command is similar to the directory command. It differs in that:
• it does not ask for confirmation when resetting the list of source directories back to the default
• it only accepts a single directory parameter
Example(idb) idb directory
(idb) idb directory foo/bar
Source directories searched: foo/bar
See Alsodirectory (gdb mode only)
directory A single directory to be added to the list of source directories.

154
7 Intel® Debugger Command Reference
idb freeze (gdb mode only)Set the execution attribute of the specified threads to frozen.
Syntaxidb freeze [thread_set]
Parameters
Description
This command sets the execution attribute of the specified threads to frozen. If you do not specify any threads, the debugger uses the current thread.
A frozen thread does not resume when you resume executing a set of threads in the job.
To specify a thread set, use proper thread set notation. For example, to freeze thread 2, enter the following command:
idb freeze t:[2]
Example(idb) idb freeze t:[1:5]
(idb) idb freeze $myset
See Alsoidb info thread (gdb mode only)idb thaw (gdb mode only)idb uninterrupt (gdb mode only)Working With Thread and Process Sets: Overview
thread_set A thread set.

IDB Command Reference 7
155
idb info barrier (gdb mode only)Shows information for existing barriers in an OpenMP application.
Syntaxidb info barrier [ barrier_id, ... ]
Parameters
Description
An OpenMP barrier defines a point in an application that every thread of a particular set has to reach before thread execution continues.
This command displays the following information for any existing barriers, which you specify with barrier_id, in an OpenMP application:
• state
• the threads that reached the barrier
• the barrier’s location
• a list of tasks the barrier is waiting for
• the source code that created the current barrier
If you do not specify barrier_id, this command shows all existing barriers in the OpenMP application.
NOTE. This command is fully supported for OpenMP versions 3.0 and higher. For older versions, this command has restricted functionality.
See Alsoidb info lock (gdb mode only)idb info openmp thread tree (gdb mode only)idb info task (gdb mode only)idb info taskwait (gdb mode only)idb info team (gdb mode only)idb info thread (gdb mode only)
barrier_id A barrier ID.

156
7 Intel® Debugger Command Reference
idb info lock (gdb mode only)Shows information for existing locks in an OpenMP application.
Syntaxidb info lock [ lock_id, ... ]
Parameters
Description
The OpenMP runtime library contains various lock routines that you can use for synchronization.
This command displays the following information for any existing locks, which you specify with lock_id, in an OpenMP application:
• state
• type
• the tasks or threads holding references to the lock
• The tasks or threads that are waiting for the lock
• the lock’s location
• the source code that created the current lock
If you do not specify lock_id, this command shows all existing locks in the OpenMP application.
NOTE. This command is fully supported for OpenMP versions 3.0 and higher. For older versions, this command has restricted functionality.
See Alsoidb info barrier (gdb mode only)idb info openmp thread tree (gdb mode only)idb info task (gdb mode only)idb info taskwait (gdb mode only)idb info team (gdb mode only)idb info thread (gdb mode only)
lock_id A lock ID.

IDB Command Reference 7
157
idb info openmp thread tree (gdb mode only)Display the threads in the process in a tree format.
Syntaxidb info openmp thread tree
ParametersNone.
Description
This command displays the parent-child relationship among OpenMP tasks in a tree format. Each internal node in the tree is a task that has spawned other tasks. Tasks that have not spawned other tasks are displayed as leafnodes.
This command only displays current tasks and task teams, not destroyed tasks or task teams.
The debugger variable $threadlevel must be set to openmp to debug an OpenMP application. The debugger usually sets this variable automatically when you load an OpenMP application. Using this command causes an error message if $threadlevel is not set to openmp.
NOTE. This command is fully supported for OpenMP versions 3.0 and higher. For older versions, this command has restricted functionality.
See Alsoidb info barrier (gdb mode only)idb info lock (gdb mode only)idb info task (gdb mode only)idb info taskwait (gdb mode only)idb info team (gdb mode only)idb info thread (gdb mode only)

158
7 Intel® Debugger Command Reference
idb info task (gdb mode only)Display information for existing tasks in an OpenMP application.
Syntaxidb info task [ task_id, ... ]
Parameters
Description
This command displays the following information for any existing task, which you specify with task_id, in an OpenMP application.
• type
• state
• the thread executing the task
• the parent task
• the spawned tasks
• a task’s location
• the source code that created the current lock
If you do not specify task_id, this command shows all existing tasks in the OpenMP application.
NOTE. This command is fully supported for OpenMP versions 3.0 and higher. For older versions, this command has restricted functionality.
See Alsoidb info barrier (gdb mode only)idb info lock (gdb mode only)idb info openmp thread tree (gdb mode only)idb info taskwait (gdb mode only)idb info team (gdb mode only)idb info thread (gdb mode only)
task_id A task ID.

IDB Command Reference 7
159
idb info taskwait (gdb mode only)Display information for any existing taskwait.
Syntaxidb info taskwait [ taskwait_id, ... ]
Parameters
Description
An OpenMP taskwait is a specific task barrier. It defines a point in an application that all tasks generated by the current task or thread have to reach before thread execution continues.
This command displays the following information for any existing taskwait, which you specify with taskwait_id, in an OpenMP application.
• the binding task
• state
• the thread that reaches the taskwait
• the tasks the taskwait is waiting for
• the taskwait's location
If you do not specify taskwait_id, this command shows all existing tasks in the OpenMP application.
NOTE. This command is fully supported for OpenMP versions 3.0 and higher. For older versions, this command has restricted functionality.
See Alsoidb info barrier (gdb mode only)idb info lock (gdb mode only)idb info openmp thread tree (gdb mode only)idb info task (gdb mode only)idb info team (gdb mode only)idb info thread (gdb mode only)
taskwait_id A taskwait ID.

160
7 Intel® Debugger Command Reference
idb info team (gdb mode only)Display information for any existing team.
Syntaxidb info team [ team_id, ... ]
Parameters
Description
An OpenMP team is a set of one or more threads that are members of a parallel region.
This command displays the following information for any existing teams, which you specify with team_id, in an OpenMP application:
• the parent team
• the number of threads in a team
• the team’s location
If you do not specify team_id, this command shows all existing teams in the OpenMP application.
See Alsoidb info barrier (gdb mode only)idb info lock (gdb mode only)idb info openmp thread tree (gdb mode only)idb info task (gdb mode only)idb info taskwait (gdb mode only)idb info thread (gdb mode only)
team_id A team ID.

IDB Command Reference 7
161
idb info thread (gdb mode only)Show the specified threads in the process.
Syntaxidb info thread [ thread_id, ... ]
Parameters
Description
This command shows the following information for any threads you specify with thread_id:
• type
— native
A thread that the operating system created.
— unknown
In an OpenMP* process, the OpenMP* runtime library cannot determine the type of the thread.
— initial
In an OpenMP* process, the first thread in the process.
— omp
A thread that is created by the OpenMP runtime library.
— foreign
In an OpenMP* process, a thread that is not created by the OpenMP runtime library, such as the result of the application directly calling the thread creation function that the system thread library provided.
— monitoring
A thread that the OpenMP RTL created to monitor the execution of the OpenMP threads in the process.
• the IDs of the OS threads.
• the ID of the thread library.
• the execution attribute of the thread:
thread_id The ID of a thread.

162
7 Intel® Debugger Command Reference
— frozen
The thread does not resume when you resume executing a set of threads in the job.
— thawed
The thread resumes when you resume executing a set of threads in the job.
— uninterrupted
The thread continues running without being interrupted for events. It basically detaches the thread from the debugger's control.
• the current thread location.
If you do not specify thread_id, this command shows all existing threads.
Example(idb) idb info thread 1
* 1 initial thread 46912509908752 (LWP 10606) [thawed] stopped at 0x401ed3 in main at /users/hal/openmp_sample/openmp.c:82
See Alsoidb info barrier (gdb mode only)idb info lock (gdb mode only)idb info openmp thread tree (gdb mode only)idb info task (gdb mode only)idb info taskwait (gdb mode only)idb info team (gdb mode only)

IDB Command Reference 7
163
idb process (gdb mode only)Show or specify a process.
Syntaxidb process [ pid-expression | image-name ]
Parameters
Description
This command shows or specifies a process using the process ID number or the name of the image.
If you do not specify any parameters, the debugger shows the current process.
The debugger sets the context of the current process to the process ID, pid-expression, or the process that runs the named binary image, image-name. If there is more than one process running the same binary image, the debugger warns you and leaves the process context unchanged.
Example(idb) idb process
There is no current process.
You may start one by using the `file' or `attach' commands.
(idb) file ~/c_code/hello
Reading symbols from /home/hal/hello...done.
(idb) idb process
>localhost:6121 (/home/hal/hello) loaded.
(idb) detach ~/c_code/hello
(idb) idb process 6121
pid-expression A process ID.
image-name A binary image file name.

164
7 Intel® Debugger Command Reference
idb reentrancy (gdb mode only)Enable re-entrancy detection on a function.
Syntaxidb reentrancy { specifier | off | status }
Parameters
Description
This command does not apply to Mac OS* X.
This command enables re-entrancy detection on a line number, function or an address.
A re-entrant call occurs when more than one thread accesses an expression at the same time. This command enables you to break code execution at these re-entrant calls.
specifier Specifies a line number, a function name, or * and an address. If it is a line number or an address, the debugger marks the function that encloses the line or address for detection.
off Turns off function re-entrancy detection.
status Displays the status of function re-entrancy detection.

IDB Command Reference 7
165
idb session restore (gdb mode only)Load a session file to restore a session’s debug settings.
Syntaxidb session restore session_file
Parameters
Description
This command loads a session file to restore a session’s debug settings.
If session_file includes an absolute path, the debugger does not use $sessiondir.
NOTE. It is recommended that only experienced users use relative paths. Unless you have a specific reason to do otherwise, you should only provide a file name and not a path.
ExampleThe following example loads the session file $sessiondir/lastsession.my.
(idb) idb session restore lastsession.my
The following example loads the session file $sessiondir/../test.
(idb) idb session restore ../test
The following example uses an absolute path to load the session file /tmp/test.my.
(idb) idb session restore /tmp/test.my
See AlsoAbout Session HandlingRestoring a SessionAbout Session Handling in Command-line Modeidb session save (gdb mode only)
session_file The name of the session file.
If you don't specify a path, the file is stored in $sessiondir. If you include a relative path, the path is relative to $sessiondir.
Default: idb_customizations.cmd

166
7 Intel® Debugger Command Reference
idb session save (gdb mode only)Save a session’s debug settings to a file.
Syntaxidb session save [ session_file ]
Parameters
Description
This command saves a session’s debug settings to a file.
If session_file includes an absolute path, the debugger does not use $sessiondir.
NOTE. It is recommended that only experienced users use relative paths. Unless you have a specific reason to do otherwise, you should only provide a file name and not a path.
ExampleThe following example saves the session to $sessiondir/lastsession.my.
(idb) idb session save lastsession.my
The following example saves the session to $sessiondir/../test.
(idb) idb session save ../test
The following example uses an absolute path to save the session to /tmp/test.my.
(idb) idb session save /tmp/test.my
See Alsoidb session restore (gdb mode only)
session_file The name of the session file. If you include a relative path, the path is relative to $sessiondir.
Default: If you don’t specify this parameter, the session is stored in $sessiondir/idb_customizations.cmd.

IDB Command Reference 7
167
idb set openmp-serialization (gdb mode only)Enable or disable serial execution of parallel regions in an OpenMP* process.
Syntaxidb set openmp-serialization [ on | off ]
Parameters
Description
This command does not apply to Mac OS* X.
This command enables or disables serial execution of parallel regions in an OpenMP* process.
If you do not specify on or off, the debugger enables serial execution.
See Alsoidb show openmp-serialization (gdb mode only)
on Enable serial execution.
This is the default value.
off Disable serial execution.

168
7 Intel® Debugger Command Reference
idb set solib-path-substitute (gdb mode only)Substitute a directory path when loading shared libraries.
Syntaxidb set solib-path-substitute dir_path replacement_dir_path
Parameters
Description
This command is only available when debugging a remote target.
This command replaces a directory path that is specified in the debuggee’s binary when loading shared libraries.
Use this command if you want the debugger to search for shared libraries in a non-standard location.
ExampleThe following command defines the local copy of the main image:
(idb) file ~/src/foo.exe
The following command defines the actual binary to run:
(idb) idb file-remote /usr/tmp/foo.exe
The following command tells the debugger that when the actual target specified in the binary is /usr/lib/foo.so, the debugger should look in /tmp/shlib/foo.so:
(idb) idb set solib-path-substitute /usr/lib /tmp/shlib
See Alsoidb show solib-path-substitute (gdb mode only)idb unset solib-path-substitute (gdb mode only)
dir_path The shared library directory path specified in the debuggee.
replacement_dir_path The directory that replaces dir_path.

IDB Command Reference 7
169
idb sharing (gdb mode only)Disable or enable data sharing event detection.
Syntaxidb sharing {off | on}
Parameters
Description
This command does not apply to Mac OS* X.
This command disables or enables data sharing event detection.
See Alsoidb sharing event expand (gdb mode only)idb sharing event list (gdb mode only)idb sharing filter add file (gdb mode only)idb sharing filter add function (gdb mode only)idb sharing filter add range (gdb mode only)idb sharing filter add variable (gdb mode only)idb sharing filter delete (gdb mode only)idb sharing filter disable (gdb mode only)idb sharing filter enable (gdb mode only)idb sharing filter list (gdb mode only)idb sharing filter toggle (gdb mode only)idb sharing reset (gdb mode only)idb sharing status (gdb mode only)idb sharing stop (gdb mode only)
off Disables data sharing detection
on Enables data sharing detection

170
7 Intel® Debugger Command Reference
idb sharing event expand (gdb mode only)Display detailed information for data sharing detection events.
Syntaxidb sharing event expand [ event_id_list ]
Parameters
Description
This command does not apply to Mac OS* X.
This command displays detailed information for data sharing detection events. This command is similar to idb sharing event list, but more verbose.
If you do not specify an event ID, this command displays the last recorded event.
To view a list of events and their IDs, use the command idb sharing event list.
See Alsoidb sharing (gdb mode only)idb sharing event list (gdb mode only)idb sharing filter add file (gdb mode only)idb sharing filter add function (gdb mode only)idb sharing filter add range (gdb mode only)idb sharing filter add variable (gdb mode only)idb sharing filter delete (gdb mode only)idb sharing filter disable (gdb mode only)idb sharing filter enable (gdb mode only)idb sharing filter list (gdb mode only)idb sharing filter toggle (gdb mode only)idb sharing reset (gdb mode only)idb sharing status (gdb mode only)idb sharing stop (gdb mode only)
event_id_list A list of IDs separated by spaces. For example:
1 2 3

IDB Command Reference 7
171
idb sharing event list (gdb mode only)Display a summary of all data sharing detection events.
Syntaxidb sharing event list
ParametersNone.
Description
This command does not apply to Mac OS* X.
This command displays a summary of all data sharing detection events. This command is similar to idb sharing event expand, but less verbose.
See Alsoidb sharing (gdb mode only)idb sharing event expand (gdb mode only)idb sharing filter add file (gdb mode only)idb sharing filter add function (gdb mode only)idb sharing filter add range (gdb mode only)idb sharing filter add variable (gdb mode only)idb sharing filter delete (gdb mode only)idb sharing filter disable (gdb mode only)idb sharing filter enable (gdb mode only)idb sharing filter list (gdb mode only)idb sharing filter toggle (gdb mode only)idb sharing reset (gdb mode only)idb sharing status (gdb mode only)idb sharing stop (gdb mode only)

172
7 Intel® Debugger Command Reference
idb sharing filter add file (gdb mode only)Ignore data sharing events in the named file.
Syntaxidb sharing filter add file filename
Parameters
Description
This command does not apply to Mac OS* X.
This command tells the debugger to ignore data sharing events in the named file.
See Alsoidb sharing (gdb mode only)idb sharing event expand (gdb mode only)idb sharing event list (gdb mode only)idb sharing filter add function (gdb mode only)idb sharing filter add range (gdb mode only)idb sharing filter add variable (gdb mode only)idb sharing filter delete (gdb mode only)idb sharing filter disable (gdb mode only)idb sharing filter enable (gdb mode only)idb sharing filter list (gdb mode only)idb sharing filter toggle (gdb mode only)idb sharing reset (gdb mode only)idb sharing status (gdb mode only)idb sharing stop (gdb mode only)
filename The name of the file whose sharing events you want to ignore.

IDB Command Reference 7
173
idb sharing filter add function (gdb mode only)Ignore data sharing events in the named function.
Syntaxidb sharing filter add function function_name
Parameters
Description
This command does not apply to Mac OS* X.
This command tells the debugger to ignore data sharing events in the named function.
See Alsoidb sharing (gdb mode only)idb sharing event expand (gdb mode only)idb sharing event list (gdb mode only)idb sharing filter add file (gdb mode only)idb sharing filter add range (gdb mode only)idb sharing filter add variable (gdb mode only)idb sharing filter delete (gdb mode only)idb sharing filter disable (gdb mode only)idb sharing filter enable (gdb mode only)idb sharing filter list (gdb mode only)idb sharing filter toggle (gdb mode only)idb sharing reset (gdb mode only)idb sharing status (gdb mode only)idb sharing stop (gdb mode only)
function_name The name of the function whose sharing events you want to ignore.

174
7 Intel® Debugger Command Reference
idb sharing filter add range (gdb mode only)Ignore data sharing events in an address range.
Syntaxidb sharing filter add range start_address, end_address
Parameters
Description
This command does not apply to Mac OS* X.
This command tells the debugger to ignore data sharing events in the address range you specify.
See Alsoidb sharing (gdb mode only)idb sharing event expand (gdb mode only)idb sharing event list (gdb mode only)idb sharing filter add file (gdb mode only)idb sharing filter add function (gdb mode only)idb sharing filter add variable (gdb mode only)idb sharing filter delete (gdb mode only)idb sharing filter disable (gdb mode only)idb sharing filter enable (gdb mode only)idb sharing filter list (gdb mode only)idb sharing filter toggle (gdb mode only)idb sharing reset (gdb mode only)idb sharing status (gdb mode only)idb sharing stop (gdb mode only)
start_address The address at the start of the memory range.
end_address The address at the end of the memory range.

IDB Command Reference 7
175
idb sharing filter add variable (gdb mode only)Ignore data sharing events on the specified variable.
Syntaxidb sharing filter add variable variable [, size]
Parameters
Description
This command does not apply to Mac OS* X.
This command tells the debugger to ignore data sharing events on the specified variable.
If you specify size, the debugger ignores data sharing events on size bytes starting at variable. Otherwise, the debugger uses the size of variable. For example:
Example(idb) idb sharing filter add variable foo 8
(idb) idb sharing filter add variable *(struct X*)0xabcdabcd
See Alsoidb sharing (gdb mode only)idb sharing event expand (gdb mode only)idb sharing event list (gdb mode only)idb sharing filter add file (gdb mode only)idb sharing filter add function (gdb mode only)idb sharing filter add range (gdb mode only)idb sharing filter delete (gdb mode only)idb sharing filter disable (gdb mode only)idb sharing filter enable (gdb mode only)idb sharing filter list (gdb mode only)idb sharing filter toggle (gdb mode only)idb sharing reset (gdb mode only)idb sharing status (gdb mode only)idb sharing stop (gdb mode only)
variable A variable that you want to exempt from data sharing event detection.
size The size of a range of bytes, starting at variable, whose sharing events you want to ignore.

176
7 Intel® Debugger Command Reference
idb sharing filter delete (gdb mode only)Delete data sharing detection filters.
Syntaxidb sharing filter delete [ filter_id_list ]
Parameters
Description
This command does not apply to Mac OS* X.
This command deletes data sharing detection filters.
If you don’t specify a filter ID, this command deletes all filters.
To view a list of events and their IDs, use the command idb sharing filter list.
See Alsoidb sharing (gdb mode only)idb sharing event expand (gdb mode only)idb sharing event list (gdb mode only)idb sharing filter add file (gdb mode only)idb sharing filter add function (gdb mode only)idb sharing filter add range (gdb mode only)idb sharing filter add variable (gdb mode only)idb sharing filter disable (gdb mode only)idb sharing filter enable (gdb mode only)idb sharing filter list (gdb mode only)idb sharing filter toggle (gdb mode only)idb sharing reset (gdb mode only)idb sharing status (gdb mode only)idb sharing stop (gdb mode only)
filter_id_list A list of IDs separated by spaces. For example:
1 2 3

IDB Command Reference 7
177
idb sharing filter disable (gdb mode only)Disable data sharing detection filters.
Syntaxidb sharing filter disable [ filter_id_list ]
Parameters
Description
This command does not apply to Mac OS* X.
This command disables data sharing detection filters.
If you don’t specify a filter ID, this command disables all filters.
To view a list of events and their IDs, use the command idb sharing filter list.
See Alsoidb sharing (gdb mode only)idb sharing event expand (gdb mode only)idb sharing event list (gdb mode only)idb sharing filter add file (gdb mode only)idb sharing filter add function (gdb mode only)idb sharing filter add range (gdb mode only)idb sharing filter add variable (gdb mode only)idb sharing filter delete (gdb mode only)idb sharing filter enable (gdb mode only)idb sharing filter list (gdb mode only)idb sharing filter toggle (gdb mode only)idb sharing reset (gdb mode only)idb sharing status (gdb mode only)idb sharing stop (gdb mode only)
filter_id_list A list of IDs separated by spaces. For example:
1 2 3
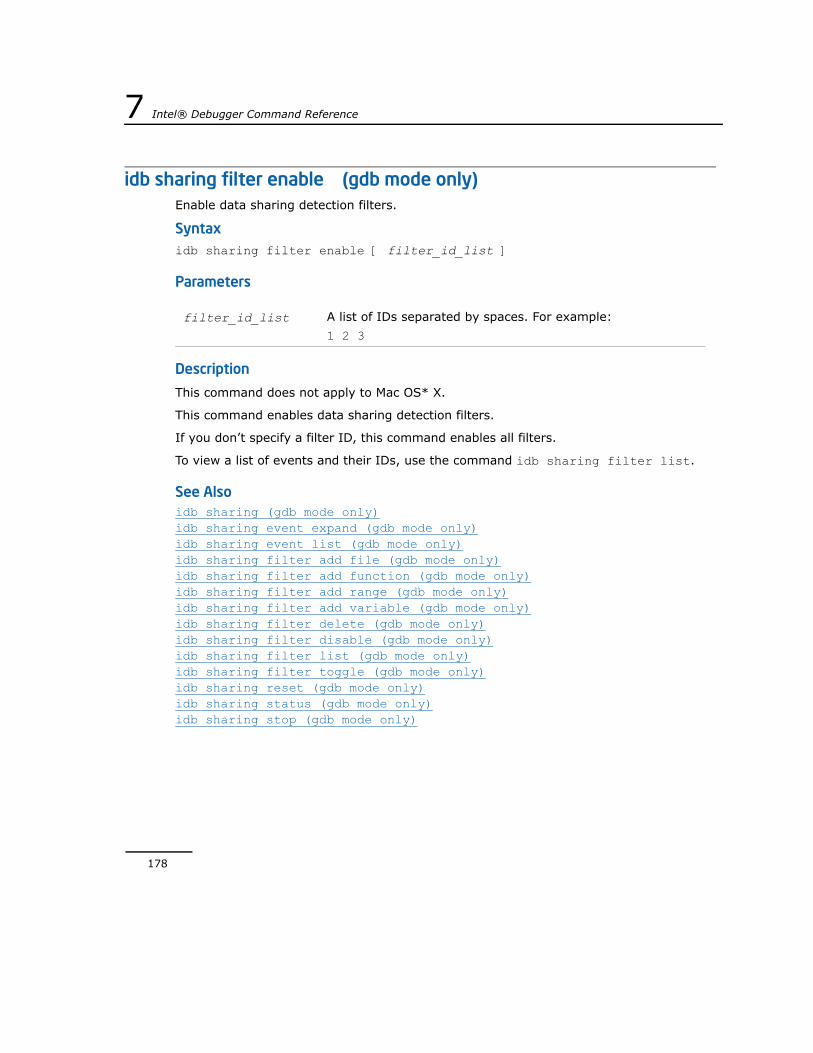
178
7 Intel® Debugger Command Reference
idb sharing filter enable (gdb mode only)Enable data sharing detection filters.
Syntaxidb sharing filter enable [ filter_id_list ]
Parameters
Description
This command does not apply to Mac OS* X.
This command enables data sharing detection filters.
If you don’t specify a filter ID, this command enables all filters.
To view a list of events and their IDs, use the command idb sharing filter list.
See Alsoidb sharing (gdb mode only)idb sharing event expand (gdb mode only)idb sharing event list (gdb mode only)idb sharing filter add file (gdb mode only)idb sharing filter add function (gdb mode only)idb sharing filter add range (gdb mode only)idb sharing filter add variable (gdb mode only)idb sharing filter delete (gdb mode only)idb sharing filter disable (gdb mode only)idb sharing filter list (gdb mode only)idb sharing filter toggle (gdb mode only)idb sharing reset (gdb mode only)idb sharing status (gdb mode only)idb sharing stop (gdb mode only)
filter_id_list A list of IDs separated by spaces. For example:
1 2 3

IDB Command Reference 7
179
idb sharing filter list (gdb mode only)List all data sharing detection filters.
Syntaxidb sharing filter list
ParametersNone.
Description
This command does not apply to Mac OS* X.
This command lists all data sharing detection filters.
See Alsoidb sharing (gdb mode only)idb sharing event expand (gdb mode only)idb sharing event list (gdb mode only)idb sharing filter add file (gdb mode only)idb sharing filter add function (gdb mode only)idb sharing filter add range (gdb mode only)idb sharing filter add variable (gdb mode only)idb sharing filter delete (gdb mode only)idb sharing filter disable (gdb mode only)idb sharing filter enable (gdb mode only)idb sharing filter toggle (gdb mode only)idb sharing reset (gdb mode only)idb sharing status (gdb mode only)idb sharing stop (gdb mode only)

180
7 Intel® Debugger Command Reference
idb sharing filter toggle (gdb mode only)Toggle data sharing detection filters.
Syntaxidb sharing filter toggle [ filter_id_list ]
Parameters
Description
This command does not apply to Mac OS* X.
This command toggles data sharing detection filters that you specify: It enables filters that are disabled, and disables filters that are enabled.
If you don’t specify a filter ID, this command toggles all filters.
To view a list of events and their IDs, use the command idb sharing filter list.
See Alsoidb sharing (gdb mode only)idb sharing event expand (gdb mode only)idb sharing event list (gdb mode only)idb sharing filter add file (gdb mode only)idb sharing filter add function (gdb mode only)idb sharing filter add range (gdb mode only)idb sharing filter add variable (gdb mode only)idb sharing filter delete (gdb mode only)idb sharing filter enable (gdb mode only)idb sharing filter list (gdb mode only)idb sharing reset (gdb mode only)idb sharing status (gdb mode only)idb sharing stop (gdb mode only)
filter_id_list A list of IDs separated by spaces. For example:
1 2 3

IDB Command Reference 7
181
idb sharing reset (gdb mode only)Clear the data sharing event list.
Syntaxidb sharing reset
ParametersNone.
Description
This command does not apply to Mac OS* X.
This command clears the data sharing event list.
See Alsoidb sharing (gdb mode only)idb sharing event expand (gdb mode only)idb sharing event list (gdb mode only)idb sharing filter add file (gdb mode only)idb sharing filter add function (gdb mode only)idb sharing filter add range (gdb mode only)idb sharing filter add variable (gdb mode only)idb sharing filter delete (gdb mode only)idb sharing filter disable (gdb mode only)idb sharing filter enable (gdb mode only)idb sharing filter list (gdb mode only)idb sharing filter toggle (gdb mode only)idb sharing status (gdb mode only)idb sharing stop (gdb mode only)

182
7 Intel® Debugger Command Reference
idb sharing status (gdb mode only)Show if data sharing detection is on or off.
Syntaxidb sharing status
ParametersNone.
Description
This command does not apply to Mac OS* X.
This command shows if data sharing detection is on or off.
See Alsoidb sharing (gdb mode only)idb sharing event expand (gdb mode only)idb sharing event list (gdb mode only)idb sharing filter add file (gdb mode only)idb sharing filter add function (gdb mode only)idb sharing filter add range (gdb mode only)idb sharing filter add variable (gdb mode only)idb sharing filter delete (gdb mode only)idb sharing filter disable (gdb mode only)idb sharing filter enable (gdb mode only)idb sharing filter list (gdb mode only)idb sharing filter toggle (gdb mode only)idb sharing reset (gdb mode only)idb sharing stop (gdb mode only)

IDB Command Reference 7
183
idb sharing stop (gdb mode only)Stop or continue the debuggee when a data sharing event occurs.
Syntaxidb sharing stop { on | off | status }
Parameters
Description
This command does not apply to Mac OS* X.
This command stops or continues the debuggee when a data sharing event occurs.
By default, the debugger stops the debuggee when a data sharing event occurs.
See Alsoidb sharing (gdb mode only)idb sharing event expand (gdb mode only)idb sharing event list (gdb mode only)idb sharing filter add file (gdb mode only)idb sharing filter add function (gdb mode only)idb sharing filter add range (gdb mode only)idb sharing filter add variable (gdb mode only)idb sharing filter delete (gdb mode only)idb sharing filter disable (gdb mode only)idb sharing filter enable (gdb mode only)idb sharing filter list (gdb mode only)idb sharing filter toggle (gdb mode only)idb sharing reset (gdb mode only)idb sharing status (gdb mode only)
on Stops the process. (default)
off Continues the process.
status Show if stop is on or off.

184
7 Intel® Debugger Command Reference
idb show openmp-serialization (gdb mode only)Show if serialization of parallel regions in an OpenMP process is enabled.
Syntaxidb show openmp-serialization
Parameters
None.
Description
This command does not apply to Mac OS* X.
This command shows if serialization of parallel regions in an OpenMP process is enabled. By default, it is enabled.
See Alsoidb set openmp-serialization (gdb mode only)

IDB Command Reference 7
185
idb show solib-path-substitute (gdb mode only)Show the replacement directory for loading shared libraries.
Syntaxidb show solib-path-substitute [ dir_path ]
Parameters
Description
This command shows the replacement directory path for the specified path in the target that the debugger uses to load shared libraries.
If you do not specify dir_path, the debugger shows all replacement directories.
Example(idb) idb set solib-path-substitute /usr/lib /tmp/shlib
(idb) idb set solib-path-substitute /usr/hal/lib /tmp/hal/shlib
(idb) idb show solib-path-substitute
/usr/lib => /tmp/shlib
/usr/hal/lib => /tmp/hal/shlib
(idb) idb show solib-path-substitute /usr/lib
/usr/lib => /tmp/shlib
See Alsoidb set openmp-serialization (gdb mode only)idb unset solib-path-substitute (gdb mode only)
dir_path The shared library directory path specified in the debuggee.

186
7 Intel® Debugger Command Reference
idb stopping threads (gdb mode only)Specify the threads that stop when a breakpoint is hit.
Syntaxidb stopping threads breakpoint_id [ thread_set ]
Parameters
Description
This command specifies the threads that stop when a breakpoint is hit.
Execution stops in all the threads you specify when the breakpoint is triggered.
To specify stopping threads, use thread set notation.
See Alsoinfo threads (gdb mode only)Process and Thread Set Notation
breakpoint_id The ID of the breakpoint whose stopping threads you want to specify.
thread_set A thread set. If you do not specify this parameter, all threads are stopping threads.

IDB Command Reference 7
187
idb synchronize (gdb mode only)Set a thread syncpoint at a location you specify.
Syntaxidb synchronize {func | line | *addr}, thread_set [if cond]
Parameters
Description
This command sets a thread syncpoint.
A syncpoint is an address in code. When a thread you want to synchronize reaches the syncpoint, the debugger stops that thread and freezes it. The syncpoint is hit when all the threads being synchronized have reached the syncpoint. The debugger thaws the threads being synchronized after the hit.
Syncpoints and breakpoints have the same attributes, except that when defining a breakpoint, you can optionally specify the threads that trigger it, whereas with a syncpoint, you specify the threads you want to synchronize.
When you specify cond, the debugger evaluates the condition every time a synchronized thread arrives at the syncpoint, in the context of that thread. If the condition evaluates to true, then the debugger stops the thread and freezes it. Otherwise, the debugger continues the thread.
The eventing thread of a syncpoint is the thread that arrives last at the syncpoint.
See AlsoWorking With Thread and Process Sets: Overviewclear (gdb mode only)delete breakpoint (gdb mode only)disableenable
func The name of a function.
line A line number in a source code file.
addr An address.
thread_set A thread set.
cond A conditional expression. Execution stops when the debugger hits the specified location and this condition evaluates to TRUE.

188
7 Intel® Debugger Command Reference
ignore (gdb mode only)info breakpoints (gdb mode only)

IDB Command Reference 7
189
idb target threads (gdb mode only)Specify the threads that subsequent mover commands apply to.
Syntaxidb target threads target_thread_set
Parameters
Description
This command specifies the threads that subsequent mover commands apply to. Mover commands are commands that advance the application, such as step or continue.
A subsequent mover command completes when all the target threads have reached the destination the mover specifies. If you or an event interrupts the command before it completes, the command aborts.
If a target thread is frozen, the command aborts with an error message.
The debugger does not evaluate target_thread_set when you issue idb target threads. It does so before executing each subsquent mover command. For example:
(idb) set $foo = t:[1]
(idb) idb target threads $foo
(idb) step
(idb) set $foo = t:[2]
(idb) step
The first step command steps thread 1, while the second step command steps thread 2.
NOTE. The thread command specifies the thread to which non-mover commands apply, so it doesn't interact with this command.
The default target thread set, the set that movers use before you issue idb target threads, contains the last eventing thread to match the current mover behaviors.
To specify thread sets, use thread set notation.
target_thread_set
A thread set.

190
7 Intel® Debugger Command Reference
See Alsoinfo threads (gdb mode only)threadProcess and Thread Set Notation

IDB Command Reference 7
191
idb thaw (gdb mode only)Set the execution attribute of the specified threads to thawed.
Syntaxidb thaw [thread_set]
Parameters
Description
This command sets the execution attribute of the specified threads to thawed. If you do not specify any threads, the debugger uses the current thread.
A thawed thread resumes when you resume executing a set of threads in the job.
To specify a thread set, use proper thread set notation. For example, to thaw thread 2, enter the following command:
idb thaw t:[2]
See Alsoidb freeze (gdb mode only)idb info thread (gdb mode only)idb uninterrupt (gdb mode only)Working With Thread and Process Sets: Overview
thread_set A thread set.
Use the proper threadset notation idb freeze 2
to freeze thread 2. Instead, you need to say
idb freeze t:[2]
You can say it's a "parameter restriction".

192
7 Intel® Debugger Command Reference
idb uninterrupt (gdb mode only)Set the execution attribute of the specified threads to uninterrupt.
Syntaxidb uninterrupt [thread_set]
Parameters
Description
This command sets the execution attribute of the specified threads to uninterrupt. If you do not specify any threads, the debugger uses the current thread.
An uninterrupted thread continues running without being interrupted for events. It basically detaches the thread from the debugger's control.
To specify a thread set, use proper thread set notation. For example, to specify thread 2 with this command, enter the following command:
idb uninterrupt t:[2]
See Alsoidb freeze (gdb mode only)idb info thread (gdb mode only)idb thaw (gdb mode only)Working With Thread and Process Sets: Overview
thread_set A thread set.

IDB Command Reference 7
193
idb unset solib-path-substitute (gdb mode only)Remove a path substitution rule.
Syntaxidb unset solib-path-substitute [ dir_path ]
Parameters
Description
This command removes a path substitution rule for dir_path that you set with idb set solib-path-substitute. If you do not specify dir_path, the debugger removes all replacements.
Example(idb) idb show solib-path-substitute
/usr/lib => /tmp/shlib
/usr/hal/lib => /tmp/hal/shlib
(idb) idb unset solib-path-substitute /usr/lib
(idb) idb show solib-path-substitute
/usr/hal/lib => /tmp/hal/shlib
See Alsoidb set openmp-serialization (gdb mode only)idb show solib-path-substitute (gdb mode only)
dir_path The shared library directory path specified in the debuggee.
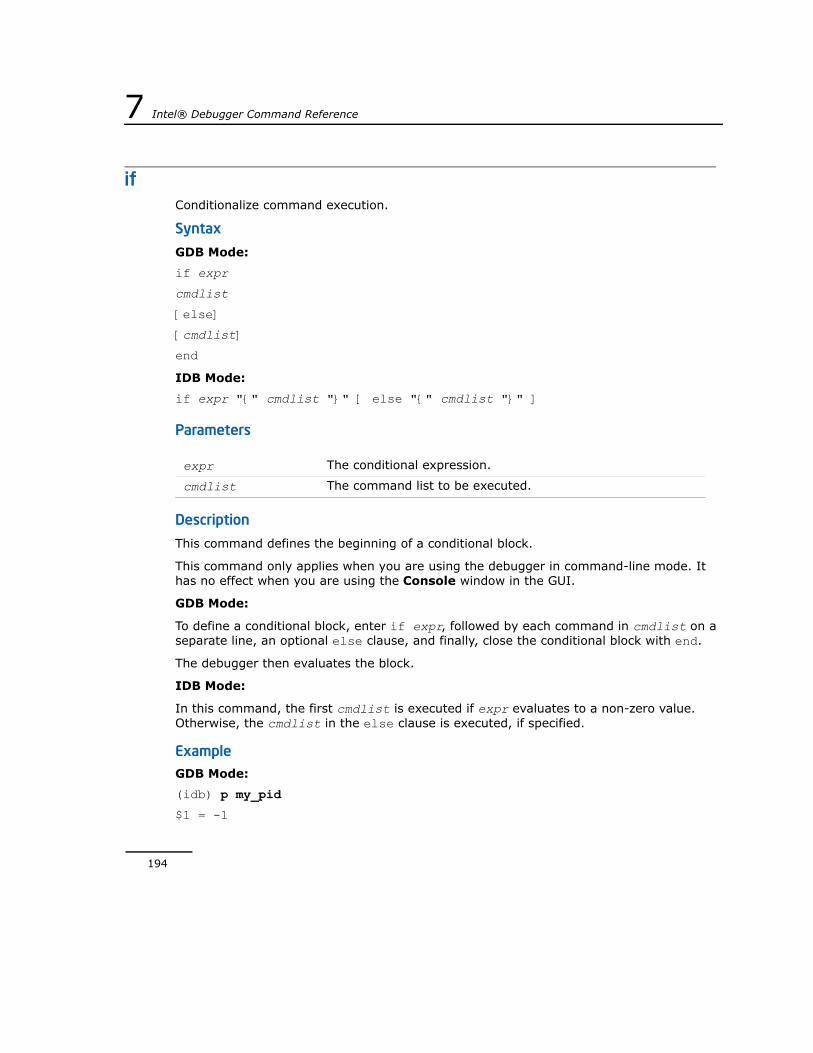
194
7 Intel® Debugger Command Reference
if Conditionalize command execution.
Syntax
GDB Mode:
if expr
cmdlist
[else]
[cmdlist]
end
IDB Mode:
if expr "{" cmdlist "}" [ else "{" cmdlist "}" ]
Parameters
Description
This command defines the beginning of a conditional block.
This command only applies when you are using the debugger in command-line mode. It has no effect when you are using the Console window in the GUI.
GDB Mode:
To define a conditional block, enter if expr, followed by each command in cmdlist on a separate line, an optional else clause, and finally, close the conditional block with end.
The debugger then evaluates the block.
IDB Mode:
In this command, the first cmdlist is executed if expr evaluates to a non-zero value. Otherwise, the cmdlist in the else clause is executed, if specified.
ExampleGDB Mode:
(idb) p my_pid
$1 = -1
expr The conditional expression.
cmdlist The command list to be executed.

IDB Command Reference 7
195
(idb) if my_pid == 0
> print "is zero"
> else
> print "is not zero"
>end
$2 = is not zero
(idb)
IDB Mode:
(idb) set $c = 1
(idb) assign pid = 0
(idb) if pid < $c { print "Greater" } else { print "Lesser" }
Greater
See Alsowhile
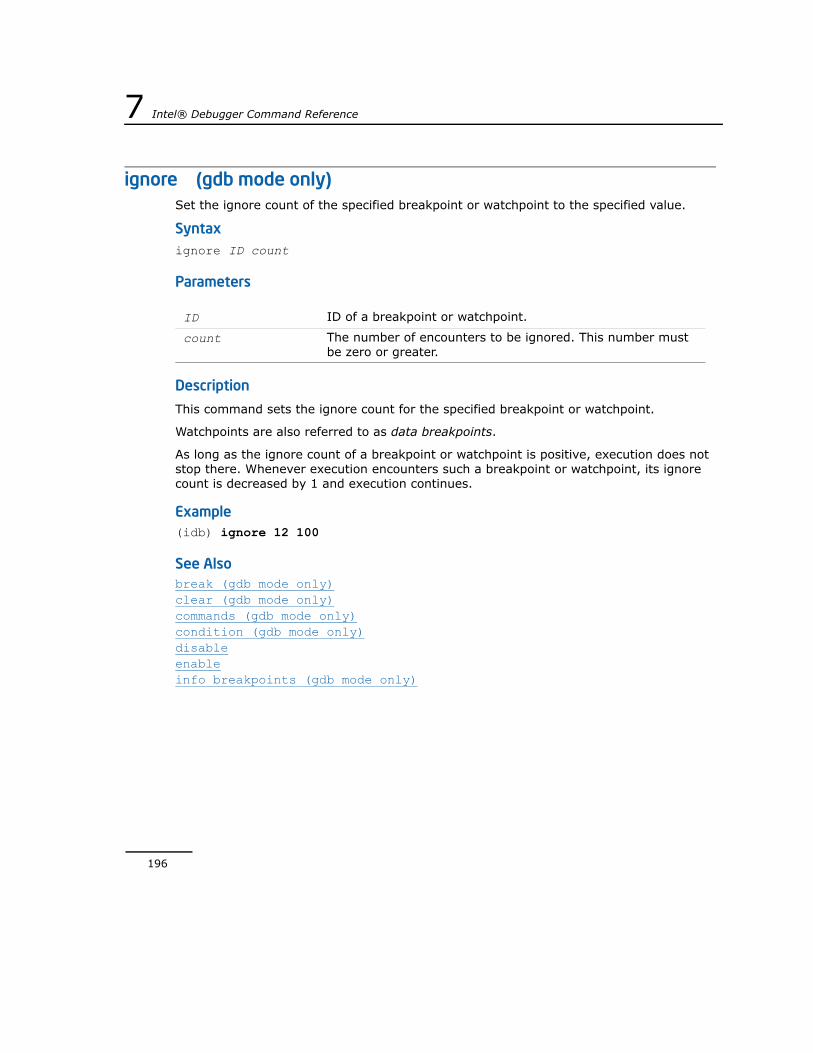
196
7 Intel® Debugger Command Reference
ignore (gdb mode only) Set the ignore count of the specified breakpoint or watchpoint to the specified value.
Syntaxignore ID count
Parameters
Description
This command sets the ignore count for the specified breakpoint or watchpoint.
Watchpoints are also referred to as data breakpoints.
As long as the ignore count of a breakpoint or watchpoint is positive, execution does not stop there. Whenever execution encounters such a breakpoint or watchpoint, its ignore count is decreased by 1 and execution continues.
Example(idb) ignore 12 100
See Alsobreak (gdb mode only)clear (gdb mode only)commands (gdb mode only)condition (gdb mode only)disableenableinfo breakpoints (gdb mode only)
ID ID of a breakpoint or watchpoint.
count The number of encounters to be ignored. This number must be zero or greater.

IDB Command Reference 7
197
ignore (idb mode only) Ignore the specified signal.
Syntaxignore [signal]
Parameters
Description
This command ignores the specified signal.
To refrain from catching or handling the specified signal and pass it to your program, include signal. This command is equivalent to deleting the breakpoint created by a catch command for that signal.
To list all signals currently being ignored, do not include a signal parameter.
Example(idb) ignore SIGILL
(idb) ignore
RTMIN, RTMIN1, RTMIN2, RTMIN3, RTMIN4, RTMIN5, RTMIN6, RTMIN7, RTMAX, RTMAX7, RTMAX6, RTMAX5, RTMAX4, RTMAX3, RTMAX2, RTMAX1, HUP, KILL, ALRM, TSTP, CONT, CHLD, WINCH, POLL
See Alsocatch (idb mode only)
signal The signal to be ignored.

198
7 Intel® Debugger Command Reference
info args (gdb mode only) Print the arguments of the current frame.
Syntaxinfo args
ParametersNone.
Description
The command prints the arguments of the selected frame, each on a separate line.

IDB Command Reference 7
199
info breakpoints (gdb mode only) Print information about one or more breakpoints.
Syntaxinfo breakpoints [expr]
Parameters
Description
This command prints information about the specified breakpoint. If you do not specify a breakpoint ID, the debugger prints information about all breakpoints.
Example(idb) info breakpoints
Num Type Disp Enb Address What
1 breakpoint keep y 0x08051603 in main at src/x_list.cxx:182
breakpoint already hit 1 time(s)
2 breakpoint keep y 0x0804ae5a in List<Node>::append(Node * const) at src/x_list.cxx:148
breakpoint already hit 1 time(s)
3 watchpoint keep y _firstNode
See Alsobreak (gdb mode only)clear (gdb mode only)commands (gdb mode only)condition (gdb mode only)disableenablehelpignore (gdb mode only)status (idb mode only)tbreak (gdb mode only)
expr An expression denoting the ID of a breakpoint

200
7 Intel® Debugger Command Reference
info files (gdb mode only) Print the names of the files in the debuggee.
Syntaxinfo files
ParametersNone.
Description
This command prints the names of the following files in the debuggee:
• the executable file
• the core dump files that the debugger is currently using
• the files from which the debugger loaded symbols
This command is equivalent to info target.
Example(idb) info files
Symbols from "/site/spt/usr1/c_code/hello".
Child process:
Using the running image of child process 5133.
While running this, IDB does not access memory from...
Local exec file:
'/site/spt/usr1/c_code/hello', file type <unknown>
0x8048000 - 0x80485fc is .text
0x80495fc - 0x8049740 is .data
0x8049740 - 0x8049740 is .bss
See Alsoinfo target (gdb mode only)

IDB Command Reference 7
201
info functions (gdb mode only) Print names and types of functions.
Syntaxinfo functions [REGEXP]
Parameters
Description
This command prints the names and types of defined functions. If you do not include a regular expression, it prints the names and types of all defined functions. If you include a regular expression, it prints the names and data types of all defined functions whose name contains a match for the expression.
The debugger’s regular expression engine uses the Sun* Java* API class java.util.regex. For more information see www.sun.com.
For example, info functions .*uname finds all functions whose names include uname, info functions ^uname finds any functions whose names begin with uname. Use a backslash to escape special regular expression characters, such as foo*().
Example(idb) info functions
All defined functions:
File source/control.cpp:
Controller::Controller(void);
virtual float Controller::LimitingIO(float);
virtual void Controller::setDt(float);
virtual void Controller::setMax(void);
Controller::~Controller(void);
virtual float DController::calculate(float, float);
int runCplus(void);
char * table<char>::insert(char&, int);
table<char>::table(int);
table<char>::~table(void);
REGEXP A regular expression.

202
7 Intel® Debugger Command Reference
int * table<int>::insert(int&, int);
table<int>::table(int);
table<int>::~table(void);
<opaque> _Exit(...);

IDB Command Reference 7
203
info handle (gdb mode only) Print available signals and signal setting information.
Syntaxinfo handle
ParametersNone.
Description
This command prints a list of available signals and the current settings for signal handling. You can change these settings with the handle command.
Example(idb) info handle
Signal Stop Print Pass to program Description
SIGHUP No No Yes Hangup
SIGINT Yes Yes No Interrupt
...
See Alsohandle (gdb mode only)info signals (gdb mode only)

204
7 Intel® Debugger Command Reference
info line (gdb mode only) Print start and end address of specified source line.
Syntaxinfo line num
Parameters
Description
This command prints the start and end address of the compiled code for the specified source line.
You can specify source lines in any of the formats described for the list command.
See Alsolist
num Source line for which you want the start and end address printed.

IDB Command Reference 7
205
info locals (gdb mode only) Print local variables of the selected function.
Syntaxinfo locals
ParametersNone.
Description
This command prints the local variables of the selected function, each on a separate line. These variables are all declared as either static or automatic, and are accessible at the point of execution of the selected frame.
See Alsodump (idb mode only)

206
7 Intel® Debugger Command Reference
info program (gdb mode only) Print information about the debuggee.
Syntaxinfo program
ParametersNone.
Description
This command prints the following information about the status of the debuggee:
• whether it is running
• the process ID
• at which address it stopped
• the reason it stopped
Example(idb) info program
Using the running image of child process 23606.
Program stopped at 0x804b70c.
It stopped at breakpoint 3.

IDB Command Reference 7
207
info registers (gdb mode only) Print registers and their contents.
Syntaxinfo registers [ $register_name ]
Parameters
Description
This command displays the contents of a register when you specify register_name, or all registers and their contents when you do not. This command enables you to examine sets of registers and individual registers.
ExampleThe following example shows how to examine sets of registers:
(idb) info registers $sp
$14 = (void *) 0xbfffe2cc
(idb) info registers
$eax 0x1 1
$ecx 0xbfffe42c -1073748948
$edx 0xbfffe3b0 -1073749072
$ebx 0xb74e7d98 -1219592808
$esp [$sp] 0xbfffe2cc (void *) 0xbfffe2cc
...
The following example shows two ways to examine the eax register:
(idb) info registers $eax
$eax 0x4 4
(idb) print $eax
$2 = 4
See Alsoprintprintregs (idb mode only)
register_name The name of a register.

208
7 Intel® Debugger Command Reference
info share (gdb mode only) Print the names of shared libraries.
Syntaxinfo share
ParametersNone.
Description
This command is a synonym for info sharedlibrary.
See Alsoinfo sharedlibrary (gdb mode only)

IDB Command Reference 7
209
info sharedlibrary (gdb mode only) Print the names of shared libraries.
Syntaxinfo sharedlibrary
ParametersNone.
Description
This command prints the names of all currently loaded shared libraries.
Example(idb) info sharedlibary
From To Syms Read Shared Object Library
0xb7f97000 0xb7fb16df No /lib/ld-2.5.so
0xb7b80000 0xb7bc21ef No /myapp/lib/libintlc.so.5
0xb7bc4000 0xb7e0fbd3 No /myapp/lib/libimf.so
0xb7e10000 0xb7e1307b No /lib/tls/i686/cmov/libdl-2.5.so
0xb7e14000 0xb7f545a3 No /lib/tls/i686/cmov/libc-2.5.so
0xb7f55000 0xb7f60343 No /lib/libgcc_s.so.1
0xb7f61000 0xb7f8707f No /lib/tls/i686/cmov/libm-2.5.so
0xb7f93000 0xb7f94e47 No /user/hal/workdir/libbpshr.so
See Alsoinfo share (gdb mode only)

210
7 Intel® Debugger Command Reference
info signals (gdb mode only) Print signal setting information.
Syntaxinfo signals
ParametersNone.
Description
This command is a synonym for info handle.
See Alsoinfo handle (gdb mode only)

IDB Command Reference 7
211
info source (gdb mode only) Print information about the current source file.
Syntaxinfo source
ParametersNone.
Description
This command prints the following information about the the source file for the function containing the current point of execution, as specified during compilation:
• the name of the source file, and the directory containing it
• the directory in which it was compiled
• its length, in lines
• in which programming language it is written
• whether the executable includes debugging information for that file, and if so, the format of the information, such as STABS or Dwarf 2
• whether the debugging information includes information about preprocessor macros
See Alsoinfo sources (gdb mode only)
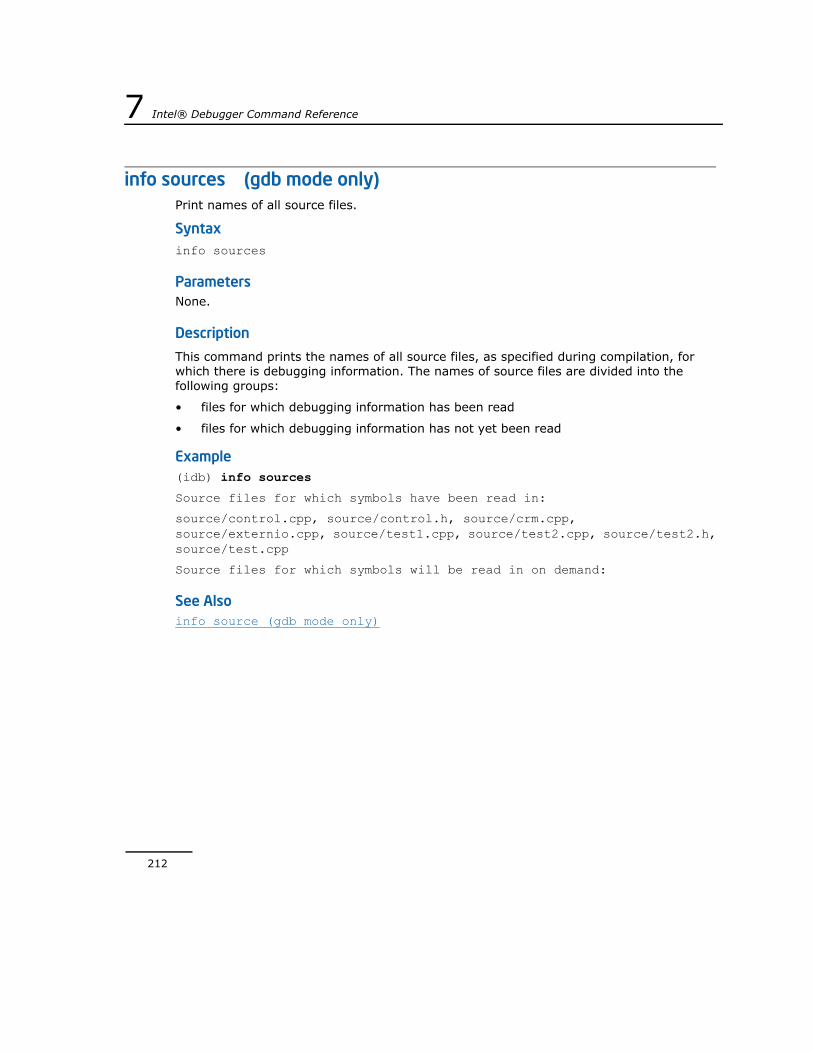
212
7 Intel® Debugger Command Reference
info sources (gdb mode only) Print names of all source files.
Syntaxinfo sources
ParametersNone.
Description
This command prints the names of all source files, as specified during compilation, for which there is debugging information. The names of source files are divided into the following groups:
• files for which debugging information has been read
• files for which debugging information has not yet been read
Example(idb) info sources
Source files for which symbols have been read in:
source/control.cpp, source/control.h, source/crm.cpp, source/externio.cpp, source/test1.cpp, source/test2.cpp, source/test2.h, source/test.cpp
Source files for which symbols will be read in on demand:
See Alsoinfo source (gdb mode only)

IDB Command Reference 7
213
info stack (gdb mode only) Print a backtrace of stack frames.
Syntaxinfo stack num
Parameters
Description
This command prints a backtrace of stack frames. This command is similar to backtrace.
This command prints the current frame, which is the frame that has debugger focus, and the num-1 callers of the current frame.
For example, if you enter info stack 3, the debugger prints the current frame, its caller, and the caller of the caller.
The up command puts focus on the caller of the current frame.
See Alsobacktrace (gdb mode only)
num The number of stack frames to print, starting from the current position.

214
7 Intel® Debugger Command Reference
info target (gdb mode only) Print the names of the files in the debuggee.
Syntaxinfo target
ParametersNone.
Description
This command is equivalent to info files.
See Alsoinfo files (gdb mode only)

IDB Command Reference 7
215
info threads (gdb mode only) Print all threads.
Syntaxinfo threads
ParametersNone.
Description
This command prints a list of threads in the debuggee, including the following information:
• a thread ID that the debugger assigns
• a thread ID that the target system assigns
• a summary of the thread’s current stack frame
An asterisk (*) preceding the thread ID indicates the current thread.
Example(idb) info threads
1 Thread 3074820864 (LWP 18872) [thawed] 0xb75a01fb in pthread_cond_wait@@GLIBC_2.3.2 from /lib/tls/libpthread-0.60.so
2 Thread 3074804656 (LWP 18873) [thawed] 0xb75a01fb in pthread_cond_wait@@GLIBC_2.3.2 from /lib/tls/libpthread-0.60.so
3 Thread 3064314800 (LWP 18875) [thawed] 0xb75a01fb in pthread_cond_wait@@GLIBC_2.3.2 from /lib/tls/libpthread-0.60.so
4 Thread 3053824944 (LWP 18876) [thawed] 0xb75a01fb in pthread_cond_wait@@GLIBC_2.3.2 from /lib/tls/libpthread-0.60.so
* 5 Thread 3043335088 (LWP 18900) [thawed] 0x80487f3 in breakpoint1 at /site/spt/anmod/sandbox-for-nightly/test/idb/Thread/src/pthread_prime_numbers.c:24
See Alsoshow thread (idb mode only)

216
7 Intel® Debugger Command Reference
info types (gdb mode only) Print a description of types in the program.
Syntaxinfo types [REGEXP]
Parameters
Description
This command prints a description of types in your program.
If you specify REGEXP, the debugger prints a description of types whose names match the regular expression.
If you do not specify REGEXP, the debugger prints a description of all types.
The debugger matches each complete type name as though it is a complete line. For example, info type foo prints information on all types in the debuggee whose names include the string foo. However, info type ^foo$ prints information only for types whose complete name is foo.
This command is similar to ptype, but differs in that it does not print a detailed description.
See Alsoptype (gdb mode only)
REGEXP A regular expression pattern to match.

IDB Command Reference 7
217
info variables (gdb mode only) Print names and types of all global variables.
Syntaxinfo variables [REGEXP]
Parameters
Description
This command prints the names and types of all global and static variables matching REGEXP. If you don’t inlcude the REGEXP parameter, this command prints all the names and types of all global and static variables.
REGEXP A regular expression.

218
7 Intel® Debugger Command Reference
info watchpoints (gdb mode only) Print information about one or more watchpoints.
Syntaxinfo watchpoints [expr]
Parameters
Description
This command prints information about the specified watchpoint. If you do not specify an ID, the debugger prints information about all watchpoints.
Watchpoints are also referred to as data breakpoints.
This command is the same as info breakpoints.
Example(idb) info watchpoints
Num Type Disp Enb Address What
1 breakpoint keep y 0x08051603 in main at src/x_list.cxx:182
breakpoint already hit 1 time(s)
2 breakpoint keep y 0x0804ae5a in List<Node>::append(Node * const) at src/x_list.cxx:148
breakpoint already hit 1 time(s)
3 watchpoint keep y _firstNode
See Alsoinfo breakpoints (gdb mode only)status (idb mode only)
expr An expression denoting the ID of a watchpoint.

IDB Command Reference 7
219
jump (gdb mode only) Jump to the specified line number or address.
Syntaxjump { num | *addr }
Parameters
Description
This command jumps the program counter to the specified location. The debugger resumes program execution at that point unless it encounters a breakpoint there.
NOTE. A jump does not change the stack frame or any memory contents. Jumping from one routine to another can lead to unpredictable results.
The tbreak command is commonly used in conjunction with this command.
One way you can use this command is to go to a section of the debuggee that has already executed, in order to examine it more closely.
If num is in a function other than the one currently executing, and the two functions require different argument patterns or different patterns for local variables, the output of this command may be unpredictable.
Because of this behavior, when num is not in the current function, the debugger prompts you to confirm this command.
This command is similar to storing a new value in the $pc register, in that it changes the address from which the application continues executing. For example, the command set $pc = 0x123 causes the next continue command to continue from the address 0x123.
See Alsogoto (idb mode only)
num Number of the line to jump to.
addr Address of the instruction to jump to.

220
7 Intel® Debugger Command Reference
kill Kill the current process.
Syntaxkill
ParametersNone.
Description
This command kills the current process, leaving the debugger running. Any breakpoints previously set are retained. Later, you can execute the program again, by using the run command in GDB mode or the rerun command in IDB mode, without loading the debuggee again.
ExampleGDB Mode:
(idb) info program
Using the running image of child process 17629.
Program stopped at 0x8051603.
It stopped at breakpoint 1.
(idb) kill
Program exited normally.
(idb) run
Starting program: /home/user/examples/x_list
Breakpoint 1, main () at src/x_list.cxx:182
182 List<Node> nodeList;
IDB Mode:
(idb) show process
Current Process: localhost:17336 (/home/user/examples/x_list)
paused.
(idb) kill
Process has exited
(idb) rerun

IDB Command Reference 7
221
[1] stopped at [int main(void):182 0x08051603]
182 List<Node> nodeList;
See Alsorunrerun (idb mode only)
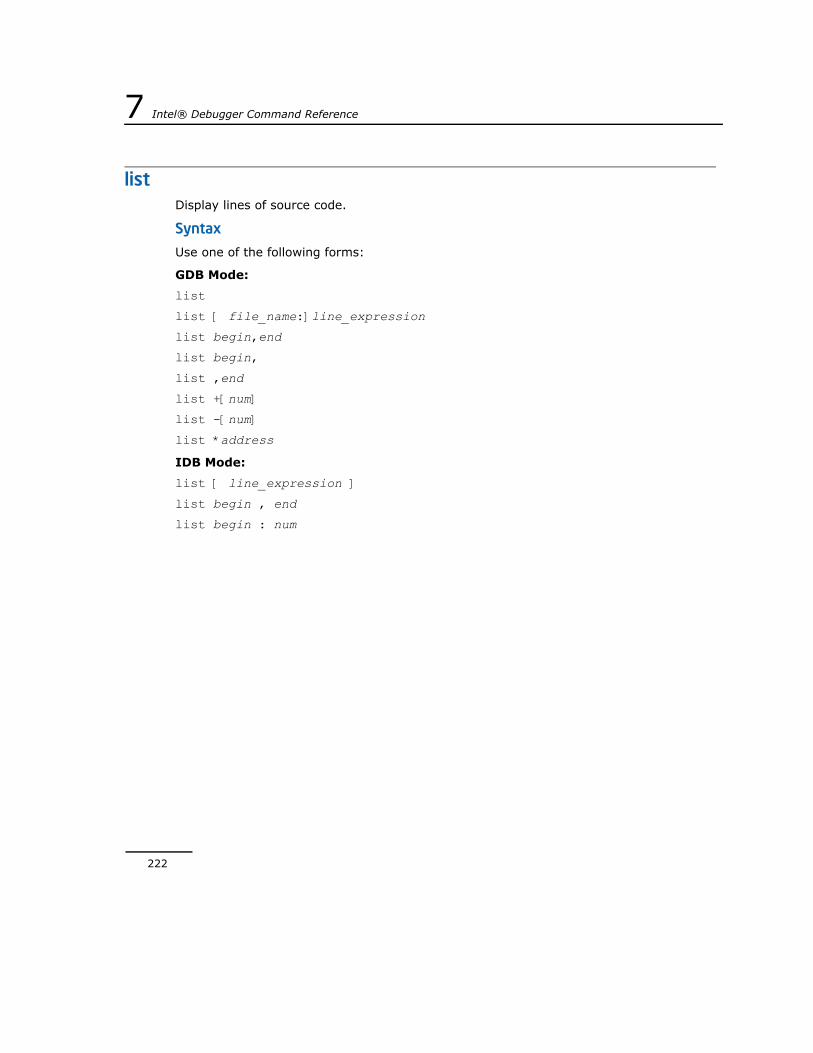
222
7 Intel® Debugger Command Reference
list Display lines of source code.
Syntax
Use one of the following forms:
GDB Mode:
list
list [ file_name:]line_expression
list begin,end
list begin,
list ,end
list +[num]
list -[num]
list *address
IDB Mode:
list [ line_expression ]
list begin , end
list begin : num

IDB Command Reference 7
223
Parameters
Description
This command displays lines of source code, as specified by one of the following items:
• The position of the program counter
• The last line listed, if multiple list commands have been entered
• The line numbers specified as the parameters to the list command
GDB Mode:
line_expression An expression that evaluates to an integer or the name of a function whose source code you want to display. The syntax of the command and the expression determine how the debugger evaluates line_expression.
When this expression is an integer, it can be the line number of the source code you want to display or any of the following parameters:• begin • end • +num • -num
begin An expression that evaluates to the line number at the beginning of the range of source code you want to display.
end An expression that evaluates to the line number at the end of the range of source code you want to display.
num The number of lines to print.
GDB Mode:
Default is 10.
file_name The name of the file containing the source code you want to print.
line_number The line number of the source code you want to display.
function The name of the function whose source code you want to display.
address The address of the instruction that the compiler outputs from a line of source code.

224
7 Intel® Debugger Command Reference
If you do not specify a parameter, the debugger prints the ten lines surrounding the current line. If the last line that the debugger printed was the output of this command, the debugger prints the lines following the last line it printed. If the last line it printed was a single line that the debugger printed as part of a stack frame, the debugger prints the lines centered around that line.
If you specify only line_number or function, the debugger prints the lines centered around the specified line or the beginning of the function. By default, the debugger prints ten lines.
If you specify begin and end, the debugger prints the lines beginning with begin and ending with end. If you specify only begin or end, the debugger prints the ten lines either following begin or preceding end.
list + prints num lines after the last printed. list - prints num lines before the last printed. If you do not include num, the debugger prints ten lines.
If you specify *address, the debugger prints the line that was compiled to an instruction at the specified program address.
IDB Mode:
If you specify only line_number or function, the debugger prints the lines starting with the specified line or the beginning of the function. By default, the debugger prints ten lines.
If you specify begin , end, the debugger prints the lines beginning with begin and ending with end. If you specify begin : num, the debugger prints num lines, beginning with begin.
If you do not specify end or num, the debugger shows 20 lines, or fewer if it reaches the end of source file.
ExampleFor example, to list lines 16 through 20:
(idb) list 16,20
16
17 class Node {
18 public:
19 Node ();
20
To list 6 lines, beginning with line 16:
GDB Mode:
(idb) list 16,+6
16

IDB Command Reference 7
225
17 class Node {
18 public:
19 Node ();
20
21 virtual void printNodeData() const = 0;
Here are some other examples of the list command:
list -2,
list ,+2
list -2,+2
list myfile:2
list myfile:2,
list ,myfile:2
list myfile:2,myfile:3
list myfile:bar
list myfile:bar,
list ,myfile:bar
list myfile:bar,myfile:foo
list *0x123
IDB Mode:
(idb) list 16:6
16
17 class Node {
18 public:
19 Node ();
20
21 virtual void printNodeData() const = 0;
See Alsoset listsize (gdb mode only)

226
7 Intel® Debugger Command Reference
listobj (idb mode only)List all loaded objects, including the main image and the shared libraries.
Syntaxlistobj
ParametersNone.
Description
This command lists all loaded objects, including the main image and the shared libraries.
For each object, the information listed consists of:
• the full object name, with path name
• the starting address for the text
• the size of the text region
• whether the debugger has read the symbol table information
Example(idb) listobj
section Start Addr End Addr
------------------------------------------------------------------------
/home/user/examples/test/idb/Examples/exp/i686-Linux-currstable/debuggable/x_list
.text 0x8048000 0x80555cf
.data 0x8056000 0x805be07
.bss 0x805be08 0x805bebf
/lib/libdl-2.3.2.so
.text 0xb73b1000 0xb73b2dc3
.data 0xb73b3dc4 0xb73b3f53
.bss 0xb73b3f54 0xb73b3f73
/lib/tls/libc-2.3.2.so
.text 0xb73b4000 0xb74e44f5
.data 0xb74e5500 0xb74e7fdb
.bss 0xb74e7fdc 0xb74eaa8b

IDB Command Reference 7
227
/nfs/cmplr/icc-9.1.043/lib/libunwind.so.5
.text 0xb74eb000 0xb74ef28c
.data 0xb74f0290 0xb74f0a1b
.bss 0xb74f0a1c 0xb74f0b7b
/nfs/cmplr/icc-9.1.043/lib/libcxa.so.5
.text 0xb74f1000 0xb750cd5e
.data 0xb750d000 0xb7513bcb
.bss 0xb7513bcc 0xb7513d4f
/nfs/cmplr/icc-9.1.043/lib/libcprts.so.5
.text 0xb7514000 0xb7594aaf
.data 0xb7595000 0xb75b3d23
.bss 0xb75b3d24 0xb75b469f
/lib/tls/libm-2.3.2.so
.text 0xb75b5000 0xb75d5dbf
.data 0xb75d6dc0 0xb75d6f43
.bss 0xb75d6f44 0xb75d6f8f
/lib/ld-2.3.2.so
.text 0xb75eb000 0xb75fffcf
.data 0xb7600000 0xb7600533
.bss 0xb7600534 0xb7600753
See Alsoinfo share (gdb mode only)info sharedlibrary (gdb mode only)

228
7 Intel® Debugger Command Reference
load (idb mode only) Load an executable and core file for debugging.
Syntaxload filename [corefilename]
Parameters
Description
This command specifies an executable, and optionally, a core file, for debugging.
Core file debugging is not supported on Mac OS* X.
This command reads the symbolic information for an executable file and the shared libraries it uses, if available. Objects compiled without debug information do not have symbols to load.
If you specify a core file, the debugger acts as though it is attached to the process at the point just before it died and generated the core file: The debugger uses the core file to enable debug operations such as printing variables and the stack and looking at source files, but because the core file is not an executable, you cannot use commands that require a runnable process, such as step or continue, or commands that try to evaluate function calls.
Loading a process makes the debugger aware of it and makes it the current process that the debugger controls.
The opposite of loading an executable file is unloading an executable file, during which the debugger removes all related symbol table information that the debugger associated with the debuggee.
Example% idb /home/user/examples/x_list
(idb) listobj
Program is not active
(idb) load /home/user/examples/x_list
Reading symbolic information from /home/user/examples/test/idb/Examples/exp/i686-Linux-currstable/debuggable/x_list...done
filename The executable file for the debugger to load.
corefilename The name of the core file to load.

IDB Command Reference 7
229
See Alsounload (idb mode only)file (gdb mode only)

230
7 Intel® Debugger Command Reference
map source directory (idb mode only) Map one source directory to another one.
Syntaxmap source directory from_directory_name to_directory_name
Parameters
Description
This command tells the debugger that the source files in the directory from_directory_name can be found in the directory to_directory_name.
The directory used in the source specification in the compile command is the base for the from_directory_name. The compiler combines the file path in the compile command and the user's current directory at the time of the compilation and attempts to simplify the file path so that it is a relative path from that current working directory.
ExampleSuppose that when you compiled the debuggee, the source files were in /src/foo/, and that you want the debugger to use the source files in /src/bar/. You would use the following command:
(idb) map source directory /src/foo /src/bar
See Alsoset substitute-path (gdb mode only)
from_directory_name The directory from which you want to map.
to_directory_name The directory to which you want to map.

IDB Command Reference 7
231
next Step forward in source, over any function calls.
Syntaxnext [expr]
Parameters
Description
This command executes a line of source code. When the next line to be executed contains a function call, the debugger executes the function being called and stops the process at the line immediately following the function call.
If you specify expr, the debugger evaluates the expression as a positive integer that specifies the number of times to execute the next command. The expression can be any expression that is valid in the current context.
ExampleGDB Mode:
(idb) list +0,+4
151 Node* currentNode = _firstNode;
152 while (currentNode->getNextNode())
153 currentNode = currentNode->getNextNode();
154 currentNode->setNextNode(node);
(idb) next
152 while (currentNode->getNextNode())
(idb) next
153 currentNode = currentNode->getNextNode();
(idb) next
152 while (currentNode->getNextNode())
(idb) next
154 currentNode->setNextNode(node);
IDB Mode:
(idb) list $curline:4
expr A numeric expression.

232
7 Intel® Debugger Command Reference
> 151 Node* currentNode = _firstNode;
152 while (currentNode->getNextNode())
153 currentNode = currentNode->getNextNode();
154 currentNode->setNextNode(node);
(idb) next
stopped at [void List<Node>::append(class Node* const):152 0x0804c579]
152 while (currentNode->getNextNode())
(idb) next
stopped at [void List<Node>::append(class Node* const):153 0x0804c592]
153 currentNode = currentNode->getNextNode();
(idb) next
stopped at [void List<Node>::append(class Node* const):152 0x0804c5aa]
152 while (currentNode->getNextNode())
(idb) next
stopped at [void List<Node>::append(class Node* const):154 0x0804c5c3]
154 currentNode->setNextNode(node);
See Alsonextirunstepstepi

IDB Command Reference 7
233
nexti Step forward in assembler instructions, over any function calls.
Syntaxnexti [expr]
Parameters
Description
This command executes a machine instruction. When the instruction contains a function call, the command executes the function being called and stops the process at the instruction immediately following the call instruction.
If you specify expr, the debugger evaluates the expression as a positive integer that specifies the number of times to execute the nexti command. The expression can be any expression that is valid in the current context.
See Alsonextrunstepstepi
expr A numeric expression.

234
7 Intel® Debugger Command Reference
output (gdb mode only) Print the value of an expression.
Syntaxoutput /format expr
Parameters
Description
This command prints the value of the specified expression.
This command is very similar to the print command. The differences are:
• This command does not print a newline at the end of the value.
• This command does not add a value to the value history.
See print commands for details about format.
Example(idb) output /x 10
(idb) output /c 12
See Alsoprintprintf
format The format in which to print the expression.
expr The expression to be printed.

IDB Command Reference 7
235
patch (idb mode only) Modify an executable by writing the value of an expression to a specific address or variable.
Syntaxpatch addr = expr
Parameters
Description
This command modifies an executable by writing the value of an expression to a specified address or variable.
Use this command to correct bad data or instructions in executable disk files. You can patch text, initialized data, or read-only data areas. You cannot patch the bss segment, or stack and register locations, because they do not exist on disk files.
Patching the code directly is very risky. You need to be careful that the source and target fit in structure, size, byte order, etc. Any mismatch may damage your application.
Only use this command to change the on-disk binary file. To modify debuggee memory, use the assign command. If the image is executing when you issue the patch command, the corresponding location in the debuggee address space is updated as well. The debuggee is updated regardless of whether the patch to disk succeeded, as long as the assign command can process the source and destination expressions. If your program is loaded but not yet started, the patch to disk is performed without the corresponding assign to memory.
When you use the patch command, the debugger saves the original binary with the string ~backup appended to the file name, so you can revert to the original binary if necessary. The debugger may also create a file with the string ~temp appended to the file name. The debugger may delete this file after the debugging session is over.
Example(idb) run
[1] stopped at [int main(void):24 0x120001324]
24 return 0;
(idb) patch i = 10
0x1400000d0 = 10
addr The address or variable whose value you want to set.
expr The value for the address.

236
7 Intel® Debugger Command Reference
(idb) patch j = i + 12
0x1400000d8 = 22
(idb)
See Alsoassign (idb mode only)

IDB Command Reference 7
237
path (gdb mode only) Add specified directory to search path.
Syntaxpath dirname
Parameters
Description
This command adds the specified directory to the search path for object files, the PATH environment variable, for the current debuggee process.
If you don’t specify dirname, the debugger displays the executable and object file path of the debuggee.
See Alsosetenv (idb mode only)
dirname The directory to add to the search path.

238
7 Intel® Debugger Command Reference
playback input (idb mode only)Execute commands from a file.
Syntaxplayback input filename
Parameters
Description
This command executes commands from a file to automate tasks. You can record commands to a file using the record and unrecord commands, or by using the GUI.
Example(idb) record input myscript
(idb) print "Hello World"
Hello World
(idb) unrecord input
(idb) playback input myscript
Hello World
(idb)
See Alsorecord (idb mode only)sourceunrecord (idb mode only)
filename The file from which to execute commands.

IDB Command Reference 7
239
pop (idb mode only) Remove frames from the call stack.
Syntaxpop [expr]
Parameters
Description
This command removes one or more call frames from the call stack.
By default, this command removes one call frame. This command undoes the work already done by the removed execution frames. However, it does not, reverse side effects, such as changes to global variables.
Because it is extremely unlikely this will fix all the effects of a half-executed call, this command is not recommended for general use. Furthermore, the pop command does not provide a way to specify a return value when the frame being discarded corresponds to a function that should return a value. You may need to use the assign command to restore the values of global variables.
Instead of using the pop command, you may want to use the IDB mode return command, which causes the called routine to resume execution and eventually return to the caller.
Examplereturn (idb mode only)return (gdb mode only)
expr The number of stack frames to be removed.

240
7 Intel® Debugger Command Reference
print Print the value of an expression.
Syntax
GDB Mode:
print [/format] [expr]
IDB Mode:
printradix expr[,...]
print printable_type

IDB Command Reference 7
241
Parameters
format GDB Mode:
Specifies the format in which to print the expression. Use one of the following values:
x
Regard the bits of the value as an integer, and print the integer in hexadecimal.
d
Print as integer in signed decimal.
u
Print as integer in unsigned decimal.
o
Print as integer in octal.
t
Print as integer in binary. The letter t stands for two.
a
Print as an address, both absolute in hexadecimal and as an offset from the nearest preceding symbol.
c
Regard as an integer and print it as a character constant.
f
Regard the bits of the value as a floating-point number and print using typical floating point syntax.
expr The expression to print.
Expressions in the debugger are valid expressions in the language in which your program is written.
The debugger attempts to duplicate the standard language semantics for expressions.
An expression can include a qualifier and a tick mark, which can help identify ambiguous expressions. For example, if both a.cxx and b.cxx inlcude a file level variable, x, you can use the syntax "a.cxx"`x to specify the variable x in a.cxx. Use the same syntax to specify object hierarchy.
IDB Mode:
Use commas to separate multiple expressions.
To print an expression including the C/C++ comma operator, you must enclose the expression in parentheses.

242
7 Intel® Debugger Command Reference
Description
This command prints the value of an expression. You can print the values of one or more expressions or all local variables. You can also use the print command to evaluate complex expressions involving typecasts, pointer dereferences, multiple variables, constants, and any legal operators allowed by the language of the program you are debugging.
For an array, the debugger prints every cell in the array if you do not specify a specific cell.
GDB Mode:
Use the set output-radix x command to select a radix for the output of the print command, where x can be 8, 10 or 16.
IDB Mode:
Use the $hexints, $decints, or $octints variables to select a radix for the output of the print command. If you do not want to change the radix permanently, use the printx, printd, printo, and printb commands to print expressions in hexadecimal, decimal, octal, or binary base format, respectively.
ExampleConsider the following declarations in a C++ program:
GDB Mode:
(idb) list 59,+2
59 const unsigned int biggestCount = 10;
radix IDB Mode:
x
Regard the bits of the value as an integer, and print the integer in hexadecimal.
d
Print as integer in signed decimal.
o
Print as integer in octal.
b
Print as integer in binary.
filename IDB Mode:
The name of the file containing the expression to print.
printable_type IDB Mode:
A user-defined type for which you have debug information.

IDB Command Reference 7
243
60 static Moon *biggestMoons[biggestCount];
IDB Mode:
(idb) list 59:2
59 const unsigned int biggestCount = 10;
60 static Moon *biggestMoons[biggestCount];
The following example uses the print command to display a non-string array:
GDB Mode:
(idb) print biggestMoons
$4 = {0x8067998, 0x8067cb0, 0x80679f0, 0x80678e8, 0x8067730, 0x8067940, 0x8068020, 0x8067f18, 0x8067c58, 0x8067f70}
IDB Mode:
(idb) print biggestMoons
[0] = 0x8067998,[1] = 0x8067cb0,[2] = 0x80679f0,[3] = 0x80678e8,[4] = 0x8067730,[5] = 0x8067940,[6] = 0x8068020,[7] = 0x8067f18,[8] = 0x8067c58,[9] = 0x8067f70
The following example shows how to print individual values of an array:
GDB Mode:
(idb) print biggestMoons[3]
$7 = (Moon *) 0x80678e8
(idb) print *biggestMoons[3]
$8 = {<Planet> = {<HeavenlyBody> = {_name = 0x805a514 "Io", _innerNeighbor = 0x0, _outerNeighbor = 0x8067940, _firstSatellite = 0x0, _lastSatellite = 0x0}, <Orbit> = {_primary = 0x8067890, _distance = 422, _name = 0x8067918 "Jupiter 1"}}, _radius = 1815}
IDB Mode:
(idb) print biggestMoons[3]
0x80678e8
(idb) print *biggestMoons[3]
class Moon {
_radius = 1815;
_name = 0x805a514="Io"; // class Planet::HeavenlyBody
_innerNeighbor = 0x0; // class Planet::HeavenlyBody
_outerNeighbor = 0x8067940; // class Planet::HeavenlyBody
_firstSatellite = 0x0; // class Planet::HeavenlyBody
244
7 Intel® Debugger Command Reference
_lastSatellite = 0x0; // class Planet::HeavenlyBody
_primary = 0x8067890; // class Planet::Orbit
_distance = 422; // class Planet::Orbit
_name = 0x8067918="Jupiter 1"; // class Planet::Orbit
See Alsoprintfprinti

IDB Command Reference 7
245
printenv (idb mode only) Display the value of one or all environment variables.
Syntaxprintenv [varname]
Parameters
Description
This command displays the value of one environment variable if you specify varname, or all environment variables if you omit varname.
ExampleThe following example displays the value of all environment variables.
(idb) printenv
DESKTOP_STARTUP_ID=
DISPLAY=:1.0
HISTCONTROL=ignoreboth
HOME=/home/hal
LESSCLOSE=/usr/bin/lesspipe %s %s
LESSOPEN=| /usr/bin/lesspipe %s
...
runlevel=2
(idb)
The following example displays the value of the HOME environment variable.
(idb) printenv HOME
HOME=/home/hal
(idb)
See Alsoexport (idb mode only)setenv (idb mode only)
varname The environment variable whose value you want to display.

246
7 Intel® Debugger Command Reference
printf Display a complex structure with formatting.
Syntaxprintf format [, expr,…]
Parameters
Description
This command formats and displays a complex structure. This command requires a running target program because it uses libc. A comma must precede the first expr if there is one. Separate expressions with commas.
Example(idb) printf "The PC is 0x%x", $pc
The PC is 0x8051a3c
format A string expression of characters and conversion specifications using the same format specifiers as the printf C function.
expr,… One or more expressions separated by commas.

IDB Command Reference 7
247
printi Display the value as an assembly instruction.
Syntaxprinti [expr,...]
Parameters
Description
This command takes one or more numerical expressions and interprets each one as an assembly instruction, printing out the instruction, and its arguments when applicable.
This command is typically used by engineers performing machine-level debugging.
Example(idb) $curpc/1i
int main(void): src/x_list.cxx
*[line 182, 0x08051603] main+0x1b: pushl %edi
(idb) $curpc/1dd
0x08051603: 2022018391
(idb) printi $pc
main+0x1b: pushl %edi
expr,... One or more expressions separated by commas.

248
7 Intel® Debugger Command Reference
printregs (idb mode only) Display the values of hardware registers.
Syntaxprintregs
ParametersNone.
Description
This command displays the values of all the hardware registers. The list of registers the debugger displays is machine-dependent.
By default, the debugger displays most values in decimal radix. To display the register values in hexadecimal radix, set the $hexints variable to 1.
Example(idb) printregs
$eax 0x805be28 134594088
$ecx 0xb74e61a0 -1219599968
$edx 0xb74e5610 -1219602928
$ebx 0xb74e7d98 -1219592808
$esp [$sp] 0xbfff83a8 -1073773656
$ebp [$fp] 0xbfff8478 -1073773448
$esi 0xbfff8504 -1073773308
$edi 0xb74e567c -1219602820
$eip [$pc] 0x8051a3c 134552124
$eflags 0x286 646
$cs 0x23 35
$ss 0x2b 43
$ds 0x2b 43
$es 0x2b 43
$fs 0x0 0
$gs 0x33 51
$orig_eax 0xffffffff -1

IDB Command Reference 7
249
$fctrl 0x37f 895
$fstat 0x0 0
$ftag 0x0 0
$fiseg 0x23 35
$fioff 0x804ea61 134539873
$foseg 0x2b 43
$fooff 0xbfff81c4 -1073774140
$fop 0x89 137
$f0 0x0 0
$f1 0x0 0
$f2 0x0 0
$f3 0x0 0
$f4 0x0 0
$f5 0x0 0
$f6 0x0 0
$f7 0xa1f7cf0000000000 10.1230001449584961
$xmm0 0x0 union {
v4_float = [0] = 0,[1] = 0,[2] = 0,[3] = 0;
v2_double = [0] = 0,[1] = 0;
v16_int8 = [0] = 0,[1] = 0,[2] = 0,[3] = 0,[4] = 0,[5] = 0,[6] = 0,[7] = 0,[8] = 0,[9] = 0,[10] = 0,[11] = 0,[12] = 0,[13] = 0,[14] = 0,[15] = 0;
v8_int16 = [0] = 0,[1] = 0,[2] = 0,[3] = 0,[4] = 0,[5] = 0,[6] = 0,[7] = 0;
v4_int32 = [0] = 0,[1] = 0,[2] = 0,[3] = 0;
v2_int64 = [0] = 0,[1] = 0;
}
$xmm1 0x0 union {
v4_float = [0] = 0,[1] = 0,[2] = 0,[3] = 0;
v2_double = [0] = 0,[1] = 0;
v16_int8 = [0] = 0,[1] = 0,[2] = 0,[3] = 0,[4] = 0,[5] = 0,[6] = 0,[7] = 0,[8] = 0,[9] = 0,[10] = 0,[11] = 0,[12] = 0,[13] = 0,[14] = 0,[15] = 0;
v8_int16 = [0] = 0,[1] = 0,[2] = 0,[3] = 0,[4] = 0,[5] = 0,[6] = 0,[7] = 0;
v4_int32 = [0] = 0,[1] = 0,[2] = 0,[3] = 0;

250
7 Intel® Debugger Command Reference
v2_int64 = [0] = 0,[1] = 0;
}
$xmm2 0x0 union {
v4_float = [0] = 0,[1] = 0,[2] = 0,[3] = 0;
v2_double = [0] = 0,[1] = 0;
v16_int8 = [0] = 0,[1] = 0,[2] = 0,[3] = 0,[4] = 0,[5] = 0,[6] = 0,[7] = 0,[8] = 0,[9] = 0,[10] = 0,[11] = 0,[12] = 0,[13] = 0,[14] = 0,[15] = 0;
v8_int16 = [0] = 0,[1] = 0,[2] = 0,[3] = 0,[4] = 0,[5] = 0,[6] = 0,[7] = 0;
v4_int32 = [0] = 0,[1] = 0,[2] = 0,[3] = 0;
v2_int64 = [0] = 0,[1] = 0;
}
$xmm3 0x0 union {
v4_float = [0] = 0,[1] = 0,[2] = 0,[3] = 0;
v2_double = [0] = 0,[1] = 0;
v16_int8 = [0] = 0,[1] = 0,[2] = 0,[3] = 0,[4] = 0,[5] = 0,[6] = 0,[7] = 0,[8] = 0,[9] = 0,[10] = 0,[11] = 0,[12] = 0,[13] = 0,[14] = 0,[15] = 0;
v8_int16 = [0] = 0,[1] = 0,[2] = 0,[3] = 0,[4] = 0,[5] = 0,[6] = 0,[7] = 0;
v4_int32 = [0] = 0,[1] = 0,[2] = 0,[3] = 0;
v2_int64 = [0] = 0,[1] = 0;
}
$xmm4 0x0 union {
v4_float = [0] = 0,[1] = 0,[2] = 0,[3] = 0;
v2_double = [0] = 0,[1] = 0;
v16_int8 = [0] = 0,[1] = 0,[2] = 0,[3] = 0,[4] = 0,[5] = 0,[6] = 0,[7] = 0,[8] = 0,[9] = 0,[10] = 0,[11] = 0,[12] = 0,[13] = 0,[14] = 0,[15] = 0;
v8_int16 = [0] = 0,[1] = 0,[2] = 0,[3] = 0,[4] = 0,[5] = 0,[6] = 0,[7] = 0;
v4_int32 = [0] = 0,[1] = 0,[2] = 0,[3] = 0;
v2_int64 = [0] = 0,[1] = 0;
}
$xmm5 0x0 union {
v4_float = [0] = 0,[1] = 0,[2] = 0,[3] = 0;

IDB Command Reference 7
251
v2_double = [0] = 0,[1] = 0;
v16_int8 = [0] = 0,[1] = 0,[2] = 0,[3] = 0,[4] = 0,[5] = 0,[6] = 0,[7] = 0,[8] = 0,[9] = 0,[10] = 0,[11] = 0,[12] = 0,[13] = 0,[14] = 0,[15] = 0;
v8_int16 = [0] = 0,[1] = 0,[2] = 0,[3] = 0,[4] = 0,[5] = 0,[6] = 0,[7] = 0;
v4_int32 = [0] = 0,[1] = 0,[2] = 0,[3] = 0;
v2_int64 = [0] = 0,[1] = 0;
}
$xmm6 0x0 union {
v4_float = [0] = 0,[1] = 0,[2] = 0,[3] = 0;
v2_double = [0] = 0,[1] = 0;
v16_int8 = [0] = 0,[1] = 0,[2] = 0,[3] = 0,[4] = 0,[5] = 0,[6] = 0,[7] = 0,[8] = 0,[9] = 0,[10] = 0,[11] = 0,[12] = 0,[13] = 0,[14] = 0,[15] = 0;
v8_int16 = [0] = 0,[1] = 0,[2] = 0,[3] = 0,[4] = 0,[5] = 0,[6] = 0,[7] = 0;
v4_int32 = [0] = 0,[1] = 0,[2] = 0,[3] = 0;
v2_int64 = [0] = 0,[1] = 0;
}
$xmm7 0x0 union {
v4_float = [0] = 0,[1] = 0,[2] = 0,[3] = 0;
v2_double = [0] = 0,[1] = 0;
v16_int8 = [0] = 0,[1] = 0,[2] = 0,[3] = 0,[4] = 0,[5] = 0,[6] = 0,[7] = 0,[8] = 0,[9] = 0,[10] = 0,[11] = 0,[12] = 0,[13] = 0,[14] = 0,[15] = 0;
v8_int16 = [0] = 0,[1] = 0,[2] = 0,[3] = 0,[4] = 0,[5] = 0,[6] = 0,[7] = 0;
v4_int32 = [0] = 0,[1] = 0,[2] = 0,[3] = 0;
v2_int64 = [0] = 0,[1] = 0;
}
$mxcsr 0x1f80 8064
$vfp 0xbfff8480 -1073773440
See Also$hexintsinfo registers (gdb mode only)
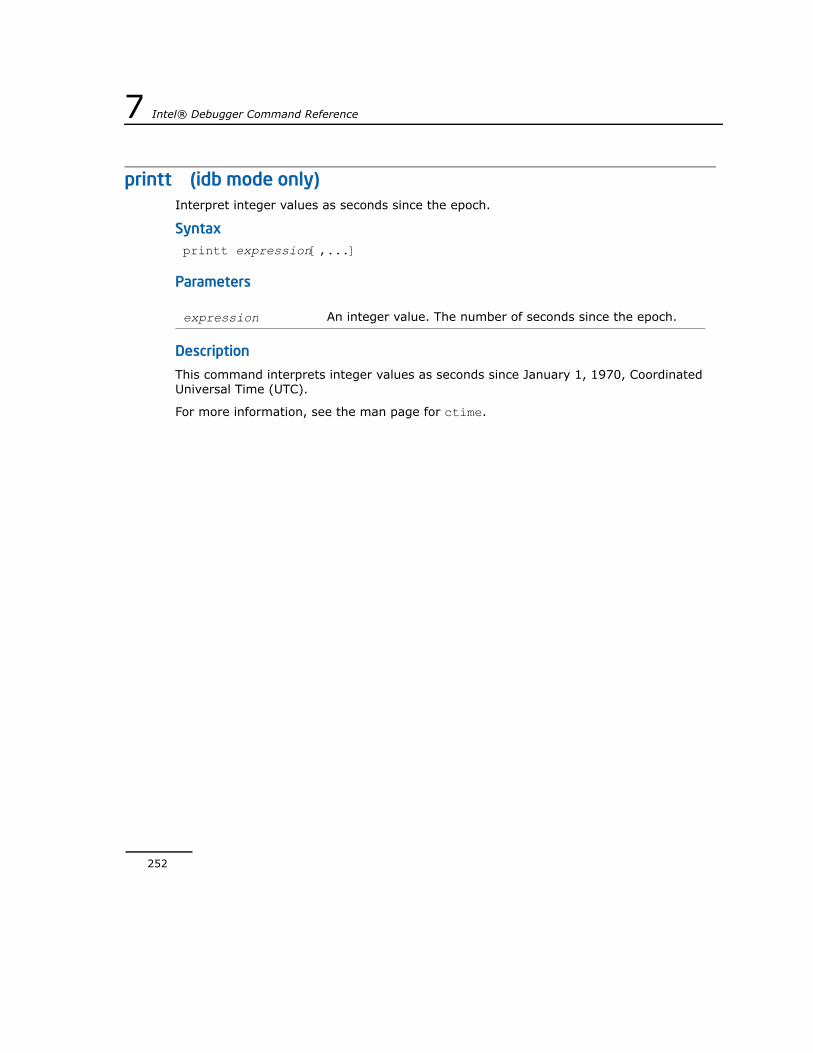
252
7 Intel® Debugger Command Reference
printt (idb mode only)Interpret integer values as seconds since the epoch.
Syntax printt expression[,...]
Parameters
Description
This command interprets integer values as seconds since January 1, 1970, Coordinated Universal Time (UTC).
For more information, see the man page for ctime.
expression An integer value. The number of seconds since the epoch.

IDB Command Reference 7
253
process (idb mode only)Show or change the current process.
Syntaxprocess [ ID | filename ]
Parameters
Description
This command shows the current process or it changes the current process if you specify ID or filename.
The process you switch away from remains loaded, but stalled, until the debugger exits, or that process is unloaded, or untill you swicth to it to continue it.
ExampleThe following example creates two processes and switches from one to the other:
(idb) process
There is no current process.
You may start one by using the `load' or `attach' commands.
(idb) load x_list
Reading symbolic information from /home/user/examples/x.x_processes/x_list...done
(idb) process
>localhost:20492 (/home/user/examples/x.x_processes/x_list) loaded.
(idb) set $old_process = $curprocess
(idb) printf "$old_process=%d", $old_process
$old_process=20492
(idb) load x_segv
Reading symbolic information from /home/user/examples/x.x_processes/x_segv...done
(idb) process
localhost:20492 (/home/user/examples/x.x_processes/x_list) loaded.
ID ID of the process to which you want to switch.
filename Name of the file to which you want to switch.

254
7 Intel® Debugger Command Reference
>localhost:20492 (/home/user/examples/x.x_processes/x_segv) loaded.
(idb) process 20492
(idb) process
>localhost:20492 (/home/user/examples/x.x_processes/x_list) loaded.
localhost:20492 (/home/user/examples/x.x_processes/x_segv) loaded.
See Alsoattachload (idb mode only)show process (idb mode only)show process set
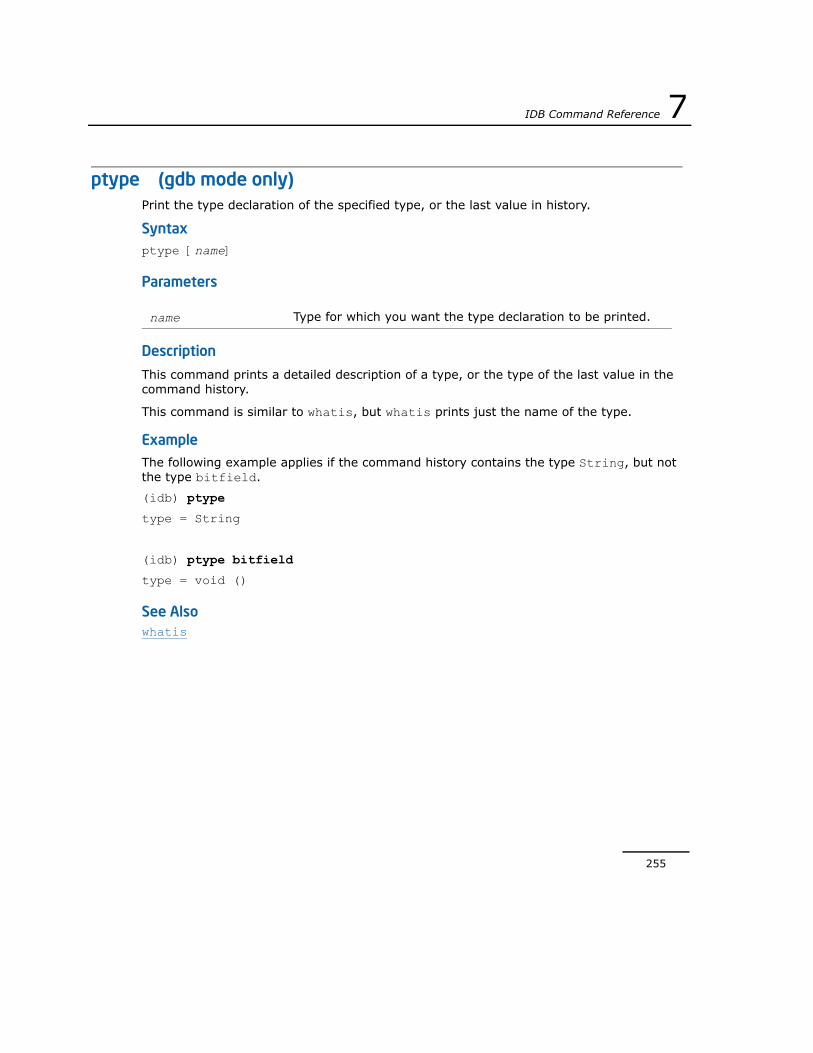
IDB Command Reference 7
255
ptype (gdb mode only) Print the type declaration of the specified type, or the last value in history.
Syntaxptype [name]
Parameters
Description
This command prints a detailed description of a type, or the type of the last value in the command history.
This command is similar to whatis, but whatis prints just the name of the type.
ExampleThe following example applies if the command history contains the type String, but not the type bitfield.
(idb) ptype
type = String
(idb) ptype bitfield
type = void ()
See Alsowhatis
name Type for which you want the type declaration to be printed.

256
7 Intel® Debugger Command Reference
pwd (gdb mode only) Display the current working directory.
Syntaxpwd
ParametersNone.
Description
This command displays the current working directory.
Example(idb) pwd
Working directory /home/hal/myapp

IDB Command Reference 7
257
quit Exit the debugger.
Syntaxquit
ParametersNone
Description
This command exits the debugger.
See AlsoExiting the Debuggerexit (idb mode only)

258
7 Intel® Debugger Command Reference
readsharedobj (idb mode only) Read symbol information for a shared object.
Syntaxreadsharedobj filename
Parameters
Description
This command reads the symbol table information for the specified shared object. The object must be a shared library. You can use this command only when you specify the debuggee using the load command or with the GUI.
See Alsodelsharedobj (idb mode only)listobj (idb mode only)
filename The shared object.

IDB Command Reference 7
259
record (idb mode only) Record debugger interactions to a file.
Syntaxrecord { input | output | io } [file]
Parameters
Description
This command records debugger input, output, or both.
To help you make command files, as well as to help you see what has happened before, the debugger can write both its input and its output to files.
The record input command saves debugger commands to a file. You can execute the commands in the file using the source command or the playback input command.
If you do not specify a file name, the debugger creates a file with a random file name in /tmp as the record file. The debugger issues a message giving the name of that file.
The record output command saves the debugger output to a file. The output is simultaneously written to stdout (normal output) or stderr (error messages).
To stop recording debugger input or output, use the appropriate version of the unrecord command, then exit the debugger, or redirect the command to /dev/null, as shown in the following example:
(idb) record input /dev/null
(idb) record output /dev/null
(idb) record io /dev/null
The record io command saves both input to and output from the debugger. If the debugger is already recording input or output when you invoke this command, the debugger closes the old file and records to a new one. It does not record simultaneously to two files.
record io is equivalent to the combination of record input and record output, and closes any open recording files.
file The file to which you want to record interactions.
input Records input only.
output Records output only.
io Records input and output.

260
7 Intel® Debugger Command Reference
NOTE. Only the record io command records the prompt itself.
ExampleThe following example shows how to use the record input command to record a series of debugger commands in a file named myscript:
(idb) record input myscript
(idb) stop in main
[#1: stop in int main(void)]
(idb) run
[1] stopped at [int main(void):182 0x08051603]
182 List<Node> nodeList;
(idb) unrecord input
This example results in the following recorded input in myscript:
(idb) sh cat myscript
stop in main
run
unrecord input
The following example shows how to use the record output command to record a series of debugger commands in a file named myscript:
(idb) record output myscript
(idb) stop in List<Node>::append
[#2: stop in void List<Node>::append(class Node* const)]
(idb) cont
[2] stopped at [void List<Node>::append(class Node* const):148 0x0804ae5a]
148 if (!_firstNode)
(idb) cont to 156
stopped at [void List<Node>::append(class Node* const):156 0x0804aed7]
156 }
(idb) unrecord output
After the above commands are executed, myscript contains the following:
(idb) sh cat myscript

IDB Command Reference 7
261
[#2: stop in void List<Node>::append(class Node* const)]
[2] stopped at [void List<Node>::append(class Node* const):148 0x0804ae5a]
148 if (!_firstNode)
stopped at [void List<Node>::append(class Node* const):156 0x0804aed7]
156 }
The following example shows how record io records input and output.
(idb) record io myscript
(idb) stop in main
[#1: stop in int main(void) ]
(idb) run
[1] stopped at [int main(void):12 0x120001130]
12 int i;
(idb) quit
% cat myscript
(idb) stop in main
[#1: stop in int main(void) ]
(idb) run
[1] stopped at [int main(void):12 0x120001130]
12 int i;
(idb) quit
See AlsoScripting Commandsplayback input (idb mode only)source

262
7 Intel® Debugger Command Reference
rerun (idb mode only) Restart the program.
Syntaxrerun [ args ] [ IO_redirection ... ]
Parameters
Description
This command restarts the debuggee.
When you do not include any parameters, this command uses the arguments and the IO_redirection parameters of the most recent run command entered with arguments. If there was no previous run command, the rerun command defaults to run.
If the last modification time or size of the binary file or any of the shared objects used by the binary file has changed since you issued the last run or rerun command, the debugger automatically rereads the symbol table information. When this happens, the old breakpoint settings may no longer be valid after the debugger reads the new symbol table information.
args The arguments to pass to the debuggee.
Provides both the argc and argv for the created process in the same way a shell does.
IO_redirection ...
Enables you to change stdin, stdout, and stderr, which are otherwise inherited from the debugger process.
You can enter the following values:
> filename
Redirect stdout
1> filename
Redirect stdout
2> filename
Redirect stderr
>& filename
Redirect stdout and stderr
1> filename 2> filename
Redirect stdout and stderr to different files

IDB Command Reference 7
263
The debugger breaks up the argument string into words, and supports several shell features, including tilde (~) and environment variable expansion, wildcard substitution, single quote ('), double quote ("), and single character quote (\).
The IO_redirection parameter enables you to change stdin, stdout, and stderr, which are otherwise inherited from the debugger process.
The various forms have the same effect as in the csh(1) shell.
Example(idb) stop at 182
[#1: stop at "src/x_list.cxx":182]
(idb) rerun -s > prog.output
[1] stopped at [int main(void):182 0x08051603]
182 List<Node> nodeList;
See Alsorun

264
7 Intel® Debugger Command Reference
return (gdb mode only) Remove frames from the call stack.
Syntaxreturn
Parameters
None.
Description
When you use return, the selected stack frame is discarded, and all frames within it.
The return command does not resume execution. It leaves the program stopped in the state that would exist if the function had just returned. In contrast, the finish command resumes execution until the selected stack frame returns naturally.
See Alsofinish (gdb mode only)pop (idb mode only)

IDB Command Reference 7
265
return (idb mode only) Continue execution until the current or specified function returns.
Syntaxreturn [function_name]
Parameters
Description
This command continues execution until the current, or specified, function returns. If you do not specify a function name, this command continues execution of the current function until it returns to its caller.
Specify a function name to continue the execution until control is returned to the specified function. The function must be active on the call stack.
This command is sensitive to the user’s location in the call stack. Suppose function A calls function B, which calls function C. Execution has stopped in function C, and you entered the up command, so you are now in function B, at the point where it called function C. Using the return command here returns you to function A, at the point where function A called function B. Functions B and C will have completed execution.
ExampleIn this example the return command causes the user routine append to complete and return to the caller. At that point, the debugger returns control to the user.
(idb) cont
[1] stopped at [void List<Node>::append(class Node* const):151 0x0804ae6d]
151 Node* currentNode = _firstNode;
(idb) return
stopped at [int main(void):195 0x080518c8]
195 nodeList.append(new IntNode(3)); {static int somethingToReturnTo; somethingToReturnTo++; }
See Alsofinish (gdb mode only)
function_name The function until which you want to continue execution.

266
7 Intel® Debugger Command Reference
reverse-search (gdb mode only) Search backward in the source for a string or repeat last search.
Syntaxreverse-search [string]
Parameters
Description
This command searches backward, starting at the current position, in the current source file for the specified character string. If you do not specify string, the debugger uses the string of the most recent search.
The debugger interprets the rest of the line to be the search string, so you do not need to quote the string. The debugger executes alias expansion on whatever precedes this command on the same line, possibly changing the search string.
When the debugger finds a match, it lists the line number and the line. That line becomes the starting point for any further searches, or for a list command.
Example(idb) reverse-search append
145 void List<NODETYPE>::append(NODETYPE* const node)
(idb) reverse-search
65 void append (NODETYPE* const node);
See Alsoforward-search (gdb mode only)search (gdb mode only)
string The character string to search for.

IDB Command Reference 7
267
run Run the debuggee program.
Syntaxrun [args] [IO_redirection]
Parameters
Description
This command runs the debuggee, creating a process executing the loaded program. If you do not specify any arguments, the debugger uses default arguments. Default arguments are specified by the previous run command with arguments.
The debugger breaks up the argument string into words, and supports several shell features, including tilde (~) and environment variable expansion, wildcard substitution, single quote ('), double quote ("), and single character quote (\).
The debugger sets up argc and argv based on the argument list in the same way the shell does, where argv[0] is always the image run. For example, if you enter run a b c, then argc is 4, and argv is {"debuggee", "a", "b", "c"}.
GDB Mode:
args The arguments to pass to the debuggee.
IO_redirection Enables you to change stdin, stdout, and stderr, which are otherwise inherited from the debugger process.
You can enter the following values:
< filename
Redirect stdin
> filename
Redirect stdout
1> filename
Redirect stdout
2> filename
Redirect stderr
>& filename
Redirect stdout and stderr
1> filename 2> filename
Redirect stdout and stderr to different files

268
7 Intel® Debugger Command Reference
You can also specify arguments using the set args command. To view default arguments, use the show args command.
Examples(idb) run
(idb) run -s > prog.output
See Alsofile (gdb mode only)load (idb mode only)rerun (idb mode only)set args (gdb mode only)show args (gdb mode only)

IDB Command Reference 7
269
rwatch (gdb mode only) Set a read watchpoint on the specified expression.
Syntaxrwatch expr
Parameters
Description
This command sets a read watchpoint on the specified expression. When the debuggee reads the value of the specified expression, it stops.
Watchpoints are also referred to as data breakpoints.
See Alsoawatch (gdb mode only)watch (gdb mode only)watch (idb mode only)
expr The expression on which to set the watchpoint.

270
7 Intel® Debugger Command Reference
search (gdb mode only) Search forward in the source for a string or repeat last search.
Syntaxsearch [string]
ParametersParameterss
Description
This command is a synonym for forward-search.
See Alsoforward-search (gdb mode only)reverse-search (gdb mode only)
string The character string to search for

IDB Command Reference 7
271
set (idb mode only) Set a debugger variable to a value or show all debugger variables.
Syntaxset [ variable = expr ]
Parameters
Description
This command sets a debugger variable, memory address, or expression that is accessible according to the scope and visibility rules of the language of the debuggee. Alternatively, this command displays a list of all debugger variables and their values.
To set a debugger variable, enter this command followed by a variable name, an equal sign, and a definition. Enclose string definitions in quotes.
To display the definitions of all debugger variables, enter this command without any parameters.
To display the definition of a single debugger variable, use the print command.
To delete one or all debugger variables, use the unset command.
To delete one or all environment variables, use the unsetenv command (not the unset command).
Enter help $variable for a list of all predefined debugger variables.
Example(idb) print $givedebughints
0
(idb) set $givedebughints = "gdb"
(idb) print $givedebughints
1
variable A debugger variable, memory address, or expression that is accessible according to the scope and visibility rules of the language.
expr The new definition of variable. This expression can be any expression that is valid in the current context.

272
7 Intel® Debugger Command Reference
See Alsoset variable (gdb mode only)show convenience (gdb mode only)unset (idb mode only)

IDB Command Reference 7
273
set args (gdb mode only) Specify arguments for the debuggee program.
Syntaxset args [arguments] [IO_redirection]
Parameters
Description
This command specifies arguments for the debuggee. If the run command does not specify any arguments, the debuggee uses the arguments from the previous run command or arguments that you set with the set args command.
If you do not include any parameters, the debugger sets the argument list to null.
The set args command does not affect processes currently running. New arguments affect only the next run.
To view default arguments, use the show args command.
Example(idb) set args -s > prog.output
arguments The arguments to pass to the debuggee.
IO_redirection Enables you to change stdin, stdout, and stderr, which are otherwise inherited from the debugger process.
You can enter the following values:
< filename
Redirect stdin
> filename
Redirect stdout
1> filename
Redirect stdout
2> filename
Redirect stderr
>& filename
Redirect stdout and stderr to a single file
1> filename 2> filename
Redirect stdout and stderr to different files

274
7 Intel® Debugger Command Reference
(idb) show args
Argument list to give program being debugged when it is started is "-s > prog.output".
See Alsorunshow args (gdb mode only)

IDB Command Reference 7
275
set confirm (gdb mode only) Switch confirmation requests on or off.
Syntaxset confirm {on|off}
Parameters
Description
This command switches confirmation requests for various commands on or off.
on Turns on confirmation requests.
off Turns off confirmation requests.

276
7 Intel® Debugger Command Reference
set editing (gdb mode only) Enable or disable Emacs*-like control characters.
Syntaxset editing {on|off}
Parameters
Description
This command enables or disables Emacs*-like control characters in the debugger. It is not possible to use vi*-like commands in IDB.
In the GUI console mode, this functionality is disabled by default. In the command-line interface, it is enabled by default.
Example(idb) set editing on
(idb) show editing
Editing of command lines as they are typed is on.
See Alsoshow editing (gdb mode only)
on Enable Emacs*-like control characters.
off Disable Emacs*-like control characters.

IDB Command Reference 7
277
set environment (gdb mode only) Set an environment variable to a value.
Syntaxset environment name [ value ]
Parameters
Description
This command sets an environment variable to a value you specify.
To show the value of an environment variable, use show environment.
To remove an environment variable, use unset environment.
The environment commands have no effect on the environment of any currently running process. The environment commands do not change or show the environment variables of the debugger or of the current process. They only affect the environment variables that will be used when a new process is created.
You can set and unset environment variables for processes created in the future to set up an environment different from the environment of the debugger and of the shell from which the debugger was invoked. When set, the environment variables apply to all new processes you debug.
See Alsoshow environment (gdb mode only)unset environment (gdb mode only)export (idb mode only)setenv (idb mode only)
name The name of an environment variable.
value The value for the environment variable.

278
7 Intel® Debugger Command Reference
set height (gdb mode only) Set the height of the screen.
Syntaxset height [num]
Parameters
Description
This command sets the height of the screen to num lines high.
This command only applies when you are using the debugger in command-line mode. It has no effect when you are using the Console window in the GUI.
Screen height determines how many lines of output the debugger prints without pausing. When the debugger prints a large amount of output, the output may scroll out of site. You can use this command to set the number of lines of output that the debugger prints at one time.
After printing num lines of output, the debugger pauses. To continue printing output, press Enter. If you don’t specify num, the debugger uses the default value 0, which prints all output without pausing.
You can also specify how many columns the debugger prints before wrapping its output using set width.
To show the current height, use show height.
Example(idb) set height 10
(idb) show height
Number of lines idb thinks are in a page is 10
(idb) set height 0
(idb) show height
Number of lines idb thinks are in a page is 0
See Alsoset width (gdb mode only)
num The screen height in lines.
Default: 0

IDB Command Reference 7
279
show height (gdb mode only)

280
7 Intel® Debugger Command Reference
set history save Switch command-line history on or off.
Syntaxset history save [{on|off}]
Parameters
Description
This command switches command-line history on or off.
See AlsoViewing the Command Historyset history sizeshow commands (gdb mode only)
on Switches on command-line history.
off Switches off command-line history.

IDB Command Reference 7
281
set history size Specify the size of the command-line history.
Syntaxset history size num
Parameters
Description
This command sets the size of the command history. The default size is that of the environment variable HISTSIZE. If HISTSIZE is not set, the default value is 256.
See AlsoViewing the Command Historyset history saveshow commands (gdb mode only)
num The number of lines in the command-line history.
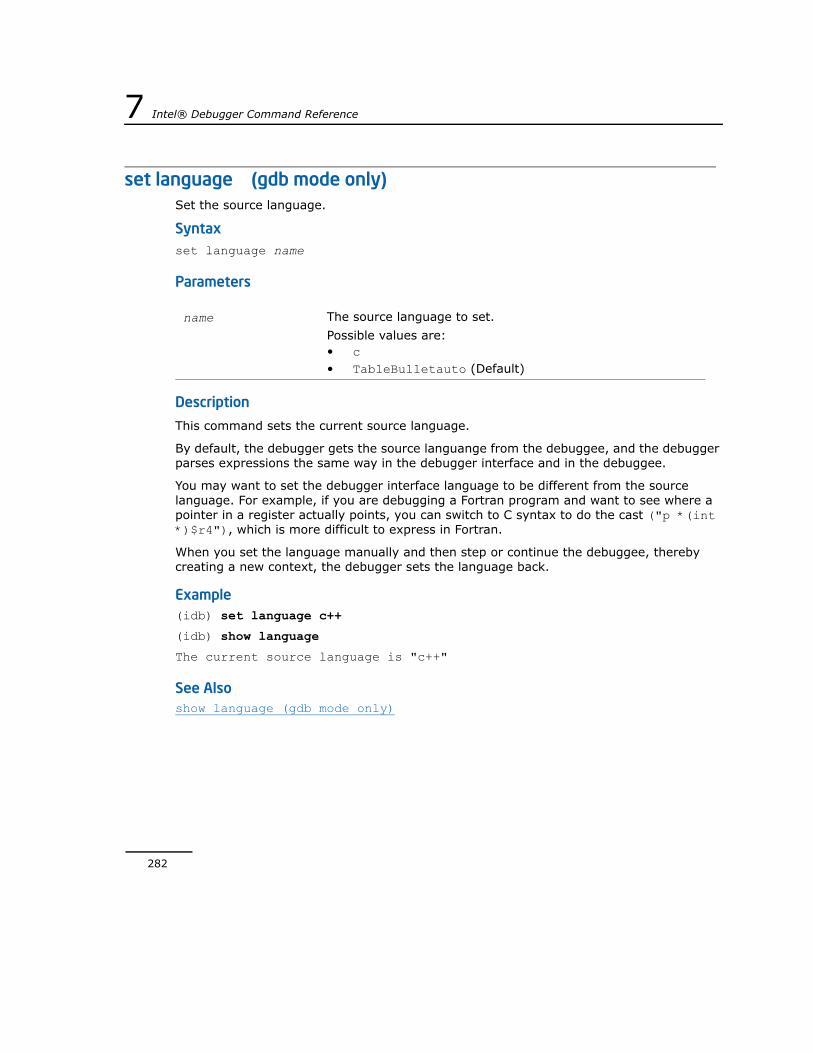
282
7 Intel® Debugger Command Reference
set language (gdb mode only) Set the source language.
Syntaxset language name
Parameters
Description
This command sets the current source language.
By default, the debugger gets the source languange from the debuggee, and the debugger parses expressions the same way in the debugger interface and in the debuggee.
You may want to set the debugger interface language to be different from the source language. For example, if you are debugging a Fortran program and want to see where a pointer in a register actually points, you can switch to C syntax to do the cast ("p *(int *)$r4"), which is more difficult to express in Fortran.
When you set the language manually and then step or continue the debuggee, thereby creating a new context, the debugger sets the language back.
Example(idb) set language c++
(idb) show language
The current source language is "c++"
See Alsoshow language (gdb mode only)
name The source language to set.
Possible values are:• c • TableBulletauto (Default)

IDB Command Reference 7
283
set listsize (gdb mode only) Set the default number of source lines for the list command to display.
Syntaxset listsize num
Parameters
Description
This command sets the default number of source lines for the list command to display.
Example(idb) set listsize 10
(idb) list
79
80 // To sort the array.
81 array4[a][b] = array4[c][d];
82
83 // Set a breakpoint to watch the array.
84 array4[c][d] = help;
85 }
86 }
87 }
88 }
(idb)
See Alsolistshow listsize (gdb mode only)
num The default number of source lines that the list command should display.

284
7 Intel® Debugger Command Reference
set max-user-call-depth (gdb mode only) Set the maximum number of recursion levels a user-defined command may have.
Syntaxset max-user-call-depth num
Parameters
Description
This command sets the maximum number of recursion levels a user-defined command may have. If the number of recursion levels in a user-defined command exceeds num, the debugger assumes an infinite recursion and aborts the command.
See AlsoUser-defined Commandsdefine (gdb mode only)show max-user-call-depth (gdb mode only)
num The maximum number of recursion levels.

IDB Command Reference 7
285
set output-radix (gdb mode only) Set the default numeric base for numeric output.
Syntaxset output-radix base
Parameters
Description
This command sets the default numeric base in which the debugger displays numeric output. The same rules apply for specifying the base as do with the set input-radix command.
Example(idb) set output-radix 8
Output radix now set decimal 8, hex 8, octal 10.
(idb) show output-radix
Default output radix for printing of values is 8.
See Alsoshow output-radix (gdb mode only)
base The default base for numeric output. Possible values, listed in decimal base, are:• 8• 10• 16
286
7 Intel® Debugger Command Reference
set print address (gdb mode only) Set the debugger’s default to either print or not print the value of a pointer as an address.
Syntaxset print address [ on | off ]
Parameters
Description
This command sets the debugger’s default to either print or not print the value of a pointer as an address.
The debugger shows the value of a pointer as an address by default.
This information may include the location of stack traces, breakpoints, structure and pointer values.
See Alsoshow print address (gdb mode only)
on Show an address value for pointers.
This is the default value.
off Hide an address value for pointers.

IDB Command Reference 7
287
set print elements (gdb mode only) Set a limit on the number of array elements to print.
Syntaxset print elements num
Parameters
Description
This command sets a limit on the number of array elements to print, which may be useful in a case where the debugger is printing a large array. This limit also applies to the number of characters the debugger will print when printing the value of a char * variable.
If you set num to zero, there is no limit on the number of elements.
Example(idb) p pc
$1 = (char *) 0x80485b8 "1234"
(idb) set prin ele 2
(idb) p pc
$2 = (char *) 0x80485b8 "12"...
(idb)
See Alsoshow print elements (gdb mode only)
num The number of elements to print.
The default value is 200.

288
7 Intel® Debugger Command Reference
set print repeats (gdb mode only) Limit the number of consecutive, identical array elements the debugger prints.
Syntaxset print repeats threshold
Parameters
Description
This command limits the number of consecutive, identical array elements the debugger prints. When the number of such elements exceeds threshold, instead of printing the elements, the debugger prints repeats n times, where n is the number of repetitions.
When threshold is 0, the debugger prints all consecutive, identical array elements.
Example(idb) p pBig
$1 = "011111211111333333333", '1' <repeats 40 times>
(idb) set print repe 2
(idb) p pBig
$2 = "0", '1' <repeats 5 times>, "2", '1' <repeats 5 times>, '3' <repeats 9 times>, '1' <repeats 40 times>
(idb)
See Alsoshow print repeats (gdb mode only)
threshold The maximum number of consecutive, identical array elements the debugger prints.
The default value is 10.

IDB Command Reference 7
289
set print static-members (gdb mode only) Print static members when showing a C++ object.
Syntaxset print static-members [on | off]
Parameters
Description
This command enables or disables printing static members when showing a C++ object.
Example(idb) set print stat off
(idb) p *jb
$3 = {JBfoo = 1}
(idb) set print stat on
(idb) p *jb
$4 = {JBfoo = 1, static yoyo = 99}
(idb)
See Alsoshow print static-members (gdb mode only)
on The debugger prints static members.
This is the default.
off The debugger does not print static members.

290
7 Intel® Debugger Command Reference
set prompt (gdb mode only) Set a new string for the debugger prompt.
Syntaxset prompt prompt
Parameters
Description
This command sets a new string for the debugger prompt.
If prompt contains spaces or special characters, enclose the parameter in quotes ("").
You also can specify a debugger prompt when you start the debugger from a shell with the -prompt option. For example:
% idb -prompt ">> "
>> quit
You can also change the prompt by setting the $prompt debugger variable. For example:
(idb) set $prompt = "newPrompt>> "
newPrompt>>
To see the current debugger prompt, use the show prompt command.
Example(idb) set prompt "(gdb mode) "
(gdb mode) show prompt
idb's prompt is "(gdb mode) ".
(gdb mode)
There is a space at the end of the first line of the example above. If the space is missed, the result will be as follows:
(idb) set prompt "(gdb mode)"
(gdb mode)show prompt
idb's prompt is "(gdb mode)".
(gdb mode)
prompt The new prompt. The default debugger prompt is (idb).

IDB Command Reference 7
291
See Alsoshow prompt (gdb mode only)
292
7 Intel® Debugger Command Reference
set substitute-path (gdb mode only)Set a substitution rule for finding source files.
Syntaxset substitute-path from-path to-path
Parameters
Description
This command sets a substitution rule for finding source files.
See Alsomap source directory (idb mode only)unset substitute-path (gdb mode only)Specifying Source Path Substitution Rules
from-path The path to be replaced.
to-path The new path.

IDB Command Reference 7
293
set variable (gdb mode only) Set a debugger variable to a value.
Syntaxset variable variable = [expression]
Parameters
Description
This command sets the values of a debugger variable, memory address, or expression that is accessible according to the scope and visibility rules of the language. The expression can be any expression that is valid in the current context.
The set variable command evaluates the specified expression. If the expression includes the assignment operator (=), the debugger evaluates that operator, as it does with all operators in expressions, and assigns the new value. The only difference between the set variable and the print commands is that set variable does not print anything, while print assigns the new value and displays the new value of the variable.
If you do not specify expression, debugger variables are set to void, while program variables do not change.
You can omit the keyword variable if the beginning of expression is unambiguous to the debugger. For example, if expression begins with the string height, the debugger interprets the command as the set height command.
For C++, use the set variable command to modify static and object data members in a class, and variables declared as reference types, type const, or type static. You cannot change the address referred to by a reference type, but you can change the value at that address.
Do not use the set variable command to change the PC. When you change the PC, no adjustment to the contents of registers or memory is made. Because most instructions change registers or memory in ways that can impact the meaning of the application,
variable The variable to set.
If variable starts with a dollar sign ($) then it is either a predefined register name or a debugger variable, either a predefined variable or a user variable.
If variable does not start with a dollar sign ($), it is a variable in the program.
expression The value for the variable.

294
7 Intel® Debugger Command Reference
changing the PC is very likely to cause your application to do incorrect calculations and arrive at the wrong answer. Access violations and other errors and signals may result from changing the value in the PC.
ExampleThe following example shows how to deposit the value 5 into the data member _data of a C++ object:
(idb) print node->_data
$2 = 2
(idb) set variable node->_data = 5
(idb) print node->_data
$3 = 5
The following example shows how to change the value associated with a variable and the value associated with an expression:
(idb) print *node
$6 = {<IntNode> = {<Node> = {_nextNode = 0x0}, _data = 5}, _fdata = 12.345}
(idb) set variable node->_data = -32
(idb) set variable node->_fdata = 3.14 * 4.5
(idb) set variable node->_nextNode = _firstNode
(idb) print *node
$7 = {<IntNode> = {<Node> = {_nextNode = 0x805c4e8}, _data = -32}, _fdata = 14.13}
You can use the set variable command to alter the contents of memory specified by an address as shown in the following example:
(idb) set variable $address = &(node->_data)
(idb) print $address
$11 = (int *) 0x805c500
(idb) print *(int *)($address)
$12 = -32
(idb) set variable *(int *)($address) = 1024
(idb) print *(int *)($address)
$13 = 1024
See Alsoassign (idb mode only)

IDB Command Reference 7
295
printset (idb mode only)show convenience (gdb mode only)

296
7 Intel® Debugger Command Reference
set width (gdb mode only) Set the width of the screen.
Syntaxset width [num]
Parameters
Description
This command sets the width of the screen to num characters wide.
This command only applies when you are using the debugger in command-line mode. It has no effect when you are using the Console window in the GUI.
Screen width determines how many characters of output the debugger prints without wrapping. When the debugger prints a large amount of output, the output may scroll out of site. You can use this command to set the number of characters of output that the debugger prints before wrapping to the next line.
If you don’t specify num, the debugger uses the default value 0, which prints all output without pausing.
You can also specify how many lines the debugger prints before pausing its output using set height.
To show the current width, use show width.
Example(idb) set width 40
(idb) show width
Number of characters idb thinks are in a line is 40
(idb) set width 0
(idb) show width
Number of characters idb thinks are in a line is 0
See Alsoset height (gdb mode only)show width (gdb mode only)
num The screen width in characters.
Default: 0

IDB Command Reference 7
297
setenv (idb mode only) Set the value of an environment variable.
Syntaxsetenv [ name value ]
Parameters
Description
This command sets the value of an environment variable when you include name and value, or lists all environment variables when you do not include any parameters.
setenv is similar to export, except that export requires the equal sign to set a value, while setenv does not.
This command has no effect on the environment of any currently running process. This command does not change or show the environment variables of the debugger or of the current process. It only affects the environment variables that will be used when a new process is created.
You can set and unset environment variables for processes created in the future to set up an environment different from the environment of the debugger and from the shell that invoked the debugger. When set, the environment variables apply to all new processes you debug.
There is no command to return environment variables to their initial state.
To print all environment variables, use printenv, setenv, or export.
To print a single environment variable, use printenv.
To unset an environment variable, use unsetenv.
Example(idb) printenv TOOLDIRECTORY
Error: Environment variable 'TOOLDIRECTORY' was not found in the environment.
(idb) setenv TOOLDIRECTORY /home/user/examples/tools
(idb) printenv TOOLDIRECTORY
TOOLDIRECTORY=/home/user/examples/tools
name The variable for which you want to set the value.
value The value for the variable.

298
7 Intel® Debugger Command Reference
See Alsoexport (idb mode only)printenv (idb mode only)unsetenv (idb mode only)set environment (gdb mode only)

IDB Command Reference 7
299
sh (idb mode only) Execute a shell command.
Syntaxsh string
Parameters
Description
This command executes a call to an OS shell command.
When using the Console window in the GUI, the shell output appears in the shell window that invoked the debugger.
ExampleThe following examples are based on the command-line debugger, not on the GUI.
(idb) sh uname -s
Linux
(idb)
To execute more than one command at the shell, spawn a shell and enter commands, as shown in the following example:
(idb) sh bash -f
% ls out
out
% ls *.b
recio.b
stdio.b
% exit
(idb)
See Alsoshell (gdb mode only)
string The command to execute.

300
7 Intel® Debugger Command Reference
shell (gdb mode only) Execute a shell command.
Syntaxshell string
Parameters
Description
This command executes a call to the operating system's system function. This function is documented in system(3).
When using the Console window in the GUI, the shell output appears in the shell window that invoked the debugger.
ExampleThe following examples are based on the command-line debugger, not on the GUI.
(idb) sh uname -s
Linux
(idb)
To execute more than one command at the shell, spawn a shell and enter commands, as follows:
(idb) shell bash --norc
$ ls out
out
$ ls *.b
recio.b
stdio.b
$ exit
(idb)
See Alsosh (idb mode only)
string The command to execute.

IDB Command Reference 7
301
show aggregated message Print the specified aggregated messages.
Syntaxshow aggregated message [ {all | msgs} ]
Parameters
Description
This command prints the specified aggregated messages, which is useful when debugging parallel applications.
The root debugger collects the outputs from the leaf debuggers and presents you with an aggregated output. In most cases, this aggregation works fine, but it can be an impediment if you want to know the exact output from certain leaf debuggers. To remedy this, the debugger assigns a unique number, called a message ID, to each aggregated message and saves the message in the message ID list.
If you specify a list of message IDs, the debugger displays the aggregated messages with these IDs.
If you specify all, IDB displays all the aggregated messages in the list.
If you specify nothing, the debugger shows the most recently added message.
See Alsoexpand aggregated message
msgs A list of comma-separated, aggregated message IDs. The debugger assigns each aggregated message a unique integer ID when it first displays the ID.
302
7 Intel® Debugger Command Reference
show architecture (gdb mode only) Show the current architecture.
Syntaxshow architecture
ParametersNone.
Description
This command shows the architecture of the currrent machine.
Possible values are:
i686 IA-32 architecture
x86_64 Intel® 64 architecture
ia64 IA-64 architecture

IDB Command Reference 7
303
show args (gdb mode only) Show arguments and input and output redirections.
Syntaxshow args
ParametersNone.
Description
This command shows the default arguments and it shows input and output redirections for the debuggee. To set argument and input and output redirections, use set args.
See Alsoset args (gdb mode only)

304
7 Intel® Debugger Command Reference
show commands (gdb mode only) Print commands in history.
Syntaxshow commands [num]
Parameters
Description
This command lists the last num commands in the debugger’s command history.
See AlsoViewing the Command Historyset history saveset history size
num The number of commands to print. By default, the values is set to 10.

IDB Command Reference 7
305
show condition (idb mode only) List information about pthreads condition variables.
Syntaxshow condition
ParametersNone.
Description
This command lists information about pthreads condition variables.

306
7 Intel® Debugger Command Reference
show convenience (gdb mode only) Show a list of debugger variables and their values.
Syntaxshow convenience
ParametersNone.
Description
This command displays a list of all debugger variables and their values.
See Alsoset variable (gdb mode only)set (idb mode only)

IDB Command Reference 7
307
show directories (gdb mode only) Show the list of source directories to search.
Syntaxshow directories
ParametersNone.
Description
This command lists the current source directories.
Example(idb) directory
Source directories searched: $cdir:$cwd
(idb) directory aa:cc:dd
Source directories searched: aa:cc:dd:$cdir:$cwd
(idb) show directory
Source directories searched: aa:cc:dd:$cdir:$cwd
See AlsoSpecifying Source DirectoriesSpecifying Source Path Substitution Rulesdirectory (gdb mode only)use (idb mode only)

308
7 Intel® Debugger Command Reference
show editing (gdb mode only) Show whether command line editing is on or off.
Syntaxshow editing
ParametersNone.
Description
This command shows whether command line editing is on or off.
Example(idb) set editing on
(idb) show editing
Editing of command lines as they are typed is on.
See Alsoset editing (gdb mode only)

IDB Command Reference 7
309
show environment (gdb mode only) Show one or all environment variables.
Syntaxshow environment [name]
Parameters
Description
This command shows one or all environment variables and their values.
If you do not specify name, the debugger displays all environment variables with their values.
Example(idb) show environment USER
USER=hal
See Alsoset environment (gdb mode only)export (idb mode only)printenv (idb mode only)
name The environment variable to show.

310
7 Intel® Debugger Command Reference
show height (gdb mode only) Show the height of the screen.
Syntaxshow height
ParametersNone.
Description
This command shows the height of the screen in lines.
To set the height, use set height.
See Alsoset height (gdb mode only)

IDB Command Reference 7
311
show language (gdb mode only) Show the current source language.
Syntaxshow language
ParametersNone.
Description
This command shows the current source language.
To set the current source language, use set language.
Example(idb) set language c++
(idb) show language
The current source language is "c++"
See Alsoset language (gdb mode only)

312
7 Intel® Debugger Command Reference
show listsize (gdb mode only) Show the default number of lines for the list command.
Syntaxshow listsize
ParametersNone.
Description
This command shows the default number of lines the debugger lists when you use the list command.
Example(idb) show listsize
Number of source lines idb will list by default is 10.
See Alsolistset listsize (gdb mode only)

IDB Command Reference 7
313
show lock (idb mode only) List information about OpenMP* locks.
Syntaxshow lock [ name,… ]
Parameters
Description
This command lists information about one or more OpenMP* locks.
If you don’t specify name, then the debugger displays all the currently known locks.
name The name of the lock.

314
7 Intel® Debugger Command Reference
show max-user-call-depth (gdb mode only) Show the maximum recursion level for user-defined commands.
Syntaxshow max-user-call-depth
ParametersNone.
Description
This command shows the maximum number of recursion levels a user-defined command may have.
See AlsoUser-defined Commandsdefine (gdb mode only)set max-user-call-depth (gdb mode only)

IDB Command Reference 7
315
show mutex (idb mode only) Show information about pthreads mutexes.
Syntaxshow mutex [ [mutex_id_list [ with state == locked ]]
Parameters
Description
This command shows information about currently available pthreads mutexes.
If you supply one or more mutex identifiers, the debugger displays information about only those mutexes that you specify, provided that the list matches the identity of currently available mutexes.
If you omit the mutex identifier specification, the debugger displays information about all mutexes currently available.
Use show mutex with state == locked to display information exclusively about locked mutexes.
mutex_id_list A list of mutex identifiers.

316
7 Intel® Debugger Command Reference
show openmp thread tree (idb mode only) Display the threads in the process in a tree format.
Syntaxshow openmp thread tree
ParametersNone.
Description
This command is equivalent to idb info openmp thread tree.
See Alsoidb info openmp thread tree (gdb mode only)show team (idb mode only)

IDB Command Reference 7
317
show output-radix (gdb mode only) Show the default numeric base for numeric output.
Syntaxshow output-radix
ParametersNone.
Description
This command shows the default numeric base in which the debugger displays numeric output.
Example(idb) set output-radix 8
Output radix now set decimal 8, hex 8, octal 10.
(idb) show output-radix
Default output radix for printing of values is 8.
See Alsoset output-radix (gdb mode only)

318
7 Intel® Debugger Command Reference
show print address (gdb mode only) Show whether the debugger is set to print or not print the value of a pointer as an address.
Syntaxshow print address
ParametersNone.
Description
This command shows whether the debugger is set to print or not print the value of a pointer as an address.
This command shows the current display setting for variables.
The debugger shows the value of a pointer as an address by default.
This information may include the location of stack traces, breakpoints, structure and pointer values.
See Alsoset print address (gdb mode only)

IDB Command Reference 7
319
show print elements (gdb mode only) Show the maximum number of array elements the debugger is set to print.
Syntaxshow print elements
ParametersNone.
Description
This command shows the maximum number of array elements the debugger is set to print. If the number is 0, there is no limit.
See Alsoset print elements (gdb mode only)

320
7 Intel® Debugger Command Reference
show print repeats (gdb mode only) Show the current threshold of repeated identical elements that the debugger is set to print.
Syntax show print repeats
ParametersNone.
Description
This command shows the current threshold of repeated identical elements that the debugger is set to print.
See Alsoset print repeats (gdb mode only)

IDB Command Reference 7
321
show print static-members (gdb mode only) Show the current setting for printing static class members with the the print command.
Syntaxshow print static-members
ParametersNone.
Description
This command shows the current setting for printing static class members with the the print command.
See Alsoset print static-members (gdb mode only)

322
7 Intel® Debugger Command Reference
show process (idb mode only)Show process information.
Syntaxshow process [ {all | *} ]
Parameters
Description
This command shows process information for the current debuggee process. If you do not specify any parameter, or if you specify all, the debugger shows information for all processes.
Example(idb) show process
Current Process: 127.0.0.1:29573 (/home/hal/example_ia/control_icc_9.0) paused.
See Alsoprocess (idb mode only)show process set
all | * Instructs the debugger to show all processes.

IDB Command Reference 7
323
show process setList information about one or all process sets.
Syntaxshow process set [ {all|name} ]
Parameters
Description
This command lists information about one or all process sets.
If you do not specify name, or if you specify all, the debugger displays all the process sets that are currently stored in debugger variables.
Example(idb) set $set2 = [8:9, 5:2, 22:27]
`5:2' is not a legal process range. Ignored.
(idb) show process set $set2
$set2 = [8:9, 22:27]
(idb) show process set *
$set1 = [:7, 10, 15:20, 30:]
$set2 = [8:9, 22:27]
See AlsoStoring Process and Thread Sets in Debugger Variablesprocess (idb mode only)show process (idb mode only)
all Lists information about all process sets.
name The process set whose information you want to see.

324
7 Intel® Debugger Command Reference
show prompt (gdb mode only) Show the current debugger prompt.
Syntaxshow prompt
ParametersNone.
Description
This command shows the current debugger prompt. Use the set prompt command to set the debugger prompt.
Example(idb) set prompt "(gdb mode) "
(gdb mode) show prompt
idb's prompt is "(gdb mode) ".
(gdb mode)
See Alsoset prompt (gdb mode only)

IDB Command Reference 7
325
show source directory (idb mode only) List information about directory mappings.
Syntaxshow [ all ] source directory [ directory ]
Parameters
Description
This command displays the directory mapping information of directory and its child directories.
If you do not specify directory, the debugger displays the mapping information of all the source directories whose parent is not a source directory.
If you specify all, the debugger displays the mapping information of all the descendants of directory.
To set a directory mapping, use map source directory.
To unset a directory mapping, use unmap source directory.
See Alsomap source directory (idb mode only)unmap source directory (idb mode only)
all Show mapping information of all descendants of directory.
directory The directory for which you are seeking mapping information.

326
7 Intel® Debugger Command Reference
show team (idb mode only) List information about OpenMP* teams.
Syntaxshow team [team_id,…]
Parameters
Description
This command lists information about live OpenMP* teams.
If you specify team_id one or more times, the debugger displays information about only those teams that you specify, provided that the list matches the identity of currently live teams.
If you do not specify team_id, the debugger displays information about all live teams.
Example
(idb) show team 6917529027641120768
OpenMP Team: 6917529027641120768
Parent Team: 6917529027641117440
Created At: "/projects/OpenMP/src/c_omp.c":main:58:98
Team members
[0] Thread 1, is master of team 6917529027641153024
[1] Thread 3, is master of team 6917529027641184768
See Alsoshow openmp thread tree (idb mode only)
team_id The team for which you want to list the information.

IDB Command Reference 7
327
show thread (idb mode only) List information about a thread.
Syntaxshow thread [ [thread_id,...] with state == thread_state ]
Parameters
Description
This command lists all the threads known to the debugger. If you specify one or more thread identifiers, the debugger displays information about the threads with matching thread ID and thread state.
If you do not specify thread_id_list, the debugger displays information for all threads.
Specify with state == thread_state to list threads that have specific characteristics, such as threads that are currently blocked.
Example(idb) show thread 1,2,3
See Alsoinfo threads (gdb mode only)
thread_id A thread ID. Specify one or more.
thread_state Threads that you want to list are in this state.
Valid state values for native threads:• ready • blocked • running • terminated • detached •
328
7 Intel® Debugger Command Reference
show user (gdb mode only) Show the definition of one or all user-defined commands.
Syntaxshow user [cmd]
Parameters
Description
This command shows the definition of one or all user-defined commands. If you specify cmd, the debugger displays the definition of that command. If you do not specify cmd, it displays the definitions of all user-defined commands.
See AlsoUser-defined Commandsdefine (gdb mode only)
cmd The user-defined command whose definition you want to show.

IDB Command Reference 7
329
show values (gdb mode only) Show ten values of the value history.
Syntaxshow values [ {num|+} ]
Parameters
Description
This command shows the last ten values in the value history.
If you specify num, the debugger shows the ten values centered around the value at the num place in the history.
If you specify +, the debugger shows the ten values in the history starting with the most recently printed value. For example, if the most recent printed value is $7, the debugger shows the ten values starting with $8.
If the value history does not contain enough values to print ten, the debugger prints the number of values it has in the value history. For example, if you do not specify num or +, and the debugger only has seven value, it shows seven values. If you specify +, and the value history only has seven values after the most recent one it printed, it shows those seven values.
num Show values centered on value num.
+ Start showing values after the last value printed.

330
7 Intel® Debugger Command Reference
show width (gdb mode only) Show the width of the screen.
Syntaxshow width
ParametersNone.
Description
This command shows the width of the screen in characters.
To set the width, use set width.
Example(idb) set width 40
(idb) show width
Number of characters idb thinks are in a line is 40
(idb) set width 0
(idb) show width
Number of characters idb thinks are in a line is 0
See Alsoset width (gdb mode only)

IDB Command Reference 7
331
source Execute commands from a batch file.
Syntaxsource filename
Parameters
Description
This command specifies a file from which the debugger reads and executes a series of commands.
Alternatively, you can execute debugger commands when you invoke the debugger by creating an initialization file named .idbrc or .dbxinit.
If you place commands in a file, you can execute them directly from the file rather than cutting and pasting them to the terminal. These commands can be nested. If you have multiple command files, the debugger continues reading and processing the commands in a subsequent file immediately after processing the final command of the previous file.
The following rules and guidelines apply to command files:
• Blank lines in command files do not repeat the last command, as opposed to blank lines entered directly from the prompt.
• Format the commands as if they were entered at the debugger prompt.
• Use the pound character (#) to create comments to format your scripts.
• When the debugger executes a command file, the value of the $pimode debugger variable determines whether the commands are echoed. If the $pimode variable is set to 1, commands are echoed. If $pimode is set to 0, the default, commands are not echoed. The debugger output resulting from the commands is always echoed.
ExampleThe following example is a debugger script named ../src/myscript:
step
where 2
The following example shows how to execute this script:
(idb) run
[1] stopped at [int main(void):187 0x080516aa]
filename The file from which to execute commands.

332
7 Intel® Debugger Command Reference
188 nodeList.append(newNode); {static int somethingToReturnTo; somethingToReturnTo++; }
(idb) source ../src/myscript
stopped at [void List<Node>::append(class Node* const):148 0x0804ae5a]
148 if (!_firstNode)
>0 0x0804ae5a in ((List<Node>*)0xbfffa460)->List<Node>::append(node=0x805c500) "src/x_list.cxx":148
See AlsoConfiguring Default Startup Actions Using Initialization Filesplayback input (idb mode only)record (idb mode only)

IDB Command Reference 7
333
status (idb mode only) Print info on all breakpoints and tracepoints.
Syntaxstatus
ParametersNone.
Description
This command displays all currently existing breakpoints and their properties.
Example(idb) status
#1 PC==0x08051603 in int main(void) "src/x_list.cxx":182 { stop }
#2 PC==0x0804ae5a in void List<Node>::append(class Node* const)
"src/x_list.cxx":148 { break }
#3 Access memory (write) 0xbfffdb00 to 0xbfffdb03 { stop }
See Alsodelete (idb mode only)disableenableinfo breakpoints (gdb mode only)info watchpoints (gdb mode only)stop every (idb mode only)

334
7 Intel® Debugger Command Reference
step Step forward in source, into any function calls.
Syntaxstep [expr]
Parameters
Description
This command executes a line of source code. When the next line to be executed contains a function call, the debugger steps into the function and stops at the first executable statement.
If you specify expr, the debugger evaluates the expression as a positive integer that specifies the number of times to execute the step command. The expression can be any expression that is valid in the current context.
ExampleIn the following example, five step commands continue executing a C++ program:
GDB Mode:
(idb) list +0,+4
151 Node* currentNode = _firstNode;
152 while (currentNode->getNextNode())
153 currentNode = currentNode->getNextNode();
154 currentNode->setNextNode(node);
(idb) step
152 while (currentNode->getNextNode())
(idb) step
Node::getNextNode (this=0x805c500) at src/x_list.cxx:81
81 Node* Node::getNextNode() {return _nextNode; }
(idb) step
81 Node* Node::getNextNode() {return _nextNode; }
(idb) step
expr A numeric expression.

IDB Command Reference 7
335
List<Node>::append (this=0xbfffcbe0, node=0x805c510) at src/x_list.cxx:152
152 while (currentNode->getNextNode())
(idb) step
154 currentNode->setNextNode(node);
IDB Mode:
(idb) list $curline:4
> 151 Node* currentNode = _firstNode;
152 while (currentNode->getNextNode())
153 currentNode = currentNode->getNextNode();
154 currentNode->setNextNode(node);
(idb) step
stopped at [void List<Node>::append(class Node* const):152 0x0804ae75]
152 while (currentNode->getNextNode())
(idb) step
stopped at [class Node* Node::getNextNode(void):81 0x08051be5]
81 Node* Node::getNextNode() {return _nextNode; }
(idb) step
stopped at [class Node* Node::getNextNode(void):81 0x08051bec]
81 Node* Node::getNextNode() {return _nextNode; }
(idb) step
stopped at [void List<Node>::append(class Node* const):152 0x0804ae81]
152 while (currentNode->getNextNode())
(idb) step
stopped at [void List<Node>::append(class Node* const):154 0x0804aebf]
154 currentNode->setNextNode(node);
See Alsonextnextirunstepi

336
7 Intel® Debugger Command Reference
stepi Step forward in assembler instructions, into any function calls.
Syntaxstepi [expr]
Parameters
Description
This command executes a machine instruction. When the instruction contains a function call, the command steps into the function being called.
For multithreaded applications, use the stepi command to step the current thread one machine instruction while putting all other threads on hold.
If you specify expr, the debugger evaluates the expression as a positive integer that specifies the number of times to execute the stepi command. The expression can be any expression that is valid in the current context.
ExampleThe following example shows stepping by instruction (stepi). To see stepping over calls, see the example of the next command.
GDB Mode:
(idb) x /8i $pc
0x0804ae6d <append+25>: movlr 0x8(%ebp), %eax
0x0804ae70 <append+28>: movlr (%eax), %eax
0x0804ae72 <append+30>: movl %eax, -16(%ebp)
0x0804ae75 <append+33>: pushl %edi
0x0804ae76 <append+34>: movlr -16(%ebp), %eax
0x0804ae79 <append+37>: movl %eax, (%esp)
0x0804ae7c <append+40>: call 0x08051be2 <getNextNode>
0x0804ae81 <append+45>: addl $0x4, %esp
(idb) stepi
0x0804ae70 151 Node* currentNode = _firstNode;
(idb) x /1i $pc
expr A numeric expression.
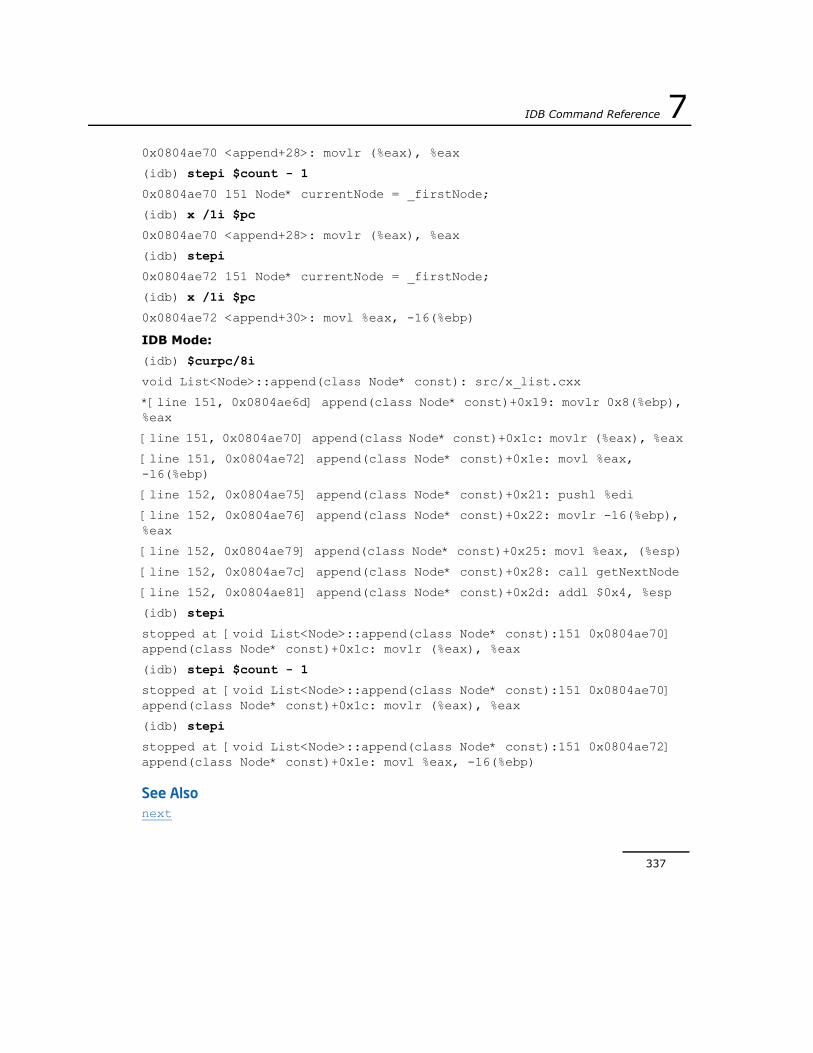
IDB Command Reference 7
337
0x0804ae70 <append+28>: movlr (%eax), %eax
(idb) stepi $count - 1
0x0804ae70 151 Node* currentNode = _firstNode;
(idb) x /1i $pc
0x0804ae70 <append+28>: movlr (%eax), %eax
(idb) stepi
0x0804ae72 151 Node* currentNode = _firstNode;
(idb) x /1i $pc
0x0804ae72 <append+30>: movl %eax, -16(%ebp)
IDB Mode:
(idb) $curpc/8i
void List<Node>::append(class Node* const): src/x_list.cxx
*[line 151, 0x0804ae6d] append(class Node* const)+0x19: movlr 0x8(%ebp), %eax
[line 151, 0x0804ae70] append(class Node* const)+0x1c: movlr (%eax), %eax
[line 151, 0x0804ae72] append(class Node* const)+0x1e: movl %eax, -16(%ebp)
[line 152, 0x0804ae75] append(class Node* const)+0x21: pushl %edi
[line 152, 0x0804ae76] append(class Node* const)+0x22: movlr -16(%ebp), %eax
[line 152, 0x0804ae79] append(class Node* const)+0x25: movl %eax, (%esp)
[line 152, 0x0804ae7c] append(class Node* const)+0x28: call getNextNode
[line 152, 0x0804ae81] append(class Node* const)+0x2d: addl $0x4, %esp
(idb) stepi
stopped at [void List<Node>::append(class Node* const):151 0x0804ae70] append(class Node* const)+0x1c: movlr (%eax), %eax
(idb) stepi $count - 1
stopped at [void List<Node>::append(class Node* const):151 0x0804ae70] append(class Node* const)+0x1c: movlr (%eax), %eax
(idb) stepi
stopped at [void List<Node>::append(class Node* const):151 0x0804ae72] append(class Node* const)+0x1e: movl %eax, -16(%ebp)
See Alsonext

338
7 Intel® Debugger Command Reference
nextirunstep

IDB Command Reference 7
339
stop at (idb mode only) Set a breakpoint at a line number or expression.
Syntaxstop [quiet] at expr [thread ID {,...}][if cond] [commands]
Parameters
Description
This command sets a breakpoint on an expression that you specify with expr.
To suppress status reporting messages when the debugger hits a breakpoint, specify quiet.
To set a breakpoint such that the debugger stops when it hits one or more specific threads, specify thread and one or more comma-separated thread IDs.
To set a breakpoint based on a conditional expression, specify if cond.
To run one or more commands upon hitting a breakpoint, specify commands.
Example(idb) stop in main
[#1: stop in int main(void) ]
(idb) stop at 167
[#1: stop at "src/x_list.cxx":167]
(idb) run
[1] stopped at [void List<Node>::print(void) const:167 0x0804af2e]
167 cout << "Node " << i ;
(idb)
expr A line number in source code or an expression, other than a function name.
ID A thread ID.
cond A conditional expression.
commands A list of debugger commands.

340
7 Intel® Debugger Command Reference
See Alsobreak (gdb mode only)delete (idb mode only)disableenablestatus (idb mode only)stop every (idb mode only)stop in (idb mode only)stop pc (idb mode only)stop variable (idb mode only)stop memory (idb mode only)stop signal (idb mode only)stop unaligned (idb mode only)stop every (idb mode only)

IDB Command Reference 7
341
stop every (idb mode only) Set a breakpoint on every function entry point or on every instruction.
Syntaxstop [quiet] every procedure entry [thread ID {,...}][if cond] [commands]
stop [quiet] every instruction [thread ID {,...}][if cond] [commands]
Parameters
Description
This command sets a breakpoint on every entry point to a function in the program, or on every instruction in the program.
To suppress status reporting messages when the debugger hits a breakpoint, specify quiet.
To set a breakpoint such that the debugger stops when it hits one or more specific threads, specify thread and one or more comma-separated thread IDs.
To set a breakpoint based on a conditional expression, specify if cond.
To run one or more commands upon hitting a breakpoint, specify commands.
A disadvantage of this command is that it establishes breakpoints for hundreds or even thousands of entry points about which you have little or no information. For example, if you use stop every procedure entry immediately after loading a program and then run it, the debugger will stop or trace over 100 entry points before reaching your main entry point. About the only thing that you can do if execution stops at most such unknown places is continue until some function relevant to your debugging is reached.
NOTE. This command can be very time consuming because the debugger searches your entire program—including all shared libraries that it references—and establishes breakpoints for every entry point in every executable image. This can also considerably slow execution of your program as it runs.
ID A thread ID.
cond A conditional expression.
commands A list of debugger commands.

342
7 Intel® Debugger Command Reference
See Alsobreak (gdb mode only)delete (idb mode only)disableenablestatus (idb mode only)stop at (idb mode only)stop in (idb mode only)stop memory (idb mode only)stop pc (idb mode only)stop signal (idb mode only)stop unaligned (idb mode only)stop variable (idb mode only)

IDB Command Reference 7
343
stop in (idb mode only) Set a breakpoint in a function.
Syntaxstop [quiet] [in] [all] funcname [thread ID {,...}][if cond] [commands]
Parameters
Description
This command sets a breakpoint on a function named funcname. If you specify all, the debugger breaks on all functions with this name.
Whenever the debugger hits a breakpoint, the debugger suspends program execution and waits for a command from you.
To suppress status reporting messages when the debugger hits a breakpoint, specify quiet.
To set a breakpoint such that the debugger stops when it hits one or more specific threads, specify thread and one or more comma-separated thread IDs.
To set a breakpoint based on a conditional expression, specify if cond.
To run one or more commands upon hitting a breakpoint, specify commands.
Example(idb) stop in main
[#1: stop in int main(void) ]
(idb) stop at 167
[#1: stop at "src/x_list.cxx":167]
(idb) run
[1] stopped at [void List<Node>::print(void) const:167 0x0804af2e]
167 cout << "Node " << i ;
funcname Sets a breakpoint on the function of this name.
ID A thread ID.
cond A conditional expression.
commands A list of debugger commands.

344
7 Intel® Debugger Command Reference
(idb)
See Alsobreak (gdb mode only)delete (idb mode only)disableenablestatus (idb mode only)stop at (idb mode only)stop every (idb mode only)stop memory (idb mode only)stop pc (idb mode only)stop signal (idb mode only)stop unaligned (idb mode only)stop variable (idb mode only)

IDB Command Reference 7
345
stop memory (idb mode only) Set a breakpoint on a region in memory.
Syntaxstop [quiet] memory start-addr [, end-addr| :size] [access] [within funcname] [thread ID {,...}][if cond] [commands]
Parameters
Description
This command sets a breakpoint on a region in memory that you specify. If you specify within funcname, program execution breaks only when the access occurs in the specified function.
start-addr is the address at the beginning of a memory region. This memory region is 8-bytes in size when you do not specify end-addr or size.
If you specify size, the memory region starts with start-addr and is size-bytes long.
If you specify end-addr, the memory region is from start-addr through end-addr, inclusive.
To suppress status reporting messages when the debugger hits a breakpoint, specify quiet.
ID A thread ID.
cond A conditional expression.
commands A list of debugger commands.
start-addr The address at the start of the memory region.
end-addr The address at the end of the memory region starting from start-addr.
size The size of the memory region starting from start-addr.
funcname The name of a function.
access Possible values are:• write • read • changed This mode detects writes that change the
contents of the memory.• any This mode detects both read and write.
Default value: write

346
7 Intel® Debugger Command Reference
To set a breakpoint such that the debugger stops when it hits one or more specific threads, specify thread and one or more comma-separated thread IDs.
To set a breakpoint based on a conditional expression, specify if cond.
To run one or more commands upon hitting a breakpoint, specify commands.
See Alsobreak (gdb mode only)delete (idb mode only)disableenablestatus (idb mode only)stop in (idb mode only)stop at (idb mode only)stop pc (idb mode only)stop variable (idb mode only)stop signal (idb mode only)stop unaligned (idb mode only)stop every (idb mode only)

IDB Command Reference 7
347
stop pc (idb mode only) Set a breakpoint when PC equals a specific address.
Syntaxstop [quiet] pc address [thread ID {,...}][if cond] [commands]
Parameters
Description
This command sets a breakpoint that stops program execution when PC equals an address that you specify.
To suppress status reporting messages when the debugger hits a breakpoint, specify quiet.
To set a breakpoint such that the debugger stops when it hits one or more specific threads, specify thread and one or more comma-separated thread IDs.
To set a breakpoint based on a conditional expression, specify if cond.
To run one or more commands upon hitting a breakpoint, specify commands.
See Alsobreak (gdb mode only)delete (idb mode only)disableenablestatus (idb mode only)stop in (idb mode only)stop at (idb mode only)stop variable (idb mode only)stop memory (idb mode only)stop signal (idb mode only)stop unaligned (idb mode only)stop every (idb mode only)
address An address.
ID A thread ID.
cond A conditional expression.
commands A list of debugger commands.

348
7 Intel® Debugger Command Reference
stop signal (idb mode only) Set a breakpoint on a signal.
Syntaxstop [quiet] signal signal [, ...] [thread ID {,...}][if cond] [commands]
Parameters
Description
This command sets a breakpoint on a signal. Program execution stops when it receives any of the signals that you specify.
To see a list of signals, use the GDB mode command info handle.
You can notate a signal with or without the prefix SIG. Signal notation is not case-sensitive. For example, all of the following refer to the same signal:
• hup
• sighup
• HUP
• SIGHUP
To suppress status reporting messages when the debugger hits a breakpoint, specify quiet.
To set a breakpoint such that the debugger stops when it hits one or more specific threads, specify thread and one or more comma-separated thread IDs.
To set a breakpoint based on a conditional expression, specify if cond.
To run one or more commands upon hitting a breakpoint, specify commands.
Example(idb) stop signal hup, int
[#5: stop signal hup, int]
signal One or more comma-separated signals.
ID A thread ID.
cond A conditional expression.
commands A list of debugger commands.

IDB Command Reference 7
349
See Alsobreak (gdb mode only)catch (idb mode only)delete (idb mode only)disableenableinfo handle (gdb mode only)status (idb mode only)stop in (idb mode only)stop at (idb mode only)stop pc (idb mode only)stop variable (idb mode only)stop memory (idb mode only)stop unaligned (idb mode only)stop every (idb mode only)

350
7 Intel® Debugger Command Reference
stop unaligned (idb mode only) Set a breakpoint on unaligned accesses.
Syntaxstop [quiet] unaligned [thread ID {,...}][if cond] [commands]
Parameters
Description
This command sets a breakpoint that stops the debugger when program execution encounters an unaligned access.
To suppress status reporting messages when the debugger hits a breakpoint, specify quiet.
To set a breakpoint such that the debugger stops when it hits one or more specific threads, specify thread and one or more comma-separated thread IDs.
To set a breakpoint based on a conditional expression, specify if cond.
To run one or more commands upon hitting a breakpoint, specify commands.
See Alsobreak (gdb mode only)delete (idb mode only)disableenablestatus (idb mode only)stop in (idb mode only)stop at (idb mode only)stop pc (idb mode only)stop variable (idb mode only)stop memory (idb mode only)stop signal (idb mode only)stop every (idb mode only)
ID A thread ID.
cond A conditional expression.
commands A list of debugger commands.

IDB Command Reference 7
351
stop variable (idb mode only) Set a breakpoint on a specific variable.
Syntaxstop [quiet] variable lvalue [access] [within funcname] [thread ID {,...}][if cond] [commands]
Parameters
Description
This command sets a breakpoint on a variable that you specify. If you specify within funcname, program execution breaks only when the access occurs in the specified function.
To suppress status reporting messages when the debugger hits a breakpoint, specify quiet.
To set a breakpoint such that the debugger stops when it hits one or more specific threads, specify thread and one or more comma-separated thread IDs.
To set a breakpoint based on a conditional expression, specify if cond.
To run one or more commands upon hitting a breakpoint, specify commands.
See Alsobreak (gdb mode only)delete (idb mode only)
lvalue An expression that designates a memory location.
ID A thread ID.
cond A conditional expression.
commands A list of debugger commands.
funcname The name of a function.
access Possible values are:• write • read • changed This mode detects writes that change the
contents of the memory.• any This mode detects both read and write.
Default value: write

352
7 Intel® Debugger Command Reference
disableenablestatus (idb mode only)stop in (idb mode only)stop at (idb mode only)stop pc (idb mode only)stop memory (idb mode only)stop signal (idb mode only)stop unaligned (idb mode only)stop every (idb mode only)
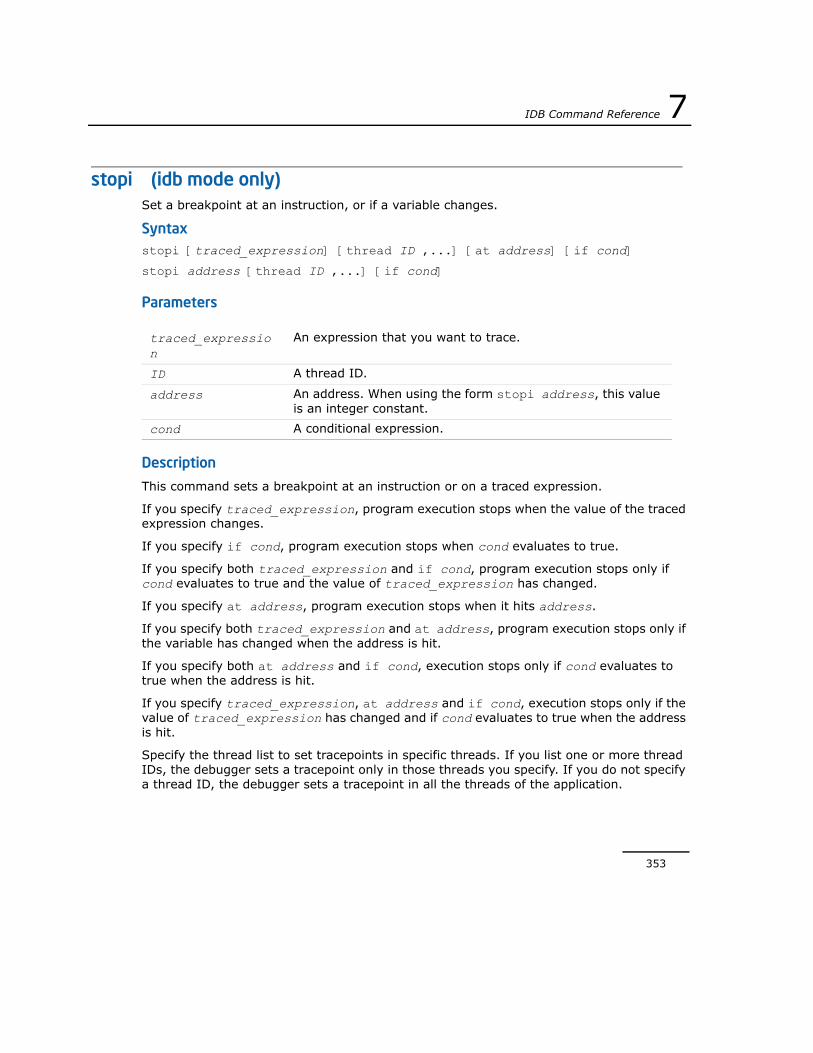
IDB Command Reference 7
353
stopi (idb mode only) Set a breakpoint at an instruction, or if a variable changes.
Syntaxstopi [traced_expression] [thread ID ,...] [at address] [if cond]
stopi address [thread ID ,...] [if cond]
Parameters
Description
This command sets a breakpoint at an instruction or on a traced expression.
If you specify traced_expression, program execution stops when the value of the traced expression changes.
If you specify if cond, program execution stops when cond evaluates to true.
If you specify both traced_expression and if cond, program execution stops only if cond evaluates to true and the value of traced_expression has changed.
If you specify at address, program execution stops when it hits address.
If you specify both traced_expression and at address, program execution stops only if the variable has changed when the address is hit.
If you specify both at address and if cond, execution stops only if cond evaluates to true when the address is hit.
If you specify traced_expression, at address and if cond, execution stops only if the value of traced_expression has changed and if cond evaluates to true when the address is hit.
Specify the thread list to set tracepoints in specific threads. If you list one or more thread IDs, the debugger sets a tracepoint only in those threads you specify. If you do not specify a thread ID, the debugger sets a tracepoint in all the threads of the application.
traced_expression
An expression that you want to trace.
ID A thread ID.
address An address. When using the form stopi address, this value is an integer constant.
cond A conditional expression.

354
7 Intel® Debugger Command Reference
The stopi command differs from the stop command in that the debugger checks the breakpoint set with the stopi command after executing each machine instruction. So using stopi affects performance of the debuggee.

IDB Command Reference 7
355
target core (gdb mode only) Specify a core file as a target.
Syntaxtarget core filename
Parameters
Description
This command specifies a core file to use as a target.
Core file debugging is not supported on Mac OS* X.
This command is the same as core-file filename.
See Alsocore-file (gdb mode only)
filename The filename of the target core file.

356
7 Intel® Debugger Command Reference
tbreak (gdb mode only) Set a temporary breakpoint at specified location.
Syntaxtbreak { funcname | num }
Parameters
Description
This command sets a temporary breakpoint at the specified location, either a line number in source code, or a function.
This command differs from the break command in that the tbreak command creates a temporary breakpoint that is automatically removed after it stops program execution.
Example(idb) tbreak main
See Alsobreak (gdb mode only)commands (gdb mode only)condition (gdb mode only)disableenableignore (gdb mode only)info breakpoints (gdb mode only)jump (gdb mode only)
funcname The name of a function.
num The number of a source code line.

IDB Command Reference 7
357
thread Show or change the current thread.
Syntaxthread [ID]
Parameters
Description
This command shows or changes the current thread. If you omit a thread identifier, the debugger shows the current thread. If you specify a thread identifier, the debugger makes that thread the current thread.
The debugger variable $curthread contains the thread identifier of the current thread. The $curthread value is updated when program execution stops or completes.
You can modify the current thread by assigning $curthread a valid thread identifier, which is equivalent to issuing the thread ID command. When there is no process or program, $curthread is set to 0.
ExampleGDB Mode:
(idb) thread 2
* 2 Thread 1026 (LWP 19515) 0x804f8f6 in __sigsuspend from /tmp/pthread_manythreads
IDB Mode:
(idb) thread 2
ID STATE
*1 stopped
See Also$curthread
ID The identifier of the thread to which you want to switch.

358
7 Intel® Debugger Command Reference
unalias (idb mode only) Remove an alias.
Syntaxunalias alias_name
Parameters
Description
This command removes the alias specified by alias_name.
Example(idb) alias cs
alias cs is not defined
(idb) alias cs "stop at 186; run"
(idb) cs
[#1: stop at "x_list.cxx":186 ]
[1] stopped at [int main(void):186 0x120002420]
186 IntNode* newNode = new IntNode(1);
(idb) unalias cs
(idb)
See Alsoalias (idb mode only)
alias_name The name of the alias to be removed.

IDB Command Reference 7
359
unload (idb mode only) Unload an image or a core file from the debugger.
Syntaxunload [ {filename|pid,…} ]
Parameters
Description
This command unloads an image or a core file from the debugger.
Core file debugging is not supported on Mac OS* X.
Example(idb) listobj
section Start Addr End Addr
------------------------------------------------------------------------
/home/user/examples/x_list
.text 0x8048000 0x8056e3f
.data 0x8057000 0x805deeb
.bss 0x805deec 0x805dfb3
/lib/libdl-2.3.2.so
.text 0xb7386000 0xb7387dc3
.data 0xb7388dc4 0xb7388f53
.bss 0xb7388f54 0xb7388f73
/lib/tls/libc-2.3.2.so
.text 0xb7389000 0xb74b94f5
.data 0xb74ba500 0xb74bcfdb
.bss 0xb74bcfdc 0xb74bfa8b
/nfs/cmplr/icc-9.0.031/lib/libunwind.so.5
.text 0xb74c0000 0xb74c433f
filename The executable file to unload.
pid An integer constant representing the ID of the process to unload.

360
7 Intel® Debugger Command Reference
.data 0xb74c5340 0xb74c5abb
.bss 0xb74c5abc 0xb74c5c1b
/nfs/cmplr/icc-9.0.031/lib/libcxa.so.5
.text 0xb74c6000 0xb74e62b3
.data 0xb74e7000 0xb74eed37
.bss 0xb74eed38 0xb74eeeaf
/nfs/cmplr/icc-9.0.031/lib/libcprts.so.5
.text 0xb74ef000 0xb758d933
.data 0xb758e000 0xb75b422f
.bss 0xb75b4230 0xb75b4c27
/lib/tls/libm-2.3.2.so
.text 0xb75b5000 0xb75d5dbf
.data 0xb75d6dc0 0xb75d6f43
.bss 0xb75d6f44 0xb75d6f8f
/lib/ld-2.3.2.so
.text 0xb75eb000 0xb75fffcf
.data 0xb7600000 0xb7600533
.bss 0xb7600534 0xb7600753
(idb) unload
(idb) listobj
Program is not active
See Alsoload (idb mode only)

IDB Command Reference 7
361
unmap source directory (idb mode only) Remove a directory mapping.
Syntaxunmap source directory dirname
Parameters
Description
This command removes a directory mapping by restoring the default mapping of dirname.
Example(idb) show source directory
.
/home/user/examples/solarSystemSrc *=> /home/user/examples/movedSolarSystemSrc
...
(idb) show source directory /home/user/examples/solarSystemSrc
/home/user/examples/solarSystemSrc *=> /home/user/examples/movedSolarSystemSrc
/home/user/examples/solarSystemSrc/base_class_includes => /home/user/examples/movedSolarSystemSrc/base_class_includes
/home/user/examples/solarSystemSrc/derived_class_includes => /home/user/examples/movedSolarSystemSrc/derived_class_includes
/home/user/examples/solarSystemSrc/main => /home/user/examples/movedSolarSystemSrc/main
(idb) unmap source directory /home/user/examples/solarSystemSrc
(idb) show source directory /home/user/examples/solarSystemSrc
/home/user/examples/solarSystemSrc
/home/user/examples/solarSystemSrc/base_class_includes
/home/user/examples/solarSystemSrc/derived_class_includes
dirname The directory whose mapping will be removed.

362
7 Intel® Debugger Command Reference
unrecord (idb mode only) Stop recording debugger input, output, or both.
Syntaxunrecord {input|output|io}
Parameters
Description
This command stops recording debugger input, output, or both.
To record, use the record command.
Example(idb) record output myscript
(idb) stop in List<Node>::append
[#2: stop in void List<Node>::append(class Node* const)]
(idb) cont
[2] stopped at [void List<Node>::append(class Node* const):148 0x0804ae5a]
148 if (!_firstNode)
(idb) cont to 156
stopped at [void List<Node>::append(class Node* const):156 0x0804aed7]
156 }
(idb) unrecord output
See Alsorecord (idb mode only)
input Stops logging input.
output Stops logging output
io Stops logging input and output.

IDB Command Reference 7
363
unset (idb mode only) Delete the specified debugger variable.
Syntaxunset name
Parameters
Description
This command deletes the specified debugger variable.
Example(idb) set $color="blue"
(idb) print $color
"blue"
(idb) unset $color
(idb) print $color
Symbol "$color" is not defined.
See Alsoset (idb mode only)
name The variable to delete.
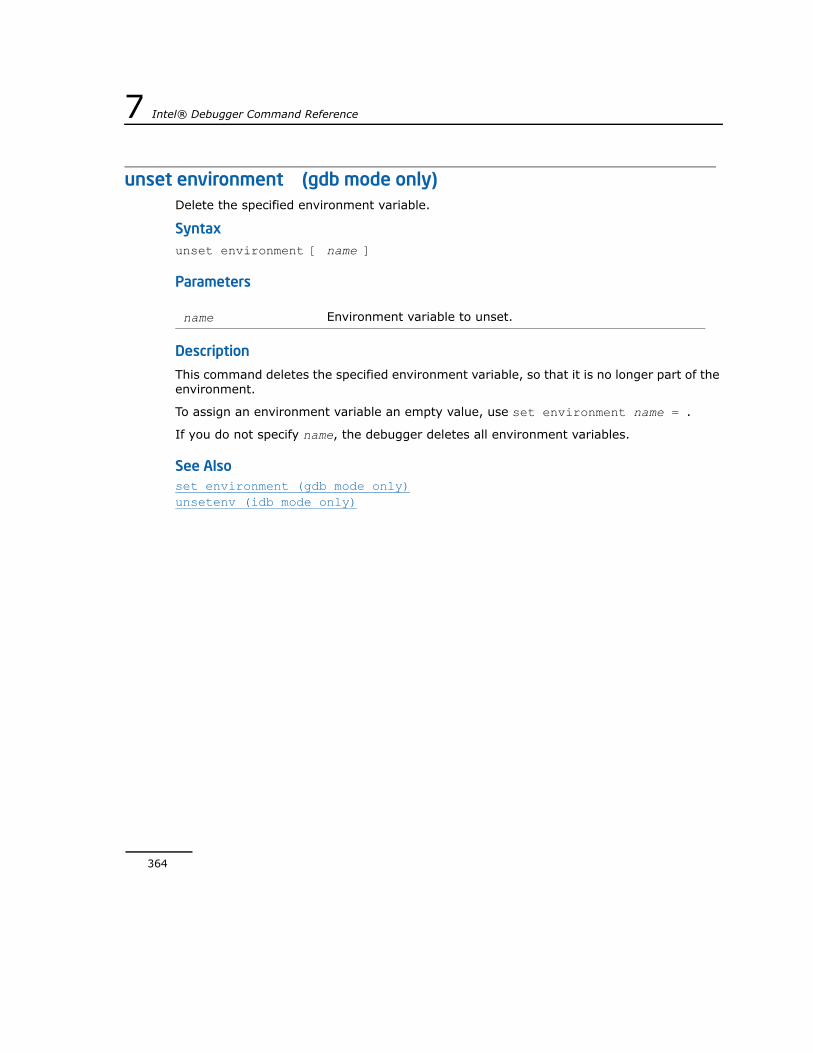
364
7 Intel® Debugger Command Reference
unset environment (gdb mode only) Delete the specified environment variable.
Syntaxunset environment [ name ]
Parameters
Description
This command deletes the specified environment variable, so that it is no longer part of the environment.
To assign an environment variable an empty value, use set environment name = .
If you do not specify name, the debugger deletes all environment variables.
See Alsoset environment (gdb mode only)unsetenv (idb mode only)
name Environment variable to unset.

IDB Command Reference 7
365
unset substitute-path (gdb mode only)Unset a source directory substitution rule.
Syntaxunset substitute-path from-path
Parameters
Description
This command unsets a source directory substitution rule. Specify the original path for which you created a substitution rule.
See Alsoset substitute-path (gdb mode only)Specifying Source Path Substitution Rules
from-path The path you replaced with the set substitute-path command.
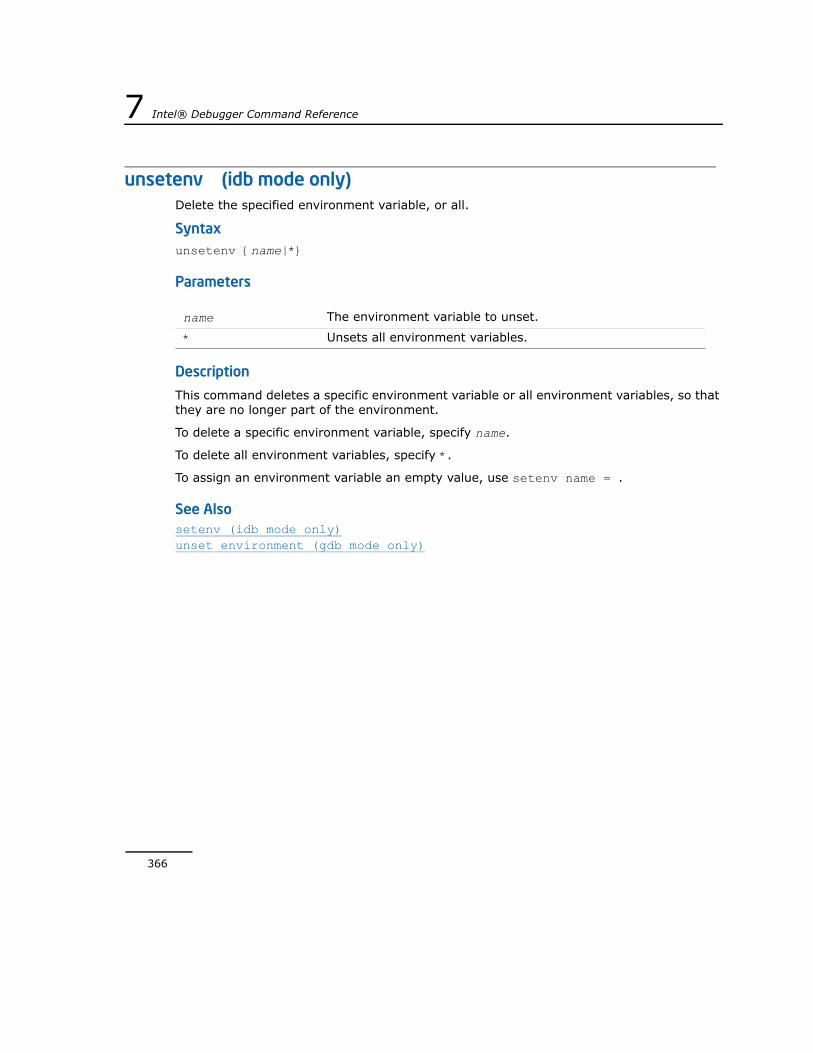
366
7 Intel® Debugger Command Reference
unsetenv (idb mode only) Delete the specified environment variable, or all.
Syntaxunsetenv {name|*}
Parameters
Description
This command deletes a specific environment variable or all environment variables, so that they are no longer part of the environment.
To delete a specific environment variable, specify name.
To delete all environment variables, specify *.
To assign an environment variable an empty value, use setenv name = .
See Alsosetenv (idb mode only)unset environment (gdb mode only)
name The environment variable to unset.
* Unsets all environment variables.

IDB Command Reference 7
367
until (gdb mode only) Run until a specific line.
Syntaxuntil [line]
Parameters
Description
This command continues the debuggee past the current line until the next source line in the current stack frame. Use this command to avoid single stepping through a loop more than once.
If you specify line, the debugger continues running until it either reaches the specified location, or the current stack frame returns.
See Alsoadvance (gdb mode only)continue (gdb mode only)
line The line until which to run.

368
7 Intel® Debugger Command Reference
unuse (idb mode only) Remove the specified directories from the source path or set path to default.
Syntaxunuse [ { dirname,… | * } ]
Parameters
Description
This command removes entries from the list of source directories that the debugger uses to search for source and script files when opening an executable file.
To add entries to the list, use use.
If you do not specify any directories, this command sets the search list to the default, which is the home directory, the current directory, and the directory containing the executable file.
If you specify any directory names, the debugger removes them from the search list.
If you specify an asterisk (*), the debugger removes all directories from the search list.
Example(idb) unuse aa
Directory search path for source files:
. ../src /home/user/examples bb cc
(idb) unuse aa
aa not in the current source path
Directory search path for source files:
. ../src /home/user/examples bb cc
(idb) unuse bb cc
Directory search path for source files:
. ../src /home/user/examples
(idb) unuse *
Directory search path for source files:
dirname The directory to remove from source path.
* Sets path to default.

IDB Command Reference 7
369
(idb) unuse
Directory search path for source files:
. ../src /home/user/examples
See Alsoshow source directory (idb mode only)use (idb mode only)

370
7 Intel® Debugger Command Reference
up Move a specific number of frames up the stack and print them.
Syntaxup [ num ]
Parameters
Description
This command moves to the stack frame num levels above the current frame and then prints those frames. The default value for num is 1.
If the specified number of levels exceeds the number of active calls on the stack in the specified direction, the debugger issues a warning message and the call frame does not change.
When the current call frame changes, the debugger displays the source line corresponding to the last instruction executed in the function executing the selected call frame.
ExampleGDB Mode:
(idb) up 2
#2 0x08051a3c in main () at src/x_list.cxx:203
203 nodeList.print();
(idb) list 200,+5
200 CompoundNode* cNode2 = new CompoundNode(10.123, 5);
201 nodeList.append(cNode2); {static int somethingToReturnTo; somethingToReturnTo++; }
202
203 nodeList.print();
204 }
See Alsodowndown-silently (gdb mode only)
num A numeric expression of non-negative value. The default value is 1.

IDB Command Reference 7
371
up-silently (gdb mode only)

372
7 Intel® Debugger Command Reference
up-silently (gdb mode only) Move a specific number of frames up the stack but do not print them.
Syntaxup-silently [num]
Parameters
Description
This command moves to the stack frame num levels above the current frame. The default value for num is 1. This command is the same as up, except that it does not display the new frame.
If the specified number of levels exceeds the number of active calls on the stack in the specified direction, the debugger issues a warning message and the call frame does not change.
See Alsodowndown-silently (gdb mode only)up
num A numeric expression of non-negative value

IDB Command Reference 7
373
use (idb mode only) Add a directory to the source path, or show directories in the source path.
Syntaxuse [ dirname … ]
Parameters
Description
This command adds directories to the list of source directories that the debugger uses to search for source and script files when opening an executable file.
If you do not specify dirname, the debuggee lists the directories in which the debugger searches for source code files.
If you specify dirname, the debugger searches source code files in that directory, and appends dirname to the list of source directories, or it replaces the list, depending on the value of the $dbxuse debugger variable: When $dbxuse is zero, the debugger appends. Otherwise it replaces. The default value of $dbxuse is 0.
Alternatively, you can specify the -I option when you start the debugger.
You can customize your debugger environment source code search paths by adding commands to your .idbrc file that use the use command.
Example(idb) use
Directory search path for source files:
. ../src /home/user/examples
(idb) use aa
Directory search path for source files:
. ../src /home/user/examples aa
(idb) use bb cc
Directory search path for source files:
. ../src /home/user/examples aa bb cc
(idb) use bb
Directory search path for source files:
dirname The path of the directory to add to the source path.

374
7 Intel® Debugger Command Reference
. ../src /home/user/examples aa bb cc
(idb) use aa bb cc
Directory search path for source files:
. ../src /home/user/examples aa bb cc
(idb) set $dbxuse = 1
(idb) use aa
Directory search path for source files:
. ../src /home/user/examples aa
See Alsoshow source directory (idb mode only)unuse (idb mode only)$dbxuse

IDB Command Reference 7
375
watch (gdb mode only) Set a write watchpoint on the specified expression.
Syntaxwatch lvalue
Parameters
Description
This command sets a write watchpoint on the specified expression. When the debuggee writes to the memory location designated by lvalue, it stops.
The debugger does not detect writing if the value of memory is not changed.
Watchpoints are also referred to as data breakpoints.
See Alsoawatch (gdb mode only)rwatch (gdb mode only)watch (idb mode only)
lvalue An expression that designates a memory location.

376
7 Intel® Debugger Command Reference
watch (idb mode only) Set a watchpoint on the specified variable or memory range.
Syntaxwatch memory start-addr [, end-addr| :size] [access] [thread ID {,...}] [within funcname] [if cond] [commands]
watch variable lvalue [access] [thread ID {,...}] [within funcname] [if cond] [commands]
Parameters
Description
This command sets a write watchpoint on the specified variable or memory range. Watchpoints are also referred to as data breakpoints.
If varname is a pointer, watch variable varname watches the content of the pointer, not the memory that varname points to. Use watch memory *varname to watch the memory pointed to by varname.
You can use watchpoints to determine when a variable or memory location is read from, written to, or changed.
lvalue An expression that designates a memory location.
ID A thread ID.
cond A conditional expression.
commands A list of debugger commands.
start-addr The address at the start of the memory region.
end-addr The address at the end of the memory region starting from start-addr.
size The size of the memory region starting from start-addr.
funcname The name of a function.
access Possible values are:• write • read • changed This mode detects writes that change the
contents of the memory.• any This mode detects both read and write.
Default value: write

IDB Command Reference 7
377
You can specify a variable whose memory is to be watched, or specify the memory directly. You can set the accesses that the debugger watches to those that:
• write (the default)
• read
• write and actually change the value
• all accesses
If you specify a variable, the memory to be watched includes all of the memory for that variable, as determined by the variable's type.
If you specify memory directly in terms of its address, the memory to be watched is defined as follows:
• start-addr is the address at the beginning of a memory region. This memory region is 8-bytes in size when you do not specify end-addr or size.
• If you specify size, the memory region starts with start-addr and is size-bytes long.
• If you specify end-addr, the memory region is from start-addr through end-addr, inclusive.
To set a watchpoint such that the debugger breaks when it hits one or more specific threads, specify thread and one or more comma-separated thread IDs.
To set a watchpoint based on a conditional expression, specify if cond.
To run one or more commands upon hitting a watchpoint, specify commands.
If you specify within funcname, program execution breaks only when the access occurs in the specified function.
ExampleThe following example watches for write accesses to the variable _nextNode:
(idb) whatis _nextNode
class Node* Node::_nextNode
(idb) print "sizeof(_nextNode) =", sizeof((_nextNode))
sizeof(_nextNode) = 4
(idb) watch variable _nextNode write
[#3: watch variable _nextNode write]
The following example watches the 4 bytes specified on the command line.
(idb) watch memory &_nextNode, ((long)&_nextNode) + 3 read
[#5: watch memory &_nextNode, ((long)&_nextNode) + 3 read]

378
7 Intel® Debugger Command Reference
The following example watches the 2 bytes specified on the command line for a change in contents.
(idb) watch memory &_nextNode : 2 changed [#6: stop memory &_nextNode : 2 changed]
If you specify the within modifier, then the debugger watches only those accesses that occur within the specified function, but not any function it calls. For example:
(idb) whatis t
int t
(idb) watch variable t write within C::foo(void)
[#3: watch variable t write within void C::foo(void)]
(idb) cont
Select from
----------------------------------------------------
1 int C::foo(double*)
2 void C::foo(float)
3 void C::foo(int)
4 void C::foo(void)
5 None of the above
----------------------------------------------------
5
Value of <overloaded function> not completely specified
foo is not a valid breakpoint address
[3] Address 0x0804d5d0 was accessed at:
void C::foo(void): src/x_overload.cxx
[line 22, 0x08048789] foo+0x3: movl $0x0, 0x804d5d0
0x0804d5d0: Old value = 0x0000000f
0x0804d5d0: New value = 0x00000000
[3] stopped at [void C::foo(void):22 0x08048793]
22 void C::foo() { t = 0; state++; return; }

IDB Command Reference 7
379
whatis Print the type of a variable.
Syntaxwhatis expr
Parameters
Description
This command prints the type of a variable.
You can print information about the basic nature of an expression. The debugger shows you information about the entity rather than evaluating it. However, it will evaluate any contained expressions, such as pointers, needed to determine the entity to which you are referring.
ExampleThe following example uses the whatis command to determine the storage representation for the data member _classification:
(idb) whatis sun->_classification
const enum StellarClass Star::_classification
(idb) whatis StellarClass
enum StellarClass {O, B, A, F, G, K, M, R, N, S}
(idb) print sun->_classification
G
expr The expression whose type you want to print. The expression can be a normal language expression or the name of a type, function, or other language entity.

380
7 Intel® Debugger Command Reference
when (idb mode only) Set a breakpoint that executes a command list when it is hit.
Syntaxwhen [quiet] detector [thread ID,…] [if cond] [commands]
ParametersSee the stop commands.
Description
This command sets a breakpoint that executes a list of commands when it is hit and both thread and if conditions, if specified, evaluate to TRUE.
When the event specified by the breakpoint occurs and all processing for that breakpoint has been completed, the debugger resumes execution of the program.
detector represents the various syntactical variations of the stop commands, such as in, at, and variable.
The difference between stop and when is that a breakpoint created using stop suspends the execution when hit, whereas one created using when does not.
See Alsostop in (idb mode only)stop at (idb mode only)stop pc (idb mode only)stop variable (idb mode only)stop memory (idb mode only)stop signal (idb mode only)stop unaligned (idb mode only)stop every (idb mode only)

IDB Command Reference 7
381
wheni (idb mode only) Set an instruction breakpoint that executes a command list when it is hit.
Syntaxwheni [traced_expression] [thread ID ,...] [at address] [if cond] {commands ;...}
wheni address [thread ID ,...] [if cond] {commands ;...}
Parameters
For all other parameters, see the stopi command.
Description
This command sets an instruction breakpoint that executes a command list when it is hit.
The difference between stopi and wheni is that a breakpoint created using stopi suspends the execution when hit and does not execute any commands, whereas one created using wheni does not suspend execution and does execute commands.
See Alsostopi (idb mode only)
commands A list of debugger commands.

382
7 Intel® Debugger Command Reference
where (idb mode only) Show the current stack trace of currently active functions.
Syntaxwhere [num] [thread { thread_id, ... | all | * } ]
Parameters
Description
This command displays the stack trace of currently active functions.
If you do not specify the thread keyword, the debugger displays the stack trace of currently active functions for the current thread.
If you specify the thread keyword, the debugger displays the stack trace of the specified threads.
To display a specific number of call frames at the top of the stack, specify the num parameter. Each active function is designated by a number, which you can use as an parameter for the func command. If you do not specify the number, the debugger displays all levels.
The top level on the stack is 0.
For example, if you enter the command where 3, the debugger displays levels 0, 1, and 2.
When large and complex values are passed by value to a routine on the stack, the output of the where command can be voluminous. You can set the control variable $stackargs to 0 to suppress the output of argument values in the call stack. Setting $stack_levels to a numeric value limits the number of stacks displayed to the specified value.
See Alsobacktrace (gdb mode only)show thread (idb mode only)
num The number of call frames to show, starting from the beginning of the stack.
thread_id The thread whose call stack should be shown.
all | * Display the full stack trace of all threads. all and * are equivalent.
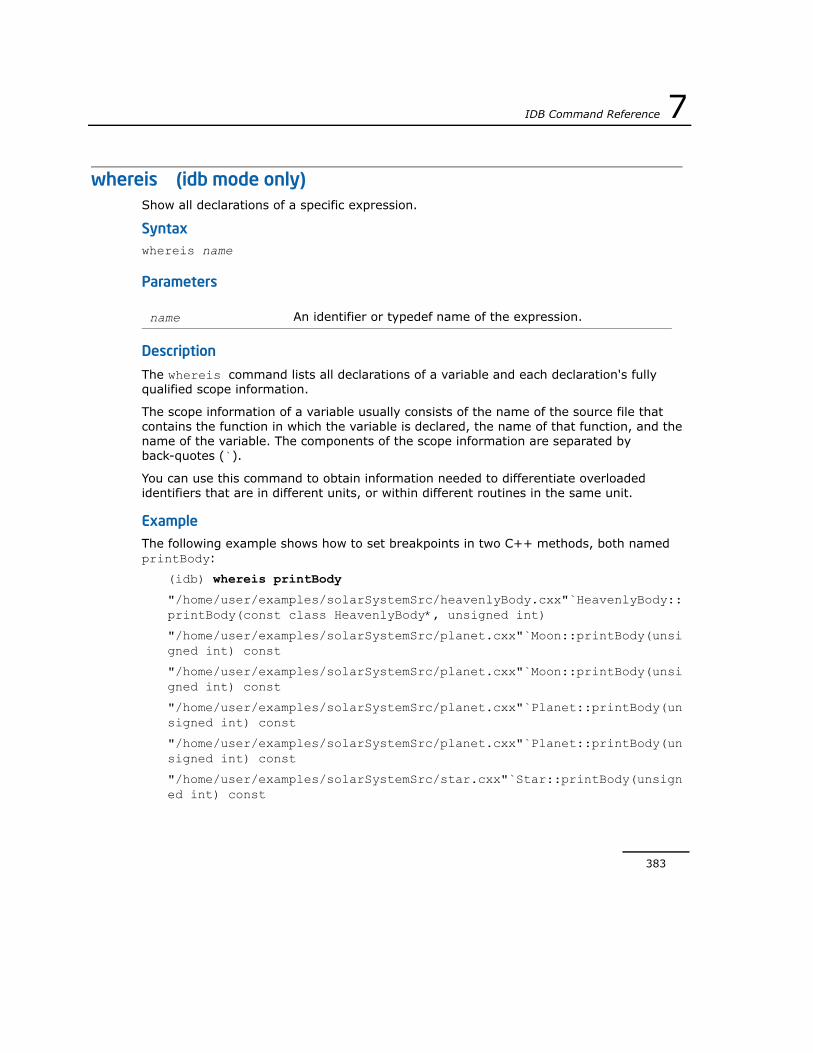
IDB Command Reference 7
383
whereis (idb mode only) Show all declarations of a specific expression.
Syntaxwhereis name
Parameters
Description
The whereis command lists all declarations of a variable and each declaration's fully qualified scope information.
The scope information of a variable usually consists of the name of the source file that contains the function in which the variable is declared, the name of that function, and the name of the variable. The components of the scope information are separated by back-quotes (`).
You can use this command to obtain information needed to differentiate overloaded identifiers that are in different units, or within different routines in the same unit.
ExampleThe following example shows how to set breakpoints in two C++ methods, both named printBody:
(idb) whereis printBody
"/home/user/examples/solarSystemSrc/heavenlyBody.cxx"`HeavenlyBody::printBody(const class HeavenlyBody*, unsigned int)
"/home/user/examples/solarSystemSrc/planet.cxx"`Moon::printBody(unsigned int) const
"/home/user/examples/solarSystemSrc/planet.cxx"`Moon::printBody(unsigned int) const
"/home/user/examples/solarSystemSrc/planet.cxx"`Planet::printBody(unsigned int) const
"/home/user/examples/solarSystemSrc/planet.cxx"`Planet::printBody(unsigned int) const
"/home/user/examples/solarSystemSrc/star.cxx"`Star::printBody(unsigned int) const
name An identifier or typedef name of the expression.

384
7 Intel® Debugger Command Reference
"/home/user/examples/solarSystemSrc/star.cxx"`Star::printBody(unsigned int) const
(idb) stop in "star.h"`Star::printBody
Select from
----------------------------------------------------
1 /home/user/examples/solarSystemSrc/main/solarSystem.cxx
2 /home/user/examples/solarSystemSrc/star.cxx
3 None of the above
----------------------------------------------------
1
[#2: stop in virtual void Star::printBody(unsigned int) const]
See also the which command for another example of the whereis command.
If you are not sure how to spell a symbol, you can use the whereis command to search the symbol table for the regular expression represented by the quoted string. All symbols that match the rules of the regular expression are displayed in ascending order. For example:
(idb) whereis planet
Symbol not found
(idb) whereis "[Pp]lanet"
"solarSystemSrc/derived_class_includes/planet.h"`Moon::Moon(char*, Megameters, Kilometers, class Planet*)
"solarSystemSrc/derived_class_includes/planet.h"`Planet
"solarSystemSrc/derived_class_includes/planet.h"`Planet
"solarSystemSrc/derived_class_includes/planet.h"`Planet
"solarSystemSrc/derived_class_includes/planet.h"`Planet::Planet(char*, Megameters, class HeavenlyBody*)
"solarSystemSrc/derived_class_includes/planet.h"`Planet::Planet(char*, Megameters, class HeavenlyBody*)
"solarSystemSrc/derived_class_includes/planet.h"`Planet::print(unsigned int)
"solarSystemSrc/derived_class_includes/planet.h"`__INTER__Moon_Moon_Orbit_Planet_Xv
"solarSystemSrc/derived_class_includes/planet.h"`__INTER__Planet_Planet_Orbit_Xv
"solarSystemSrc/derived_class_includes/planet.h"`__dt__6PlanetXv

IDB Command Reference 7
385
__T_6Planet
__cxxexsig6Planet
__vtbl_5Orbit6Planet
__vtbl_5Orbit6Planet4Moon
__vtbl_6Planet
solarSystemSrc/derived_class_includes/planet.h
solarSystemSrc/derived_class_includes/planet.h
solarSystemSrc/derived_class_includes/planet.h
solarSystemSrc/planet.cxx
(idb) whereis "^Planet$"
"solarSystemSrc/derived_class_includes/planet.h"`Planet
"solarSystemSrc/derived_class_includes/planet.h"`Planet
"solarSystemSrc/derived_class_includes/planet.h"`Planet
"solarSystemSrc/derived_class_includes/planet.h"`Planet::Planet(char*, Megameters, class HeavenlyBody*)
(idb) whereis Planet
"solarSystemSrc/derived_class_includes/planet.h"`Planet
"solarSystemSrc/derived_class_includes/planet.h"`Planet
"solarSystemSrc/derived_class_includes/planet.h"`Planet
"solarSystemSrc/derived_class_includes/planet.h"`Planet::Planet(char*, Megameters, class HeavenlyBody*)
(idb) which Planet
"solarSystemSrc/derived_class_includes/planet.h"`Planet
(idb) whatis Planet
class Planet : HeavenlyBody, Orbit {
Planet(char*, Megameters, class HeavenlyBody*);
virtual void print(unsigned int);
}
You can use the $symbolsearchlimit debugger variable to specify the maximum number of symbols that will be returned by the whereis command for a regular expression search. The default value for the $symbolsearchlimit variable is 100; a value of 0 indicates no limit.
See Alsowhich (idb mode only)

386
7 Intel® Debugger Command Reference
which (idb mode only) Show the full scope of an expression.
Syntaxwhich name
Parameters
Description
This command shows the full scope of an expression.
Use this command to determine to which declaration an identifier resolves. This command shows the fully qualified scope information for the instance of the specified expression visible from the current scope.
The scope information of a variable usually consists of the name of the source file that contains the function in which the variable is declared, the name of that function, and the name of the variable. The components of the scope information are separated by back-quotes (`).
ExampleThe following example shows how to use the whereis and which commands to determine a variable's scope:
(idb) where 4
>0 0x08053549 in ((Planet*)0x806ae98)->Planet::printBody(i=2) "/home/user/examples/solarSystemSrc/planet.cxx":19
#1 0x0804bacf in ((HeavenlyBody*)0x806ae98)->HeavenlyBody::printBodyAndItsSatellites(i=2) "/home/user/examples/solarSystemSrc/heavenlyBody.cxx":62
#2 0x0804bb0a in ((HeavenlyBody*)0x806ae40)->HeavenlyBody::printBodyAndItsSatellites(i=1) "/home/user/examples/solarSystemSrc/heavenlyBody.cxx":68
#3 0x08056745 in main() "/home/user/examples/solarSystemSrc/main/solarSystem.cxx":120
(idb) which i
"/home/user/examples/solarSystemSrc/planet.cxx"`Planet::printBody(unsigned int) const`i
name An identifier or typedef name of the expression.

IDB Command Reference 7
387
(idb) assign i = 10
(idb) print i
10
(idb) whereis i
"/home/user/examples/solarSystemSrc/heavenlyBody.cxx"`HeavenlyBody::printBodyAndItsSatellites(unsigned int) const`i
"/home/user/examples/solarSystemSrc/heavenlyBody.cxx"`HeavenlyBody::printBodyAndItsSatellites(unsigned int) const`i
"/home/user/examples/solarSystemSrc/heavenlyBody.cxx"`HeavenlyBody::satelliteNumber(class HeavenlyBody*) const`i
"/home/user/examples/solarSystemSrc/main/solarSystem.cxx"`main`i
"/home/user/examples/solarSystemSrc/main/solarSystem.cxx"`printBiggestMoons`i
"/home/user/examples/solarSystemSrc/main/solarSystem.cxx"`trackBiggestMoons(class Moon*)`i
"/home/user/examples/solarSystemSrc/planet.cxx"`Moon::printBody(unsigned int) const`i
"/home/user/examples/solarSystemSrc/planet.cxx"`Planet::printBody(unsigned int) const`i
"/home/user/examples/solarSystemSrc/star.cxx"`Star::printBody(unsigned int) const`i
(idb) func HeavenlyBody::printBodyAndItsSatellites
void HeavenlyBody::printBodyAndItsSatellites(unsigned int) const in /home/user/examples/solarSystemSrc/heavenlyBody.cxx line No. 62:
62 printBody(i); {static int somethingToReturnTo; somethingToReturnTo++; }
(idb) which i
"/home/user/examples/solarSystemSrc/heavenlyBody.cxx"`HeavenlyBody::printBodyAndItsSatellites(unsigned int) const`i
(idb) print i
2

388
7 Intel® Debugger Command Reference
while Execute the command list while the specified expression is not zero.
Syntax
GDB Mode:
while expr
commands
end
IDB Mode:
while expr "{" commands "}"
Parameters
Description
The debugger executes the commands in cmdlist as long as expr evaluates to a non-zero value.
This is different from testing for true or false according to the current language. For example, if the current langauge is Fortran and the expression evaluates to 2, the while continues, because although 2 is .FALSE. in Fortran, 2 is non-zero.
While you can put continue, step or next commands in the while command's body, be aware that doing so may lead to confusion. For example, breakpoints may trigger during a continuation of the application within the body of the while command.
GDB Mode: This command only applies when you are using the debugger in command-line mode. It has no effect when you are using the Console window in the GUI.
ExampleGDB Mode:
(idb) set $loop = 5
expr Conditional expression controlling the while-loop
commands One or more debugger commands or programmatic expressions to be executed.
GDB Mode:
Enter one command per line.
IDB Mode:
Delineate commands with a semicolon (;).

IDB Command Reference 7
389
(idb) while $loop > 0
>output "$loop is "
>output $loop
>echo \n
>set $loop = $loop - 1
>end
$loop is 5
$loop is 4
$loop is 3
$loop is 2
$loop is 1
IDB Mode:
(idb) while $loop > 0 { p $loop; set $loop = $loop - 1}
5
4
3
2
1
(idb)
The following example demonstrates a more complicated use of the while command, including continuing the application within the body of the while:
IDB Mode:
(idb) run
The list is:
[1] stopped at [void List<Node>::print(void) const:167 0x0804af2e]
167 cout << "Node " << i ;
(idb)
(idb) while (currentNode->_data != 5) { print "currentNode->_data is ",
currentNode->_data; cont }
currentNode->_data is 1
Node 1 type is integer, value is 1
[1] stopped at [void List<Node>::print(void) const:167 0x0804af2e]
167 cout << "Node " << i ;

390
7 Intel® Debugger Command Reference
currentNode->_data is 2
Node 2 type is compound, value is 12.345
parent type is integer, value is 2
[1] stopped at [void List<Node>::print(void) const:167 0x0804af2e]
167 cout << "Node " << i ;
currentNode->_data is 7
Node 3 type is compound, value is 3.1415
parent type is integer, value is 7
[1] stopped at [void List<Node>::print(void) const:167 0x0804af2e]
167 cout << "Node " << i ;
currentNode->_data is 3
Node 4 type is integer, value is 3
[1] stopped at [void List<Node>::print(void) const:167 0x0804af2e]
167 cout << "Node " << i ;
currentNode->_data is 4
Node 5 type is integer, value is 4
[1] stopped at [void List<Node>::print(void) const:167 0x0804af2e]
167 cout << "Node " << i ;
(idb)
(idb) print currentNode->_data
5

IDB Command Reference 7
391
x (gdb mode only) Print memory at the specified address.
Syntaxx [/nfu] [addr]
Parameters
Description
This command prints memory.
n The amount of memory to display, in units set by u.
The default value is 1.
f The format in which to display memory. Possible values are:• i instr• s string• x hex• d sdecimal• u udecimal• o octal• t binary• a addr• c char• f float
The default changes each time you use this command or the print command. The initial default value is x. The current default value is whatever you used most recently.
u The units in which to display memory. Possible values are:• b byte• h halfword• w word• g giant (8 bytes)
The default changes each time you use this command. The current default value is whatever you used most recently.
addr The starting address for which you want to print memory. The default is the address following the most recently printed address when using this or the print command.

392
7 Intel® Debugger Command Reference
When you use defaults for n, f, and u, the slash (/) is optional.
Example(idb) x/10i &main
0x080483c4 <main>: pushl %ebp
0x080483c5 <main+1>: movlr %esp, %ebp
0x080483c7 <main+3>: subl $0x3, %esp
0x080483ca <main+6>: andl $-8, %esp
0x080483cd <main+9>: addl $0x4, %esp
0x080483d0 <main+12>: subl $0x14, %esp
0x080483d3 <main+15>: flds 0x8048628
0x080483d9 <main+21>: fstps -20(%ebp)
0x080483dc <main+24>: movl $-1, -16(%ebp)
0x080483e3 <main+31>: movl $0xa, -12(%ebp)
End of assembler dump.
See Alsoprint

393
List of Predefined Debugger Variables 8
The debugger has the following predefined variables. The Intel® Debugger’s convention for variable names is a leading dollar sign ($) followed by an identifier.
Variable Default Setting Description
$aggregatedmsghistory 0 Controls the length of the aggregated message list. If set to the default (0), the debugger records as many messages as the system will allow.
$ascii 1 Displays whether prints are in ASCII format or all ISO Latin-1. See $lc_ctype.
$beep 1 Beeps on illegal command line editing.
$childprocess 0 When the debugger detects a fork, it assigns the child process ID to $childprocess.
$cmdset gdb Sets the current debugger command mode. Possible values are gdb and idb. Enclose the value in quotation marks.
$curcolumn 0 Displays the current column number if that information is available; 0 otherwise.
$curevent 0 Displays the current breakpoint number.

394
8 Intel® Debugger Command Reference
$curfile (null) Displays the current source file name.
$curfilepath (null) Displays the current source file access path.
$curline 0 Displays the current source line.
$curpc 0 Displays the current point of program execution (the program counter).
$curprocess 0 Displays the current process ID.
$cursrcline 0 Displays the last source line at end of most recent source listing.
$cursrcpc 0 Displays the PC address at end of most recent machine code listing.
$curthread 0 Displays the current thread ID.
$dbxoutputformat 0 Displays various data structures in dbx format.
$dbxuse 0 Replaces (0) or appends to (1) current use paths
$decints 0 Displays integers in decimal radix.
$doverbosehelp 1 Displays the help menu front page.
$editline 1 Enables or disables Emacs*-like control characters in the debugger. It is not possible to use vi*-like commands in IDB.
In the GUI console mode, this functionality is disabled by default. In the command-line interface, it is enabled by default.
$eventecho 1 Echoes events with event numbers.
Variable Default Setting Description

List of Predefined Debugger Variables 8
395
$exitonterminationofprocesswithpid
None If set to a process ID, the debugger exits when that process terminates.
$float80bit 1 If set to 0 (the default), prints 128-bit floating point numbers normally;if set to a non-zero value, prints 128-bit floating point numbers as 128-bit containsers holding 80-bit floating point numbers.
$floatshrinking 1 If set to the default (1), the debugger prints binary floating point numbers using the shortest possible decimal number. If set to 0, the debugger prints the decimal number which is the closest representation in the number of decimal digits available of the internal binary number.
$framesearchlimit 0 Defines the maximum number of call frames by which to extend normal language-based identifier lookup.
$funcsig 1 Displays function signature at breakpoint.
$gdb_compatible_output 0 Makes IDB output compatible with GDB output.
$givedebughints 1 Displays hints on debugger features.
$hasmeta 0 Interprets multibyte characters.
$hexints 0 Displays integers in hex radix.
$highpc (internal debugger variable)
Returns the highest address associated with "function".
$historylines 20 Defines the number of commands to show for history.
Variable Default Setting Description

396
8 Intel® Debugger Command Reference
$indent 1 Prints structures with indentation.
$lang "None" Defines the programming language of current routine.
$lasteventmade 0 Displays the number of last (successful) breakpoint definition.
$lc_ctype result of setlocale (LC_CTYPE,0L)
Defines the current locale information.
If set, passes the value through setlocale() and becomes the result.
"" is passed as 0L.
$listwindow 20 Displays the number of lines to show for list.
$main "main" Displays the name of the first routine in the program.
$maxstrlen 128 Defines the length of the largest string (in characters) to printed in full.
$memorymatchall 0 When set to non-zero, displays all memory matches in the specified range. Otherwise, only the first memory match is displayed.
$octints 0 Displays integers in octal radix.
$overloadmenu 1 Prompts for choice of overloaded C++ name.
$page 1 If non-zero, debugger terminal output is paged.
$pagewindow 0 Defines the number of lines per output page. The default of 0 causes the debugger to query the terminal for the page size.
Variable Default Setting Description

List of Predefined Debugger Variables 8
397
$parallel_branchingfactor 8 Specifies the factor used to build the n-nary tree and determine the number of aggregators in the tree.
$parallel_aggregatordelay 3000 milliseconds
Specifies the length of time that aggregators wait before they aggregate and send messages down to the next level when not all the expected messages have been received.
$parentprocess 0 When the debugger detects a fork, it assigns the parent process ID to $parentprocess.
$pimode 0 Echoes input to log file on playback input. Only applicable to IDB mode.
$prompt "(idb) " Specifies debugger prompt.
$readtextfile 0 If set to non-zero, instructions are read from the text area of the binary file rather than from the memory image.
$regstyle 1 Controls the format of register names during disassembly. Valid settings are:
0 compiler names, for example, t0, ra, or zero.
1 hardware names, for example, r1, r26, or r31.
2 assembly names, for example, $1, $26, or $31.
$repeatmode 1 Repeats previous command when you press Enter if 1.
$reportsotrans 0 Report when an event was changed because a shared object library was either opened or closed if 1.
$showlineonstartup 0 Displays the first executable line in main if 1.
Variable Default Setting Description

398
8 Intel® Debugger Command Reference
$showwelcomemsg 1 Displays welcome message at startup time if 1.
$stackargs 1 Shows arguments in the call stack if 1.
$stack_levels 50 Controls the number of call stack output levels.
$statusargs 1 Prints breakpoints with parameters if 1.
$stepg0 0 Controls how a step command behaves when encountering a function with minimal debug information. Possible settings:
0 Steps over routines.
1 Steps into routines.
$stoponattach 0 Stops the running process on attach if 1.
$symbolsearchlimit 100 Specifies the maximum number of symbols that will be returned by the whereis command for a regular expression search. The default value is 100; a value of 0 indicates no limit.
$threadlevel native Specifies native threads.
$usedynamictypes 1 Evaluates using C++ static (if 0) or dynamic (if 1) type.
$verbose 0 Produces even more output if 1.
$catchexecs 0 Stops execution on program exec.
$catchforkinfork 0 Notifies you as soon as the forked process is created (otherwise you are notified when the call finishes).
$catchforks 0 Notifies you on program fork and stops child.
Variable Default Setting Description