Embed Size (px)
Citation preview
Mass
Tran
sfer
P P I • p p i 2 p a s s . c o m
DISTRIBUTE.
Figure 24.8 Feed Lines for Various Feed Qualities
Condensing all of the vapor and returning it to the col-umn and returning all of the bottoms from the reboilerback into the column is the condition of total reflux. Thenumber of stages to achieve the separation is minimumat total reflux. Total reflux requires that there be nofeed stream. With total reflux, L=V, and L/V= 1;L̄f= V̄f, and L̄f/V̄f= 1. The slopes of both the top andthe bottom operating lines are 1.0, which is equivalentto the y= x line on the McCabe-Thiele diagram. Theminimum number of stages is determined by steppingoff stages using the y= x line as the operating line.
Example 24.7
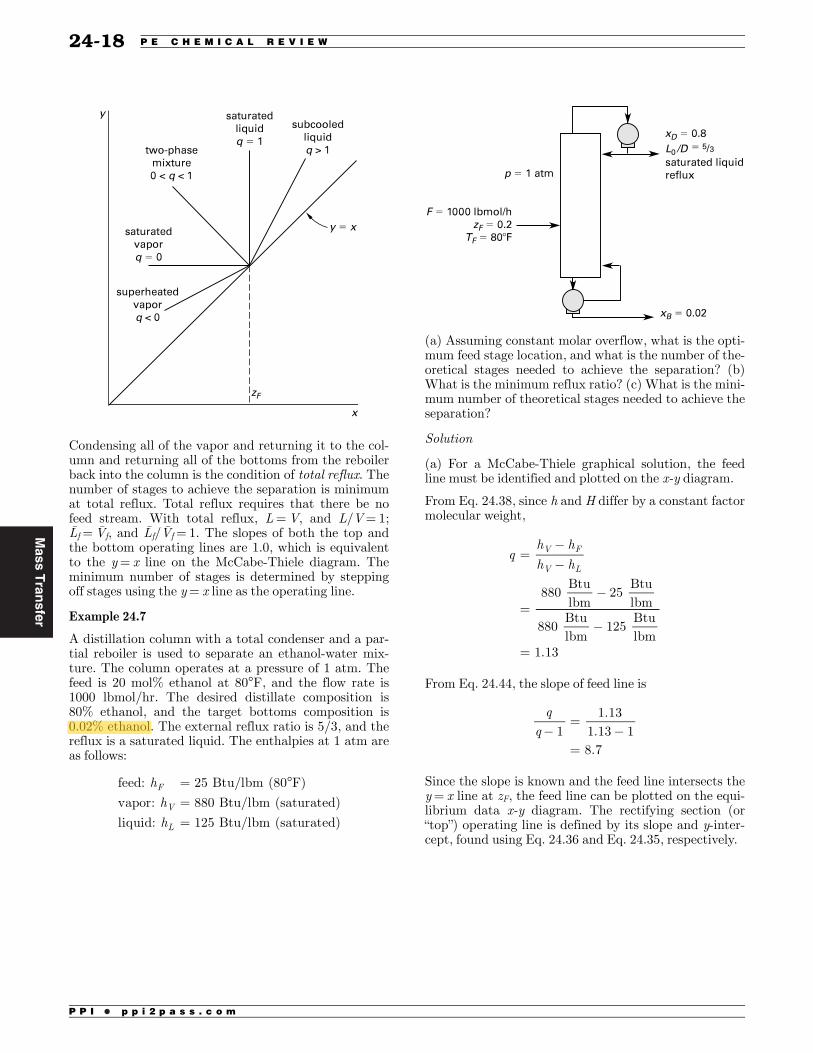
A distillation column with a total condenser and a par-tial reboiler is used to separate an ethanol-water mix-ture. The column operates at a pressure of 1 atm. Thefeed is 20 mol% ethanol at 80°F, and the flow rate is1000 lbmol/hr. The desired distillate composition is80% ethanol, and the target bottoms composition is0.02% ethanol. The external reflux ratio is 5/3, and thereflux is a saturated liquid. The enthalpies at 1 atm areas follows:
= °==
h
h
h
feed:† 25†Btu/lbm†(80 F)
vapor:† 880†Btu/lbm†(saturated)
liquid:† 125†Btu/lbm†(saturated)
F
V
L
(a) Assuming constant molar overflow, what is the opti-mum feed stage location, and what is the number of the-oretical stages needed to achieve the separation? (b)What is the minimum reflux ratio? (c) What is the mini-mum number of theoretical stages needed to achieve theseparation?
Solution
(a) For a McCabe-Thiele graphical solution, the feedline must be identified and plotted on the x-y diagram.
From Eq. 24.38, since h and H differ by a constant factormolecular weight,
=
=
=
qh h
h h
880†Btulbm
25†Btulbm
880†Btulbm
125†Btulbm
1.13
V F
V L
From Eq. 24.44, the slope of feed line is
=
=
q
q 11.13
1.13 18.7
Since the slope is known and the feed line intersects they= x line at zF, the feed line can be plotted on the equi-librium data x-y diagram. The rectifying section (or“top”) operating line is defined by its slope and y-inter-cept, found using Eq. 24.36 and Eq. 24.35, respectively.
24-1824-18 P E C H E M I C A L R E V I E W
PPI COPYRIG
HT
DO NOT D
ISTRIB
UTE
Mass
Tran
sfer
P P I • p p i 2 p a s s . c o m
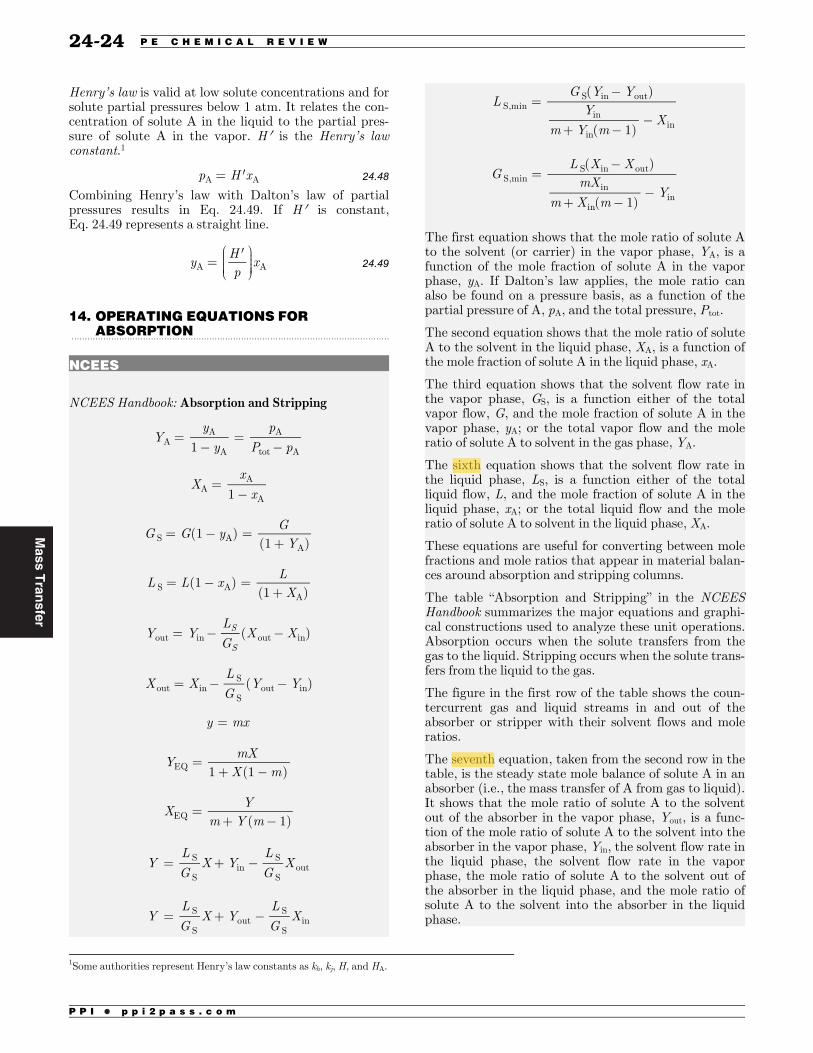
Henry’s law is valid at low solute concentrations and forsolute partial pressures below 1 atm. It relates the con-centration of solute A in the liquid to the partial pres-sure of solute A in the vapor. H ¢ is the Henry’s lawconstant.1
=p H xA A 24.48
Combining Henry’s law with Dalton’s law of partialpressures results in Eq. 24.49. If H ¢ is constant,Eq. 24.49 represents a straight line.
=yHp
xA A 24.49
14. OPERATING EQUATIONS FORABSORPTION........................................................................................................................
NCEES
NCEES Handbook: Absorption and Stripping
= =Yy
y
p
P p1AA
A
A
tot A
=Xx
x1AA
A
= =+
G G yG
Y(1 )
(1 )S AA
= =+
L L xLX
(1 )(1 )S A
A
=Y YL
GX X( )S
Sout in out in
=X XL
GY Y( )out in
S
Sout in
=y mx
=+
YmX
X m1 (1 )EQ
=+
XY
m Y m( 1)EQ
= +YL
GX Y
L
GXS
Sin
S
Sout
= +YL
GX Y
L
GXS
Sout
S
Sin
=
+
LG Y Y
Y
m Y mX
( )
( 1)
S,minS in out
in
inin
=
+
GL X X
mX
m X mY
( )
( 1)
S,minS in out
in
inin
The first equation shows that the mole ratio of solute Ato the solvent (or carrier) in the vapor phase, YA, is afunction of the mole fraction of solute A in the vaporphase, yA. If Dalton’s law applies, the mole ratio canalso be found on a pressure basis, as a function of thepartial pressure of A, pA, and the total pressure, Ptot.
The second equation shows that the mole ratio of soluteA to the solvent in the liquid phase, XA, is a function ofthe mole fraction of solute A in the liquid phase, xA.
The third equation shows that the solvent flow rate inthe vapor phase, GS, is a function either of the totalvapor flow, G, and the mole fraction of solute A in thevapor phase, yA; or the total vapor flow and the moleratio of solute A to solvent in the gas phase, YA.
The sixth equation shows that the solvent flow rate inthe liquid phase, LS, is a function either of the totalliquid flow, L, and the mole fraction of solute A in theliquid phase, xA; or the total liquid flow and the moleratio of solute A to solvent in the liquid phase, XA.
These equations are useful for converting between molefractions and mole ratios that appear in material balan-ces around absorption and stripping columns.
The table “Absorption and Stripping” in the NCEESHandbook summarizes the major equations and graphi-cal constructions used to analyze these unit operations.Absorption occurs when the solute transfers from thegas to the liquid. Stripping occurs when the solute trans-fers from the liquid to the gas.
The figure in the first row of the table shows the coun-tercurrent gas and liquid streams in and out of theabsorber or stripper with their solvent flows and moleratios.
The seventh equation, taken from the second row in thetable, is the steady state mole balance of solute A in anabsorber (i.e., the mass transfer of A from gas to liquid).It shows that the mole ratio of solute A to the solventout of the absorber in the vapor phase, Yout, is a func-tion of the mole ratio of solute A to the solvent into theabsorber in the vapor phase, Yin, the solvent flow rate inthe liquid phase, the solvent flow rate in the vaporphase, the mole ratio of solute A to the solvent out ofthe absorber in the liquid phase, and the mole ratio ofsolute A to the solvent into the absorber in the liquidphase.
24-2424-24 P E C H E M I C A L R E V I E W
1Some authorities represent Henry’s law constants as kh, kj, H, and HA.
FOR C
FOR C
PPI COPYRIG
HT
DO NOT D
ISTRIB
UTE
Mas
sTransfer
P P I • p p i 2 p a s s . c o m
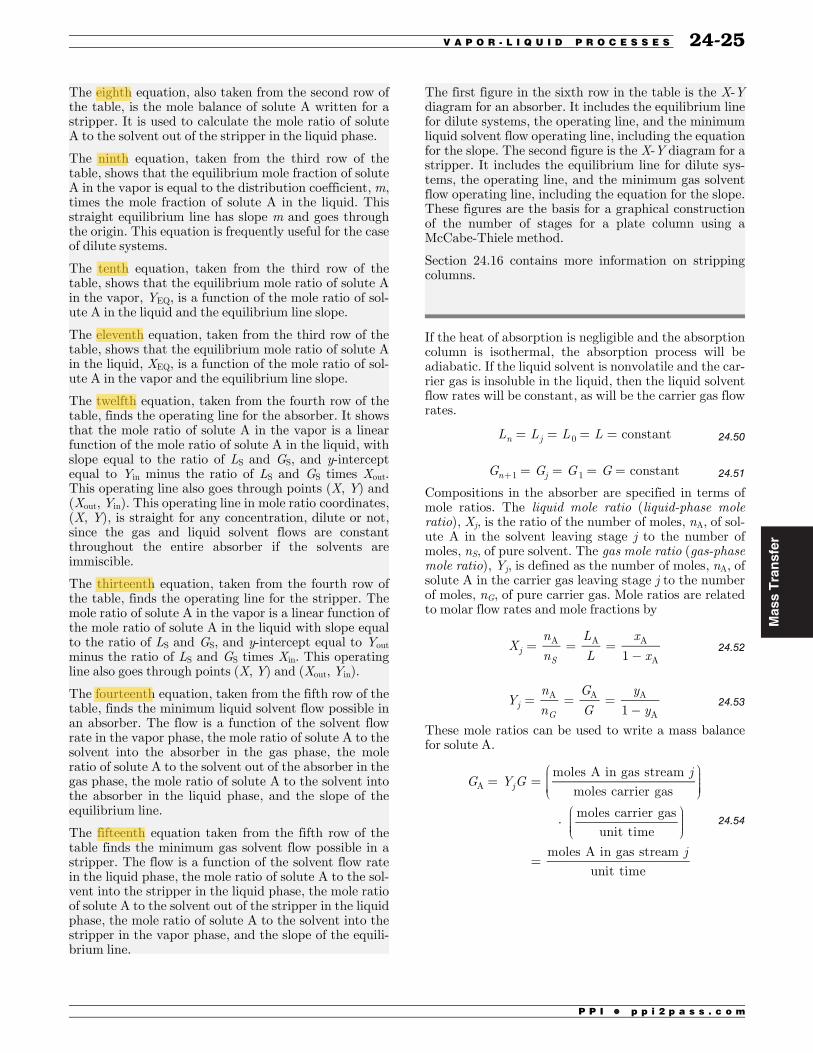
The eighth equation, also taken from the second row ofthe table, is the mole balance of solute A written for astripper. It is used to calculate the mole ratio of soluteA to the solvent out of the stripper in the liquid phase.
The ninth equation, taken from the third row of thetable, shows that the equilibrium mole fraction of soluteA in the vapor is equal to the distribution coefficient, m,times the mole fraction of solute A in the liquid. Thisstraight equilibrium line has slope m and goes throughthe origin. This equation is frequently useful for the caseof dilute systems.
The tenth equation, taken from the third row of thetable, shows that the equilibrium mole ratio of solute Ain the vapor, YEQ, is a function of the mole ratio of sol-ute A in the liquid and the equilibrium line slope.
The eleventh equation, taken from the third row of thetable, shows that the equilibrium mole ratio of solute Ain the liquid, XEQ, is a function of the mole ratio of sol-ute A in the vapor and the equilibrium line slope.
The twelfth equation, taken from the fourth row of thetable, finds the operating line for the absorber. It showsthat the mole ratio of solute A in the vapor is a linearfunction of the mole ratio of solute A in the liquid, withslope equal to the ratio of LS and GS, and y-interceptequal to Yin minus the ratio of LS and GS times Xout.This operating line also goes through points (X, Y) and(Xout, Yin). This operating line in mole ratio coordinates,(X, Y), is straight for any concentration, dilute or not,since the gas and liquid solvent flows are constantthroughout the entire absorber if the solvents areimmiscible.
The thirteenth equation, taken from the fourth row ofthe table, finds the operating line for the stripper. Themole ratio of solute A in the vapor is a linear function ofthe mole ratio of solute A in the liquid with slope equalto the ratio of LS and GS, and y-intercept equal to Youtminus the ratio of LS and GS times Xin. This operatingline also goes through points (X, Y) and (Xout, Yin).
The fourteenth equation, taken from the fifth row of thetable, finds the minimum liquid solvent flow possible inan absorber. The flow is a function of the solvent flowrate in the vapor phase, the mole ratio of solute A to thesolvent into the absorber in the gas phase, the moleratio of solute A to the solvent out of the absorber in thegas phase, the mole ratio of solute A to the solvent intothe absorber in the liquid phase, and the slope of theequilibrium line.
The fifteenth equation taken from the fifth row of thetable finds the minimum gas solvent flow possible in astripper. The flow is a function of the solvent flow ratein the liquid phase, the mole ratio of solute A to the sol-vent into the stripper in the liquid phase, the mole ratioof solute A to the solvent out of the stripper in the liquidphase, the mole ratio of solute A to the solvent into thestripper in the vapor phase, and the slope of the equili-brium line.
The first figure in the sixth row in the table is the X-Ydiagram for an absorber. It includes the equilibrium linefor dilute systems, the operating line, and the minimumliquid solvent flow operating line, including the equationfor the slope. The second figure is the X-Y diagram for astripper. It includes the equilibrium line for dilute sys-tems, the operating line, and the minimum gas solventflow operating line, including the equation for the slope.These figures are the basis for a graphical constructionof the number of stages for a plate column using aMcCabe-Thiele method.
Section 24.16 contains more information on strippingcolumns.
If the heat of absorption is negligible and the absorptioncolumn is isothermal, the absorption process will beadiabatic. If the liquid solvent is nonvolatile and the car-rier gas is insoluble in the liquid, then the liquid solventflow rates will be constant, as will be the carrier gas flowrates.
= = = =L L L L constantn j 0 24.50
= = = =+G G G G constantn j1 1 24.51
Compositions in the absorber are specified in terms ofmole ratios. The liquid mole ratio (liquid-phase moleratio), Xj, is the ratio of the number of moles, nA, of sol-ute A in the solvent leaving stage j to the number ofmoles, nS, of pure solvent. The gas mole ratio (gas-phasemole ratio), Yj, is defined as the number of moles, nA, ofsolute A in the carrier gas leaving stage j to the numberof moles, nG, of pure carrier gas. Mole ratios are relatedto molar flow rates and mole fractions by
= = =Xn
n
L
L
x
x1jS
A A A
A24.52
= = =Yn
n
G
G
y
y1jG
A A A
A24.53
These mole ratios can be used to write a mass balancefor solute A.
= =
×
=
G Y Gj
j
moles†A†in†gas†stream†
moles†carrier†gas
moles†carrier†gas
unit†time
moles†A†in†gas†stream†
unit†time
jA
24.54
24-25V A P O R - L I Q U I D P R O C E S S E S 24-25
PPI COPYRIG
HT
DO NOT D
ISTRIB
UTE
Mass
Tran
sfer
P P I • p p i 2 p a s s . c o m
With a straight operating line and a dilute solution(where Henry’s law applies), the number of theoreticalplates, Np, for a packed tower is the same as for a stagedtower.
=
+
N
H GpL
yH x
p
yHp
H GpL
pL
H G
ln†
1
lnp
12
2 24.87
The height of an equivalent theoretical plate (HETP) is acommon efficiency rating given to tower packings. Usingthe HETP concept allows distillation design methods tobe used with packed towers. Regardless of whether themass transfer limitation is in the liquid, the gas, or bothphases, the height of packing is the product of Np, thenumber of theoretical plates, and HETP, the height ofan equivalent theoretical plate.
=h N HETPp 24.88
The relationship between the number of gas-phasetransfer units and the number of theoretical plates is
= =N N
H GpL
H GpL
N A
A
†
ln
1†
ln1
11
p pOG 24.89
25. PRESSURE DROP, COLUMN DIAMETER,AND PACKING........................................................................................................................
NCEES
NCEES Handbook: Flooding and Pressure Drop
=DG
G4 A
The table “Packing Factors” in the NCEES Handbookgives the packing factor, F, for various packing types,materials, and nominal packing sizes. These packing fac-tors are used to estimate pressure drop, as in NCEESHandbook: Flooding and Pressure Drop.
The figure “Packing Factors: Stacked Packings & Grids”in the NCEES Handbook graphs packing factors forstacked packing and grids vs. nominal packing size.
The figure “Packing Factors: Screen Packing & RandomDumped Packing” in the NCEES Handbook graphspacking factors for screen and random dump packing vs.nominal packing size.
The figure “Generalized Pressure Drop Correlation” in theNCEES Handbook is a generalized correlation for floodingand pressure drop in packed columns. The curves dependon the pressure drop per foot of height,Dp.
The equation shown finds the column diameter, D. Thecolumn diameter is a function of the actual gas massflow rate, GA, and the gas mass velocity, G.
The figure “Pressure Drop Versus Gas Rate” in theNCEES Handbook is a series of graphs of the pressuredrop per foot of packing height for various correlations.The first graph is a graph of pressure drop as a functionof the mass velocity of air, G, and the mass velocity ofliquid, L, each for a given packing type and nominalsize. The height of the column and the packing heightare also noted.
The figure “Flooding in Gas Absorption Packed Towers”in the NCEES Handbook is a graph of generalized corre-lation for flooding in packed columns. The abscissa is afunction of the liquid mass velocity, L, the gas massvelocity, G, the gas density, rG, and the liquid density,rL. The ordinate is a function of the gas mass velocity,the specific area, ap, the void fraction, ϵ, the liquid vis-cosity, mL, the gravitational constant conversion factor,gc, the gas density, rG, and the liquid density, rL.
Section 6.2 has further information regarding floodingin packed beds.
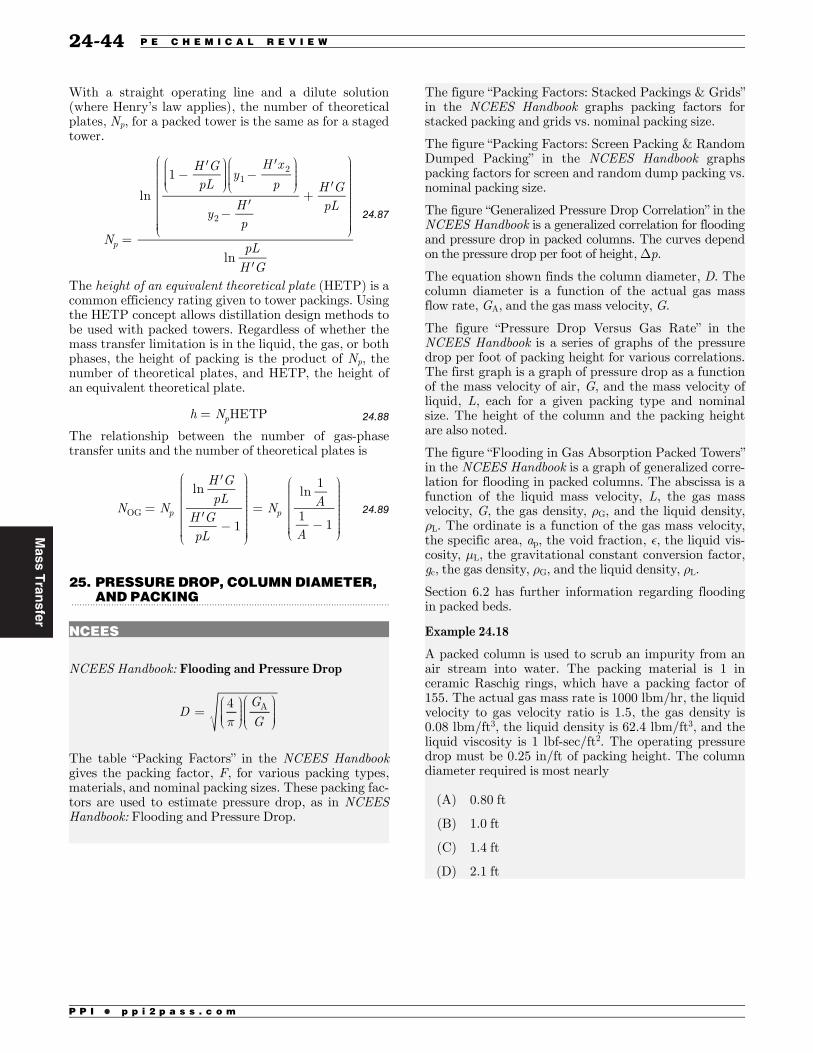
Example 24.18
A packed column is used to scrub an impurity from anair stream into water. The packing material is 1 inceramic Raschig rings, which have a packing factor of155. The actual gas mass rate is 1000 lbm/hr, the liquidvelocity to gas velocity ratio is 1.5, the gas density is0.08 lbm/ft3, the liquid density is 62.4 lbm/ft3, and theliquid viscosity is 1 lbf-sec/ft2. The operating pressuredrop must be 0.25 in/ft of packing height. The columndiameter required is most nearly
(A) 0.80 ft
(B) 1.0 ft
(C) 1.4 ft
(D) 2.1 ft
24-4424-44 P E C H E M I C A L R E V I E W
PPI COPYRIG
HT
DO NOT D
ISTRIB
UTE
Mas
sTransfer
P P I • p p i 2 p a s s . c o m
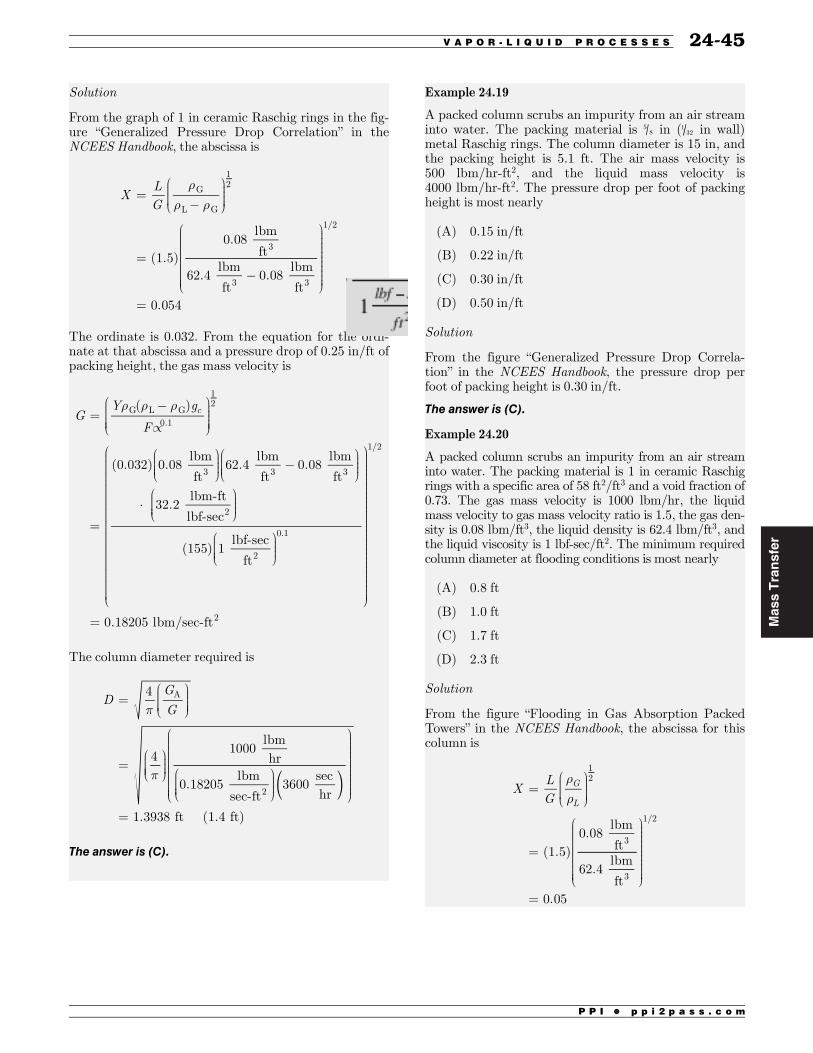
Solution
From the graph of 1 in ceramic Raschig rings in the fig-ure “Generalized Pressure Drop Correlation” in theNCEES Handbook, the abscissa is
=
=
=
XLG
(1.5)0.08†
lbm
ft
62.4†lbm
ft0.08†
lbm
ft0.054
G
L G
12
3
3 3
1/2
The ordinate is 0.032. From the equation for the ordi-nate at that abscissa and a pressure drop of 0.25 in/ft ofpacking height, the gas mass velocity is
µ=
=
×
=
GY g
F
( )
(0.032) 0.08†lbm
ft62.4†
lbm
ft0.08†
lbm
ft
32.2†lbm-ft
lbf-sec
(155) 1†lbf-sec
ft
0.18205†lbm/sec-ft
cG L G0.1
12
3 3 3
2
2
0.1
1/2
2
The column diameter required is
=
=
=
( )
DG
G4
41000†
lbmhr
0.18205†lbm
sec-ft3600†
sechr
1.3938†ft††††(1.4†ft)
A
2
The answer is (C).
Example 24.19
A packed column scrubs an impurity from an air streaminto water. The packing material is 5
8 in (1 32 in wall)metal Raschig rings. The column diameter is 15 in, andthe packing height is 5.1 ft. The air mass velocity is500 lbm/hr-ft2, and the liquid mass velocity is4000 lbm/hr-ft2. The pressure drop per foot of packingheight is most nearly
(A) 0.15 in/ft
(B) 0.22 in/ft
(C) 0.30 in/ft
(D) 0.50 in/ft
Solution
From the figure “Generalized Pressure Drop Correla-tion” in the NCEES Handbook, the pressure drop perfoot of packing height is 0.30 in/ft.
The answer is (C).
Example 24.20
A packed column scrubs an impurity from an air streaminto water. The packing material is 1 in ceramic Raschigrings with a specific area of 58 ft2/ft3 and a void fraction of0.73. The gas mass velocity is 1000 lbm/hr, the liquidmass velocity to gas mass velocity ratio is 1.5, the gas den-sity is 0.08 lbm/ft3, the liquid density is 62.4 lbm/ft3, andthe liquid viscosity is 1 lbf-sec/ft2. The minimum requiredcolumn diameter at flooding conditions is most nearly
(A) 0.8 ft
(B) 1.0 ft
(C) 1.7 ft
(D) 2.3 ft
Solution
From the figure “Flooding in Gas Absorption PackedTowers” in the NCEES Handbook, the abscissa for thiscolumn is
=
=
=
XLG
(1.5)0.08†
lbm
ft
62.4†lbm
ft0.05
G
L
12
3
3
1/2
24-45V A P O R - L I Q U I D P R O C E S S E S 24-45
PPI COPYRIG
HT
DO NOT D
ISTRIB
UTE
Mass
Tran
sfer
P P I • p p i 2 p a s s . c o m
From the equation for the ordinate for flooding, the gasmass velocity at that abscissa is
µ
µ
= =
=
=
=
Y
Ga
g
GYga
†( )
0.12
†( )
(0.12) 32.2†lbm-ft
lbf-sec0.08†
lbm
ft62.4†
lbm
ft
58†ft
ft(0.73)
1†lbf-sec
ft
0.36†lbm/sec-ft
p
c
c
23 L
0.2
G L
G L
p
3 L0.2
12
2 3 3
2
3
3 2
0.2
1/2
2
The minimum required column diameter at floodingconditions is
=
=
=
( )
DG
G4
41000†
lbmhr
0.129†lbm
sec-ft3600†
sechr
0.99†ft††††(1.0†ft)
A
2
The answer is (B).
The combination of liquid-to-gas flow rates, packingchoice, and column diameter determines the pressureloss (drop) in the column. For a packed column to oper-ate effectively, the pressure loss must be within someacceptable range, typically 0.25 to 1.5 in water/ft(i.e., inches of water per foot of packing height; 200 to1200 Pa/m) for columns operating at 1 atm or above.
At pressure drop increases above approximately 1.5 inwater/ft packing (1200 Pa/m), flooding becomes problem-atic. Flooding is characterized by a sudden large increasein pressure drop through the column, caused by liquidbuildup in the tower. Alternatively, pressure drops below0.25 in water/ft packing (200 Pa/m) are symptomatic ofpoor liquid-gas contact and the existence of dry areas inthe column. A design pressure drop of approximately0.4 in water/ft packing (320 Pa/m) is recommended for
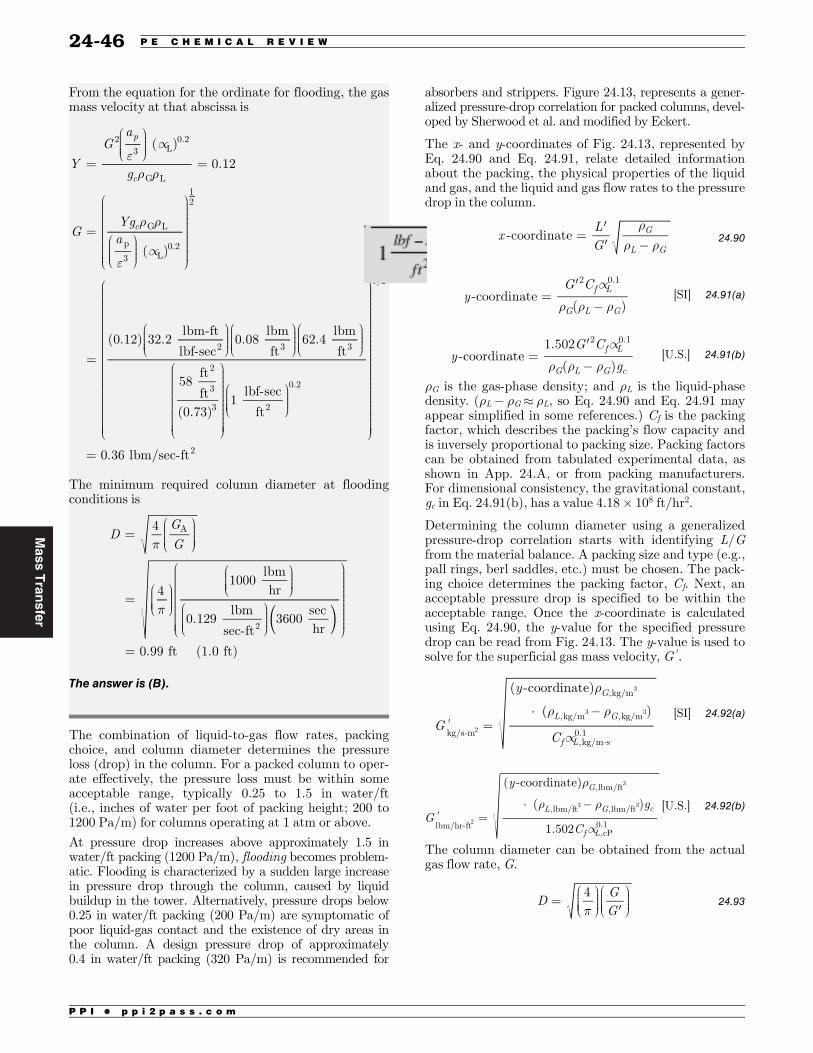
absorbers and strippers. Figure 24.13, represents a gener-alized pressure-drop correlation for packed columns, devel-oped by Sherwood et al. and modified by Eckert.
The x- and y-coordinates of Fig. 24.13, represented byEq. 24.90 and Eq. 24.91, relate detailed informationabout the packing, the physical properties of the liquidand gas, and the liquid and gas flow rates to the pressuredrop in the column.
=xLG
-coordinate G
L G24.90
µ=y
G C-coordinate
( )f L
G L G
2 0.1
[SI] 24.91(a)
µ=y
G C
g-coordinate
1.502
( )f L
G L G c
2 0.1
[U.S.] 24.91(b)
rG is the gas-phase density; and rL is the liquid-phasedensity. (rL- rG» rL, so Eq. 24.90 and Eq. 24.91 mayappear simplified in some references.) Cf is the packingfactor, which describes the packing’s flow capacity andis inversely proportional to packing size. Packing factorscan be obtained from tabulated experimental data, asshown in App. 24.A, or from packing manufacturers.For dimensional consistency, the gravitational constant,gc in Eq. 24.91(b), has a value 4.18 × 108 ft/hr2.
Determining the column diameter using a generalizedpressure-drop correlation starts with identifying L/Gfrom the material balance. A packing size and type (e.g.,pall rings, berl saddles, etc.) must be chosen. The pack-ing choice determines the packing factor, Cf. Next, anacceptable pressure drop is specified to be within theacceptable range. Once the x-coordinate is calculatedusing Eq. 24.90, the y-value for the specified pressuredrop can be read from Fig. 24.13. The y-value is used tosolve for the superficial gas mass velocity, G ¢.
µ=
×G
y
C
( -coordinate)
( )
G
L G
f Lkg/s m
,kg/m
,kg/m ,kg/m
,kg/m s0.12
3
3 3 [SI] 24.92(a)
µ=
×G
y
g
C
( -coordinate)
( )
1.502
G
L G c
f Llbm/hr-ft
,lbm/ft
,lbm/ft ,lbm/ft
,cP0.12
3
3 3 [U.S.] 24.92(b)
The column diameter can be obtained from the actualgas flow rate, G.
=DGG
424.93
24-4624-46 P E C H E M I C A L R E V I E W
PPI COPYRIG
HT
DO NOT D
ISTRIB
UTE
Mass
Tran
sfer
P P I • p p i 2 p a s s . c o m
Example 24.25
A distillation column has a reflux ratio of 2.8, four the-oretical stages in the rectifying section, and an averagerectifying section equilibrium curve slope of 0.75. TheMurphree tray efficiency is 64%. The number of actualstages in the rectifying section is most nearly
(A) 4
(B) 5
(C) 6
(D) 7
Solution
The slope of the rectifying section operating line is
=+
=+
=VL
RR 1
2.82.8 1
0.73684
The ratio of the slope of the equilibrium curve to therectifying section operating line is
= = =mVL
(0.75)(0.73684) 0.55263
The overall column efficiency in the rectifying section is
=+
=+
=
( )
EEln[1 ( 1)]
ln
ln 1 (0.64)(0.55623 1)
ln 0.556230.5696
OCMV
From the equation for the overall column efficiency as afunction of the number of stages, the number of actualstages in the rectifying section is
=
=
=
=
EN
N
NN
E
40.56967.02 (7†stages)
OCt
a
at
OC
The answer is (D).
32. TRAY HYDRAULIC MODELING........................................................................................................................
NCEES
The figure “The Hydraulic Model for Trays” in theNCEES Handbook shows a crossflow tray with its bub-bling area and downcomers. Liquid from the tray abovegoes through the inflow downcomer and flows throughthe bottom clearance and across the perforated bub-bling area, generating froth. The liquid then flows overthe outflow downcomer weir and into the outflow down-comer to the tray below. The perforated area could con-sist of sieve trays, valve trays, or bubble caps, amongother options.
The table “Tray Area Definitions” in the NCEES Hand-book defines the tray areas, some of which are shown inthe figure “The Hydraulic Model for Trays.”
33. VAPOR AND LIQUID LOAD........................................................................................................................
NCEES
NCEES Handbook: Definitions of Vapor Load
=V CFSloadG
L G
=F u G
=C u G
L G
= =CV
A
Fload
L G
NCEES Handbook: Definitions of Liquid Load
=QL
gpm
WL
=QA
gpmD
DT
The first equation shows that the vapor load, Vload, isa function of the vapor flow rate at conditions in vol-ume/time, CFS, the liquid density, rL, and the vapordensity, rG.
The second equation defines the F-factor for gas loading, F.The factor is equal to the superficial linear vapor velocity,u, times the square root of the gas density.
24-5224-52 P E C H E M I C A L R E V I E W
PPI COPYRIG
HT
DO NOT D
ISTRIB
UTE
Mas
sTransfer
P P I • p p i 2 p a s s . c o m
The third equation defines the C-factor for gas loading,C. The factor is a function of the superficial linear gasvelocity, the liquid density, and the gas density.
The fourth equation relates the C-factor for gas loading,the vapor load, the area for vapor flow, A, the C-factorfor gas loading, the F-factor for gas loading, the liquiddensity, and the gas density.
The fifth equation defines the tray liquid load, QL, asthe liquid volumetric flow rate, gpm, over the outletweir length, LW.
The sixth equation defines the downcomer liquid load,QD. The load is the liquid volumetric flow rate, gpm,divided by the area at the top of the downcomer, ADT.
Example 24.26
The vapor flow in a trayed column has a gas density of0.08 lbm/ft3, and a liquid density of 50 lbm/ft3. The C-fac-tor for gas loading in the column is 0.20 ft/sec. The super-ficial linear gas velocity in the column is most nearly
(A) 1.3 ft/sec
(B) 2.0 ft/sec
(C) 3.2 ft/sec
(D) 5.0 ft/sec
Solution
From the equation for the C-factor for gas loading, solv-ing for the superficial linear gas velocity,
=
=
=
=
C u
u C
0.20†ft
sec
50†lbm
ft0.08†
lbm
ft
0.08†lbm
ft4.9960†ft/sec (5.0†ft/sec)
G
L G
L G
G
3 3
3
The answer is (D).
Example 24.27The liquid flow in a trayed column is 120 gal/min. Eachtray has an outlet weir length of 5 ft, and the tray areaat the top of each downcomer 6.5 ft2. The tray liquidload and downcomer liquid load are most nearly
(A) 2.0 gpm/in, 2.3 ft/sec
(B) 2.0 gpm/in, 0.30 ft/sec
(C) 24 gpm/in, 0.30 ft/sec
(D) 24 gpm/in, 2.3 ft/sec
Solution
The tray liquid load is
=
=
=
( )
QL
gpm
120†gal
min
(5†ft) 12†inft
2.0†gal/min-in (2.0†gpm/in)
WL
The downcomer liquid load expressed in ft/sec is
=
=
=
( )
QA
gpm
120†gal
min7.4805†
ftgal
(6.5†ft ) 60†secmin
2.3017†ft/sec (2.3†ft/sec)
DDT
3
2
The answer is (A).
34. FLOW REGIMES........................................................................................................................
NCEES
The figure “Flow Regimes” in the NCEES Handbookshows the flow regimes on a tray as a function of thevapor load (the C-factor) and the liquid flow rate perweir length (the tray liquid load). The main flowregimes are the froth regime, the most common operat-ing regime, where the holes are forming bubbles and theflow is well mixed; the emulsion regime, where the gas isemulsified in the liquid; the spray regime, where theliquid forms droplets of various sizes; and the floodingregime, where too much liquid accumulates in the col-umn, which can occur if the liquid load becomes toohigh.
The figure “Tray Performance Diagram” in the NCEESHandbook is a sieve tray stability diagram. It is a plot ofvapor flow rate, V, vs. liquid flow rate, L. A sieve trayshould operate in the shaded area of satisfactory opera-tion. The upper part of the area is the flooding limit athigh vapor or liquid rates. The lower part of the area isthe excessive weeping conditions at low vapor rates.
24-53V A P O R - L I Q U I D P R O C E S S E S 24-53
PPI COPYRIG
HT
DO NOT D
ISTRIB
UTE
Mas
sTransfer
P P I • p p i 2 p a s s . c o m
The table “Criteria for Downcomer Aeration Factors” inthe NCEES Handbook lists various values of relativefroth density as a function of foaming tendency, withexamples.
NCEES Handbook: Downcomer Choke Flooding pro-vides equations, tables, and figures related to down-comer choke flooding. The seventh, eighth, and ninthequations are the Glitsch correlations for downcomerchoke flooding. The maximum downcomer clear liquidvelocity, QD,max, at the downcomer entrance that willstill avoid downcomer choke flooding is the lowest valuefound from these three equations. QD,max is a function ofthe liquid density, the gas density, the tray spacing, andthe system factor (derating factor), SF.
The tenth equation shows that the maximum down-comer clear liquid velocity at the downcomer entrancethat will avoid downcomer choke flooding is a functionof the tray spacing, the downcomer residence time, tR,and the system factor. For this equation to apply, thetray spacing must be less than 30 in (0.762 m).
The figure “Koch and Nutter Correlations” in theNCEES Handbook shows the downcomer residence timeis a function of the difference between the liquid densityand the gas density using either the Koch or the Nuttercorrelation curves.
The table “Maximum Downcomer Velocities” in theNCEES Handbook shows the generalized criteria formaximum downcomer velocity, with examples. For agiven foaming tendency, it shows the maximum clearliquid velocity in the downcomer for three different trayspacings.
The table “Recommended Minimum Residence Time inthe Downcomer” in the NCEES Handbook shows the rec-ommended minimum residence time in the downcomeras a function of the foaming tendency, with examples.The liquid should have enough residence time in thedowncomer that the liquid is vapor-free when it entersthe tray below, otherwise downcomer choke floodingmay result.
The table “Capacity Discount Factors for Foaming Sys-tems” in the NCEES Handbook shows the capacity dis-count factors, or system factors, for foaming systems,with examples. The higher the foaming system ten-dency, the lower the factor.
Example 24.28
The gas in a trayed column has a density of 0.08 lbm/ft3,and the liquid has a density of 50 lbm/ft3 and a surface ten-sion of 17 lbf/ft. The Souders and Brown constant at theentrainment flood point is 0.20 ft/sec. The superficial lineargas velocity is most nearly
(A) 1.3 ft/sec
(B) 2.0 ft/sec
(C) 3.2 ft/sec
(D) 4.8 ft/sec
Solution
From the equation for the Souders and Brown constant,rearranging to solve for the superficial gas velocity,
=
=
=
=
( )
C u
u C
20
20
0.20†ft
sec
50†lbm
ft0.08†
lbm
ft
0.08†lbm
ft
17†lbfft
20†lbfft
4.8362†ft/sec (4.8†ft/sec)
SB,flood N,flood
0.2G
L G
0.5
N,flood SB,floodL G
G
0.5 0.2
3 3
3
0.5 0.2
The answer is (D).
Example 24.29
A sieve tray column with a 36 in tray spacing has a gas den-sity of 0.08 lbm/ft3 and a liquid density of 50 lbm/ft3. Theexternal reflux ratio is 2.0. The Souders and Brown con-stant at the entrainment flood point is most nearly
(A) 0.35 ft/sec
(B) 0.40 ft/sec
(C) 0.45 ft/sec
(D) 0.50 ft/sec
Solution
From the Fair’s entrainment flooding correlation,
= =+
=+
=
FLG
RR 1
2.02.0 1
0.08†lbm
ft
50†lbm
ft0.027
lvG
L
0.5G
L
0.5
3
3
1/2
For this value of the factor and a 36 in plate spacing, theSouders and Brown constant at the entrainment floodpoint plot ordinate is 0.50 ft/sec.
The answer is (D).
Example 24.30
The gas in a trayed column has a density of 0.08 lbm/ft3,and the liquid has a density of 50 lbm/ft3. The tray spacingis 18 in and the system factor is 0.8. The maximum clearliquid velocity at the downcomer entrance to avoid down-comer choke flooding is most nearly
24-55V A P O R - L I Q U I D P R O C E S S E S 24-55
PPI COPYRIG
HT
DO NOT D
ISTRIB
UTE