Embed Size (px)
Citation preview
Active and Passive Elec. Comp., 1988, Vol. 13, pp. 113-132Reprints available directly from the publisherPhotocopying permitted by license only() 1988 Gordon and Breach, Science Publishers, Inc.Printed in Great Britain
DISTORTION ANALYSIS OF ACTIVEFILTERS
UMESH KUMAR and SUSHIL KUMAR SHUKLADepartment ofElectrical Engineering, Indian Institute of Technology,
Haus Khas, New Delhi-llO016, India
Centrefor Development of Telematics, Akbar Bhawan,Chanakayapuri, New Delhi-llO021, India
(Received January 8, 1987, infinalform November 13, 1987)
Second order active filters using single and two operational amplifiers at high frequenciesand/or large-signal levels are investigated for their nonlinear performance. A generalprocedure using the Volterra series in presented regarding intermodulation distortion.Computer results by implementation in a program "Distortion Analysis" demonstratethe accuracy of the analysis technique.
INTRODUCTION
Analysis of the distortion of a filter is very important to improving itsperformance. In this paper a software package has been developedthat measures the distortion at various desired frequencies of anactive filter in tabular and are graphical form upon inputting para-meters of this filter.
The analysis procedure used in this paper is based upon theVolterra series, described in section 2. If an operational amplifier isoverdriven by a large input and/or high frequencies, the output slewsat some limiting rate called slew rate. The nonlinear effect gives riseto distortion.- The study of this distortion and a model of an opera-tional amplifiex using the distortion generator approach are dis-cussed in section 3. Section 4 describes this procedure. Softwareimplementation of this procedure has been dealt in section 5. Finallysome conclusions have been drawn in section 6.
VOLTERRA SERIES REPRESENTATION
The Volterra series is a generalization of the convolution integralused to describe linear systems and is ideal for representing small
113

114 UMESH KUMAR AND SUSHIL KUMAR SHUKLA
non-linearities (3). If a non-linear system is time invariant, therelation between its input X(t) and output y(t) according to thisrepresentation is:
Y(t) f hl(T1)X(t rl)dT
+ f f h2(Tl, T2)x(t- T1)x(t- T2)dTldT2
hn(T1, T2, Tn)x(t T1)x(t- T2)
x(t Tn)dYl dT2 dT + (1)
For n 1, 2, hn(T1, T2, Tn) 0 for any Tj < 0, 1,2, n hn(Tx, T2, Tn) is called nth order "Volterra Kernel".
The relation (1) can be written in compact from as:
y(t)- f f hn(T1, T2... Tn) H x(t- Tk)dtk (2)n=l k=l
The nth fold transform of the nth order Volterra Kernel is definedby:
K(Sl, s2, Sn): f f hn(T1, T2 Tn) exp[-(sa, T1
+ s2T2 + + snTn)] dTIDT2 dTn(3)
Where K(s, S2, Sn) may be thought as the nth order transferfunction. The physical interpretation can be given as follows. Whenn sinusodial signals of complex frequencies s, s2, s, of unitamplitude are applied to the filter, K(Sl, s2, s,) gives themagnitude of the nth order product signals at frequency (Sl, s2,
s.).Substituting expression (3) into eq. (2) and taking the Laplace
transform we obtain:

DISTORTION ANALYSIS OF ACTIVE FILTERS
FIGURE Volterra system representation
115
k
Y(s1, $2, Sn) K(s1, s2, Sk) 1-[ x(sj)k=l j-I
(4)
Here kernels up to nth order have been utilized to represent thesystem.
Thus, the Volterra model for non-linear systems could berepresented by the model shown in Figure 1, where the non-linearsystem is decomposed to a linear system and a finite number ofhomogeneous non-linear subsystems are completely characterizedby their nonlinear transfer functions.
DISTORTION MODEL OF OPERATIONAL AMPLIFIER
Slew rate, which is the time rate of change of the closed loopamplifier output voltage under large signal conditions, can causeserious degradation of the filter frequency response sometimes lead-ing to instability-(4). In this section slew-induced distortion is studiedand a distortion model of an operational amplifiex presented.
The first order model of an operational amplifier is given inFigure 2a. The instantaneous differential input voltage vi(t) is usedto control a current source, with the current of this voltage-controlled current source given by the function f[vi(t)]. As shown in

116 UMESH KUMAR AND SUSHIL KUMAR SHUKLA
g-a’n,amplifierl
[vi(tl]L _1
FIGURE 2(a) First-order model of an op amp.
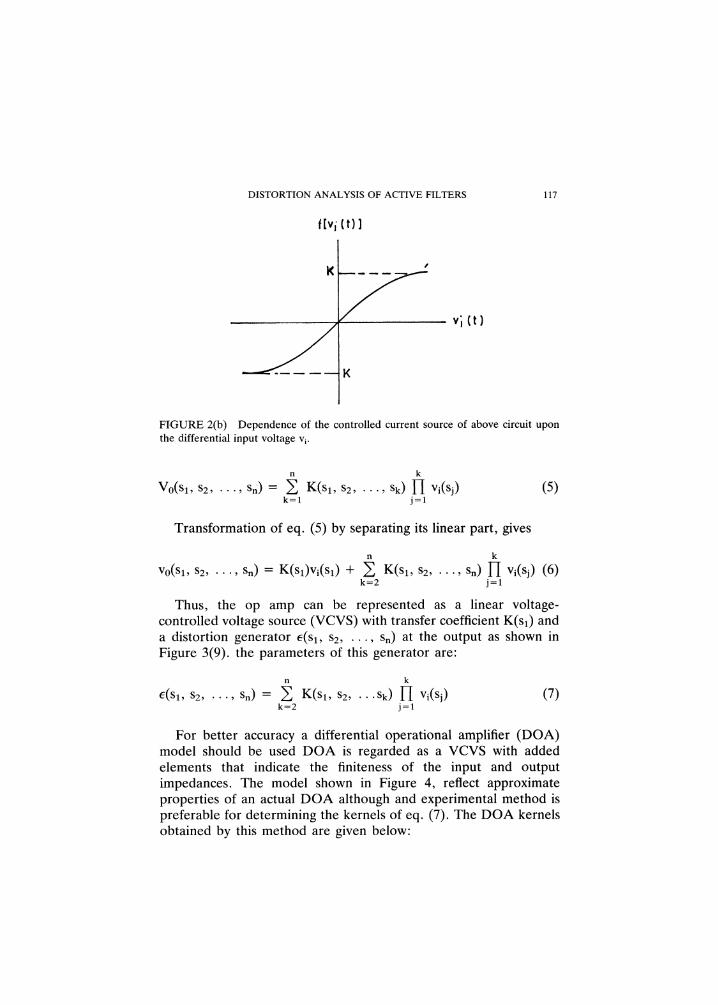
Figure 2b, there is a region for small values of vi(t), in which f[vi(t)]is proportional to vi(t). However, for large values of vi(t) it saturatesand becomes independent of vi(t). Then the output signal is distortedand in the limit approaches a triangle wave from where the slopesare equal to the slew rate of the op amp. Such distortions cannot beremoved by the frequency response of filter and small-signal infor-mation is not passed by the filter.
There are two methods available to prevent slew-induceddistortion (SID) from occuring:
(i) input to the filter can be clipped so as to keep the output slopeof the op amp less than the slew rate. While this methodallows larger signal levels at lower frequencies than ampli-tude limiting, it creates its own distortion in the form of higherharmonics.
(ii) An operational amplifier with a high slew rate, such as abiFET or CMOS type can be used if an operational amplifieris operating in the range of SID. Then its modelling using theVolterra series is difficult if exact methods are utilized, suchas the "distortion generator" method (6). This method pro-vides a sufficient accuracy in the estimation of small non-linear distortions.
The relationship between input (vi) and output (v0) of an op amppossessing nonlinear and interial properties using eq. (4) is
DISTORTION ANALYSIS OF ACTIVE FILTERS
f[vi (t)]
117
v;Ct)
FI.GURE 2(b) Dependence of the controlled current source of above circuit uponthe differential input voltage vi.
k
Vo(S1, $2, sn) K(s1, $2, Sk) I-I Vi(Sj)k=l j=l
Transformation of eq. (5) by separating its linear part, gives
n k
Vo(S1, $2’ Sn) K(S1)Vi(S1) "[- E K(s1, $2, Sn) H vi(sj) (6)k=2 j--1
Thus, the op amp can be represented as a linear voltage-controlled voltage source (VCVS) with transfer coefficient K(sa) anda distortion generator e(Sl, s2, Sn) at the output as shown inFigure 3(9). the parameters of this generator are:
n k
?($1, $2, Sn) E K(s1, $2, ...Sk) 1-[ Vi(Sj)k=2 j=l
(7)
For better accuracy a differential operational amplifier (DOA)model should be used DOA is regarded as a VCVS with addedelements that indicate the finiteness of the input and outputimpedances. The model shown in Figure 4, reflect approximateproperties of an actual DOA although and experimental method ispreferable for determining the kernels of eq. (7). The DOA kernelsobtained by this method are given below:

118 UMESH KUMAR AND SUSHIL KUMAR SHUKLA
viFIGURE 3(a) Operational amplifier with distortion.
E(SI,- ,S
v|(S / SI ,SnK(S]FIGURE 3(b) Signal flow-graph of above circuit.
Vi
FIGURE 4 Equivalent circuit of operational amplifier based on DOA model.
KoA(SI) al1 + S1TOA
a2 0Koa(Sl, $2) (1 "}- S1T0)(1 + s2T%) (8)
K%(s, sz, s) a3
I-[ (1 + SjTOA)j=l
Here only three kernels have been used to characterize the opamp and the even order term is zero due to odd symetry char-acteristic in Figure 2b. This model gives accurate results for smallnonlinearities.
DISTORTION ANALYSIS OF ACTIVE FILTERS 119
ANALYSIS PROCEDURE
The analysis procedure adopted in this paper for any active filter isas follows:
(i)
(ii)(iii)(iv)
(v)
(vi)
(vii)(viii)
Identify various nodes of the circuit and draw a signal flowgraph in such way that every node represents a voltage. Ifelements are given in the form of impedances, convert theminto admittences.
Find the gain branch of the signal flow graph.Find the voltage at VCVS input vis.Find the output voltage of the device excluding the distor-tion generators.Find the parameters of the distortion generator fromequation 7 using equation 8.
Assuming the circuit to be linear, recompute the para-meters of the distortion generators at the circuit output.Find the total output signal by using equation 6.
From an analysis of the expression describing the filteroutput signal, kernels of the functions of Volterra series aredetermined. This series shows the relation between theinput and output signals.
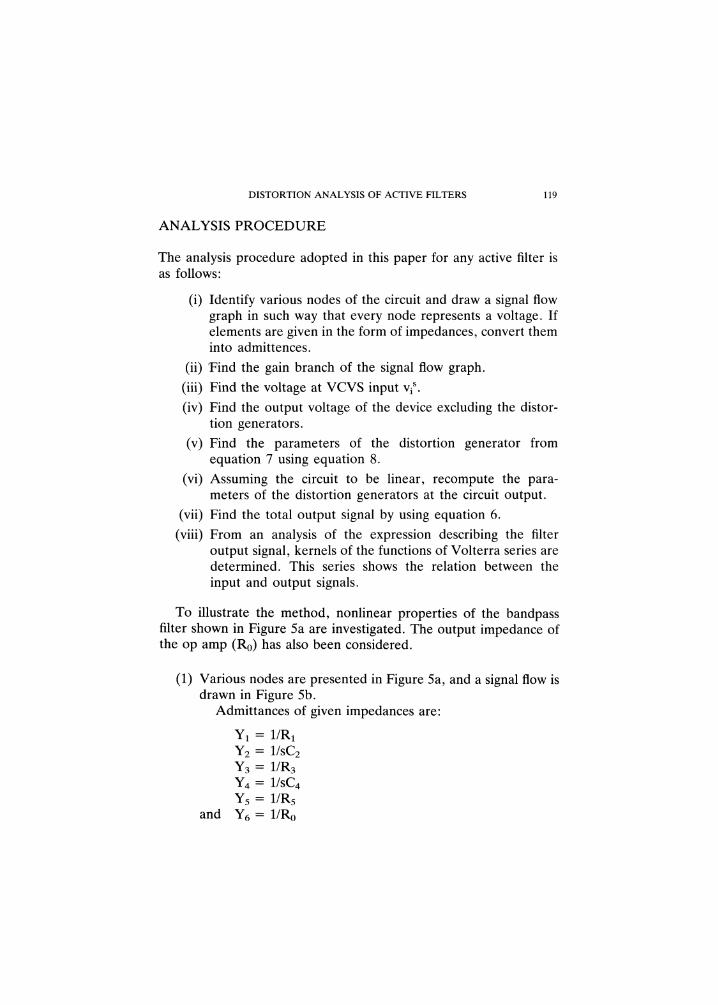
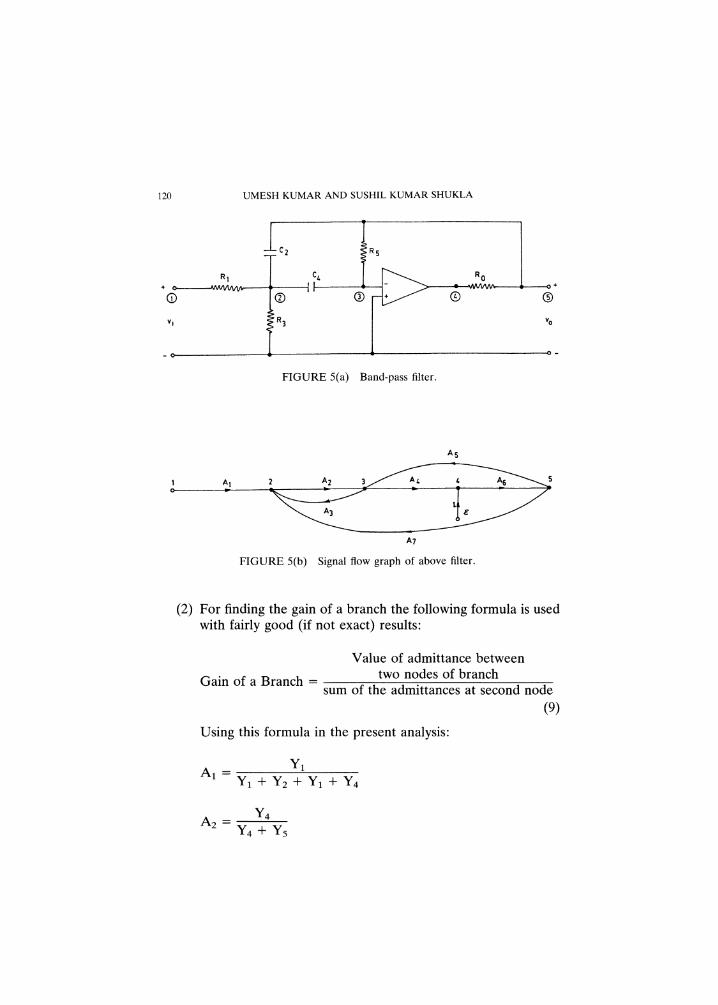
To illustrate the method, nonlinear properties of the bandpassfilter shown in Figure 5a are investigated. The output impedance ofthe op amp (R0) has also been considered.
(1) Various nodes are presented in Figure 5a, and a signal flow isdrawn in Figure 5b.
Admittances of given impedances are:
Y1 l/R1Y2 1/sC2Y3 l/R3Y4 1/sC4Y5 l/R5
and Y6 l/R0
120 UMESH KUMAR AND SUSHIL KUMAR SHUKLA
-C
vl
FIGURE 5(a) Band-pass filter.
A
FIGURE 5(b) Signal flow graph of above filter.
(2) For finding the gain of a branch the following formula is usedwith fairly good (if not exact) results:
Value of admittance betweentwo nodes of branchGain of a Branch
sum of the admittances at second node(9)
Using this formula in the present analysis"
Y1A1 "-Y1 + Y2 + Y1 + Y4
Y4A2 Y4 + Y5

DISTORTION ANALYSIS OF ACTIVE FILTERS 121
Y4A3 Y1 + Y2 + Y3 + Y4
al1 + sToA
Y5As Y4 + Y5
Y0A6 Y1 + Y2 + Y3 + Y4
(3) The following general gain formula (2) is used to find thevoltage as a node for a gain voltage at any other node ofsignal flow graph
N MkAkMmn E A (10)k=l
where Mmn gain between nodes rn and nN total number of forward pathsMk gain of kth forward pathAk for that part of the signal flow graph which is
nontouching with the kth forward pathA 1 EPml + EPm2 + + (-1) EPmr +
rn rn
(11)
gain product of the mth possible combina-tion of all nontouching loops.
Two parts of a signal flow graph are said to be nontouch-ing if they do not share a common node.
Using this formula the signal at the input of the op amp is:
AIA2V3(s) 1 A2A3 A4AsA6- A2A4A6A7 VI(S)
T13(S)VI(S)
(4) Use of eq. (10) gives a linear part of the output signal as:

122 UMESH KUMAR AND SUSHIL KUMAR SHUKLA
AIA2A4A6V(s) 1 A2A3- A4AA6- A2A4A6A7 v (s)
Tf(s)v(s)
(5) Parameters of the distortion generator for the present caseusing eq. (7)
k
6"($1, $2’ Sn) E KoA(S1, $2, Sn) H [--V3(Sj)]k=2 j=l
(6) The transfer function from the distortion generator to thefilter output is (using eq. 10)
A6(1 A2A3)T,(s) 1 A2A3 A4A5A6 A2A4A6A7
(7) Recompute the signal from the distortion generator to thefilter output and find the total output signal (using eq. 6.)
n
Wo(s1, $2, Sn) Tf(s)Wi(s) + E KoA(s1, $2, Sn)k=l
x (-1)k ]-I [v3(s) x T,s(esj)] (12)j=l
To this point all the values used on RHS of above equationhave been determined so that output can be calculated.
(8) From the expression obtain in eq. 12, kernels of the functionsare determined using eq. 6"
K(s) Tf(s1)
Kf(s1, s2, Sp) KoA(S1, S2, Sp)(--1)p
PI-[ [T13(Sj) T5(sj)]j-1
(13)

DISTORTION ANALYSIS OF ACTIVE FILTERS 123
Utilizing an expression for the complex amplitude of thefirst harminic, we can find the amplitude frequency responsefrom the first harmonic:
[Keq(iW)3 2 (iwKr(ko) + UmKj iw, -iw) (14)
If measure of distortion of a particular order (e.g., 3) is ofinterest, it can be determined by calculating the third orderintermodulation index, which is defined as (4):
K3(s1, $1, --$2)3IM3 20 log ]-[ KI(Sj)
j=l
Similarly, other intermodulationcalculated if required.
indices can also be
SOFTWARE IMPLEMENTATION
The software package made using the algorithm developed in lastsection is given in Appendix 1. The program developed is quitegeneral and can be used for any type of filter with the followingrestrictions:
(1) The amplitude of input harmonic signal should not be toolarge and it must satisfy the inequality:
Um 1.2 [ Kj(iw, iw, -iw)] 1/2
where se is given order of smallness.
(2) The signal flow graph of filter should not have more than twonontouching loops.
Thus, for small nonlinearities and for not every complex circuits,this program can be used, to determine an amplitude frequencyresponse.

124 UMESH KUMAR AND SUSHIL KUMAR SHUKLA
The band pass filter, that was used to illustrate the procedure inlast section is given here to also show performance of program. Inputdata i.e., parameters of the filter and op amp used are given in thedata file in Appendix. The variation of amplitude with frequency isalso given in Appendix 2.From these results of this filter, the following conclusion can be
drawn. The major contribution to the nonlinear distortion of thefilter is made by the signals in the filter pass band.
CONCLUSIONS
Although alternative approaches were available for the problem, adistortion generator method is described in this paper because itsimplifies the computations so that more complex circuits (difficultwith other methods such as in Nasseret al’s method (8)) can beanalysed.
The importance of this work lies in the fact that nonidealities ofactive elements have a stronger effect than that of passive ones onthe nonlinear properties of the filter (5). The program developed canbe used to calculate the distortion in filter output due to nonidealitiesof active elements so that filter performance can be improved.
REFERENCES
1. Martin Schetzen, The Volterra and Wiener Theories of Nonlinear Systems, JohnWilley and Sons, 1980.
2. Benjamin C. Kuo, Automatic Control Systems, Prentice-Hall, 1983.3. S. Narayanan, Application of Volterra series to intermodulation Distortion
Analysis of Transistor Feedback Amplifiers, IEEE Transaction on Circuit Theory,Vol. CT-17, no. 4, pp. 518-527, Nov. 1980.
4. J.E. Solomon The Monolithic op amp-A Tutorial study IEEE J. Solid-stateCircuit, vol. SC-9, pp. 314-332, December 1974.
5. R. Schaumann, W.A., Kinghorn and K.R. Laker, Minimising Signal Distortionin FLF Active Filters, Electronics Letters, vol. 12, no. 9, pp. 211-213, 29th April1976.
6. E.A. Bogatyrew and Yu. S. Grebenko, Analysis of Nonlinear Distortion in ActiveFilters Utilizing Volterra Series, Telecommucations and Radio Engineering, part2, vol. 34, no. 10, pp. 51-56, Oct. 1979.
7. E.A. Laksberg, A, Combined Analysis of the Sensitivities Noise, and NonlinearDistortion in the Frequency Domain, Radioelectronics and Communication
System, vol. 25, no. 11, pp. 44-50, 1982.

DISTORTION ANALYSIS OF ACTIVE FILTERS 125
8. A. Nasser, M. Fikri and K. Kafrawy, Volterra series analysis of IntermodulationDistortion in Second Order Active Filters, IEEE Circuits and Systems, Magazine,pp. 4-8, June 1983.
9. O.J. Bonello, Distortion in Positive and Negative Feedback Filters, J. AudioEngineering Society, vol. 32, pp. 239-245, no. 4, April 1984.

126 UMESH KUMAR AND SUSHIL KUMAR SHUKLA
APPENDIX-I LISTINGS OF PROGRAM "DISTORTION ANALYSIS"
List of Symbols used in Program "Distortion Analysis"N Number of elements in networkNN Number of nodes in networkN1 & N2 Node numbersA Element in branch connecting nodes N1 and N2N3 Signifies type of element
to indicate presence of resistance2 to indicate presence of capacitor3 to indicate presence of inductor4 to indicate presence of positive input to op amp5 to indicate presence of negative input to op amp
XK al of equation (8)T TOA of equation (8)A13 ’a3 of equation (8)L1 Lower frequency limit from which frequency response is requiredL2 Upper frequency limit upto which frequency response is requiredL3 Frequency interval at which Keq(iW)’ is to be calculatedU Input voltage levelIll Number of times Keq(iW)l is calculatedJll Frequencies for which Keq(iW)] is calculatedY IKeq(iW)P Character array in which graph is plottedB Admittance corresponding to given impedance AC Gain of a branchE Resultant gain between two unconnected nodesEl, E2, E3, E4, E5 Values of E for different nodesA1A2A3Ell, E12E21, E22
KP
KEQ3ZDIIF
N1NJMAXJMINYMAXYMIN
KoA(s1) of equation (8)1/(1 + S1ToA) of equation (8)complex form of A3Values of A2 for different frequenciesValues of A1 for different frequencies
i[Ii [T3(sj) T+/-675(sj)] of equation (13) for all distortion
generators.
]Keq(iW)] of equation (14)Complex form of UGain of a branch
:Parameter used to get negative and double of frequency atwhich ]Keq(iW)] is being calculated.Parameter used to limit number of values to 80 if Ill exceeds 80.Maximum value of all the JllsMinimum value of all the JllsMaximum value of all the YsMinimum value of all the Ys

DISTORTION ANALYSIS OF ACTIVE FILTERS 127
D1X11, 12
N5
NIJ
QQ1Q2Q3
Denominator of equation (9)Numerator of equation (9)Node numbers used for transfer from main segment to fuLctionsub-program EArray used to compare nodes with previously used nodes whilecalculating D1 to ensure that no branch is used more than once.:Two dimensional array to give information whether a branchexists between two nodes or not.
MK of equation (10)Gain product of a loopPml of equation (10)Pm2 of equation (10)
Besides these symbols I, J, II, JJ and L1 have been used as indices of DO loops.
PROGRAM DISTORTIONANALYSISMAIN SEGMENTDIMENSION N1(25), N2(25), N3(25), A(25), Jl1(200), Y(200)CHARACTER P(80, 80)COMPLEX E(25), C(25), E1(15), E2(15), E3(15), E4(15),E21, E22, KP, KEQ3, Z, O, E, 45, A1, A2, A3, Ell, E12COMMON N1, N2, N/BL1/B/BL2/C, NNDATA P/6400."/READING NUMBER OF ELEMENTS, NUMBER OF NODES, 1, TAND 3 OF OP AMP, LOWER, UPPER LIMITS AND FREQUENCYINTERVAL OF FREQUENCY RESPONSE, INPUT VOLTAGE LEVELREAD (5, *)N, NN, XK, T, A13, L1, L2, L3 UREADING NUMBER OF NODES AND ELEMENTS IN BRANCHCONNECTING THESE NODESREAD (5, *) (NI(I), N2(I), N3(I), A(I), 1, N)Z CMPLX(0, 0.0)Ill 0DO 6 I1F L1, L2, L3KP CMPLX(0.0, 0.0)JF IIFA3 CMPLX(A13, 0.0)A2 (CMPLX (1.0, 0.0))/(CMPLX(1.0, I1F*6.28319,T))A1 (CMPLX(XK, 0.0))*A2CONVERSION OF IMPEDANCES INTO ADMITTANCESDO.1I 1, NIF(Na(I).EQ.1)B(I) CMPLX(I.0/A(I), 0.0)IF(Na(I).EQ.2)B(I) CMPLX(0.0, I1F*6.28319,A(I))IF(Na(I).EQ.3)B(I) CMPLX(0.0, 1.0/(11F*6.28319*A(I)))IF((N3(I).EQ.4).OR.(Na(I).EQ.5))B(I) KPCONTINUEDO2I 1, N

128 UMESH KUMAR AND SUSHIL KUMAR SHUKLA
IF((N3(I).EQ. 1). OR. (N3(I).EQ.2). OR. (N3(I).EQ.3))C(I) D(N2(I), B(I))IF((N3(I).EQ.4).AND.(NI(I).NE.0))C(I) A1IF((N3(I).EQ.5).AND.(N (I).NE.0))C(I) ACONTINUEIF(I1F.LT.C)GO TO 4IF(I1F.EQ.(2*JF))GO TO 8Ell A2E21 A1CALCULATION OF GAIN AT INPUT OF OP AMP INPUTNODE OF FILTER AND GAIN AT OUTPUT NODE OF FILTER...DISTORTION GENERATORDO3I=I,NIF((N3(I).NE.4).OR.(N3(I).NE.5))GO TO 3El(I) E(a, Na(I))E2(I) E(N2(I), NN)CONTINUECALCULATION OF LINEAR PART OF OUTPUT SIGNALE5 E(1, NN)I1F -I1FGO TO 5El2 A2E22 A1CALCULATION OF GAIN AT INPUT OF OP AMP INPUTNODE OF FILTERDO9I= 1, NIF((N3(I).NE.4).OR.(N3(I).NE.5))GO TO 9E3(I) E(1, NI(I))CONTINUEI1F -I1F*2GO TO 5CALCULATION OF GAIN AT OUTPUT NODE OF FILTER...DISTORTION GENERATORDO7I= 1, NIF((Na(I).NE.4).OR.(Na(I).NE.5))GO TO 7E4(I) E(N2(I), NN)CONTINUECALCULATION OF TT[T13(S ).T5( )] FOR ALLDISTORTION GENERATORSDO 10I 1, NIF((Na(I).NE.4).OR.(Na(I).NE.5))GO TO 10KP KP / EI(I)*EI(I)*E2(I)*E2(I)*Ea(I)*E4(I)CONTINUECALCULATION OF THIRD ORDER KERNELKEQ3 -A3*E11*E11*E12*KPCALCULATION OF K OF EQUATION(14)

DISTORTION ANALYSIS OF ACTIVE FILTERS 129
XKIM CABS (E5 + (0.75, 0.0)*Z*Z*KEQ3)Ill Ill + 1Jll(Ill) JFY(Ila) XKIMIIF JFCONTINUEGRAPH PLOTTINGIF(I11.GT.8C)NIN 80IF(Ill.LE.SC)N1N IllDO 12I 1, N1NP(I, 1) J 2, NINDO 13J =2, N1NP(1, J)SELECTION OF MAXIMUM AND MINIMUM VALUESJMAX Jl1(1)YMAX Y(1)JMIN Jll(1)YMIN Y(1)DO llI 1, IllIF(J11 (I). GT.JMAX) JMAX J11 (I)IF(J11(I).LT.JMIN) JMIN J11(I)IF(Y(I).GT.YMAX) YMAX- Y(I)IF(Y(I).LT.YMIN) YMIN Y(I)CONTINUESCALING OF CALCULATED VALUES TO FIT THEMEFFECTIVELY IN AVALABLE SPACEKXX NIN-KYY NIN-DO 14K= 1, Ill
(Jll(K) JMIN)*FLOAT(KXX)/(FLOAT(JMAX- JMIN))J (Y(K) YMIN)*FLOAT(KYY)/(YMAX- YMIN)P(I, J) ’*’CONTINUEZSULT WRITING IN TammA VORMWRITE (6, 15) (Jll(I), Y(I), 1, Ill)FORMAT (5X, ’FREQUENCY ’, i4, 5x,’ K ’, El0.5)RESULT WRITING IN GRAPHICAL FORMDO 16J 1, NINWRITE (6, 17) (P(I, J), 1, N1N)FORMAT (10A8)STOPEND
FUNCTION SUBPROGRAM TO CALCULATE GAIN OFA BRANCHCOMPLEX FUNCTION D(I1, X)

130 UMESH KUMAR AND SUSHIL KUMAR SHUKLA
COMMON N1(25), N2(25), N/BL1/B(25)COMPLEX D1, X, BDIMENSION N5(25)D1 CMPLX (0.0, 0.0)DO1L=I,NIF(I1.EQ.NI(L))GO TO 2IF(I1.EQ.N2(L))GO TO 3GO TON5(L) N2(L)GO TO 4N5(L) NI(L)IF(L.EQ.1)GO TO 5DO6J 1, L-IF(N5(J).EQ.N5(L))GO TOCONTINUEDI= DI+ E(1)CONTINUED X/D1
RETURNEND
FUNCTION SUBPROGRAM TO CALCULATE RESULTANTGAIN BETWEEN TWO UNCONNECTED NODESCOMPLEX FUNCTION E(I1, I2)COMMON N1(25), N2(25), N/BL2/C(25), NNDIMENSION NIJ(25, 25)COMPLEX Q, Q1(25), Q2, C, Q3O CMPLX (1.0, 0.0)DATA Q1/25,(1.0, 0.0)/, NIJ/625*0/
Q2 CMPLX (0.0, 0.0)Q3 CMPLX (0.0, 0.0)CALCULATION OF M OF EQUATION (10)DOLL1 1, NIF((N (L1).GE.I1).AND.(NZ(L ).LE.I2).AND.(N2(L ).GT.NI(LI)))G G*C(L1)CONTINUECALCULATION OF EP OF EQUATION(11)DO 2 LI I, NDO2J= I,NIF (L1.EQ.J)GO TO 2DO3K=I,NIF((NI(K).EQ.L1).AND.(NZ(K).EQ.J))GO TO 4CONTINUEGO TO 2DO5L= 1, NIF((NI(L).EQ.J).AND.(NZ(L).EQ.La))GO TO 6
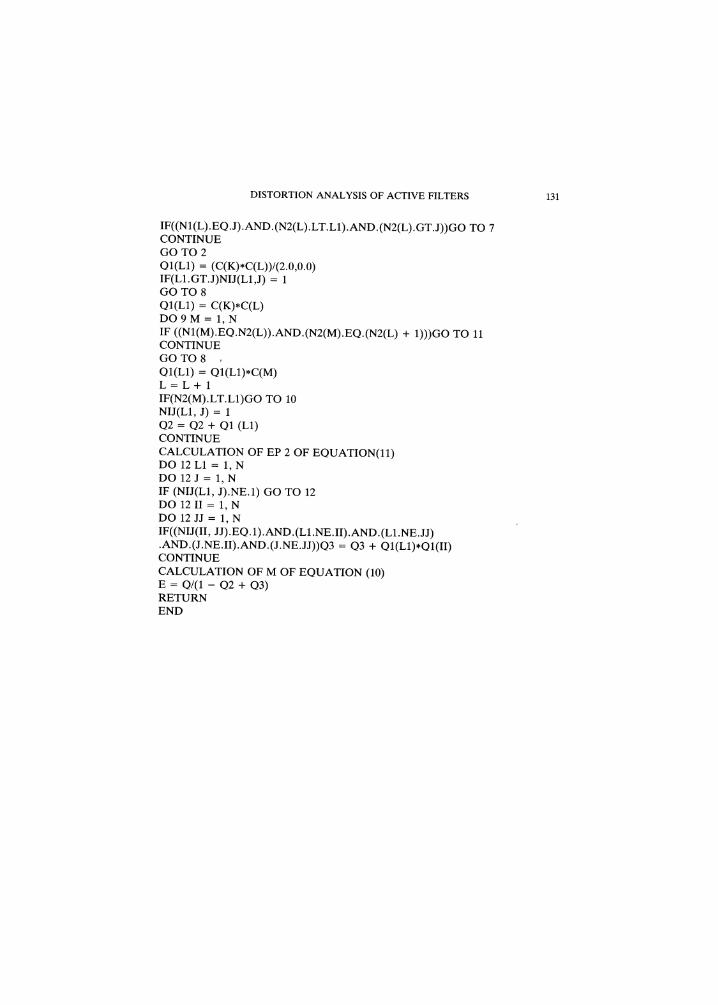
DISTORTION ANALYSIS OF ACTIVE FILTERS 131
IF((NI(L).EQ.J).AND.(N2(L).LT.L1).AND.(N2(L).GT.J))GO TO 7CONTINUEGO TO 2QI(L1) (C(K)*C(L))/(2.0,0.0)IF(L1.GT.J)NIJ(L1,J)GO TO 8QI(L1) C(K)*C(L)DOgM 1, NIF ((NI(M).EQ.N2(L)).AND.(N2(M).EQ.(N2(L) + 1)))GO TO 11CONTINUEGO TO 8Qa(La) Qa(L1),C(M)L=L+IIF(N2(M).LT.LI)GO TO 10NIJ(L1, J)Q2 Q2 + Q1 (L1)CONTINUECALCULATION OF EP 2 OF EQUATION(ll)DO 12L1= 1, NDO 12 J 1, NIF (NIJ(L1, J).NE.1) GO TO 12DO 12II 1, NDO 12JJ 1, NIF((NIJ(II, JJ).EQ.1).AND.(LI.NE.II).AND.(L1.NE.Jj).AND.(J.NE.II).AND.(J.NE.JJ))Q3 Q3 + Qa(L1),QI(II)CONTINUECALCULATION OF M OF EQUATION (10)E Q/(1- Q2 + Q3)RETURNEND

132 UMESH KUMAR AND SUSHIL KUMAR SHUKLA
APPENDIX-II INPUT DATA AND RESULTS OF PROGRAM"DISTORTION ANALYSIS"
Data File8 5 5000.0 4.0E 04 -8.0E 03 950 1050 8, 4
2 1213.5E033 2321.0E-064 3.4 5 0.05 4 5.1 200.06 5315.0E037 5221.0E-068 3221.0E-069 2015.0
ResultsFREQUENCY 950 ]Keq(iw)FREQUENCY 960 {Keq(iw)FREQUENCY 970 IKeq(iw)FREQUENCY 980 IKeq(iw)FREQUENCY 990 IKeq(iw)FREQUENCY 1000 IKeq(iw)FREQUENCY 1010 IKeq(iw)FREQUENCY 1020 IKeq(iw)FREQUENCY 1030FREQUENCY 1040FREQUENCY 1050
.22493E 01
.44784E + 00
.55471E + 00
.71649E + 00
.96816E + 00
.12979E + 01
.13920E + 01
.11026E + 01IKeq(iw) .81600E + 00[Keq(iw) .62703E + 00Keq(iw) .50397E + 00

International Journal of
AerospaceEngineeringHindawi Publishing Corporationhttp://www.hindawi.com Volume 2010
RoboticsJournal of
Hindawi Publishing Corporationhttp://www.hindawi.com Volume 2014
Hindawi Publishing Corporationhttp://www.hindawi.com Volume 2014
Active and Passive Electronic Components
Control Scienceand Engineering
Journal of
Hindawi Publishing Corporationhttp://www.hindawi.com Volume 2014
International Journal of
RotatingMachinery
Hindawi Publishing Corporationhttp://www.hindawi.com Volume 2014
Hindawi Publishing Corporation http://www.hindawi.com
Journal ofEngineeringVolume 2014
Submit your manuscripts athttp://www.hindawi.com
VLSI Design
Hindawi Publishing Corporationhttp://www.hindawi.com Volume 2014
Hindawi Publishing Corporationhttp://www.hindawi.com Volume 2014
Shock and Vibration
Hindawi Publishing Corporationhttp://www.hindawi.com Volume 2014
Civil EngineeringAdvances in
Acoustics and VibrationAdvances in
Hindawi Publishing Corporationhttp://www.hindawi.com Volume 2014
Hindawi Publishing Corporationhttp://www.hindawi.com Volume 2014
Electrical and Computer Engineering
Journal of
Advances inOptoElectronics
Hindawi Publishing Corporation http://www.hindawi.com
Volume 2014
The Scientific World JournalHindawi Publishing Corporation http://www.hindawi.com Volume 2014
SensorsJournal of
Hindawi Publishing Corporationhttp://www.hindawi.com Volume 2014
Modelling & Simulation in EngineeringHindawi Publishing Corporation http://www.hindawi.com Volume 2014
Hindawi Publishing Corporationhttp://www.hindawi.com Volume 2014
Chemical EngineeringInternational Journal of Antennas and
Propagation
International Journal of
Hindawi Publishing Corporationhttp://www.hindawi.com Volume 2014
Hindawi Publishing Corporationhttp://www.hindawi.com Volume 2014
Navigation and Observation
International Journal of
Hindawi Publishing Corporationhttp://www.hindawi.com Volume 2014
DistributedSensor Networks
International Journal of