Embed Size (px)
Citation preview
Explaining MotionDistance Time Graphs
Learning TweetTo understand how to plot and read Distance-Time
GraphsTo understand the relationship between velocity and
distance time graphs
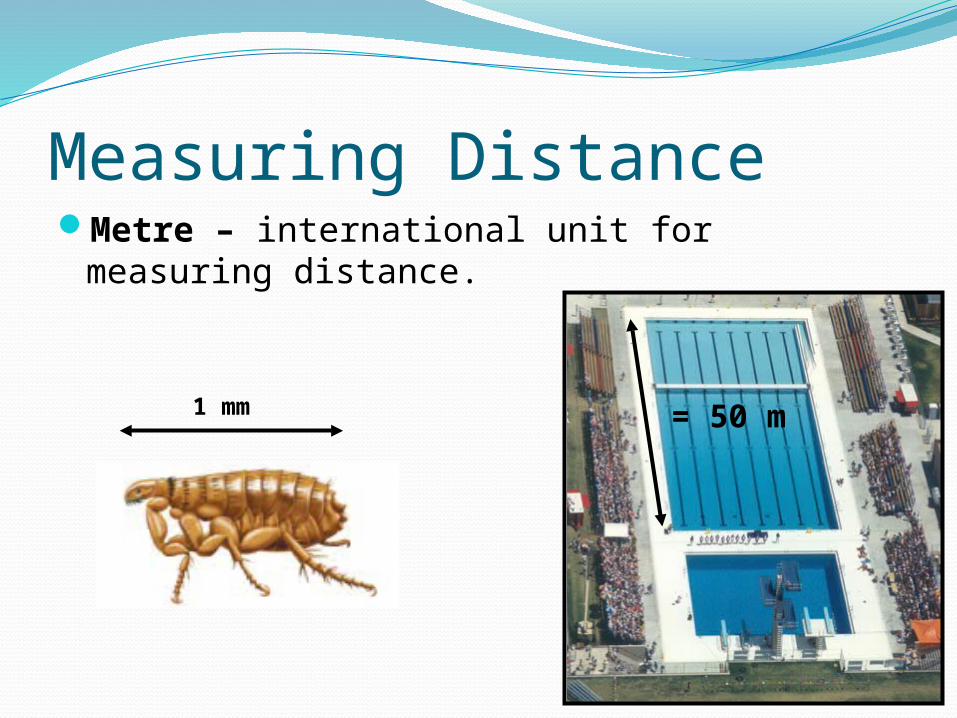
Measuring DistanceMetre – international unit for measuring distance.
= 50 m1 mm
Calculating SpeedSpeed (S) = distance traveled (d) / the amount of time it
took (t).
S = d/t
Calculating speedIf I travel 100 kilometre in one hour then I have a speed
of…100 km/h
If I travel 1 metre in 1 second then I have a speed of….1 m/s
S = d/t
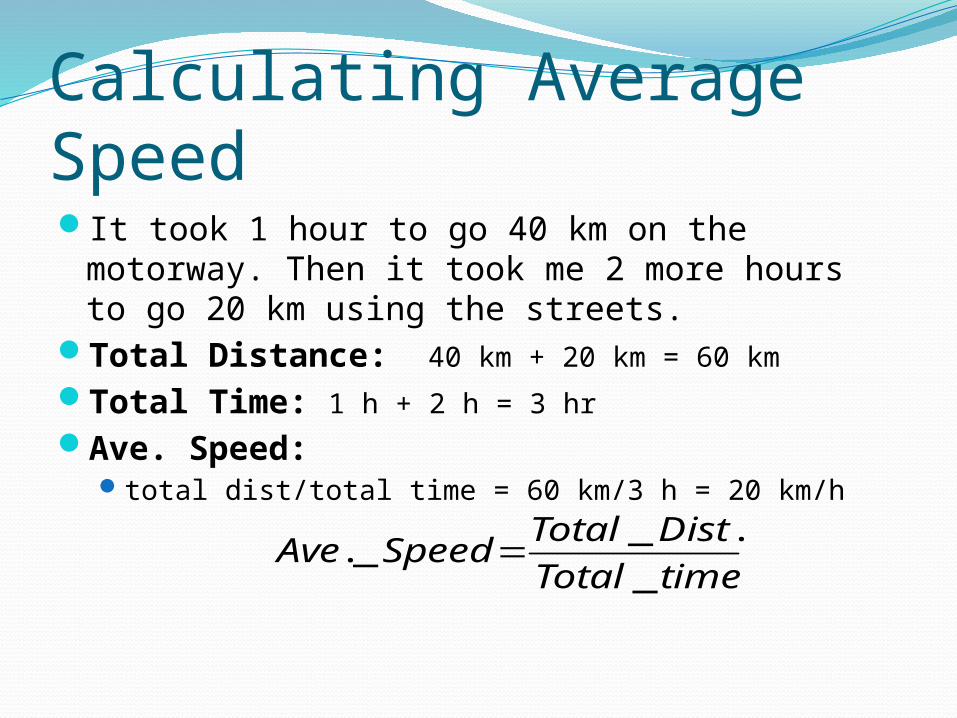
Calculating Average Speed It took 1 hour to go 40 km on the motorway. Then it took
me 2 more hours to go 20 km using the streets.Total Distance: 40 km + 20 km = 60 kmTotal Time: 1 h + 2 h = 3 hrAve. Speed:
total dist/total time = 60 km/3 h = 20 km/h timeTotal
DistTotalSpeedAve
_
.__.
timeTotal
DistTotalSpeedAve
_
.__.
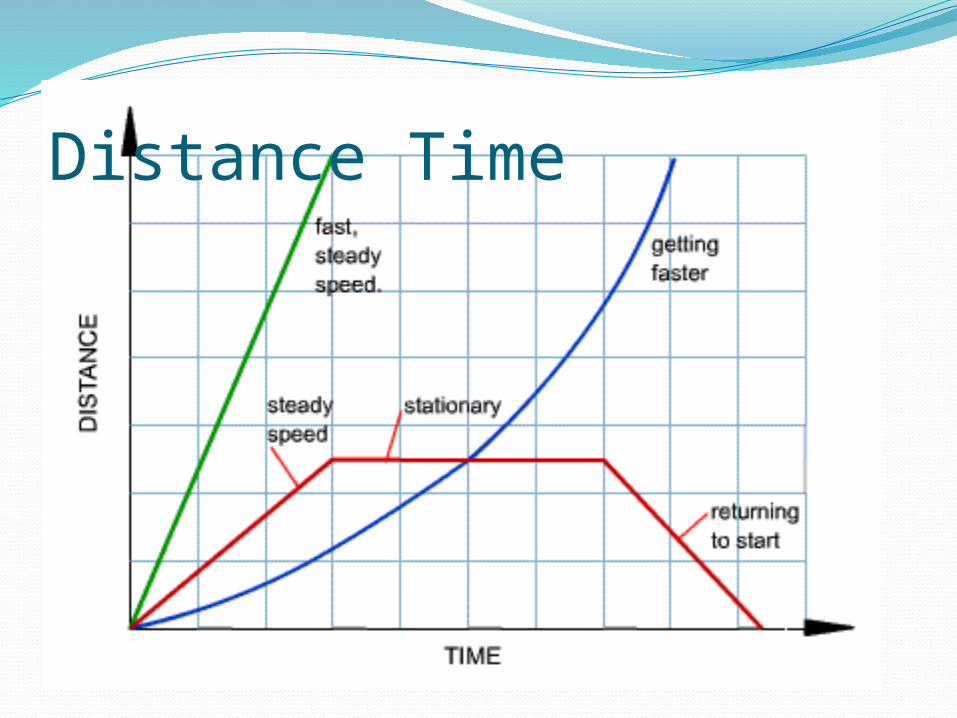
Distance Time
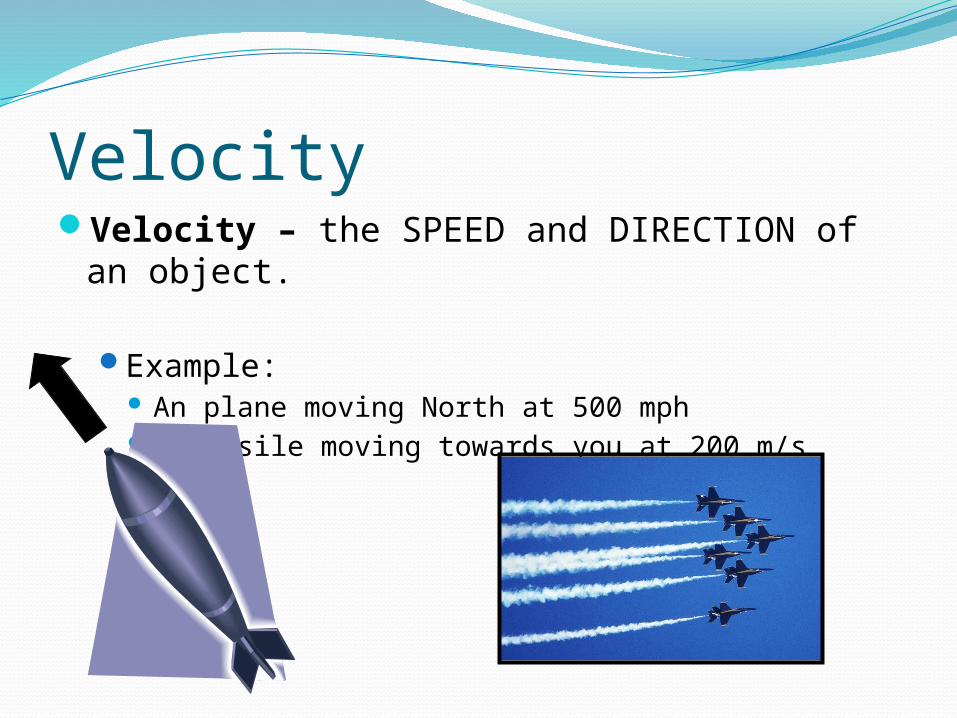
VelocityVelocity – the SPEED and DIRECTION of an object.
Example: An plane moving North at 500 mph A missile moving towards you at 200 m/s
Learning TweetMomentum
Know that Momentum is mass (kg) x Velocity (m/s)Explain a force acting for a certain time causes a change
in momentum
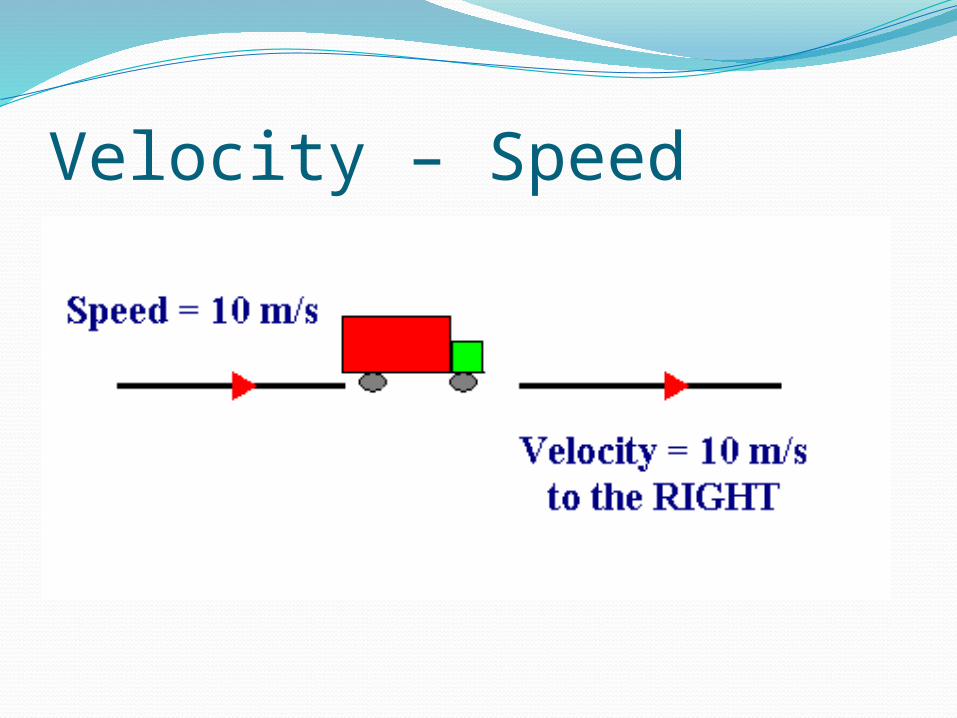
Velocity – Speed
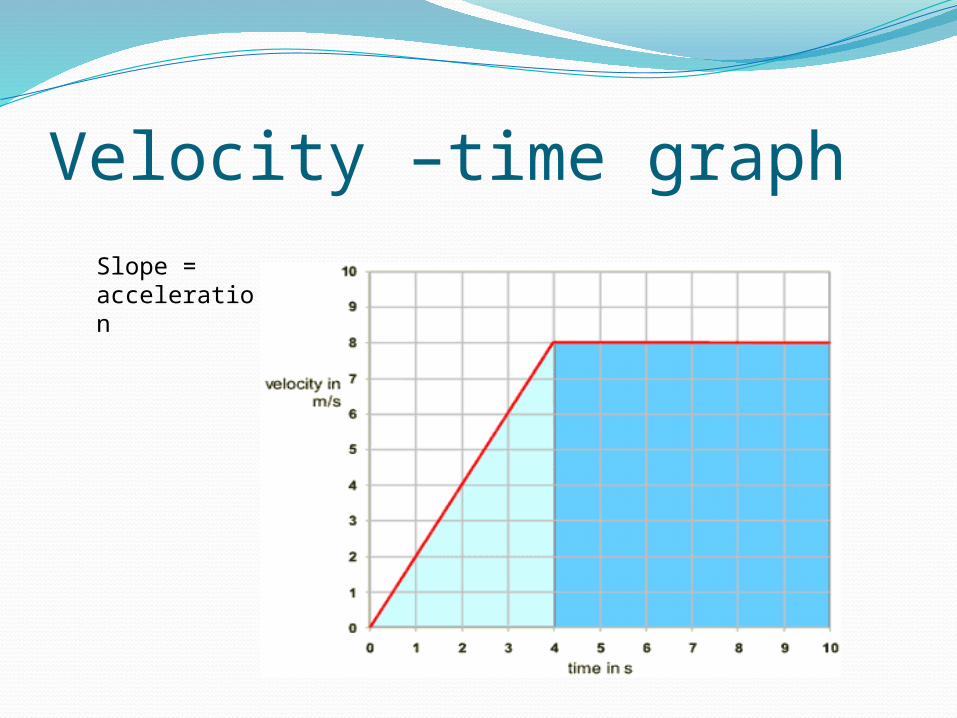
Velocity –time graph Slope = acceleration
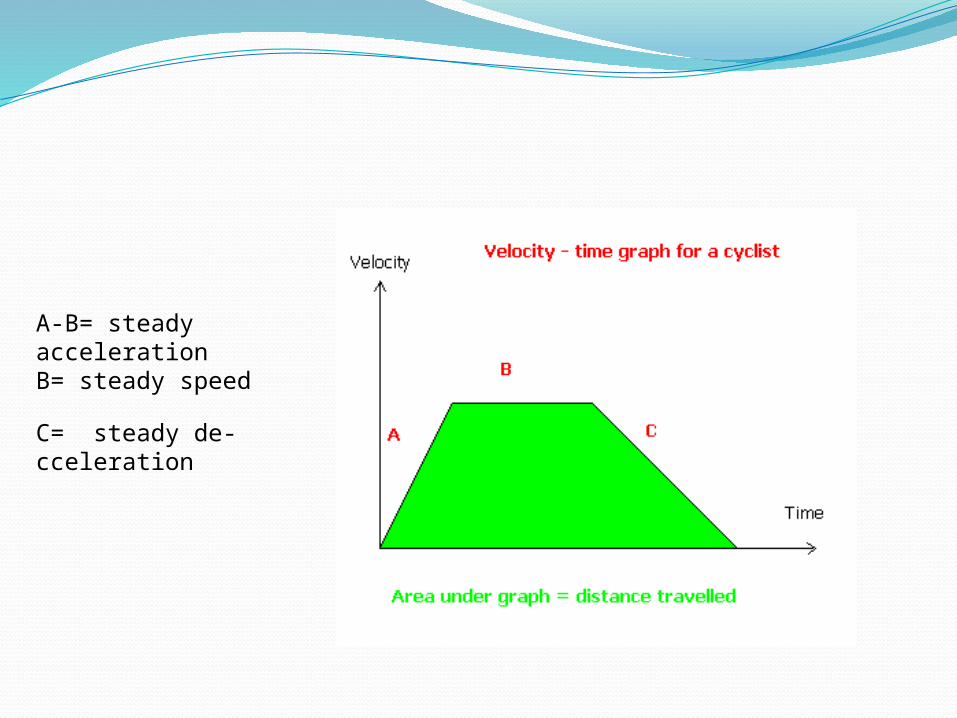
A-B= steady accelerationB= steady speed
C= steady de-cceleration