Embed Size (px)
Citation preview
DISSOLUTION TESTING IN PRODUCT DEVELOPMENT
PROF. PADMA V DEVARAJAN
DEPARTMENT OF PHARMACEUTICAL SCIENCES AND TECHNOLOGY
INSTITUTE OF CHEMICAL TECHNOLOGY(Deemed University)
Elite Status and Centre of Excellence- GOM
MUMBAI – 400019
DISSO INDIA AHMEDABAD 2016- JULY 26-27
2
APPLICATION OF IN VITRO DISSOLUTION
TESTING
IN PRODUCT DEVELOPMENT
SURROGATE FOR IN VIVO
STUDY“BIOWAIVERS”
FINISHED PRODUCT TESTING
3
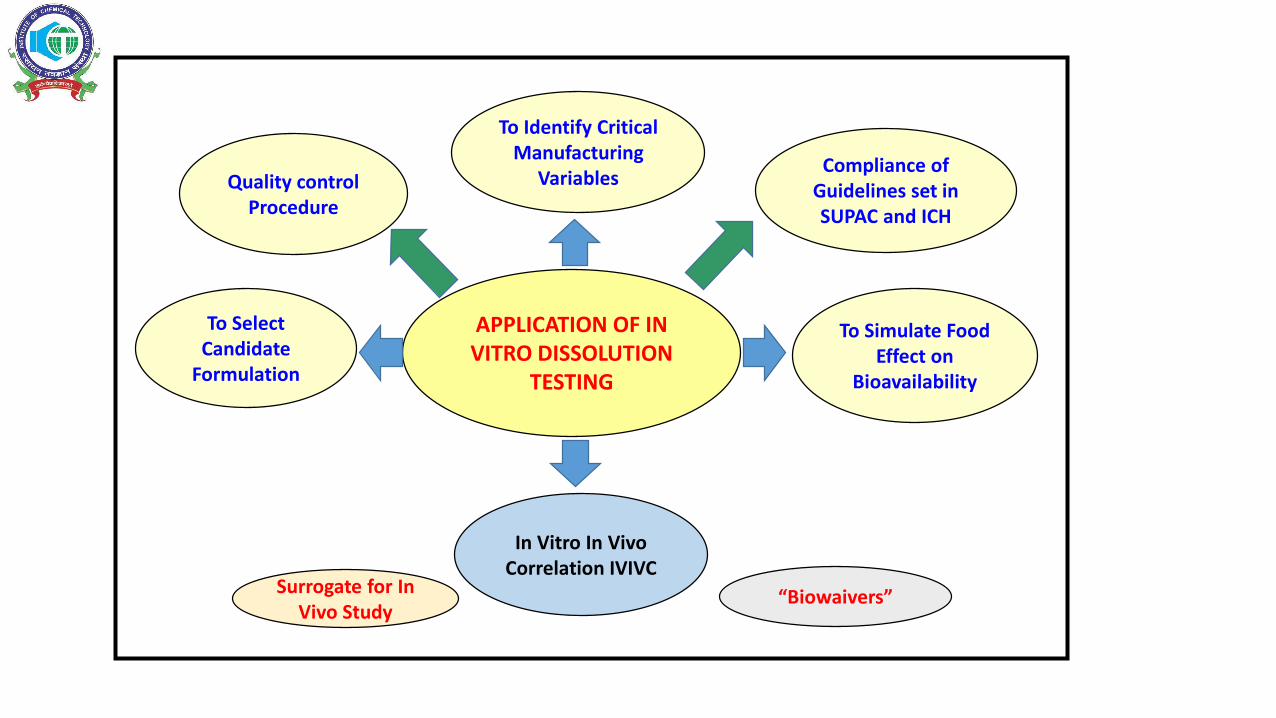
APPLICATION OF IN VITRO DISSOLUTION
TESTING
Quality control Procedure
To Select Candidate
Formulation
Compliance of Guidelines set in SUPAC and ICH
To Identify Critical Manufacturing
Variables
To Simulate Food Effect on
Bioavailability
In Vitro In Vivo Correlation IVIVC
Surrogate for In Vivo Study
“Biowaivers”
GUIDING PRINCIPLES
Avoid unnecessary
• Proliferation of equipment
• Complex method design
• Modifications of compendial equipment
• Development or use of alternative equipment
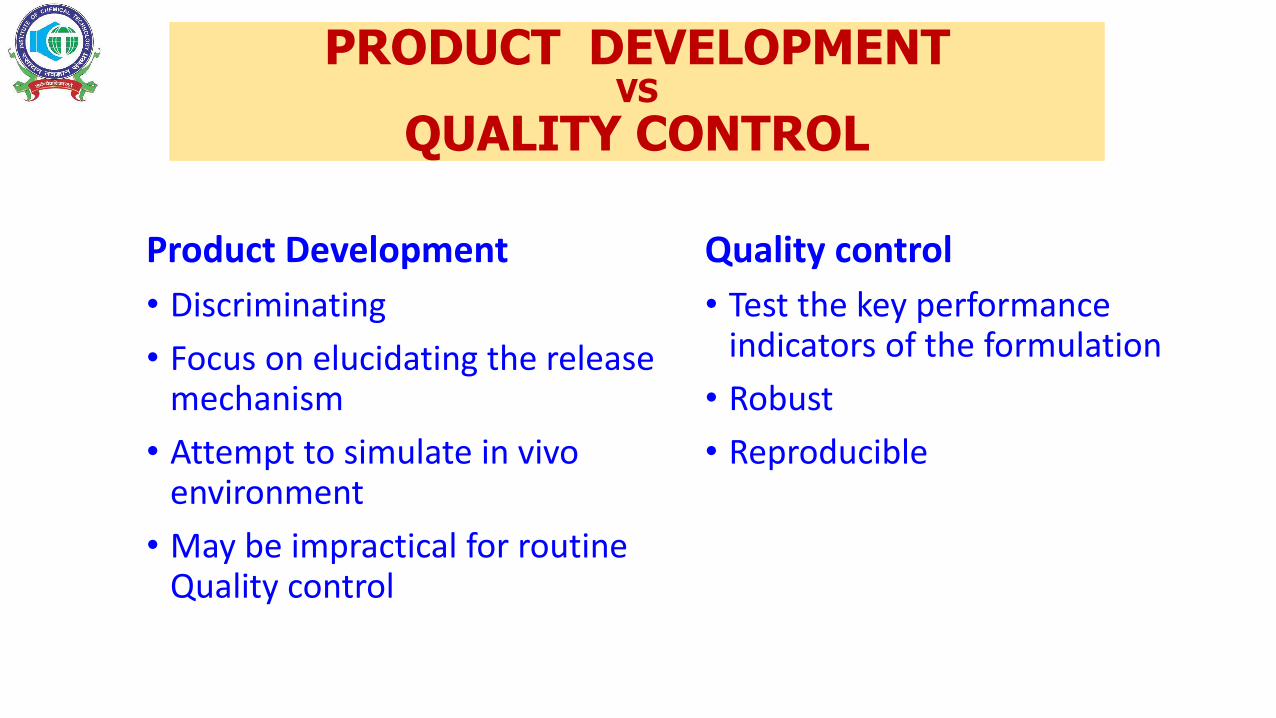
PRODUCT DEVELOPMENT VS
QUALITY CONTROL
Product Development
• Discriminating
• Focus on elucidating the release mechanism
• Attempt to simulate in vivo environment
• May be impractical for routine Quality control
Quality control
• Test the key performance indicators of the formulation
• Robust
• Reproducible
DISSOLUTION TEST CONSIDERATIONS
• Apparatus selection
• Agitation (HYDRODYNAMICS)
• Composition of the dissolution medium
• Temperature
SUMMARY OF THE PRESENTATION
• Dissolution test Apparatus - Why so many
• Dissolution media - and test objective
• Release Kinetics Analysis
• Dosage Forms- Selection of optimal apparatus and conditions
• Case studies
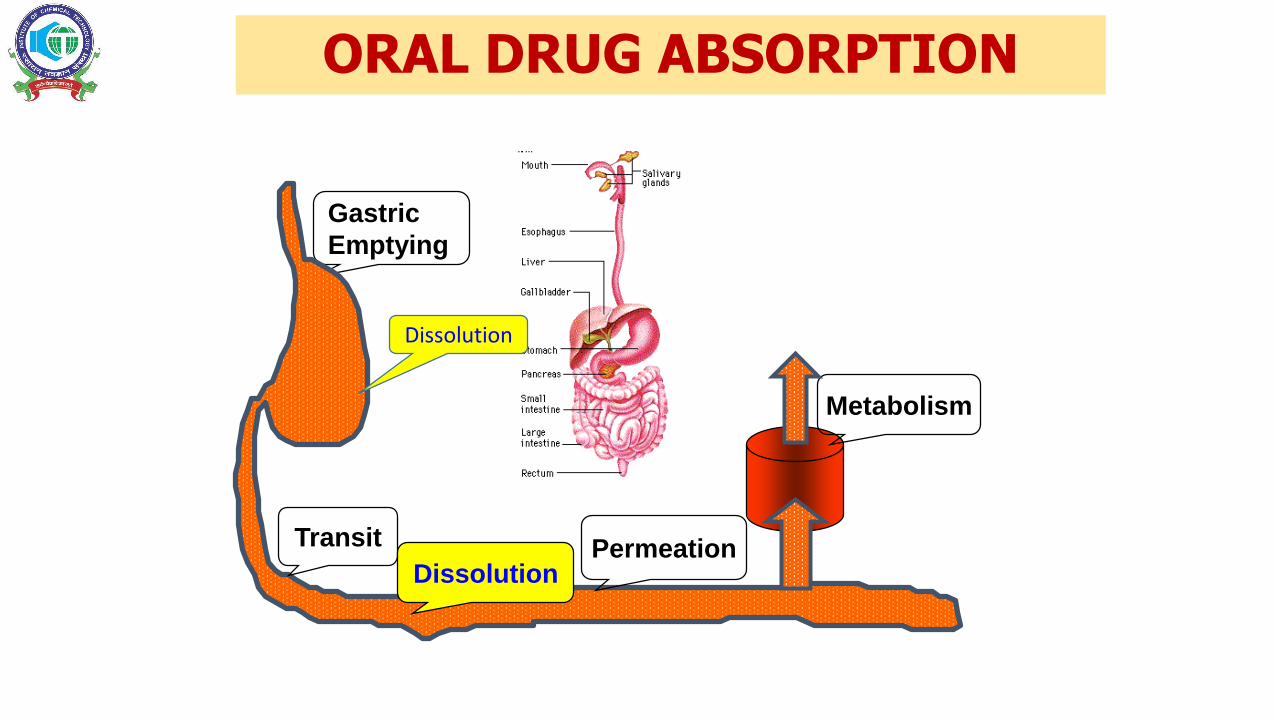
ORAL DRUG ABSORPTION
Gastric
Emptying
Transit PermeationDissolution
Metabolism
Dissolution
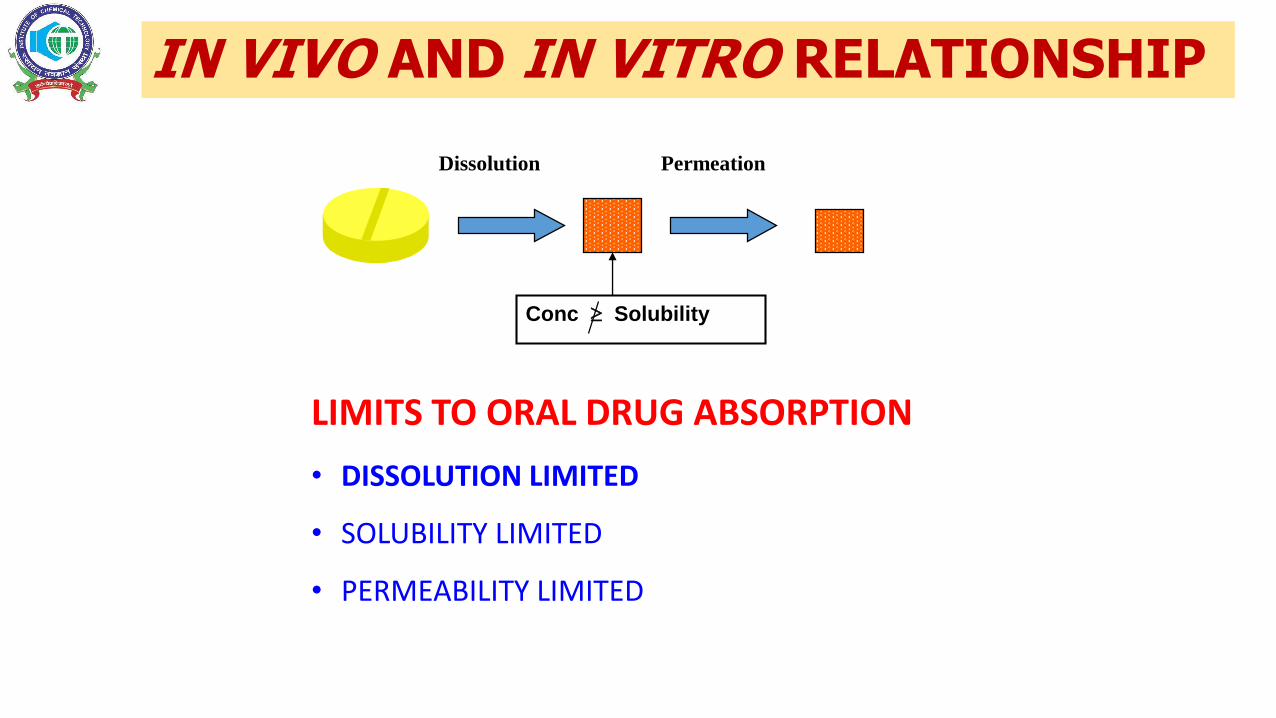
IN VIVO AND IN VITRO RELATIONSHIP
Dissolution Permeation
Conc Solubility
LIMITS TO ORAL DRUG ABSORPTION
• DISSOLUTION LIMITED
• SOLUBILITY LIMITED
• PERMEABILITY LIMITED
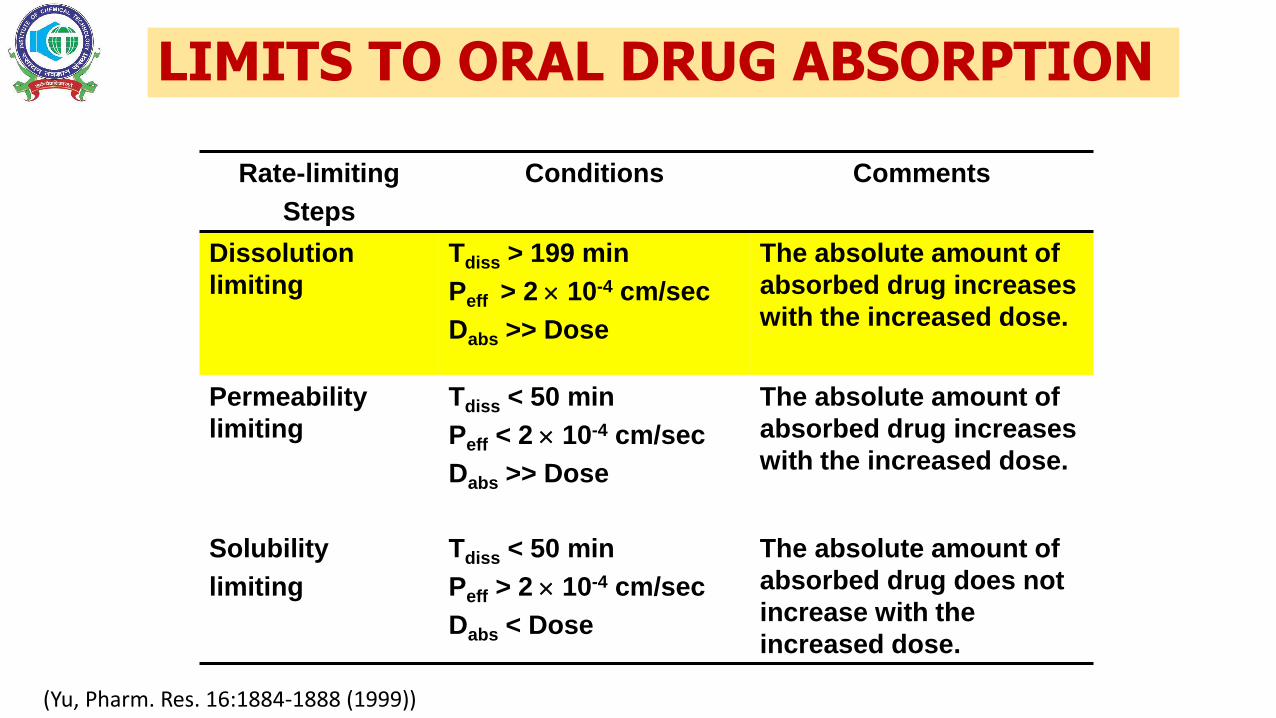
LIMITS TO ORAL DRUG ABSORPTION
Rate-limiting
Steps
Conditions Comments
Dissolution
limiting
Tdiss > 199 min
Peff > 2 10-4 cm/sec
Dabs >> Dose
The absolute amount of
absorbed drug increases
with the increased dose.
Permeability
limiting
Tdiss < 50 min
Peff < 2 10-4 cm/sec
Dabs >> Dose
The absolute amount of
absorbed drug increases
with the increased dose.
Solubility
limiting
Tdiss < 50 min
Peff > 2 10-4 cm/sec
Dabs < Dose
The absolute amount of
absorbed drug does not
increase with the
increased dose.
(Yu, Pharm. Res. 16:1884-1888 (1999))
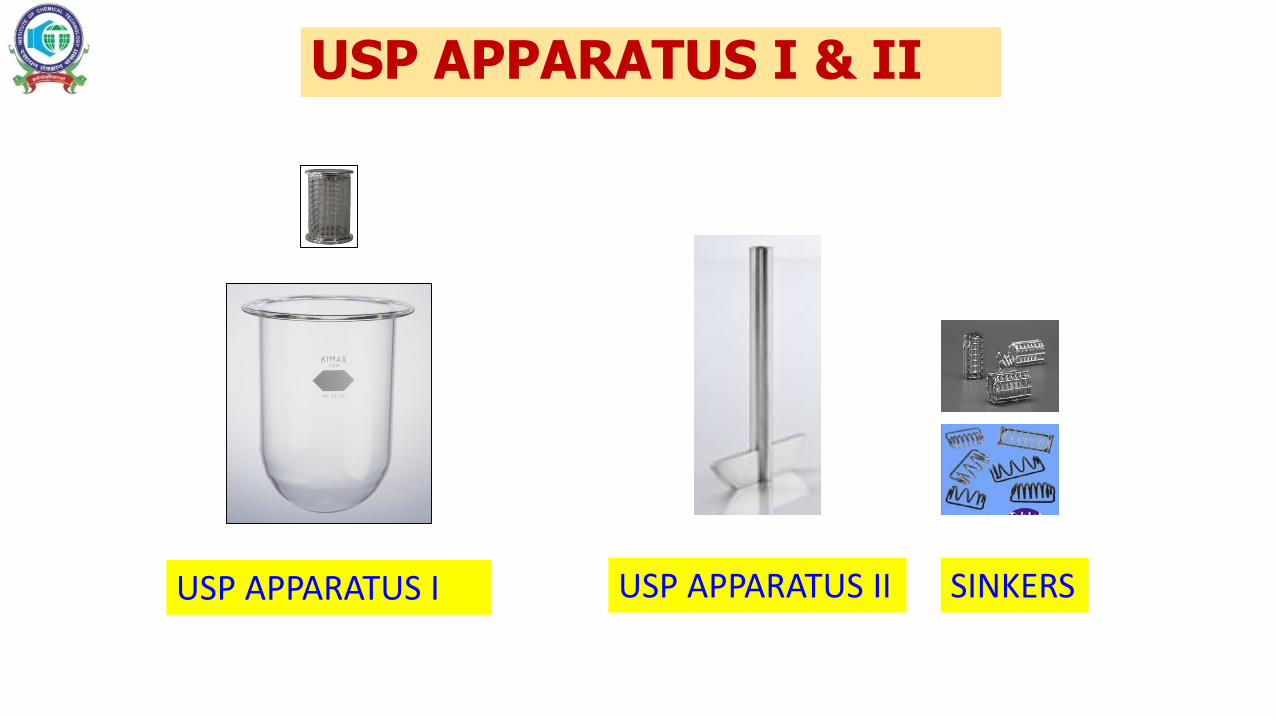
USP APPARATUS I & II
USP APPARATUS I USP APPARATUS II SINKERS
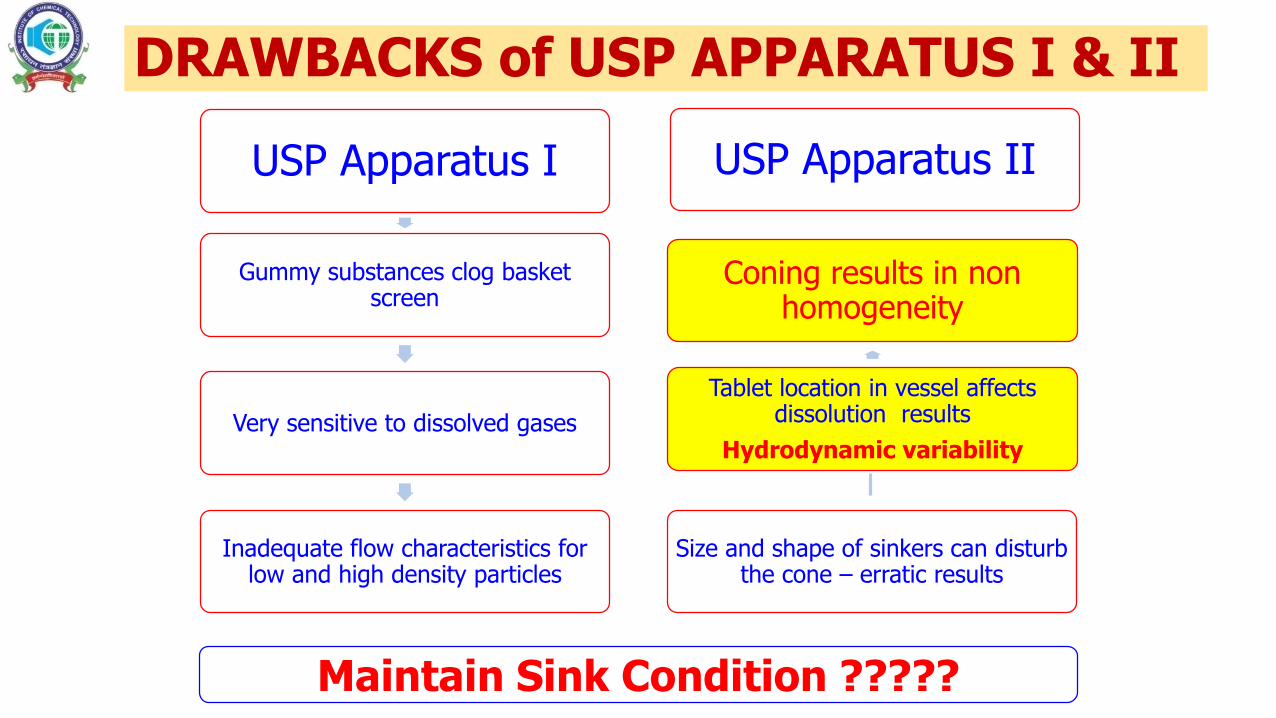
DRAWBACKS of USP APPARATUS I & II
USP Apparatus I
Gummy substances clog basket screen
Very sensitive to dissolved gases
Inadequate flow characteristics for low and high density particles
USP Apparatus II
Tablet location in vessel affects dissolution results
Hydrodynamic variability
Coning results in non homogeneity
Size and shape of sinkers can disturb the cone – erratic results
Maintain Sink Condition ?????
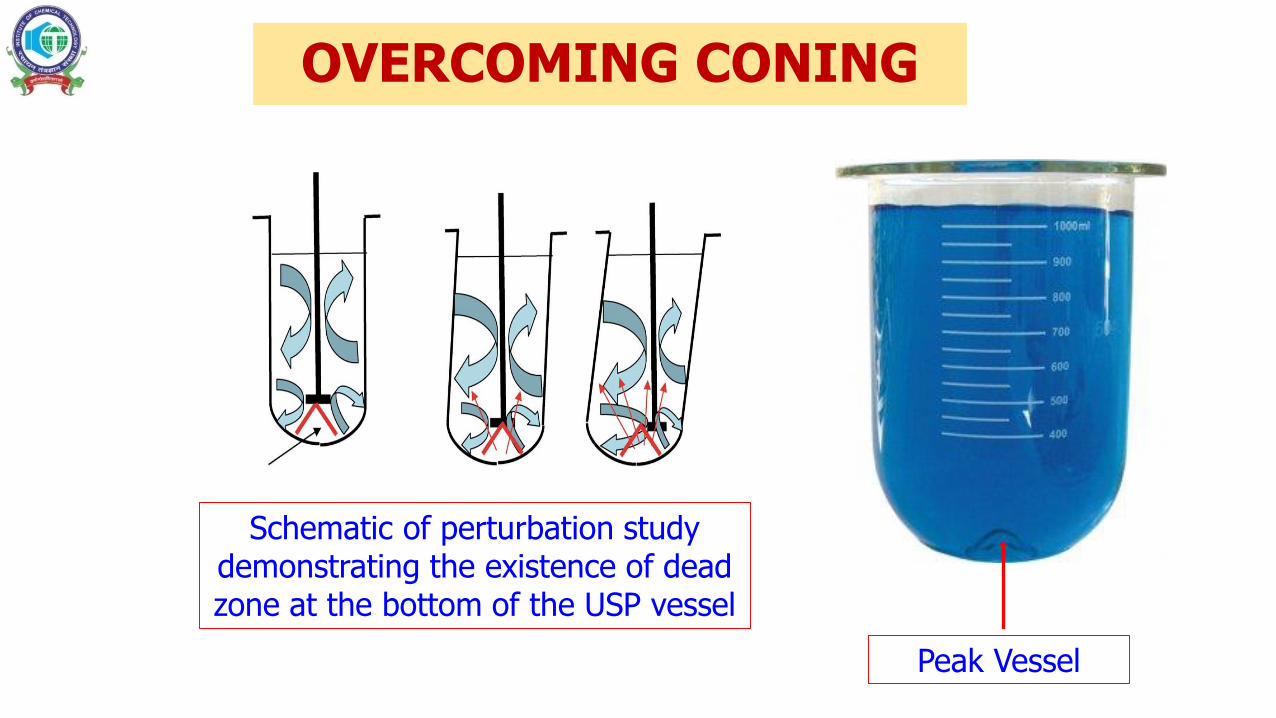
OVERCOMING CONING
Schematic of perturbation study demonstrating the existence of dead zone at the bottom of the USP vessel
Peak Vessel
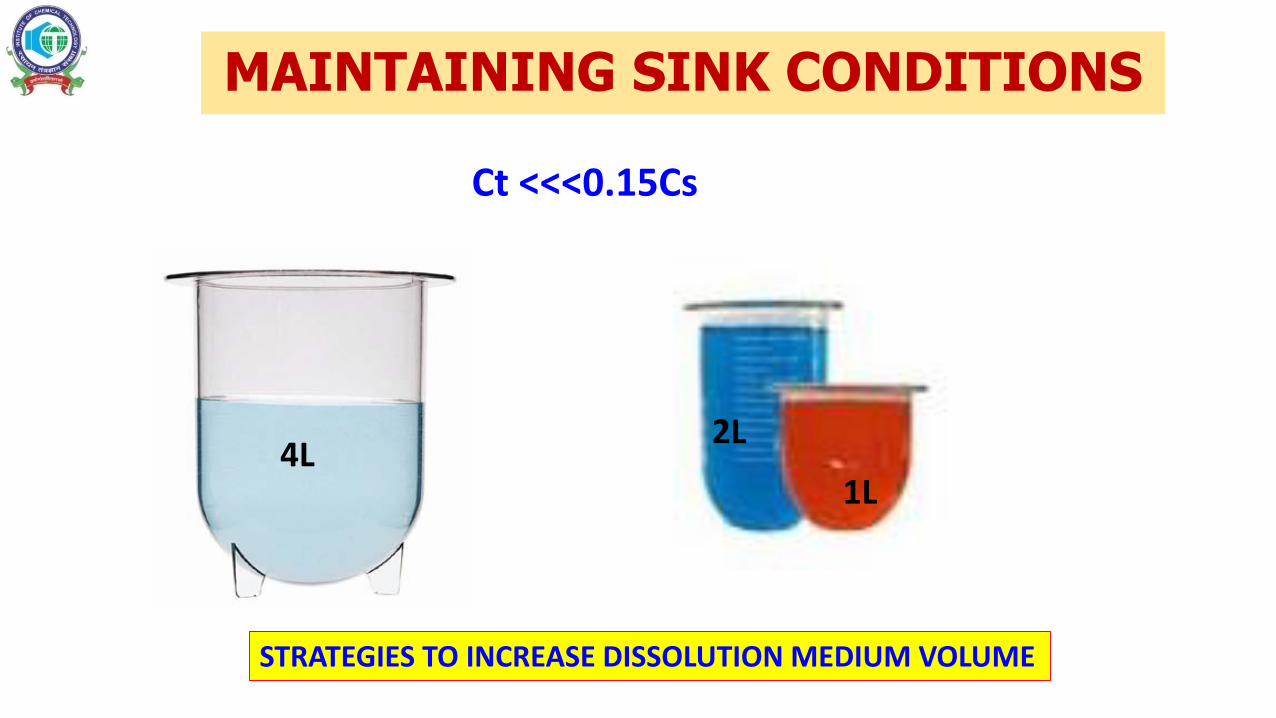
MAINTAINING SINK CONDITIONS
Ct <<<0.15Cs
2L
1L4L
STRATEGIES TO INCREASE DISSOLUTION MEDIUM VOLUME
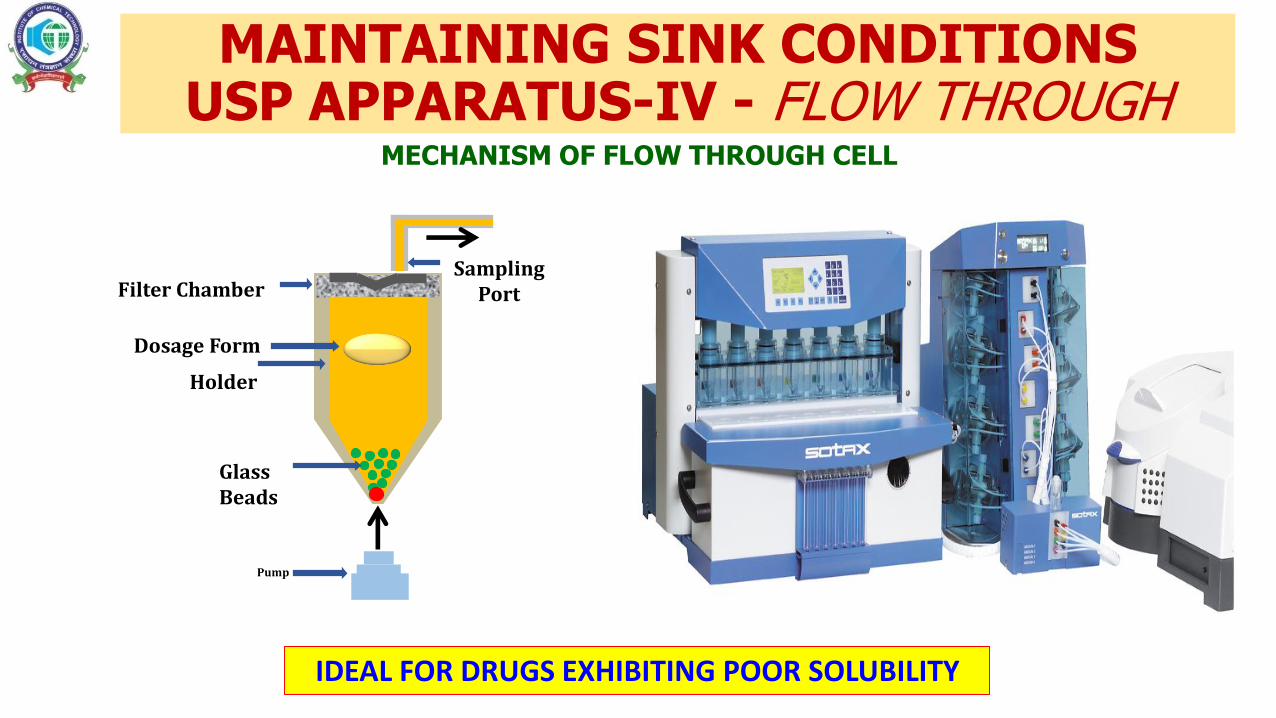
Filter Chamber
Dosage Form
Holder
Glass Beads
Sampling Port
Pump
MAINTAINING SINK CONDITIONSUSP APPARATUS-IV - FLOW THROUGH
MECHANISM OF FLOW THROUGH CELL
IDEAL FOR DRUGS EXHIBITING POOR SOLUBILITY
16
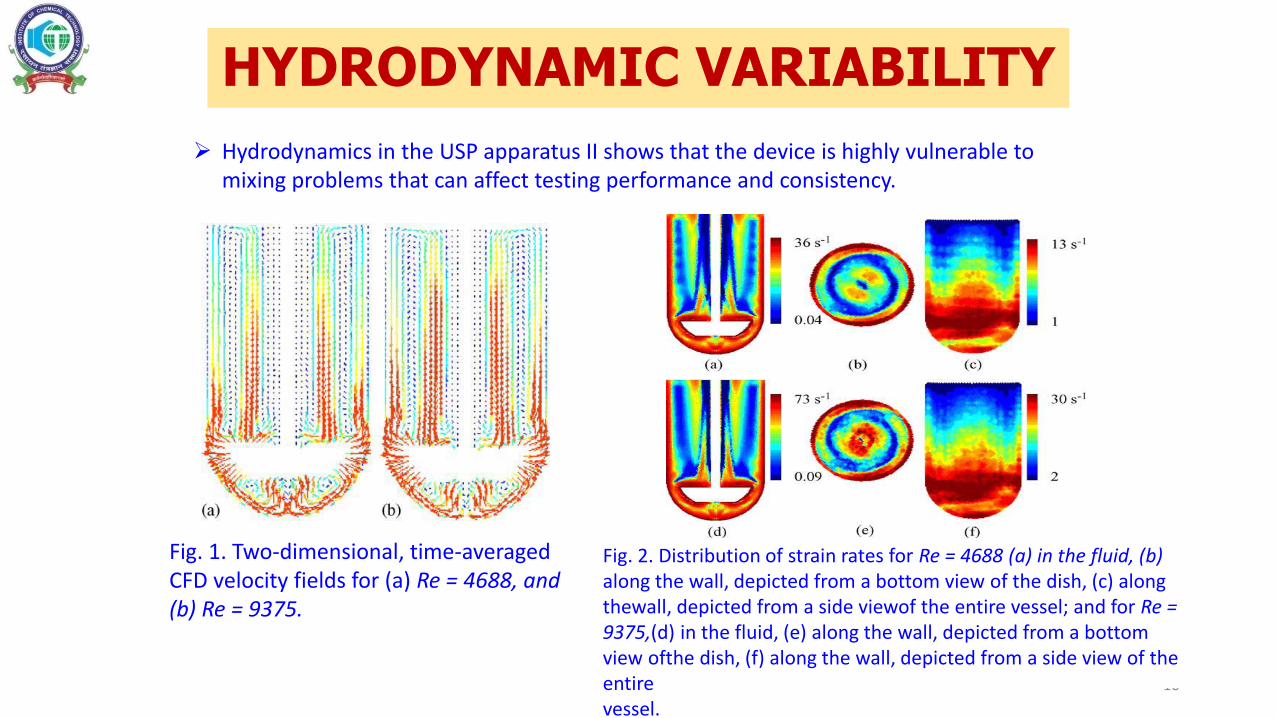
Fig. 1. Two-dimensional, time-averaged CFD velocity fields for (a) Re = 4688, and (b) Re = 9375.
Fig. 2. Distribution of strain rates for Re = 4688 (a) in the fluid, (b) along the wall, depicted from a bottom view of the dish, (c) along thewall, depicted from a side viewof the entire vessel; and for Re = 9375,(d) in the fluid, (e) along the wall, depicted from a bottom view ofthe dish, (f) along the wall, depicted from a side view of the entirevessel.
HYDRODYNAMIC VARIABILITY
Hydrodynamics in the USP apparatus II shows that the device is highly vulnerable to mixing problems that can affect testing performance and consistency.
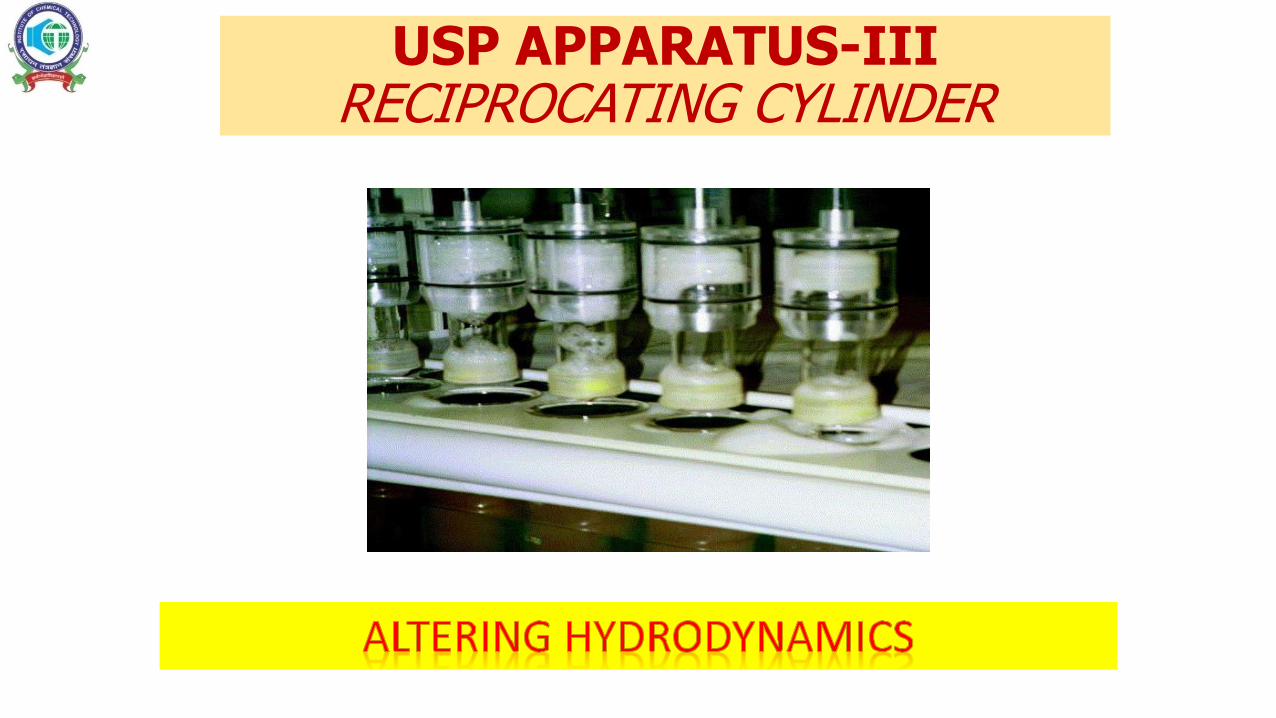
USP APPARATUS-III RECIPROCATING CYLINDER
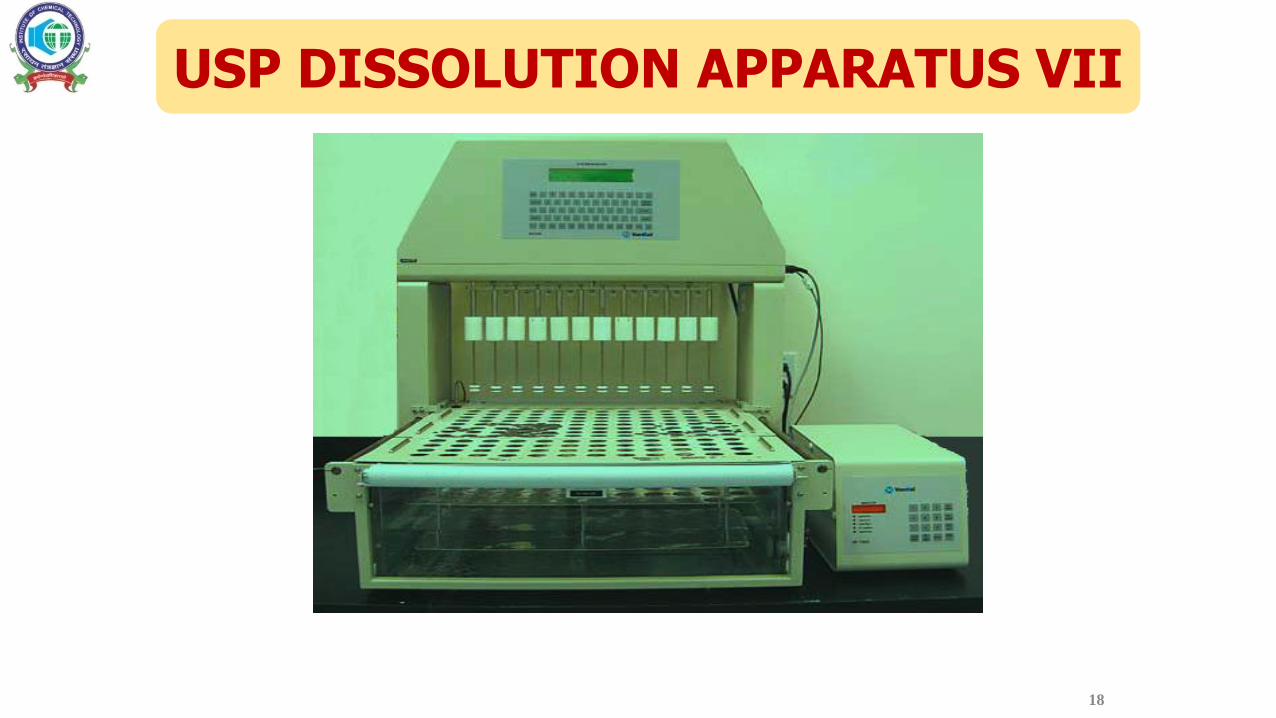
USP DISSOLUTION APPARATUS VII
18
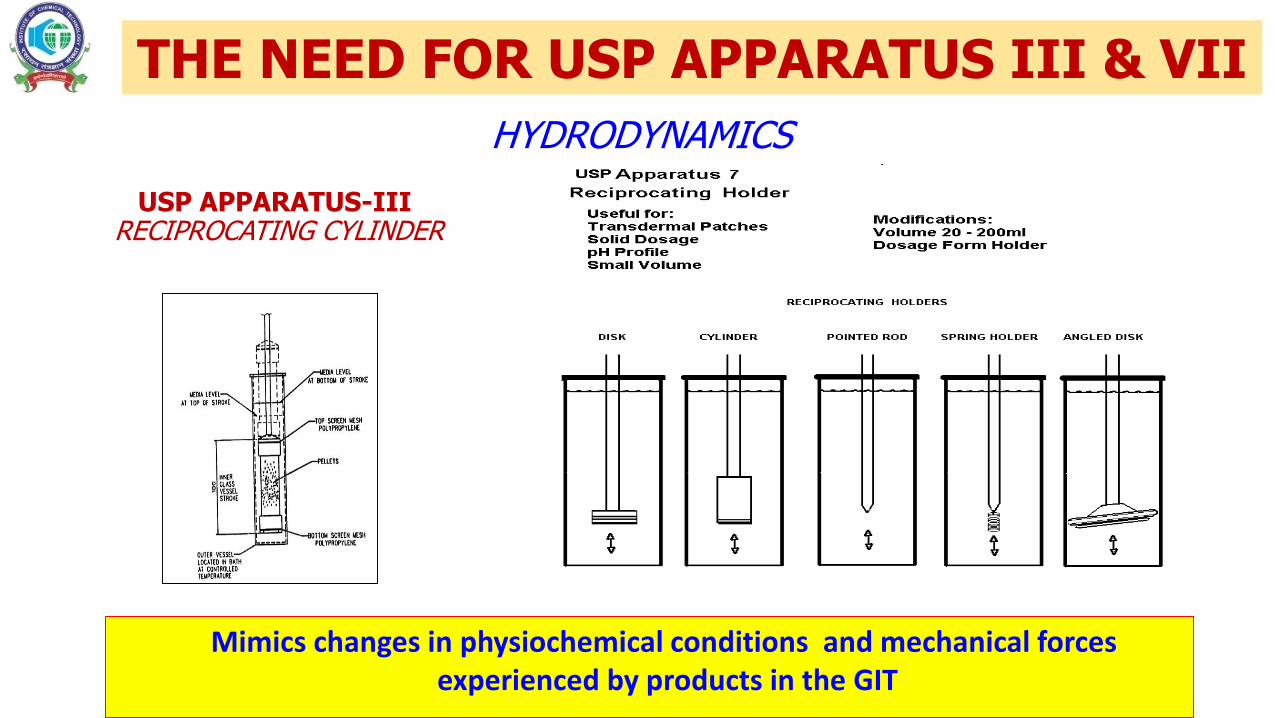
USP APPARATUS-IIIRECIPROCATING CYLINDER
THE NEED FOR USP APPARATUS III & VII
Mimics changes in physiochemical conditions and mechanical forces experienced by products in the GIT
HYDRODYNAMICS
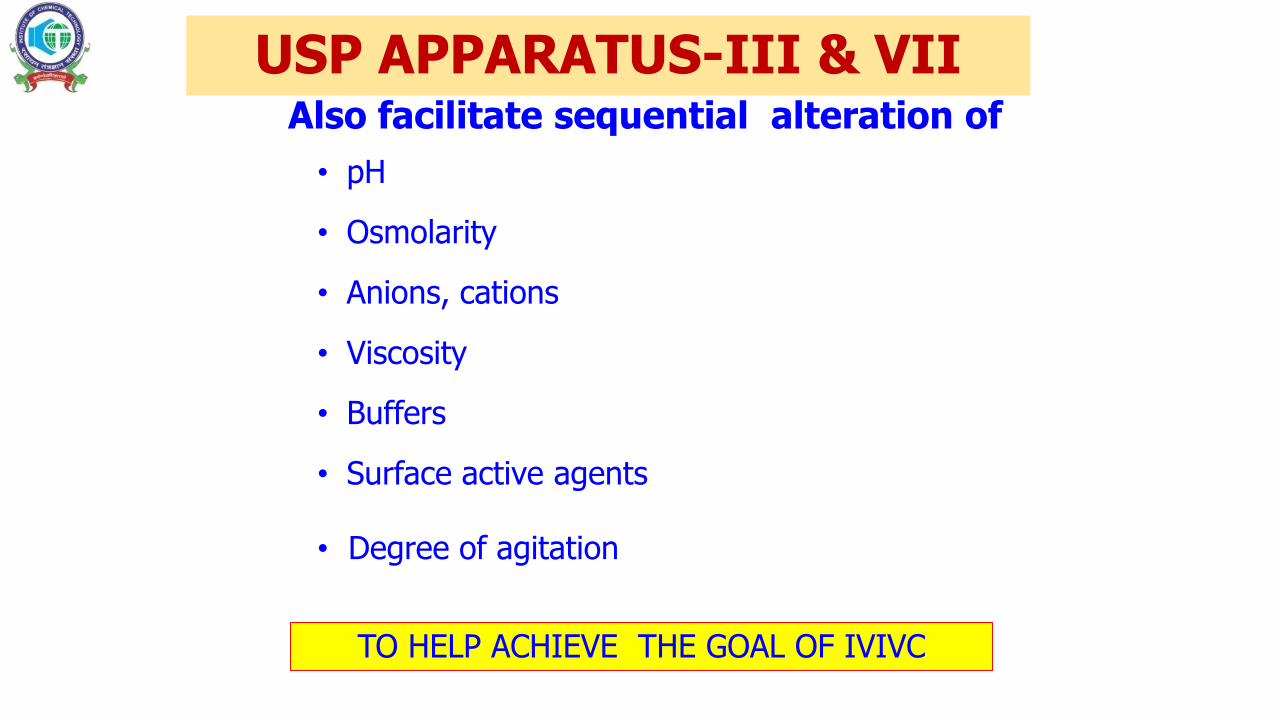
USP APPARATUS-III & VIIAlso facilitate sequential alteration of
• pH
• Osmolarity
• Anions, cations
• Viscosity
• Buffers
• Surface active agents
• Degree of agitation
TO HELP ACHIEVE THE GOAL OF IVIVC
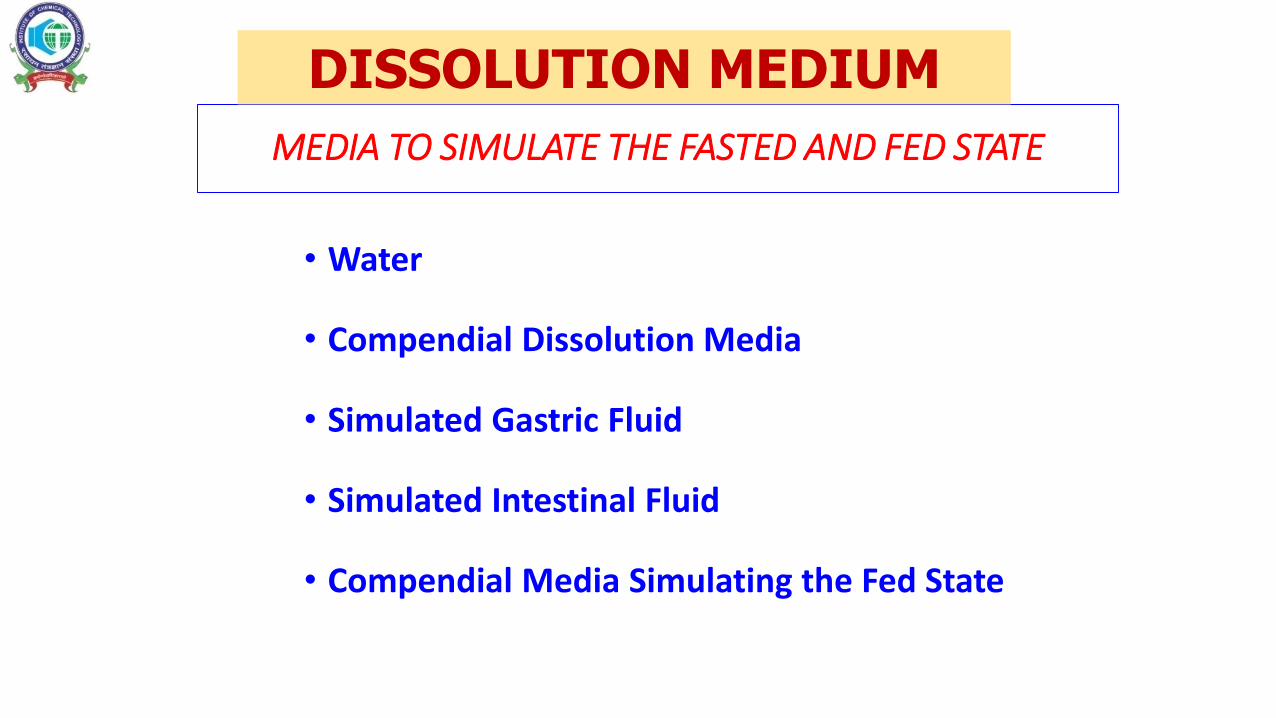
MEDIA TO SIMULATE THE FASTED AND FED STATE
• Water
• Compendial Dissolution Media
• Simulated Gastric Fluid
• Simulated Intestinal Fluid
• Compendial Media Simulating the Fed State
DISSOLUTION MEDIUM
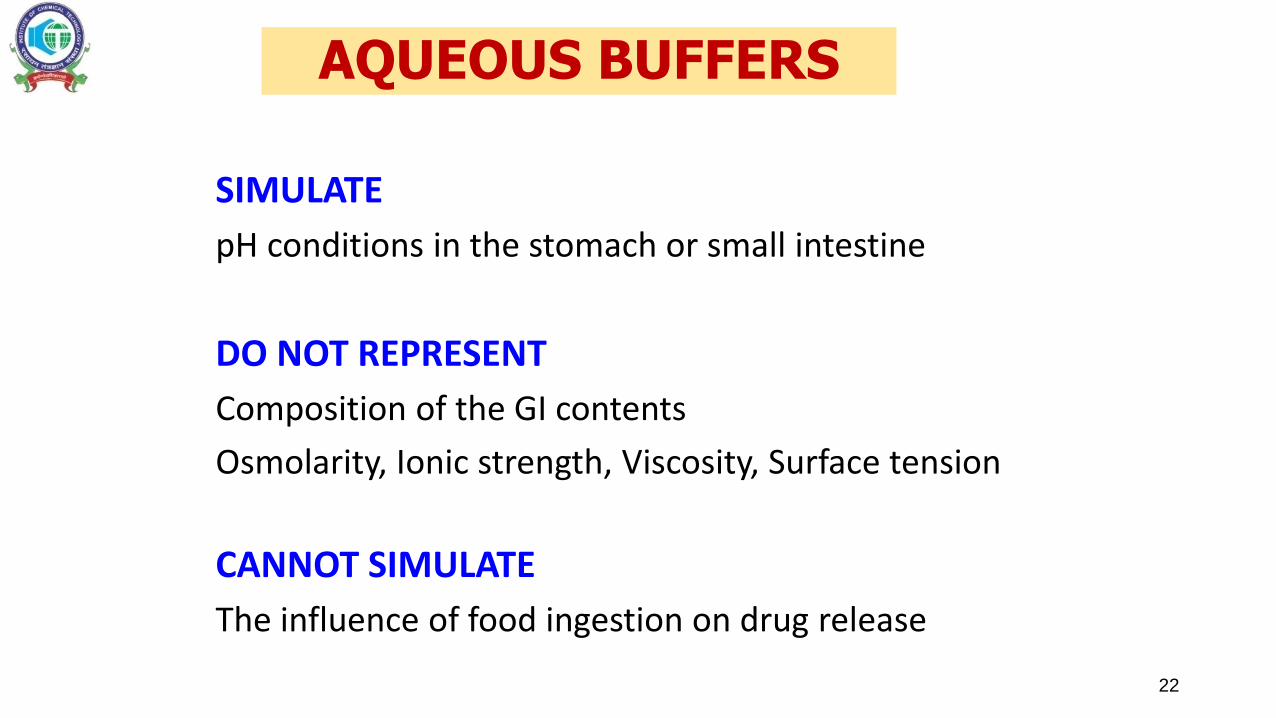
SIMULATE
pH conditions in the stomach or small intestine
DO NOT REPRESENT
Composition of the GI contents
Osmolarity, Ionic strength, Viscosity, Surface tension
CANNOT SIMULATE
The influence of food ingestion on drug release
22
AQUEOUS BUFFERS
23
Useful for qualitative forecasting of formulation and food effects
Can provide a more accurate simulation of pharmacokinetic profiles
Have a great impact on the pharmacokinetic studies performed to optimize
dosing conditions and product formulation
Could be used to assess bioequivalence of post-approval formulation
changes in certain kinds of formulations
BIORELEVANT MEDIA
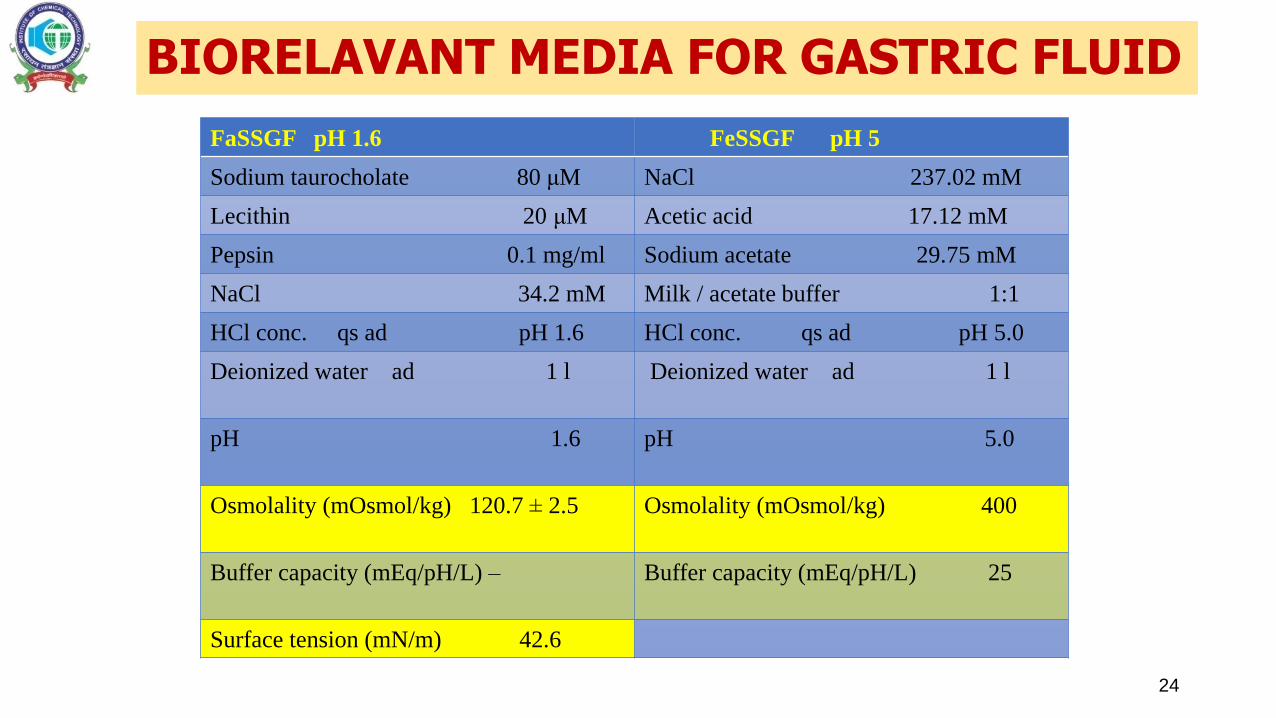
BIORELAVANT MEDIA FOR GASTRIC FLUID
24
FaSSGF pH 1.6 FeSSGF pH 5
Sodium taurocholate 80 μM NaCl 237.02 mM
Lecithin 20 μM Acetic acid 17.12 mM
Pepsin 0.1 mg/ml Sodium acetate 29.75 mM
NaCl 34.2 mM Milk / acetate buffer 1:1
HCl conc. qs ad pH 1.6 HCl conc. qs ad pH 5.0
Deionized water ad 1 l Deionized water ad 1 l
pH 1.6 pH 5.0
Osmolality (mOsmol/kg) 120.7 ± 2.5 Osmolality (mOsmol/kg) 400
Buffer capacity (mEq/pH/L) – Buffer capacity (mEq/pH/L) 25
Surface tension (mN/m) 42.6
25
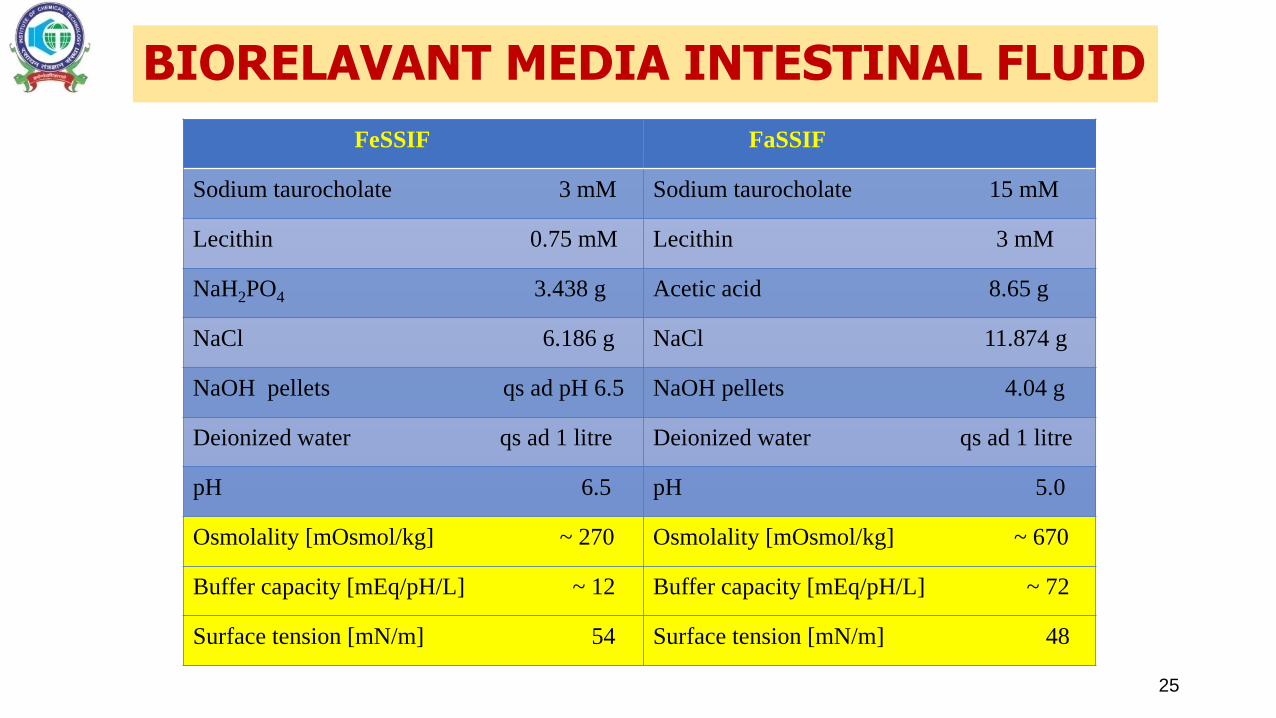
FeSSIF FaSSIF
Sodium taurocholate 3 mM Sodium taurocholate 15 mM
Lecithin 0.75 mM Lecithin 3 mM
NaH2PO4 3.438 g Acetic acid 8.65 g
NaCl 6.186 g NaCl 11.874 g
NaOH pellets qs ad pH 6.5 NaOH pellets 4.04 g
Deionized water qs ad 1 litre Deionized water qs ad 1 litre
pH 6.5 pH 5.0
Osmolality [mOsmol/kg] ~ 270 Osmolality [mOsmol/kg] ~ 670
Buffer capacity [mEq/pH/L] ~ 12 Buffer capacity [mEq/pH/L] ~ 72
Surface tension [mN/m] 54 Surface tension [mN/m] 48
BIORELAVANT MEDIA INTESTINAL FLUID
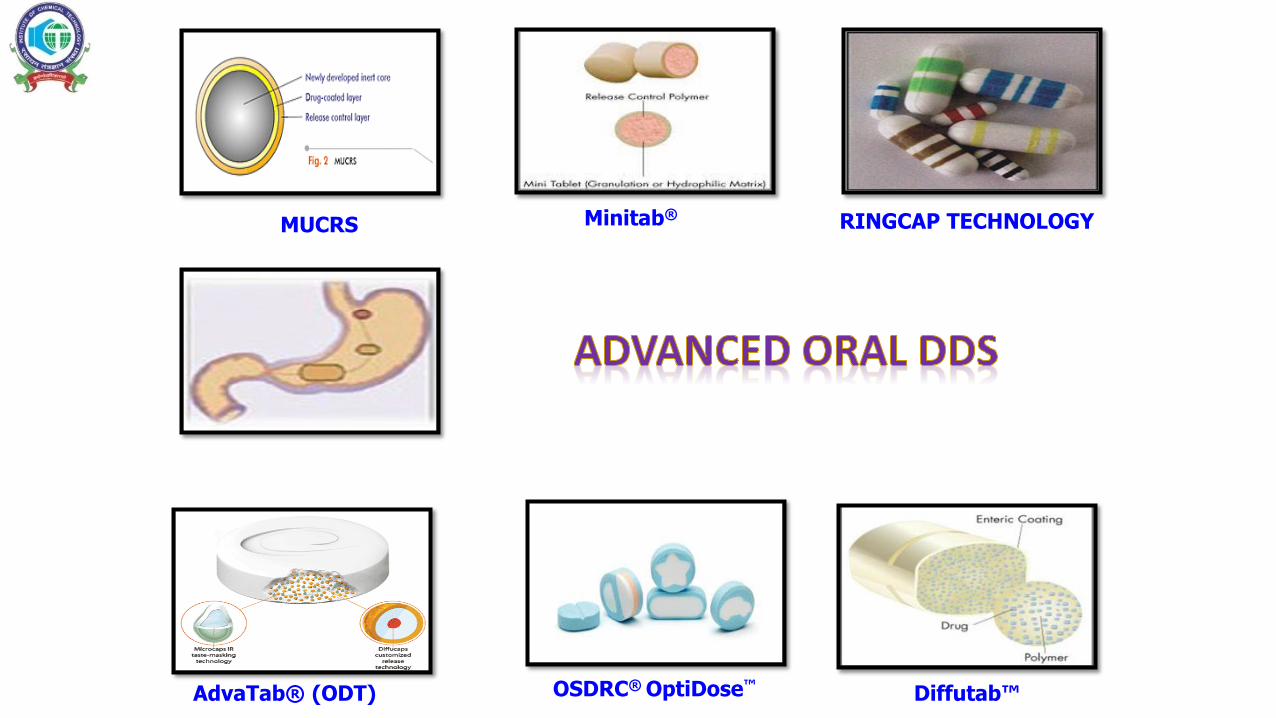
OSDRC® OptiDose™AdvaTab® (ODT)
RINGCAP TECHNOLOGYMUCRS Minitab®
Diffutab™
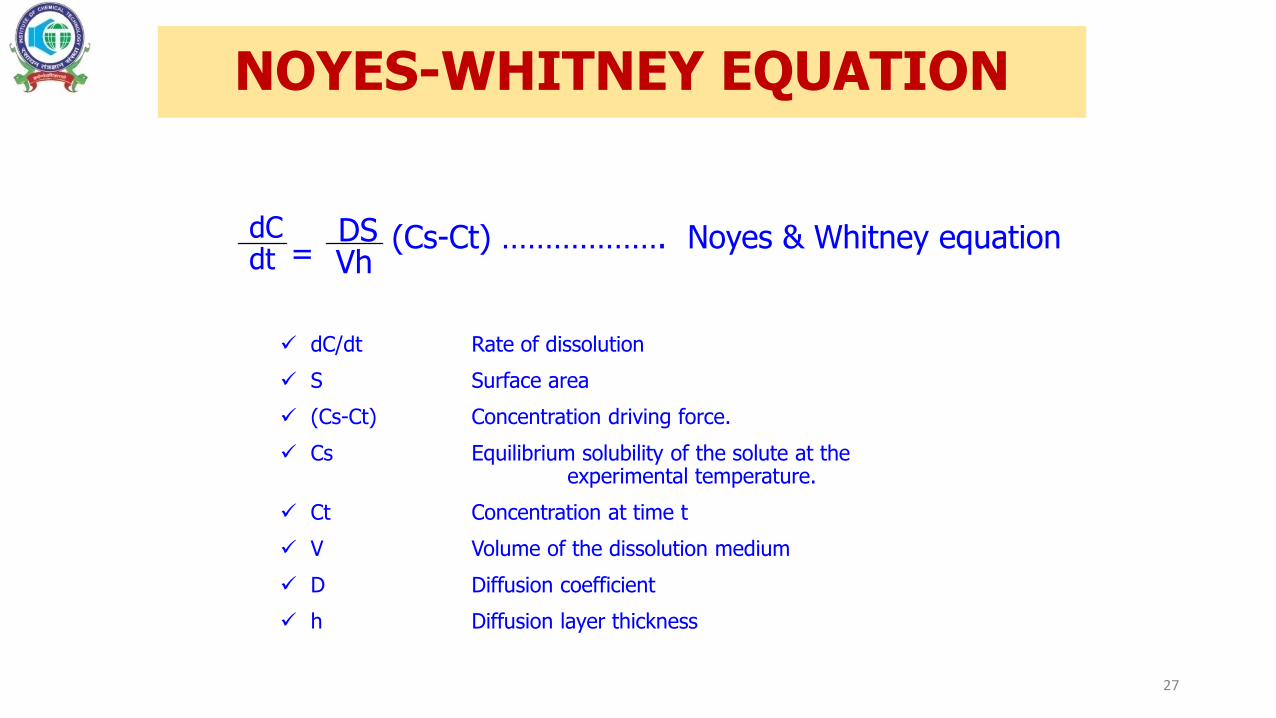
NOYES-WHITNEY EQUATION
27
dC/dt Rate of dissolution
S Surface area
(Cs-Ct) Concentration driving force.
Cs Equilibrium solubility of the solute at the experimental temperature.
Ct Concentration at time t
V Volume of the dissolution medium
D Diffusion coefficient
h Diffusion layer thickness
=DSdC
dt(Cs-Ct) ………………. Noyes & Whitney equation
Vh
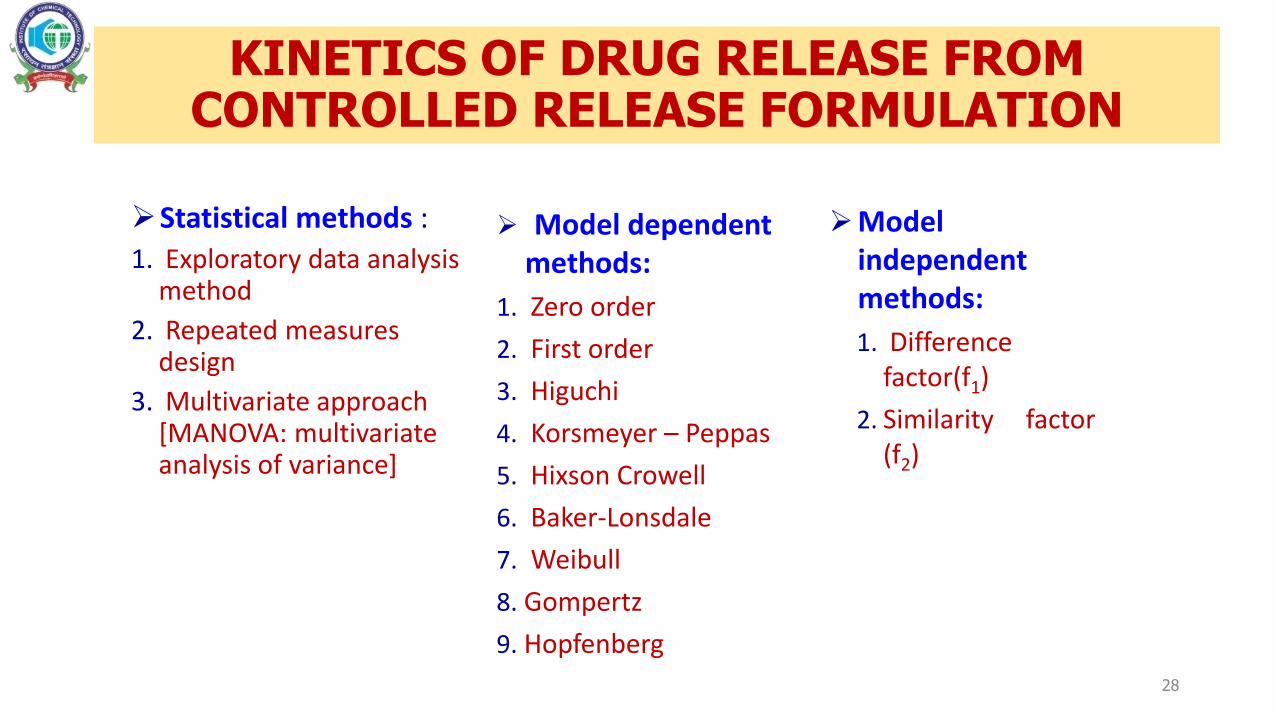
KINETICS OF DRUG RELEASE FROM CONTROLLED RELEASE FORMULATION
28
Statistical methods :
1. Exploratory data analysis method
2. Repeated measures design
3. Multivariate approach [MANOVA: multivariate analysis of variance]
Model dependent methods:
1. Zero order
2. First order
3. Higuchi
4. Korsmeyer – Peppas
5. Hixson Crowell
6. Baker-Lonsdale
7. Weibull
8. Gompertz
9. Hopfenberg
Modelindependentmethods:
1. Differencefactor(f1)
2. Similarity factor(f2)
29
This relationship can be used to describe the drug
dissolution of several types of modified release
pharmaceutical dosage forms, as in the case of some
transdermal systems, as well as matrix tablets with low
soluble drugs in coated forms, osmotic systems, etc.
APPLICATION ZERO-ORDER MODEL
30
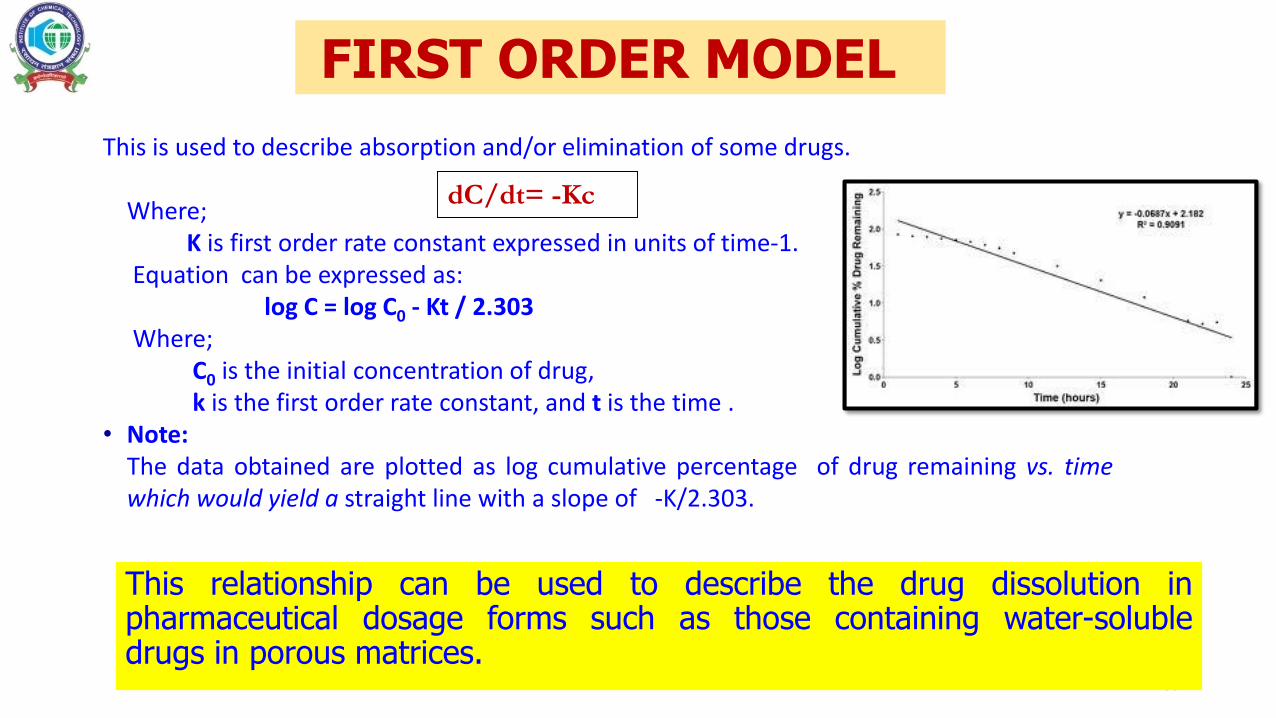
This is used to describe absorption and/or elimination of some drugs.
Where;K is first order rate constant expressed in units of time-1.
Equation can be expressed as:log C = log C0 - Kt / 2.303
Where;C0 is the initial concentration of drug,k is the first order rate constant, and t is the time .
• Note:The data obtained are plotted as log cumulative percentage of drug remaining vs. timewhich would yield a straight line with a slope of -K/2.303.
dC/dt= -Kc
FIRST ORDER MODEL
This relationship can be used to describe the drug dissolution inpharmaceutical dosage forms such as those containing water-solubledrugs in porous matrices.
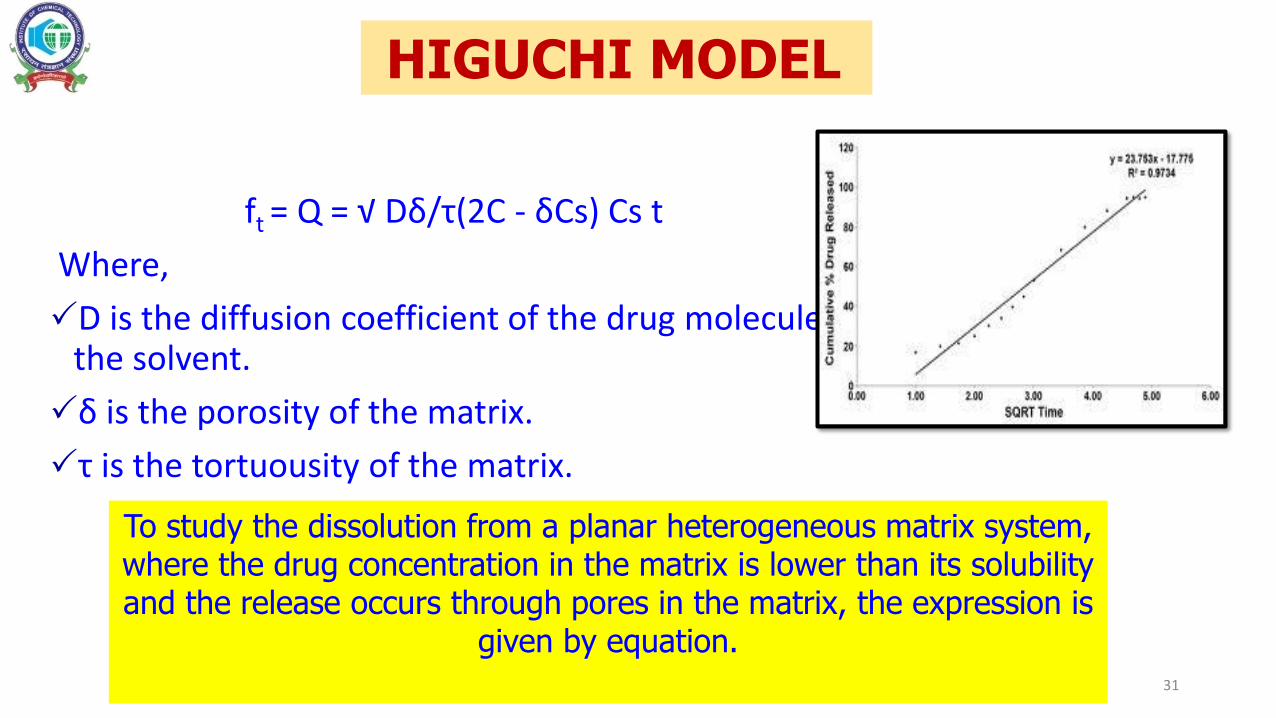
31
ft = Q = √ Dδ/τ(2C - δCs) Cs t
Where,
D is the diffusion coefficient of the drug molecule in the solvent.
δ is the porosity of the matrix.
τ is the tortuousity of the matrix.
HIGUCHI MODEL
To study the dissolution from a planar heterogeneous matrix system, where the drug concentration in the matrix is lower than its solubility and the release occurs through pores in the matrix, the expression is
given by equation.
32
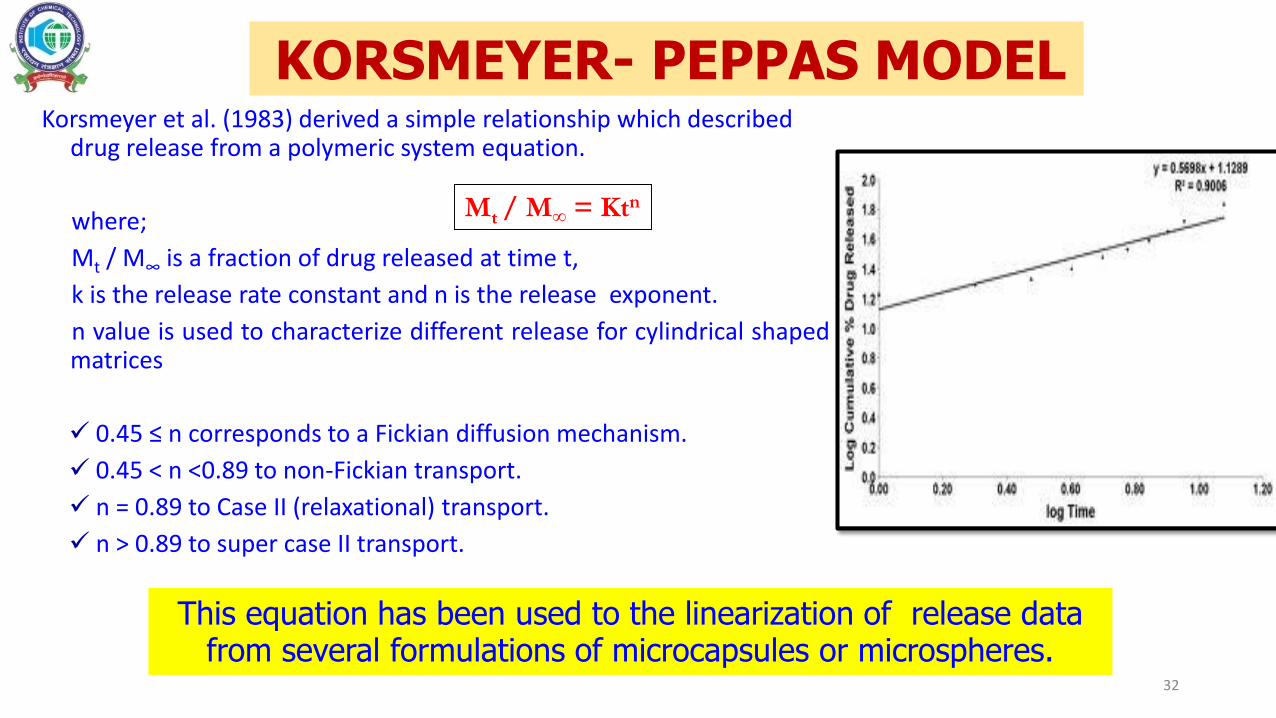
Korsmeyer et al. (1983) derived a simple relationship which described drug release from a polymeric system equation.
where;
Mt / M∞ is a fraction of drug released at time t,
k is the release rate constant and n is the release exponent.
n value is used to characterize different release for cylindrical shapedmatrices
0.45 ≤ n corresponds to a Fickian diffusion mechanism.
0.45 < n <0.89 to non-Fickian transport.
n = 0.89 to Case II (relaxational) transport.
n > 0.89 to super case II transport.
Mt / M∞ = Ktn
KORSMEYER- PEPPAS MODEL
This equation has been used to the linearization of release data from several formulations of microcapsules or microspheres.
33
For comparison of in vitro dissolution profiles, similarity and difference factors are emphasized by US FDA.
Similarity Factor (f2):
The similarity factor should be between 0 and 100.
It is 100 when two comparative groups of reference and test are identical and approaches 0 as the dissimilarity increases
Similarity factor > 50 indicates comparable profiles
Difference factor (f1) F1< 15 indicates similarity in profiles
The dissolution profiles can be compared only when number of dissolution units used are equal to or greater than 12. The similarity factor should be computed from the average mean dissolution data of 12 units. The mean data for comparison can be used only if the coefficient of variation at the first time point is NMT 20%, and NLT 10% at the rest of time intervals.
For accurate calculation of similarity factor, statistical approach of establishment of confidence intervals, to determine whether the reference and test are statistically significant or not may be used.
MODEL INDEPENDENT APPROACH
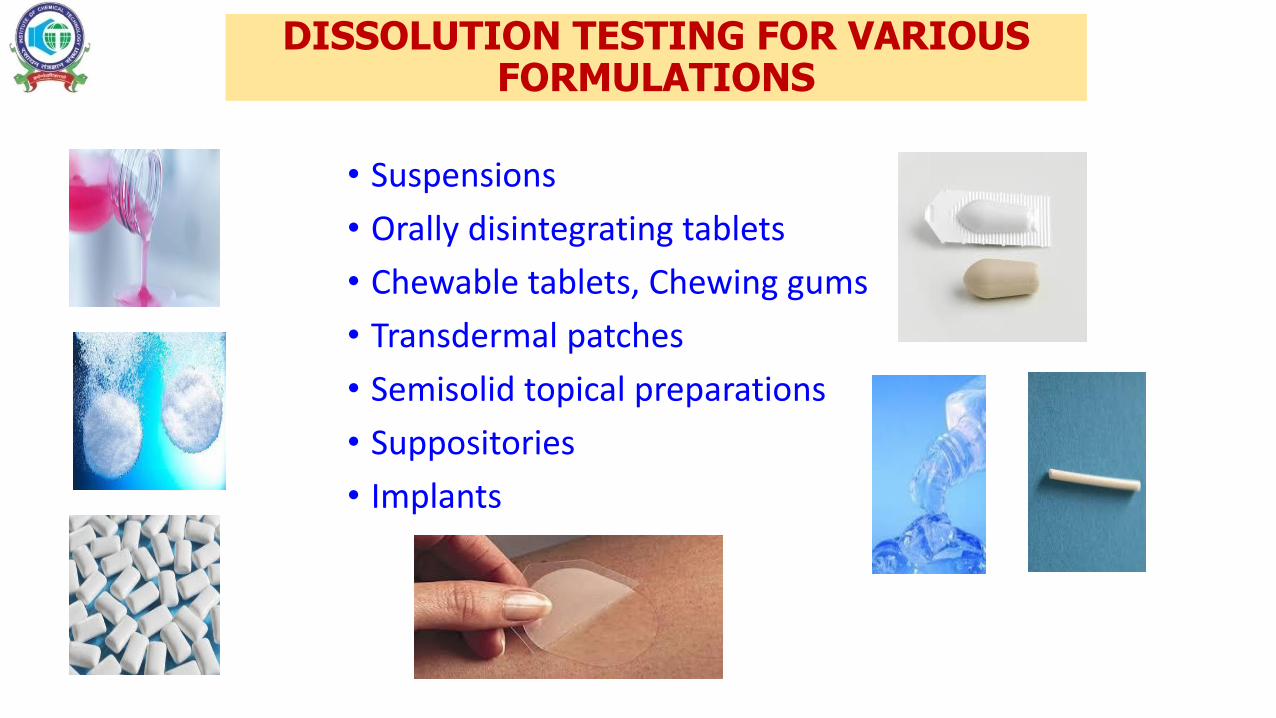
DISSOLUTION TESTING FOR VARIOUS FORMULATIONS
• Suspensions
• Orally disintegrating tablets
• Chewable tablets, Chewing gums
• Transdermal patches
• Semisolid topical preparations
• Suppositories
• Implants
ORAL SUSPENSIONS
• APPARATUS -USP II
• Method
• Shaking or mixing.
• Sample introduction-
• accurate, precise, and reproducible
• Agitation Rate
• on the basis of the viscosity and composition of the suspension matrix.
• should facilitate discrimination between batches with different release properties.
• For low-viscosity suspensions, A slow agitation rate of 25 rpm is generally
• for high-viscosity samples faster agitation rate such as 50 or 75 rpm to prevent sample mounding at the bottom of the vessel
Ideally, sample weight/volume should reflect a typical dose of the product. However, testing a partial dose— for instance, ≥10% to 20% of the usual product dose—is recommended rather than using a surfactant TO MAINTAIN SINK
ODT• APPARATUS -USP II
• Method
• Agitation Rate • Should facilitate discrimination between batches with different release properties.
• 50RPM
• Higher agitation rates may be necessary in the case of sample mounding.
• Disintegration test as substitute- Discriminating
• Taste Masking• A dissolution criterion (typical example: ≤10% dissolved in 5 minutes) would largely
depend on the taste intensity of the drug and may enable the in vitro evaluation of the taste-masking properties while avoiding organoleptic measurements.
• Multipoint profile in neutral medium
• Challenge• Floating particles/granules
CHEWABLE TABLETS
• Same as that used for regular tablets.
• Based on the possibility that a patient might swallow the dosage form without proper chewing,
• The nondisintegrating nature of the dosage form, it may be necessary to increase the agitation rate and increase the test duration
• The reciprocating cylinder (USP apparatus 3) with the addition of glass beads may also provide more "intensive" agitation
• Mechanical breaking of chewable tablets prior to exposing the specimen to dissolution testing could be considered
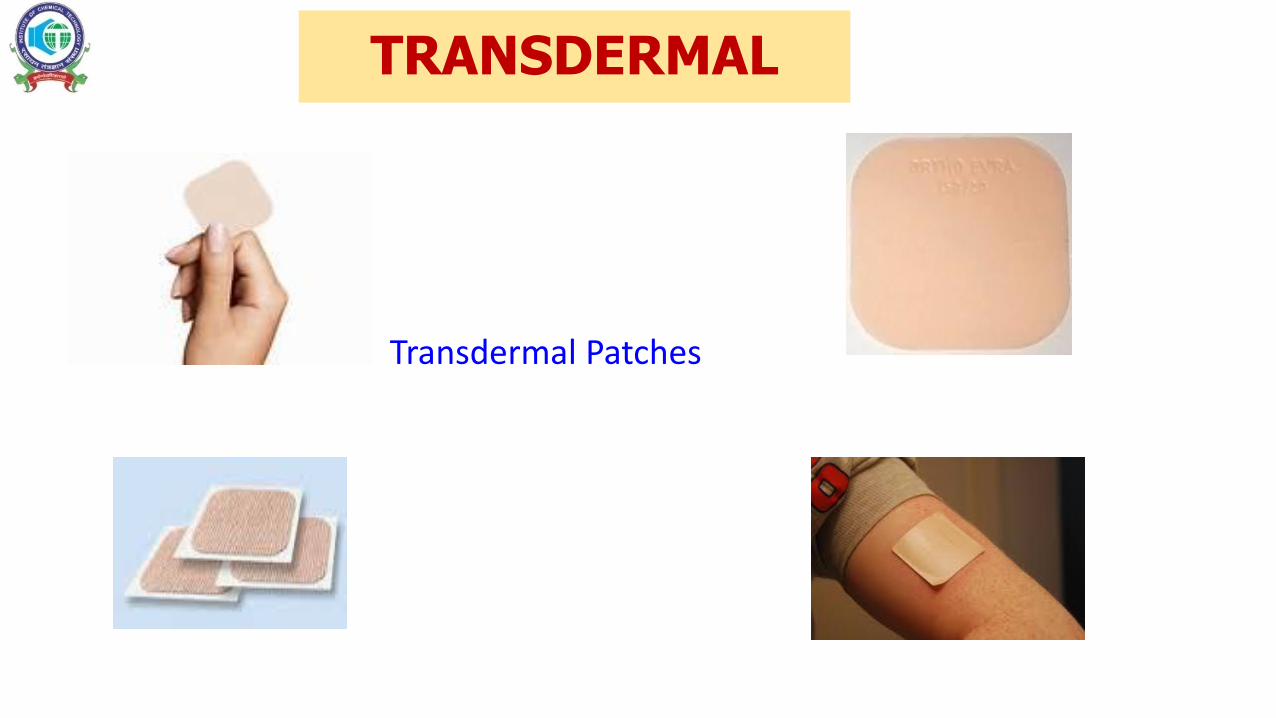
TRANSDERMAL
Transdermal Patches
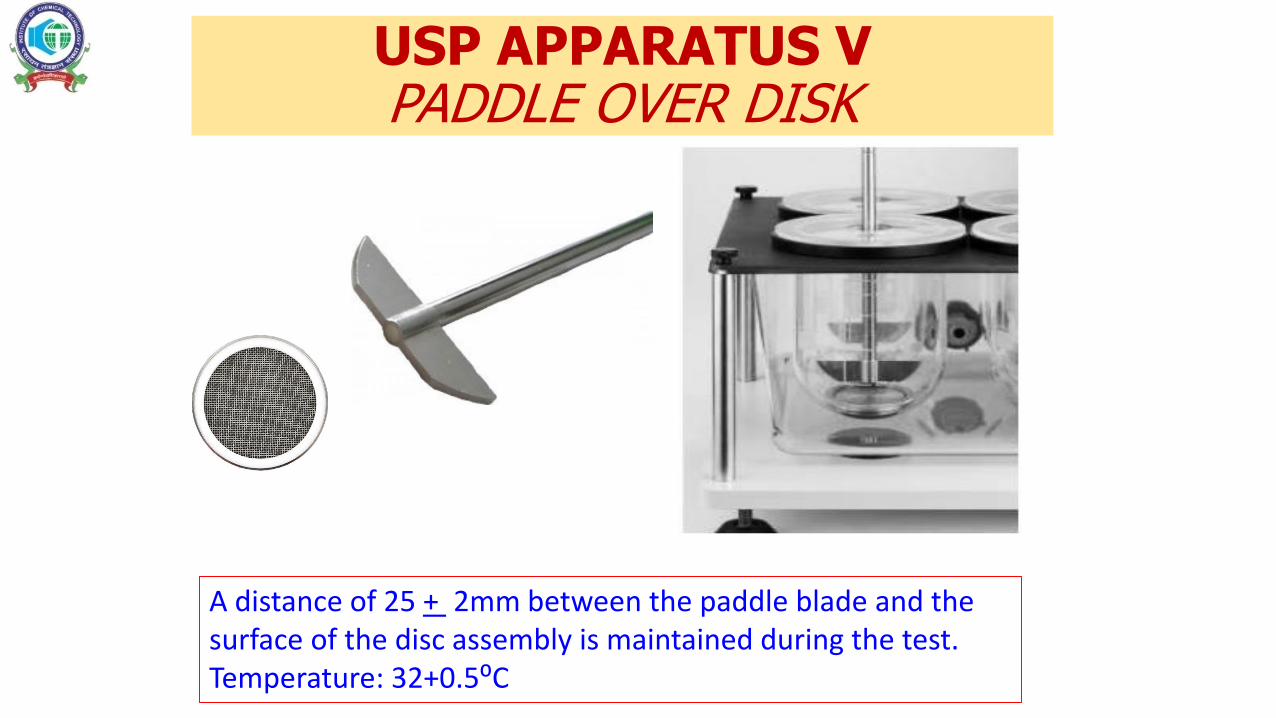
USP APPARATUS V PADDLE OVER DISK
A distance of 25 + 2mm between the paddle blade and the surface of the disc assembly is maintained during the test. Temperature: 32+0.5⁰C
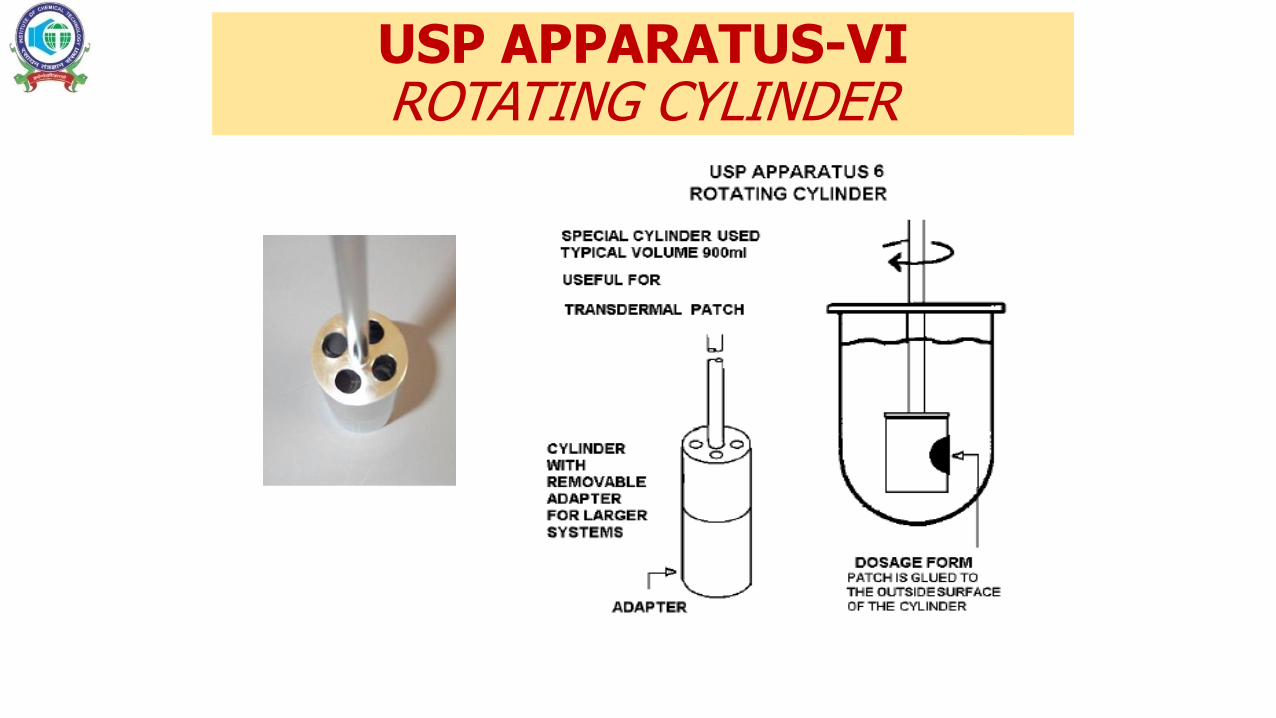
USP APPARATUS-VI ROTATING CYLINDER
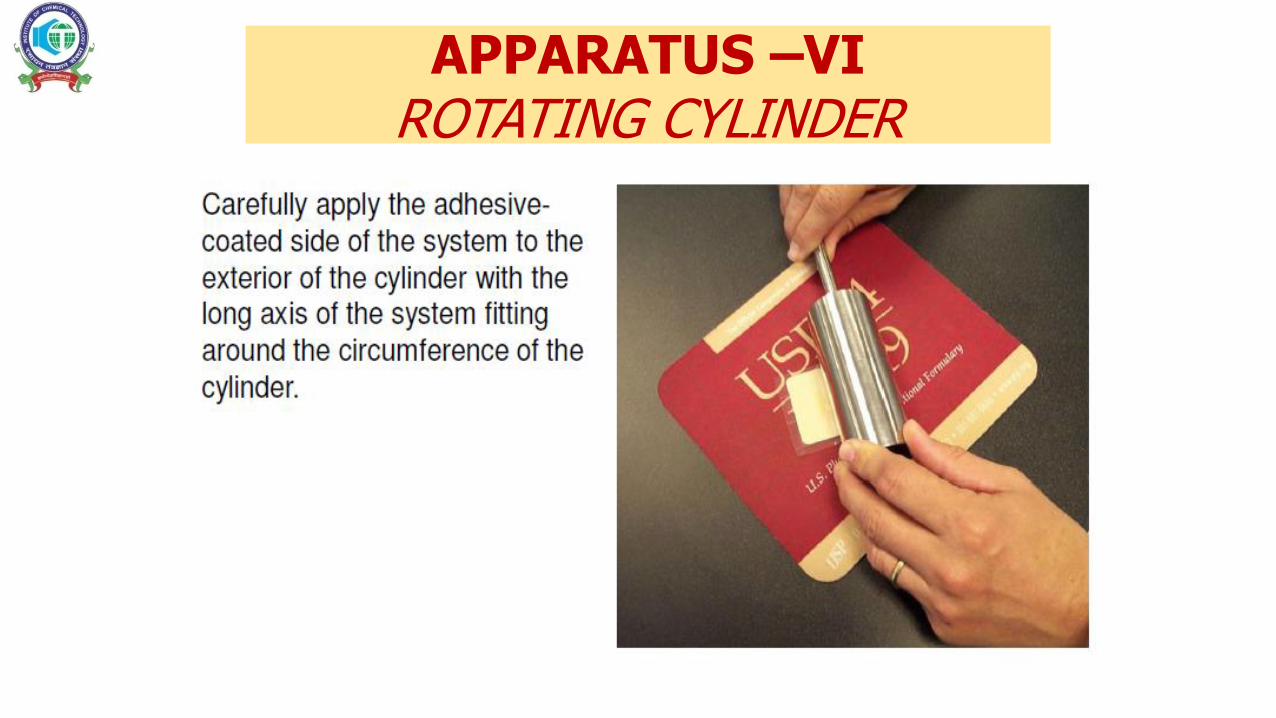
APPARATUS –VIROTATING CYLINDER
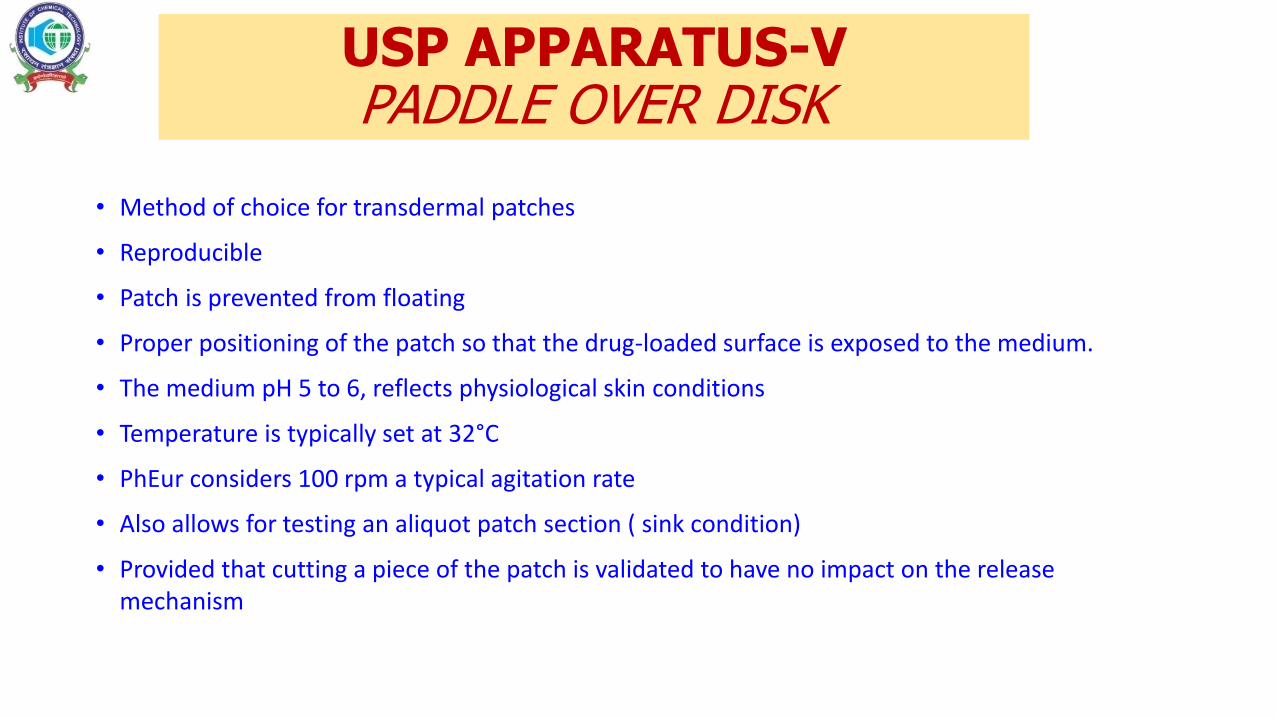
• Method of choice for transdermal patches
• Reproducible
• Patch is prevented from floating
• Proper positioning of the patch so that the drug-loaded surface is exposed to the medium.
• The medium pH 5 to 6, reflects physiological skin conditions
• Temperature is typically set at 32°C
• PhEur considers 100 rpm a typical agitation rate
• Also allows for testing an aliquot patch section ( sink condition)
• Provided that cutting a piece of the patch is validated to have no impact on the release mechanism
USP APPARATUS-V PADDLE OVER DISK
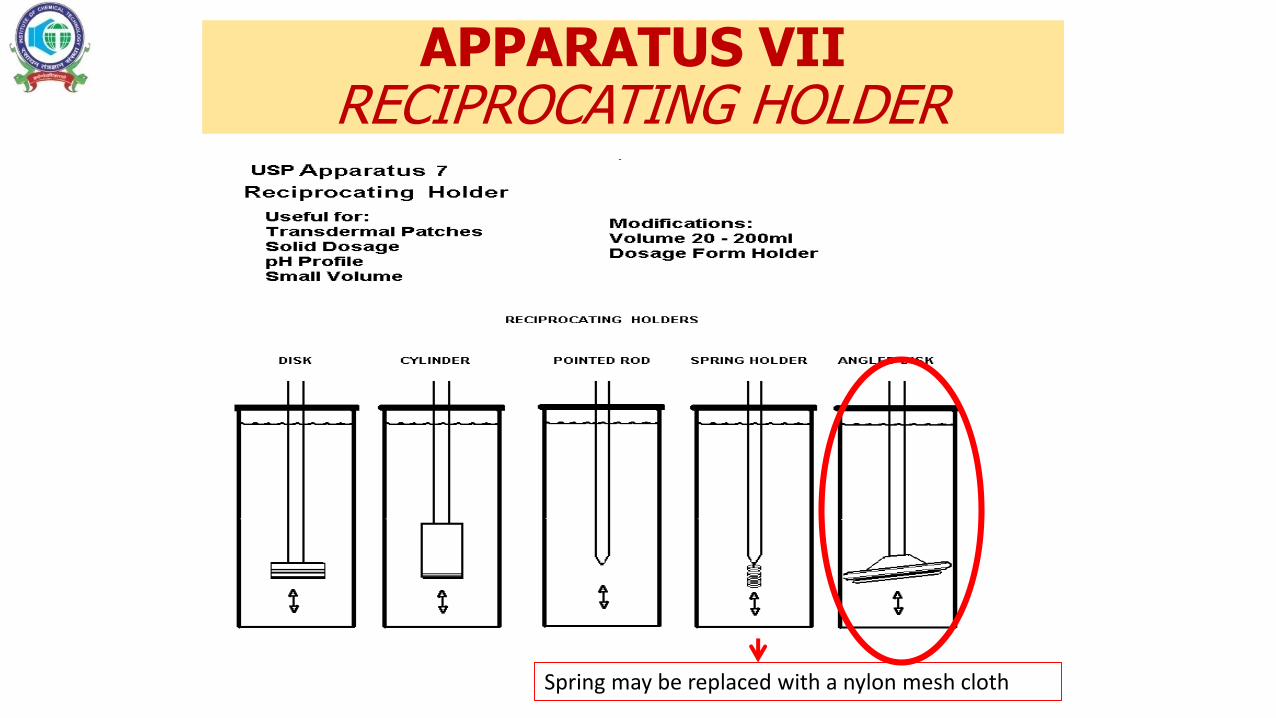
APPARATUS VIIRECIPROCATING HOLDER
Spring may be replaced with a nylon mesh cloth
TOPICAL
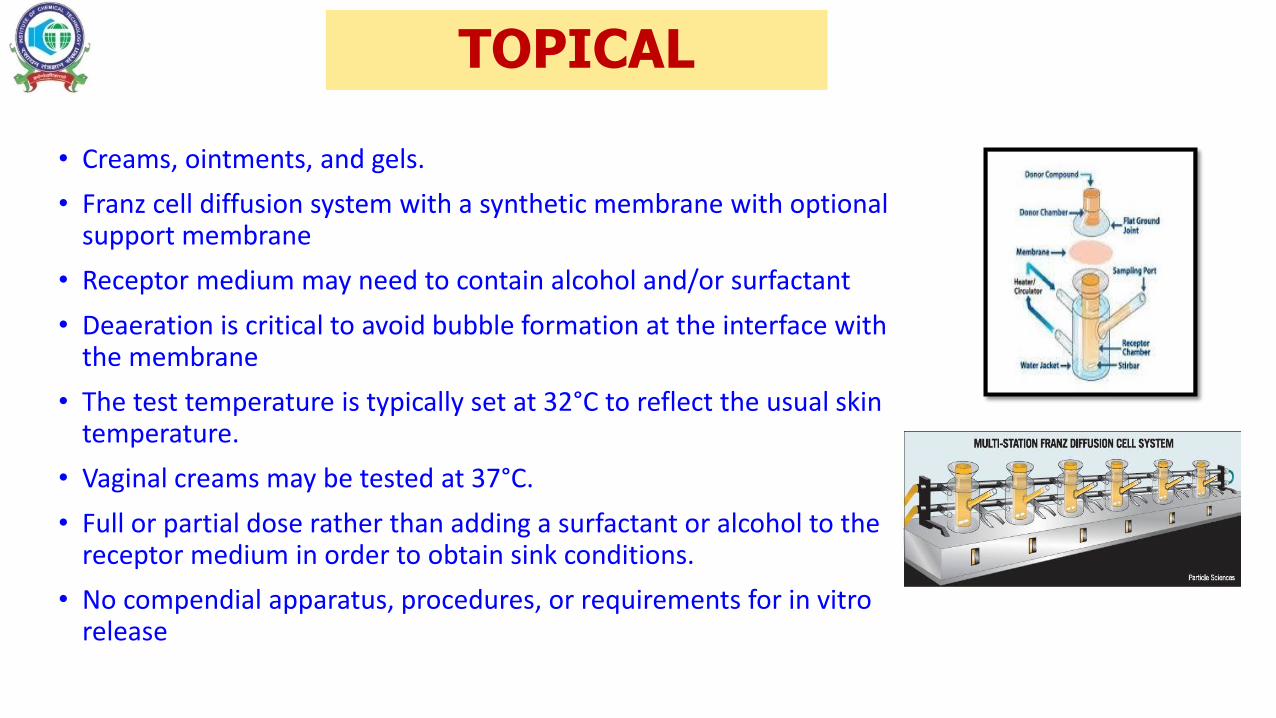
• Creams, ointments, and gels.
• Franz cell diffusion system with a synthetic membrane with optional support membrane
• Receptor medium may need to contain alcohol and/or surfactant
• Deaeration is critical to avoid bubble formation at the interface with the membrane
• The test temperature is typically set at 32°C to reflect the usual skin temperature.
• Vaginal creams may be tested at 37°C.
• Full or partial dose rather than adding a surfactant or alcohol to the receptor medium in order to obtain sink conditions.
• No compendial apparatus, procedures, or requirements for in vitro release
SUPPOSITORIES
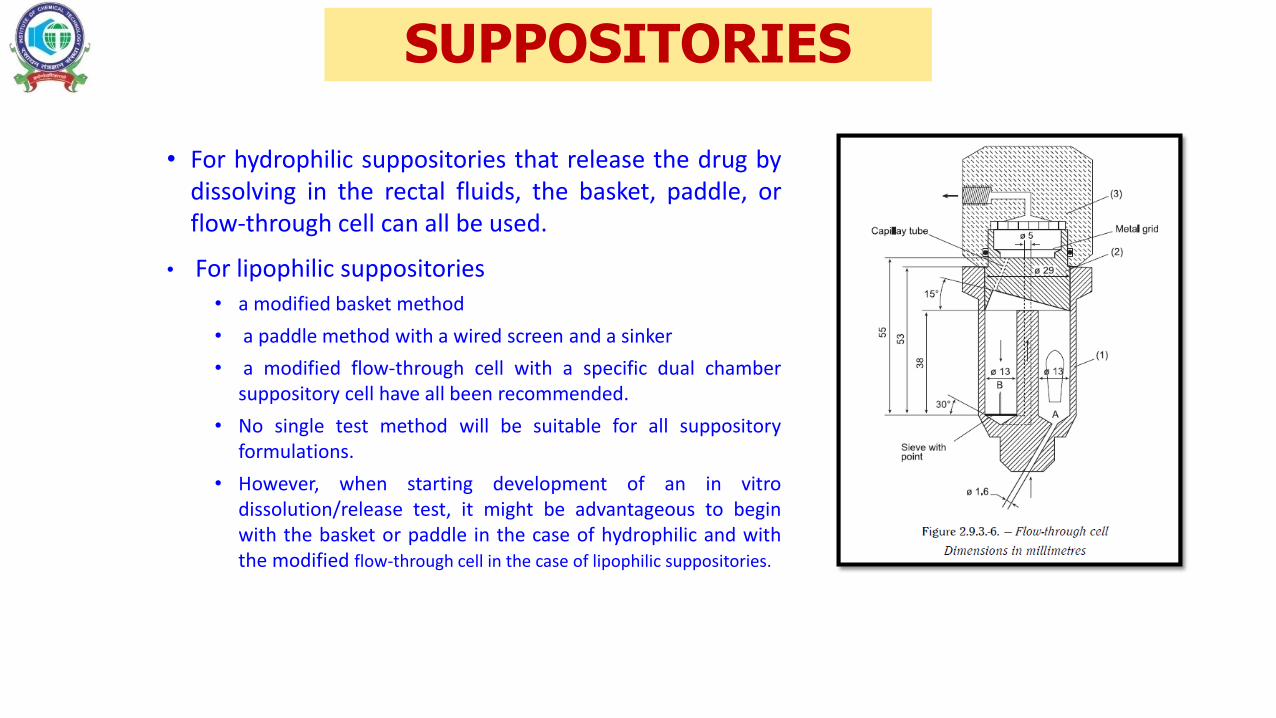
• For hydrophilic suppositories that release the drug bydissolving in the rectal fluids, the basket, paddle, orflow-through cell can all be used.
• For lipophilic suppositories
• a modified basket method
• a paddle method with a wired screen and a sinker
• a modified flow-through cell with a specific dual chambersuppository cell have all been recommended.
• No single test method will be suitable for all suppositoryformulations.
• However, when starting development of an in vitrodissolution/release test, it might be advantageous to beginwith the basket or paddle in the case of hydrophilic and withthe modified flow-through cell in the case of lipophilic suppositories.
IMPLANTS
• The compendial and the modified flow-through cell have been used successfully for implants
• Static or rotating bottles have also been used for in vitro release testing.
• Flow-through apparatus with low volume of fluid , slow flow rate
• Intermittent flow might also be an option.
• As tests are often run over a long time period (eg, several weeks to months), measures have to be taken to compensate against evaporation.
• Suitable preservatives may be added to prevent microbial contamination
• The osmolarity, pH, and buffer capacity of the with lower buffer capacity.
• Main challenges
• to determine the appropriate duration of the test
• times at which samples are to be drawn
• The possibility of running the test under accelerated conditions (temperatures even above glass transition temperatures of the polymers involved) and at pH values offering faster drug release
47
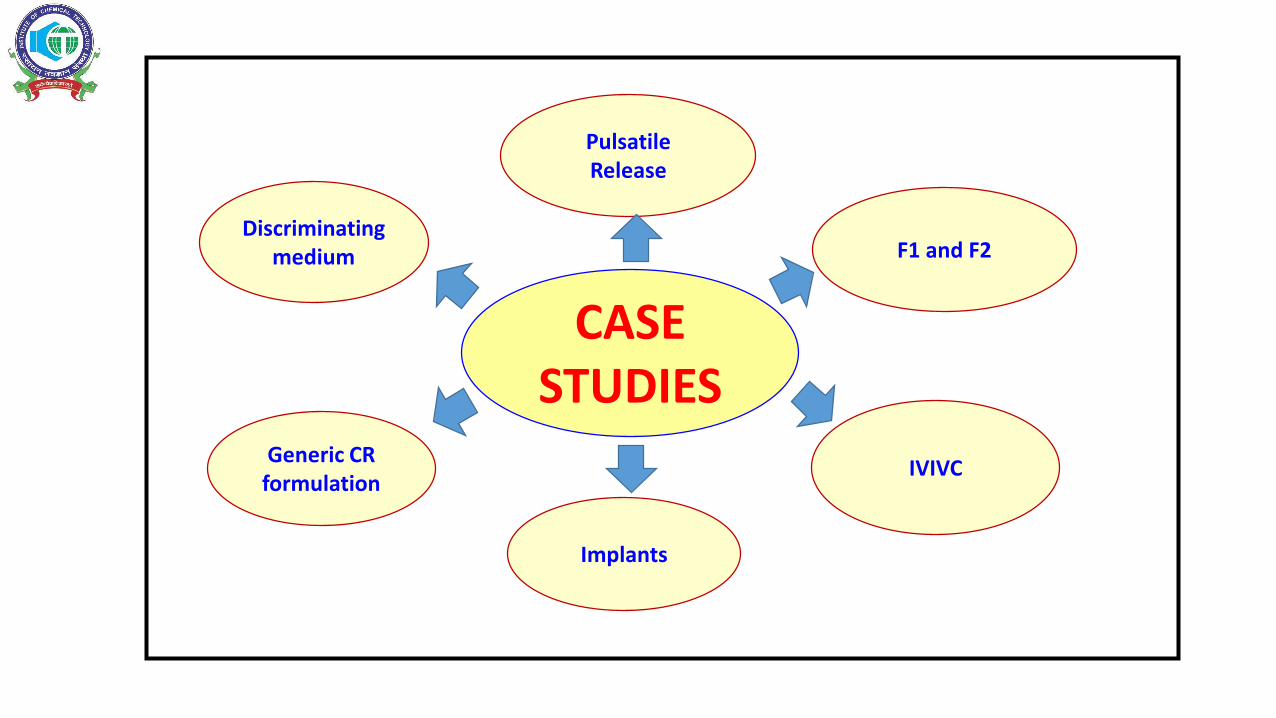
CASE STUDIES
Discriminating medium F1 and F2
Pulsatile Release
IVIVCGeneric CR
formulation
Implants
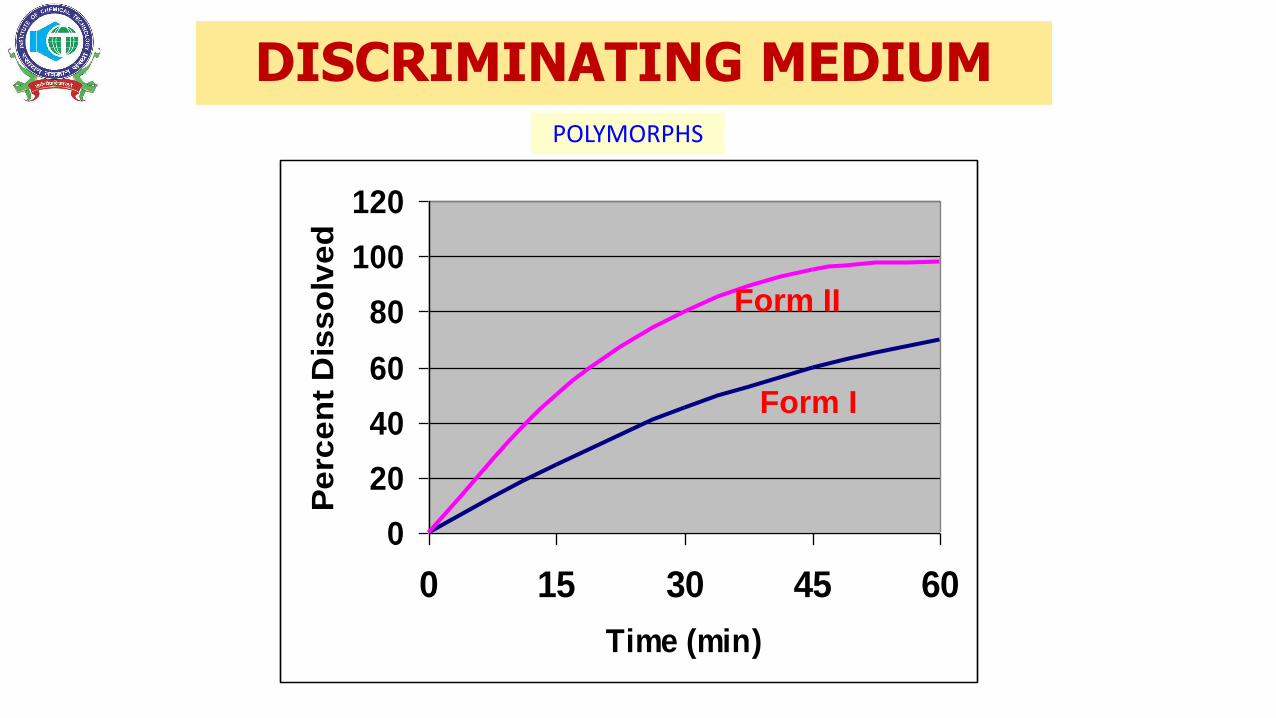
DISCRIMINATING MEDIUM
0
20
40
60
80
100
120
0 15 30 45 60
Time (min)
Pe
rce
nt
Dis
so
lve
dForm II
Form I
POLYMORPHS
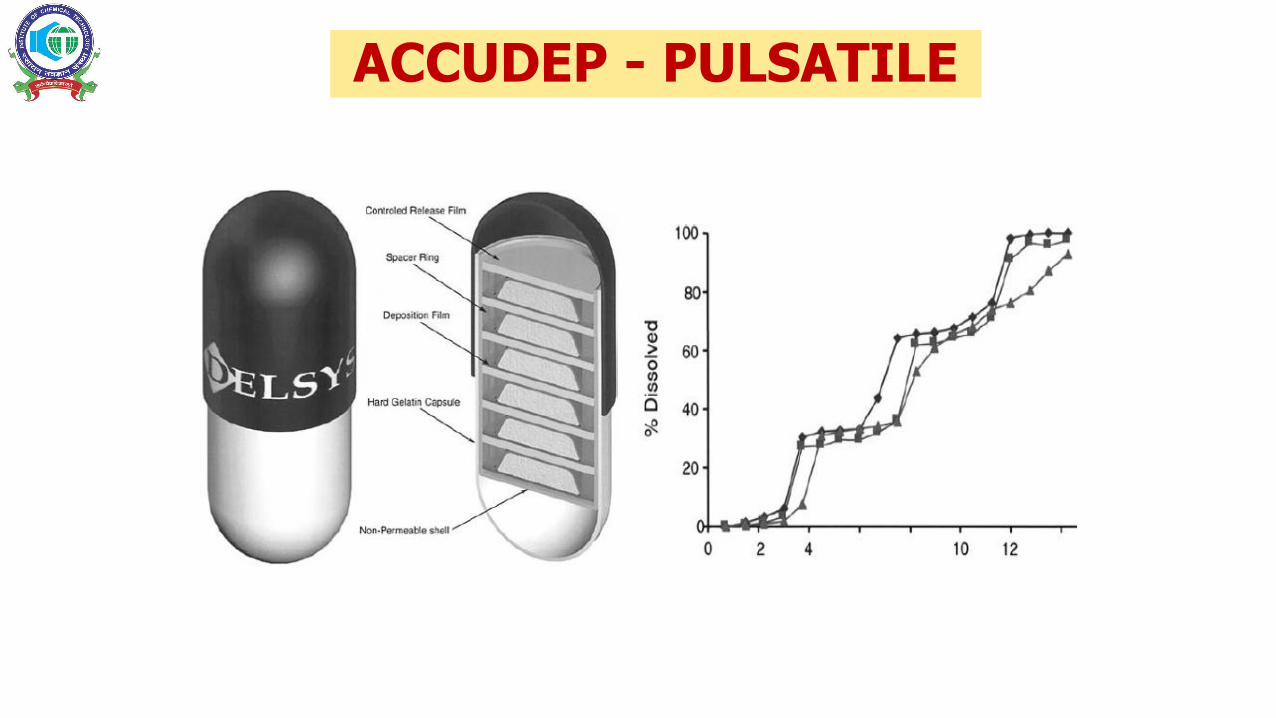
ACCUDEP - PULSATILE
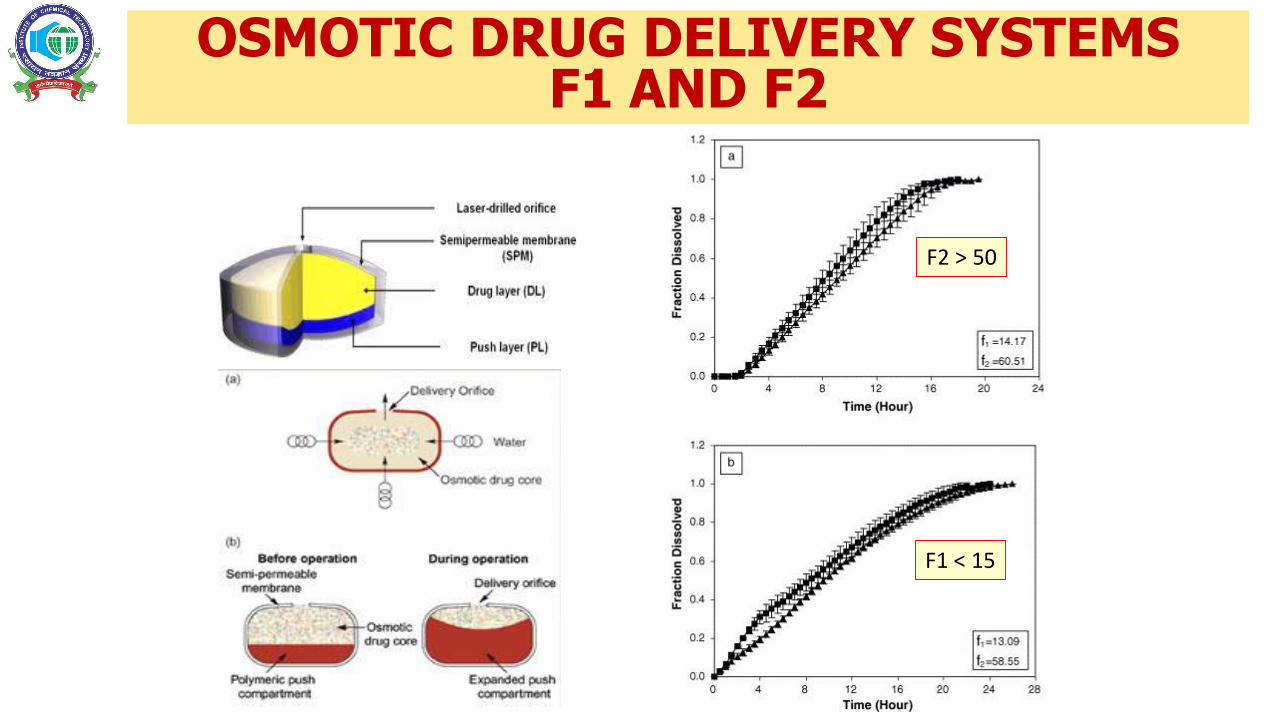
OSMOTIC DRUG DELIVERY SYSTEMSF1 AND F2
F2 > 50
F1 < 15
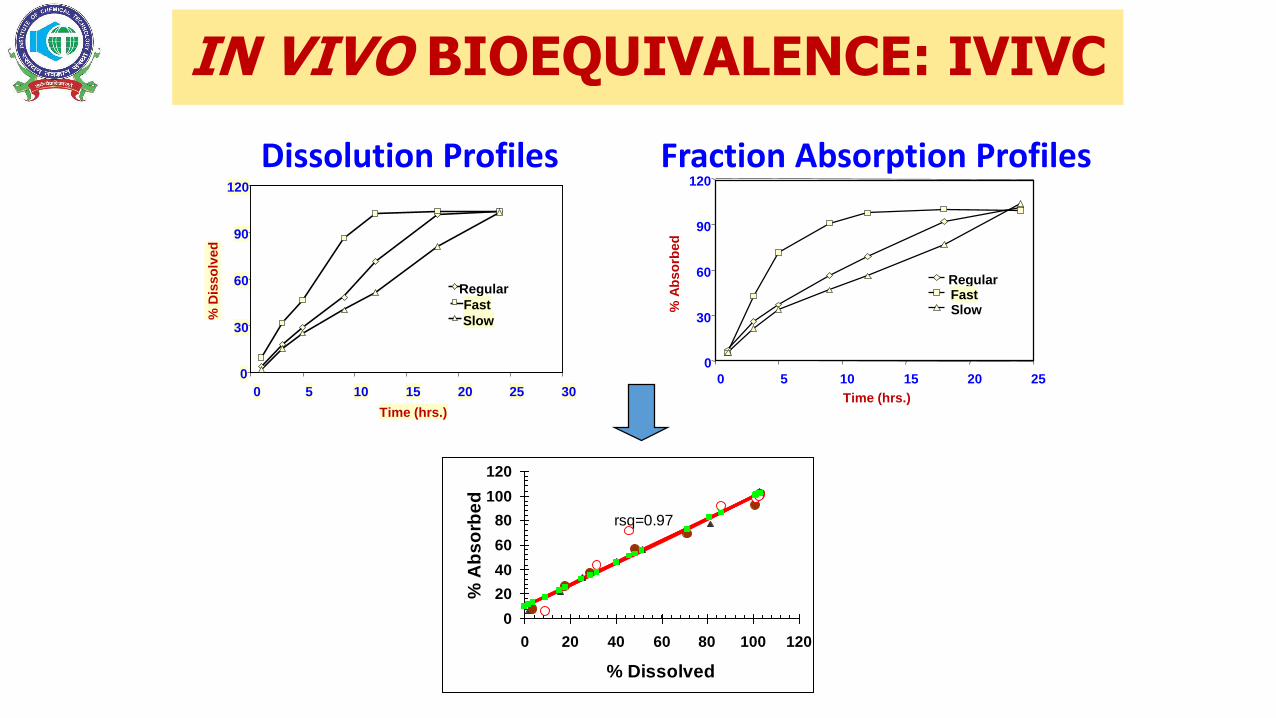
IN VIVO BIOEQUIVALENCE: IVIVC
0
30
60
90
120
0 5 10 15 20 25 30
Time (hrs.)
% D
isso
lved
Regular
Fast
Slow
Dissolution Profiles Fraction Absorption Profiles
rsq=0.97
0
20
40
60
80
100
120
0 20 40 60 80 100 120
% Dissolved
% A
bs
orb
ed
0
30
60
90
120
0 5 10 15 20 25
Time (hrs.)
% A
bso
rbed
RegularFastSlow
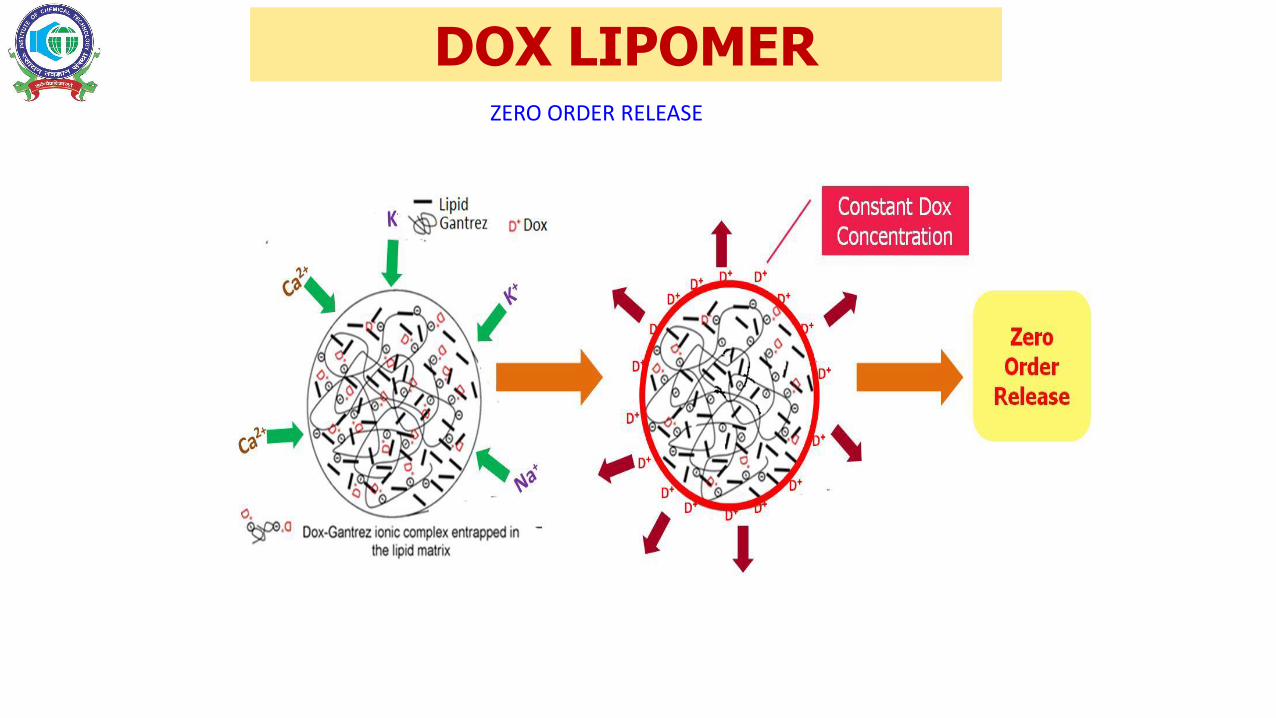
DOX LIPOMERZERO ORDER RELEASE
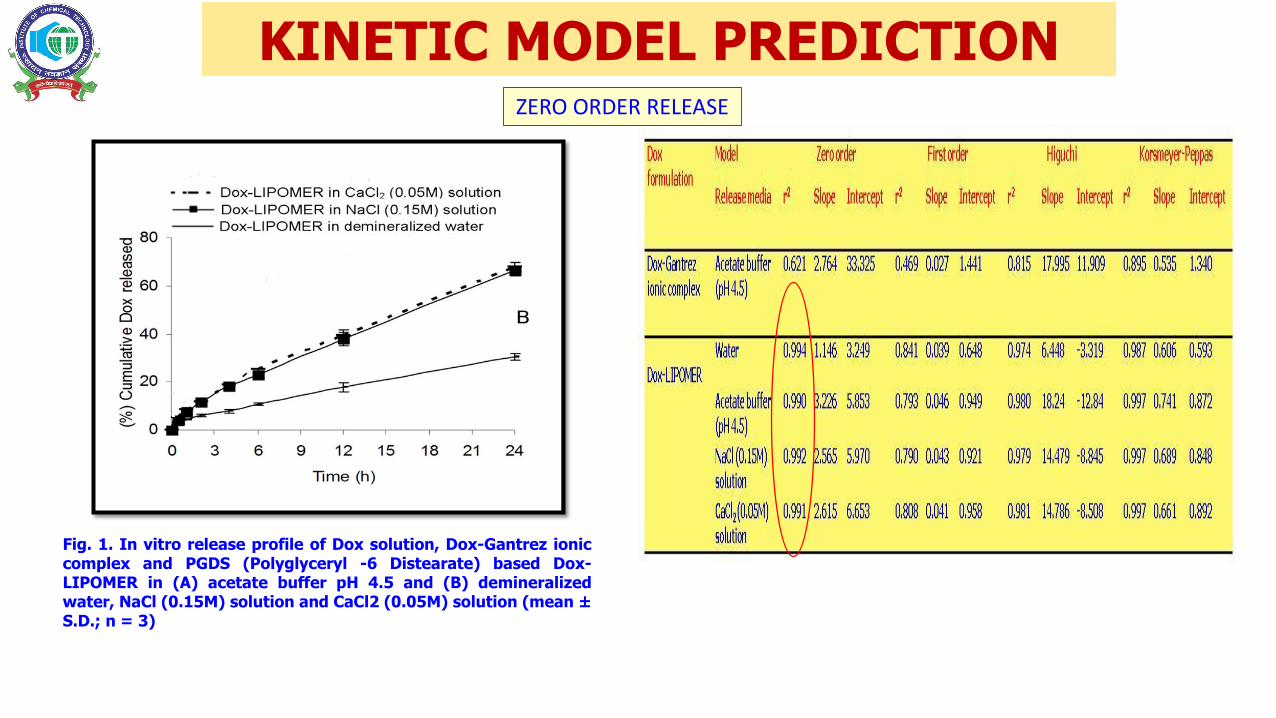
Fig. 1. In vitro release profile of Dox solution, Dox-Gantrez ioniccomplex and PGDS (Polyglyceryl -6 Distearate) based Dox-LIPOMER in (A) acetate buffer pH 4.5 and (B) demineralizedwater, NaCl (0.15M) solution and CaCl2 (0.05M) solution (mean ±S.D.; n = 3)
KINETIC MODEL PREDICTIONZERO ORDER RELEASE
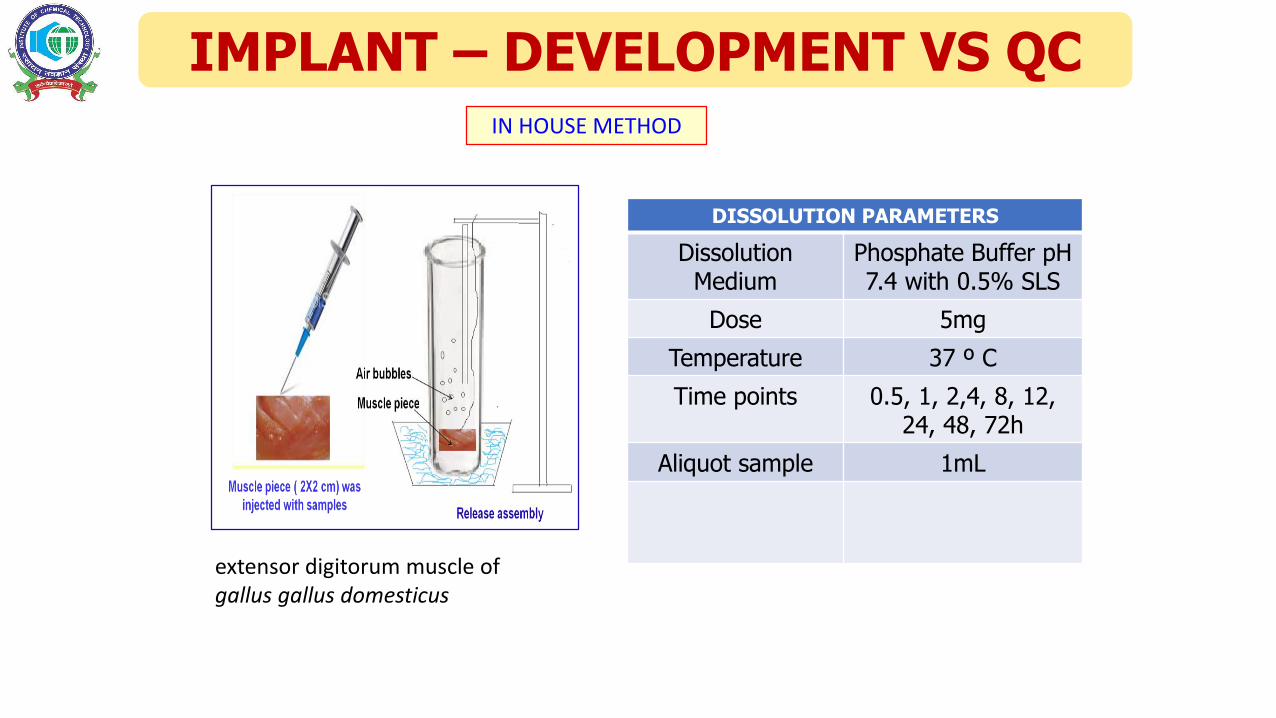
DISSOLUTION PARAMETERS
Dissolution Medium
Phosphate Buffer pH 7.4 with 0.5% SLS
Dose 5mg
Temperature 37 º C
Time points 0.5, 1, 2,4, 8, 12, 24, 48, 72h
Aliquot sample 1mL
IN HOUSE METHOD
extensor digitorum muscle of gallus gallus domesticus
IMPLANT – DEVELOPMENT VS QC
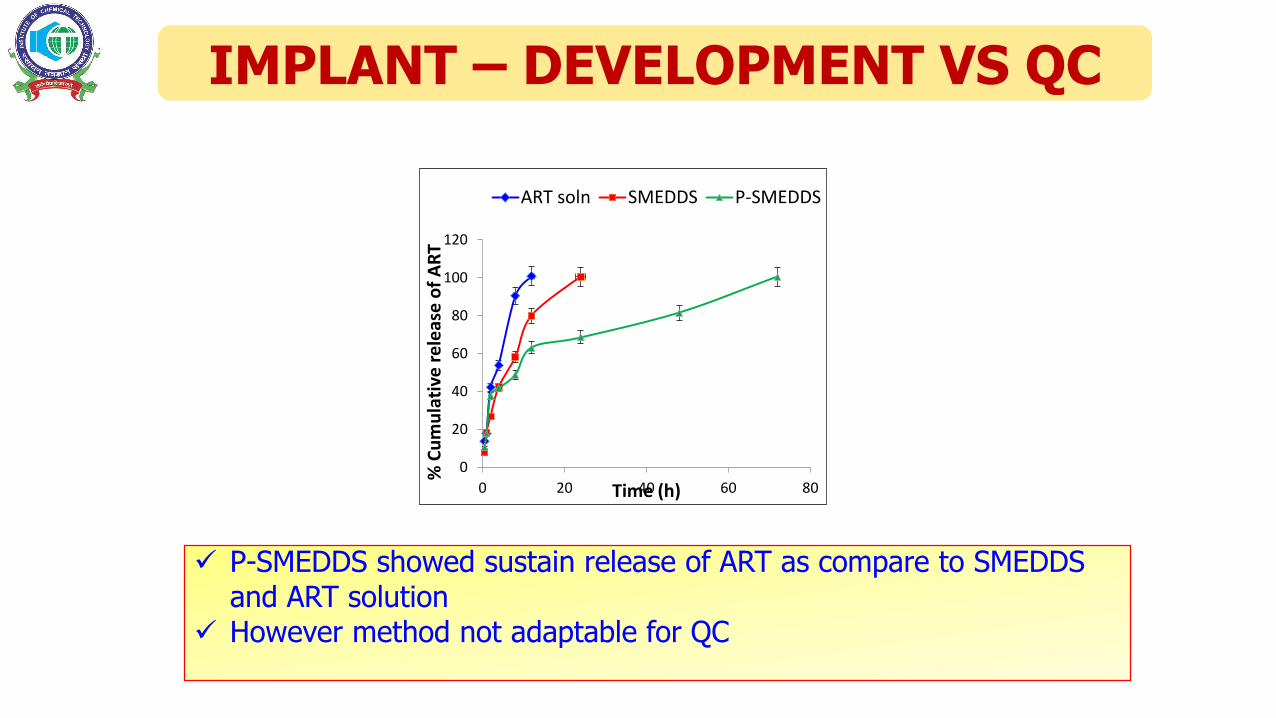
0
20
40
60
80
100
120
0 20 40 60 80
% C
um
ula
tive
re
leas
e o
f A
RT
Time (h)
ART soln SMEDDS P-SMEDDS
P-SMEDDS showed sustain release of ART as compare to SMEDDS and ART solution
However method not adaptable for QC
IMPLANT – DEVELOPMENT VS QC

• COMPREHENDING THE PURPOSE OF A DISSOLUTION TEST AND IDENTIFYING THE RIGHT APPARATUS AND METHOD CONTINUES TO BE AN AREA OF INTENSE RESEARCH PARTICULARLY FOR NEW DELIVERY SYSTEMS
• CUSTOMIZING NEEDS FOR DEVELOPMENT COULD POSE NUMEROUS CHALLENGES
CONCLUSION
MY RESEARCH GROUP
57

58
THANK YOU