Embed Size (px)
Citation preview
uef.fi
PUBLICATIONS OF THE UNIVERSITY OF EASTERN FINLAND
Dissertations in Forestry and Natural Sciences
ISBN 978-952-61-2156-7ISSN 1798-5668
Dissertations in Forestry and Natural Sciences
DIS
SE
RT
AT
ION
S | JU
US
O H
ON
KA
NE
N | C
OM
PU
TE
D T
OM
OG
RA
PH
Y O
F C
AR
TIL
AG
E A
ND
ME
NIS
CU
S... | N
o 230
JUUSO HONKANEN
COMPUTED TOMOGRAPHY OF CARTILAGE AND MENISCUSUSING ANIONIC AND CATIONIC CONTRAST AGENTS
PUBLICATIONS OF THE UNIVERSITY OF EASTERN FINLAND
Contrast enhanced computed tomography (CECT) is a promising technique for detecting articular
cartilage pathologies. However, its potential for meniscal imaging has not been thoroughly
studied. CECT could enable simultaneous quantitative imaging of these tissues provided
that the differences between their diffusion kinematics were known. CECT using anionic and cationic contrast agents was utilized to
study articular cartilage and meniscus and the differences between their diffusion kinematics.
JUUSO HONKANEN

ii
ii
ii
ii
JUUSO HONKANEN
Computed Tomography ofCartilage and Meniscus
Using Anionic andCationic Contrast Agents
Publications of the University of Eastern FinlandDissertations in Forestry and Natural Sciences
No 230
Academic DissertationTo be presented by permission of the Faculty of Science and Forestry for publicexamination in the SN201 in Snellmania Building at the University of Eastern
Finland, Kuopio, on 21st June 2016,at 12:00 o’clock.
Department of Applied Physics
ii
ii
ii
ii
Grano Oy
Jyväskylä, 2016
Editors: Prof. Jukka Tuomela, Prof. Pertti Pasanen
Prof. Pekka Toivanen, Prof. Matti Vornanen
Distribution:
University of Eastern Finland Library / Sales of publications
P.O. Box 107, FI-80101 Joensuu, Finland
tel. +358-50-3058396
http://www.uef.fi/kirjasto
ISBN: 978-952-61-2156-7 (printed)
ISSNL: 1798-5668
ISSN: 1798-5668
ISBN: 978-952-61-2157-4 (pdf)
ISSN: 1798-5676 (pdf)
ii
ii
ii
ii
Author’s address: University of Eastern FinlandDepartment of Applied PhysicsP.O.Box 162770211 KuopioFinlandemail: [email protected] / [email protected]
Supervisors: Professor Juha Töyräs, Ph.D.University of Eastern FinlandDepartment of Applied PhysicsKuopio, Finlandemail: [email protected]
Dean Jukka Jurvelin, Ph.D.University of Eastern FinlandDepartment of Applied PhysicsKuopio, Finlandemail: [email protected]
Adjunct Professor Tuomas Virén, Ph.D.University of Eastern FinlandDepartment of Applied PhysicsKuopio, Finlandemail: [email protected]
Reviewers: Associate Professor Martin Englund, M.D., Ph.D.Lund UniversityDepartment of Clinical SciencesLund, Swedenemail: [email protected]
Docent Mika Kortesniemi, Ph.D.Helsinki University HospitalMedical Imaging CenterHelsinki, Finlandemail: [email protected]
Opponent: Associate Professor Marc Levenston, Ph.D.Stanford UniversityDepartment of Mechanical EngineeringStanford, CA, United Statesemail: [email protected]

ii
ii
ii
ii
ii
ii
ii
ii
ABSTRACT
Osteoarthritis (OA) is the most prevalent joint disease, causing jointpain and dysfunction. OA affects the whole joint and it is usuallycharacterized by a progressive loss of the articular cartilage. In earlyOA, the cartilage surface starts to fibrillate, the proteoglycan (PG)content decreases and the water content increases. OA can be ini-tiated by a focal cartilage trauma, but it may also be consequenceof meniscal injury or degeneration as the diminished load bearingcapability exposes cartilage to excessive strains. If these patholo-gies are diagnosed early enough, cartilage and meniscus damagemay be repaired and the further progression of tissue degenera-tion prevented. However, the detection of minor lesions and earlydegenerative changes is challenging or impossible with traditionalradiological methods.
Contrast enhanced computed tomography (CECT) is a promis-ing imaging technique for detecting cartilage pathologies. The tech-nique relies on the diffusion of contrast agents that enables furtherassessment of morphological and structural properties of cartilage.Indeed, CECT has shown potential at detecting PG loss in articularcartilage in vitro. In addition, the technique has produced promis-ing results in ex vivo and in vivo imaging of cartilage. However,the feasibility of exploiting CECT in meniscal imaging has not beenthoroughly investigated. Furthermore, the differences between thediffusion kinematics of these two tissues are unknown. In this the-sis, the differences in contrast agent diffusion in articular cartilageand meniscus are studied.
First, the feasibility of utilizing CECT to image the diffusionof anionic contrast agent (ioxaglate) in isolated human meniscuswas evaluated with a clinical cone beam CT (CBCT) in situ. Next,the diffusion kinematics of two different contrast agents, a smallmolecular anionic iodine and novel cationic contrast agent bearingtwo positive charges (CA2+), were determined in two independentlaboratory studies. In both studies, the diffusion kinematics weredetermined in bovine articular cartilage and meniscus. Finally, the
ii
ii
ii
ii
potential of CECT using anionic ioxaglate to quantitatively assessthe compositional, histological and biomechanical characteristics ofarticular cartilage in an intact cadaveric human knee joint were eval-uated using a clinical CBCT scanner.
The diffusion of ioxaglate required over 25 hours to reach dif-fusion equilibrium within intact human meniscus. However, thecontrast agent partition at the 40 minute time point correlated sig-nificantly (p < 0.05) with that at the 30 hour time point. Further-more, the contrast agent partition after 30 hours of diffusion agreedqualitatively with the distribution of PGs. Even though the timeneeded for ioxaglate to reach equilibrium is not feasible for clini-cal applications, the significant relationship between early and latetime point contrast agent partition suggests that meniscal patholo-gies could possibly be detected even after short, clinically-relevant,diffusion times (e.g. < 2 h). The contrast agent partition at diffu-sion equilibrium was significantly higher (p < 0.05) in the meniscusthan in cartilage when anionic iodine was used but significantlyhigher (p < 0.05) in cartilage when CA2+ was used. The distri-bution of the contrast agent at equilibrium was different in carti-lage and meniscus with both contrast agents. These results suggestthat the contrast agent distribution in the meniscus may be lessdependent on the PG distribution compared with cartilage. Thesedifferences in diffusion kinematics between cartilage and meniscusshould be acknowledged when interpreting CECT images of kneejoint. Differences in cadaveric cartilage quality between intra-jointregions were quantitatively distinguishable shortly after ioxaglateexposure as well as at diffusion equilibrium. Furthermore, X-rayattenuation correlated significantly (p < 0.05) with histological, bio-chemical and biomechanical properties at both early (< 2 hours)and later time points. These results suggest that CECT enables theassessment of biochemical and biomechanical properties of carti-lage at clinically-relevant diffusion times. Thus, CECT may providea useful quantitative tool for the clinical detection of the early signsof cartilage degeneration.
To conclude, the diffusion characteristics of contrast agents vary
ii
ii
ii
ii
between articular cartilage and meniscus. Nevertheless, CECT couldprovide a clinical tool for simultaneous assessment of both cartilageand meniscus, as long as the limitations of the technique and dif-ferences between the tissues are understood and considered whileinterpreting the images.
National Library of Medicine Classification: QT 36, WN 160, WN 206,WE 300, WE 870
Medical Subject Headings: Diagnostic Imaging; Tomography, X-RayComputed; Contrast Media; Ioxaglic Acid; Iodine; Diffusion; Carti-lage, Articular; Menisci, Tibial; Knee Joint; Osteoarthritis/diagnosis
Yleinen suomalainen asiasanasto: kuvantaminen; tomografia; kontrasti;varjoainetutkimus; diffuusio; nivelrusto; polven nivelkierukat; nivel-rikko

ii
ii
ii
ii
ii
ii
ii
ii
Preface
This study was carried out during the years 2012-2016 in the De-partment of Applied Physics at the University of Eastern Finland.
First, I would like express my sincere gratitude to all my super-visors for their professional guidance during this Ph.D. thesis. I amgrateful to my principal supervisor Professor Juha Töyräs, Ph.D.,for his enthusiasm, work ethics and encouragement. He has beenthe main driving force behind my research. I thank my second su-pervisor, Dean Jukka Jurvelin, Ph.D., for his endless support andalways making me see the bigger picture. I also thank my thirdsupervisor, Adjunct Professor Tuomas Virén, Ph.D., for his help,especially, at the beginning of my thesis project.
The official reviewers of this thesis, Associate Professor MartinEnglund, M.D., Ph.D, and Docent Mika Kortesniemi, Ph.D, are ac-knowledged for their constructive criticism and professional review.I am grateful to Ewen MacDonald, D.Pharm., for the linguistic re-view.
I would like to thank my co-authors for their significant contri-butions. Especially, I would like to thank Mikael Turunen for hisimmeasurable help with the second and third study.
Special thanks to Lasse Räsänen and Petri Tanska for their in-valuable help and support as well as sharing this experience start-ing from the very first lecture at the university. Without you, I prob-ably would not be writing this. I would also thank Harri Kokkonenfor his help over the years.
I owe my sincere thanks to the colleagues in BBC (Biophysics ofBone and Cartilage) group. It has been a privilege working in a suchhigh spirited research group. Special thanks to Markus, Pete, Lasse,Jaakko, Anni, Kata, Satu, Katariina, Mika, Mikael, Janne, Jarkko,Moukku, Hande, Pikku Jukka, Pia, Weiwei, Rambo Roimela, Chuby,Elvis, Ari, Sami, Harri, Finski, Simo, Cristina, Roope, Jari, Mikko,Kimmo, Mimmi and Nissi. I also thank all the researchers who
ii
ii
ii
ii
have helped me with my thesis.I would like to express my gratitude to all my friends outside
the academic world for supporting me and providing me with afull life outside of science. I thank Black Sabbath for enriching mylife with all the music and introducing me to the world of Rockand Roll. Furthermore, I would like to thank my bandmates AlainAquamelon, Bruce Deluxe, Barry Oyster and S. McDee (Thermate).
This thesis work was financially supported by the Academyof Finland (project 269315), Instrumentarium Science Foundation,Kuopio University Hospital (EVO/VTR 5041715, 5041731, 5041746and 5063535), Magnus Ehrnrooth Foundation, National DoctoralProgramme of Musculoskeletal Disorders and Biomaterials (TBDP),Orion Corporation Research Foundation, Saastamoinen Founda-tion, Sigrid Juselius Foundation and strategic funding of the Uni-versity of Eastern Finland.
I am sincerely grateful to my parents, Merja and Raimo, and mylittle sister Saara. Mum and dad, thank you for encouraging me inmy studies and supporting my choices throughout my life. Yoursupport means a lot to me. I would like to express my deepest grat-itude to my beloved Miitu for her love, support and understandingfor the long working hours.
Jyväskylä, May 2016
Juuso Honkanen
ii
ii
ii
ii
ABBREVIATIONS
2D Two-dimensional3D Three-dimensionalBLOKS Boston-Leeds Osteoarthritis Knee ScoreCA2+ Contrast agent bearing two positive chargesCA4+ Contrast agent bearing four positive chargesCBCT Cone beam computed tomographyCECT Contrast enhanced computed tomographyCT Computed tomographyCTa Computed tomography arthrographyDD Digital densitometrydGEMRIC Delayed gadolinium enhanced magnetic resonance
imaging of cartilageECM Extracellular matrixEDTA Ethylenediaminetetraacetic acid disodium saltFCD Fixed charge densityFTIR Fourier transform infrared spectroscopyGAG GlycosaminoglycanICRS International Cartilage Repair SocietyNaI Sodium iodideNCP non-collagenous proteinmicroCT X-ray microtomographyMRI Magnetic resonance imagingOA OsteoarthritisOARSI Osteoarthritis Research Society InternationalOD Optical densityPBS Phosphate buffered salinePG ProteoglycanPTOA Post-traumatic osteoarthritisSD Standard deviationSNR Signal-to-noise ratioWORMS Whole Organ Magnetic Resonance Imaging Scorew.w. Wet weightZnSe Zinc-selenide
ii
ii
ii
ii
SYMBOLS AND NOTATIONS
[. . .] ConcentrationC Solute concentrationC̄ Bulk concentrationd Diameterdsd Source-to-detector distancedso Source-to-object distanceD Diffusion coefficiente Napier’s constantEeq Equilibrium modulusEi Instantaneous modulusF Faraday constanth Thickness of the tissueI IntensityI0 Initial intensityJ Diffusion fluxM Magnification or molar massµ Linear attenuation coefficientn Number of samplesν Poisson’s ratioO Original object sizeO′ Magnified object sizep Level of statistical significanceΨ Membrane potentialq Electric charger Donnan ratio or Pearson correlation coefficientR Gas constantρ Spearman’s rhot TimeT Temperaturex Distancez Valence of the ionZ Atomic number
ii
ii
ii
ii
LIST OF PUBLICATIONS
This thesis consists of the present review of the author’s work in thefield of contrast enhanced computed tomography of cartilage andmeniscus and the following selection of the author’s publications:
I Honkanen J.T.J., Danso E.K., Suomalainen J.-S., Tiitu V., Jur-velin J.S., Töyräs J., “Contrast enhanced imaging of humanmeniscus using cone beam CT”. Osteoarthritis and Cartilage,23(8), 1367–76 (2015).
II Honkanen J.T.J., Turunen M.J., Tiitu V., Jurvelin J.S., Töyräs J.,“Transport of iodine is different in cartilage and meniscus”.Annals of Biomedical Engineering. In press (2016).
III Honkanen J.T.J., Turunen M.J., Saarakkala S., Grinstaff M.W.,Ylärinne J.H., Jurvelin J.S., Töyräs J., “Cationic contrast agentdiffusion differs between cartilage and meniscus”. Annals ofBiomedical Engineering. In press (2016).
IV Stewart R.C.*, Honkanen J.T.J.*, Kokkonen H.T., Tiitu V., Saa-rakkala S., Joukainen A., Snyder B.D., Jurvelin J.S., GrinstaffM.W., Töyräs J., “Contrast-enhanced computed tomographyenables quantitative evaluation of tissue properties at intra-joint regions in cadaveric knee cartilage”. Submitted (2016).(*Equal contribution)
Throughout the thesis, these papers will be referred to by Romannumerals.
ii
ii
ii
ii
AUTHOR’S CONTRIBUTION
The publications in this dissertation are original research papers oncontrast enhanced computed tomography (CECT) of articular car-tilage and meniscus. The author was involved in the planning anddesign of each paper.
In paper I, the author conducted CECT and MRI imaging of themenisci and carried out all the data analysis excluding those of thebiomechanical measurements. The biomechanical measurementswere conducted and the results analysed by E. K. Danso. The au-thor was the principal author of the manuscript.
In paper II, the author conducted or supervised the CECT mea-surements, carried out all the data analysis, and was the principalauthor of the manuscript.
In paper III, the author conducted or supervised the CECT mea-surements, conducted the digital densitometry, carried out all thedata analysis, and was the principal author of the manuscript.
In paper IV, the author conducted the CECT imaging, biomechan-ical measurements and data analyses in equal contribution with R.C. Stewart. In addition, the author conducted the histological grad-ing of the samples with J. Töyräs and V. Tiitu. The manuscript waswritten in equal contribution with R. C. Stewart.
In all papers, the collaboration with the co-authors has been sig-nificant.
ii
ii
ii
ii
Contents
1 INTRODUCTION 1
2 KNEE JOINT 52.1 Articular cartilage . . . . . . . . . . . . . . . . . . . . . 6
2.1.1 Structure and composition of articular cartilage 62.1.2 Mechanical properties of articular cartilage . . 8
2.2 Meniscus . . . . . . . . . . . . . . . . . . . . . . . . . . 92.2.1 Anatomy . . . . . . . . . . . . . . . . . . . . . . 102.2.2 Structure and composition of meniscus . . . . 102.2.3 Mechanical properties of meniscus . . . . . . . 12
2.3 Cartilage and meniscus pathologies . . . . . . . . . . 132.4 Clinical diagnostics of articular cartilage and menis-
cus pathologies . . . . . . . . . . . . . . . . . . . . . . 15
3 CONTRAST ENHANCED COMPUTED TOMOGRAPHY 173.1 X-ray computed tomography . . . . . . . . . . . . . . 173.2 Contrast agents . . . . . . . . . . . . . . . . . . . . . . 193.3 Diffusion of contrast agents in cartilage
and meniscus . . . . . . . . . . . . . . . . . . . . . . . 193.4 Contrast enhanced computed tomography . . . . . . 22
4 AIMS OF THE PRESENT STUDY 25
5 MATERIALS AND METHODS 275.1 Sample preparation . . . . . . . . . . . . . . . . . . . . 275.2 Contrast enhanced computed tomography . . . . . . 28
5.2.1 Cone beam computed tomography . . . . . . 285.2.2 X-ray microtomography . . . . . . . . . . . . . 29
5.3 Reference methods . . . . . . . . . . . . . . . . . . . . 295.3.1 Histological and biochemical analyses . . . . . 295.3.2 Mechanical testing . . . . . . . . . . . . . . . . 305.3.3 Magnetic resonance imaging . . . . . . . . . . 31
ii
ii
ii
ii
5.4 Statistical analyses . . . . . . . . . . . . . . . . . . . . 31
6 RESULTS 336.1 Contrast enhanced computed tomography of human
meniscus . . . . . . . . . . . . . . . . . . . . . . . . . . 336.2 Diffusion kinematics in bovine articular
cartilage and meniscus . . . . . . . . . . . . . . . . . . 356.3 Contrast enhanced computed tomography
of cadaveric articular cartilage . . . . . . . . . . . . . . 39
7 DISCUSSION 437.1 Contrast enhanced computed tomography of human
meniscus . . . . . . . . . . . . . . . . . . . . . . . . . . 437.2 Diffusion and distribution of contrast
agents in bovine cartilage and meniscus . . . . . . . . 457.3 Assessment of cartilage health and mechanical prop-
erties using contrast enhanced computed tomography 487.4 Limitations . . . . . . . . . . . . . . . . . . . . . . . . . 497.5 Contrast enhanced computed tomography in clinical
applications – current status and future . . . . . . . . 50
8 SUMMARY AND CONCLUSIONS 53
REFERENCES 54
ii
ii
ii
ii
1 Introduction
Articular cartilage and meniscus are soft tissue structures crucial forthe proper functioning of a healthy knee joint. Articular cartilageis an avascular, highly specialized connective tissue that covers theends of articulating bones. The crescent shaped menisci are mostlyavascular fibrocartilaginous tissues located between the medial andlateral femoral condyles and tibial plateaus. These hydrated softtissues with an inhomogeneous structure and unique mechanicalproperties enable near-frictionless joint movement, distribute loadsin the knee joint and absorb mechanical energy during movements[1–8]. In addition, the menisci stabilize the knee joint and contributeto proprioception [2, 9].
While the structural constituents are similar in cartilage andmeniscus, their contents and organization differ considerably [2,7, 10]. Their main structural constituents are water, collagen andproteoglycans (PGs). Any disturbances in these constituents, e.g.,due to inflammation or trauma, may affect the interactions betweenthese structures, and thus impair the function of the tissues. Thedisrupted functioning of cartilage or meniscus may lead to the de-velopment of a degenerative joint disease called osteoarthritis (OA).
OA is the most prevalent joint disease, causing joint pain anddysfunction [4,11]. It is a disease of the whole joint, usually charac-terized by a progressive loss of the articular cartilage accompaniedby remodeling and sclerosis of subchondral bone. The cartilagedegeneration is usually caused by a disturbance in the natural re-pair cycle of cartilage [12], however, the pathogenesis of OA is notfully understood. Age is one of the most important risk factors forOA. Indeed, it has been estimated that over 50% of people over 50years, and nearly 90% of people at the age of 75 years have radi-ological changes typical of OA [11]. Other recognized risk factorsinclude genetics, sex (higher risk for women), congenital anomaliesand obesity [4, 13–15]. In addition to these risk factors, OA may
Dissertations in Forestry and Natural Sciences No 230 1
ii
ii
ii
ii
Juuso Honkanen: Computed Tomography of Cartilage and MeniscusUsing Anionic and Cationic Contrast Agents
also be initiated by a local or global joint trauma; in such cases thedisease is called post-traumatic OA (PTOA). PTOA may be initiatedafter a trauma to cartilage itself or a meniscal injury, e.g., a meniscaltear [16].
Conventional radiography is the gold standard imaging tech-nique for OA diagnostics [17]. However, it can only detect changesrelated to moderate- to late-stage OA, such as alterations in boneand joint space narrowing, as the soft tissues (e.g., cartilage andmeniscus) are not visible on plain radiographs. Magnetic reso-nance imaging (MRI) provides good soft tissue contrast and suf-ficient in-plane resolution for cartilage and meniscus assessment.However, MRI lacks rapid three-dimensional (3D) data acquisitionwith a small enough isotropic voxel size - a feature that limits thedetection of incipient cartilage or meniscal changes. Furthermore,the high imaging costs and long queuing times restrict the routineuse of the MRI in the diagnostics of early stage cartilage and menis-cal changes. Nevertheless, early diagnosis of cartilage and menis-cal injuries or degeneration is essential for an effective treatmentand slowing the progression of tissue degradation. More impor-tantly, if these injuries are detected early enough, the progressionof the tissue degeneration might be stopped or even reversed withrepair surgery or pharmaceuticals [18–20]. Thus, this lack of a sen-sitive imaging technique represents lost opportunities for cliniciansto guide treatment before the damage has become too widespreador severe, with no other treatment options but arthroplasty.
The earliest degenerative changes in cartilage include the lossof PGs, structural changes in superficial collage, and an increasein the water content [21, 22]. Delayed gadolinium enhanced mag-netic resonance imaging of cartilage (dGEMRIC) and contrast en-hanced computed tomography (CECT) have been introduced forthe detection of this PG loss in cartilage [23–28]. These techniquesare based on an assumption that the partitioning of mobile anioniccontrast agents into cartilage is inversely proportional to the tissue’sanionic fixed charge density (FCD) created by the glycosaminogly-cans (GAGs) of PGs. In addition to FCD, the diffusion and distri-
2 Dissertations in Forestry and Natural Sciences No 230
ii
ii
ii
ii
Introduction
bution of the contrast agent are influenced by the water content,collagen content, and the structural integrity of the tissue [29–32].Recently, these techniques have also been applied for imaging themeniscus [33–36].
Cationic contrast agents have recently been introduced for CECTimaging of cartilage [37–39] and meniscus [35]. In contrast to tradi-tional anionic contrast agents, cationic contrast agents are assumedto distribute at diffusion equilibrium in concentration directly pro-portional to the FCD distribution in the tissue. Furthermore, asthe cationic contrast agent molecules are attracted by the negativeFCD, cationic contrast agents are assumed to offer more sensitivetechnique for direct monitoring of changes in the PG contents ofcartilage and meniscus [35, 37].
Although many in vitro studies have highlighted the potentialof CECT to assess the health of cartilage [24, 25, 28, 40–42], the fea-sibility of CECT for quantitative imaging of meniscus has not beenthoroughly studied. Furthermore, if these two soft tissues in theknee joint could be imaged and assessed simultaneously, CECTcould provide a method for comprehensive evaluation of the kneejoint health with a short acquisition time and high isotropic resolu-tion. This thesis focuses on the assessment of differences in contrastagent diffusion in cartilage and meniscus. In study I, the poten-tial of CECT to image contrast agent diffusion in human meniscuswith a clinical cone beam CT (CBCT) is evaluated. The diffusionkinematics of a small anionic contrast agent (iodine) is determinedin bovine cartilage and meniscus in study II while the diffusionkinematics of a novel cationic contrast agent bearing two positivecharges (CA2+) in these tissues is determined in study III. StudyIV examines whether CBCT based on an anionic contrast agent,reflects the biochemical, histological and biomechanical character-istics of articular cartilage in an intact cadaveric human knee joint.
Dissertations in Forestry and Natural Sciences No 230 3

ii
ii
ii
ii
Juuso Honkanen: Computed Tomography of Cartilage and MeniscusUsing Anionic and Cationic Contrast Agents
4 Dissertations in Forestry and Natural Sciences No 230
ii
ii
ii
ii
2 Knee joint
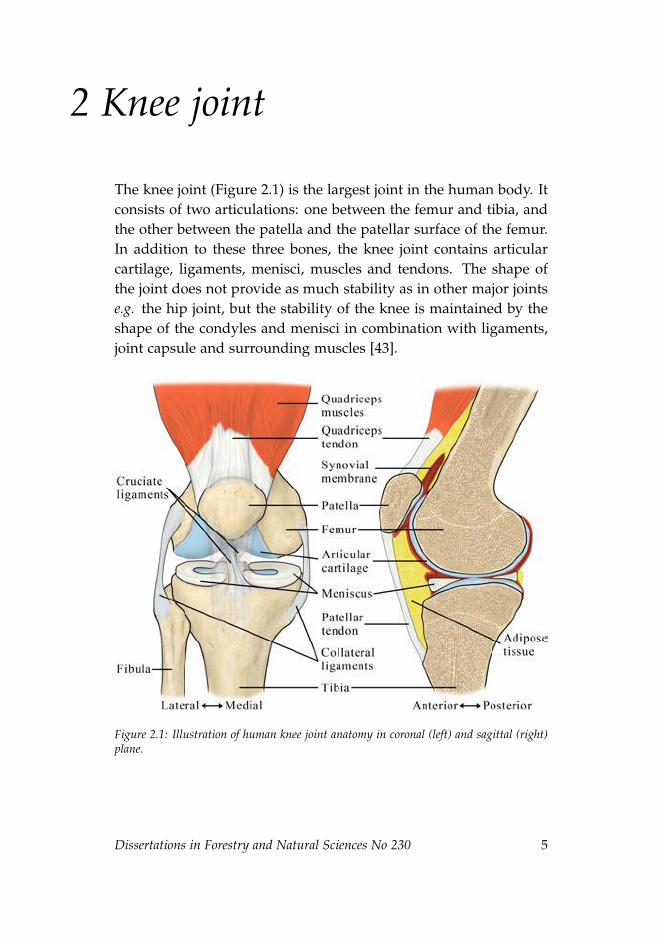
The knee joint (Figure 2.1) is the largest joint in the human body. Itconsists of two articulations: one between the femur and tibia, andthe other between the patella and the patellar surface of the femur.In addition to these three bones, the knee joint contains articularcartilage, ligaments, menisci, muscles and tendons. The shape ofthe joint does not provide as much stability as in other major jointse.g. the hip joint, but the stability of the knee is maintained by theshape of the condyles and menisci in combination with ligaments,joint capsule and surrounding muscles [43].
Figure 2.1: Illustration of human knee joint anatomy in coronal (left) and sagittal (right)plane.
Dissertations in Forestry and Natural Sciences No 230 5
ii
ii
ii
ii
Juuso Honkanen: Computed Tomography of Cartilage and MeniscusUsing Anionic and Cationic Contrast Agents
2.1 ARTICULAR CARTILAGE
Articular cartilage is a highly specialized connective tissue. Thehyaline cartilaginous tissue covers the ends of articulating bones inthe diarthrodial joints. Articular cartilage has a pearly blue andtranslucent appearance. In a human knee joint, the mean cartilagethickness varies between 2 and 4 mm depending on the anatom-ical location [44]. It allows near-frictionless movement of the ar-ticulating bones in conjunction with the synovial fluid and menis-cus [8, 45]. In addition, cartilage and menisci absorb kinetic energyand distribute loads minimizing the peak stresses on underlyingsubchondral bone [3, 10].
2.1.1 Structure and composition of articular cartilage
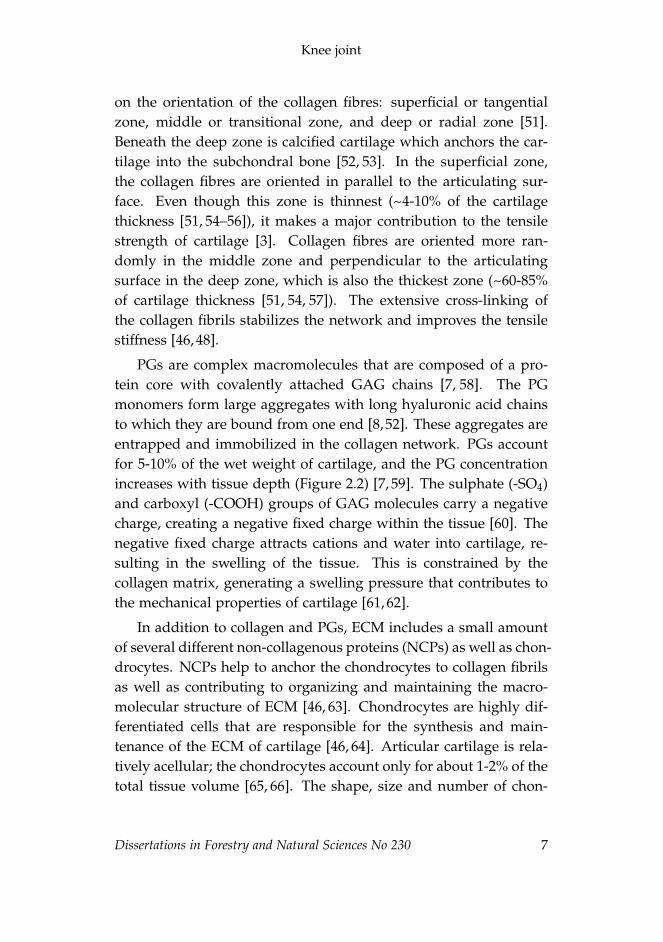
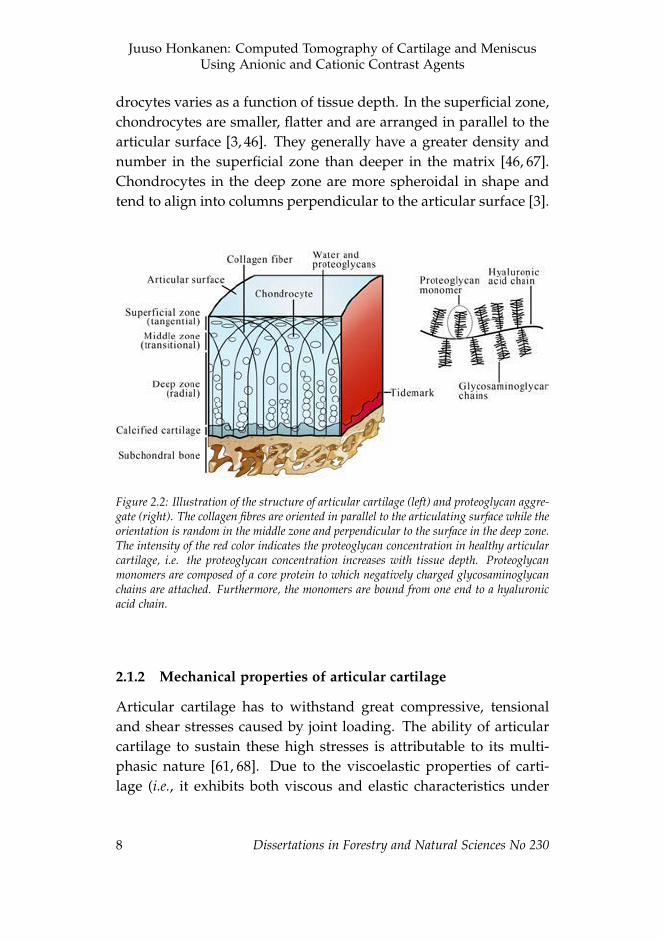
The majority of articular cartilage comprises the extracellular ma-trix (ECM) which surrounds the cartilage cells, chondrocytes (Fig-ure 2.2). The ECM consists mainly of water (60-85% of the wetmass [7, 8]) and the water content decreases towards the cartilage-bone interface [3, 46]. In addition to water, this interstitial fluidcontains small proteins, metabolites, and a high concentration ofcations to balance the negative FCD of the PGs [3]. The majorityof the water can flow freely in and out of the cartilage; this flow ofwater plays an important role not only in the tissue’s mechanicalfunction but also in providing nutrition to the chondrocytes [47].As cartilage is avascular, the transport of nutrients occur primarilyvia diffusion and convection from the synovial fluid.
Most of the solid phase of cartilage consists of collagen, whichaccounts for 10-22% of the wet weight of cartilage [7, 8]. In healthycartilage, type II collagen is abundant, representing 90-95% of thecollagen present in ECM [3,46]. Other collagen types include typesIII, VI, IX, X, XI, XII, and XIV [48]. The collagen fibres form a tightthree dimensional arcade-like network that provides high tensileand shear strength properties as well as dynamic compressive stiff-ness on articular cartilage [3, 48–50].
Articular cartilage is usually divided into three layers based
6 Dissertations in Forestry and Natural Sciences No 230
ii
ii
ii
ii
Knee joint
on the orientation of the collagen fibres: superficial or tangentialzone, middle or transitional zone, and deep or radial zone [51].Beneath the deep zone is calcified cartilage which anchors the car-tilage into the subchondral bone [52, 53]. In the superficial zone,the collagen fibres are oriented in parallel to the articulating sur-face. Even though this zone is thinnest (~4-10% of the cartilagethickness [51, 54–56]), it makes a major contribution to the tensilestrength of cartilage [3]. Collagen fibres are oriented more ran-domly in the middle zone and perpendicular to the articulatingsurface in the deep zone, which is also the thickest zone (~60-85%of cartilage thickness [51, 54, 57]). The extensive cross-linking ofthe collagen fibrils stabilizes the network and improves the tensilestiffness [46, 48].
PGs are complex macromolecules that are composed of a pro-tein core with covalently attached GAG chains [7, 58]. The PGmonomers form large aggregates with long hyaluronic acid chainsto which they are bound from one end [8,52]. These aggregates areentrapped and immobilized in the collagen network. PGs accountfor 5-10% of the wet weight of cartilage, and the PG concentrationincreases with tissue depth (Figure 2.2) [7, 59]. The sulphate (-SO4)and carboxyl (-COOH) groups of GAG molecules carry a negativecharge, creating a negative fixed charge within the tissue [60]. Thenegative fixed charge attracts cations and water into cartilage, re-sulting in the swelling of the tissue. This is constrained by thecollagen matrix, generating a swelling pressure that contributes tothe mechanical properties of cartilage [61, 62].
In addition to collagen and PGs, ECM includes a small amountof several different non-collagenous proteins (NCPs) as well as chon-drocytes. NCPs help to anchor the chondrocytes to collagen fibrilsas well as contributing to organizing and maintaining the macro-molecular structure of ECM [46, 63]. Chondrocytes are highly dif-ferentiated cells that are responsible for the synthesis and main-tenance of the ECM of cartilage [46, 64]. Articular cartilage is rela-tively acellular; the chondrocytes account only for about 1-2% of thetotal tissue volume [65, 66]. The shape, size and number of chon-
Dissertations in Forestry and Natural Sciences No 230 7
ii
ii
ii
ii
Juuso Honkanen: Computed Tomography of Cartilage and MeniscusUsing Anionic and Cationic Contrast Agents
drocytes varies as a function of tissue depth. In the superficial zone,chondrocytes are smaller, flatter and are arranged in parallel to thearticular surface [3, 46]. They generally have a greater density andnumber in the superficial zone than deeper in the matrix [46, 67].Chondrocytes in the deep zone are more spheroidal in shape andtend to align into columns perpendicular to the articular surface [3].
Figure 2.2: Illustration of the structure of articular cartilage (left) and proteoglycan aggre-gate (right). The collagen fibres are oriented in parallel to the articulating surface while theorientation is random in the middle zone and perpendicular to the surface in the deep zone.The intensity of the red color indicates the proteoglycan concentration in healthy articularcartilage, i.e. the proteoglycan concentration increases with tissue depth. Proteoglycanmonomers are composed of a core protein to which negatively charged glycosaminoglycanchains are attached. Furthermore, the monomers are bound from one end to a hyaluronicacid chain.
2.1.2 Mechanical properties of articular cartilage
Articular cartilage has to withstand great compressive, tensionaland shear stresses caused by joint loading. The ability of articularcartilage to sustain these high stresses is attributable to its multi-phasic nature [61, 68]. Due to the viscoelastic properties of carti-lage (i.e., it exhibits both viscous and elastic characteristics under
8 Dissertations in Forestry and Natural Sciences No 230
ii
ii
ii
ii
Knee joint
deformation), it exhibits a time-dependent behaviour under load-ing [10]. During dynamic loading, the low permeability of cartilageresists the water flow and the collagen network restricts the defor-mation [10, 61]. This increases the pressure within cartilage, result-ing in a high stiffness of cartilage during high-rate loading [10]. Incase of a static loading, the interstitial water flows slowly out ofthe tissue and into the less pressurized areas. This softens cartilageand allows the distribution of loads to larger areas. This deforma-tion continues until an equilibrium between the load and the forcesresisting it within the matrix is reached. At this point, PGs are pre-dominantly responsible for supporting the load [10, 69]. Once theload is released, the water flows back into the tissue due to the os-motic pressure created by the FCD, and the cartilage swells back toits original shape.
Besides distributing loads and decreasing stresses on subchon-dral bone, articular cartilage provides a wear-resistant, low frictionsurface for joint movement. This is achieved by lubrication by themacro-molecules (e.g. lubricin) within the synovial fluid [70]. Inaddition, a thin film decreasing the friction is formed on top ofthe articulating surfaces during dynamic loading as the pressurizedwater flows out of the cartilage [71].
2.2 MENISCUS
The menisci of the knee joint are two fibrocartilaginous crescent-shaped discs found between the femoral condyles and tibial pla-teaus. Although they were earlier thought to be vestigial remnantsof a leg muscle [72], menisci are important structures within theknee joint. They redistribute contact forces across the joint, absorbshock, increase stability of tibiofemoral articulation, and aid in jointlubrication and proprioception [2,7,73,74]. They are wedge-shapedin cross-section and partially cover the femoral and tibial joint sur-faces occupying approximately 70% of the total contact area of thejoint [75, 76].
Dissertations in Forestry and Natural Sciences No 230 9
ii
ii
ii
ii
Juuso Honkanen: Computed Tomography of Cartilage and MeniscusUsing Anionic and Cationic Contrast Agents
2.2.1 Anatomy
The medial and lateral menisci differ in shape and size; the medialmeniscus is approximately 3 cm wide (from the attachment of theposterior horn to the outermost edge of the peripheral rim) and4-5 cm long while the lateral meniscus is 3 cm wide and 3-4 cmlong (Figure 2.3) [77]. The medial meniscus is C-shaped and itsposterior horn is substantially larger than the anterior horn. Thelateral meniscus is more circular and regular in its width.
The circumferential collagen fibres of the meniscus continue intothe anterior and posterior insertional ligaments, which attaches themenisci to the tibia at their anterior and posterior horns [78]. Themenisci are also attached by several other secondary ligaments andto the inside of the joint capsule at their peripheral rims [9, 79]. Inaddition, the medial meniscus is attached more firmly at its mid-point to deep medial collateral ligament [79]. For to this reason, themedial meniscus is less mobile that its lateral counterpart.
2.2.2 Structure and composition of meniscus
Similarly to articular cartilage, the ECM of meniscus is mainly com-posed of water (60-75% of meniscus wet weight) [6, 7, 80]. In thesolid matrix, collagens are most abundant (15-25% of wet weight),while PGs account only for < 1-2% of meniscus wet weight [2, 6, 7].About 98% of collagens in the meniscus are of type I, and the re-mainder consists of types II, III and V [2, 81]. The distribution ofdifferent collagen types shows substantial regional variation. Colla-gen type II can be found in the inner third, where it is the predom-inant type, as well as in the deeper superficial zone (i.e. lamellarlayer) [82, 83]. In the peripheral two-thirds, the type I collagen ac-counts for almost all of the collagen [82]. Regional variations inthe distribution of the PGs have also been observed, with the in-ner two-thirds having relatively higher concentration than the outerone-third [35, 84]. The ECM of the meniscus includes also smallamounts of other NCPs, such as fibronectin and elastin. They help,for example, in tissue repair, blood clotting and cell migration [80].
10 Dissertations in Forestry and Natural Sciences No 230
ii
ii
ii
ii
Knee joint
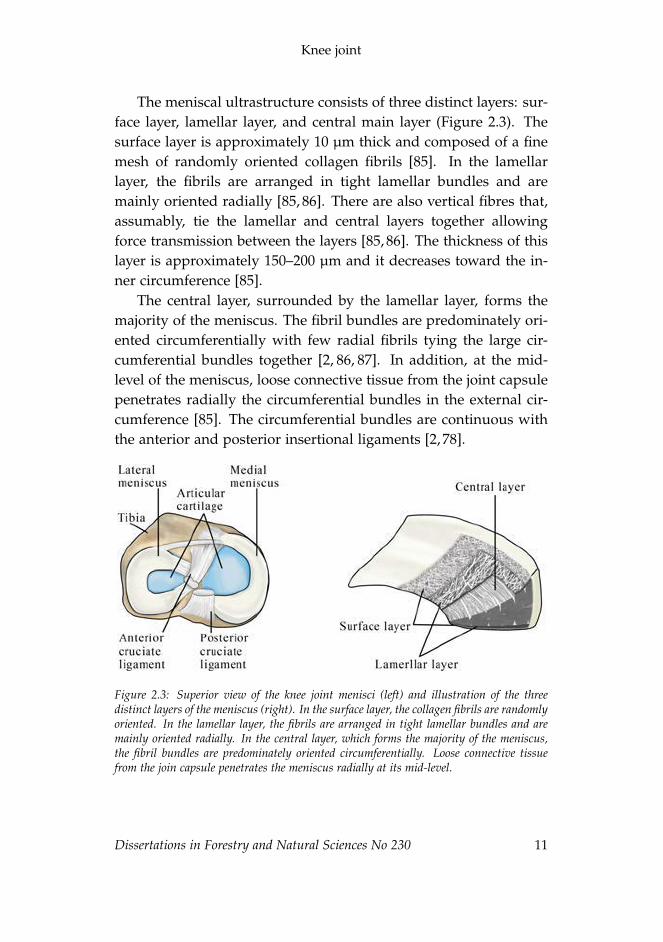
The meniscal ultrastructure consists of three distinct layers: sur-face layer, lamellar layer, and central main layer (Figure 2.3). Thesurface layer is approximately 10 µm thick and composed of a finemesh of randomly oriented collagen fibrils [85]. In the lamellarlayer, the fibrils are arranged in tight lamellar bundles and aremainly oriented radially [85, 86]. There are also vertical fibres that,assumably, tie the lamellar and central layers together allowingforce transmission between the layers [85, 86]. The thickness of thislayer is approximately 150–200 µm and it decreases toward the in-ner circumference [85].
The central layer, surrounded by the lamellar layer, forms themajority of the meniscus. The fibril bundles are predominately ori-ented circumferentially with few radial fibrils tying the large cir-cumferential bundles together [2, 86, 87]. In addition, at the mid-level of the meniscus, loose connective tissue from the joint capsulepenetrates radially the circumferential bundles in the external cir-cumference [85]. The circumferential bundles are continuous withthe anterior and posterior insertional ligaments [2, 78].
Figure 2.3: Superior view of the knee joint menisci (left) and illustration of the threedistinct layers of the meniscus (right). In the surface layer, the collagen fibrils are randomlyoriented. In the lamellar layer, the fibrils are arranged in tight lamellar bundles and aremainly oriented radially. In the central layer, which forms the majority of the meniscus,the fibril bundles are predominately oriented circumferentially. Loose connective tissuefrom the join capsule penetrates the meniscus radially at its mid-level.
Dissertations in Forestry and Natural Sciences No 230 11
ii
ii
ii
ii
Juuso Honkanen: Computed Tomography of Cartilage and MeniscusUsing Anionic and Cationic Contrast Agents
At birth, the whole meniscus is vascularized but only the pe-ripheral 10-30% of adult menisci have blood vessels [76, 88, 89].Based on the vascularity, meniscus can be cross-sectionally dividedinto three zones: red-red, red-white and white-white [90]. Unlikecartilage, the meniscus also has nerves in its outer two thirds; theouter third of the body is more densely innervated than the middlethird [80, 91].
Meniscus contains a variety of cells. The main cell types in theinner and middle part (i.e. white-white to white-red zone) of themeniscus display features of chondrocytes and fibroblasts, and thusthese cells are called fibrochondrocytes [92]. The surface layer ispopulated by a large number of oval or fusiform cells aligned inparallel to the articulating surfaces resembling the chondrocytes ofarticular cartilage [5,9,93,94]. Deeper in the main body, the cells arerounded or polygonal in shape, usually solitary, but they can alsoform groups of two or three [78, 92, 93]. The outer third is mainlypopulated by fibroblast-like cells [5].
2.2.3 Mechanical properties of meniscus
Meniscus, similar to articular cartilage, has viscoelastic properties.Due to its highly anisotropic structure, the mechanical propertiesare site and orientation dependent. The shape of the menisci in-creases the congruency in the knee joint, which helps to distributethe loads. Indeed, the menisci play an important role in bearingand distributing loads and transmit approximately 50% of the loadin the tibofemoral joint [79, 95, 96]. During axial loading, menisciare extruded tensioning the circumferential fibres and insertionalligaments [78]. Thus, part of the axial load is transformed intotensile circumferential or "hoop" stresses [9, 97]. As the collagenfibres are predominantly oriented circumferentially, menisci havegreat tensile stiffness in the circumferential orientation. Moreover,the circumferential tensile strength has been reported to be abouttenfold to that in radial direction [2, 98–100].
Meniscus is less stiff in compression than in tension [79]. Itis also about 50% less stiff and 80% less permeable than articular
12 Dissertations in Forestry and Natural Sciences No 230
ii
ii
ii
ii
Knee joint
cartilage [10]. The low compressive stiffness and low permeabil-ity makes meniscus a good shock absorber. Under an impact, theshock is mainly absorbed by high frictional drag forces developedas the interstitial water tries to flow out of the tissue [79]. Theshock absorbing capability has been shown to decrease by 20% inknees without menisci [101]. In addition, the low stiffness allowsmeniscus to deform, thereby conforming to the variable geometryof femoral condyles, as well as distributing the load to larger area.
2.3 CARTILAGE AND MENISCUS PATHOLOGIES
Knee joints are confronted with heavy loads and impact forces dur-ing daily life; normal walking, for example, subjects the knee jointto a load equivalent to three times the body weight [102]. Besidestrauma-based injuries, articular cartilage and meniscus are suscep-tible to degenerative diseases such as OA. OA is the most prevalentdisease in synovial joints, usually characterized by a progressivedegeneration of the articular cartilage as well as remodeling andsclerosis of subchondral bone. Risk factors contributing to carti-lage degeneration and OA include obesity, genetics, abnormal jointloading, congenital anomalies, and ageing [4, 13–15]. Cartilage de-generation results in pain, stiffness and reduced mobility of thejoints. As well as decreasing the quality of life, OA is a major eco-nomical burden; in Finland, the annual cost to society due to OAhas been estimated to be one billion euros [11].
Meniscal tears are one of the most common types of knee in-juries, and they can be classified as acute or degenerative [103–105].Acute tears usually occur in younger active individuals and arecaused when an excessive force is applied to a healthy knee [106].Degenerative tears are more common with older individuals, and,when a repetitive force is applied, results in a worn meniscus [90,105]. Meniscal tears can also be categorized into multiple differenttypes based on the pattern and location. Acute tears are often paral-lel to the circumferentially oriented collagen fibres (e.g. a longitudi-nal tear) but can occasionally be perpendicular to the circumferen-
Dissertations in Forestry and Natural Sciences No 230 13
ii
ii
ii
ii
Juuso Honkanen: Computed Tomography of Cartilage and MeniscusUsing Anionic and Cationic Contrast Agents
tial fibres (e.g. a radial tear) [106,107]. The latter greatly reduces thefunctional ability of the meniscus, and thus usually leads to menis-cal surgery. Degenerative tears generally have a more complex tearpattern, and can be classified, e.g., as horizontal cleavage, oblique,or complex [90,105]. The most common location for a meniscal tearis the posterior horn of the medial meniscus [105, 108–111].
The severity and healing capability of a meniscal tear is highlylocation dependent. For example, lesions closer to the vascular-ized area have a better chance for spontaneous healing or are bettertargets for successful surgical repair [90, 97]. Currently, the sur-geons aim to repair an injured meniscus instead of removing it.Treatment options include surgical repair using sutures or rigidimplants (e.g. meniscus arrow or dart), but in more severe casespartial meniscectomy or meniscal allograft transplantation may beperformed [9, 77, 97]. However, it must be noted that partial andespecially total meniscectomy exposes the cartilage to higher peakforces, and thus to degeneration [1, 73, 96]. Nonetheless, menis-cal injuries may cause further degradation of the meniscus, andthus degeneration of articular cartilage and even development ofOA [16, 79, 112].
The earliest signs of articular cartilage degeneration include lossof PGs, an increase in the water content, and fibrillation of super-ficial collagen matrix [4, 7, 21]. These changes increase the perme-ability and decrease the stiffness of cartilage exposing it to furtherdamages. In general, an increase in the water content, degrada-tion of the collagen network and a decrease in the PG content arealso related to meniscus degeneration [6, 36, 113]. However, the PGcontent in meniscus has also been reported to increase due to in-jury [113,114]. The PG content may also transiently increase deeperin the degenerated cartilage as the chondrocytes synthesize morePGs due to changed environment [21, 115].
The pathogenesis of primary OA (i.e. "wear and tear") is not yetfully understood, while secondary OA is initiated e.g. by a jointtrauma. It has been postulated that impairment in the mechanicalproperties of articular cartilage increases stresses on subchondral
14 Dissertations in Forestry and Natural Sciences No 230
ii
ii
ii
ii
Knee joint
bone, leading to thickening and sclerosis of subchondral bone, andthus increased loading of cartilage [116]. It has also been speculatedthat stiffening of subchondral bone exposes cartilage to mechanicaloverload and thus initiates the cartilage degeneration [117]. Fur-thermore, cartilage degeneration and OA can be consequence of ameniscal tear in a healthy knee, but OA may also lead to a meniscaltear [106, 112].
2.4 CLINICAL DIAGNOSTICS OF ARTICULAR CARTILAGEAND MENISCUS PATHOLOGIES
OA diagnosis is usually based on patient symptoms and physicalexamination. Common cartilage and meniscus related symptomsinclude pain, stiffness, effusion, catching or locking sensation, andclicking on moving the knee. To ensure the diagnosis, native X-ray image is usually taken. The severity of OA is usually assessedfrom the a native X-ray images by Kellgren-Lawrence grading sys-tem [118]. However, as the synovial fluid and soft tissue structureswithin the knee joint attenuate the X-rays almost equally, cartilageand meniscus can not be differentiated on plain radiographs. Thus,the Kellgren-Lawrence grading system is based on assessing jointspace narrowing and the structural changes in bone, features thatare related to moderate- to late-stage OA changes. Furthermore,cartilage and meniscus injuries can also be asymptomatic, whichagain delays the diagnosis of these injuries [108, 119, 120].
MRI enables detection of cartilage and meniscal lesions andevaluation of cartilage thickness [105, 121, 122]. It provides a goodsoft tissue contrast, and thus is the preferred imaging modalityfor evaluating cartilage and meniscus [17, 106]. There are severalgrading systems for the semi-quantitative assessment of lesions andoverall knee joint health, including such as Internal Cartilage RepairSociety (ICRS) grading system, Whole Organ MRI Score (WORMS)method, and Boston-Leeds Osteoarthritis Knee Score (BLOKS) meth-od. In addition, contrast enhanced MRI techniques, such as dGEM-RIC, enable quantitative assessment of cartilage health. In this
Dissertations in Forestry and Natural Sciences No 230 15
ii
ii
ii
ii
Juuso Honkanen: Computed Tomography of Cartilage and MeniscusUsing Anionic and Cationic Contrast Agents
technique, mobile anionic gadopentate molecules are assumed todiffuse and distribute in cartilage in inverse proportion to GAGs[23, 26]. Although it is assumed that only FCD in the tissue andthe charge of the contrast agent molecule affect the diffusion, ithas been demonstrated that dGEMRIC is also sensitive to otherfactors, such as, collagen content [123–125]. This technique hasalso been used for imaging of the meniscus and assessment of itshealth [33, 36, 126]. Even though MRI provides a good soft tissuecontrast, it lacks rapid 3D image acquisition with sufficient reso-lution. In addition, relatively high imaging costs, long acquisitionand queue times limit its use in the detection of early degenerationor acute injuries.
CT arthrography (CTa) employs iodinated contrast agents to en-hance the contrast between the synovial fluid and the articular car-tilage and meniscus. In CTa, the image acquisition is performedrapidly after intra-articular injection of the contrast agent. This en-ables morphological evaluation of cartilage and meniscus but notassessment of internal structures. CTa may be used for the detec-tion of articular cartilage and meniscal lesions [127].
Arthroscopy is the gold standard in the evaluation of cartilageand meniscal lesions [106, 120, 128]. The modality enables directvisual inspection and probing of cartilage and meniscal surfaces,and relies on subjective assessment by the surgeon. Arthroscopicultrasound imaging and arthroscopical optical coherence tomog-raphy may also be performed during a conventional arhtroscopicinvestigation. Even though these modalities allow high resolutionimaging [129–132], they are not yet in widespread clinical use.
16 Dissertations in Forestry and Natural Sciences No 230
ii
ii
ii
ii
3 Contrast enhanced com-puted tomography
The German physicist, Wilhelm Röntgen, discovered X-rays in 1895,and the use of X-rays in medical imaging was widespread alreadybefore the beginning of the 20th century. In 1917, Johann Radonintroduced the mathematical theory (i.e. Radon transform) behindcomputed tomography reconstruction. However, it was not until1971 when Godfrey Hounsfield introduced X-ray computed tomog-raphy into medical practice. In CT, X-ray projections are acquiredat multiple projection angles around the imaged object. Based onthese projections, a 3D image of the object can be reconstructed.
3.1 X-RAY COMPUTED TOMOGRAPHY
X-rays are electromagnetic radiation with the usual wavelength of0.01 to 100 nanometers. The X-ray imaging is based on attenuationdifferences between tissues. Due to various interactions with themedium, X-rays attenuate according to the Beer-Lambert law:
I(x) = I0e−µx , (3.1)
where I is the intensity of the radiation at distance x, I0 is the initialintensity, and µ is the linear attenuation coefficient, which dependson the energy of the photon, atomic number (Z), and the electrondensity of the material. When X-ray energies are in the diagnosticrange (< 200 keV), the attenuation is due to three interactions: pho-toelectric effect, Compton effect, and elastic scattering. The photo-electric effect is the predominant form of the interaction with diag-nostic X-ray energies. In general, the photoelectric effect contributesto the image contrast whereas Compton effect contributes to imagenoise. [133, 134]
Dissertations in Forestry and Natural Sciences No 230 17
ii
ii
ii
ii
Juuso Honkanen: Computed Tomography of Cartilage and MeniscusUsing Anionic and Cationic Contrast Agents
In a CT scan, the X-ray source and the detector rotate aroundthe imaged object while acquiring multiple images at multiple pro-jection angles. These projection images cover 180 to 360 degreesof the imaged object. Subsequently, the acquired projection im-ages are mathematically reconstructed into two-dimensional (2D)axial images using either analytical (e.g. filtered back projection)or more computationally demanding iterative reconstruction algo-rithms. Subsequently, these 2D axial images are used to form a 3Dimage of the imaged object. [133, 135]
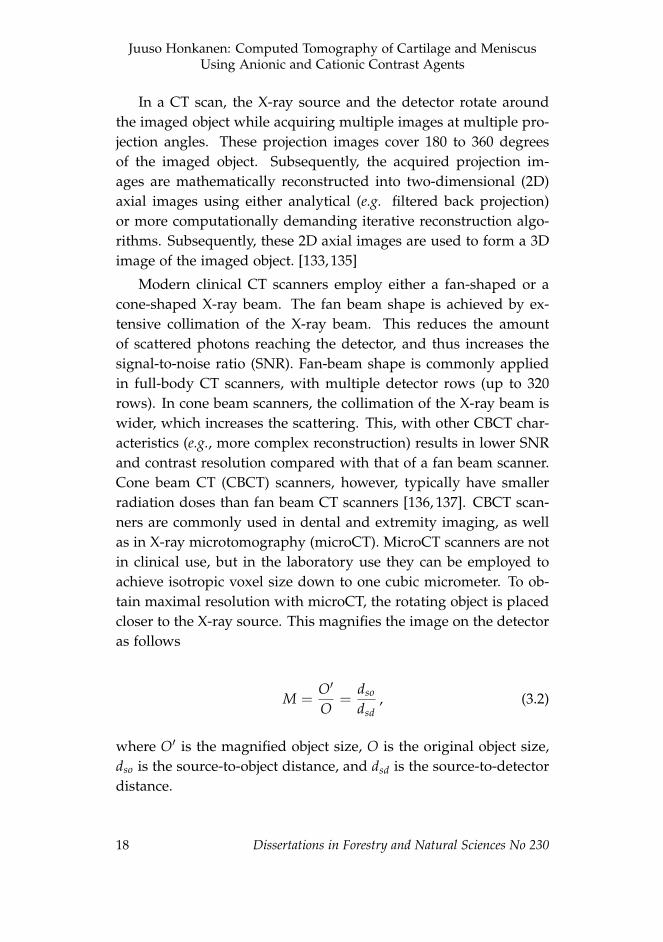
Modern clinical CT scanners employ either a fan-shaped or acone-shaped X-ray beam. The fan beam shape is achieved by ex-tensive collimation of the X-ray beam. This reduces the amountof scattered photons reaching the detector, and thus increases thesignal-to-noise ratio (SNR). Fan-beam shape is commonly appliedin full-body CT scanners, with multiple detector rows (up to 320rows). In cone beam scanners, the collimation of the X-ray beam iswider, which increases the scattering. This, with other CBCT char-acteristics (e.g., more complex reconstruction) results in lower SNRand contrast resolution compared with that of a fan beam scanner.Cone beam CT (CBCT) scanners, however, typically have smallerradiation doses than fan beam CT scanners [136, 137]. CBCT scan-ners are commonly used in dental and extremity imaging, as wellas in X-ray microtomography (microCT). MicroCT scanners are notin clinical use, but in the laboratory use they can be employed toachieve isotropic voxel size down to one cubic micrometer. To ob-tain maximal resolution with microCT, the rotating object is placedcloser to the X-ray source. This magnifies the image on the detectoras follows
M =O′
O=
dso
dsd, (3.2)
where O′ is the magnified object size, O is the original object size,dso is the source-to-object distance, and dsd is the source-to-detectordistance.
18 Dissertations in Forestry and Natural Sciences No 230
ii
ii
ii
ii
Contrast enhanced computed tomography
3.2 CONTRAST AGENTS
Even though soft tissues absorb X-rays, the interface between adja-cent structures (e.g., articular cartilage, meniscus and synovial fluid)can be obscured due to small differences in X-ray attenuation. Thus,contrast agents are often used to help to visualize the tissue of in-terest. In addition, they may be used for probing the biochemicalcomposition or predicting biomechanical properties of the tissue.
Introduced over half a century ago [138], contrast agents areusually iodine based compounds, which can be injected intrave-nously or directly into the location of interest, e.g., intra-articularlyinto a knee joint. They may be non-ionic or ionic, bearing a singleor multiple charges. Traditionally, the contrast agents used withX-ray CT are anionic. Recently, the use of cationic contrast agentsfor the imaging of articular cartilage and the meniscus was alsoproposed [35, 37, 38].
Generally, contrast agents should increase the attenuation differ-ence between the tissue of interest and the surrounding structuresby 200% [139]. Thus, the contrast agents should contain a highatomic number. While the atomic number of iodine is relativelyhigh (Z = 53), it is not as high as that of gold (Z = 79) or bismuth(Z = 83), which are also used as contrast agents [140, 141]. How-ever, the K-edge of iodine (33.2 keV), i.e., a sudden sharp increasein the attenuation of X-rays at the energy level corresponding tothe binding energy of K-shell electrons, is almost ideal for clinicallyused X-ray spectra. In addition, the clinically used contrast agentsshould be non-toxic and cleared from the body within a reasonableamount of time (< 24 h) [139]. Contrast agents can also be tissuespecific when attached to functional carrier molecules [142, 143].
3.3 DIFFUSION OF CONTRAST AGENTS IN CARTILAGEAND MENISCUS
Diffusion is a random Brownian movement of molecules or atomsfrom a higher concentration to a lower concentration. The state
Dissertations in Forestry and Natural Sciences No 230 19
ii
ii
ii
ii
Juuso Honkanen: Computed Tomography of Cartilage and MeniscusUsing Anionic and Cationic Contrast Agents
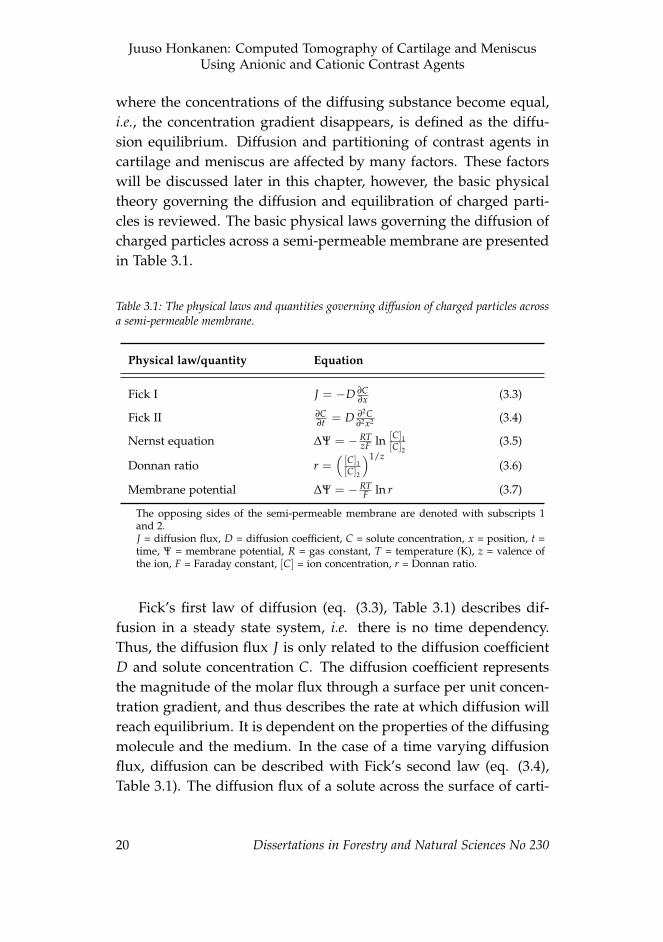
where the concentrations of the diffusing substance become equal,i.e., the concentration gradient disappears, is defined as the diffu-sion equilibrium. Diffusion and partitioning of contrast agents incartilage and meniscus are affected by many factors. These factorswill be discussed later in this chapter, however, the basic physicaltheory governing the diffusion and equilibration of charged parti-cles is reviewed. The basic physical laws governing the diffusion ofcharged particles across a semi-permeable membrane are presentedin Table 3.1.
Table 3.1: The physical laws and quantities governing diffusion of charged particles acrossa semi-permeable membrane.
Physical law/quantity Equation
Fick I J = −D ∂C∂x (3.3)
Fick II ∂C∂t = D ∂2C
∂2x2 (3.4)
Nernst equation ∆Ψ = − RTzF ln [C]1
[C]2(3.5)
Donnan ratio r =([C]1[C]2
)1/z(3.6)
Membrane potential ∆Ψ = − RTF ln r (3.7)
The opposing sides of the semi-permeable membrane are denoted with subscripts 1and 2.J = diffusion flux, D = diffusion coefficient, C = solute concentration, x = position, t =time, Ψ = membrane potential, R = gas constant, T = temperature (K), z = valence ofthe ion, F = Faraday constant, [C] = ion concentration, r = Donnan ratio.
Fick’s first law of diffusion (eq. (3.3), Table 3.1) describes dif-fusion in a steady state system, i.e. there is no time dependency.Thus, the diffusion flux J is only related to the diffusion coefficientD and solute concentration C. The diffusion coefficient representsthe magnitude of the molar flux through a surface per unit concen-tration gradient, and thus describes the rate at which diffusion willreach equilibrium. It is dependent on the properties of the diffusingmolecule and the medium. In the case of a time varying diffusionflux, diffusion can be described with Fick’s second law (eq. (3.4),Table 3.1). The diffusion flux of a solute across the surface of carti-
20 Dissertations in Forestry and Natural Sciences No 230
ii
ii
ii
ii
Contrast enhanced computed tomography
lage or meniscus can be defined as follows
J = −h∂C̄∂t
, (3.8)
where h is the thickness of the tissue and C̄ is the bulk concentrationof the solute within the tissue [25].
The equilibrium state between two charged particles separatedby a semi-permeable membrane is described by the Donnan equi-librium [144]. These charged particles (ions) create an electrical po-tential across the membrane. Small ions are allowed to pass throughthe semi-permeable membrane, but the transit of the larger ions isblocked. The smaller mobile ions diffuse across the membrane untilequilibrium is reached for both electrical charge and concentration.The Nernst equation (eq. (3.5), Table 3.1) describes the distributionof ions at equilibrium, and can be reorganized into the Donnan ratio(eq. (3.6), Table 3.1). This allows the expression of the membranepotential as presented in equation (3.7) (Table 3.1). Furthermore,the Donnan ratio can be presented as
r = 1 +C1
C2, (3.9)
where C1 and C2 are the concentrations of the ions on sides 1 and 2of the membrane [144].
Let us consider a situation where tissue (cartilage or meniscus)sample is immersed and equilibrated in an electrolyte solution.Furthermore, let us assume that mobile ions in a solute bath willdistribute according to the Donnan equilibrium. When the chargeof the ions is taken into account in ideal Donnan conditions, theelectrochemical equilibrium in cartilage or meniscal tissue requiresthat [60, 145]:(
[anion]tissue[anion]bath
)zanion
=
([cation]bath[cation]tissue
)zcation
, (3.10)
where z is the valence of the ion. Furthermore, the tissues are as-sumed to be externally electroneutral, and thus the following mustbe met:
Dissertations in Forestry and Natural Sciences No 230 21
ii
ii
ii
ii
Juuso Honkanen: Computed Tomography of Cartilage and MeniscusUsing Anionic and Cationic Contrast Agents
zcation [cation]bath = zanion [anion]bath (3.11)
and
zcation [cation]tissue = zanion [anion]tissue + FCD , (3.12)
where FCD is the fixed charge density induced by the negativelycharged GAGs in cartilage and meniscus [60, 146].
The equation (3.12) shows how the FCD of cartilage and menis-cus affects the partitioning of charged contrast agents, i.e., anioniccontrast agent molecules are electrostatically repelled by the nega-tive fixed charge of the tissue, whereas cationic contrast agents areelectrostatically attracted. This has also been proven by previousstudies with anionic and cationic contrast agents [28, 35, 39, 147].The diffusion is also affected by the organization and orientation ofthe collagen network, and thereby the structural integrity of the col-lagen matrix [25,30,148]. Furthermore, a previous study reported asignificantly slower diffusion through deep cartilage than throughthe articulating surface due to the greater steric hindrance in thedeep cartilage [29]. The molecular size of the contrast agent hasalso been shown to affect the diffusion; larger molecules are hin-dered more by the cartilage matrix [25, 29, 149]. In addition, varia-tion in the water content relates to the porosity of the tissue, whichagain affects the diffusion [60].
3.4 CONTRAST ENHANCED COMPUTED TOMOGRAPHY
Contrast enhanced computed tomography (CECT) is an X-ray CTtechnique that utilizes contrast agents to visualize and quantify thedifferences in tissue structures and composition. In contrast to CTarthrography, CECT is a dynamic imaging technique where mul-tiple images are acquired at different time points. The later timepoints allow the evaluation of diffusion and partitioning of thecontrast agent, and thus the assessment of the structure or com-position of the tissue [42]. CECT usually refers to contrast en-hanced techniques used for in vitro, in situ, and ex vivo measure-
22 Dissertations in Forestry and Natural Sciences No 230
ii
ii
ii
ii
Contrast enhanced computed tomography
ments while in clinical in vivo measurements, the technique is re-ferred to as delayed CT arthrography or delayed quantitative CTarthrography [150, 151]. Nonetheless, the basic principles are thesame in all of these techniques.
The anionic contrast agents are assumed to distribute inverselyto the FCD in cartilage or meniscus at equilibrium. With cationiccontrast agents, the distribution is assumed to be directly propor-tional to the FCD. Indeed, previous in vitro studies have reporteda strong relationship between the contrast agent concentration andPGs in cartilage and meniscus [24, 27, 35, 41, 42, 147, 152]. However,the distribution of the contrast agent is also affected by the waterand collagen contents, as well as the structural integrity of the tissuematrix [29–32]. Thus, the technique might be sensitive also to otherstructural properties. Moreover, previous studies have shown itspotential to assess the health and mechanical properties of articularcartilage [41, 153, 154].
The equilibrium time is highly dependent on the tissue thick-ness and the molecular size of the contrast agent. Previous stud-ies have reported equilibrium times of over 8 hours in bovine andhuman cartilage with common clinical contrast agent (ioxaglate)[28, 29, 155]. Thus, reaching equilibrium is not feasible in clinicalapplications. However, the relationship between the contrast agentconcentration and the PG concentration has been reported to be sig-nificant at an early stage of diffusion in vitro [155]. Furthermore, arecent in vivo study suggests that CECT enables a feasible tool fordiagnostics and assessment of cartilage lesion already at 45 minutesafter the contrast agent administration [156].
Although CECT has been widely applied to study articular car-tilage in vitro [24, 25, 27, 28, 32, 40–42, 157–159], the potential of thetechnique to quantitatively image meniscus has not been thoroughlystudied. Furthermore, the differences between the diffusion kine-matics of cartilage and meniscus are still unknown.
Dissertations in Forestry and Natural Sciences No 230 23
ii
ii
ii
ii
Juuso Honkanen: Computed Tomography of Cartilage and MeniscusUsing Anionic and Cationic Contrast Agents
24 Dissertations in Forestry and Natural Sciences No 230
ii
ii
ii
ii
4 Aims of the present study
This thesis focuses on the assessment of differences in contrastagent diffusion in cartilage and meniscus.
The specific aims of this thesis were:
1. to evaluate the potential of CECT to image contrast agent dif-fusion in human meniscus with a clinical CBCT scanner.
2. to determine the diffusion kinematics of a small charged mol-ecule (iodine) in cartilage and meniscus.
3. to determine the diffusion kinematics of a novel iodinated cat-ionic contrast agent (CA2+) in cartilage and meniscus.
4. to investigate whether the diffusion of the anionic contrastagent, as imaged with CBCT in an intact human knee joint exvivo, reflects the biochemical, histological and biomechanicalcharacteristics of articular cartilage.
Dissertations in Forestry and Natural Sciences No 230 25

ii
ii
ii
ii
Juuso Honkanen: Computed Tomography of Cartilage and MeniscusUsing Anionic and Cationic Contrast Agents
26 Dissertations in Forestry and Natural Sciences No 230
ii
ii
ii
ii
5 Materials and methods
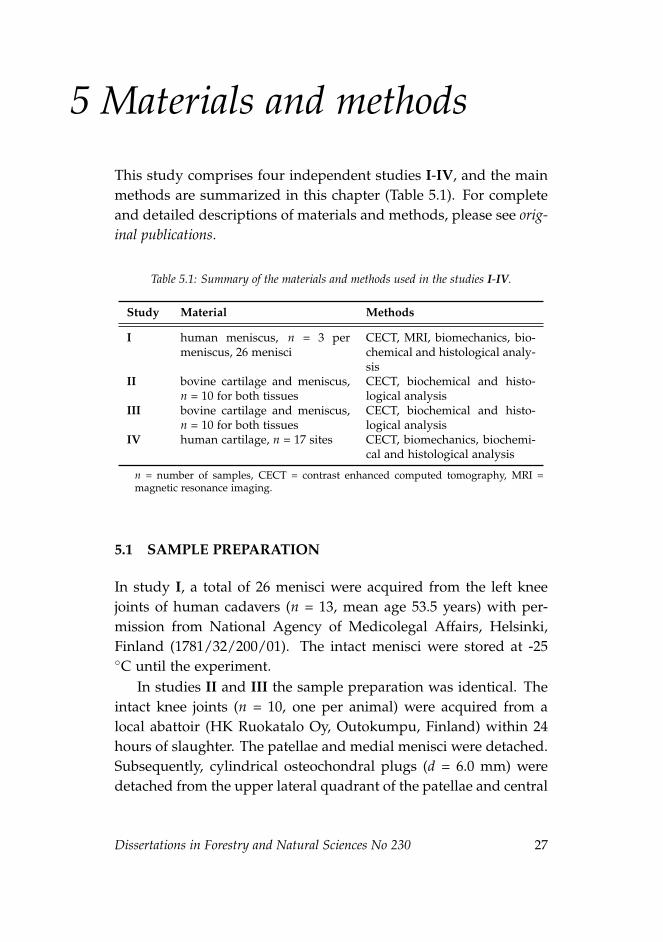
This study comprises four independent studies I-IV, and the mainmethods are summarized in this chapter (Table 5.1). For completeand detailed descriptions of materials and methods, please see orig-inal publications.
Table 5.1: Summary of the materials and methods used in the studies I-IV.
Study Material Methods
I human meniscus, n = 3 permeniscus, 26 menisci
CECT, MRI, biomechanics, bio-chemical and histological analy-sis
II bovine cartilage and meniscus,n = 10 for both tissues
CECT, biochemical and histo-logical analysis
III bovine cartilage and meniscus,n = 10 for both tissues
CECT, biochemical and histo-logical analysis
IV human cartilage, n = 17 sites CECT, biomechanics, biochemi-cal and histological analysis
n = number of samples, CECT = contrast enhanced computed tomography, MRI =magnetic resonance imaging.
5.1 SAMPLE PREPARATION
In study I, a total of 26 menisci were acquired from the left kneejoints of human cadavers (n = 13, mean age 53.5 years) with per-mission from National Agency of Medicolegal Affairs, Helsinki,Finland (1781/32/200/01). The intact menisci were stored at -25◦C until the experiment.
In studies II and III the sample preparation was identical. Theintact knee joints (n = 10, one per animal) were acquired from alocal abattoir (HK Ruokatalo Oy, Outokumpu, Finland) within 24hours of slaughter. The patellae and medial menisci were detached.Subsequently, cylindrical osteochondral plugs (d = 6.0 mm) weredetached from the upper lateral quadrant of the patellae and central
Dissertations in Forestry and Natural Sciences No 230 27
ii
ii
ii
ii
Juuso Honkanen: Computed Tomography of Cartilage and MeniscusUsing Anionic and Cationic Contrast Agents
region of the medial meniscus (d = 6.0 mm) (Figure 5.1). The menis-cus sample was trimmed to be approximately 2.0 mm in height.
Study IV involved the right knee joint of a randomly selectedcadaver (female, 91 years), obtained 4 days after death, with thepermission from the ethical committee of Kuopio University Hos-pital (58//2013). The cadaver was stored at 4 ◦C in the morgue atKuopio University Hospital before the start of the experiment.
5.2 CONTRAST ENHANCED COMPUTED TOMOGRAPHY
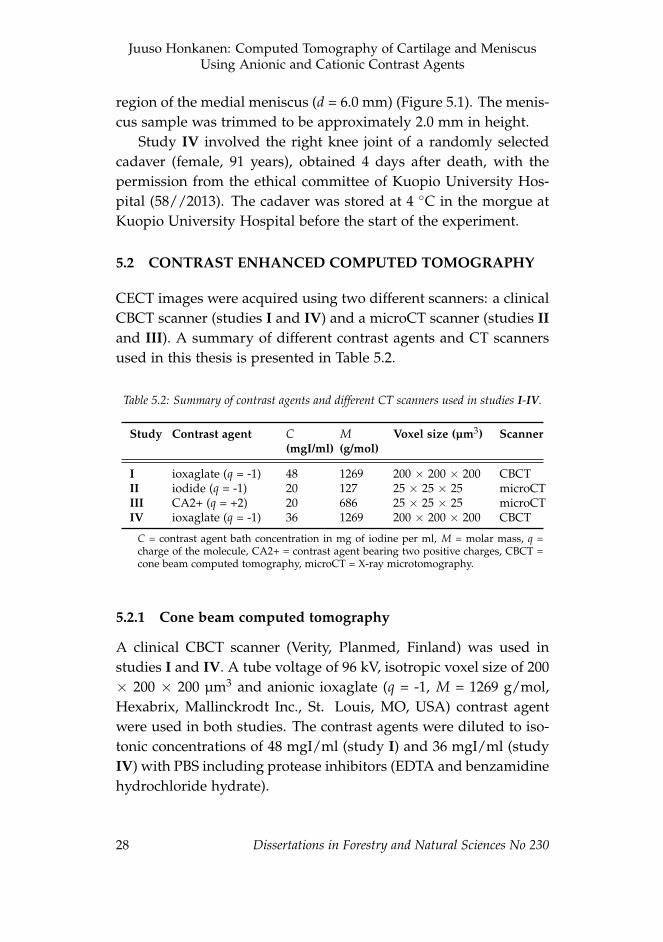
CECT images were acquired using two different scanners: a clinicalCBCT scanner (studies I and IV) and a microCT scanner (studies IIand III). A summary of different contrast agents and CT scannersused in this thesis is presented in Table 5.2.
Table 5.2: Summary of contrast agents and different CT scanners used in studies I-IV.
Study Contrast agent C(mgI/ml)
M(g/mol)
Voxel size (µm3) Scanner
I ioxaglate (q = -1) 48 1269 200 × 200 × 200 CBCTII iodide (q = -1) 20 127 25 × 25 × 25 microCTIII CA2+ (q = +2) 20 686 25 × 25 × 25 microCTIV ioxaglate (q = -1) 36 1269 200 × 200 × 200 CBCT
C = contrast agent bath concentration in mg of iodine per ml, M = molar mass, q =charge of the molecule, CA2+ = contrast agent bearing two positive charges, CBCT =cone beam computed tomography, microCT = X-ray microtomography.
5.2.1 Cone beam computed tomography
A clinical CBCT scanner (Verity, Planmed, Finland) was used instudies I and IV. A tube voltage of 96 kV, isotropic voxel size of 200× 200 × 200 µm3 and anionic ioxaglate (q = -1, M = 1269 g/mol,Hexabrix, Mallinckrodt Inc., St. Louis, MO, USA) contrast agentwere used in both studies. The contrast agents were diluted to iso-tonic concentrations of 48 mgI/ml (study I) and 36 mgI/ml (studyIV) with PBS including protease inhibitors (EDTA and benzamidinehydrochloride hydrate).
28 Dissertations in Forestry and Natural Sciences No 230
ii
ii
ii
ii
Materials and methods
In study I, the menisci were imaged before the contrast agentimmersion and at 10, 20, 30, 40, 50 min and, 1, 2, 3, 4, 5, 10, 15,20, 25, and 30 h after that. In study IV, the knee joint of a humancadaver was imaged before contrast agent injection and thereafterat 10, 20, 30, 40, 50 min, and 1, 2, 4, 6, 9, 16, 36, 61 h time points.Additional contrast agent was injected 16 and 35 h after the ini-tial injection. The image and data analyses were conducted withAnalyze software (v. 10.0-11.0, AnalyzeDirect, Inc., KS, USA) andMATLAB (R2011a, MathWorks, Inc., Natick, MA, USA).
5.2.2 X-ray microtomography
A microCT scanner (SkyScan 1172, SkyScan, Kontich, Belgium) wasused in studies II and III. In both studies, 100 kV tube voltageand 25 × 25 × 25 µm3 isotropic voxel size was used. In study II,phosphate buffered atomic iodine (dissolved NaI, q = -1, M = 126.9g/mol, Sigma–Aldrich Inc., St. Louis, MO, USA) including proteaseinhibitors was used. Cationic contrast agent (CA2+, q = +2, M = 686g/mol) diluted with PBS including protease inhibitors was usedin study III. In both studies, a contrast agent concentration of 20mgI/ml was used. The osmolalities of the contrast agent solutionswere 350 and 330 mOsm/kg in studies II and III, respectively.
Images were acquired before contrast agent immersion and atthe time points of: 10, 20, 30, 40, 50, 60, 70, 80, 90, 100 min, and 2,2.5, 3, 3.5, 4, 4.5, 5, 6, 7, 16, 23 h (study II); 10, 20, 30, 40, 50, 60, 70,80, 90, 100 min, and 2, 2.5, 3, 3.5, 4, 4.5, 5, 6, 7, 16, 20, 24, 28, 44, 46,48 h (study III). The image and data analyses were conducted withMATLAB (R2012a, MathWorks, Inc., Natick, MA, USA).
5.3 REFERENCE METHODS
5.3.1 Histological and biochemical analyses
For the histological analysis (Figure 5.1), the samples were fixedin 10% formalin, decalcified (osteochondral samples), processed ingraded alcohol solutions, embedded in paraffin, and cut into 3 and
Dissertations in Forestry and Natural Sciences No 230 29
ii
ii
ii
ii
Juuso Honkanen: Computed Tomography of Cartilage and MeniscusUsing Anionic and Cationic Contrast Agents
5 µm thick sections for analysis of PG and collagen distributions,respectively. The paraffin was dissolved and the 3 µm sections werestained with Safranin-O, which as a cationic dye, binds to neg-atively charged GAGs indicating the PG distribution in the sam-ple [160]. Subsequently, optical density (OD) measurements usingquantitative digital densitometry (DD) were conducted to reveal thespatial distribution of the stain, and thus the PG distribution [54].
In study IV, the severity of OA was evaluated from the Safranin-O stained sections according to the modified Mankin [161] andOARSI [162] grading systems. The modified Mankin grading as-sesses the abnormalities in structure, cellularity and Safranin-O stain-ing while the OARSI grading system evaluates the integrity of thecartilage matrix.
The spatial distribution of collagen in the tissue was measuredvia Fourier transform infrared (FTIR) spectroscopy [163, 164]. The5 µm thick sections were placed on Zinc-Selenide (ZnSe) infrared-windows. As the specific absorption spectra of amide I (1590–1720cm−1), corresponding to collagen, is known, the spatial distributionof collagen in cartilage and meniscus can be determined from theFTIR images [163].
In the biochemical analyses (Figure 5.1), the water, hydroxypro-line (collagen) and uronic acid (PG) contents were determined. Thewater contents of the samples were determined from the differencebetween the wet and dry weights before and after lyophilization, i.e.freeze-drying. The hydroxyproline content was determined fromthe lyophilized samples with a spectrophotometric assay after pa-pain digestion [165]. The uronic acid content was quantified fromthe ethanol-precipitated samples dissolved in water [166].
5.3.2 Mechanical testing
In studies I and IV, a custom-made material testing system in-cluding a high precision load cell (Model 31/AL311AR, Honey-well, Columbus, OH, USA; resolution: 0.005 N) and an actuator(PM1A1798, Newport Corporation, Irvine, CA, USA; resolution:0.1 µm) were used for indentation testing [167]. In both studies,
30 Dissertations in Forestry and Natural Sciences No 230
ii
ii
ii
ii
Materials and methods
a stress-relaxation protocol was implemented using a ramp rate of100%/s and four compressive steps (4 × 5% of sample thickness).The relaxation criteria of < 10 Pa/min (study I) or 20 minutes (studyIV) were used. The equilibium (Eeq) and instantaneous (Ei) moduliwere calculated with Poisson’s ratios of ν = 0.1 and ν = 0.5, respec-tively, in accordance with Hayes et al. [168].
5.3.3 Magnetic resonance imaging
The menisci in study I were imaged with a 3.0 T clinical MRIscanner (Achieva-3T, Philips Medical Systems, Amsterdam, Nether-lands) utilizing a standard clinical MRI-protocol for the knee joint.After blind coding, the images were interpreted and graded twiceby two musculoskeletal radiologists according to Lotysch et al. [169]and Crues et al. [170].
5.4 STATISTICAL ANALYSES
In study I, the Wilcoxon signed rank test was applied to study thesignificance of the differences between the parameter values de-termined for different meniscal locations and subregions. In ad-dition, Pearson’s correlation coefficients (r) between the biochem-ical, histological, biomechanical, MRI and CECT parameters weredetermined. In studies II and III, the Wilcoxon signed rank testwas applied to study the significance of the differences betweenthe parameter values of cartilage and meniscus. In addition, Spear-man’s rho (ρ) was determined to analyze the significance of rela-tionships between the contrast agent partition and reference pa-rameters. In study III, a multiple linear regression analysis wasconducted between the compositional parameters (i.e., water, hy-droxyproline and uronic acid contents) and the contrast agent par-tition of pooled cartilage and meniscus samples. In study IV, therelationships between the reference parameter values and X-ray at-tenuation were evaluated using Pearson’s correlation analysis. Thestatistical tests were conducted using SPSS (v. 19.0.0.2 and 21.0.0.0,SPPS Inc., IBM Company, Armonk, NY, USA).
Dissertations in Forestry and Natural Sciences No 230 31
ii
ii
ii
ii
Juuso Honkanen: Computed Tomography of Cartilage and MeniscusUsing Anionic and Cationic Contrast Agents
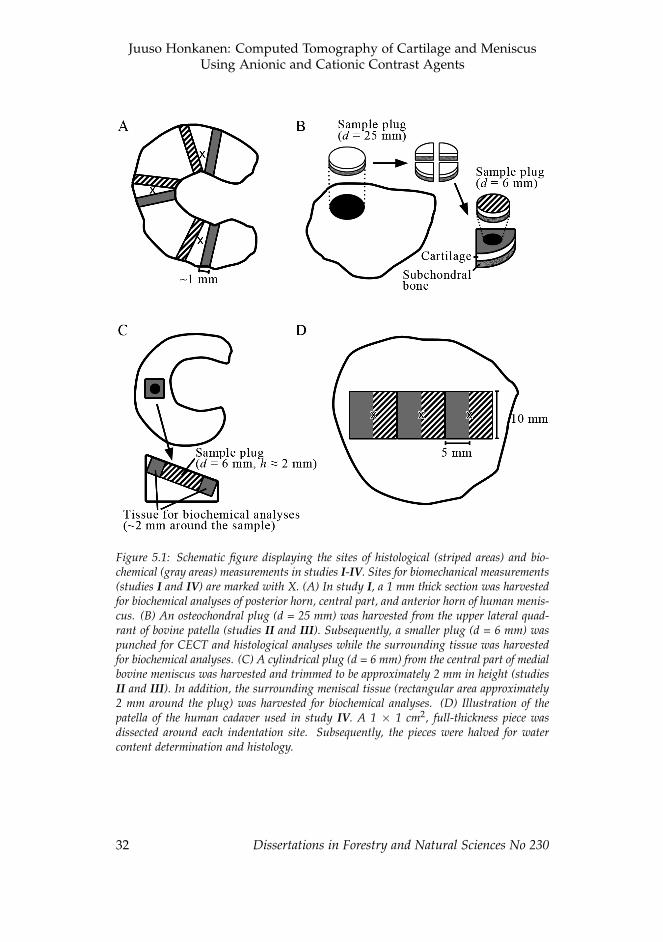
Figure 5.1: Schematic figure displaying the sites of histological (striped areas) and bio-chemical (gray areas) measurements in studies I-IV. Sites for biomechanical measurements(studies I and IV) are marked with X. (A) In study I, a 1 mm thick section was harvestedfor biochemical analyses of posterior horn, central part, and anterior horn of human menis-cus. (B) An osteochondral plug (d = 25 mm) was harvested from the upper lateral quad-rant of bovine patella (studies II and III). Subsequently, a smaller plug (d = 6 mm) waspunched for CECT and histological analyses while the surrounding tissue was harvestedfor biochemical analyses. (C) A cylindrical plug (d = 6 mm) from the central part of medialbovine meniscus was harvested and trimmed to be approximately 2 mm in height (studiesII and III). In addition, the surrounding meniscal tissue (rectangular area approximately2 mm around the plug) was harvested for biochemical analyses. (D) Illustration of thepatella of the human cadaver used in study IV. A 1 × 1 cm2, full-thickness piece wasdissected around each indentation site. Subsequently, the pieces were halved for watercontent determination and histology.
32 Dissertations in Forestry and Natural Sciences No 230
ii
ii
ii
ii
6 Results
This chapter summarizes the most important results of studies I-IV.For additional details and complete results, see the original publica-tions attached to the thesis as appendices.
6.1 CONTRAST ENHANCED COMPUTED TOMOGRAPHY OFHUMAN MENISCUS
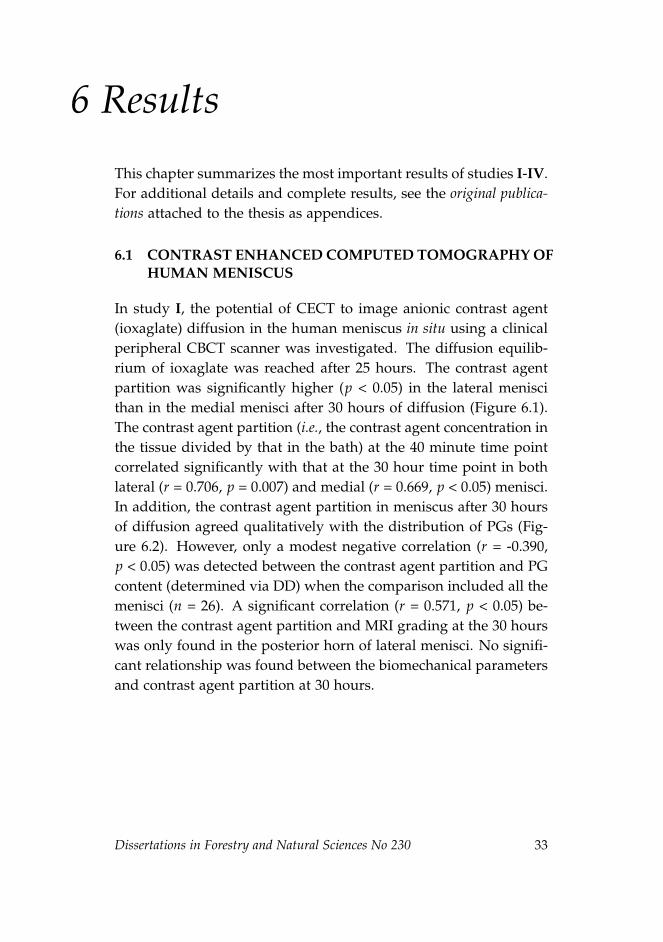
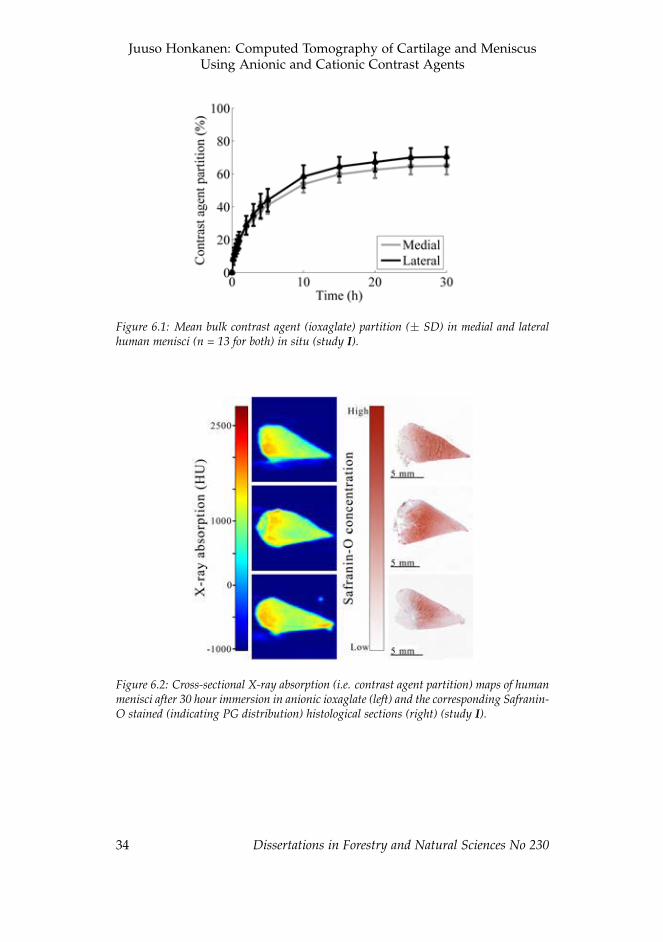
In study I, the potential of CECT to image anionic contrast agent(ioxaglate) diffusion in the human meniscus in situ using a clinicalperipheral CBCT scanner was investigated. The diffusion equilib-rium of ioxaglate was reached after 25 hours. The contrast agentpartition was significantly higher (p < 0.05) in the lateral meniscithan in the medial menisci after 30 hours of diffusion (Figure 6.1).The contrast agent partition (i.e., the contrast agent concentration inthe tissue divided by that in the bath) at the 40 minute time pointcorrelated significantly with that at the 30 hour time point in bothlateral (r = 0.706, p = 0.007) and medial (r = 0.669, p < 0.05) menisci.In addition, the contrast agent partition in meniscus after 30 hoursof diffusion agreed qualitatively with the distribution of PGs (Fig-ure 6.2). However, only a modest negative correlation (r = -0.390,p < 0.05) was detected between the contrast agent partition and PGcontent (determined via DD) when the comparison included all themenisci (n = 26). A significant correlation (r = 0.571, p < 0.05) be-tween the contrast agent partition and MRI grading at the 30 hourswas only found in the posterior horn of lateral menisci. No signifi-cant relationship was found between the biomechanical parametersand contrast agent partition at 30 hours.
Dissertations in Forestry and Natural Sciences No 230 33
ii
ii
ii
ii
Juuso Honkanen: Computed Tomography of Cartilage and MeniscusUsing Anionic and Cationic Contrast Agents
Figure 6.1: Mean bulk contrast agent (ioxaglate) partition (± SD) in medial and lateralhuman menisci (n = 13 for both) in situ (study I).
Figure 6.2: Cross-sectional X-ray absorption (i.e. contrast agent partition) maps of humanmenisci after 30 hour immersion in anionic ioxaglate (left) and the corresponding Safranin-O stained (indicating PG distribution) histological sections (right) (study I).
34 Dissertations in Forestry and Natural Sciences No 230
ii
ii
ii
ii
Results
6.2 DIFFUSION KINEMATICS IN BOVINE ARTICULARCARTILAGE AND MENISCUS
The contrast agent partition (i.e. normalized attenuation) was sig-nificantly higher (p < 0.05) in the meniscus than in cartilage after70 minutes of diffusion, when an anionic contrast agent (atomiciodine) was used (Table 6.1, Figure 6.3A, study II). Furthermore,when the cationic contrast agent (CA2+) was used, the contrastagent partition was significantly higher (p < 0.05) in cartilage thanin meniscus after 50 minutes of diffusion (Table 6.1, Figure 6.3B,study III). The contrast agent distribution within the cartilage andmeniscus sample plugs was found to be different with both con-trast agents (Figure 6.4). However, no statistically significant dif-ference was recorded in equilibrium times of cartilage and menis-cus with anionic or cationic contrast agent. When all the sampleswere pooled (n = 20), the compositional parameters significantlypredicted the contrast agent partition at 48 hours: F(3, 16) = 27.934,R2 = 0.840, p < 0.001. However, only the uronic acid content was asignificant (p < 0.05) predictor of the contrast agent partition (studyIII).
Dissertations in Forestry and Natural Sciences No 230 35
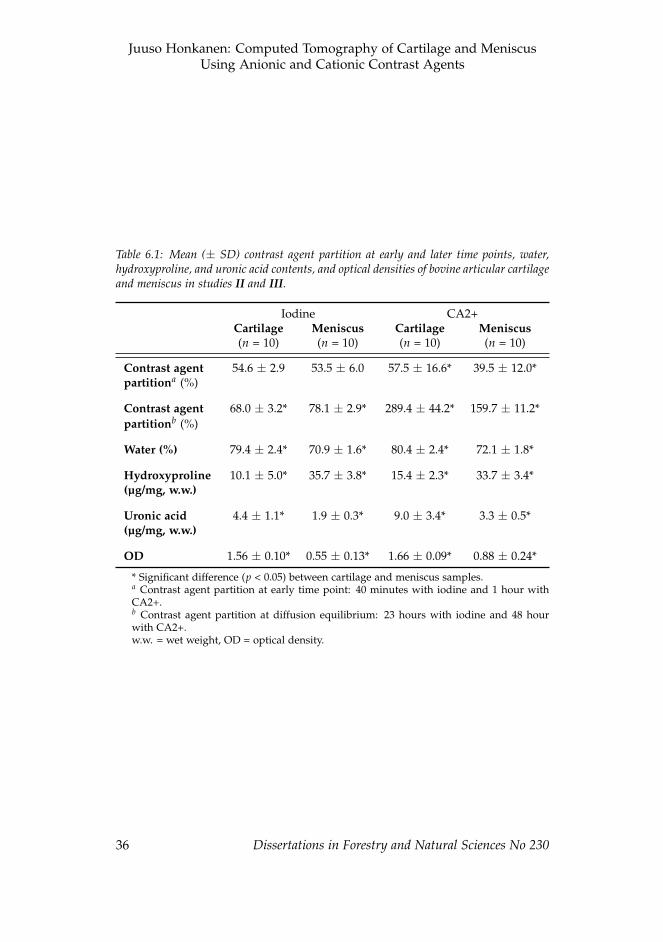
ii
ii
ii
ii
Juuso Honkanen: Computed Tomography of Cartilage and MeniscusUsing Anionic and Cationic Contrast Agents
Table 6.1: Mean (± SD) contrast agent partition at early and later time points, water,hydroxyproline, and uronic acid contents, and optical densities of bovine articular cartilageand meniscus in studies II and III.
Iodine CA2+Cartilage Meniscus Cartilage Meniscus(n = 10) (n = 10) (n = 10) (n = 10)
Contrast agent 54.6 ± 2.9 53.5 ± 6.0 57.5 ± 16.6* 39.5 ± 12.0*partitiona (%)
Contrast agent 68.0 ± 3.2* 78.1 ± 2.9* 289.4 ± 44.2* 159.7 ± 11.2*partitionb (%)
Water (%) 79.4 ± 2.4* 70.9 ± 1.6* 80.4 ± 2.4* 72.1 ± 1.8*
Hydroxyproline 10.1 ± 5.0* 35.7 ± 3.8* 15.4 ± 2.3* 33.7 ± 3.4*(µg/mg, w.w.)
Uronic acid 4.4 ± 1.1* 1.9 ± 0.3* 9.0 ± 3.4* 3.3 ± 0.5*(µg/mg, w.w.)
OD 1.56 ± 0.10* 0.55 ± 0.13* 1.66 ± 0.09* 0.88 ± 0.24*
* Significant difference (p < 0.05) between cartilage and meniscus samples.a Contrast agent partition at early time point: 40 minutes with iodine and 1 hour withCA2+.b Contrast agent partition at diffusion equilibrium: 23 hours with iodine and 48 hourwith CA2+.w.w. = wet weight, OD = optical density.
36 Dissertations in Forestry and Natural Sciences No 230
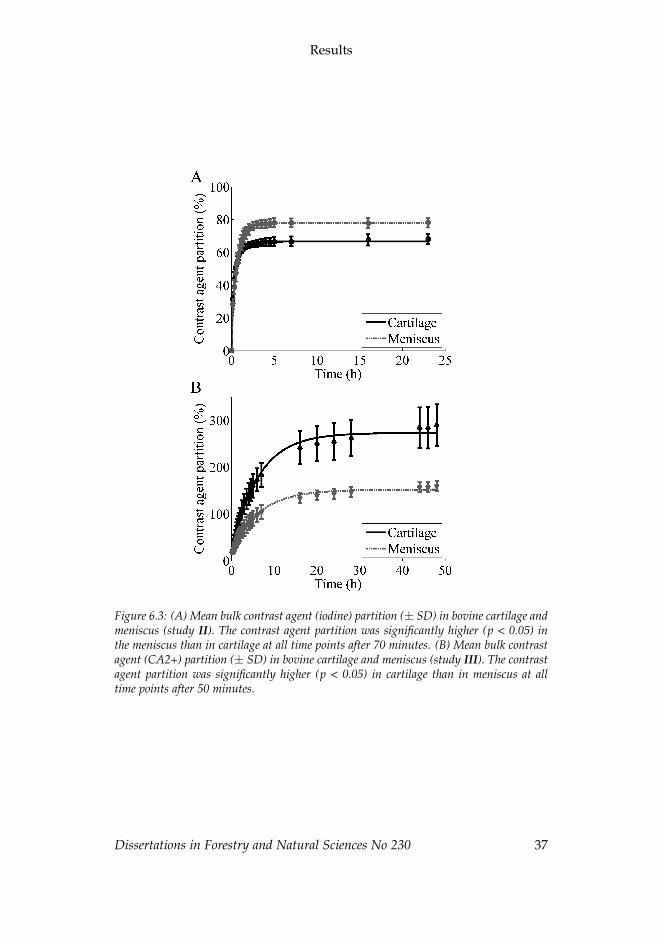
ii
ii
ii
ii
Results
Figure 6.3: (A) Mean bulk contrast agent (iodine) partition (± SD) in bovine cartilage andmeniscus (study II). The contrast agent partition was significantly higher (p < 0.05) inthe meniscus than in cartilage at all time points after 70 minutes. (B) Mean bulk contrastagent (CA2+) partition (± SD) in bovine cartilage and meniscus (study III). The contrastagent partition was significantly higher (p < 0.05) in cartilage than in meniscus at alltime points after 50 minutes.
Dissertations in Forestry and Natural Sciences No 230 37
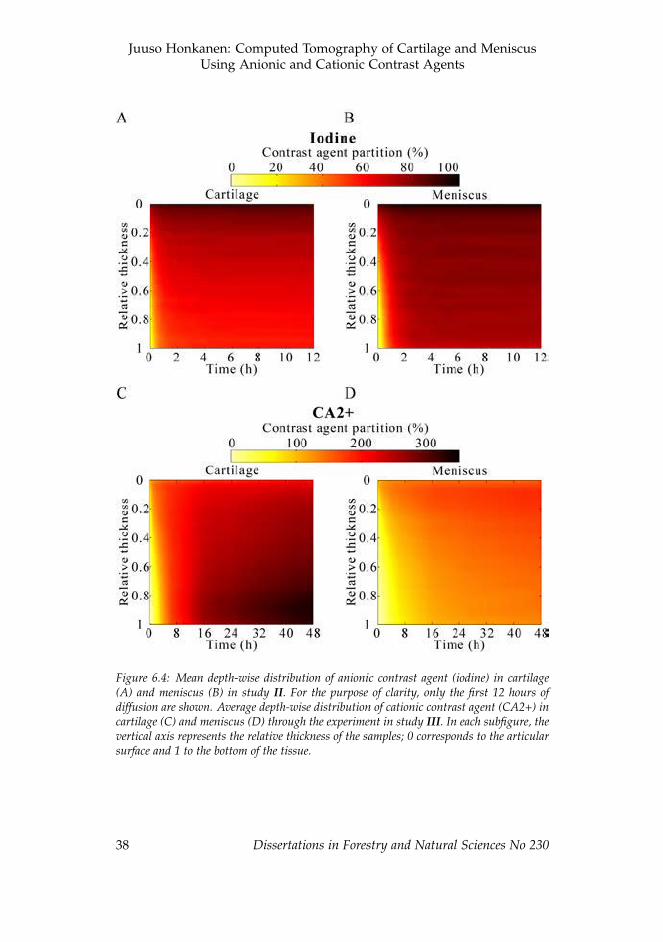
ii
ii
ii
ii
Juuso Honkanen: Computed Tomography of Cartilage and MeniscusUsing Anionic and Cationic Contrast Agents
Figure 6.4: Mean depth-wise distribution of anionic contrast agent (iodine) in cartilage(A) and meniscus (B) in study II. For the purpose of clarity, only the first 12 hours ofdiffusion are shown. Average depth-wise distribution of cationic contrast agent (CA2+) incartilage (C) and meniscus (D) through the experiment in study III. In each subfigure, thevertical axis represents the relative thickness of the samples; 0 corresponds to the articularsurface and 1 to the bottom of the tissue.
38 Dissertations in Forestry and Natural Sciences No 230
ii
ii
ii
ii
Results
6.3 CONTRAST ENHANCED COMPUTED TOMOGRAPHYOF CADAVERIC ARTICULAR CARTILAGE
The CECT imaging using ioxaglate enabled a quantitative distinc-tion of cartilage quality between the intra-joint regions soon afterthe contrast agent injection as well as at later time points (Figure6.5). Furthermore, X-ray attenuation in the CECT images corre-lated significantly (p < 0.05) with cartilage water and PG contents,Mankin score, and equilibrium and instantaneous moduli at earlytime points (< 1 h) as well as at later time points (Figure 6.6). Inaddition, the X-ray attenuation at very early time points (< 30 min)was related (p < 0.05) to the collagen content and the OARSI score(Figure 6.6B). The X-ray attenuation at early time points (< 2 h)correlated (p < 0.05) with those at the later time points (16 - 61 h).
Dissertations in Forestry and Natural Sciences No 230 39
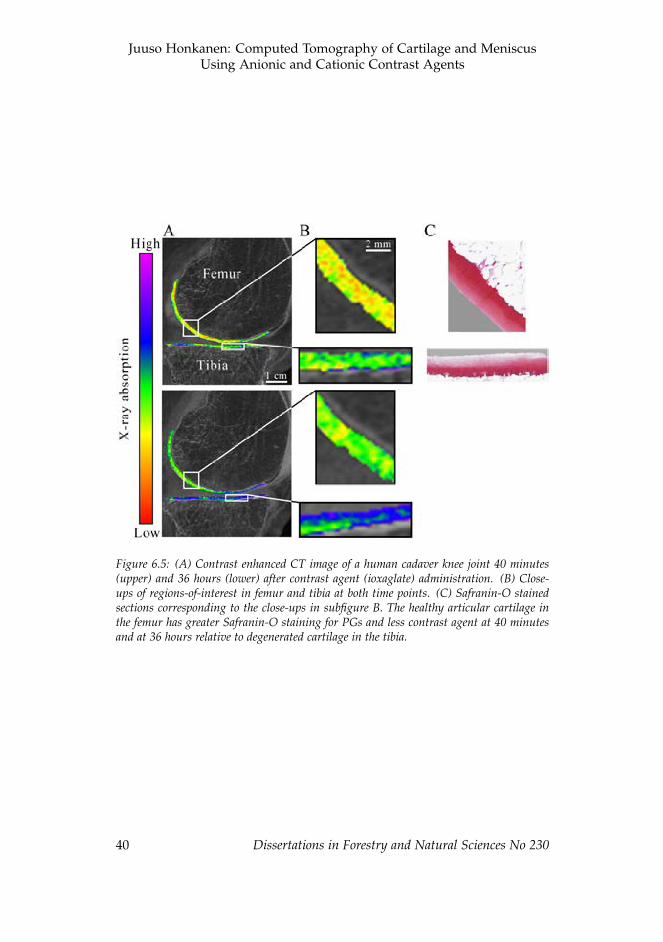
ii
ii
ii
ii
Juuso Honkanen: Computed Tomography of Cartilage and MeniscusUsing Anionic and Cationic Contrast Agents
Figure 6.5: (A) Contrast enhanced CT image of a human cadaver knee joint 40 minutes(upper) and 36 hours (lower) after contrast agent (ioxaglate) administration. (B) Close-ups of regions-of-interest in femur and tibia at both time points. (C) Safranin-O stainedsections corresponding to the close-ups in subfigure B. The healthy articular cartilage inthe femur has greater Safranin-O staining for PGs and less contrast agent at 40 minutesand at 36 hours relative to degenerated cartilage in the tibia.
40 Dissertations in Forestry and Natural Sciences No 230
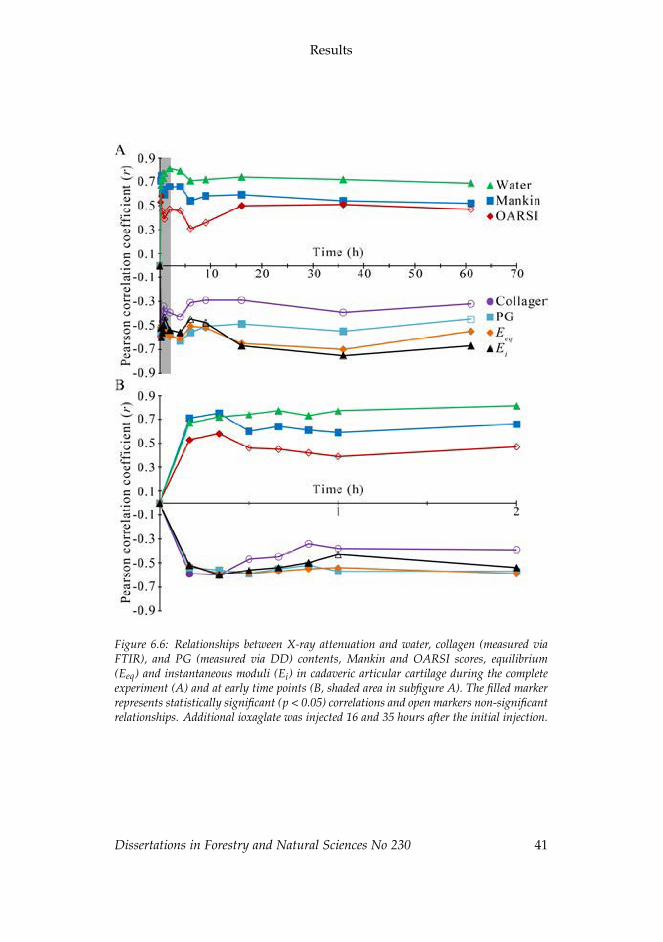
ii
ii
ii
ii
Results
Figure 6.6: Relationships between X-ray attenuation and water, collagen (measured viaFTIR), and PG (measured via DD) contents, Mankin and OARSI scores, equilibrium(Eeq) and instantaneous moduli (Ei) in cadaveric articular cartilage during the completeexperiment (A) and at early time points (B, shaded area in subfigure A). The filled markerrepresents statistically significant (p < 0.05) correlations and open markers non-significantrelationships. Additional ioxaglate was injected 16 and 35 hours after the initial injection.
Dissertations in Forestry and Natural Sciences No 230 41

ii
ii
ii
ii
Juuso Honkanen: Computed Tomography of Cartilage and MeniscusUsing Anionic and Cationic Contrast Agents
42 Dissertations in Forestry and Natural Sciences No 230
ii
ii
ii
ii
7 Discussion
In this thesis, contrast enhanced computed tomography (CECT)was used to investigate differences in contrast agent diffusion inarticular cartilage and meniscus. Intact human menisci and artic-ular cartilage as well as bovine osteochondral and meniscal plugswere used. Three different contrast agents were used in studies I-IV, i.e. two anionic contrast agents (ioxaglate and atomic iodine)and a novel cationic contrast agent bearing two positive charges(CA2+).
In study I, the potential of CECT to image contrast agent dif-fusion in human meniscus with clinical peripheral cone beam CT(CBCT) scanner was evaluated. In studies II and III, the diffusionkinematics of atomic iodine and CA2+ was determined in bovinecartilage and meniscus. The potential of CBCT with an anioniccontrast agent to reflect differences in the biochemical, histologi-cal and biomechanical characteristics of articular cartilage betweenintra-joint regions was evaluated ex vivo in study IV.
7.1 CONTRAST ENHANCED COMPUTED TOMOGRAPHY OFHUMAN MENISCUS
Contrast agent partition at 40 minutes correlated significantly withthat at the equilibrium. The diffusion equilibrium was reached af-ter 25 hours. A previous study with a substantially larger bovinemeniscus reported over 90 hours’ diffusion time [35]. In articularcartilage, anionic contrast agents reach the diffusion equilibriumwithin 20 hours [24, 28, 155]. These differences in diffusion timesarise mainly from the differences in the diffusion distance (i.e. tis-sue thickness).
In clinical applications, diffusion times of several hours are notfeasible. Furthermore, as the contrast agents start to dilute and ef-flux from the joint space immediately after the injection, the sensi-tivity of the method decreases as the interval between the injection
Dissertations in Forestry and Natural Sciences No 230 43
ii
ii
ii
ii
Juuso Honkanen: Computed Tomography of Cartilage and MeniscusUsing Anionic and Cationic Contrast Agents
and imaging increases [151, 171]. Hence, multiple intra-articularinjections would be required to maintain the contrast agent concen-tration high enough in the joint capsule during a long delay beforethe imaging. However, a shorter delay (e.g. 40 minutes) between thecontrast agent injection and imaging could be feasible for the eval-uation of the integrity of articular cartilage as proposed in recentin vivo study [156]. Similarly, a shorter delay for imaging of menis-cal pathologies is supported by the presently reported relationshipbetween the contrast agent partition after 40 minutes and 30 hoursof diffusion. Moreover, the meniscal tears and macroscopic lesionscould be detected in arthrographic images acquired immediatelyafter the contrast agent injection while the assessment of the healthof internal structures could be evaluated from the delayed images.However, it must be noted that the contrast agent distribution wellbefore diffusion equilibrium will not indicate the PG distribution orconcentration within the meniscus, but rather the overall integrityof the tissue.
The diffusion rate is dependent on the temperature, as the Brow-nian movement of contrast agent molecules and the viscosity ofthe contrast agent are temperature dependent [172, 173]. Thus, thediffusion rate might be higher within a living knee joint than atroom temperature. Furthermore, the diffusion may be further ac-celerated by exercising the joint after the contrast agent administra-tion [33, 35, 126, 151].
The anionic contrast agent partition showed a qualitative inverseagreement with the spatial distribution of PGs after 30 hours of dif-fusion. However, only a modest negative correlation was foundwith contrast agent partition and the PG content when all the re-gions of all the menisci were pooled. Although a negative relation-ship has been reported between contrast agent partition and the PGcontent in bovine meniscus [35], the water content and integrity ofthe matrix also contributes to the contrast agent distribution withinthe tissue [29–32]. This, and the relatively low content of PGs in themeniscus [7], could explain the lack of stronger relationship.
Even though indentation measurement is not the most com-
44 Dissertations in Forestry and Natural Sciences No 230
ii
ii
ii
ii
Discussion
monly used method to study the biomechanical properties of themeniscus, it was applied in study I in order to keep the menisciintact. Furthermore, the indentation testing is more prone to as-sess the superficial characteristics rather than bulk properties of thetissue. It is believed that this is the reason why no significant rela-tionship was found between contrast agent partition at equilibriumand compressive biomechanical properties.
7.2 DIFFUSION AND DISTRIBUTION OF CONTRASTAGENTS IN BOVINE CARTILAGE AND MENISCUS
In studies II and III, the diffusion kinematics of contrast agent wasstudied in bovine cartilage and meniscus. Both studies included tenosteochondral and meniscal plugs while an anionic contrast agent(atomic iodine) was used in study II and a novel cationic contrastagent (CA2+) was used in study III.
The contrast agent partition (i.e. normalized attenuation) atequilibrium was significantly higher in meniscus than in cartilagewhen atomic iodine was used while the order was opposite withCA2+. These findings are most likely due to differences in thePG contents of cartilage and meniscus: due to the higher PG con-tent of cartilage, the anionic contrast agents are electrostatically re-pelled while cationic ones are electrostatically attracted more thanin meniscus.
The diffusion of contrast agents is driven by the concentrationgradient between the contrast agent bath and tissue as well as theelectrochemical gradient between the charge of the contrast agentmolecules and the FCD of the tissue. At equilibrium, the concentra-tion gradient is balanced with the electrochemical gradient. Hence,the anionic contrast agents equilibrate at partitions lower than 100%of the initial bath concentration while cationic agents equilibrate atpartitions over 100%.
The equilibrium contrast agent partition with atomic iodine incartilage was consistent with that reported in previous studies [29,148, 174]. As the diffusion of iodine in the meniscus was inves-
Dissertations in Forestry and Natural Sciences No 230 45
ii
ii
ii
ii
Juuso Honkanen: Computed Tomography of Cartilage and MeniscusUsing Anionic and Cationic Contrast Agents
tigated for the first time in study II, no comparison can be con-ducted with previous studies. Furthermore, the majority of pre-vious CECT studies using cationic contrast agents have reportedattenuation values in Hounsfield units rather than in partition [35,37, 39, 152, 175]. However, a previous study with a cationic con-trast agent bearing four positive charges (CA4+) [176] reported av-erage equilibrium partition (i.e., contrast agent uptake ratio) of 238± 26% within bovine osteochondral plugs, which was lower thanreported in study III with CA2+ (289 ± 44%). However, the equi-librium partition of CA4+ should presumably be higher due to itsgreater charge. This discrepancy could be due to the difference inthe molecular weights (686 g/mol vs. 1354 g/mol in CA2+ andCA4+, respectively); the tight collagen matrix may exclude CA4+from certain areas that are accessible for CA2+. In addition, sub-stantially shorter equilibrium times were used with CA4+ (24 vs.48 hours).
In articular cartilage, the depth-wise contrast agent distributionwas different between atomic iodine and CA2+. With iodine, thehighest concentration was detected at the superficial zone whilethe concentration decreased towards the deep zone. With CA2+,the distribution was opposite: the concentration was found to in-crease with tissue depth. Thus, the contrast agent distribution atequilibrium suggested dependency on the PG distribution. Inter-estingly, the contrast agent distribution in the meniscus was similarwith both contrast agents. This suggests that the contrast agent dis-tribution in the meniscus may be related more to other factors, suchas water and collagen distribution, rather than the PG distribution.
Although the contrast agent distribution was different betweenarticular cartilage and meniscus, no significant difference was foundin equilibrium times between the tissues with anionic or cationiccontrast agents. In the case of atomic iodine, the steric hindrancecaused by the tissue matrix is likely to have only a minor influenceon the diffusion due to small molecular size (M = 127 g/mol) of thecontrast agent. Thus, the diffusion equilibrium is reached approx-imately at the same time in both tissues. The diffusion of CA2+,
46 Dissertations in Forestry and Natural Sciences No 230
ii
ii
ii
ii
Discussion
being a bigger molecule (M = 686 g/mol), is probably affected bythe steric hindrance of the matrix. The higher collagen content ofthe meniscus likely induces greater steric hindrance resulting in aslower diffusion flux than in cartilage. The flux was greater in thecartilage and the amount of contrast agent diffused into cartilagewas substantially greater: the bulk equilibrium partition in carti-lage was almost two fold to that in the meniscus. Moreover, themajority of CA2+ accumulated close to the articulating surface inthe meniscus samples while in the deep zone of cartilage samples.Probably due to these differences, CA2+ equilibrated within sameamount of time in cartilage and meniscus.
Clearly the different diffusion rates between the two contrastagents affect their feasibility in different applications. Atomic io-dine should be safe enough for clinical use [29, 177]. In addition,it reaches near diffusion equilibrium partition within a reasonableamount of time; 88 and 81% of the partition at diffusion equilib-rium was reached within the first hour in cartilage and meniscus,respectively. However, the small molecular size limits its capabil-ity to evaluate the integrity of the matrix [25]. At clinically rele-vant time points (i.e., far prior diffusion equilibrium), cationic con-trast agents may have a limited potential to assess the degenerativestate of cartilage or meniscus. Unlike with anionic contrast agents,cationic contrast agents will initially diffuse into the tissue relativelyindependently of its degenerative state, and only later on will thecontrast agents accumulate in those areas with a higher FCD. Inaddition, the long diffusion times limit the feasibility of exploit-ing cationic contrast agents in clinical in vivo measurements. How-ever, CECT using cationic contrast agents enable promising imagingtechnique for laboratory purposes. For example, cationic contrastagents could be used for non-destructive CT based 3D histopatho-logical evaluation of the knee joint [178]. However, contrast agentbath concentration must be maintained high enough during the ex-periment, which in the case of an intact knee joint, would requiremultiple contrast agent injections or some kind of circulation sys-tem.
Dissertations in Forestry and Natural Sciences No 230 47
ii
ii
ii
ii
Juuso Honkanen: Computed Tomography of Cartilage and MeniscusUsing Anionic and Cationic Contrast Agents
7.3 ASSESSMENT OF CARTILAGE HEALTH AND MECHAN-ICAL PROPERTIES USING CONTRAST ENHANCED COM-PUTED TOMOGRAPHY
The X-ray attenuation in ioxaglate enhanced CBCT images wasfound to correlate with the cartilage water and PG contents, theMankin score, and equilibrium and instantaneous moduli within aclinically feasible time frame, i.e. after less than 2 hours of diffu-sion (study IV). In addition, at the earliest time points (10 and 20minutes), correlations were seen with the collagen content and theOARSI scoring. This probably results from that the OARSI scoringfocuses highly on the integrity of the matrix [162]. Moreover, thecollagen content and matrix integrity are likely to influence the dif-fusion during the first few minutes, and thus no significant correla-tion was found between 30 minutes and 2 hours. OARSI score cor-related also to the X-ray attenuation immediately after additionalioxaglate injections (at 16 and 35 hours), which supports this pro-posal.
The strength as well as the significance of the correlations be-tween X-ray attenuation and all of the reference parameters de-creased after 36 hours of diffusion. Furthermore, X-ray attenuationwas no longer significantly related to the PG content at the 61 hourtime point. As the previous ioxaglate injection was performed 25hours prior to the measurement, the contrast agent had started toefflux from the joint space during the interval between injection andimaging.
The X-ray attenuation at early time points correlated with thatat the later time points, which is consistent with previous stud-ies [179, 180]. However, it must be noted that although related tothe PG content, contrast agent distribution is not a direct measureof the PG distribution at time points long before the diffusion equi-librium. Nonetheless these findings are important, as they sug-gest that CECT measurements, even at pre-equilibrium, may yieldquantitative information about the cartilage quality, as recently pro-posed [156].
48 Dissertations in Forestry and Natural Sciences No 230
ii
ii
ii
ii
Discussion
7.4 LIMITATIONS
There are some limitations in studies I-IV that need to be addressed.The number of samples in each study was selected based on theavailability and practicality, and thus these aspects may have hadintroduced some limitations.
In study I, slight degeneration was observed with MRI in themenisci, even though the donors had no history of joint diseases.This was probably due to the relatively high average age (53.5 years)of the donors. Due to the varying state of degeneration, the rela-tively small number of joints (n = 13) and the lack of a clear controlgroup, the assessment of natural regional variation in biomechani-cal and compositional results was challenging. Although this needsto be considered when interpreting the results, it does not jeopar-dize the conclusion as that was not the focus of study I.
Multiple freeze-thaw cycles may alter the biomechanical proper-ties of the meniscus [181]. The menisci used in study I went throughtwo freeze-thaw cycles before CECT imaging, which hence, mighthave had effect on the results. Since hypo- and hypertonic environ-ments affect the biomechanical properties of cartilage [182], all thesolutions used in study I were isotonic. Thus, even if any ioxaglateresidues remained in the menisci after the 24 hour wash-out in PBS,they most likely did not have any effect on the biomechanical prop-erties.
In studies II and III, relatively small homogeneous sample pop-ulation (n = 10 for cartilage and meniscus in both studies) was used.The limited variation in cartilage and meniscus structural and com-positional properties hindered the assessment of the potential ofCECT to measure these variations in the tissues. Nevertheless, ho-mogeneous population allowed a reliable comparison the diffusionkinematics between the tissues which was the focus of the study.The osmolalities of contrast agent solutions used in studies II andIII were slightly higher than that of normal saline solution: 308mOsm/kg [183] vs. 350 and 330 mOsm/kg in studies II and III, re-spectively. However, the osmolality of the synovial fluid ranges ap-
Dissertations in Forestry and Natural Sciences No 230 49
ii
ii
ii
ii
Juuso Honkanen: Computed Tomography of Cartilage and MeniscusUsing Anionic and Cationic Contrast Agents
proximately between 350-450 mOsm/kg, and it can be even lower inan osteoarthritic joint [184,185]. Thus, the slight difference betweenthe osmolalities should not have affected the results or conclusionsof the studies.
Even though CECT imaging enabled the quantitative detectionof differences in cartilage properties between multiple intra-joint re-gions in study IV, all the regions were from the same joint. Thus,the inter-joint and inter-individual comparisons should be conduct-ed in future studies. As it is not feasible to harvest cartilage samplesfor biomechanical, histological or compositional analyses from liv-ing patients, a cadaveric knee model was used. However, a cadav-eric knee joint does not perfectly represent the in vivo environment.For example, the efflux of contrast agent from the joint would bemore rapid in living patients due to active metabolism and perfu-sion. In addition, the temperature of the cadaver was not at normalbody temperature but at room temperature or slightly below that.
7.5 CONTRAST ENHANCED COMPUTED TOMOGRAPHY INCLINICAL APPLICATIONS – CURRENT STATUS AND FU-TURE
CECT is a clinically available imaging technique. However, it is nota widely exploited method despite its availability and potential indetection of cartilage degeneration. A previous study suggestedto include three acquisitions in a clinical study: a non-contrastimage before the contrast agent administration, an arthrographicimage immediately after contrast agent administration, and a de-layed image 30-60 minutes after the administration [151]. However,three acquisitions substantially increase the radiation dose (approx-imately 6-11 µSv per scan [137, 156]) of the patient and are moretime demanding and laborous compared with a single acquisitionCTa. Thus, a more recent study included only two acquisitions,omitting the non-contrast image [150].
Including only one delayed image, the radiation dose could bedecreased further and the imaging protocol simplified. This wouldalso lower the imaging costs. Only one delayed image, however,
50 Dissertations in Forestry and Natural Sciences No 230
ii
ii
ii
ii
Discussion
would hamper the detection of the interface between synovial fluidand cartilage or meniscus as the interface blurs due to diffusion ofthe contrast agent. This could possibly be solved by using a con-trast agent cocktail with two or more components with different X-ray absorption properties. The first component would diffuse intothe tissue providing information about the degenerative state (e.g.,PG loss) of the tissue while the other component (e.g., nanoparti-cles) would remain in the synovial fluid providing good contrastbetween the synovial fluid and the tissue.
The toxicity of atomic iodine (dissociated NaI) should be lowenough for clinical use [29, 177], and thus the use of atomic iodineas a clinical contrast agent could be considered. Although atomiciodine may not be ideal for the assessment of matrix integrity [25],it could enable more accurate assessment of PG content as its dif-fusivity is higher than that of ioxaglate. However, the efflux ratefrom the joint capsule is also likely to be higher. Thus, thorough invivo studies should be conducted to evaluate the potential of usingatomic iodine in clinical CECT.
Although CECT has already been tested clinically, some uncer-tainties related to its application still warrant further investigation.First, the individual effects of the cartilage constituents (water, col-lagen, PG) on the diffusion of different contrast agents (cationic,anionic and nanoparticles) still need to be investigated more thor-oughly. In addition, issues related to access of the contrast agent tothe articular surface (e.g., uneven distribution within the joint cavityand the effect of menisci on diffusion in the underlying cartilage)and their effects on interpretation of contrast enhanced images needto be studied. Furthermore, spatially varying thickness of menisciand cartilage affects diffusion and need to be considered. Althoughnovel CBCT scanners have great potential for orthopaedic diagnos-tics, image SNR and contrast resolution are still significantly lowerthan those of conventional full body scanners. This limits the us-ability of CBCT scanners in quantitative imaging of contrast agentdiffusion in cartilage and meniscus. However, technical develop-ment in this area is intensive to cure these shortcomings.
Dissertations in Forestry and Natural Sciences No 230 51
ii
ii
ii
ii
Juuso Honkanen: Computed Tomography of Cartilage and MeniscusUsing Anionic and Cationic Contrast Agents
52 Dissertations in Forestry and Natural Sciences No 230
ii
ii
ii
ii
8 Summary and conclusions
In this thesis, CECT was used to study the differences in contrastagent diffusion in articular cartilage and meniscus. The direct com-parison of diffusion kinematics in articular cartilage and meniscusis presented for the first time in this thesis. The main conclusionsof this thesis can be summarized as follows:
1. The spatial resolution of clinical CBCT scanner was sufficientto assess the contrast agent distribution within human menis-cus. The time needed to reach diffusion equilibrium wasfound impractical for clinical applications. However, a shortdelay between injection and imaging (e.g. 40 min) could possi-bly be utilized in clinical diagnostics of meniscal pathologies.
2. The diffusion of anionic iodine into articular cartilage andmeniscus was different, especially between the first 2 hoursafter contrast agent administration. The contrast agent par-tition at diffusion equilibrium was significantly higher in themeniscus.
3. The diffusion kinematics of cationic CA2+ varies between ar-ticular cartilage and meniscus. The contrast agent distributionwithin cartilage and meniscus was different at equilibrium.The contrast agent partition at diffusion equilibrium was sig-nificantly higher in cartilage. The CA2+ distribution at diffu-sion equilibrium in the meniscus was less dependent on thePG distribution than that in cartilage.
4. CECT based on anionic contrast agent (ioxaglate) may en-able quantitative assessment of the biomechanical, biochemi-cal and histological properties even after short diffusion times.Furthermore, CECT can detect variation in cartilage proper-ties between intra-joint regions both after a short delay be-tween contrast agent administration and image acquisitionand at diffusion equilibrium.
Dissertations in Forestry and Natural Sciences No 230 53

ii
ii
ii
ii
Juuso Honkanen: Computed Tomography of Cartilage and MeniscusUsing Anionic and Cationic Contrast Agents
54 Dissertations in Forestry and Natural Sciences No 230
ii
ii
ii
ii
Bibliography
[1] A. M. Ahmed and D. L. Burke, “In-vitro measurement of static pressuredistribution in synovial joints–Part I: Tibial surface of the knee.,” Journal ofBiomechanical Engineering 105, 216–25 (1983).
[2] D. C. Fithian, M. A. Kelly, and V. C. Mow, “Material properties andstructure-function relationships in the menisci.,” Clinical orthopaedics and re-lated research 19–31 (1990).
[3] J. A. Buckwalter and H. J. Mankin, “Articular Cartilage. Part I: Tissue De-sign and Chondrocyte-Matrix Interactions,” J Bone Joint Surg Am 79, 600–611(1997).
[4] J. A. Buckwalter and J. Martin, “Degenerative joint disease.,” Clinical sym-posia (Summit, N.J. : 1957) 47, 1–32 (1995).
[5] F. N. Ghadially, J. M. Lalonde, and J. H. Wedge, “Ultrastructure of normaland torn menisci of the human knee joint.,” Journal of anatomy 136, 773–91(1983).
[6] J. Herwig, E. Egner, and E. Buddecke, “Chemical changes of human kneejoint menisci in various stages of degeneration.,” Annals of the rheumatic dis-eases 43, 635–40 (1984).
[7] V. C. Mow, W. Y. Gu, and F. H. Chen, “Structure and function of articularcartilage and meniscus,” in Basic orthopaedic biomechanics & mechano-biology,3rd ed., V. C. Mow and R. Huiskes, eds. (Lippincott Williams & Wilkins,Philadelphia, PA, USA, 2005), pp. 181–258.
[8] V. C. Mow, A. Ratcliffe, and A. R. Poole, “Cartilage and diarthrodial joints asparadigms for hierarchical materials and structures,” Biomaterials 13, 67–97(1992).
[9] K. Messner and J. Gao, “The menisci of the knee joint. Anatomical andfunctional characteristics, and a rationale for clinical treatment.,” Journal ofanatomy 193(Pt2), 161–78 (1998).
[10] V. C. Mow, D. C. Fithian, and M. A. Kelly, “Fundamentals of articularcartilage and meniscus biomechanics,” in Articular cartilage and knee jointfunction: basic science and arthroscopy, J. W. Ewing, ed. (Racen Press, Ltd.,New York, 1990), pp. 852–70.
[11] M. Heliövaara, P. Slätis, and P. Paavolainen, “Nivelrikon esiintyvyys ja kus-tannukset,” Duodecim 124, 1869–1874 (2008).
[12] G. Rizkalla, A. Reiner, E. Bogoch, and A. R. Poole, “Studies of the artic-ular cartilage proteoglycan aggrecan in health and osteoarthritis. Evidencefor molecular heterogeneity and extensive molecular changes in disease.,”Journal of clinical investigation 90, 2268–2277 (1992).
[13] D. T. Felson and R. Hodgson, “Identifying and treating preclinical and earlyosteoarthritis.,” Rheumatic disease clinics of north america 40, 699–710 (2014).
Dissertations in Forestry and Natural Sciences No 230 55
ii
ii
ii
ii
Juuso Honkanen: Computed Tomography of Cartilage and MeniscusUsing Anionic and Cationic Contrast Agents
[14] D. T. Felson, R. C. Lawrence, P. A. Dieppe, R. Hirsch, C. G. Helmick,J. M. Jordan, R. S. Kington, N. E. Lane, M. C. Nevitt, Y. Zhang, M. Sow-ers, T. McAlindon, T. D. Spector, A. R. Poole, S. Z. Yanovski, G. Ateshian,L. Sharma, J. A. Buckwalter, K. D. Brandt, and J. F. Fries, “Osteoarthritis:new insights. Part 1: the disease and its risk factors.,” Annals of internalmedicine 133, 635–46 (2000).
[15] E. C. Lau, C. Cooper, D. Lam, V. N. H. Chan, K. K. Tsang, and A. Sham,“Factors associated with osteoarthritis of the hip and knee in Hong KongChinese: obesity, joint injury, and occupational activities.,” American journalof epidemiology 152, 855–862 (2000).
[16] M. Englund, A. Guermazi, F. W. Roemer, P. Aliabadi, M. Yang, C. E. Lewis,J. Torner, M. C. Nevitt, B. Sack, and D. T. Felson, “Meniscal tear in kneeswithout surgery and the development of radiographic osteoarthritis amongmiddle-aged and elderly persons: The Multicenter Osteoarthritis Study.,”Arthritis and rheumatism 60, 831–839 (2009).
[17] F. W. Roemer, F. Eckstein, D. Hayashi, and A. Guermazi, “The role of imag-ing in osteoarthritis.,” Best Practice & Research Clinical Rheumatology 28, 31–60(2014).
[18] W. Zhang, H. Ouyang, C. R. Dass, and J. Xu, “Current research on pharma-cologic and regenerative therapies for osteoarthritis.,” Bone research 4, 15040(2016).
[19] D. D. Anderson, S. Chubinskaya, F. Guilak, J. A. Martin, T. R. Oegema, S. A.Olson, and J. A. Buckwalter, “Post-traumatic osteoarthritis: improved un-derstanding and opportunities for early intervention.,” Journal of orthopaedicresearch 29, 802–9 (2011).
[20] A.-C. Bay-Jensen, S. Hoegh-Madsen, E. Dam, K. Henriksen, B. C. Sonder-gaard, P. Pastoureau, P. Qvist, and M. A. Karsdal, “Which elements areinvolved in reversible and irreversible cartilage degradation in osteoarthri-tis?,” Rheumatology international 30, 435–42 (2010).
[21] J. Buckwalter and H. Mankin, “Articular cartilage: Part II: Degenerationand osteoarthritis, repair, regeneration, and transplantation.,” J Bone JointSurg Am 79, 612–632 (1997).
[22] C. G. Armstrong and V. C. Mow, “Variations in the intrinsic mechanicalproperties of human articular cartilage with age, degeneration, and watercontent.,” The Journal of bone and joint surgery. American volume 64, 88–94(1982).
[23] A. Bashir, M. L. Gray, R. D. Boutin, and D. Burstein, “Glycosaminoglycan inarticular cartilage: in vivo assessment with delayed Gd(DTPA)(2-)-enhancedMR imaging.,” Radiology 205, 551–8 (1997).
[24] A. S. Kallioniemi, J. S. Jurvelin, M. T. Nieminen, M. J. Lammi, and J. Töyräs,“Contrast agent enhanced pQCT of articular cartilage.,” Physics in medicineand biology 52, 1209–19 (2007).
[25] H. T. Kokkonen, J. S. Jurvelin, V. Tiitu, and J. Töyräs, “Detection of mechan-ical injury of articular cartilage using contrast enhanced computed tomog-raphy.,” Osteoarthritis and cartilage 19, 295–301 (2011).
56 Dissertations in Forestry and Natural Sciences No 230
ii
ii
ii
ii
Bibliography
[26] M. T. Nieminen, J. Rieppo, J. Silvennoinen, J. Töyräs, J. M. Hakumäki, M. M.Hyttinen, H. J. Helminen, and J. S. Jurvelin, “Spatial assessment of articu-lar cartilage proteoglycans with Gd-DTPA-enhanced T1 imaging.,” Magneticresonance in medicine 48, 640–8 (2002).
[27] A. W. Palmer, R. E. Guldberg, and M. E. Levenston, “Analysis of carti-lage matrix fixed charge density and three-dimensional morphology viacontrast-enhanced microcomputed tomography.,” Proceedings of the NationalAcademy of Sciences of the United States of America 103, 19255–60 (2006).
[28] T. S. Silvast, J. S. Jurvelin, A. S. Aula, M. J. Lammi, and J. Töyräs, “Contrastagent-enhanced computed tomography of articular cartilage: associationwith tissue composition and properties.,” Acta radiologica 50, 78–85 (2009).
[29] T. S. Silvast, H. T. Kokkonen, J. S. Jurvelin, T. M. Quinn, M. T. Nieminen,and J. Töyräs, “Diffusion and near-equilibrium distribution of MRI andCT contrast agents in articular cartilage.,” Physics in medicine and biology 54,6823–36 (2009).
[30] R. C. Evans and T. M. Quinn, “Solute diffusivity correlates with mechanicalproperties and matrix density of compressed articular cartilage.,” Archivesof biochemistry and biophysics 442, 1–10 (2005).
[31] H. T. Kokkonen, J. Mäkelä, K. A. M. Kulmala, L. Rieppo, J. S. Jurvelin, V. Ti-itu, H. M. Karjalainen, R. K. Korhonen, V. Kovanen, and J. Töyräs, “Com-puted tomography detects changes in contrast agent diffusion after collagencross-linking typical to natural aging of articular cartilage.,” Osteoarthritisand cartilage 19, 1190–8 (2011).
[32] K. A. M. Kulmala, H. M. Karjalainen, H. T. Kokkonen, V. Tiitu, V. Kovanen,M. J. Lammi, J. S. Jurvelin, R. K. Korhonen, and J. Töyräs, “Diffusion of ionicand non-ionic contrast agents in articular cartilage with increased cross-linking–contribution of steric and electrostatic effects.,” Medical engineering& physics 35, 1415–20 (2013).
[33] N. Krishnan, S. K. Shetty, A. Williams, B. Mikulis, C. McKenzie, andD. Burstein, “Delayed gadolinium-enhanced magnetic resonance imagingof the meniscus: an index of meniscal tissue degeneration?,” Arthritis andrheumatism 56, 1507–11 (2007).
[34] M. Son, S. B. Goodman, W. Chen, B. A. Hargreaves, G. E. Gold, and M. E.Levenston, “Regional variation in T1ρ and T2 times in osteoarthritic humanmenisci: correlation with mechanical properties and matrix composition.,”Osteoarthritis and cartilage 21, 796–805 (2013).
[35] B. A. Lakin, D. J. Grasso, R. C. Stewart, J. D. Freedman, B. D. Snyder, andM. W. Grinstaff, “Contrast enhanced CT attenuation correlates with theGAG content of bovine meniscus.,” Journal of orthopaedic research 31, 1765–71(2013).
[36] J. van Tiel, G. Kotek, M. Reijman, P. K. Bos, E. E. Bron, S. Klein, J. A. N.Verhaar, G. P. Krestin, H. Weinans, and E. H. G. Oei, “Delayed gadolinium-enhanced MRI of the meniscus (dGEMRIM) in patients with knee os-teoarthritis: relation with meniscal degeneration on conventional MRI, re-producibility, and correlation with dGEMRIC.,” European radiology 24, 2261–70 (2014).
Dissertations in Forestry and Natural Sciences No 230 57
ii
ii
ii
ii
Juuso Honkanen: Computed Tomography of Cartilage and MeniscusUsing Anionic and Cationic Contrast Agents
[37] P. N. Bansal, N. S. Joshi, V. Entezari, B. C. Malone, R. C. Stewart, B. D. Sny-der, and M. W. Grinstaff, “Cationic contrast agents improve quantificationof glycosaminoglycan (GAG) content by contrast enhanced CT imaging ofcartilage.,” Journal of orthopaedic research 29, 704–9 (2011).
[38] N. S. Joshi, P. N. Bansal, R. C. Stewart, B. D. Snyder, and M. W. Grinstaff,“Effect of contrast agent charge on visualization of articular cartilage usingcomputed tomography: exploiting electrostatic interactions for improvedsensitivity.,” Journal of the American Chemical Society 131, 13234–5 (2009).
[39] R. C. Stewart, P. N. Bansal, V. Entezari, H. Lusic, R. M. Nazarian, B. D.Snyder, and M. W. Grinstaff, “Contrast-enhanced CT with a high-affinitycationic contrast agent for imaging ex vivo bovine, intact ex vivo rabbit, andin vivo rabbit cartilage.,” Radiology 266, 141–50 (2013).
[40] A. S. Aula, J. S. Jurvelin, and J. Töyräs, “Simultaneous computed tomogra-phy of articular cartilage and subchondral bone.,” Osteoarthritis and cartilage17, 1583–8 (2009).
[41] P. N. Bansal, N. S. Joshi, V. Entezari, M. W. Grinstaff, and B. D. Snyder, “Con-trast enhanced computed tomography can predict the glycosaminoglycancontent and biomechanical properties of articular cartilage.,” Osteoarthritisand cartilage 18, 184–91 (2010).
[42] L. Xie, A. S. P. Lin, R. E. Guldberg, and M. E. Levenston, “Nondestructiveassessment of sGAG content and distribution in normal and degraded ratarticular cartilage via EPIC-microCT.,” Osteoarthritis and cartilage 18, 65–72(2010).
[43] T. K. Kakarlapudi and D. R. Bickerstaff, “Knee instability: isolated andcomplex.,” The Western journal of medicine 174, 266–272 (2001).
[44] G. A. Ateshian, L. J. Soslowsky, and V. C. Mow, “Quantitation of articularsurface topography and cartilage thickness in knee joints using stereopho-togrammetry.,” Journal of biomechanics 24, 761–76 (1991).
[45] M. A. MacConaill, “The Function of Intra-Articular Fibrocartilages, withSpecial Reference to the Knee and Inferior Radio-Ulnar Joints.,” Journal ofanatomy 66, 210–27 (1932).
[46] A. J. Sophia Fox, A. Bedi, and S. A. Rodeo, “The basic science of articu-lar cartilage: structure, composition, and function.,” Sports health 1, 461–8(2009).
[47] V. C. Mow, M. H. Holmes, and W. M. Lai, “Fluid transport and mechanicalproperties of articular cartilage: a review.,” Journal of biomechanics 17, 377–94(1984).
[48] D. Eyre, “Collagen of articular cartilage.,” Arthritis research 4, 30–5 (2002).
[49] D. L. Bader and G. E. Kempson, “The short-term compressive propertiesof adult human articular cartilage.,” Bio-medical materials and engineering 4,245–56 (1994).
[50] G. E. Kempson, H. Muir, C. Pollard, and M. Tuke, “The tensile properties ofthe cartilage of human femoral condyles related to the content of collagenand glycosaminoglycans.,” Biochimica et biophysica acta 297, 456–72 (1973).
58 Dissertations in Forestry and Natural Sciences No 230
ii
ii
ii
ii
Bibliography
[51] Y. Xia, J. B. Moody, H. Alhadlaq, and J. Hu, “Imaging the physical andmorphological properties of a multi-zone young articular cartilage at micro-scopic resolution.,” Journal of magnetic resonance imaging 17, 365–74 (2003).
[52] M. Huber, S. Trattnig, and F. Lintner, “Anatomy, biochemistry, and physiol-ogy of articular cartilage.,” Investigative radiology 35, 573–80 (2000).
[53] T. R. Oegema, R. J. Carpenter, F. Hofmeister, and R. C. Thompson, “Theinteraction of the zone of calcified cartilage and subchondral bone in os-teoarthritis.,” Microscopy research and technique 37, 324–32 (1997).
[54] H. E. Panula, M. M. Hyttinen, J. P. Arokoski, T. K. Långsjö, A. Pelttari,I. Kiviranta, and H. J. Helminen, “Articular cartilage superficial zone colla-gen birefringence reduced and cartilage thickness increased before surfacefibrillation in experimental osteoarthritis.,” Annals of the rheumatic diseases57, 237–45 (1998).
[55] H. A. Alhadlaq, Y. Xia, J. B. Moody, and J. R. Matyas, “Detecting struc-tural changes in early experimental osteoarthritis of tibial cartilage by micro-scopic magnetic resonance imaging and polarised light microscopy.,” Annalsof the rheumatic diseases 63, 709–17 (2004).
[56] L. P. Räsänen, M. E. Mononen, E. Lammentausta, M. T. Nieminen, J. S.Jurvelin, and R. K. Korhonen, “Three dimensional patient-specific collagenarchitecture modulates cartilage responses in the knee joint during gait,”Computer Methods in Biomechanics and Biomedical Engineering 5842, 0 (2015).
[57] J. E. Kurkijärvi, M. J. Nissi, J. Rieppo, J. Töyräs, I. Kiviranta, M. T. Niemi-nen, and J. S. Jurvelin, “The zonal architecture of human articular cartilagedescribed by T2 relaxation time in the presence of Gd-DTPA2-.,” Magneticresonance imaging 26, 602–7 (2008).
[58] M. T. Bayliss, M. Venn, A. Maroudas, and S. Y. Ali, “Structure of proteo-glycans from different layers of human articular cartilage.,” The Biochemicaljournal 209, 387–400 (1983).
[59] I. Kiviranta, M. Tammi, J. Jurvelin, and H. J. Helminen, “Topographical vari-ation of glycosaminoglycan content and cartilage thickness in canine knee(stifle) joint cartilage. Application of the microspectrophotometric method.,”Journal of anatomy 150, 265–76 (1987).
[60] A. Maroudas, “Physicochemical properties of cartilage in the light of ionexchange theory.,” Biophysical journal 8, 575–95 (1968).
[61] V. C. Mow, C. C. Wang, and C. T. Hung, “The extracellular matrix, intersti-tial fluid and ions as a mechanical signal transducer in articular cartilage.,”Osteoarthritis and cartilage 7, 41–58 (1999).
[62] S. R. Eisenberg and A. J. Grodzinsky, “Swelling of articular cartilage andother connective tissues: electromechanochemical forces.,” Journal of or-thopaedic research 3, 148–59 (1985).
[63] J. Mollenhauer, J. A. Bee, M. A. Lizarbe, and K. von der Mark, “Role ofanchorin CII, a 31,000-mol-wt membrane protein, in the interaction of chon-drocytes with type II collagen.,” The Journal of cell biology 98, 1572–9 (1984).
Dissertations in Forestry and Natural Sciences No 230 59
ii
ii
ii
ii
Juuso Honkanen: Computed Tomography of Cartilage and MeniscusUsing Anionic and Cationic Contrast Agents
[64] H. Muir, “The chondrocyte, architect of cartilage. Biomechanics, structure,function and molecular biology of cartilage matrix macromolecules.,” BioEs-says 17, 1039–48 (1995).
[65] R. A. Stockwell, “The cell density of human articular and costal cartilage.,”Journal of anatomy 101, 753–63 (1967).
[66] E. B. Hunziker, T. M. Quinn, and H.-J. Häuselmann, “Quantitative structuralorganization of normal adult human articular cartilage.,” Osteoarthritis andcartilage 10, 564–72 (2002).
[67] R. S. Gilmore and A. J. Palfrey, “Chondrocyte distribution in the articularcartilage of human femoral condyles.,” Journal of anatomy 157, 23–31 (1988).
[68] W. Y. Gu, W. M. Lai, and V. C. Mow, “A mixture theory for charged-hydrated soft tissues containing multi-electrolytes: passive transport andswelling behaviors.,” Journal of biomechanical engineering 120, 169–80 (1998).
[69] M. S. Laasanen, J. Töyräs, R. K. Korhonen, J. Rieppo, S. Saarakkala, M. T.Nieminen, J. Hirvonen, and J. S. Jurvelin, “Biomechanical properties of kneearticular cartilage.,” Biorheology 40, 133–40 (2003).
[70] G. D. Jay, J. R. Torres, M. L. Warman, M. C. Laderer, and K. S. Breuer, “Therole of lubricin in the mechanical behavior of synovial fluid.,” Proceedingsof the National Academy of Sciences of the United States of America 104, 6194–9(2007).
[71] G. A. Ateshian, “The role of interstitial fluid pressurization in articularcartilage lubrication.,” Journal of biomechanics 42, 1163–76 (2009).
[72] J. Bland-Sutton, Ligaments. Their Nature and Morphology, 2nd ed. (H. K.Lewis, London, 1897).
[73] T. J. Fairbank, “Knee joint changes after meniscectomy,” The Journal of boneand joint surgery. British volume 30, 664–70 (1948).
[74] P. S. Walker and M. J. Erkman, “The role of the menisci in force transmissionacross the knee.,” Clinical orthopaedics and related research 184–92 (1975).
[75] T. Fukubayashi and H. Kurosawa, “The contact area and pressure distribu-tion pattern of the knee. A study of normal and osteoarthrotic knee joints.,”Acta orthopaedica Scandinavica 51, 871–9 (1980).
[76] C. R. Clark and J. A. Ogden, “Development of the menisci of the humanknee joint. Morphological changes and their potential role in childhoodmeniscal injury.,” The Journal of bone and joint surgery. American volume 65,538–47 (1983).
[77] I. D. McDermott, F. Sharifi, A. M. J. Bull, C. M. Gupte, R. W. Thomas,and A. A. Amis, “An anatomical study of meniscal allograft sizing.,” Kneesurgery, sports traumatology, arthroscopy 12, 130–5 (2004).
[78] I. D. McDermott, S. D. Masouros, A. M. J. Bull, and A. A. Amis, “Anatomy,”in The Meniscus, P. Beaufils and R. Verdonk, eds. (Springer Berlin Heidel-berg, Berlin, Heidelberg, 2010), pp. 11–18.
[79] S. D. Masouros, I. D. McDermott, A. A. Amis, and A. M. J. Bull, “Biome-chanics of the meniscus-meniscal ligament construct of the knee.,” Kneesurgery, sports traumatology, arthroscopy 16, 1121–32 (2008).
60 Dissertations in Forestry and Natural Sciences No 230
ii
ii
ii
ii
Bibliography
[80] A. J. S. Fox, A. Bedi, and S. A. Rodeo, “The basic science of humanknee menisci: structure, composition, and function.,” Sports health 4, 340–51 (2012).
[81] D. R. Eyre and J. J. Wu, “Collagen of fibrocartilage: a distinctive molecularphenotype in bovine meniscus.,” FEBS letters 158, 265–70 (1983).
[82] H. S. Cheung, “Distribution of type I, II, III and V in the pepsin solubilizedcollagens in bovine menisci.,” Connective tissue research 16, 343–56 (1987).
[83] H. E. Kambic and C. A. McDevitt, “Spatial organization of types I and IIcollagen in the canine meniscus.,” Journal of orthopaedic research 23, 142–9(2005).
[84] J. Sanchez-Adams, V. P. Willard, and K. A. Athanasiou, “Regional variationin the mechanical role of knee meniscus glycosaminoglycans.,” Journal ofapplied physiology 111, 1590–6 (2011).
[85] W. Petersen and B. Tillmann, “Collagenous fibril texture of the human kneejoint menisci.,” Anatomy and embryology 197, 317–24 (1998).
[86] P. G. Bullough, L. Munuera, J. Murphy, and A. M. Weinstein, “The strengthof the menisci of the knee as it relates to their fine structure.,” The Journal ofbone and joint surgery. British volume 52, 564–7 (1970).
[87] D. L. Skaggs, W. H. Warden, and V. C. Mow, “Radial tie fibers influencethe tensile properties of the bovine medial meniscus.,” Journal of orthopaedicresearch 12, 176–85 (1994).
[88] W. Petersen and B. Tillmann, “Age-related blood and lymph supply of theknee menisci. A cadaver study.,” Acta orthopaedica Scandinavica 66, 308–12(1995).
[89] S. P. Arnoczky and R. F. Warren, “Microvasculature of the human menis-cus.,” The American journal of sports medicine 10, 90–5 (1982).
[90] C. Laible, D. A. Stein, and D. N. Kiridly, “Meniscal Repair,” Journal of theAmerican Academy of Orthopedic Surgeons 21, 204–213 (2013).
[91] J. C. Gray, “Neural and vascular anatomy of the menisci of the humanknee.,” The Journal of orthopaedic and sports physical therapy 29, 23–30 (1999).
[92] C. A. McDevitt and R. J. Webber, “The ultrastructure and biochemistry ofmeniscal cartilage.,” Clinical orthopaedics and related research 8–18 (1990).
[93] F. N. Ghadially, I. Thomas, N. Yong, and J. M. Lalonde, “Ultrastructure ofrabbit semilunar cartilages.,” Journal of anatomy 125, 499–517 (1978).
[94] D. H. Gershuni, A. R. Hargens, and L. A. Danzig, “Regional nutrition andcellularity of the meniscus. Implications for tear and repair.,” Sports medicine(Auckland, N.Z.) 5, 322–7 (1988).
[95] B. B. Seedhom, D. Dowson, and V. Wright, “Proceedings: Functions of themenisci. A preliminary study.,” Annals of the rheumatic diseases 33, 111 (1974).
[96] W. R. Krause, M. H. Pope, R. J. Johnson, and D. G. Wilder, “Mechanicalchanges in the knee after meniscectomy.,” The Journal of bone and joint surgery.American volume 58, 599–604 (1976).
Dissertations in Forestry and Natural Sciences No 230 61
ii
ii
ii
ii
Juuso Honkanen: Computed Tomography of Cartilage and MeniscusUsing Anionic and Cationic Contrast Agents
[97] C. Stärke, S. Kopf, W. Petersen, and R. Becker, “Meniscal repair,” Arthroscopy25, 1033–44 (2009).
[98] M. Tissakht and A. M. Ahmed, “Tensile stress-strain characteristics of thehuman meniscal material.,” Journal of biomechanics 28, 411–22 (1995).
[99] K. Lechner, M. L. Hull, and S. M. Howell, “Is the circumferential tensilemodulus within a human medial meniscus affected by the test sample lo-cation and cross-sectional area?,” Journal of orthopaedic research 18, 945–51(2000).
[100] D. J. Goertzen, D. R. Budney, and J. G. Cinats, “Methodology and appara-tus to determine material properties of the knee joint meniscus.,” Medicalengineering & physics 19, 412–9 (1997).
[101] A. S. Voloshin and J. Wosk, “Shock absorption of meniscectomized andpainful knees: a comparative in vivo study.,” Journal of biomedical engineering5, 157–61 (1983).
[102] M. S. Kuster, G. A. Wood, G. W. Stachowiak, and A. Gächter, “Joint load con-siderations in total knee replacement.,” The Journal of bone and joint surgery.British volume 79, 109–13 (1997).
[103] B. E. Baker, A. C. Peckham, F. Pupparo, and J. C. Sanborn, “Reviewof meniscal injury and associated sports.,” The American journal of sportsmedicine 13, 1–4 (1985).
[104] I. D. McDermott and A. A. Amis, “The consequences of meniscectomy.,”The Journal of bone and joint surgery. British volume 88, 1549–56 (2006).
[105] R. Howell, N. S. Kumar, N. Patel, and J. Tom, “Degenerative meniscus:Pathogenesis, diagnosis, and treatment options.,” World journal of orthopedics5, 597–602 (2014).
[106] M. Englund, A. Guermazi, and S. L. Lohmander, “The role of the meniscusin knee osteoarthritis: a cause or consequence?,” Radiologic clinics of NorthAmerica 47, 703–12 (2009).
[107] P. C. Verdonk and C. Vererfve, “Traumatic Lesions: Stable Knee, ACL Knee,”in The Meniscus, P. Beaufils and R. Verdonk, eds. (Springer Berlin Heidel-berg, Berlin, Heidelberg, 2010), pp. 45–49.
[108] M. Englund, A. Guermazi, D. Gale, D. J. Hunter, P. Aliabadi, M. Clancy, andD. T. Felson, “Incidental meniscal findings on knee MRI in middle-aged andelderly persons.,” The New England journal of medicine 359, 1108–15 (2008).
[109] G. I. Drosos and J. L. Pozo, “The causes and mechanisms of meniscal in-juries in the sporting and non-sporting environment in an unselected pop-ulation.,” The Knee 11, 143–9 (2004).
[110] S. E. Campbell, T. G. Sanders, and W. B. Morrison, “MR imaging of meniscalcysts: incidence, location, and clinical significance.,” AJR. American journalof roentgenology 177, 409–13 (2001).
[111] M. H. Metcalf and G. R. Barrett, “Prospective evaluation of 1485 meniscaltear patterns in patients with stable knees.,” The American journal of sportsmedicine 32, 675–80 (2004).
62 Dissertations in Forestry and Natural Sciences No 230
ii
ii
ii
ii
Bibliography
[112] H. Roos, T. Adalberth, L. Dahlberg, and L. S. Lohmander, “Osteoarthritisof the knee after injury to the anterior cruciate ligament or meniscus: theinfluence of time and age.,” Osteoarthritis and cartilage 3, 261–7 (1995).
[113] M. P. Hellio Le Graverand, E. Vignon, I. G. Otterness, and D. A. Hart, “Earlychanges in lapine menisci during osteoarthritis development: Part I: cellularand matrix alterations.,” Osteoarthritis and cartilage 9, 56–64 (2001).
[114] M. E. Adams, M. E. Billingham, and H. Muir, “The glycosaminoglycans inmenisci in experimental and natural osteoarthritis.,” Arthritis and rheumatism26, 69–76 (1983).
[115] J. T. A. Mäkelä, Z. S. Rezaeian, S. Mikkonen, R. Madden, S.-K. Han, J. S.Jurvelin, W. Herzog, and R. K. Korhonen, “Site-dependent changes in struc-ture and function of lapine articular cartilage 4 weeks after anterior cruciateligament transection.,” Osteoarthritis and cartilage 22, 869–78 (2014).
[116] D. T. Felson and T. Neogi, “Osteoarthritis: is it a disease of cartilage or ofbone?,” Arthritis and rheumatism 50, 341–4 (2004).
[117] M. B. Goldring and S. R. Goldring, “Articular cartilage and subchondralbone in the pathogenesis of osteoarthritis.,” Annals of the New York Academyof Sciences 1192, 230–7 (2010).
[118] J. H. Kellgren and J. S. Lawrence, “Radiological assessment of osteo-arthrosis.,” Annals of the rheumatic diseases 16, 494–502 (1957).
[119] W. Widuchowski, J. Widuchowski, B. Koczy, and K. Szyluk, “Untreatedasymptomatic deep cartilage lesions associated with anterior cruciate liga-ment injury: results at 10- and 15-year follow-up.,” The American journal ofsports medicine 37, 688–92 (2009).
[120] T. Bhattacharyya, D. Gale, P. Dewire, S. Totterman, M. E. Gale, S. McLaugh-lin, T. A. Einhorn, and D. T. Felson, “The clinical importance of meniscaltears demonstrated by magnetic resonance imaging in osteoarthritis of theknee.,” The Journal of bone and joint surgery. American volume 85-A, 4–9 (2003).
[121] E. Pessis, J.-L. Drapé, P. Ravaud, A. Chevrot, M. Dougados, and X. Ayral,“Assessment of progression in knee osteoarthritis: results of a 1 year studycomparing arthroscopy and MRI.,” Osteoarthritis and cartilage 11, 361–9(2003).
[122] C. Ding, P. Garnero, F. Cicuttini, F. Scott, H. Cooley, and G. Jones, “Knee car-tilage defects: association with early radiographic osteoarthritis, decreasedcartilage volume, increased joint surface area and type II collagen break-down.,” Osteoarthritis and cartilage 13, 198–205 (2005).
[123] M. L. Gray, D. Burstein, Y.-J. Kim, and A. Maroudas, “2007 Elizabeth Win-ston Lanier Award Winner. Magnetic resonance imaging of cartilage gly-cosaminoglycan: basic principles, imaging technique, and clinical applica-tions.,” Journal of orthopaedic research 26, 281–91 (2008).
[124] Z. K. Hawezi, E. Lammentausta, J. Svensson, L. E. Dahlberg, and C. J.Tiderius, “In vivo transport of Gd-DTPA(2-) in human knee cartilage as-sessed by depth-wise dGEMRIC analysis.,” Journal of magnetic resonanceimaging 34, 1352–8 (2011).
Dissertations in Forestry and Natural Sciences No 230 63
ii
ii
ii
ii
Juuso Honkanen: Computed Tomography of Cartilage and MeniscusUsing Anionic and Cationic Contrast Agents
[125] E.-N. Salo, M. J. Nissi, K. A. M. Kulmala, V. Tiitu, J. Töyräs, and M. T.Nieminen, “Diffusion of Gd-DTPA2- into articular cartilage.,” Osteoarthritisand cartilage 20, 117–26 (2012).
[126] W. Li, R. R. Edelman, and P. V. Prasad, “Delayed contrast enhanced MRIof meniscus with ionic and non-ionic agents.,” Journal of magnetic resonanceimaging 33, 731–5 (2011).
[127] B. C. Vande Berg, F. E. Lecouvet, P. Poilvache, J. E. Dubuc, B. Bedat,B. Maldague, J. J. Rombouts, and J. Malghem, “Dual-detector spiral CTarthrography of the knee: accuracy for detection of meniscal abnormalitiesand unstable meniscal tears.,” Radiology 216, 851–7 (2000).
[128] G. Spahn, H. M. Klinger, and G. O. Hofmann, “How valid is thearthroscopic diagnosis of cartilage lesions? Results of an opinion surveyamong highly experienced arthroscopic surgeons.,” Archives of orthopaedicand trauma surgery 129, 1117–21 (2009).
[129] P. H. Puhakka, J. H. Ylärinne, M. J. Lammi, S. Saarakkala, V. Tiitu, H. Kröger,T. Virén, J. S. Jurvelin, and J. Töyräs, “Dependence of light attenuationand backscattering on collagen concentration and chondrocyte density inagarose scaffolds.,” Physics in medicine and biology 59, 6537–48 (2014).
[130] T. Virén, S. Saarakkala, E. Kaleva, H. J. Nieminen, J. S. Jurvelin, andJ. Töyräs, “Minimally invasive ultrasound method for intra-articular di-agnostics of cartilage degeneration.,” Ultrasound in medicine & biology 35,1546–54 (2009).
[131] T. Xie, S. Guo, J. Zhang, Z. Chen, and G. M. Peavy, “Use of polarization-sensitive optical coherence tomography to determine the directional polar-ization sensitivity of articular cartilage and meniscus.,” Journal of biomedicaloptics 11, 064001 (2014).
[132] E. Kaleva, T. Virén, S. Saarakkala, J. Sahlman, J. Sirola, J. Puhakka, T. Paatela,H. Kröger, I. Kiviranta, J. S. Jurvelin, and J. Töyräs, “Arthroscopic Ul-trasound Assessment of Articular Cartilage in the Human Knee Joint: APotential Diagnostic Method.,” Cartilage 2, 246–53 (2011).
[133] P. P. Dendy and B. Heaton, Physics for Diagnostic Radiology, 2nd ed. (Instituteof Physics Publishing, Bristol, 1999).
[134] A. Oppelt, Imaging Systems for Medical Diagnostics (Publicis Corporate Pub-lishing, Erlangen, 2005).
[135] H. Singh and J. A. Neutze, Radiology Fundamentals, 4th ed. (Springer NewYork, New York, 2012).
[136] A. Suomalainen, T. Kiljunen, Y. Käser, J. Peltola, and M. Kortesniemi,“Dosimetry and image quality of four dental cone beam computed tomog-raphy scanners compared with multislice computed tomography scanners,”Dentomaxillofacial Radiology 38, 367–378 (2009).
[137] J. Koivisto, T. Kiljunen, N. Kadesjö, X.-Q. Shi, and J. Wolff, “Effective radi-ation dose of a MSCT, two CBCT and one conventional radiography devicein the ankle region.,” Journal of foot and ankle research 8 (2015).
64 Dissertations in Forestry and Natural Sciences No 230
ii
ii
ii
ii
Bibliography
[138] J. J. Pasternak and E. E. Williamson, “Clinical pharmacology, uses, andadverse reactions of iodinated contrast agents: a primer for the non-radiologist.,” Mayo Clinic proceedings 87, 390–402 (2012).
[139] H. Lusic and M. W. Grinstaff, “X-ray-computed tomography contrastagents.,” Chemical reviews 113, 1641–66 (2013).
[140] J. Domey, U. Teichgräber, and I. Hilger, “Gold nanoparticles allow detectionof early-stage edema in mice via computed tomography imaging.,” Interna-tional journal of nanomedicine 10, 3803–14 (2015).
[141] O. Rabin, J. Manuel Perez, J. Grimm, G. Wojtkiewicz, and R. Weissleder,“An X-ray computed tomography imaging agent based on long-circulatingbismuth sulphide nanoparticles.,” Nature materials 5, 118–22 (2006).
[142] S. Kweon, H.-J. Lee, W. J. Hyung, J. Suh, J. S. Lim, and S.-J. Lim, “Liposomescoloaded with iopamidol/lipiodol as a RES-targeted contrast agent for com-puted tomography imaging.,” Pharmaceutical research 27, 1408–15 (2010).
[143] F. Hyafil, J.-C. Cornily, J. E. Feig, R. Gordon, E. Vucic, V. Amirbekian, E. A.Fisher, V. Fuster, L. J. Feldman, and Z. A. Fayad, “Noninvasive detection ofmacrophages using a nanoparticulate contrast agent for computed tomog-raphy.,” Nature medicine 13, 636–41 (2007).
[144] F. G. Donnan, “The Theory of Membrane Equilibria.,” Chemical Reviews 1,73–90 (1924).
[145] A. Maroudas and H. Evans, “A Study of Ionic Equilibria in Cartilage,”Connective Tissue Research 1, 69–77 (1972).
[146] A. Bashir, M. L. Gray, and D. Burstein, “Gd-DTPA2- as a measure of carti-lage degradation.,” Magnetic resonance in medicine 36, 665–73 (1996).
[147] M. D. Cockman, C. A. Blanton, P. A. Chmielewski, L. Dong, T. E. Dufresne,E. B. Hookfin, M. J. Karb, S. Liu, and K. R. Wehmeyer, “Quantitative imag-ing of proteoglycan in cartilage using a gadolinium probe and microCT.,”Osteoarthritis and cartilage 14, 210–4 (2006).
[148] T. S. Silvast, J. S. Jurvelin, V. Tiitu, T. M. Quinn, and J. Töyras, “Bath Con-centration of Anionic Contrast Agents Does Not Affect Their Diffusion andDistribution in Articular Cartilage In Vitro,” Cartilage 4, 42–51 (2012).
[149] A. Maroudas, “Distribution and diffusion of solutes in articular cartilage.,”Biophysical journal 10, 365–79 (1970).
[150] J. Hirvasniemi, K. A. M. Kulmala, E. Lammentausta, R. Ojala, P. Lehenkari,A. Kamel, J. S. Jurvelin, J. Töyräs, M. T. Nieminen, and S. Saarakkala, “Invivo comparison of delayed gadolinium-enhanced MRI of cartilage and de-layed quantitative CT arthrography in imaging of articular cartilage.,” Os-teoarthritis and cartilage 21, 434–42 (2013).
[151] H. T. Kokkonen, A. S. Aula, H. Kroger, J.-S. Suomalainen, E. Lammentausta,E. Mervaala, J. S. Jurvelin, and J. Toyras, “Delayed Computed Tomogra-phy Arthrography of Human Knee Cartilage In Vivo,” Cartilage 3, 334–341(2012).
Dissertations in Forestry and Natural Sciences No 230 65
ii
ii
ii
ii
Juuso Honkanen: Computed Tomography of Cartilage and MeniscusUsing Anionic and Cationic Contrast Agents
[152] B. A. Lakin, D. J. Grasso, S. S. Shah, R. C. Stewart, P. N. Bansal, J. D. Freed-man, M. W. Grinstaff, and B. D. Snyder, “Cationic agent contrast-enhancedcomputed tomography imaging of cartilage correlates with the compres-sive modulus and coefficient of friction.,” Osteoarthritis and cartilage 21, 60–8(2013).
[153] T. M. Piscaer, J. H. Waarsing, N. Kops, P. Pavljasevic, J. A. N. Verhaar, G. J.V. M. van Osch, and H. Weinans, “In vivo imaging of cartilage degenerationusing microCT-arthrography.,” Osteoarthritis and cartilage 16, 1011–7 (2008).
[154] T. M. Piscaer, G. J. V. M. van Osch, J. A. N. Verhaar, and H. Weinans, “Imag-ing of experimental osteoarthritis in small animal models.,” Biorheology 45,355–64 (2008).
[155] T. S. Silvast, J. S. Jurvelin, M. J. Lammi, and J. Töyräs, “pQCT study on diffu-sion and equilibrium distribution of iodinated anionic contrast agent in hu-man articular cartilage–associations to matrix composition and integrity.,”Osteoarthritis and cartilage 17, 26–32 (2009).
[156] H. T. Kokkonen, J.-S. Suomalainen, A. Joukainen, H. Kröger, J. Sirola, J. S.Jurvelin, J. Salo, and J. Töyräs, “In vivo diagnostics of human knee cartilagelesions using delayed CBCT arthrography.,” Journal of orthopaedic research 32,403–12 (2014).
[157] L. Xie, A. S. P. Lin, M. E. Levenston, and R. E. Guldberg, “Quantitative as-sessment of articular cartilage morphology via EPIC-microCT.,” Osteoarthri-tis and cartilage 17, 313–20 (2009).
[158] L. Xie, A. S. P. Lin, K. Kundu, M. E. Levenston, N. Murthy, and R. E. Guld-berg, “Quantitative imaging of cartilage and bone morphology, reactiveoxygen species, and vascularization in a rodent model of osteoarthritis.,”Arthritis and rheumatism 64, 1899–908 (2012).
[159] H. J. Yoo, S. H. Hong, J.-Y. Choi, I. J. Lee, S. J. Kim, J.-A. Choi, and H. S.Kang, “Contrast-enhanced CT of Articular Cartilage: Experimental Studyfor Quantification of Glycosaminoglycan Content in Articular Cartilage,”Radiology 261, 805–812 (2011).
[160] I. Kiviranta, J. Jurvelin, M. Tammi, A. M. Säämänen, and H. J. Helminen,“Microspectrophotometric quantitation of glycosaminoglycans in articularcartilage sections stained with Safranin O.,” Histochemistry 82, 249–55 (1985).
[161] H. J. Mankin, H. Dorfman, L. Lippiello, and A. Zarins, “Biochemical andmetabolic abnormalities in articular cartilage from osteo-arthritic humanhips. II. Correlation of morphology with biochemical and metabolic data.,”The Journal of bone and joint surgery. American volume 53, 523–37 (1971).
[162] K. P. H. Pritzker, S. Gay, S. A. Jimenez, K. Ostergaard, J.-P. Pelletier,P. A. Revell, D. Salter, and W. B. van den Berg, “Osteoarthritis cartilagehistopathology: grading and staging.,” Osteoarthritis and cartilage 14, 13–29(2006).
[163] A. Boskey and N. Pleshko Camacho, “FT-IR imaging of native and tissue-engineered bone and cartilage.,” Biomaterials 28, 2465–78 (2007).
66 Dissertations in Forestry and Natural Sciences No 230
ii
ii
ii
ii
Bibliography
[164] N. P. Camacho, P. West, P. A. Torzilli, and R. Mendelsohn, “FTIR micro-scopic imaging of collagen and proteoglycan in bovine cartilage.,” Biopoly-mers 62, 1–8 (2001).
[165] S. Brown, M. Worsfold, and C. Sharp, “Microplate assay for the measure-ment of hydroxyproline in acid-hydrolyzed tissue samples.,” BioTechniques30, 38–40, 42 (2001).
[166] N. Blumenkrantz and G. Asboe-Hansen, “New method for quantitativedetermination of uronic acids.,” Analytical biochemistry 54, 484–9 (1973).
[167] R. K. Korhonen, M. S. Laasanen, J. Töyräs, J. Rieppo, J. Hirvonen, H. J.Helminen, and J. S. Jurvelin, “Comparison of the equilibrium response ofarticular cartilage in unconfined compression, confined compression andindentation.,” Journal of biomechanics 35, 903–9 (2002).
[168] W. C. Hayes, L. M. Keer, G. Herrmann, and L. F. Mockros, “A mathematicalanalysis for indentation tests of articular cartilage,” Journal of biomechanics 5,541–51 (1972).
[169] M. Lotysch, J. Mink, J. V. Crues, and S. A. Schwartz, “Magnetic resonanceimaging in the detection of meniscal injuries,” Magnetic resonance imaging 4,94 (1986).
[170] J. V. Crues, J. Mink, T. L. Levy, M. Lotysch, and D. W. Stoller, “Meniscaltears of the knee: accuracy of MR imaging,” Radiology 164, 445–448 (1987).
[171] R. Y. Carlier, P. Akeson, G. Morvan, D. T. Kristoffersen, C. Amar, and C. Val-lée, “Time dependence of iopamidol and iodixanol in arthrography of theknee.,” Acta radiologica 40, 107–10 (1999).
[172] M. Kok, C. Mihl, A. A. Mingels, B. L. Kietselaer, G. Mühlenbruch, A. See-hofnerova, J. E. Wildberger, and M. Das, “Influence of contrast media vis-cosity and temperature on injection pressure in computed tomographic an-giography: a phantom study.,” Investigative radiology 49, 217–23 (2014).
[173] J. Brunette, R. Mongrain, J. Rodés-Cabau, E. Larose, R. Leask, and O. F.Bertrand, “Comparative rheology of low- and iso-osmolarity contrast agentsat different temperatures.,” Catheterization and cardiovascular interventions 71,78–83 (2008).
[174] K. A. M. Kulmala, R. K. Korhonen, P. Julkunen, J. S. Jurvelin, T. M. Quinn,H. Kröger, and J. Töyräs, “Diffusion coefficients of articular cartilage fordifferent CT and MRI contrast agents.,” Medical engineering & physics 32,878–82 (2010).
[175] B. A. Lakin, H. Patel, C. Holland, J. D. Freedman, J. S. Shelofsky, B. D.Snyder, K. S. Stok, and M. W. Grinstaff, “Contrast-enhanced CT using acationic contrast agent enables non-destructive assessment of the biochemi-cal and biomechanical properties of mouse tibial plateau cartilage.,” Journalof orthopaedic research 1–9 (2015).
[176] P. N. Bansal, R. C. Stewart, V. Entezari, B. D. Snyder, and M. W. Grin-staff, “Contrast agent electrostatic attraction rather than repulsion to gly-cosaminoglycans affords a greater contrast uptake ratio and improved quan-titative CT imaging in cartilage.,” Osteoarthritis and cartilage 19, 970–6 (2011).
Dissertations in Forestry and Natural Sciences No 230 67
ii
ii
ii
ii
Juuso Honkanen: Computed Tomography of Cartilage and MeniscusUsing Anionic and Cationic Contrast Agents
[177] Sigma-Aldrich, “Material safety data sheet,” (2003).
[178] H. J. Nieminen, T. Ylitalo, S. Karhula, J.-P. Suuronen, S. Kauppinen, R. Ser-imaa, E. Hæggström, K. P. H. Pritzker, M. Valkealahti, P. Lehenkari,M. Finnilä, and S. Saarakkala, “Determining collagen distribution in artic-ular cartilage using contrast-enhanced micro-computed tomography.,” Os-teoarthritis and cartilage 23, 1613–21 (2015).
[179] J. van Tiel, M. Siebelt, J. H. Waarsing, T. M. Piscaer, M. Van Straten,R. Booij, M. L. Dijkshoorn, G. J. Kleinrensink, J. A. N. Verhaar, G. P. Krestin,H. Weinans, and E. H. G. Oei, “CT arthrography of the human knee to mea-sure cartilage quality with low radiation dose,” Osteoarthritis and Cartilage20, 678–685 (2012).
[180] M. Siebelt, J. van Tiel, J. H. Waarsing, T. M. Piscaer, M. van Straten,R. Booij, M. L. Dijkshoorn, G. J. Kleinrensink, J. A. N. Verhaar, G. P. Krestin,H. Weinans, and E. H. G. Oei, “Clinically applied CT arthrography to mea-sure the sulphated glycosaminoglycan content of cartilage.,” Osteoarthritisand cartilage 19, 1183–9 (2011).
[181] P. B. Lewis, J. M. Williams, N. Hallab, A. Virdi, A. Yanke, and B. J. Cole,“Multiple freeze-thaw cycled meniscal allograft tissue: A biomechanical,biochemical, and histologic analysis.,” Journal of orthopaedic research 26, 49–55 (2008).
[182] M. J. Turunen, J. Töyräs, M. J. Lammi, J. S. Jurvelin, and R. K. Korhonen,“Hyperosmolaric contrast agents in cartilage tomography may expose car-tilage to overload-induced cell death.,” Journal of biomechanics 45, 497–503(2012).
[183] A. Gulihar, D. J. Bryson, and G. J. S. Taylor, “Effect of different irrigationfluids on human articular cartilage: an in vitro study.,” Arthroscopy 29, 251–6(2013).
[184] K. L. Bertram and R. J. Krawetz, “Osmolarity regulates chondrogenic differ-entiation potential of synovial fluid derived mesenchymal progenitor cells.,”Biochemical and biophysical research communications 422, 455–61 (2012).
[185] J. Koo, K.-I. Kim, B.-H. Min, and G. M. Lee, “Controlling medium osmolal-ity improves the expansion of human articular chondrocytes in serum-freemedia.,” Tissue engineering. Part C, Methods 16, 957–63 (2010).
68 Dissertations in Forestry and Natural Sciences No 230

uef.fi
PUBLICATIONS OF THE UNIVERSITY OF EASTERN FINLAND
Dissertations in Forestry and Natural Sciences
ISBN 978-952-61-2156-7ISSN 1798-5668
Dissertations in Forestry and Natural Sciences
DIS
SE
RT
AT
ION
S | JU
US
O H
ON
KA
NE
N | C
OM
PU
TE
D T
OM
OG
RA
PH
Y O
F C
AR
TIL
AG
E A
ND
ME
NIS
CU
S... | N
o 230
JUUSO HONKANEN
COMPUTED TOMOGRAPHY OF CARTILAGE AND MENISCUSUSING ANIONIC AND CATIONIC CONTRAST AGENTS
PUBLICATIONS OF THE UNIVERSITY OF EASTERN FINLAND
Contrast enhanced computed tomography (CECT) is a promising technique for detecting articular
cartilage pathologies. However, its potential for meniscal imaging has not been thoroughly
studied. CECT could enable simultaneous quantitative imaging of these tissues provided
that the differences between their diffusion kinematics were known. CECT using anionic and cationic contrast agents was utilized to
study articular cartilage and meniscus and the differences between their diffusion kinematics.
JUUSO HONKANEN