Embed Size (px)
Citation preview
uef.fi
PUBLICATIONS OF THE UNIVERSITY OF EASTERN FINLAND
Dissertations in Forestry and Natural Sciences
ISBN 978-952-61-3183-2ISSN 1798-5668
Dissertations in Forestry and Natural Sciences
DIS
SE
RT
AT
ION
S | T
OM
I MIE
TT
INE
N | S
UIT
AB
ILIT
Y O
F A
SE
LF
-AP
PL
ICA
BL
E E
LE
CT
RO
DE
SE
T F
OR
... | No
351
TOMI MIETTINEN
SUITABILITY OF A SELF-APPLICABLE ELECTRODE SETFOR POLYSOMNOGRAPHIC ASSESSMENT OF
SLEEP BRUXISM IN THE HOME ENVIRONMENT
PUBLICATIONS OF THE UNIVERSITY OF EASTERN FINLAND
Sleep bruxism is a condition connected to several adverse effects on orofacial health. Currently, there is a serious lack of reliable and widely available means to quantify the level of sleep bruxism activity. The present
thesis introduces an electrode set that is shown to be easily self-applicable by the patients and capable of providing comprehensive, accurate and reliable quantification of the level of sleep
bruxism activity in a widely available and affordable way.
TOMI MIETTINEN
31227203_UEF_Vaitoskirja_NO_351_Tomi_Miettinen_LUMET_kansi_19_09_19.indd 1 19/09/2019 8.45


Tomi Miettinen
SUITABILITY OF A SELF-APPLICABLE ELECTRODE SET
FOR POLYSOMNOGRAPHIC ASSESSMENT OF SLEEP BRUXISM
IN THE HOME ENVIRONMENT
Publications of the University of Eastern Finland Dissertations in Forestry and Natural Sciences
No 351
University of Eastern Finland Kuopio
2019
Academic dissertation To be presented by permission of the Faculty of Science and Forestry
for public examination in the Auditorium CA102 in the Canthia Building of the University of Eastern Finland, Kuopio
on October 25th, 2019, at 12 o’clock noon
Department of Applied Physics
31227203_UEF_Vaitoskirja_NO_351_Tomi_Miettinen_LUMET_sisus_19_10_02.indd 3 02/10/2019 7.48
ii
Grano Oy Kuopio, 2019
Editors: Pertti Pasanen, Raine Kortet, Jukka Tuomela, Matti Tedre
Distribution: University of Eastern Finland / Sales of publications www.uef.fi/kirjasto
ISBN: 978-952-61-3183-2 (nid.) ISBN: 978-952-61-3184-9 (PDF)
ISSNL: 1798-5668 ISSN: 1798-5668
ISSN: 1798-5676 (PDF)
31227203_UEF_Vaitoskirja_NO_351_Tomi_Miettinen_LUMET_sisus_19_10_02.indd 4 02/10/2019 7.48
iii
Author’s address: Tomi Miettinen University of Eastern Finland
Department of Applied Physics P.O. Box 1627 70211 KUOPIO, FINLAND email: [email protected] Supervisors: Adjunct Professor Sami Myllymaa, Ph.D. University of Eastern Finland Department of Applied Physics P.O. Box 1627 70211 KUOPIO, FINLAND email: [email protected] Professor Kirsi Sipilä, D.D.S., Ph.D. University of Oulu Research Unit of Oral Health Sciences P.O. Box 8000 90014 OULU, FINLAND email: [email protected] Adjunct Professor Katja Myllymaa, Ph.D. Kuopio University Hospital Department of Clinical Neurophysiology P.O. Box 100 70029 KUOPIO, FINLAND email: [email protected]
Professor Juha Töyräs, Ph.D. The University of Queensland
School of Information Technology and Electrical Engineering
St Lucia Qld 4072 BRISBANE, QUEENSLAND, AUSTRALIA and University of Eastern Finland Department of Applied Physics P.O. Box 1627 70211 KUOPIO, FINLAND email: [email protected]
31227203_UEF_Vaitoskirja_NO_351_Tomi_Miettinen_LUMET_sisus_19_10_02.indd 5 02/10/2019 7.48
iv
Reviewers: Professor Gilles Lavigne, D.M.D., Ph.D. University of Montreal Faculty of Dental Medicine Pain, Sleep and Traumatology Laboratory
C.P. 6128, succ. Centre-ville MONTRÉAL, QUEBÉC, CANADA H3C 3J7 email: [email protected]
Associate Professor Maarten De Vos, Ph.D. University of Oxford Department of Engineering Science Institute of Biomedical Engineering Parks Road OXFORD, UNITED KINGDOM OX1 3PJ email: [email protected]
Opponent: Professor Jari Hyttinen, Ph.D. University of Tampere Department of Medicine and Health Technology
BioMediTech Institute of Biosciences and Medical Technology
Arvo Ylpön katu 34 33520 TAMPERE, FINLAND email: [email protected]
31227203_UEF_Vaitoskirja_NO_351_Tomi_Miettinen_LUMET_sisus_19_10_02.indd 6 02/10/2019 7.48
v
Miettinen, Tomi Suitability of a Self-Applicable Electrode Set for Polysomnographic Assessment of Sleep Bruxism in the Home Environment. Kuopio: University of Eastern Finland, 2019 Publications of the University of Eastern Finland Dissertations in Forestry and Natural Sciences 2019; 351
ABSTRACT
Sleep bruxism (SB) is defined as repetitive jaw muscle activity characterized by clenching or grinding of the teeth and/or bracing or thrusting the mandible. SB is a prevalent condition that affects approximately 8-15% of population; it may have various negative health consequences, such as tooth wear, orofacial pain and headaches, may be associated with several co-morbidites, and it can be present in either primary or secondary SB. Currently, treatment of SB is mainly focused on managing its consequences.
Sleep laboratory polysomnography (PSG) is considered as the gold standard for SB assessment. Unfortunately, it has limited availability and it is expensive to utilize, and thus its use is prioritized for the diagnosis of the most severe sleep disorders. Furthermore, PSG cannot be utilized for the long-term studies often required in the research settings. Some of the more affordable and applicable ambulatory devices for SB assessment have shown good performance in the screening of SB patients, but are not necessarily accurate enough for research purposes due to significant overestimation of SB activity. SB is quantified as masticatory muscle activity (MMA) and it exhibits an extensive night-to-night variablity. In some patients, there have been indications that a single recording night might not be sufficiently representitive due to the first night effect (FNE), i.e. disturbances caused by changes in the sleeping environment, meaning that a patient may well display altered results on the first night. There is a need for new instrumental assessment tools that would quantify SB activity accurately, at the same time as being applicable (feasible), affordable (cost-effective) and accessible (suitable for everyday clinical use).
A screen-printed emergency EEG set, developed in a collaboration of University of Eastern Finland and Kuopio University Hospital, has been previously shown to have an easy and quick applicablity and high signal quality in clinical settings, and furthermore, to be applicable for the sleep stage determination in PSG. In this doctoral thesis, the technology utilized in the emergency EEG set has been further developed and introduced as a possible solution for the lack of highly accurate SB assessment methods needed in the research and clinical settings.
The overarching aim of this doctoral thesis was to evaluate the suitability of a screen-printed ambulatory electrode set for SB assessment in unattended home PSG that is self-applied by the patients. Firstly, the diagnostic accuracy in patient
31227203_UEF_Vaitoskirja_NO_351_Tomi_Miettinen_LUMET_sisus_19_10_02.indd 7 02/10/2019 7.48
vi
classification with the original EEG electrode set was assessed against a standard PSG recording montage in a sleep laboratory. Secondly, the accuracy of MMA detection with the proposed electrode set based PSG montage was compared against a set of simulated unattended, reduced PSG and portable monitoring in a sleep laboratory setting. Thirdly, the applicability of a re-designed electrode set was tested when it was self-applied by the patients in unattended home PSG. Finally, the need for the possible repetition of recordings due to FNE and the associated high night-to-night variabilty was assessed in a small volunteer population.
The patient classification and the scoring accuracy of MMA events of the electrode set PSG montage were found to display good concordance with the standard PSG. When subjects were assessed with the electrode set PSG montage, similar classification results were obtained as with the standard PSG montage when similar means were present for MMA detection. The MMA event scoring with the proposed electrode set PSG montage achieved a good consistency (Intra-class correlation coefficient = 0.940, p < 0.001) and monotonic relationship (Spearman’s correlation coefficient = 0.926, p < 0.001) with the standard PSG, with only a slight risk for MMA overestimation. Furthermore, the re-designed electrode set was found to be reliable and sufficiently easy for patients to use by themselves such that good quality home PSG recordings (90% of recordings rated “good”) could be obtained with a failure rate of 5%, comparable or even lower than with standard home PSG. Indications of FNE were found, and there was a high night-to-night variability (mean coefficient of variation 50.7%) in the volunteered population and thus the repetition of recorded night(s) may be required in all settings.
To conclude, the introduced electrode set has the potential to improve the PSG assessment of SB by enabling high accuracy recordings to be administered in the home environment, making it substantially more applicable, affordable and accessible as compared to the standard PSG. In research settings, it could help to provide answers related to many open questions concerning SB. In the clinical setting, it could possibly be utilized in evaluating more demanding cases where SB and co-morbidity assessment need to be conducted concomitantly. National Library of Medicine Classification: QT 36.2, WE 560, WL 150, WM 188, WU 158 Medical Subject Headings: Sleep Bruxism/diagnosis; Electromyography/ instrumentation; Electroencephalography/instrumentation; Polysomnography; Electrodes; Masticatory Muscles; Self Care Yleinen suomalainen ontologia: bruksismi; uni (lepotila); diagnostiikka; elektromyografia; EEG; instrumentointi; elektrodit; itsehoito; kotiympäristö
31227203_UEF_Vaitoskirja_NO_351_Tomi_Miettinen_LUMET_sisus_19_10_02.indd 8 02/10/2019 7.48
vii
ACKNOWLEDGEMENTS
The work behind this thesis was carried out in the Department of Applied Physics of the University of Eastern Finland, the Department of Clinical Neurophysiology in the Diagnostic Imaging Centre of Kuopio University Hospital, and Institute of Dentistry of the University of Eastern Finland during the years 2015 – 2019. “If you have the courage to begin, you have the courage to succeed.”
- - David Viscott When I was younger, I thought I do not possess the courage to even to begin to think of tackling a massive mount of work required for finishing a master’s thesis, let alone a Ph.D. thesis! I didn’t had any idea how to manage a task as complex as that. Until then, my way of doing things was mostly based on hard work by learning and doing everything preferably by myself. A thesis seemed to me as too large of a task on my own. Luckily, I had the courage to begin, as I later learned that no one needs to face these odds alone. Based on my experiences, a successful completion of a PhD thesis always involves sharing the burden with others. In a fruitful collaboration, one can learn immensely from the experiences of others and be encouraged do one’s best. I would like to thank everyone who has had any contribution in the work behind this thesis, whether it considers the development of the electrode set used in this thesis, administering the recording devices, participating in the recordings, being a co-author in a paper of this thesis, or just being supportive friend during tough times, to give a few examples. Work such as this is always a collective effort.
I would like to name some people that I think especially had great influence over the completion of this manuscript. First of all, I would like to thank the supervisors of this thesis. Thank you Sami, Katja, Kirsi and Juha for giving me the opportunity to pursue Ph.D. degree with this thesis, which is based on your previous work with the electrode set and the idea to utilize it for sleep bruxism assessment. Thank you for always providing great advices concerning the preparation of the manuscripts, conducting the recordings, encouraging me to go on and giving me support on every aspect I ever had problems on. I don’t think one could wish for better supervisors.
My sincere gratitude goes to the preliminary reviewers of this thesis, Professor Gilles Lavigne and Professor Maarten De Vos for their comprehensive review. Thank you Professor Jari Hyttinen for accepting the invitation for being the opponent in the public examination of this thesis, I am honored that you accepted. I would also like to thank all the reviewers and editors in the journals where I’ve submitted the papers for their input for the improvement of the papers of this thesis.
The following organizations are thanked for the financial support I have received for this thesis: University of Eastern Finland, Tekes, Instrumentarium Science Foundation, Kuopio University Hospital Catchment Area Research Committee for
31227203_UEF_Vaitoskirja_NO_351_Tomi_Miettinen_LUMET_sisus_19_10_02.indd 9 02/10/2019 7.48
viii
State Research and North Savo Fund of the Finnish Culture Foundation. Screentec Oy is acknowledged for manufacturing the electrode sets used in this thesis, and Nox Medical and Resmed for providing technical support in the form of recording equipment and guidance.
Everyone who has participated in any part of this thesis deserves many thanks. Thank you Anu, Susanna, Taina, Reijo, Esa and Jari for the co-authorship in the papers, all the work you put in them and your constructive comments on the manuscripts. I also would like to thank every colleague in the Department of Applied Physics and Institute of Dentistry in UEF, the Department of Clinical Neurophysiology in KUH, and the Cancer Center of Helsinki University Central Hospital, as well as all the fellow students I’ve got to know during the years as an undergraduate, for your collegiality and support. Many thanks goes especially for all the members of the Sleep Technology and Analytics Group and the Biomaterial Technology Group. I would like to thank the technologist staff of the Department of Clinical Neurophysiology for conducting the PSG recordings and the people of Oivauni Oy for the fluent collaboration in the sleep stage scoring of the recorded data. I would like to thank Kuopio Academy of Design for the collaboration in developing the instruction manual for using the electrode set. Ewen MacDonald is acknowledged for the linguistic revision of the thesis. My biggest gratitude goes to all volunteers who participated in the recordings. Without you, this thesis would not exist.
I am grateful for my parents Pekka and Helvi, and grandparents Anna, Hugo and Helvi, who always supported and encouraged me on my chosen path, especially when the path seemed difficult and sometimes without an end in sight. My siblings Anne, Topi and Anniina, their families, and other close family members also deserve a great number of thanks for their support.
My friends are my greatest treasure. Thanks guys and girls who I’ve had the privilege to have fun with and to enjoy the life to the fullest. Very special thanks goes to the oldest of my friends from Vehmersalmi (and others), as well as all my friends from Kuopion Lyseo, especially the so called “Puliklubi”: Aku, Henri, Jesse, Panu, Peetu, Simo, Teemu and Teppo. In one of our Christmas parties they made the promise to always serve me beer at my request in our future meetings, as long as I’ve held my dissertation and karonkka to which they are invited. Now I’m making it official. Prepare for years of servitude, boys.
Lastly and most importantly, I would like to thank my dearest Maiju for your unconditional love and support during all this time. From now on, I promise to come home a little earlier from work, if you promise to put up with more of my bad jokes. I love you, rhodium.
Helsinki, August 27th, 2019 Tomi Miettinen
31227203_UEF_Vaitoskirja_NO_351_Tomi_Miettinen_LUMET_sisus_19_10_02.indd 10 02/10/2019 7.48
ix
LIST OF ABBREVIATIONS
AASM American Academy of Sleep Medicine AB Awake Bruxism Ag Silver AgCl Silver chloride ANS Autonomic Nervous System BTI Bruxism Time Index CAP Cyclic Alternating Pattern CBT Cognitive Behavioral Therapy CNS Central Nervous System CV Coefficient of Variation DC/TMD Diagnostic Criteria for Temporomandibular Disorders ECG Electrocardiography EEG Electroencephalography EMG Electromyography EOG Electrooculography ER Emergency Room GABA γ-aminobutyric acid GERD Gastroesophageal Reflux Disorder HR Heart Rate ICU Intensive Care Unit ICC Intra-class Correlation LAMF Low-Amplitude Mixed Frequency MAD Mandibular Advancement Device MDMA 3,4-Methylenedioxymethamphetamine MMA Masticatory Muscle Activity MVC Maximal Voluntary Clenching N1 N1 Sleep Stage N2 N2 Sleep Stage N3 N3 Sleep Stage NREM Non-Rapid Eye Movement OBC Oral Behaviours Checklist OFA Orofacial Movement OMA Other Muscular Activity PLM Periodic leg movement PSA Positive Specific Agreement PSG Polysomnography RBD Rapid Eye Movement Sleep Behaviour Disorder RDC/TMD Research Diagnostic Criteria for Temporomandibular Disorders
31227203_UEF_Vaitoskirja_NO_351_Tomi_Miettinen_LUMET_sisus_19_10_02.indd 11 02/10/2019 7.48
x
REM Rapid Eye Movement RM-ANOVA Repeated Measures Analysis of Variance RMMA Rhytmic Masticatory Muscle Activity SB Sleep Bruxism SDB Sleep Disordered Breathing SE Sleep Efficiency SL Sleep Latency SRA Signal Recognition Algorithm TMD Temporomandibular Disorders TRT Total Recording Time TST Total Sleep Time WASO Wake After Sleep Onset
31227203_UEF_Vaitoskirja_NO_351_Tomi_Miettinen_LUMET_sisus_19_10_02.indd 12 02/10/2019 7.48

xi
LIST OF SYMBOLS
A Anion Ce Capacitance of the epidermis and stratum corneum Cp Capacitance of the sweat gland and duct e- Electron Ehc Half-cell potential Ep Potential difference between the sweat duct and dermis or
subcutaneous tissue Ese Potential difference over the stratum corneum K Cation N Newton Ω Ohm Re Resistance of the epidermis and stratum corneum Rp Resistance of sweat gland and duct Rs Resistance caused by interface effects between electrode and skin Ru Resistance of the dermis and deeper layers of skin s Second V Volt Z Electrical impedance
31227203_UEF_Vaitoskirja_NO_351_Tomi_Miettinen_LUMET_sisus_19_10_02.indd 13 02/10/2019 7.48

xii
31227203_UEF_Vaitoskirja_NO_351_Tomi_Miettinen_LUMET_sisus_19_10_02.indd 14 02/10/2019 7.48
xiii
LIST OF ORIGINAL PUBLICATIONS This thesis is based on data presented in the following articles, referred to by the Roman Numerals I-IV. I Miettinen T, Myllymaa K, Muraja-Murro A, Westeren-Punnonen S, Hukkanen
T, Töyräs J, Lappalainen R, Mervaala E, Sipilä K, Myllymaa S. (2018). Screen-printed ambulatory electrode set enables accurate diagnostics of sleep bruxism. Journal of Sleep Research, 27(1):103-112.
II Miettinen T, Myllymaa K, Muraja-Murro A, Westeren-Punnonen S, Hukkanen
T, Töyräs J, Lappalainen R, Mervaala E, Sipilä K, Myllymaa S. (2019). Polysomnographic Scoring of Sleep Bruxism Events Is Accurate Even in the Absence of Video Recording but Unreliable with EMG-Only Setups. Sleep and Breathing. Advance online publication.
III Miettinen T, Myllymaa K, Westeren-Punnonen S, Ahlberg J, Hukkanen T,
Töyräs J, Lappalainen R, Mervaala E, Sipilä K, Myllymaa S. (2018). Success Rate and Technical Quality of Home Polysomnography With Self-Applicable Electrode Set in Subjects with Possible Sleep Bruxism. IEEE Journal of Biomedical and Health Informatics, 22(4):1124-1132.
IV Miettinen T, Myllymaa K, Hukkanen T, Töyräs J, Sipilä K, Myllymaa S. (2018).
Home Polysomnography Reveals a First-Night Effect in Patients With Low Sleep Bruxism Activity. Journal of Clinical Sleep Medicine, 14(8):1377-1386.
31227203_UEF_Vaitoskirja_NO_351_Tomi_Miettinen_LUMET_sisus_19_10_02.indd 15 02/10/2019 7.48

xiv
31227203_UEF_Vaitoskirja_NO_351_Tomi_Miettinen_LUMET_sisus_19_10_02.indd 16 02/10/2019 7.48
xv
AUTHOR’S CONTRIBUTION I) The author designed the analysis portion of the study with the co-authors, was
responsible for scoring the bruxism events in the EMG data, conducting the data analyses, interpreting the results with the co-authors and preparing the manuscript.
II) The author designed the analysis portion of the study, was responsible for scoring the bruxism events in the EMG data, conducting the data analyses, interpreting the results with the co-authors and preparing the manuscript.
III) The author designed the analysis portion of the study with the co-authors and
was responsible for designing the second prototype of the electrode set used in studies III and IV, scoring the bruxism events in the EMG data, evaluating the technical quality of the recordings, conducting the data analyses, interpreting the results with the co-authors and preparing the manuscript.
IV) The author designed the whole study with the co-authors, participated in
volunteer recruitment, took part in guiding the volunteers on how to use the equipment and collecting the recordings, and was responsible for scoring the bruxism events in the EMG data, conducting the data analyses, interpreting the results with the co-authors and preparing the manuscript.
In all manuscripts, the collaboration with the co-authors has been significant.
31227203_UEF_Vaitoskirja_NO_351_Tomi_Miettinen_LUMET_sisus_19_10_02.indd 17 02/10/2019 7.48

xvi
31227203_UEF_Vaitoskirja_NO_351_Tomi_Miettinen_LUMET_sisus_19_10_02.indd 18 02/10/2019 7.48

xvii
DISCLOSURE STATEMENT During the time of preparing the thesis and the papers it was based on, the author was employed by the Department of Applied Physics, University of Eastern Finland, Institute of Dentistry, University of Eastern Finland, Department of Clinical Neurophysiology, Kuopio University Hospital and by the Cancer Center of Helsinki University Central Hospital. This work was financially supported by The Finnish Funding Agency for Technology and Innovation project of 40047/14 (‘Bruxism’), and by grants from the Research Committee of Kuopio University Hospital Catchment Area for the State Research Funding (projects 5041739, 5041748 and 5041761), Research Foundation of the Pulmonary Diseases and Ulla Tuominen Foundation. The author was supported by grants from Instrumentarium Science Foundation and North Savo Regional fund of Finnish Cultural Foundation.
Five of the co-authors (Katja Myllymaa, Juha Töyräs, Reijo Lappalainen, Esa Mervaala and Sami Myllymaa) in the papers of this thesis are amongst the original developers of the frontal electrode set used in studies I and II. This electrode set was originally designed for emergency EEG use and patented by the University of Eastern Finland. The patent was later sold to Mega Electronics Oy, later Bittium Biosignals Oy (Kuopio, Finland) and the concept of the electrode set has been used as the basis for a new commercially available “BrainStatus” emergency EEG electrode set. The University of Eastern Finland and the previously named original developers have a royalty agreement for the sales of BrainStatus with Bittium Biosignals Oy.
All procedures performed in studies involving human participants were conducted in accordance with the ethical standards of the institutional and/or national research committee and with the 1964 Helsinki Declaration and its later amendments or comparable ethical standards. The study protocol was reviewed by the Research Ethics Committee of the Hospital District of Northern Savo, Kuopio, Finland (favorable opinion: 34/2013) and permission for the research use of frontal electrode set was obtained from the National Supervisory Authority for Welfare and Health (Valvira, 220/2013). Informed consent was obtained from all individual participants included in the study.
31227203_UEF_Vaitoskirja_NO_351_Tomi_Miettinen_LUMET_sisus_19_10_02.indd 19 02/10/2019 7.48

xviii
31227203_UEF_Vaitoskirja_NO_351_Tomi_Miettinen_LUMET_sisus_19_10_02.indd 20 02/10/2019 7.48
xix
CONTENTS
1 INTRODUCTION ................................................................................... 1
2 SLEEP BRUXISM ................................................................................. 5 2.1 Definition……….. .......................................................................................... 5 2.2 Prevalence…………….. ................................................................................ 6 2.3 Etiology……………….. .................................................................................. 7
2.3.1 Peripheral Factors ............................................................................... 7 2.3.2 Psychological Factors and Stress ....................................................... 8 2.3.3 Neurophysiological Factors................................................................. 8 2.3.4 Factors Related to the Oral Physiology .............................................. 9 2.3.5 Genetic Factors ................................................................................. 10 2.3.6 Conclusion ........................................................................................ 10
2.4 Pathophysiology .......................................................................................... 10 2.5 Clinical Findings and Co-morbidities ........................................................... 14
2.5.1 Clinical Findings and Symptoms ....................................................... 14 2.5.2 Co-morbidities ................................................................................... 16
2.6 Management………………… ...................................................................... 19 2.6.1 Dental and Oral Approaches ............................................................ 19 2.6.2 Pharmacological Approaches ........................................................... 20 2.6.3 Behavioral Approaches ..................................................................... 21 2.6.4 Lack of Evidence ............................................................................... 22
3 BIOSIGNAL RECORDINGS IN POLYSOMNOGRAPHY .................... 23 3.1 Physiological Origin of Bioelectrical Signals ............................................... 24 3.2 Biosignal Electrodes and Instrumentation ................................................... 25
3.2.1 Skin-Electrode Interface .................................................................... 25 3.2.2 Electrodes and Devices .................................................................... 28 3.2.3 Recording Techniques ...................................................................... 30 3.2.4 Signal Processing ............................................................................. 31
3.3 Recording Setups ........................................................................................ 32 3.3.1 Electroencephalography ................................................................... 32 3.3.2 Electrooculography ........................................................................... 33 3.3.3 Electromyography ............................................................................. 34 3.3.4 Electrocardiography .......................................................................... 34
3.4 Analysis of Polysomnographic Recordings ................................................. 34 3.4.1 Masticatory Muscle Activity and Other Physiological Events ........... 34 3.4.2 Sleep Stages ..................................................................................... 35 3.4.3 Typical Artifacts ................................................................................. 37
31227203_UEF_Vaitoskirja_NO_351_Tomi_Miettinen_LUMET_sisus_19_10_02.indd 21 02/10/2019 7.48
xx
4 ASSESSMENT OF SLEEP BRUXISM ................................................. 39 4.1 Self-Reports…………… ..............................................................................40 4.2 Clinical Examination ....................................................................................41 4.3 Instrumental Assessment ............................................................................43
4.3.1 Attended Sleep Laboratory Polysomnography .................................44 4.3.2 Unattended or Reduced Setups ........................................................48
5 SCREEN-PRINTED ELECTRODE SETS ............................................. 55 5.1 Materials and Design ...................................................................................55 5.2 Performance……. ........................................................................................58
6 AIMS OF THE THESIS ........................................................................ 61
7 METHODS ........................................................................................... 63 7.1 Subjects………………. ................................................................................63 7.2 Data Acquisition ..........................................................................................65
7.2.1 Sleep Laboratory Polysomnography .................................................65 7.2.2 Newly Designed Self-Applicable Electrode Sets ..............................68 7.2.3 Home Polysomnography ...................................................................72
7.3 Sleep Study Scoring ....................................................................................73 7.3.1 Masticatory Muscle Activity Events ...................................................73 7.3.2 Orofacial Movement and Other Muscular Activity Events .................75 7.3.3 Sleep Stages and Cortical Arousals .................................................76
7.4 Technical Quality Analyses .........................................................................78 7.5 Derived Variables and Statistical Analyses .................................................80
8 RESULTS ............................................................................................ 83 8.1 Diagnostic Accuracy ....................................................................................84 8.2 Event Scoring Accuracy ..............................................................................87 8.3 Technical Quality and Failure Rate of the Recordings ................................94 8.4 Night-to-Night Variability and the Presence of the First-Night Effect ........100
9 DISCUSSION ..................................................................................... 103 9.1 Accuracy of the Electrode Set in the Assessment of Sleep Bruxism ........103
9.1.1 Patient Classification Accuracy .......................................................103 9.1.2 Improving the Patient Classification Accuracy ................................104 9.1.3 Event Scoring Accuracy ..................................................................106 9.1.4 Factors Affecting the Scoring Accuracy ..........................................108
9.2 Reliability of the Electrode Set in Self-Applied Polysomnography ............110 9.3 The First-Night Effect and Night-to-Night Variability .................................113 9.4 Summary of the Performance Evaluation .................................................115
10 CONCLUSIONS ................................................................................. 119
11 BIBLIOGRAPHY ................................................................................ 121
31227203_UEF_Vaitoskirja_NO_351_Tomi_Miettinen_LUMET_sisus_19_10_02.indd 22 02/10/2019 7.48
1
1 INTRODUCTION
Bruxism has had numerous different definitions and classifications throughout the years it has been studied, depending on the viewpoint and what kind of knowledge has been available at different times. Currently, sleep bruxism (SB) is defined by the leading bruxism experts as ‘a masticatory muscle activity during sleep that is characterised as rhythmic (phasic) or non-rhythmic (tonic)’ (Lobbezoo et al., 2018). SB is clinically unrelated to, and distinct from awake bruxism (AB), which is defined as ‘masticatory muscle activity during wakefulness that is characterised by repetitive or sustained tooth contact and/or by bracing or thrusting the mandible’. (Ilovar et al., 2014; Lobbezoo et al., 2018). SB is defined primarily as a behaviour which only may, in excessive cases, lead to negative health consequences, but it can also be a symptom of some other underlying condition (Lobbezoo et al., 2018). For this reason, both definitions of SB and AB are supplemented with a clarification that it ‘is not a movement disorder or a sleep disorder in otherwise healthy individuals’ (Lobbezoo et al., 2018). The prevalence of SB in adult population is 8.0 - 15.3% in questionnaires based on self-reporting (Lavigne and Montplaisir, 1994; Ohayon et al., 2001; Kato et al., 2012; Maluly et al., 2013; Manfredini et al., 2013b) and 7.4% when studied in a sleep laboratory (Maluly et al., 2013). SB has multifactorial pathophysiology although it is believed to be mainly centrally regulated (Lobbezoo and Naeije, 2001; Nukazawa et al., 2017).
SB is traditionally considered as a risk factor for tooth wear (Abe et al., 2009; Carra et al., 2012), orofacial pain (Camparis and Siqueira, 2006; Rompré et al., 2007; Rossetti et al., 2008), headaches (Vendrame et al., 2008; Fernandes et al., 2013), and temporomandibular disorders (TMD) (Fernandes et al., 2013; Blanco Aguilera et al., 2014). Some studies suggest that in addition to exerting negative health consequences, SB might even be beneficial in some individuals and the positive and negative effects are not necessarily mutually exclusive (Manfredini et al., 2015b; Lobbezoo et al., 2018). However, many of the causal relationships between SB and the health consequences are considered inconclusive (Johansson et al., 2008; Jiménez-Silva et al., 2017), and the prevalence of negative health outcomes is not necessarily higher in individuals claimed to have SB in comparison to individuals who do not report or show any signs of SB (Raphael et al., 2012, 2016b). Furthermore, tooth wear and TMD may also be due to different reasons and have other contributing factors (Raphael et al., 2013; Palinkas et al., 2015).
A problem in several studies reporting the associations between SB and health consequences, as well as the efficacy of SB management approaches, is that they are based on populations of patients with self-reported SB. Both self-report (Raphael et al., 2015) and clinical examination (Palinkas et al., 2015) are considered to be unreliable methods for assessing the true ongoing occurrence of SB when they are
31227203_UEF_Vaitoskirja_NO_351_Tomi_Miettinen_LUMET_sisus_19_10_02.indd 23 02/10/2019 7.48
2
not complemented with any kind of quantitative instrumental assessment methods (Lobbezoo et al., 2018). The main reason why self-reporting and/or clinical examination have been mainly used in diagnostics, epidemiologic studies and trials of the efficacy of the management approaches is the poor availability and high costs of the reliable instrumental methods which could reliably measure the occurrence of SB (Blanco Aguilera et al., 2014). Nevertheless, even the instrumental means to assess SB activity level have been shown to correspond poorly to the putative detrimental consequences of SB (Raphael et al., 2016b). One possible explanation for this is that SB has a high night-to-night variablity (Lavigne et al., 2001; Hasegawa et al., 2013) and it is unclear whether the most common approach of recording only one or two nights (due to costs) as the basis for the assessment of the level of SB activity is sufficiently representative to draw conclusions on the actual ongoing level of SB activity. One could say it would be especially important to understand with some level of certainty what is causing the detrimental effects on the body to allow the reasons for the negative health outcomes to be identified and the patients treated accordingly with evidence-based and effective management methods. The current methods to assess SB activity are not good enough to achieve this goal.
Polysomnography (PSG) in a sleep laboratory setting is currently the gold standard to reliably recognize the ongoing occurrence of SB (Carra et al., 2015a). The diagnosis and quantification of SB is performed by scoring episodes of masseter and/or temporalis muscle activity in an electromyographic (EMG) signal (Carra et al., 2012, 2015a). These scored events are called masticatory muscle activity (MMA) events. Most commonly, the PSG-derived diagnosis of SB is based on the MMA index: the ratio of the number of detected SB-related MMA events to the total sleep time (TST) (Carra et al., 2015a), the latter of which is determined with electroencephalography (EEG) based sleep stage scoring (Berry et al., 2018). Other orofacial movements or muscular activities (e.g. yawning, swallowing or changing position) are distinguished from SB-associated MMA events with audio and video recordings in order to avoid an overestimation of MMA index (Dutra et al., 2009; Carra et al., 2015b).
Although sleep laboratory PSG (type I) is the most specific and sensitive method for assessing SB, it is expensive, labor-intensive, confined to a hospital environment and therefore it has a very limited availability (Kushida et al., 2005). Because of this, the use of sleep laboratory PSG is usually restricted to the diagnosis of only the most severe sleep disorders, such as narcolepsy (Kushida et al., 2005). Sleep laboratory PSG is also cumbersome from the point of view of the patient; the quality of the sleep is often poor in the unfamiliar sleeping environment (Bruyneel et al., 2011; Newell et al., 2012). Furthermore, for practical reasons, sleep laboratory PSG cannot be utilized for more than one or two nights due to its costs and the inconvenience it causes the patients, having to sleep in a foreign environment. Nonetheless, recording for several nights during a long timespan may be needed in some cases e.g. for testing the long-term efficacy of new treatment methods.
31227203_UEF_Vaitoskirja_NO_351_Tomi_Miettinen_LUMET_sisus_19_10_02.indd 24 02/10/2019 7.48
3
Home PSG (type II, including EEG) is considered a more user-friendly alternative to sleep laboratory PSG in assessing SB activity (Carra et al., 2015a). Although its use is not restricted to sleep laboratory environment, it has to be done in the vicinity of the medical facilites that have personnel skilled with EEG electrode appliance, making it unavailable especially in basic dental health care, i.e. it suffers the same limitations as type I PSG. However, home PSG is more cost-effective and better suited to be utilized for several nights.
Portable sleep monitors without EEG recordings (type III) can be applied by patients themselves but they lack the capability for accurate TST determination and are unable to discriminate between awake bruxism and SB. Furthermore, the accuracy of home PSG (both types II and III) in the assessment of SB activity may be lower than that achievable in a sleep laboratory PSG, depending whether or not the home PSG montage includes audio and video footage that are crucial for the recognition of true MMA events from other orofacial movements and other musclar events (Carra et al., 2015).
Simple ambulatory devices (type IV) have been claimed to be less cumbersome methods to instrumentally assess SB activity. These devices typically record simply masseter or temporalis EMG activity and are often supplemented with an automatic event detection system, thus not requiring expertise in analyzing the results (Shochat et al., 2007; Jadidi et al., 2008; Yamaguchi et al., 2012; Mizumori et al., 2013; Castroflorio et al., 2014; Stuginski-Barbosa et al., 2016). Whilst these ambulatory EMG devices are simple and comfortable to use for even long periods of time, the problem with their accuracy is the same as encountered with home PSG i.e. they overestimate the number of MMA events (Carra et al., 2015b). The devices lack the possiblity to distinguish MMA events from other orofacial movements or muscular events and ultimately non-SB related events are included in the MMA index. Furthermore, as in case with type III devices, sleep time can not be reliably determined and the devices are unable to distinguish between SB and AB. Type II, III and IV recordings may require repetition, because unlike in sleep laboratory PSG, the recordings are unattended and may fail since there is no technician to fix any problems encountered with the recording devices (Bruyneel and Ninane, 2014).
To conclude, no method has yet been developed for the instrumental assessment of SB activity that at the same time would be accurate in determining the MMA index, would be reliable, cost-effective to use, widely available and could be used to detect the possible co-morbidites of SB. This has lead to a situation that it is often unclear why a patient is experiencing negative health consequences and thus it is difficult to effectively treat these conditions.
Motivated by this urgent unmet need, our research group started developing a new solution for SB diagnostics in 2013, based on an easily and rapidly applicable emergency EEG electrode set (Lepola et al., 2014a, 2014b, 2015). This original electrode set could be set up for use in a matter of minutes (Lepola et al., 2014b), and it has been found to be suitable for the accurate determination of TST (Myllymaa et
31227203_UEF_Vaitoskirja_NO_351_Tomi_Miettinen_LUMET_sisus_19_10_02.indd 25 02/10/2019 7.48
4
al., 2016), a parameter that is essential for the accurate determination of the MMA index. The electrode set design could be easily modified to include electrodes to be placed anywhere on the facial area and therefore to achieve a mean to record masticatory EMG. In addition, the electrode set could be modified to be compatible with any home-PSG device and easily be complemented with additional sensors which could increase the accuracy of detecting SB-related MMA events, its co-morbidities and any other physiological phenomena required by clinicians or researchers. All these factors imply that this technology could have a high potential. However, it has not yet been proven that the electrode set is optimal or even suitable for SB assessment.
The aim of this doctoral thesis was to evaluate and potentially improve the suitability of a screen-printed ambulatory electrode set for assessment of SB activity in self-applied home PSG. The research hypothesis was that the technology used in the original emergency EEG electrode set would be suitable and with redesigning could be further utilized for accurate assessment of SB as part of type II PSG.
In order to accomplish the overall aim of the thesis, four tasks were set: i) to investigate the diagnostic accuracy of the electrode set compared to the gold standard PSG in sleep laboratory, ii) to compare the performance in MMA event recognition against other generally used recording setups, iii) to investigate how reliably the re-designed electrode set could be utilized in the home setting by patients themselves, and iv) to determine if there would be a need for several nights to be recorded to reliably assess the ongoing SB activity level in the home setting.
Expected outcomes of this thesis are, first of all, to demonstrate the suitablity of our new tool for both clinicians and researchers to assess SB activity. It is intended that this thesis will contribute to the knowledge of SB activity assessment in home PSG recordings, and furthermore, it will help to identify the key factors that are essential for the further development of self-applicable electrodes to be used as one component of home PSG equipment. If the electrode set is found to be suitable for accurate assessment of SB activity, this may lead to the PSG assessment of SB activity becoming more feasible and therefore, more ubiquitous. If the presently developed electrode set proved to be an accurate and reliable tool for SB activity assessment, the connections between SB and different health outcomes, SB etiology and pathophysiology, and efficacy of new treatment methods could be reliably established which would improve the well-being of millions of people. In clinical use, patients with suspected co-morbidites could receive a more accurate diagnosis for the reasons behind their symptoms. Decisions about managing the SB could be made with quantitative evidence based on direct observation rather than only based on subjective self-report and the currently inconclusive clinical signs and symptoms.
31227203_UEF_Vaitoskirja_NO_351_Tomi_Miettinen_LUMET_sisus_19_10_02.indd 26 02/10/2019 7.48

5
2 SLEEP BRUXISM
The roots of the term “bruxism” are in the Greek word “βρύκειν” (brúkein), which means gnashing of the teeth (Castrillon et al., 2016). Bruxism has had various definitions, views on its etiological background and recommended means to manage it throughout the years, mostly depending on the still evolving scientific knowledge and viewpoints on the subject. 2.1 DEFINITION……….. Bruxism is defined in the ninth edition of Glossary of Prosthodontic Terms as “parafunctional grinding of the teeth” and as “an oral habit consisting of involuntary rhythmic or spasmoidic nonfunctional gnashing, grinding or clenching of the teeth, in other than chewing moments of the mandible, which may lead to occlusal trauma” (The Glossary of Prosthodontic Terms, 2017). The definition of bruxism in the fifth edition of the Orofacial Pain Guidelines issued by the American Academy of Orofacial Pain is: a “diurnal or nocturnal parafunctional activity including clenching, bracing, gnashing and grinding of the teeth” (de Leeuw, 2008).
Sleep bruxism (SB) is categorized in the third edition of the International Classification of Sleep Disorders as a sleep-related movement disorder (American Academy of Sleep Medicine, 2014). This definition is, however, problematic since it strongly implies that bruxism would be a harmful dysfunction per se, and therefore would inherently cause harm to all bruxism practicing individuals, which according to recent scientific reports, may not be the truth (Lobbezoo et al., 2018). In a recent debate between experts, the favoured viewpoint was that bruxism should be considered more as an activity rather than universally harmful disorder (Manfredini et al., 2016; Raphael et al., 2016b, 2016a). The basis for the most recent international consensus paper of the bruxism experts was laid already in 2013 with the following definition:
“Bruxism is a repetitive jaw-muscle activity characterized by clenching or grinding of the teeth and/or by bracing or thrusting of the mandible.” (Lobbezoo et al., 2013).
This definition was further revised in 2018 by Lobbezoo et al.; they postulated that SB should be considered merely as a risk factor for a number of negative health consequences in otherwise healthy individuals, or in some cases, even a protective mechanism (Lobbezoo et al., 2018). The revised version has separate definitions for SB and bruxism during wakefulness (awake bruxism, AB), which are considered to have different etiologies and to be clinically unrelated (Ilovar et al., 2014). Nevertheless, it is possible that these two types of bruxism may overlap in some individuals (Lavigne et al., 2008). The latest suggestion for the definition of SB is:
31227203_UEF_Vaitoskirja_NO_351_Tomi_Miettinen_LUMET_sisus_19_10_02.indd 27 02/10/2019 7.48
6
“Sleep bruxism is a masticatory muscle activity during sleep that is characterised as rhythmic (phasic) or non-rhythmic (tonic) and is not a movement disorder or a sleep disorder in otherwise healthy individuals.” (Lobbezoo et al., 2018).
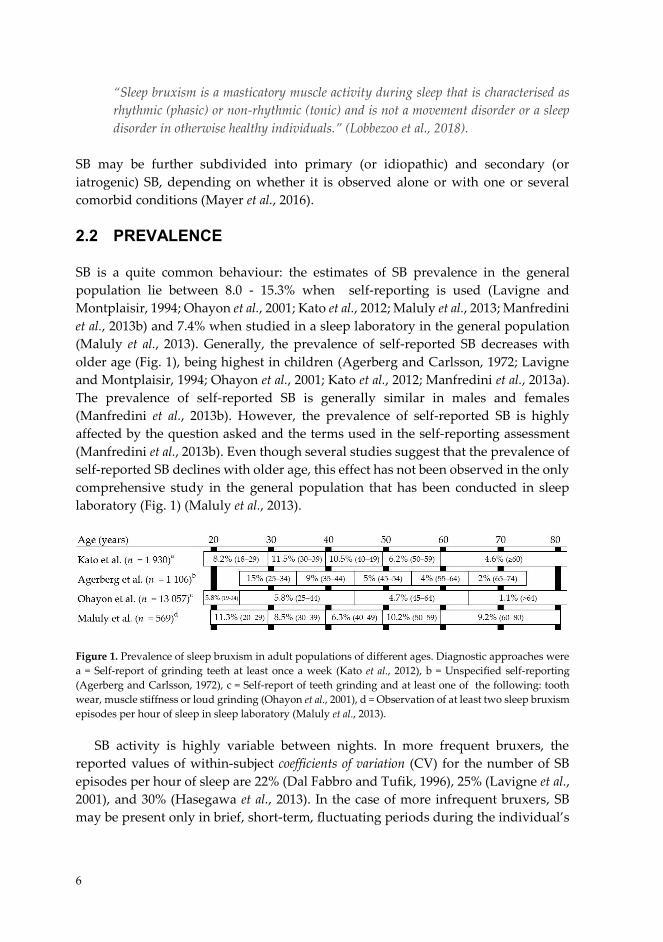
SB may be further subdivided into primary (or idiopathic) and secondary (or iatrogenic) SB, depending on whether it is observed alone or with one or several comorbid conditions (Mayer et al., 2016). 2.2 PREVALENCE…………….. SB is a quite common behaviour: the estimates of SB prevalence in the general population lie between 8.0 - 15.3% when self-reporting is used (Lavigne and Montplaisir, 1994; Ohayon et al., 2001; Kato et al., 2012; Maluly et al., 2013; Manfredini et al., 2013b) and 7.4% when studied in a sleep laboratory in the general population (Maluly et al., 2013). Generally, the prevalence of self-reported SB decreases with older age (Fig. 1), being highest in children (Agerberg and Carlsson, 1972; Lavigne and Montplaisir, 1994; Ohayon et al., 2001; Kato et al., 2012; Manfredini et al., 2013a). The prevalence of self-reported SB is generally similar in males and females (Manfredini et al., 2013b). However, the prevalence of self-reported SB is highly affected by the question asked and the terms used in the self-reporting assessment (Manfredini et al., 2013b). Even though several studies suggest that the prevalence of self-reported SB declines with older age, this effect has not been observed in the only comprehensive study in the general population that has been conducted in sleep laboratory (Fig. 1) (Maluly et al., 2013).
Figure 1. Prevalence of sleep bruxism in adult populations of different ages. Diagnostic approaches were a = Self-report of grinding teeth at least once a week (Kato et al., 2012), b = Unspecified self-reporting (Agerberg and Carlsson, 1972), c = Self-report of teeth grinding and at least one of the following: tooth wear, muscle stiffness or loud grinding (Ohayon et al., 2001), d = Observation of at least two sleep bruxism episodes per hour of sleep in sleep laboratory (Maluly et al., 2013).
SB activity is highly variable between nights. In more frequent bruxers, the reported values of within-subject coefficients of variation (CV) for the number of SB episodes per hour of sleep are 22% (Dal Fabbro and Tufik, 1996), 25% (Lavigne et al., 2001), and 30% (Hasegawa et al., 2013). In the case of more infrequent bruxers, SB may be present only in brief, short-term, fluctuating periods during the individual’s
7
lifespan and may be fully absent at different times, however, this has not been studied comprehensively (Lavigne et al., 2001; Mayer et al., 2016).
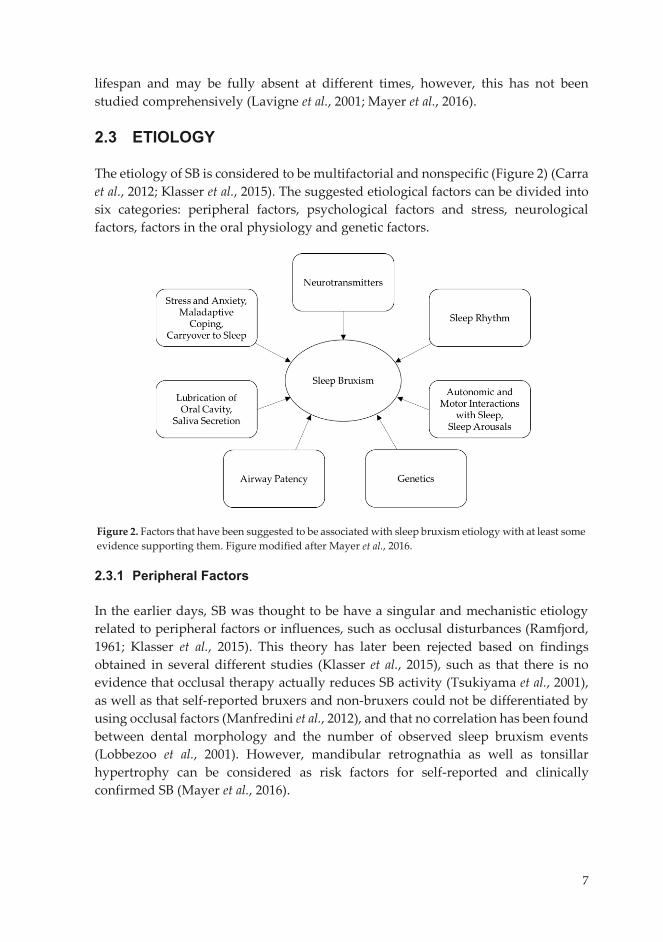
2.3 ETIOLOGY……………….. The etiology of SB is considered to be multifactorial and nonspecific (Figure 2) (Carra et al., 2012; Klasser et al., 2015). The suggested etiological factors can be divided into six categories: peripheral factors, psychological factors and stress, neurological factors, factors in the oral physiology and genetic factors.
2.3.1 Peripheral Factors In the earlier days, SB was thought to be have a singular and mechanistic etiology related to peripheral factors or influences, such as occlusal disturbances (Ramfjord, 1961; Klasser et al., 2015). This theory has later been rejected based on findings obtained in several different studies (Klasser et al., 2015), such as that there is no evidence that occlusal therapy actually reduces SB activity (Tsukiyama et al., 2001), as well as that self-reported bruxers and non-bruxers could not be differentiated by using occlusal factors (Manfredini et al., 2012), and that no correlation has been found between dental morphology and the number of observed sleep bruxism events (Lobbezoo et al., 2001). However, mandibular retrognathia as well as tonsillar hypertrophy can be considered as risk factors for self-reported and clinically confirmed SB (Mayer et al., 2016).
Figure 2. Factors that have been suggested to be associated with sleep bruxism etiology with at least some evidence supporting them. Figure modified after Mayer et al., 2016.
31227203_UEF_Vaitoskirja_NO_351_Tomi_Miettinen_LUMET_sisus_19_10_02.indd 28 02/10/2019 7.48
7
lifespan and may be fully absent at different times, however, this has not been studied comprehensively (Lavigne et al., 2001; Mayer et al., 2016).
2.3 ETIOLOGY……………….. The etiology of SB is considered to be multifactorial and nonspecific (Figure 2) (Carra et al., 2012; Klasser et al., 2015). The suggested etiological factors can be divided into six categories: peripheral factors, psychological factors and stress, neurological factors, factors in the oral physiology and genetic factors.
2.3.1 Peripheral Factors In the earlier days, SB was thought to be have a singular and mechanistic etiology related to peripheral factors or influences, such as occlusal disturbances (Ramfjord, 1961; Klasser et al., 2015). This theory has later been rejected based on findings obtained in several different studies (Klasser et al., 2015), such as that there is no evidence that occlusal therapy actually reduces SB activity (Tsukiyama et al., 2001), as well as that self-reported bruxers and non-bruxers could not be differentiated by using occlusal factors (Manfredini et al., 2012), and that no correlation has been found between dental morphology and the number of observed sleep bruxism events (Lobbezoo et al., 2001). However, mandibular retrognathia as well as tonsillar hypertrophy can be considered as risk factors for self-reported and clinically confirmed SB (Mayer et al., 2016).
Figure 2. Factors that have been suggested to be associated with sleep bruxism etiology with at least some evidence supporting them. Figure modified after Mayer et al., 2016.
31227203_UEF_Vaitoskirja_NO_351_Tomi_Miettinen_LUMET_sisus_19_10_02.indd 29 02/10/2019 7.48
8
2.3.2 Psychological Factors and Stress Previously, stress and psychological factors were also considered to have a significant role in the etiology of SB (Klasser et al., 2015). The role of stress and anxiety has later been criticized as much of the evidence has been derived from unreliable questionnaires based on self-reported measures of ongoing SB activity (Lavigne et al., 2008). Whereas some case studies have reported evidence that sleep-time masseter electromyographic (EMG) activity is increased in patients who have been exposed to physical or mental stressors, this has not been consistently observed in all studies (Klasser et al., 2015). However, it is possible that a subgroup of SB patients may exist that respond to stressors with increased SB activity, but nevertheless, they are considered a minority (Klasser et al., 2015).
Certain psychosocial factors (anxiety, stress sensitivity and depression) have shown mainly a weak association with self-reported SB (Manfredini and Lobbezoo, 2009; Maluly et al., 2013). The role of personality in the genesis of SB has also been debated with no definite conclusions (Feu et al., 2013). Bruxers have been reported to have maladaptive coping strategies as compared to non-bruxers when assessed with questionnaires (Schneider et al., 2007). Subsequently, it has been suggested that bruxism may actually be an adaptive or reactive behaviour to stress and anxiety during wake-time that is carried over to sleep (Carra et al., 2012; Mayer et al., 2016). However, this hypothesis has not been verified convincingly. 2.3.3 Neurophysiological Factors It is currently hypothesized that the functionality of central and autonomic nervous systems (CNS and ANS) plays a significant role in the genesis of SB (Klasser et al., 2015). Several studies have come to the same conclusion to form the basis for a hypothesis that SB is affected by abnormally excitable central jaw motor pathways due to impaired inhibition by the interneurons of trigeminal motoneurons in the brainstem rather than any functional or structural impairment in cortical networks (Gastaldo et al., 2006; Lavigne et al., 2007; Huang et al., 2014; İnan et al., 2017). In SB patients, there is evidence of the possible influence of low levels of γ-aminobutyric acid (GABA) in the brainstem, as well as indications of noradrenergic and dopaminergic systems possibly being associated with the onset of SB (Lobbezoo et al., 1997; Carra et al., 2010; Guaita and Högl, 2016; Fan et al., 2017; Sakai et al., 2017). It has been suggested that the fluctuations or disturbances in various neurochemicals may actually be the trigger for the occurrence of SB (Feu et al., 2013; Carra et al., 2015a).
Further support for the role of CNS and ANS in the genesis of SB is that the majority (50 – 90%) of SB events have been observed to occur in association with transient micro-arousals and increased cardiac sympathetic activity during sleep, especially in young subjects (Kato et al., 2001; Huynh et al., 2006; Lavigne et al., 2007;
31227203_UEF_Vaitoskirja_NO_351_Tomi_Miettinen_LUMET_sisus_19_10_02.indd 30 02/10/2019 7.48

9
Maluly et al., 2013; Nukazawa et al., 2017; Tsujisaka et al., 2018). Micro-arousals are evident as abrupt shifts in the electroencephalography (EEG) frequency that usually last 3 – 15 seconds but do not necessarily lead to a complete awakening (Berry et al., 2018) and are complemented with an increase in heart rate and muscle tone (Kato et al., 2001). Micro-arousals are a normal phenomenon during sleep, occurring 6 – 14 times per hour of sleep (Carra et al., 2012). Sleep bruxers do not experience excessive numbers of arousals (Maluly et al., 2013) and arousals are not considered to be a putative mechanism to SB per se (Mayer et al., 2016). Instead, arousals are suggested to be a permissive window during which SB episodes may occur due to an exaggerated activation of both the motor and autonomic nervous systems in SB patients (Lavigne et al., 2007; Mayer et al., 2016). It has been hypothesized that the decreased functionality of the inhibitory interneurons of the trigeminal motoneurons in SB patients may evoke the abnormal masticatory activity occurring during arousals (which are controlled in the brainstem) (Gastaldo et al., 2006; Lavigne et al., 2007, 2011; Huang et al., 2014; İnan et al., 2017). The occurrence of SB episodes related to micro-arousals has been suggested to be further modulated by a cyclic alternating pattern (CAP), which has been hypothesized to offer a permissive unstable periods in sleep when the sleep related motor events can occur (but not itself act as a generator of SB events) (Carra et al., 2011)
2.3.4 Factors Related to the Oral Physiology Airway obstruction is considered as one putative mechanism for SB in which malocclusion actually may have a role to play (Mayer et al., 2016). Retrognathia as well as tonsillar hypertrophy are risk factors for self-reported and clinically observed SB (Mayer et al., 2016). There is also evidence of a short-term reduction in the number of SB events when oral appliances are used that help to keep the airways open during the night (Balasubramaniam et al., 2014; Klasser et al., 2015). A reduction in SB frequency in children (assessed with questionnaires) has been detected after adenotonsillectomy (DiFrancesco et al., 2004). It has been proposed that in a subgroup of patients, SB would actually be a response to sleep disordered breathing (SDB) by maintaining airway patency throughout the night, although evidence for this hypothesis is still inconclusive (Manfredini et al., 2015b). Even though SDB and SB share common risk factors and may often be present in the same patients (Tsujisaka et al., 2018), the causal relationship is unclear and both conditions are considered to have different physiological mechanisms (Balasubramaniam et al., 2014; Mayer et al., 2016). It is still unclear, whether it would be directly the airway obstruction itself or indirectly the following arousal response that leads to the initiation of a SB episode (Manfredini et al., 2015b; Jokubauskas and Baltrušaitytė, 2017).
Reduced salivary flow has also been suggested as a possible putative mechanism for SB (Carra et al., 2012), since the majority of all swallowing events during the night (68%) in a group of SB patients were observed to occur in association with SB
31227203_UEF_Vaitoskirja_NO_351_Tomi_Miettinen_LUMET_sisus_19_10_02.indd 31 02/10/2019 7.48

10
episodes (Miyawaki et al., 2003a). However, this hypothesis still remains to be confirmed with further investigations. 2.3.5 Genetic Factors Occurrence of SB is believed to be influenced by genetic factors to some extent (Abe et al., 2012, Carra et al., 2015a, Rintakoski et al., 2012, Takaoka et al., 2017). On the whole, studies to assess the hereditary aspect of SB are scarce, but most of them seem to reveal positive evidence for genetic factors having significance in the etiology of SB (Lobbezoo et al., 2014). The main problem with many of the studies on the genetics and hereditary aspects of SB is the same as with most of the studies concerning SB: the ongoing SB activity is not confirmed by any means when questionnaires are used or the method used to confirm the activity has not been validated against the gold standard, possibly causing a significant bias (Lobbezoo et al., 2014). 2.3.6 Conclusion
To conclude, the exact etiology of SB still remains largely unclear. The focus has shifted in the etiology of SB from being singular and mechanistic to multifactorial and nonspecific. The evidence seems to be strongest for the involvment of the neurochemical disturbances in the brainstem for the genesis of SB. However, it does not explain the main putative mechanisms for the onset of SB. There are numerous suggestions for the proposed mechanisms (neurochemical fluctuations or disturbances, stress and anxiety, coping mechanisms, airway patency, lubrication of the oral cavity) and, in fact, it may be that there is no single explanation of why SB occurs in different individuals. One important factor explaining why the etiology of SB is unclear is that most of the studies have been based on subject groups classified by means of self-reporting and questionnaires. Both of these are considered as unreliable methods to actually assess the ongoing SB activity (Lobbezoo et al., 2018). 2.4 PATHOPHYSIOLOGY The occurrence of the SB episodes has been described comprehensively in the literature when these have been recorded and analyzed under sleep laboratory conditions. As stated earlier, 50 – 80% of SB episodes occur in association with a certain physiological sequence consisting of dominance of autonomic cardiac sympathetic activity and a subsequent micro-arousal (Kato et al., 2001; Huynh et al., 2006; Lavigne et al., 2007; Maluly et al., 2013; Nukazawa et al., 2017; Tsujisaka et al., 2018). This sequence results in clenching or grinding the teeth and it is quantified as masticatory muscle activity (MMA) by scoring masseter or temporalis muscle activity in the EMG signal (Carra et al., 2012). MMA is the characteristic chewing-like pattern of SB observed on the EMG of the jaw-closing masseter or temporalis muscles (Carra
31227203_UEF_Vaitoskirja_NO_351_Tomi_Miettinen_LUMET_sisus_19_10_02.indd 32 02/10/2019 7.48
11
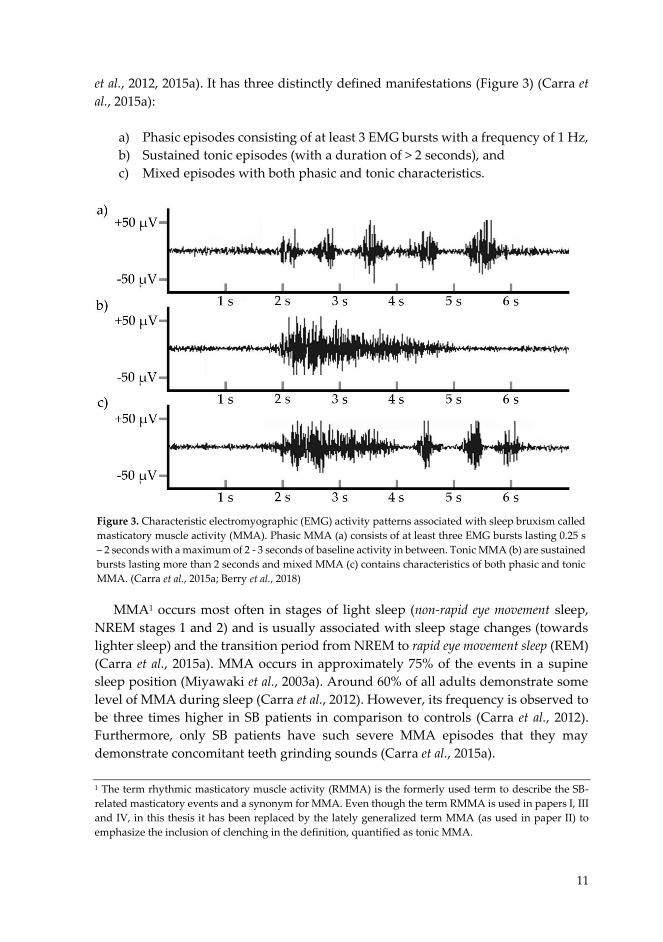
et al., 2012, 2015a). It has three distinctly defined manifestations (Figure 3) (Carra et al., 2015a):
a) Phasic episodes consisting of at least 3 EMG bursts with a frequency of 1 Hz, b) Sustained tonic episodes (with a duration of > 2 seconds), and c) Mixed episodes with both phasic and tonic characteristics.
MMA1 occurs most often in stages of light sleep (non-rapid eye movement sleep, NREM stages 1 and 2) and is usually associated with sleep stage changes (towards lighter sleep) and the transition period from NREM to rapid eye movement sleep (REM) (Carra et al., 2015a). MMA occurs in approximately 75% of the events in a supine sleep position (Miyawaki et al., 2003a). Around 60% of all adults demonstrate some level of MMA during sleep (Carra et al., 2012). However, its frequency is observed to be three times higher in SB patients in comparison to controls (Carra et al., 2012). Furthermore, only SB patients have such severe MMA episodes that they may demonstrate concomitant teeth grinding sounds (Carra et al., 2015a). 1 The term rhythmic masticatory muscle activity (RMMA) is the formerly used term to describe the SB-related masticatory events and a synonym for MMA. Even though the term RMMA is used in papers I, III and IV, in this thesis it has been replaced by the lately generalized term MMA (as used in paper II) to emphasize the inclusion of clenching in the definition, quantified as tonic MMA.
Figure 3. Characteristic electromyographic (EMG) activity patterns associated with sleep bruxism called masticatory muscle activity (MMA). Phasic MMA (a) consists of at least three EMG bursts lasting 0.25 s – 2 seconds with a maximum of 2 - 3 seconds of baseline activity in between. Tonic MMA (b) are sustained bursts lasting more than 2 seconds and mixed MMA (c) contains characteristics of both phasic and tonic MMA. (Carra et al., 2015a; Berry et al., 2018)
31227203_UEF_Vaitoskirja_NO_351_Tomi_Miettinen_LUMET_sisus_19_10_02.indd 33 02/10/2019 7.48
12
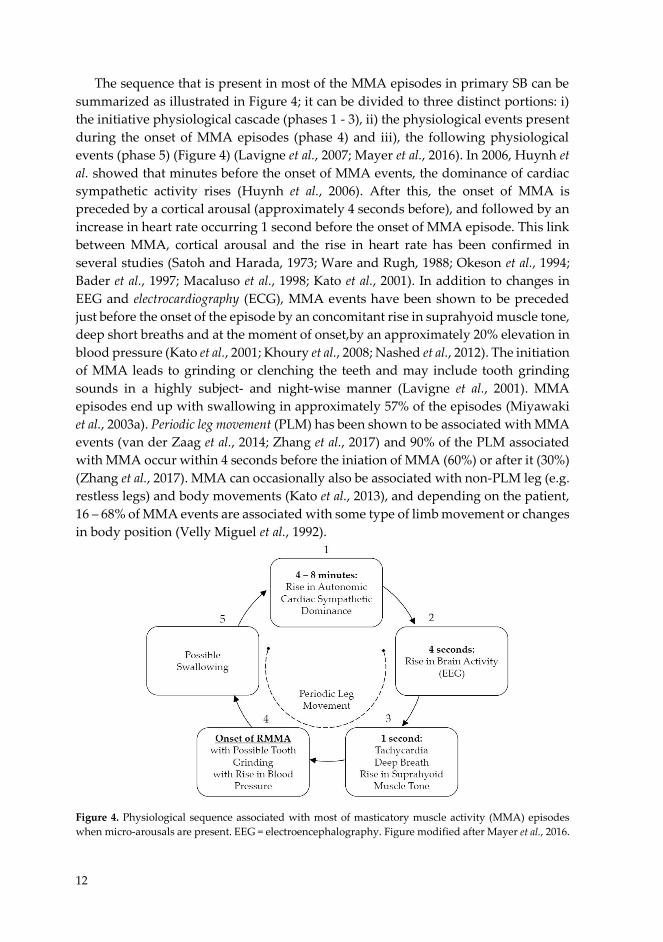
The sequence that is present in most of the MMA episodes in primary SB can be summarized as illustrated in Figure 4; it can be divided to three distinct portions: i) the initiative physiological cascade (phases 1 - 3), ii) the physiological events present during the onset of MMA episodes (phase 4) and iii), the following physiological events (phase 5) (Figure 4) (Lavigne et al., 2007; Mayer et al., 2016). In 2006, Huynh et al. showed that minutes before the onset of MMA events, the dominance of cardiac sympathetic activity rises (Huynh et al., 2006). After this, the onset of MMA is preceded by a cortical arousal (approximately 4 seconds before), and followed by an increase in heart rate occurring 1 second before the onset of MMA episode. This link between MMA, cortical arousal and the rise in heart rate has been confirmed in several studies (Satoh and Harada, 1973; Ware and Rugh, 1988; Okeson et al., 1994; Bader et al., 1997; Macaluso et al., 1998; Kato et al., 2001). In addition to changes in EEG and electrocardiography (ECG), MMA events have been shown to be preceded just before the onset of the episode by an concomitant rise in suprahyoid muscle tone, deep short breaths and at the moment of onset,by an approximately 20% elevation in blood pressure (Kato et al., 2001; Khoury et al., 2008; Nashed et al., 2012). The initiation of MMA leads to grinding or clenching the teeth and may include tooth grinding sounds in a highly subject- and night-wise manner (Lavigne et al., 2001). MMA episodes end up with swallowing in approximately 57% of the episodes (Miyawaki et al., 2003a). Periodic leg movement (PLM) has been shown to be associated with MMA events (van der Zaag et al., 2014; Zhang et al., 2017) and 90% of the PLM associated with MMA occur within 4 seconds before the iniation of MMA (60%) or after it (30%) (Zhang et al., 2017). MMA can occasionally also be associated with non-PLM leg (e.g. restless legs) and body movements (Kato et al., 2013), and depending on the patient, 16 – 68% of MMA events are associated with some type of limb movement or changes in body position (Velly Miguel et al., 1992).
Figure 4. Physiological sequence associated with most of masticatory muscle activity (MMA) episodes when micro-arousals are present. EEG = electroencephalography. Figure modified after Mayer et al., 2016.
31227203_UEF_Vaitoskirja_NO_351_Tomi_Miettinen_LUMET_sisus_19_10_02.indd 34 02/10/2019 7.48

13
However, not all of the MMA episodes are associated with arousals and contribute to the onset of the episodes. There may be also other factors that influence the onset of MMA. Protective mechanisms against transient hypoxemias have been postulated as one alternative physiological mechanism for the onset of MMA. In this case, it has been suggested that the whole-body response initiated by hypoxemia could trigger the MMA episode as a protective mechanism in the same way as it triggers the increase in blood pressure and respiratory activation (Dumais et al., 2015). Respiratory effort-related arousals may also provide a putative window for MMA onset and then the rest of the physiological sequence presumably could be similar as occurring in the majority of the cases (Mayer et al., 2016).
As was stated earlier, the described physiological sequences lead to MMA episodes that are either phasic, tonic or mixed episodes. Phasic MMA episodes generally correspond to teeth grinding, which involves the forceful closure and lateral movement of the mandibular arch, resulting in a dynamic abrasion of the opposing dentition that causes extreme horizontal forces on the masticatory system (Yap and Chua, 2016). Accordingly, tonic MMA corresponds to a forceful static closure of the opposing dentition, also possibly involving strong horizontal forces (Yap and Chua, 2016). The forces experienced in phasic and tonic MMA lead to a significant loading of the teeth, periodontium, temporomandibular joints and masticatory muscles (Yap and Chua, 2016). Teeth grinding during sleep has been shown to result in highly subject-wise maximal bite forces, ranging from 17% to over 110% of that during maximal voluntary clenching (MVC), with absolute values of approximately 150 N to 800 N (Nishigawa et al., 2001; Kato et al., 2013).
The recurrent strong vertical and horizontal forces caused either by clenching or grinding are the main contributors to the detrimental health consequences of SB. When repeated several times during the night, these forces may contribute to the excessive tooth wear found in many of the individuals exhibiting SB (Abe et al., 2009). When the teeth are ground against each other, a very distinct teeth grinding sound may be produced; at times, the sound volume may momentarily exceed 87 dB (Mizumori et al., 2009). When the masticatory system is under stress due to the extreme grinding forces, patients may experience sensations of passing local pain and/or fatigue in the masticatory muscles (Raphael et al., 2012) and tension-type headaches or migraines, especially when SB is complemented with temporomandibular disorders (TMD) (Fernandes et al., 2013).
The described mechanisms starting from arousals, leading to MMA, and ending with tooth wear and pain sensations have formed the basis for a number of clinical findings in SB patients that will be described with more detail in the next subchapter. It should be noted here, that it is possible that SB can exist as a secondary condition for some other primary medical condition (Mayer et al., 2016). In those cases, the cascade of MMA and related events described in this chapter may differ. SB may also have several secondary conditions itself (De Oliveira Trindade and Rodriguez, 2014). Some of conditions or co-morbidities that commonly co-exist with SB may be a result
31227203_UEF_Vaitoskirja_NO_351_Tomi_Miettinen_LUMET_sisus_19_10_02.indd 35 02/10/2019 7.48

14
of shared physiological mechanisms that either lead to MMA, occur during MMA or its initiation sequence, or they may share common etiological features that lead to totally different outcomes (Koyano et al., 2008; Jonsgar et al., 2015; Mayer et al., 2016). The effects of MMA may be amplified or dampened by other unrelated physiological mechanisms (Abe et al., 2009; Mayer et al., 2016; Carra, 2018). 2.5 CLINICAL FINDINGS AND CO-MORBIDITIES The presence of SB may lead to a number of clinical findings and symptoms, of which the most severe revolve around the damage, pain or functional changes in the orofacial area (Lavigne et al., 2011). These findings are not universal and only a few of them are strongly associated with SB itself (Lavigne et al., 2011; Mayer et al., 2016). There are some possible reasons for this phenomenon i.e. the clinical findings may be amplified by existing co-morbidities, or the findings may even be caused by some totally unlinked medical conditions other than SB when the condition shares the characteristics of typical SB findings (Jonsgar et al., 2015). For that reason, caution is recommended whenever the clinical symptoms are being interpreted i.e. whether or not they are actually caused by SB. SB has a wide spectrum of co-morbidities and the clinical findings associated with these conditions do not necessarily indicate the presence of SB but are clearly present in some subgroups of SB patients (Mayer et al., 2016). 2.5.1 Clinical Findings and Symptoms The list of most the common clinical findings is presented in Table 1, arranged by the strength of evidence for an association with SB. Tooth grinding sounds are the clinical finding that have the strongest association with SB and it is considered to be a characteristic of SB patients (Kato et al., 2003; Mayer, et al., 2016; Yoshida et al., 2017). The patients themselves are usually unaware of the tooth grinding and are not disturbed by it, but for the bed partner, grinding sounds may cause major sleep disruption (Kato and Lavigne, 2010). Therefore, this finding is most reliable when it is reported by the bed partner, or in the case of children or adolescents, by their parents (Yoshizawa et al., 2014; Mayer et al., 2016). However, teeth grinding is not always audible and it does not necessarily occur every night (Lavigne et al., 1996; Rompré et al., 2007). For that reason, audible teeth grinding is not always found on polysomnography (PSG), even though the patient may report it (Lavigne et al., 1996; Yoshida et al., 2017). Furthermore, it should be noted that teeth grinding sounds do not give any straightforward indication about the number of MMA events per night as teeth grinding sounds do not correlate well with the number of MMA episodes (Lavigne et al., 2001; Yoshida et al., 2017). Patients may also be unaware of any tooth grinding if they sleep alone or if their sleep partner is not affected by the grinding sounds (Rompré et al., 2007). Tooth grinding sounds usually correspond
31227203_UEF_Vaitoskirja_NO_351_Tomi_Miettinen_LUMET_sisus_19_10_02.indd 36 02/10/2019 7.48
15
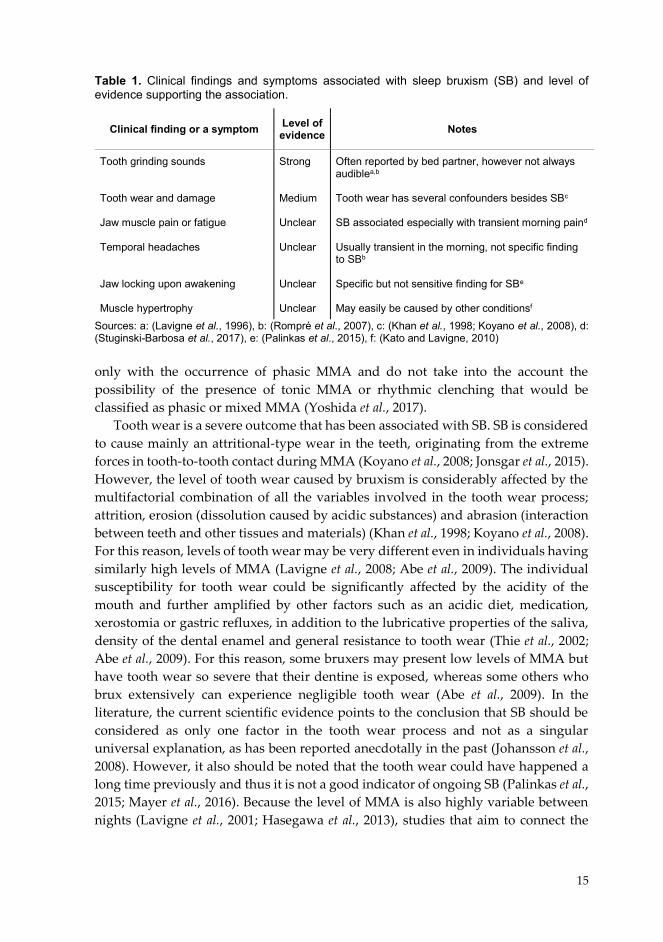
Table 1. Clinical findings and symptoms associated with sleep bruxism (SB) and level of evidence supporting the association.
Sources: a: (Lavigne et al., 1996), b: (Rompré et al., 2007), c: (Khan et al., 1998; Koyano et al., 2008), d: (Stuginski-Barbosa et al., 2017), e: (Palinkas et al., 2015), f: (Kato and Lavigne, 2010) only with the occurrence of phasic MMA and do not take into the account the possibility of the presence of tonic MMA or rhythmic clenching that would be classified as phasic or mixed MMA (Yoshida et al., 2017).
Tooth wear is a severe outcome that has been associated with SB. SB is considered to cause mainly an attritional-type wear in the teeth, originating from the extreme forces in tooth-to-tooth contact during MMA (Koyano et al., 2008; Jonsgar et al., 2015). However, the level of tooth wear caused by bruxism is considerably affected by the multifactorial combination of all the variables involved in the tooth wear process; attrition, erosion (dissolution caused by acidic substances) and abrasion (interaction between teeth and other tissues and materials) (Khan et al., 1998; Koyano et al., 2008). For this reason, levels of tooth wear may be very different even in individuals having similarly high levels of MMA (Lavigne et al., 2008; Abe et al., 2009). The individual susceptibility for tooth wear could be significantly affected by the acidity of the mouth and further amplified by other factors such as an acidic diet, medication, xerostomia or gastric refluxes, in addition to the lubricative properties of the saliva, density of the dental enamel and general resistance to tooth wear (Thie et al., 2002; Abe et al., 2009). For this reason, some bruxers may present low levels of MMA but have tooth wear so severe that their dentine is exposed, whereas some others who brux extensively can experience negligible tooth wear (Abe et al., 2009). In the literature, the current scientific evidence points to the conclusion that SB should be considered as only one factor in the tooth wear process and not as a singular universal explanation, as has been reported anecdotally in the past (Johansson et al., 2008). However, it also should be noted that the tooth wear could have happened a long time previously and thus it is not a good indicator of ongoing SB (Palinkas et al., 2015; Mayer et al., 2016). Because the level of MMA is also highly variable between nights (Lavigne et al., 2001; Hasegawa et al., 2013), studies that aim to connect the
Clinical finding or a symptom Level of evidence Notes
Tooth grinding sounds Tooth wear and damage Jaw muscle pain or fatigue Temporal headaches Jaw locking upon awakening Muscle hypertrophy
Strong Medium Unclear Unclear Unclear Unclear
Often reported by bed partner, however not always audiblea,b
Tooth wear has several confounders besides SBc SB associated especially with transient morning paind Usually transient in the morning, not specific finding to SBb Specific but not sensitive finding for SBe May easily be caused by other conditionsf
31227203_UEF_Vaitoskirja_NO_351_Tomi_Miettinen_LUMET_sisus_19_10_02.indd 37 02/10/2019 7.48
16
level of tooth wear to the level of current MMA should be interpreted with caution. This caution is particularly important in the case of infrequent bruxers, since there are no longitudinal parallel follow-up trials investigating the level of MMA and tooth wear, and also due to the fact that usually only single night PSG has been used to establish the level of MMA (Lavigne et al., 2001; Mayer et al., 2016). In extreme cases of ongoing SB, even more severe damage for the teeth, fillings or other structures could occur, such as fracturing and/or failure of dental implants (Lynch and McConnell, 2002; Johansson et al., 2008, 2011). In addition to the health-related consequences, this poses a heavy economical burden for society as well as the individual patient.
Transient jaw muscle pain or fatigue, especially in the morning is one possible indicator of ongoing SB (Rompré et al., 2007; Stuginski-Barbosa et al., 2017). A direct connection between long-term pain and SB has proved difficult to establish, unlike the connection between transient pain and experimental voluntary tooth clenching or grinding (Castrillon and Exposto, 2018). However, it is possible that long-duration orofacial pain may be a result of several risk factors in addition to SB (Takeuchi et al., 2015; Castrillon and Exposto, 2018). Jaw locking upon awakening is present in a minority of the all SB patients, but it is very a specific finding (Palinkas et al., 2015).
Temporal headaches, especially the transient type in the morning are frequently reported by patients with SB (Rompré et al., 2007). However, it should not be considered only as a direct consequence of SB, since it may also be linked to a variety of other conditions and diseases (this also applies to the transient jaw muscle pain) (Lavigne and Palla, 2010; Castrillon and Exposto, 2018).
SB is often named as a possible cause for masseter muscle hypertrophy and patients with masseter muscle hypertrophy have been shown to have a higher MMA index when compared to patients without hypertrophy (Castroflorio et al., 2015). However, no statistical difference has been shown with ultrasonography in masseter or temporalis muscle thicknesses between SB and control patients, and hypertrophy may be caused by other factors, e.g. swelling of parotid glands (Kato and Lavigne, 2010; Palinkas et al., 2016a).
2.5.2 Co-morbidities SB has several co-morbidities with varying cause-and-effect relationships between them. Some of the most common co-morbidities are presented in Table 2.
Temporomandibular disorders (TMD) are an umbrella term for pain and dysfunction of the masticatory muscles and temporomandibular joints; their most common symptoms include pain sensations in the facial and preauricular area, limitations in jaw movement and noises of temporomandibular joint during movement (List and Jensen, 2017). Some of the TMDs are associated with or are at least partially caused by SB, especially transient jaw muscle pain or fatigue and jawlocking have been connected with SB as was stated in the previous subchapter.
31227203_UEF_Vaitoskirja_NO_351_Tomi_Miettinen_LUMET_sisus_19_10_02.indd 38 02/10/2019 7.48
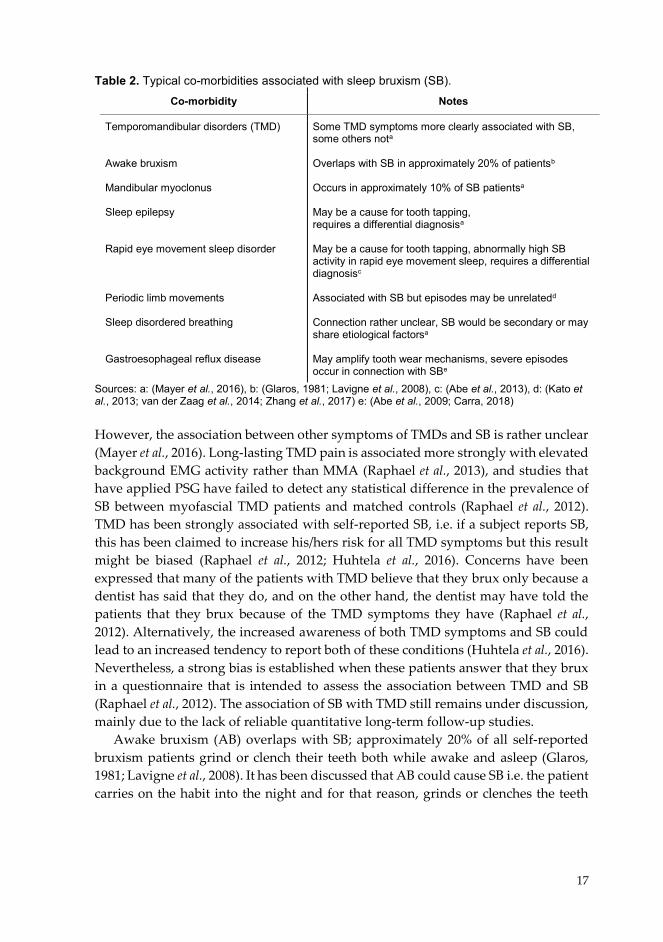
17
Table 2. Typical co-morbidities associated with sleep bruxism (SB). Co-morbidity Notes
Temporomandibular disorders (TMD) Awake bruxism Mandibular myoclonus Sleep epilepsy Rapid eye movement sleep disorder Periodic limb movements Sleep disordered breathing Gastroesophageal reflux disease
Some TMD symptoms more clearly associated with SB, some others nota
Overlaps with SB in approximately 20% of patientsb
Occurs in approximately 10% of SB patientsa May be a cause for tooth tapping, requires a differential diagnosisa May be a cause for tooth tapping, abnormally high SB activity in rapid eye movement sleep, requires a differential diagnosisc Associated with SB but episodes may be unrelatedd Connection rather unclear, SB would be secondary or may share etiological factorsa May amplify tooth wear mechanisms, severe episodes occur in connection with SBe
Sources: a: (Mayer et al., 2016), b: (Glaros, 1981; Lavigne et al., 2008), c: (Abe et al., 2013), d: (Kato et al., 2013; van der Zaag et al., 2014; Zhang et al., 2017) e: (Abe et al., 2009; Carra, 2018) However, the association between other symptoms of TMDs and SB is rather unclear (Mayer et al., 2016). Long-lasting TMD pain is associated more strongly with elevated background EMG activity rather than MMA (Raphael et al., 2013), and studies that have applied PSG have failed to detect any statistical difference in the prevalence of SB between myofascial TMD patients and matched controls (Raphael et al., 2012). TMD has been strongly associated with self-reported SB, i.e. if a subject reports SB, this has been claimed to increase his/hers risk for all TMD symptoms but this result might be biased (Raphael et al., 2012; Huhtela et al., 2016). Concerns have been expressed that many of the patients with TMD believe that they brux only because a dentist has said that they do, and on the other hand, the dentist may have told the patients that they brux because of the TMD symptoms they have (Raphael et al., 2012). Alternatively, the increased awareness of both TMD symptoms and SB could lead to an increased tendency to report both of these conditions (Huhtela et al., 2016). Nevertheless, a strong bias is established when these patients answer that they brux in a questionnaire that is intended to assess the association between TMD and SB (Raphael et al., 2012). The association of SB with TMD still remains under discussion, mainly due to the lack of reliable quantitative long-term follow-up studies.
Awake bruxism (AB) overlaps with SB; approximately 20% of all self-reported bruxism patients grind or clench their teeth both while awake and asleep (Glaros, 1981; Lavigne et al., 2008). It has been discussed that AB could cause SB i.e. the patient carries on the habit into the night and for that reason, grinds or clenches the teeth
31227203_UEF_Vaitoskirja_NO_351_Tomi_Miettinen_LUMET_sisus_19_10_02.indd 39 02/10/2019 7.48
18
while asleep (Carra et al., 2012; Mayer et al., 2016), but this speculation has not been proven.
Faciomandibular or oromandibular myoclonus occurs in approximately 10% of SB patients (Mayer et al., 2016). It can be recognized from MMA mainly by its shorter burst time: for mandibular myoclonus, it is usually less than 0.25 seconds whereas it is longer for MMA (Mayer et al., 2016). If tooth tapping in short bursts is predominant in a PSG recording, the differential diagnosis of sleep-related epilepsy is recommended (Mayer et al., 2016).
SB, along with mandibular myoclonus, could be present as a secondary condition in patients with rapid eye movement sleep behaviour disorder (RBD) (Abe et al., 2013). It is a parasomnia characterized by abnormal motor activity during rapid eye movement (REM) sleep, which could include bruxism or tooth tapping, and has been shown to be further associated with neurodegenerative disorders such as Parkinson’s disease (Abe et al., 2013). When SB is associated with RBD, an especially high proportion of MMA and mandibular myoclonus occur in REM sleep, which could indicate the need for a more detailed neurologic assessment (Abe et al., 2013).
As was already stated in chapter 2.4, PLM has been shown to occur concomitantly with MMA events (van der Zaag et al., 2014; Zhang et al., 2017). However, it is possible that the occurrence of PLM or restless leg syndrome may overlap with SB without any common cause or pathophysiology (Kato et al., 2013).
The unclear connection of transient hypoxemias of SDB and SB was also discussed in chapter 2.3.4. If the connection between SB and SDB was valid, SB would be either considered as a secondary condition to SDB (SB being a reaction to SDB-induced arousals) or to share at least the etiological factors with SDB (SB being a reaction to the reduced airflow). Once again, the epidemiological connection is rather unclear, since most of the studies associating SB with SDB have been based on questionnaires (Mayer et al., 2016).
SB has been found to to be associated with more severe gastroesophageal reflux disorder (GERD) symptoms in comparison to control patients (Miyawaki et al., 2003b). It was suggested that for some of the patients, SB might be secondary to GERD and the MMA events would be caused by a micro-arousal that only the most severe GERD episodes would induce (Miyawaki et al., 2003b). The connection between SB and GERD has later been confirmed (Carra, 2018). It is noteworthy that if a patient suffers from both GERD and SB, tooth wear process might be severely amplified by the combination of mechanical strain and the highly acidic oral environment and it should be treated accordingly (Abe et al., 2009; Carra, 2018).
There are also other SB co-morbidities beyond those mentioned i.e. only those conditions for which there is the most convincing evidence of association are listed here. Other suggested co-morbidities for SB include, but are not limited to, parasomnias, e.g. from sleep walking or talking to epilepsy, allergies or even nail biting (Carra et al., 2012). Some of the co-morbidities can be very severe, such as the neurodegenerative disorders connected to RDB, SDB or sleep-related epilepsy. The
31227203_UEF_Vaitoskirja_NO_351_Tomi_Miettinen_LUMET_sisus_19_10_02.indd 40 02/10/2019 7.48
19
presence of co-morbidities may require a further assessment or differentiation from SB so that the condition behind SB can be identified and methods for management selected accordingly. 2.6 MANAGEMENT………………… Unfortunately, no universal treatment for SB exists that could permanently prevent the occurrence of excessive MMA (Klasser et al., 2015; Yap and Chua, 2016). For this reason, in most cases it is merely the consequences of SB that can be managed. The goals of the management methods are either to rehabilitate the occlusion with tooth restorations or prosthetic constructions, prevent damage, reduce bruxism activity and grinding sounds, or relieve pain (Mayer et al., 2016; Yap and Chua, 2016). The three main categories utilized in management approaches are: i) dental (occlusal) and oral, ii) pharmacological and iii) behavioral approaches (Lobbezoo et al., 2008). The selection of the management method should be based on the individual’s symptoms and especially on the knowledge of whether the SB is primary or secondary. When SB is secondary, treating or managing the primary condition might often be the best option to also reduce MMA or even to treat SB (Carra, 2018). Table 3 presents the methods for SB management that according to a survey of the literature have the highest level of evidence for their efficacy in managing SB. 2.6.1 Dental and Oral Approaches Occlusal appliances are mainly used in SB management for protecting the teeth and restorations from damage (Lobbezoo et al., 2008). Occlusal appliances are often made from hard acrylic or soft vinyl that covers the entire maxillar or mandibular dental arch, fitting between them in occlusion and thus shielding the teeth from attrition and extreme loading (Guaita and Högl, 2016; Yap and Chua, 2016). Occlusal appliances prevent audible grinding sounds, at least to some extent (Lobbezoo et al., 2008). Even though occlusal appliances have also been shown to reduce the MMA occurrence during sleep, the effect is not permanent and also highly variable among patients (Harada et al., 2006; Klasser et al., 2015). However, the variations might be attributable to the high night-to-night variablity in SB and the fact that often applied one-night recordings provide only a random sample of the constantly fluctuating SB activity (Dal Fabbro and Tufik, 1996; Lavigne et al., 2001; Hasegawa et al., 2013).
SB management with an occlusal splint is not recommended for a patient with concomitant SDB, since the splint may obstruct the airways even further and cause serious adverse effects (Mayer et al., 2016). A mandibular advancement device (MAD) has been shown to be a good alternative to occlusal appliances especially when both SB and SDB need to managed simultaneously (Mayer et al., 2016; Carra, 2018). However, there are some adverse effects related to the use of a MAD as it causes significant discomfort i.e. pain in the teeth, gums, masticatory muscles and
31227203_UEF_Vaitoskirja_NO_351_Tomi_Miettinen_LUMET_sisus_19_10_02.indd 41 02/10/2019 7.48

20
Table 3. Methods for SB management with the highest level of evidence for their efficacy in managing SB categorized by the approach class and arranged by the level of evidence.
Sources: a: (Lobbezoo et al., 2008), b: (Mayer, Heinzer and Lavigne, 2016), c: (Tsukiyama et al., 2001; Yap and Chua, 2016), d: (DiFrancesco et al., 2004), e: (Saletu et al., 2010), f: (Carra et al., 2010), g: (Shim et al., 2014; Manfredini, Ahlberg, et al., 2015), h: (Lobbezoo et al., 1997; Carra, 2018), i: (Sumiya et al., 2014; Nakamura et al., 2019), j: (Ommerborn et al., 2007)
temporomandibular joints (Yap and Chua, 2016). Therefore, MADs can only be recommended for SB patients with concomitant SDB (Mayer et al., 2016). The long-term effects of MADs have not been yet demonstrated.
Occlusal therapy, i.e. occlusal adjustment and/or rehabilitation is irreversible and there is no scientific evidence that it would either protect teeth or prevent damage to the teeth in the case of SB (Tsukiyama et al., 2001). However, occlusal therapy might be needed as one approach in management of SB patient when the damage to the teeth is extensive and the dentition requires reconstruction (Yap and Chua, 2016). In children, adenotonsillectomy has been shown to be potentially effective in reducing the number of MMA events (DiFrancesco et al., 2004; Mayer et al., 2016). 2.6.2 Pharmacological Approaches The pharmacological means to manage SB mainly include the use of drugs that either reduce the number of MMA events or reduce their intensity. Various different drugs
Management methods Level of evidence Notes
Dental (occlusal) Occlusal appliances Mandibular advancement device Occlusal therapy Adenotonsillectomy
Pharmacological
Clonazepam Clonidine Botulinum toxin L-dopa
Behavioral Electrical or vibrational biofeedback Cognitive behavioral therapy (CBT) Avoidance of risk factors Patient education Relaxation techniques, physiotherapy Sleep hygiene Hypnotherapy Self-monitoring
Strong Strong Weak Weak Medium Medium Medium Medium Medium Weak Weak Weak Weak Weak Weak Weak
Strong evidence in protecting teeth and restorations, not so much for reducing MMAa
Recommended only for patients with concomi-tant SDBb No proven effect to reduce MMA, however nec-essary if the dental occlusion requires rehabili-tationc Reduces MMA events in childrenb,d Reduces MMA events, improves sleep qualitye Reduces MMA events, risk for hypotensiona,f
Reduces the strength of muscle contractions in MMAg
Reduces MMA eventsb,h Reduces MMA eventsi
Reduces SB activity as effectively as occlusal appliances (not very effective)j Evidence is lackingb Evidence is lackingb Evidence is lackingb Evidence is lackingb Evidence is lackingb Evidence is lackingb
31227203_UEF_Vaitoskirja_NO_351_Tomi_Miettinen_LUMET_sisus_19_10_02.indd 42 02/10/2019 7.48
21
have been tested for the treatment of SB, but for the majority, the evidence for their efficacy is dubious (Lobbezoo et al., 2008; Manfredini et al., 2015a). The strongest evidence for the efficacy in SB management has been found with various drugs affecting neurotransmitters in the nervous system. Clonazepam, clonidine, botulinum toxin and L-dopa have all been shown in controlled clinical trials either to decrease the frequency of MMA events, or to reduce their intensity (Lobbezoo et al., 2008; Manfredini et al., 2015a). However, the long-term effects of many of these drugs in managing SB are unknown, since e.g. the trial with clonazepam lasted only three nights (Saletu et al., 2010), the results on clonidine are based on a study lasting only one night (Carra et al., 2010; Manfredini et al., 2015a), and with respect to the use of botulinum toxin for MMA, the maximum follow-up time in any study has only been 12 weeks (Manfredini et al., 2015a).
In addition to drugs that reduce the number of MMA events or reduce their intensity, there are several substances and drugs that may instead increase the number of MMA events during sleep. For example, nicotine, caffeine, alcohol, selective serotonin reuptake inhibitors, amphetamines, cocaine and MDMA (ecstasy) may induce MMA in some patients (Carra, 2018). If any kind of pharmacological treatment is planned for patient with SB, their effect for the severity of SB should be taken into account (Guaita and Högl, 2016). Furthermore, if SB is secondary to some other condition, medicating the primary condition may also relieve the SB symptoms, e.g. proton pump inhibitors in GERD patients will reduce the production of stomach acids (Mayer et al., 2016).
In the light of current knowledge, medications for SB are proposed to be used only in the short-term during a transition period before the initiation of long-term management of SB (Klasser et al., 2015; Mayer et al., 2016; Carra, 2018). It should be noted that none of these aforementioned medications have yet been approved i.e. their use in SB management is off-label (Mayer et al., 2016). This is due to the fact that there are very few high-quality controlled clinical trials, even fewer of which were randomized and double-blind (Lobbezoo et al., 2008; Manfredini et al., 2015a). 2.6.3 Behavioral Approaches The efficacy of the behavioral approaches on SB management has the weakest evidence of the three management approaches (Yap and Chua, 2016). There is some evidence that electrical or vibrational biofeedback devices may be able to reduce either the number of MMA or their duration during the night without disturbing the sleep (Sumiya et al., 2014; Manfredini et al., 2015a; Nakamura et al., 2019). However, the results for the biofeedback efficacy have been presented only with respect to short-term use with nothing being known about their long-term effects (Lobbezoo et al., 2008; Mayer et al., 2016).
Cognitive behavioral therapy (CBT) has also been proposed to reduce sleep-time SB activity (Ommerborn et al., 2007). However, the results have not been very promising,
31227203_UEF_Vaitoskirja_NO_351_Tomi_Miettinen_LUMET_sisus_19_10_02.indd 43 02/10/2019 7.48
22
at the best comparable only to the reduction obtained with the use of an occlusal appliance (Ommerborn et al., 2007; Valiente López et al., 2015). The other suggested behavioral management approaches include: avoidance of risk factors and triggers for SB (such as certain drugs), patient education, relaxation techniques, sleep hygiene and hypnotherapy (Klasser et al., 2015). The efficacy of none of these methods is supported by any controlled trials (Klasser et al., 2015). However, their use has been suggested in multimodal approaches to manage SB, since they have negligible adverse effects and are non-invasive (Manfredini et al., 2015a; Carra, 2018). 2.6.4 Lack of Evidence As revealed in this review of the various SB management approaches, there is a lack of evidence, especially for the long-term efficacy of the different approaches. Furthermore, not only have the research designs applied in these studies been haphazard but also there has been a lack of objective methods capable of assessing the MMA events during the trials. Manfredini et al. showed that only 12 randomized clinical trials for SB management were published between 2008 and 2015 that used either PSG or EMG as the basis for MMA assessment (Manfredini et al., 2015a). Out of these 12 studies, only 7 used the PSG as their assessment method. Furthermore, 3 of the 12 studies were one-night studies, which only provide a snapshot of the ever fluctuating SB activity. In an earlier review by Lobbezoo et al. of the SB management studies conducted between 1966 and 2007, only a striking 13% proportion of studies were found to be randomized clinical trials, and according to the authors, even most of those did not provide good evidence-based recommendations to treat (or manage) bruxism (Lobbezoo et al., 2008).
It could be hypothesized that the lack of high-quality research and the failure to apply the gold standard PSG are linked. In that case, one of the major reasons for the lack of high-quality research for SB management, as well as for the unknown etiology of SB, would be the lack of instrumental methods for assessing SB. Especially long-term trials for efficacy of the management approaches require an instrumental assessment method that could be utilized for several nights, even longer. In these situations, sleep laboratory PSG is inappropriate, as even one night is very cumbersome to perform. The lack of a reliable instrumental assessment does not impact only on the paucity of solid research on management methods but it also prevents patients from receiving good evidence-based treatment or management. In the absence of reliable methods to test the long-term efficacy or safety of SB management approaches, concerns have been raised that opportunistic individuals or companies could start providing management approaches (or even spurious diagnostic tools, to that matter) not based on any scientific evidence but simply exploiting the suffering of the SB patients (Lobbezoo et al., 2008).
23
3 BIOSIGNAL RECORDINGS IN POLYSOMNOGRAPHY
Biosignals are energy fluctuations that carry direct or indirect information about the function of a biological system (Semmlow, 2009). These signals are encoded into various types of energy forms, such as electrical, mechanical, chemical or thermal energy (Semmlow, 2009). Recording a biosignal means that one transforms the information transmitted in the energy fluctuations into a form that can be further processed and stored for later use, usually in the form of electrical energy in electric circuits and digital data storage (Semmlow, 2009). The motivation to record biosignals in medicine is to process these biosignals in such a way that the information of the measured signal can be later displayed in an easily comprehensible form and further analyzed so that conclusions can be made about the state of the patient’s health. A typical biosignal measurement system is presented in a schematic form in Figure 5.
Figure 5. A schematic representation of a biosignal measurement system. Modified after Semmlow, 2009.
Polysomnography (PSG) means measuring several physiological parameters from biosignals during the subject’s sleep (Compton and Robertson, 2014). Many of the biosignals recorded in PSG are produced in the body in the form of electrical energy, which can be detected directly (Semmlow, 2009; Servidio et al., 2014b). As the energy is already electrical and caused by ionic currents, it only needs to be converted into an electrical current in the recorder by using electrodes as the transducer between the source signal and the recorder (Semmlow, 2009). Depending on the source of the bioelectric signal, most usually it originates in the brain, skeletal muscles, eyes or in the heart, the processes of recording the signals are correspondingly called electroencephalography (EEG,) electromyography (EMG), electrooculography (EOG) or
31227203_UEF_Vaitoskirja_NO_351_Tomi_Miettinen_LUMET_sisus_19_10_02.indd 44 02/10/2019 7.48
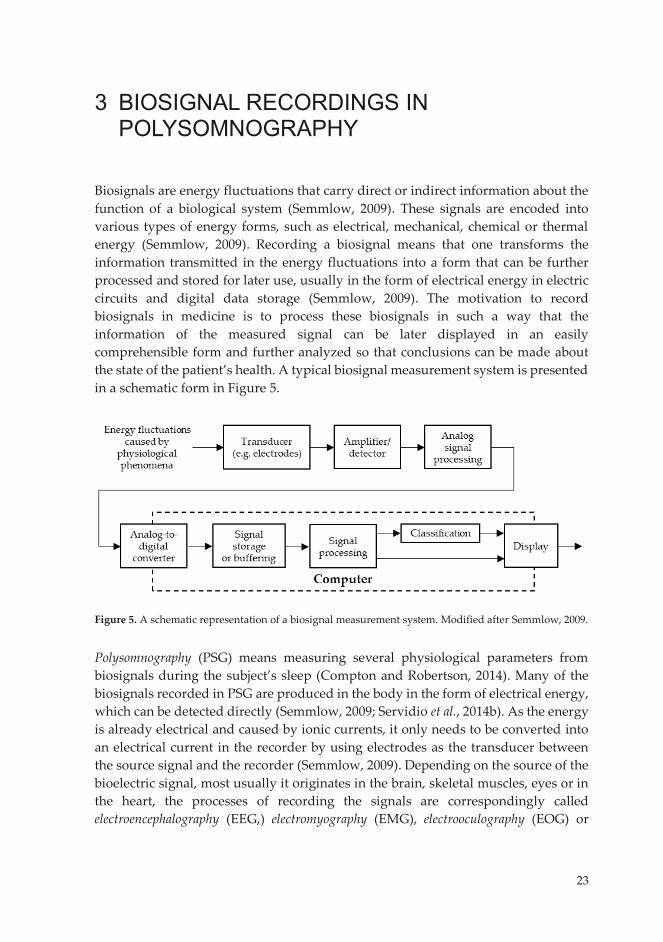
23
3 BIOSIGNAL RECORDINGS IN POLYSOMNOGRAPHY
Biosignals are energy fluctuations that carry direct or indirect information about the function of a biological system (Semmlow, 2009). These signals are encoded into various types of energy forms, such as electrical, mechanical, chemical or thermal energy (Semmlow, 2009). Recording a biosignal means that one transforms the information transmitted in the energy fluctuations into a form that can be further processed and stored for later use, usually in the form of electrical energy in electric circuits and digital data storage (Semmlow, 2009). The motivation to record biosignals in medicine is to process these biosignals in such a way that the information of the measured signal can be later displayed in an easily comprehensible form and further analyzed so that conclusions can be made about the state of the patient’s health. A typical biosignal measurement system is presented in a schematic form in Figure 5.
Figure 5. A schematic representation of a biosignal measurement system. Modified after Semmlow, 2009.
Polysomnography (PSG) means measuring several physiological parameters from biosignals during the subject’s sleep (Compton and Robertson, 2014). Many of the biosignals recorded in PSG are produced in the body in the form of electrical energy, which can be detected directly (Semmlow, 2009; Servidio et al., 2014b). As the energy is already electrical and caused by ionic currents, it only needs to be converted into an electrical current in the recorder by using electrodes as the transducer between the source signal and the recorder (Semmlow, 2009). Depending on the source of the bioelectric signal, most usually it originates in the brain, skeletal muscles, eyes or in the heart, the processes of recording the signals are correspondingly called electroencephalography (EEG,) electromyography (EMG), electrooculography (EOG) or
31227203_UEF_Vaitoskirja_NO_351_Tomi_Miettinen_LUMET_sisus_19_10_02.indd 45 02/10/2019 7.48
24
electrocardiography (ECG) (Compton and Robertson, 2014; Servidio et al., 2014b). In addition to bioelectrical signals, PSG may also involve the recording of biosignals encoded in other energy types, such as recording the mechanical energy fluctuations of respiratory movements in the form of plethysmography, the vibrational mechanical waves caused by snoring with a microphone, or thermal energy fluctuations caused by respiratory airflow with a thermocouple (Servidio et al., 2014b). However, since recording SB activity in PSG is currently based only on bioelectrical signals (and audio-video recordings), the theoretical background of the origin, measurment, processing and analyzing of signals only of a bioelectrical origin is presented in this chapter. 3.1 PHYSIOLOGICAL ORIGIN OF BIOELECTRICAL SIGNALS All cells in the human body are surrounded by a bilayered cell membrane that functions as a selectively permeable barrier between the intracellular and extracellular matrix (Madihally, 2010; Servidio et al., 2014b). Due to the fact that permeability is selectively different for the different ions in the membrane, an electric potential difference called the membrane potential is maintained between the intracellular and extracellular space (Madihally, 2010). The membrane potential is called the resting potential whenever the cell is not generating any electrical signals (Madihally, 2010; Servidio et al., 2014b). When a nerve or muscle cell receives a strong enough input in the form of a chemical transmitter, mechanical stimulus or electrical pulse, the ionic permeability of the membrane changes rapidly as a result of characteristic forms of physiological cascades and depolarization advances along the entire membrane surface (Madihally, 2010; Servidio et al., 2014b). All this occurs in a timeframe of one millisecond, after which the cell membrane returns to its resting potential as it is repolarized (Servidio et al., 2014b). This phenomenon where the polarization of the cell membrane is rapidly reversed and eventually returned to the resting potential is called the action potential (Servidio et al., 2014b). The cells may also polarize only slightly, leading to longer-duration post-synaptic potentials, before returning to resting potential.
In the neurons, i.e. nerve cells the action potential proceeds along the cell membrane in only one direction, thus enabling the communication within the different parts of the brain and rest of the body, e.g. allowing the motor cortex to control the skeletal muscles, or the sinoatrial node to synchronically contract and expand the heart (Servidio et al., 2014b).
Even though the membrane potentials within one cell during an action potential or post-synaptic potential are too small (usually -70 to +30 mV) to be detectable, the cumulative effect of all of the potentials propagating through a vast network of nerves or bundles of muscle fibers at the same time can be detected throughout the body (Madihally, 2010; Servidio et al., 2014b). A post-synaptic potential, or action potential propagating through each cell, can be conceptualized as an individual
31227203_UEF_Vaitoskirja_NO_351_Tomi_Miettinen_LUMET_sisus_19_10_02.indd 46 02/10/2019 7.48
25
dipole (with the depolarized part being negative and the polarized part being positive) (Madihally, 2010). The electric dipoles from billions of cells that are undergoing an action potential or post-synaptic potential in a synchronized manner can together induce a detectable, varying electric field (Madihally, 2010). The strength of the electric field is directly proportional to the strength of the sum of the fields induced by individual dipoles (depending on the alignment and the number of cells), the (often heterogenous) conductive properties of the surrounding medium, and inversely proportional to the distance to the dipoles (Madihally, 2010). If the changes in cell polarization occur at the same time in a large enough clusters of cells that are well aligned and in close enough proximity of the surface of the skin, the changes in the electric fields within the body can be detected as changes in electric potential through the ion currents near the surface of the skin by using electrodes and further processed with a biosignal measurement system (Madihally, 2010). 3.2 BIOSIGNAL ELECTRODES AND INSTRUMENTATION The characteristics of the electrodes that are used to record biopotentials are greatly defined by their ability to transduce the ionic currents in the body as an electronic current in the recorder. These transductive processes occur in the skin-electrode interface, and an awareness of the physical and chemical phenomena in the interface are required in order to understand the transduction process. 3.2.1 Skin-Electrode Interface Whenever an electrode is placed on the skin to record a biopotential, there is usually an additional layer of a conductive electrolyte (usually gel or paste) between the electrode and skin that maintains good contact and reduces the electrical impedance between the electrode and the skin. The transduction from an ionic current to an electronic current occurs at the interface of the electrode and electrolyte. In order for a charge to pass through this interface, oxidation or reduction reactions of the metallic cations (K) of the electrode and anions (A) of the electrolyte must occur at the interface. These chemical reactions can be represented with following equations:
𝐾𝐾 ⇄ 𝐾𝐾𝑛𝑛+ + 𝑛𝑛𝑒𝑒− (3.1)
𝐴𝐴𝑚𝑚− ⇄ 𝐴𝐴 + 𝑚𝑚𝑒𝑒−, (3.2) where n is the valence of K, m is the valence of A and e- is an electron. Both of the reactions are reversible and occur spontaneously in an equilibrium when no electric current is crossing the electrode-electrolyte interface. (Neuman, 1995)
Whenever the electric charges in an electrode-electrolyte interface are in equilibrium, different concentrations of cations and anions exist in close proximity to the electrode as compared to the rest of the electrolyte. This results in the electrolyte
31227203_UEF_Vaitoskirja_NO_351_Tomi_Miettinen_LUMET_sisus_19_10_02.indd 47 02/10/2019 7.48
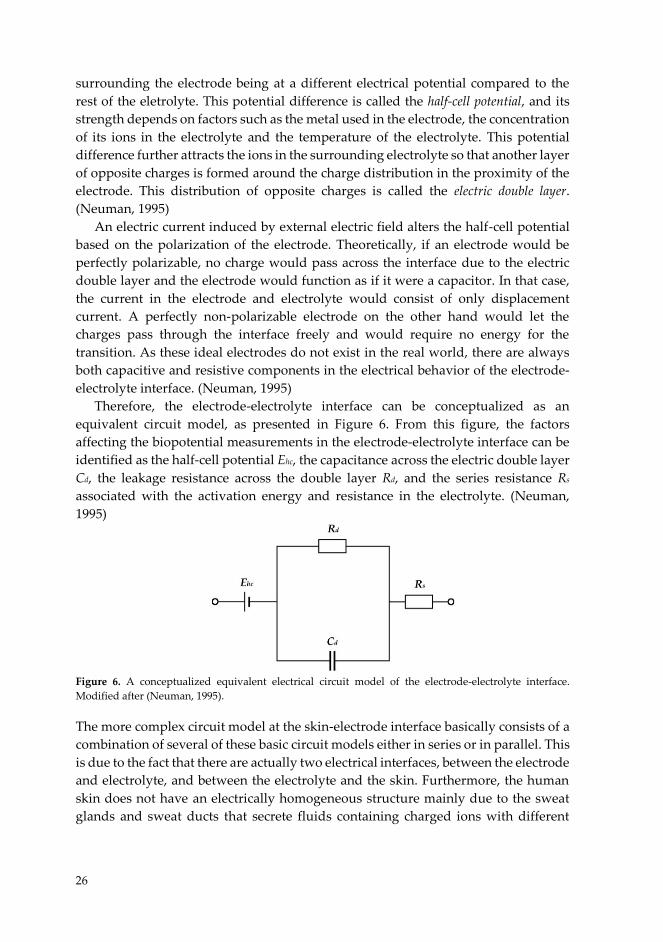
26
surrounding the electrode being at a different electrical potential compared to the rest of the eletrolyte. This potential difference is called the half-cell potential, and its strength depends on factors such as the metal used in the electrode, the concentration of its ions in the electrolyte and the temperature of the electrolyte. This potential difference further attracts the ions in the surrounding electrolyte so that another layer of opposite charges is formed around the charge distribution in the proximity of the electrode. This distribution of opposite charges is called the electric double layer. (Neuman, 1995)
An electric current induced by external electric field alters the half-cell potential based on the polarization of the electrode. Theoretically, if an electrode would be perfectly polarizable, no charge would pass across the interface due to the electric double layer and the electrode would function as if it were a capacitor. In that case, the current in the electrode and electrolyte would consist of only displacement current. A perfectly non-polarizable electrode on the other hand would let the charges pass through the interface freely and would require no energy for the transition. As these ideal electrodes do not exist in the real world, there are always both capacitive and resistive components in the electrical behavior of the electrode-electrolyte interface. (Neuman, 1995)
Therefore, the electrode-electrolyte interface can be conceptualized as an equivalent circuit model, as presented in Figure 6. From this figure, the factors affecting the biopotential measurements in the electrode-electrolyte interface can be identified as the half-cell potential Ehc, the capacitance across the electric double layer Cd, the leakage resistance across the double layer Rd, and the series resistance Rs associated with the activation energy and resistance in the electrolyte. (Neuman, 1995)
Figure 6. A conceptualized equivalent electrical circuit model of the electrode-electrolyte interface. Modified after (Neuman, 1995).
The more complex circuit model at the skin-electrode interface basically consists of a combination of several of these basic circuit models either in series or in parallel. This is due to the fact that there are actually two electrical interfaces, between the electrode and electrolyte, and between the electrolyte and the skin. Furthermore, the human skin does not have an electrically homogeneous structure mainly due to the sweat glands and sweat ducts that secrete fluids containing charged ions with different
31227203_UEF_Vaitoskirja_NO_351_Tomi_Miettinen_LUMET_sisus_19_10_02.indd 48 02/10/2019 7.48
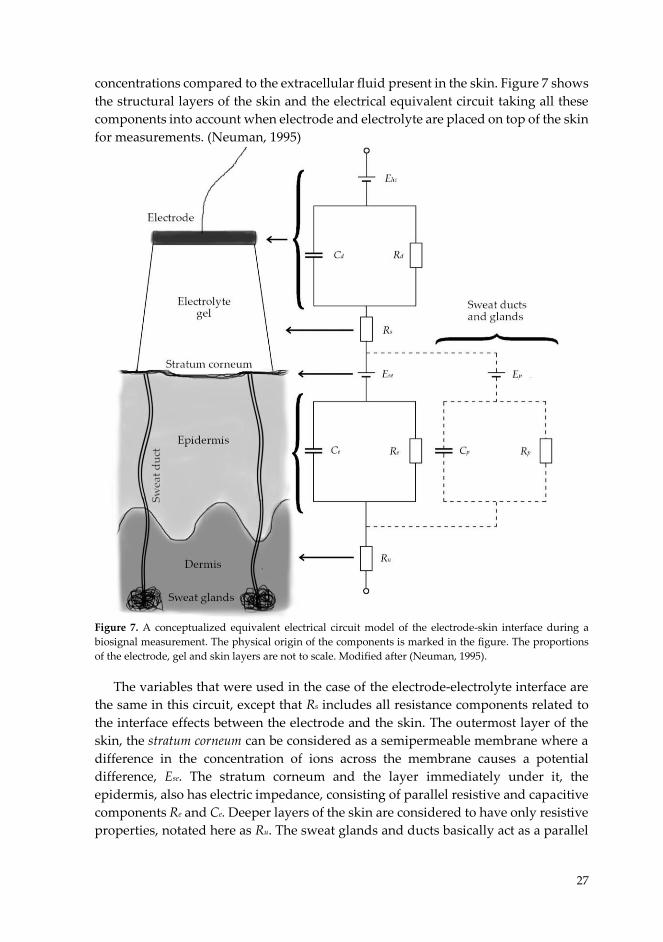
27
concentrations compared to the extracellular fluid present in the skin. Figure 7 shows the structural layers of the skin and the electrical equivalent circuit taking all these components into account when electrode and electrolyte are placed on top of the skin for measurements. (Neuman, 1995)
Figure 7. A conceptualized equivalent electrical circuit model of the electrode-skin interface during a biosignal measurement. The physical origin of the components is marked in the figure. The proportions of the electrode, gel and skin layers are not to scale. Modified after (Neuman, 1995).
The variables that were used in the case of the electrode-electrolyte interface are the same in this circuit, except that Rs includes all resistance components related to the interface effects between the electrode and the skin. The outermost layer of the skin, the stratum corneum can be considered as a semipermeable membrane where a difference in the concentration of ions across the membrane causes a potential difference, Ese. The stratum corneum and the layer immediately under it, the epidermis, also has electric impedance, consisting of parallel resistive and capacitive components Re and Ce. Deeper layers of the skin are considered to have only resistive properties, notated here as Ru. The sweat glands and ducts basically act as a parallel
31227203_UEF_Vaitoskirja_NO_351_Tomi_Miettinen_LUMET_sisus_19_10_02.indd 49 02/10/2019 7.48
28
pathway for ionic currents and have similar components Ep for the potential difference between the lumen and the dermis or subcutaneous layers, and Rp and Cp
for the resistive and capacitive components for the sweat gland and duct walls. (Neuman, 1995)
The layer consisting of stratum corneum and epidermis can have electrical impedances varying from 200 kΩ (at 1 Hz) to 200 Ω (at 1 MHz) (Rosell et al., 1988). It is possible that the impedance could rise so high that it could disturb the measurement of the actual bioelectric potentials originating inside the body. Therefore, the effect of stratus corneum and epidermis for the measurement is preferably minimized. Diminishing the effect of the stratus corneum can be achieved by removing some of it by rubbing the electrode attachment site with a pad soaked in alcohol, abrading it with sandpaper, or by using electrodes with embedded needles to puncture these skin structures (Griss et al., 2001). These processes short out the Ese, Re and Ce and lead to more stable environment in which to conduct the measurements. (Neuman, 1995)
The effect of sweat glands is often neglected, since in many cases, the abration of the skin creates a good, low impedance contact between the electrolyte and the living skin by circumventing the stratum corneum and the sweat ducts have only a marginal effect on the total impedance levels of the system (Kappenman and Luck, 2010). However, should sweating occur and sweat glands and ducts become quickly filled, leading to rapid changes in the systemic impedance over the electrode-skin interface, this could influence the measurements, especially if the stratum corneum has not been effectively abraded (Kappenman and Luck, 2010). 3.2.2 Electrodes and Devices Different types of electrodes with distinctive characteristics have been developed over the years for use with different biopotential recording setups. There have been different motivations for developing different types of electrodes e.g. the need to reduce costs, to ensure the reliablity of the measurements in some special recording setups, or to improve the performance of the electrodes so that they are able to reduce certain types of artifacts inherent to that type of recording setup. The majority of the variance between electrodes originates from their shape, materials and functionality.
Metal plate electrodes that are used with the electrolyte gel are probably the most commonly used types of electrodes. They are rather simple to manufacture in different types of shapes, from circular plates to cups. These electrodes are the most commonly used when measuring EEG, EMG and ECG. (Neuman, 1995)
Silver - silver chloride (Ag-AgCl) is one of the most widely used materials in the metallic electrodes as they can be considered as almost perfectly non-polarizable electrodes, exhibiting less electrical noise and being less subject to motion artifacts than most other materials (Neuman, 1995; Lee and Kruse, 2008). Ag-AgCl -electrodes combine the excellent conductive properties of pure silver to a slighty soluble thin
31227203_UEF_Vaitoskirja_NO_351_Tomi_Miettinen_LUMET_sisus_19_10_02.indd 50 02/10/2019 7.48
29
surface layer of AgCl that provides the required ions for the transduction process in the electrode – electrolyte interface when immersed in an electrolyte containing high concentrations of chloride ions (Neuman, 1995). Furthermore, Ag-AgCl electrodes are simple to construct, inexpensive to manufacture and contain no toxic materials (Neuman, 1995). Other commonly used materials in metal electrodes are stainless steel, platinum or gold. Electrodes made from these metals are considered polarizable, and used in situations where either better durability or no chemical reactions between the electrode and electrolyte or any moisture are desired, but these electrodes can be more susceptible to movement artifacts (Neuman, 1995).
Flexible electrodes are preferred in cases when an electrode needs to be placed on body surfaces with an asymmetric curvature (Neuman, 1995). Flexible electrodes also have the benefit of not exerting high local pressures on the skin, making them comfortable and preventing the formation of ulcerations (Neuman, 1995).
There are also other types of electrodes, mainly to be used for special purposes, such as suction electrodes, floating electrodes and dry electrodes (Webster, 1984; Neuman, 1995; Guerrero and Spinelli, 2018). Basically, the choice of the electrodes is significantly affected by practical reasons i.e. the compromise between the best possible signal acquisition, ease of application and affordability. However, the affordability of the electrodes is a rather relative concern, because if a whole PSG recording needs to be repeated due to faulty or easily detaching electrodes, the total costs may be elevated a thousand-fold compared to the price of more suitable electrodes for that recording situation.
The rest of the measurement system assembly basically follows the schematic representation shown in Figure 5 (Semmlow, 2009). Electrodes are connected to a differential amplifier with an insulated electrode wire through an separate electrode board (used most often in a sleep laboratory), or directly to the amplifier in the recording device (Servidio et al., 2014b). Analog differential amplifiers are used to amplify the difference in voltage between the measured electrodes and to reject the potential fluctuations common to both electrodes (i.e. artifacts from surrounding electric fields) and to ensure that one obtains a strong enough signal for data digitalization (Salemi, 2014). Analog filtering may also be applied after the amplification if necessary. An analog-to-digital converter is used to sample the analog voltage data that is being detected between the electrode derivation that are chosen for each particular channel, so that the data can be stored on the hard drive of a computer for later use (Salemi, 2014). The recorded data may be processed by using software at this point by applying filtering retrospectively or re-referencing the recorded signals (Salemi, 2014). In some cases, automatic classification or analysis methods are used to transform the recorded data into a more informative form so that the health care professional reviewing the data may interpret the results more easily (Salemi, 2014). The data is presented in a viewable form usually with a software showing it on the computer display and the reviewer often has the option to further process the recorded signals with the software (Salemi, 2014).
31227203_UEF_Vaitoskirja_NO_351_Tomi_Miettinen_LUMET_sisus_19_10_02.indd 51 02/10/2019 7.48

30
Even though the presented schematics of the recording system (Fig. 5) may appear straightforward, there are a numerous options on how to actually set up the recordings. The American Academy of Sleep Medicine (AASM) provides recommendation guidelines for setting up PSG recordings that offer a platform to score sleep-time physiological phenomena based on a standardized set of rules (Berry et al., 2018). The recommendations are made to ensure that the recording derivations, montages, sampling and data filtering are adequate for the utilization of the scoring rules provided by the AASM which are intended to identify physiological phenomena from the recorded biosignals (Berry et al., 2018). The most commonly used derivations, montage types, sampling and filtering methods are presented in the next two subchapters.
3.2.3 Recording Techniques As the electric potential at any certain point in space is always determined relative to a reference potential, biopotential measurements needs to be performed with a minimum of two electrodes. As described in the last subchapter, the recorded channel always consists of a certain derivation of electrodes, between which the potential is measured. There are two basics derivations used in biosignal measurements, called unipolar (or referential) derivation and bipolar derivation (Servidio et al., 2014b).
The unipolar derivation consists of two electrodes: the active electrode and the reference electrode (Servidio et al., 2014b). The unipolar montage is a set of unipolar derivations that share one or several referential electrodes (Servidio et al., 2014b). Unipolar derivations are especially useful for situations where signals are desired to be retrospectively re-referenced to another active electrode (Peacock et al., 2014). The main drawback in using a referential derivation is that it relies significantly on the quality of the signal of the reference electrode (Peacock et al., 2014; Servidio et al., 2014b). Any impedance problems with the reference electrode may readily cause noise or even unwanted artifacts in the whole unipolar montage (Peacock et al., 2014).
Bipolar derivations basically consist of two active electrodes between which the potential difference is measured (Servidio et al., 2014b). Placing electrodes near to each other in a bipolar derivation results in signals which have a high signal-to-noise ratio (Soderberg, 1992). This is caused by the fact that differential amplifiers reject the common mode signals between the electrodes and if the electrodes are positioned close to each other, the differential amplifier rejects very effectively the local noise near the electrodes’ placement site (Soderberg, 1992). Therefore, bipolar electrodes are especially good for recording bioelectric activity in situations where the signal might be weak or if there is a significant amount of noise in the vicinity of the physiologial phenomenon under scrutiny. However, bipolar derivations may suffer from signal losses at a number of frequencies (Soderberg, 1992). The cancellation can occur at a frequency that has a wavelength equal to the interelectrode distance and
31227203_UEF_Vaitoskirja_NO_351_Tomi_Miettinen_LUMET_sisus_19_10_02.indd 52 02/10/2019 7.48

31
every frequency that is an integer multiple of that frequency (Soderberg, 1992). This may lead to a signal cancellation and therefore, amplitude reduction for some physiological events as part of common noise cancellation if the detected frequencies and the electrode distance are matched (Keenan et al., 2005). Furthermore, re-referencing is generally not possible with a bipolar montage due to the fact that recorded channels do not have derivations consisting of shared reference electrode (Salemi, 2014).
As was already stated, the differential amplifier increases the amplitude of the difference between the electrodes and rejects the common mode signals. However, in order to operate properly, a ground electrode is required that nominates the zero level against which the potential of each electrode is defined (Servidio et al., 2014b). A ground electrode is most commonly placed on an inactive part of the body, e.g. on the forehead or behind the ears on a hairless part of the skin. Figure 8 illustrates the difference between the unipolar and bipolar montages in a schematic form.
Figure 8. Illustration of the difference between unipolar and bipolar montage. Both montages consist of three derivations that pass through a differntial amplifier. 3.2.4 Signal Processing Sampling is the process of taking a sample of the value of the continuous analog signal produced by the electrode and the differential amplifier at certain time points at a constant rate (Semmlow, 2009). The selected sampling frequency sets the limits for the frequency spectrum of the data in which the possible physiological events can be observed (Semmlow, 2009). If too low a sampling rate is utilized, it might become impossible to detect the events under investigation due to aliazing (Halford, 2018). Therefore, in order to ensure the proper sampling of the events under scrutiny, high
31227203_UEF_Vaitoskirja_NO_351_Tomi_Miettinen_LUMET_sisus_19_10_02.indd 53 02/10/2019 7.48

32
enough sampling rates must be used e.g. AASM has recommended minimal and desirable sampling frequencies for different PSG signals (Berry et al., 2018).
Artifacts are generally considered unwanted or unnecessary data in the recorded signal that may otherwise prevent the analysis of the data if not removed. The problem can be circumvented by applying filtering. Software-based or digital filtering is often preferred over analog filtering due to the fact that no raw data is lost by the filtering and digital filters can be adapted to the needs that the recorded signal asserts even during the analysis (Halford, 2018).
Signals can be filtered in numerous ways, but only filtering in the frequency-domain is included in the AASM guidelines; this involves the removal of some frequencies or frequency bands when analyzing the data (Semmlow, 2009; Berry et al., 2018). Frequency-domain filtering can be categorized as four different types that are named based on the frequencies that the filter allows to pass through: low-pass, high-pass, band-pass or band-stop filters (Semmlow, 2009). A low-pass filter basically attenuates all frequencies above a certain threshold in the spectrum, a high-pass filter is used to attenuate frequencies under a certain threshold, a band-pass filter does both by letting only a certain band of frequencies pass, and a band-stop filter attenuates a certain frequency band while permitting rest of the frequencies to pass (Semmlow, 2009). Digital filters are mathematical algorithms that are applied to the data in order to remove certain frequency bands (Servidio et al., 2014b).
The choice of electrode derivation, sampling rate and filtering depends on the measurement setup. In the next subchapter, the properties of the most common polysomnographic measurement setups and derivation, sampling and filtering choices attributed to those setups are described. 3.3 RECORDING SETUPS The main reason for conducting PSG recordings is to have a practical way to observe the physiological phenomena occurring during the sleep and to store the observations for later analysis. Bioelectric signals are most commonly utilized for recording the neural activity of the brain and the muscular activity of the eyes, skeletal muscles, and the heart. Electrical activity data of the brain (EEG) during sleep can be used for determining the sleep stages and arousals as well detecting as sleep-related neurological disorders when supplemented with observations of different sleep-time behaviors which are assessed with EOG, chin EMG and ECG. Furthermore, especially EMG is often utilized for the assessment of muscular activities during the night. AASM has recommendations for the setups to record EEG, EOG, EMG and ECG in PSG (Berry et al., 2018). 3.3.1 Electroencephalography AASM recommends the use of at least three EEG channels in PSG: from frontal (F), central (C) and occipital (O) areas to ensure that all activity needed for sleep staging
33
are being sampled (Berry et al., 2018). The electrode placement is based on the international 10-20 system, which is a globally standardized approach for collecting bioelectric signals from the brain (Woidke and Robertson, 2014). The electrode placement in this system is based on measuring three different dimensions of the patient’s head and subsequently, using 10% and 20% increments of these dimensions to determine the standardized electrode placement locations (Woidke and Robertson, 2014). The electrode placements and their names based on the 10% and 20% increments of the head dimensions are presented in Figure 9.
Figure 9. The electrode placements in the international 10-20 system. Modified from Wikimedia Commons.
The AASM recommended unipolar EEG montage in PSG is as follows: F4-M1, C4-
M1, O2-M1 and backup derivations of F3-M2, C3-M2, O1-M2. The position of the M1 electrode is behind the left ear (between T9 and TP9 in Figure 7), and accordingly, M2 is positioned behind the right ear (between T10 and TP10). (Berry et al., 2018)
The minimal recommended sampling frequency by AASM is 200 Hz and the desirable sampling frequency is at least 500 Hz. A band-pass filtering between 0.3 Hz and 35 Hz is recommended. However, the upper limit may be increased from 35 Hz so that the sampling frequency is at least three times the upper limit (Berry et al., 2018). 3.3.2 Electrooculography EOG recordings are conducted unipolarly by placing the active electrodes on two positions, one each for the left and the right eye. The AASM recommended EOG montage consists of derivations E1-M2 and E2-M2, in which the electrode E1 is positioned 1 cm below the canthus of the left eye, and electrode E2 correspondingly 1 cm above the outer canthus of the right eye. (Berry et al., 2018)
31227203_UEF_Vaitoskirja_NO_351_Tomi_Miettinen_LUMET_sisus_19_10_02.indd 54 02/10/2019 7.48
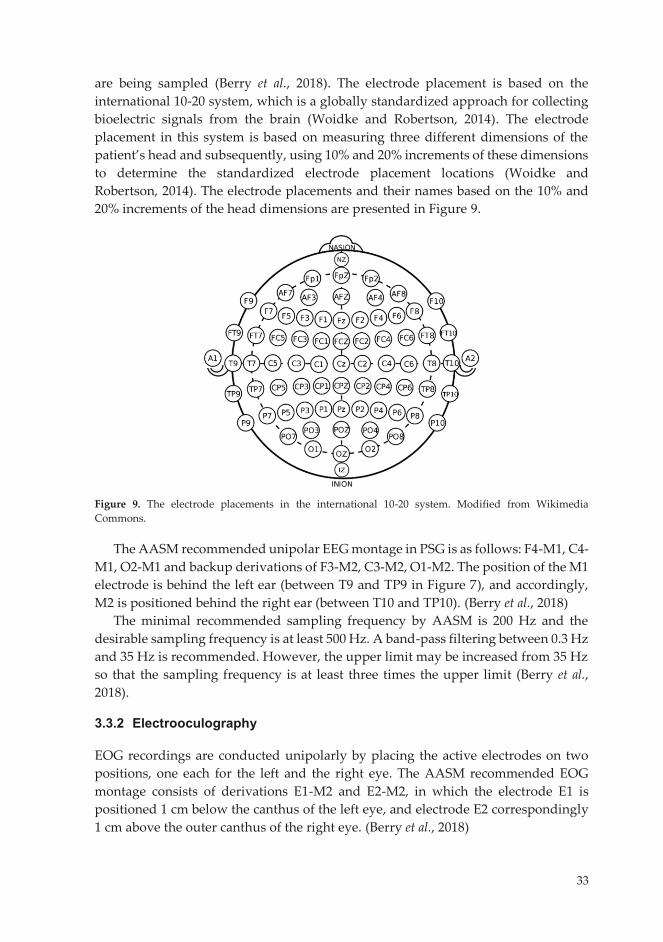
33
are being sampled (Berry et al., 2018). The electrode placement is based on the international 10-20 system, which is a globally standardized approach for collecting bioelectric signals from the brain (Woidke and Robertson, 2014). The electrode placement in this system is based on measuring three different dimensions of the patient’s head and subsequently, using 10% and 20% increments of these dimensions to determine the standardized electrode placement locations (Woidke and Robertson, 2014). The electrode placements and their names based on the 10% and 20% increments of the head dimensions are presented in Figure 9.
Figure 9. The electrode placements in the international 10-20 system. Modified from Wikimedia Commons.
The AASM recommended unipolar EEG montage in PSG is as follows: F4-M1, C4-
M1, O2-M1 and backup derivations of F3-M2, C3-M2, O1-M2. The position of the M1 electrode is behind the left ear (between T9 and TP9 in Figure 7), and accordingly, M2 is positioned behind the right ear (between T10 and TP10). (Berry et al., 2018)
The minimal recommended sampling frequency by AASM is 200 Hz and the desirable sampling frequency is at least 500 Hz. A band-pass filtering between 0.3 Hz and 35 Hz is recommended. However, the upper limit may be increased from 35 Hz so that the sampling frequency is at least three times the upper limit (Berry et al., 2018). 3.3.2 Electrooculography EOG recordings are conducted unipolarly by placing the active electrodes on two positions, one each for the left and the right eye. The AASM recommended EOG montage consists of derivations E1-M2 and E2-M2, in which the electrode E1 is positioned 1 cm below the canthus of the left eye, and electrode E2 correspondingly 1 cm above the outer canthus of the right eye. (Berry et al., 2018)
31227203_UEF_Vaitoskirja_NO_351_Tomi_Miettinen_LUMET_sisus_19_10_02.indd 55 02/10/2019 7.48
34
In EOG, the minimal sampling frequency is similar as applied for the EEG, 200 Hz with the desirable sampling rate being 500 Hz. In addition, a band-pass filter between 0.3 Hz and 35 Hz is similarly recommended for EOG, as it is for EEG. (Berry et al., 2018)
3.3.3 Electromyography AASM has recommendation guidelines for the placement of the PSG bipolar electrodes in EMG recordings from several muscle groups. In the case of bruxism scoring, AASM guidelines recommend positioning EMG electrodes on top of the masseter muscles (Berry et al., 2018). The chin EMG montage, used for sleep stage scoring, consists of a bipolar derivation and one backup electrode, with one electrode positioned in the midline 1 cm above the inferior edge of the mandible, and two electrodes 2 cm below the inferior edge of the mandible; one 2 cm to the right of the midline and the other 2 cm to its left. The chin EMG derivation consists of either electrode below the mandible being referred to the electrode above the mandible, with the other inferior electrode working as a backup electrode. (Berry et al., 2018)
The recommended minimal sampling frequency for EMG is also 200 Hz and the desirable sampling frequency 500 Hz. Band-pass filtering between 10 Hz and 100 Hz is recommended.
3.3.4 Electrocardiography The ECG derivation recommended by AASM for PSG consists of a single modified ECG lead II that utilizes a torso electrode placement, aligned in parallel to a straight line crossing from the right shoulder and left hip. Additional electrodes (and leads) may be placed if needed. The minimal sampling frequency for ECG recommended by AASM is 200 Hz with the desirable frequency being 500 Hz. Furthermore, the use of a band-pass filter between 0.3 Hz and 70 Hz is recommended. 3.4 ANALYSIS OF POLYSOMNOGRAPHIC RECORDINGS
Analyzing the recordings is the final step in utilizing PSG for observing the nocturnal physiological phenomena. Scoring the sleep stages is possibly the most common method to determine the structure and quality of the sleep. Furthermore, the frequency, duration or the number of several sleep-time activities can by assessed from the bioelectric signals that may provide indications of the possible pathophysiological conditions. However, this analysis may be distrubed or even prevented by the presence of artifacts in the recorded signals. 3.4.1 Masticatory Muscle Activity and Other Physiological Events Various physiological events can be scored based on the bioelectric recordings in PSG. These include, but are not limited to, different types of muscle or sleep-related
31227203_UEF_Vaitoskirja_NO_351_Tomi_Miettinen_LUMET_sisus_19_10_02.indd 56 02/10/2019 7.48
35
movement activities, micro-arousals, and cardiac events or measures such as heart rate. Most of the physiological events scored in the PSG are often given as an output of the total number of events, the frequency of events, the duration of the events or just the mere existence of certain events (Berry et al., 2018).
AASM guidelines include various rules for scoring the sleep-related movements or muscular events. The most relevant for this thesis is the rule of scoring MMA events. AASM recommends that the bruxism events may be scored on additional masseter electrodes, placed at the discretion of the investigator, or in the absence of those electrodes from the chin EMG signal (Berry et al., 2018). A minimum of 3 brief elevations activity lasting 0.25 – 2 seconds (amplitude at least twice the background activity) should be scored as phasic MMA and sustained EMG elevations of EMG activity lasting a minimum of 2 seconds should be scored as tonic MMA (Berry et al., 2018). At least 3 seconds of stable background EMG activity must occur before a new MMA event may be scored (Berry et al., 2018). Reliable bruxism scoring includes a minimum of 2 audible tooth griding events per night of PSG recording in the absence of epilepsy (Berry et al., 2018), however, this does not take very well into account the more clenching-type bruxers. Mixed episodes, that share the the characteristics of phasic and tonic episodes, and that are widely used in the literature (Carra et al., 2012, 2015a), are not mentioned in the AASM guidelines (Berry et al., 2018). Total sleep time (TST), defined by sleep stage scoring is utilized in the SB assessment as the denominator when calculating the MMA index, a statistic for the number of MMA events per hour of sleep (Carra et al., 2015).
Micro-arousals, that were already discussed in chapter 2 as a permissive window during which the MMA events can occur (Lavigne et al., 2007; Mayer et al., 2016), are scored based on the signals in the EEG and chin EMG channels. Arousals are scored in the presence of an abrupt shift of the EEG frequency in frontal and central regions lasting a minimum of 3 seconds with a minimum of 10 seconds of stable sleep preceding the change. These abrupt shifts include alpha waves, theta waves and/or frequencies higher than 16 Hz and should be distinguished from sleep spindles. Scoring the arousals during REM sleep must include a concurrent increase in chin EMG activity with a minimum duration of 1 second. (Berry et al., 2018)
Several physical phenomena can be recognized in the ECG signal (Campo, 2014; Berry et al., 2018). However, with respect to the MMA assessment, the heart rate (HR) is the most beneficial for the recognition of these events. As the cardiac sympathetic activity is shown to be associated with the onset of MMA (Huynh et al., 2006), HR could be utilized as a possible marker when distinguishing MMA events from other types of movement events and artifacts (Castroflorio et al., 2013). 3.4.2 Sleep Stages Sleep stage scoring is based on the visual assessment of the EEG waveform morphology and recognition of certain sleep-stage specific events with their distinctive patterns. This is further supported by the detection of sleep-related
31227203_UEF_Vaitoskirja_NO_351_Tomi_Miettinen_LUMET_sisus_19_10_02.indd 57 02/10/2019 7.48
36
behaviors on EEG, EOG and chin EMG that help in differentiating sleep and wakefulness as well as discriminating the different sleep stages.
Continuous EEG activity can be classified based on their frequency band. Some of these EEG patterns, as well as EOG and chin EMG activities, are characteristic for certain sleep stages and/or regions of the brain (Servidio et al., 2014a). For example, these activities, as well as other distinctive morphological features in the EEG signal can consist of delta (0.5 – 4 Hz), theta (3 – 7 Hz), alpha (8 – 13 Hz) and beta (> 13 Hz) activities, Low amplitude, mixed frequency waves (LAMF), K complexes, sleep spindles, vertex waves, sawtooth waves, slow and rapid eye movements and chin EMG tone (Compton and Robertson, 2014; Servidio et al., 2014a; Berry et al., 2018). All the activities that can be found in EEG signals, present their maximal activity in the frontal or central parts of the brain, except for the alpha activity that occurs predominantly in the occipital region (Servidio et al., 2014a).
All these activities are used in one form or another in the sleep stage scoring, for which the AASM has clearly defined rules (Berry et al., 2018). AASM has classified the sleep stages into five classes: wakefulness (W), three NREM sleep stages: N1, N2 and N3; the N1 which corresponds to light sleep and N3 to the deepest stage of sleep, and REM sleep (Compton and Robertson, 2014; Servidio et al., 2014a; Berry et al., 2018). Scoring is usually made in epochs of 30 seconds. The scoring rules for these stages are summarized in Table 4. More detailed rules for the transitions between the stages can be found in the AASM scoring manual (Berry et al., 2018). Table 4. Summary of the sleep stage scoring rules by the AASM. Modified after Berry et al., 2012; Compton and Robertson, 2014; Servidio et al., 2014a.
Channel Wakefulness (W) N1 N2 N3 REM
EEG EOG Chin EMG
Eyes open: beta interspersed with LAMF, little alpha activity Eyes closed: LAMF with alpha (> 50% of an epoch) Eye blinks, under voluntary control. Possible to see slow eye movements when drowsy. Highest activity of all stages, under voluntary control
Alpha activity attenuated and replaced with LAMF, theta waves, (vertex sharp waves in the end of stage) Slow eye movements High activity
LAMF, K complexes and sleep spindles Occasional slow eye movements Lower activity than in N1
> 20% delta waves in an epoch Usually no eye move-ments Lower activity than in N2
LAMF, (sawtooth waves)
REM, usually phasic Lowest activity (possibly with periods of twitching)
31227203_UEF_Vaitoskirja_NO_351_Tomi_Miettinen_LUMET_sisus_19_10_02.indd 58 02/10/2019 7.48
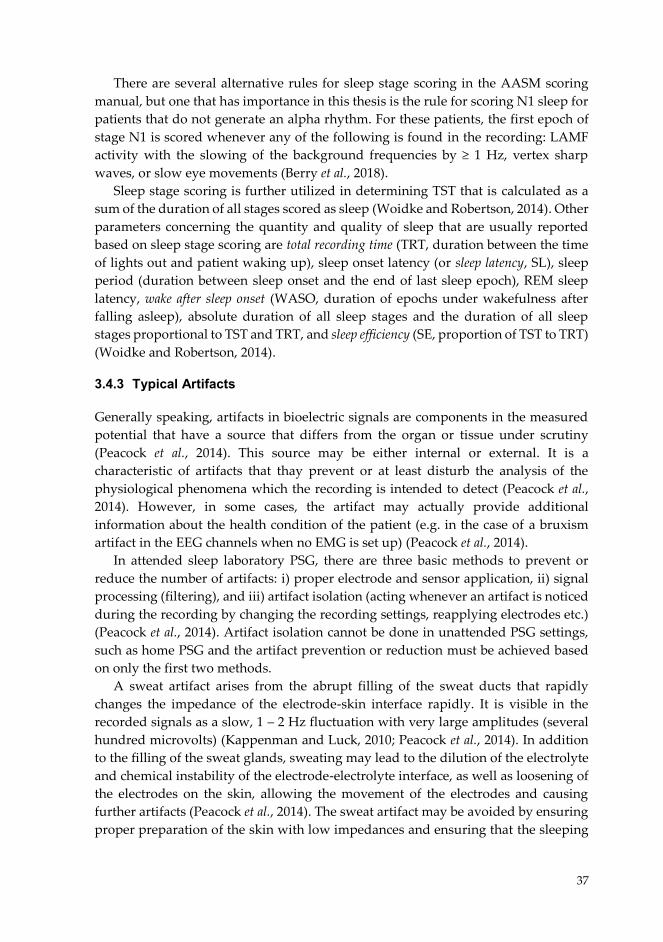
37
There are several alternative rules for sleep stage scoring in the AASM scoring manual, but one that has importance in this thesis is the rule for scoring N1 sleep for patients that do not generate an alpha rhythm. For these patients, the first epoch of stage N1 is scored whenever any of the following is found in the recording: LAMF activity with the slowing of the background frequencies by ≥ 1 Hz, vertex sharp waves, or slow eye movements (Berry et al., 2018).
Sleep stage scoring is further utilized in determining TST that is calculated as a sum of the duration of all stages scored as sleep (Woidke and Robertson, 2014). Other parameters concerning the quantity and quality of sleep that are usually reported based on sleep stage scoring are total recording time (TRT, duration between the time of lights out and patient waking up), sleep onset latency (or sleep latency, SL), sleep period (duration between sleep onset and the end of last sleep epoch), REM sleep latency, wake after sleep onset (WASO, duration of epochs under wakefulness after falling asleep), absolute duration of all sleep stages and the duration of all sleep stages proportional to TST and TRT, and sleep efficiency (SE, proportion of TST to TRT) (Woidke and Robertson, 2014). 3.4.3 Typical Artifacts Generally speaking, artifacts in bioelectric signals are components in the measured potential that have a source that differs from the organ or tissue under scrutiny (Peacock et al., 2014). This source may be either internal or external. It is a characteristic of artifacts that thay prevent or at least disturb the analysis of the physiological phenomena which the recording is intended to detect (Peacock et al., 2014). However, in some cases, the artifact may actually provide additional information about the health condition of the patient (e.g. in the case of a bruxism artifact in the EEG channels when no EMG is set up) (Peacock et al., 2014).
In attended sleep laboratory PSG, there are three basic methods to prevent or reduce the number of artifacts: i) proper electrode and sensor application, ii) signal processing (filtering), and iii) artifact isolation (acting whenever an artifact is noticed during the recording by changing the recording settings, reapplying electrodes etc.) (Peacock et al., 2014). Artifact isolation cannot be done in unattended PSG settings, such as home PSG and the artifact prevention or reduction must be achieved based on only the first two methods.
A sweat artifact arises from the abrupt filling of the sweat ducts that rapidly changes the impedance of the electrode-skin interface rapidly. It is visible in the recorded signals as a slow, 1 – 2 Hz fluctuation with very large amplitudes (several hundred microvolts) (Kappenman and Luck, 2010; Peacock et al., 2014). In addition to the filling of the sweat glands, sweating may lead to the dilution of the electrolyte and chemical instability of the electrode-electrolyte interface, as well as loosening of the electrodes on the skin, allowing the movement of the electrodes and causing further artifacts (Peacock et al., 2014). The sweat artifact may be avoided by ensuring proper preparation of the skin with low impedances and ensuring that the sleeping
31227203_UEF_Vaitoskirja_NO_351_Tomi_Miettinen_LUMET_sisus_19_10_02.indd 59 02/10/2019 7.48
38
environment is cool enough to prevent perspiration (Kappenman and Luck, 2010). High-pass filtering may also be used to remove the artifact, but with this, also physiological data may be lost, e.g. delta activity on EEG channels (Peacock et al., 2014).
A line frequency artifact at 50 or 60 Hz (depending on the power grid) is usually present whenever a single electrode has a high impedance or there is significant imbalance between two electrodes within a derivation (Peacock et al., 2014). This leads to the common mode rejection not functioning properly, and artifacts in one electrode are amplified in the recorded signal (Peacock et al., 2014). The artifact may be recognized and removed from signal with a narrow band-stop filter. However, this is recommended only as a last resort, as it may attenuate the biopotentials under scrutiny and thus actual data on the physiological functions may be lost (Peacock et al., 2014).
Muscle or movement artifacts are common in the EEG, EOG and ECG channels as high frequency activity (20 – 200 Hz) that could be easily interpreted as electrical noise (Peacock et al., 2014). Sources for a muscle artifact include, but are not limited to respiratory (muscle) events, leg cramps, abdominal efforts, bruxism, major body movements and body rocking (Peacock et al., 2014). A respiratory artifact may also present itself as a slow oscillation, but it can be distinguished from a sweat artifact by the fact that it is synchronized with the respiration (Peacock et al., 2014). One possible cause for this artifact is that the electrodes are moving in contact and in parallel to another surface, e.g. a pillow, or the electrodes have become loosened and are moving against the skin (Peacock et al., 2014). The ECG artifact can be present in every other bioelectric channel that is recorded in PSG (Peacock et al., 2014).
Channel-blocking artifacts (i.e. signal saturation) occur whenever a high enough artifact is present in the channel, so that the quantized values of the recoded signal hits the maximum or minimum value. Some of the common reasons are electrode loosening and movement, salt bridging (i.e. low impedance connection between two electrodes), and electrode dislodgement that causes a popping artifact (Peacock et al., 2014). A popping artifact may also be caused by mere mechanical instability of the electrodes, shorting in the wires or circuit disconnections (Peacock et al., 2014).
If a system reference artifact is present, and the reference electrodes suffer from any artifact-inducing problems, the artifact is transmitted to every derivation for which that electrode is being used as a reference (Peacock et al., 2014). Therefore, artifact prevention with reference electrodes should be emphasized.
It should be noted that some of these artifacts are not as detrimental as some others, as there is variance in the effect of the artifact on the signal analysis. Some artifacts, e.g. an ECG artifact may be just a nuisance in the EEG channels, whereas the channel-blocking artifact absolutely prevents any analysis on the channels in which it is present. The prevention of the artifacts that may cause the PSG recording to fail and thus require the repetition of the recording, need to be prioritized.
31227203_UEF_Vaitoskirja_NO_351_Tomi_Miettinen_LUMET_sisus_19_10_02.indd 60 02/10/2019 7.48
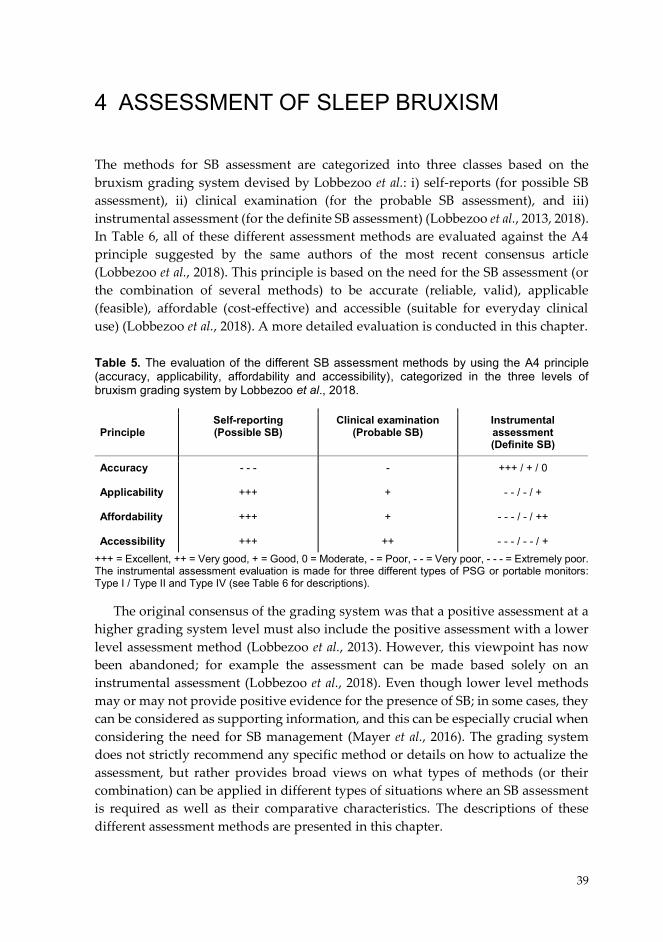
39
4 ASSESSMENT OF SLEEP BRUXISM
The methods for SB assessment are categorized into three classes based on the bruxism grading system devised by Lobbezoo et al.: i) self-reports (for possible SB assessment), ii) clinical examination (for the probable SB assessment), and iii) instrumental assessment (for the definite SB assessment) (Lobbezoo et al., 2013, 2018). In Table 6, all of these different assessment methods are evaluated against the A4 principle suggested by the same authors of the most recent consensus article (Lobbezoo et al., 2018). This principle is based on the need for the SB assessment (or the combination of several methods) to be accurate (reliable, valid), applicable (feasible), affordable (cost-effective) and accessible (suitable for everyday clinical use) (Lobbezoo et al., 2018). A more detailed evaluation is conducted in this chapter. Table 5. The evaluation of the different SB assessment methods by using the A4 principle (accuracy, applicability, affordability and accessibility), categorized in the three levels of bruxism grading system by Lobbezoo et al., 2018.
+++ = Excellent, ++ = Very good, + = Good, 0 = Moderate, - = Poor, - - = Very poor, - - - = Extremely poor. The instrumental assessment evaluation is made for three different types of PSG or portable monitors: Type I / Type II and Type IV (see Table 6 for descriptions).
The original consensus of the grading system was that a positive assessment at a higher grading system level must also include the positive assessment with a lower level assessment method (Lobbezoo et al., 2013). However, this viewpoint has now been abandoned; for example the assessment can be made based solely on an instrumental assessment (Lobbezoo et al., 2018). Even though lower level methods may or may not provide positive evidence for the presence of SB; in some cases, they can be considered as supporting information, and this can be especially crucial when considering the need for SB management (Mayer et al., 2016). The grading system does not strictly recommend any specific method or details on how to actualize the assessment, but rather provides broad views on what types of methods (or their combination) can be applied in different types of situations where an SB assessment is required as well as their comparative characteristics. The descriptions of these different assessment methods are presented in this chapter.
Principle Self-reporting (Possible SB)
Clinical examination (Probable SB)
Instrumental assessment (Definite SB)
Accuracy Applicability Affordability Accessibility
- - -
+++
+++
+++
-
+
+
++
+++ / + / 0
- - / - / +
- - - / - / ++
- - - / - - / +
31227203_UEF_Vaitoskirja_NO_351_Tomi_Miettinen_LUMET_sisus_19_10_02.indd 61 02/10/2019 7.48
40
4.1 SELF-REPORTS…………… Self-reporting is the most commonly used method for SB assessment in both research and in clinical practice. Assessment based on self-reporting is generally very practical to acquire, as it requires no special instruments or expertise, making it very applicable, affordable and accessible. The assessment of self-reporting is easily done in a matter of minutes, and can be made at a routine check-up at dentist’s office, or even in the absence of any dental experts.
However, there is not one single way to make an assessment based on self-reporting. The self-reported bruxism assessment may include varying types of practices, such as asking a single or several yes or no questions (Maluly et al., 2013; Paesani et al., 2013), filling out a questionnaire form (Blanco Aguilera et al., 2014; Huhtela et al., 2016; Yachida et al., 2016), or a free-form or structured longer anamnesis (Manfredini et al., 2012). The sensitivity and specificity of the assessment are affected by whether the questions include the assessment of the source of the patient’s knowledge for the ongoing SB (e.g. is it the bed partner, dentist or is it being based on the presence of symptoms) (Raphael et al., 2015). If the patient reports that the sleep partner has told them that they grind their teeth audibly during night, there is a higher probability of finding two or more tooth grinding episodes in a PSG recording (Raphael et al., 2015). Unfortunately, this does not apply to patients sleeping alone as they are often unaware of the grinding noises (Rompré et al., 2007). Furthermore, concerns have arisen that when the dentist has told the patient that they might have SB, this may be based on preconceptions which the dentist has drawn based the patient’s symptoms, or the patient may be hyperaware of SB and starts to consider it as the main reason for her/his unexplained pain symptoms (Raphael et al., 2012, 2015; Huhtela et al., 2016; Lobbezoo et al., 2018).
Another factor in the accuracy of assessing ongoing SB with self-reporting is the question concerning the frequency of the SB activity (Maluly et al., 2013), and the clarification of whether the activity has been recent or has occurred in the distant past (Raphael et al., 2015). If the assessment by self-reporting does not take these questions into account, it is impossible to know whether or not the SB is a current occurrence or the severity of the SB possibly, and it might prove hard to try to link SB to the symptoms (Raphael et al., 2012; Casett et al., 2017). A timeframe of 1 – 2 weeks for the assessment of self-reported SB is currently recommended, with the belief that the ideal timeframe requires confirmation by more longitudinal research of the occurrence and variability of SB activity (Lobbezoo et al., 2018).
The type of the SB activity, meaning that whether the SB is mostly grinding or clenching (Raphael et al., 2012), and the differentiation between SB and AB are also important in assessing the nature of the bruxism activity (Raphael et al., 2016b). Even though the tooth grinding sounds reported by the bed partner are a good indicator of ongoing SB, this does not apply to inaudible clenching (Yachida et al., 2016).
31227203_UEF_Vaitoskirja_NO_351_Tomi_Miettinen_LUMET_sisus_19_10_02.indd 62 02/10/2019 7.48
41
Furthermore, AB and SB may cause similar symptoms and thus their differentiation can help to find the best management option. The more detailed the questions are, basically more information concerning the quality and quantity of the activity may be extracted and utilized to form a diagnosis, e.g. making it possible to rule out other causes of the symptoms and to manage the conditions accordingly.
Currently, one of the most common methods for assessing self-reported SB has been the utilization of the question 15c in the questionnaire of the Research Diagnostic Criteria for Temporomandibular Disorders (RDC/TMD): “Have you been told, or do you notice that you grind your teeth or clench your jaw while sleeping at night?” (Yachida et al., 2016; Stuginski-Barbosa et al., 2017; Kato et al., 2018). Oral Behaviors Checklist (OBC) is a new type of questionnaire introduced in 2004 and also included in the recently published Diagnostic Criteria for Temporomandibular Disorders (DC/TMD), which is intended to replace the RDC/TMD (Schiffman et al., 2014). OBC is used to assess the occurrence of also other parafunctional oral behaviors in addition to AB and SB (van der Meulen et al., 2014; Su et al., 2018). It has questions concerning the SB and AB separately, the question for SB being: “How often do you clench or grind teeth when asleep, based on any information you may have?”.
The greatest problem with the structured questionnaires or even the customized interviews of self-reported SB is that they generally correspond rather poorly to the findings of the ongoing SB in the PSG or EMG recording (Raphael et al., 2015; Yachida et al., 2016) and even to the clinical findings (Paesani et al., 2013). It is entirely possible that some patients are overreporting the SB occurrence due to some false assumptions, or there are problems in the structure of the questionnaires, but there are also patients that present with high SB activity but do not report it, probably because they are completely unaware of the symptoms (Maluly et al., 2013; Raphael et al., 2016b; Casett et al., 2017). Especially those patients sleeping alone are problematic to assess reliably through self-reporting. Due to these reasons, self-report is currently not considered a sufficient indicator for ongoing SB activity (Raphael et al., 2015, 2016b). The latest international consensus paper on the SB definition underlines the need for improving the tools for self-reporting to enhance their reliability and validity as independent assessment methods, but also as a part of multifactorial approaches that may include combinations of clinical signs or symptoms (Lobbezoo et al., 2018).
4.2 CLINICAL EXAMINATION A clinical examination is most commonly conducted by a dentist, who examines the patient for the presence of the most common clinical symptoms of SB: tooth wear and damage, jaw muscle pain or fatigue, temporal headaches, jaw locking upon awakening and masseter muscle hypertrophy (for more details, see chapter 2.5.1) (Carra, 2018). The presence of these symptoms is also included in the diagnostic criteria of the AASM International Classification of Sleep Disorders (American
31227203_UEF_Vaitoskirja_NO_351_Tomi_Miettinen_LUMET_sisus_19_10_02.indd 63 02/10/2019 7.48
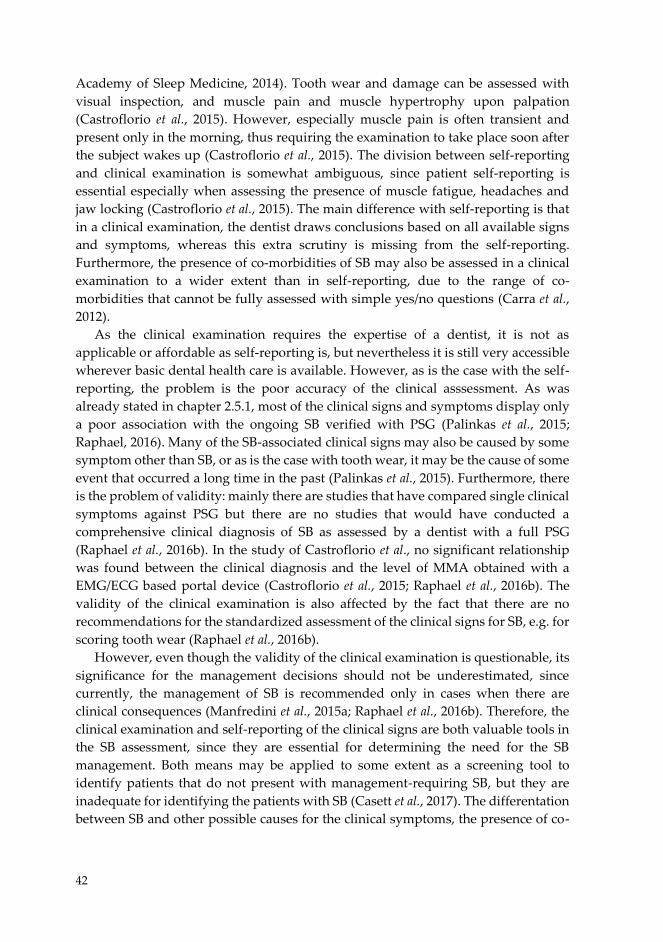
42
Academy of Sleep Medicine, 2014). Tooth wear and damage can be assessed with visual inspection, and muscle pain and muscle hypertrophy upon palpation (Castroflorio et al., 2015). However, especially muscle pain is often transient and present only in the morning, thus requiring the examination to take place soon after the subject wakes up (Castroflorio et al., 2015). The division between self-reporting and clinical examination is somewhat ambiguous, since patient self-reporting is essential especially when assessing the presence of muscle fatigue, headaches and jaw locking (Castroflorio et al., 2015). The main difference with self-reporting is that in a clinical examination, the dentist draws conclusions based on all available signs and symptoms, whereas this extra scrutiny is missing from the self-reporting. Furthermore, the presence of co-morbidities of SB may also be assessed in a clinical examination to a wider extent than in self-reporting, due to the range of co-morbidities that cannot be fully assessed with simple yes/no questions (Carra et al., 2012).
As the clinical examination requires the expertise of a dentist, it is not as applicable or affordable as self-reporting is, but nevertheless it is still very accessible wherever basic dental health care is available. However, as is the case with the self-reporting, the problem is the poor accuracy of the clinical asssessment. As was already stated in chapter 2.5.1, most of the clinical signs and symptoms display only a poor association with the ongoing SB verified with PSG (Palinkas et al., 2015; Raphael, 2016). Many of the SB-associated clinical signs may also be caused by some symptom other than SB, or as is the case with tooth wear, it may be the cause of some event that occurred a long time in the past (Palinkas et al., 2015). Furthermore, there is the problem of validity: mainly there are studies that have compared single clinical symptoms against PSG but there are no studies that would have conducted a comprehensive clinical diagnosis of SB as assessed by a dentist with a full PSG (Raphael et al., 2016b). In the study of Castroflorio et al., no significant relationship was found between the clinical diagnosis and the level of MMA obtained with a EMG/ECG based portal device (Castroflorio et al., 2015; Raphael et al., 2016b). The validity of the clinical examination is also affected by the fact that there are no recommendations for the standardized assessment of the clinical signs for SB, e.g. for scoring tooth wear (Raphael et al., 2016b).
However, even though the validity of the clinical examination is questionable, its significance for the management decisions should not be underestimated, since currently, the management of SB is recommended only in cases when there are clinical consequences (Manfredini et al., 2015a; Raphael et al., 2016b). Therefore, the clinical examination and self-reporting of the clinical signs are both valuable tools in the SB assessment, since they are essential for determining the need for the SB management. Both means may be applied to some extent as a screening tool to identify patients that do not present with management-requiring SB, but they are inadequate for identifying the patients with SB (Casett et al., 2017). The differentation between SB and other possible causes for the clinical symptoms, the presence of co-
31227203_UEF_Vaitoskirja_NO_351_Tomi_Miettinen_LUMET_sisus_19_10_02.indd 64 02/10/2019 7.48

43
morbidities and the assessment of whether SB is primary or secondary can only be achieved to some extent with these methods. Since these are major problems in self-reporting and clinical examination, it is evident that an instrumental assessment is a more reliable way to overcome these problems. 4.3 INSTRUMENTAL ASSESSMENT
The attended PSG in sleep laboratory is considered as the gold standard for SB assessment. However, it is not the only way to conduct an instrumental assessment. Some of the methods for SB assessment presented in the literature are based on abridged versions of PSG, or portable monitors that can be applied in the home environment. Traditionally, four categories for sleep studies (PSG or portable monitors) are used that are based on their comprehensiveness: type I being the attended full PSG, type II the unattended PSG and types III-IV being the portable monitors, as presented in Table 6 (Kushida et al., 2005; Kapur et al., 2017). This classification was originally constructed for the PSG assessment of SDB, but it could also be applied in the context of SB assessment (Carra et al., 2012). The categorization is based on whether the sleep study is attended by a technician, whether it is conducted in the home environment, and the number of channels being recorded.
Table 6. The four types of sleep study methods: polysomnography (PSG, types I and II) and portable monitors (types III and IV) (Kushida et al., 2005; Kapur et al., 2017).
The instrumental SB assessment is made most commonly with sleep study types I or IV. The reason for SB not usually being assessed with type II is that the application of the EEG cup electrodes still requires the expertise of a technician. In addition to the appliance affecting signal quality, if it is not done properly, there is also a risk of electrode detachment in the unattended PSG setting, possibly resulting in a higher failure rate of the recordings (Bruyneel and Ninane, 2014). With these types of electrodes, adequate impedances at the electrode-skin interface cannot be ensured without good preparation of the skin and the application of electrolyte gel on the interface. However, the utilization of type II PSG would be beneficial, as it is more accessible due to not being confined to a sleep laboratory while still being a PSG recording utilizing the widest range of channels Types III and IV exclude the EEG recordings and thus are more feasible for patient self-appliance.
Sleep Study Type Technician attendance Recording location Number of channels
Type I Type II Type III Type IV
Attended
Unattended
Unattended
Unattended
Sleep laboratory
Home environment
Home environment
Home environment
≥7 channels (including EEG)
≥7 channels
(including EEG)
≥4 channels
1-3 channels
31227203_UEF_Vaitoskirja_NO_351_Tomi_Miettinen_LUMET_sisus_19_10_02.indd 65 02/10/2019 7.48

44
4.3.1 Attended Sleep Laboratory Polysomnography According to AASM recommendations, full PSG, including EEG, EOG, chin EMG and EOG recordings, with respiratory and other channels should be complemented with masseter EMG channels to ensure the accurate detection of MMA events (Berry et al., 2018). However, the AASM does not provide any comprehensive information on the composition of the supporting channels required for SB assessment, or any means to interpret the supporting data or the significance of the number of scored MMA events (Berry et al., 2018). This is due to the fact that AASM recommendations for reporting SB extend only to reporting SB as an unusual behavior in a summary part of a PSG study that is being conducted to diagnose some other, more severe, sleep disorder (Kushida et al., 2005). In this context, the mere recommendation to add masseter EMG channels in PSG may be sufficient, but not for the situation where the primary reason for the PSG recording is to derive an SB indication. Fortunately, the scientific literature provides good guidelines on how such recordings should be practically implemented (Carra et al., 2012; Mayer et al., 2016). These requirements for comprehensive PSG-based assessment of SB are presented in Table 7.
Table 7. The PSG montage requirements for comprehensive type I PSG assessment of SB (Carra et al., 2012, 2015b; Mayer et al., 2016).
PSG = polysomnography, SB = sleep bruxism, EMG = electromyography, MMA = masticatory muscle activity, EEG = electroencephalography, EOG = electrooculography, AASM = American Academy of Sleep Medicine, TST = total sleep time, AB = awake bruxism, ECG = electrocardiography, SDB = sleep disordered breathing
Channels Details Application
Masticatory muscle EMG Audio-video recordings EEG, EOG and chin EMG ECG Leg EMG Airflow, respira-tory effort, oxy-gen saturation
Both masseter and temporalis recommended (bilaterally)
Video recordings from the facial
area of the patient AASM recommended montages
AASM recommended two-lead
montage Anterior tibialis muscle as recom-
mended by AASM
AASM recommended montages
Recognition of MMA events
Distinguishing MMA from other orofacial movements and muscular activities, detection
of tooth grinding sounds, recognition of co-morbidities
Sleep stage scoring, determination of TST and
quality of sleep, detection of arousals con-nected to MMA, distinguishing SB-related
MMA from AB-related MMA, detection of co-morbidities, detection of movement activity
Detection of arousals connected to MMA
Detection of co-morbidities, detection of move-
ment activity
Detection of SDB when suspected, detection of respiratory-related arousals
31227203_UEF_Vaitoskirja_NO_351_Tomi_Miettinen_LUMET_sisus_19_10_02.indd 66 02/10/2019 7.48
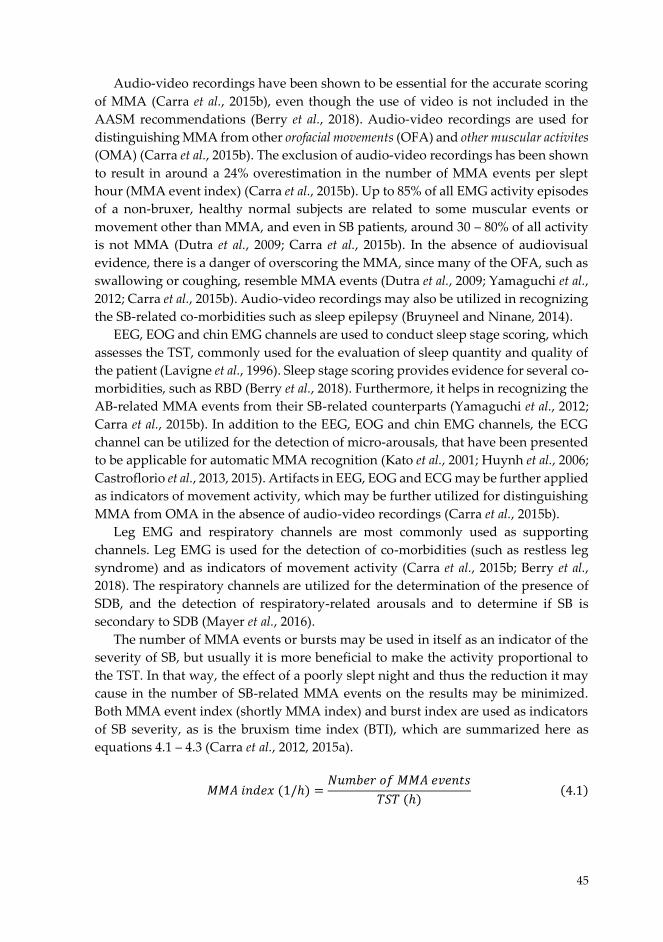
45
Audio-video recordings have been shown to be essential for the accurate scoring of MMA (Carra et al., 2015b), even though the use of video is not included in the AASM recommendations (Berry et al., 2018). Audio-video recordings are used for distinguishing MMA from other orofacial movements (OFA) and other muscular activites (OMA) (Carra et al., 2015b). The exclusion of audio-video recordings has been shown to result in around a 24% overestimation in the number of MMA events per slept hour (MMA event index) (Carra et al., 2015b). Up to 85% of all EMG activity episodes of a non-bruxer, healthy normal subjects are related to some muscular events or movement other than MMA, and even in SB patients, around 30 – 80% of all activity is not MMA (Dutra et al., 2009; Carra et al., 2015b). In the absence of audiovisual evidence, there is a danger of overscoring the MMA, since many of the OFA, such as swallowing or coughing, resemble MMA events (Dutra et al., 2009; Yamaguchi et al., 2012; Carra et al., 2015b). Audio-video recordings may also be utilized in recognizing the SB-related co-morbidities such as sleep epilepsy (Bruyneel and Ninane, 2014).
EEG, EOG and chin EMG channels are used to conduct sleep stage scoring, which assesses the TST, commonly used for the evaluation of sleep quantity and quality of the patient (Lavigne et al., 1996). Sleep stage scoring provides evidence for several co-morbidities, such as RBD (Berry et al., 2018). Furthermore, it helps in recognizing the AB-related MMA events from their SB-related counterparts (Yamaguchi et al., 2012; Carra et al., 2015b). In addition to the EEG, EOG and chin EMG channels, the ECG channel can be utilized for the detection of micro-arousals, that have been presented to be applicable for automatic MMA recognition (Kato et al., 2001; Huynh et al., 2006; Castroflorio et al., 2013, 2015). Artifacts in EEG, EOG and ECG may be further applied as indicators of movement activity, which may be further utilized for distinguishing MMA from OMA in the absence of audio-video recordings (Carra et al., 2015b).
Leg EMG and respiratory channels are most commonly used as supporting channels. Leg EMG is used for the detection of co-morbidities (such as restless leg syndrome) and as indicators of movement activity (Carra et al., 2015b; Berry et al., 2018). The respiratory channels are utilized for the determination of the presence of SDB, and the detection of respiratory-related arousals and to determine if SB is secondary to SDB (Mayer et al., 2016).
The number of MMA events or bursts may be used in itself as an indicator of the severity of SB, but usually it is more beneficial to make the activity proportional to the TST. In that way, the effect of a poorly slept night and thus the reduction it may cause in the number of SB-related MMA events on the results may be minimized. Both MMA event index (shortly MMA index) and burst index are used as indicators of SB severity, as is the bruxism time index (BTI), which are summarized here as equations 4.1 – 4.3 (Carra et al., 2012, 2015a).
𝑀𝑀𝑀𝑀𝑀𝑀 𝑖𝑖𝑖𝑖𝑖𝑖𝑖𝑖𝑖𝑖 (1/ℎ) = 𝑁𝑁𝑁𝑁𝑁𝑁𝑁𝑁𝑖𝑖𝑁𝑁 𝑜𝑜𝑜𝑜 𝑀𝑀𝑀𝑀𝑀𝑀 𝑖𝑖𝑒𝑒𝑖𝑖𝑖𝑖𝑒𝑒𝑒𝑒𝑇𝑇𝑇𝑇𝑇𝑇 (ℎ) (4.1)
31227203_UEF_Vaitoskirja_NO_351_Tomi_Miettinen_LUMET_sisus_19_10_02.indd 67 02/10/2019 7.48
46
𝐵𝐵𝐵𝐵𝐵𝐵𝐵𝐵𝐵𝐵 𝑖𝑖𝑖𝑖𝑖𝑖𝑖𝑖𝑥𝑥 (1/𝐵𝐵) = 𝑁𝑁𝐵𝐵𝑁𝑁𝑁𝑁𝑖𝑖𝐵𝐵 𝑜𝑜𝑜𝑜 𝑀𝑀𝑀𝑀𝑀𝑀 𝑁𝑁𝐵𝐵𝐵𝐵𝐵𝐵𝐵𝐵𝐵𝐵𝑇𝑇𝑇𝑇𝑇𝑇 (ℎ) (4.2)
𝐵𝐵𝑇𝑇𝐵𝐵 (%) = 𝑇𝑇𝑜𝑜𝐵𝐵𝑇𝑇𝑇𝑇 𝑖𝑖𝐵𝐵𝐵𝐵𝑇𝑇𝐵𝐵𝑖𝑖𝑜𝑜𝑖𝑖 𝑜𝑜𝑜𝑜 𝑀𝑀𝑀𝑀𝑀𝑀 𝑖𝑖𝑒𝑒𝑖𝑖𝑖𝑖𝐵𝐵𝐵𝐵 (𝐵𝐵)𝑇𝑇𝑇𝑇𝑇𝑇 (𝐵𝐵) ∗ 100% (4.3)
The thresholds for the cut-off criteria of confirmed primary SB diagnosis were established by Lavigne et al. as 4 MMA episodes per hour of sleep; this was determined in a group of patients with typical clinical symptoms (Lavigne et al., 1996). Alternative cut-off criteria have also been suggested: more than 6 bruxism bursts per episode and/or 25 bruxism bursts per hour of sleep, and at least 2 episodes with grinding sounds (Lavigne et al., 1996). Subsequently, it has been found that many of the patients with positive clinical symptoms had an MMA index lower than 4 episodes/h, and therefore a new classification was established with 2 – 4 episodes/h corresponding to low-frequency bruxers and > 4 episodes/h to high-frequency bruxers (Rompré et al., 2007). The positive diagnostic criteria for an SB assessment with PSG is currently formulated as the following guideline (Carra et al., 2012, 2015a):
“Positive SB diagnosis (based on the frequency of EMG episodes with tooth grinding history or confirmation in a sleep laboratory): Low frequency of (R)MMA: Index ≥ 2 and < 4. High frequency of (R)MMA: Index is ≥ 4 or the burst index ≥ 25.”
However, this definition for the criteria of a positive SB diagnosis has lately been challenged (Manfredini et al., 2016; Lobbezoo et al., 2018). The original study was criticized for validating the cut-off criteria against a “super-selected” groups of individuals, and not taking into account the whole continuum of SB severity or SB phenotypes, and may be one explanation for the contrasting results between self-reporting, clinical findings and PSG (Manfredini et al., 2016). As several other conditions may affect SB (and vice versa), and thus alter the severity of the resulting clinical conseqences, it has been claimed that perhaps it may not even be realistic to have actual cut-off points for the prediction of the clinical conseqences of SB (Manfredini et al., 2016; Lobbezoo et al., 2018). The use of cut-off points is currently not recommended for otherwise healthy individuals, but rather it is better to assess all evidence and SB activity at the continuum, at least until more research on the subject has been conducted (Lobbezoo et al., 2018).
Another problem that concerns not only the SB assessment with the use of type I PSG, but all instrumental assessment methods of SB, is how many nights should be recorded in order to ensure that a measure of the “true” SB activity of each patient is obtained. There is research evidence that high levels of MMA are present for long periods of time, but with high night-to-night variablity (Dal Fabbro and Tufik, 1996; Lavigne et al., 2001; Van Der Zaag et al., 2008; Hasegawa et al., 2013). In addition to night-to-night variablity, the first-night effect (FNE) is another phenomenon that affects the number of nights that should preferably be recorded (Le Bon et al., 2001;
31227203_UEF_Vaitoskirja_NO_351_Tomi_Miettinen_LUMET_sisus_19_10_02.indd 68 02/10/2019 7.48
47
Hasegawa et al., 2013). FNE is found in PSG recordings as poor sleep quality on the first night (or couple of nights); this is reflected in findings such as lower sleep efficiency and longer sleep onset and less REM sleep (Le Bon et al., 2001). It is believed to be caused by several factors, such as the anxiety caused by the unfamiliar sleep environment (patients usually show less FNE in their home environment), uncomfortable equipment and the limits it causes in subject mobility as well as the stress caused by being under scrutiny (Le Bon et al., 2001; Herbst et al., 2010). Hasegawa et al. found that SB patients with a high MMA index showed negligible SB-related FNE, but a clear majority of the patients with low-frequency MMA had higher MMA on the second night compared to the first night (Hasegawa et al., 2013). Even though the high-frequency bruxers tend to brux every night, the evidence was not so clear for low-frequency bruxers (Hasegawa et al., 2013). It is possible that the night-to-night variablity and FNE may be other reasons for the low association between self-reporting or clinical findings and PSG, if the result from one-night PSG is only a random snapshot of the constantly fluctutaing MMA levels which are actually suppressed by FNE in one- or two-night studies. There is a need for further investigations, as the findings are scarce and the study populations have been small. Furthermore, no FNE study for SB activity has been conducted in the home environment.
Despite the potential accuracy problems due to the high night-to-night variablity and possible FNE, the sleep lab PSG is still the most accurate of the methods for SB assessment, especially in the case of MMA event detection. However, it has very poor applicability due to related time-consuming scoring and expertise requirements for the application of the electrodes and devices and the supervision of the recording, which is somewhat balanced by the high level of convertibility for different research setups (Manfredini et al., 2014). The main problem with type I PSG is that it is extremely costly and thus a highly inaccessible way for assessing SB. One night of PSG is estimated to cost at least 1 000 € (the main costs are related to equipment, infrastructure and salaries of medical staff attending and scoring the recordings), thus making it very expensive even for one night (Chervin et al., 1999). Furthermore, as it requires specialized equipment and expertise, often it is confined to the major hospitals in large urban centers, available only in the developed countries. Due to its low availablility, PSG is recommended only for diagnosis of sleep disorders with more severe consequences than SB (such as narcolepsy), thus basically leaving the SB patients without any access to a definite assessment method (Kushida et al., 2005). Even in the scientific literature, sleep laboratory PSG is recommended only for those patients that are suspected of having a related co-morbidity, so that the possibly life-threatening condition can be diagnosed or it could be determined whether the SB is a primary or secondary condition (Mayer et al., 2016). For the patients that are suspected of having SB but not any co-morbidites, an assessment with a portable monitor setup is recommended (Mayer et al., 2016; Herrero Babiloni and Lavigne, 2018).
31227203_UEF_Vaitoskirja_NO_351_Tomi_Miettinen_LUMET_sisus_19_10_02.indd 69 02/10/2019 7.48
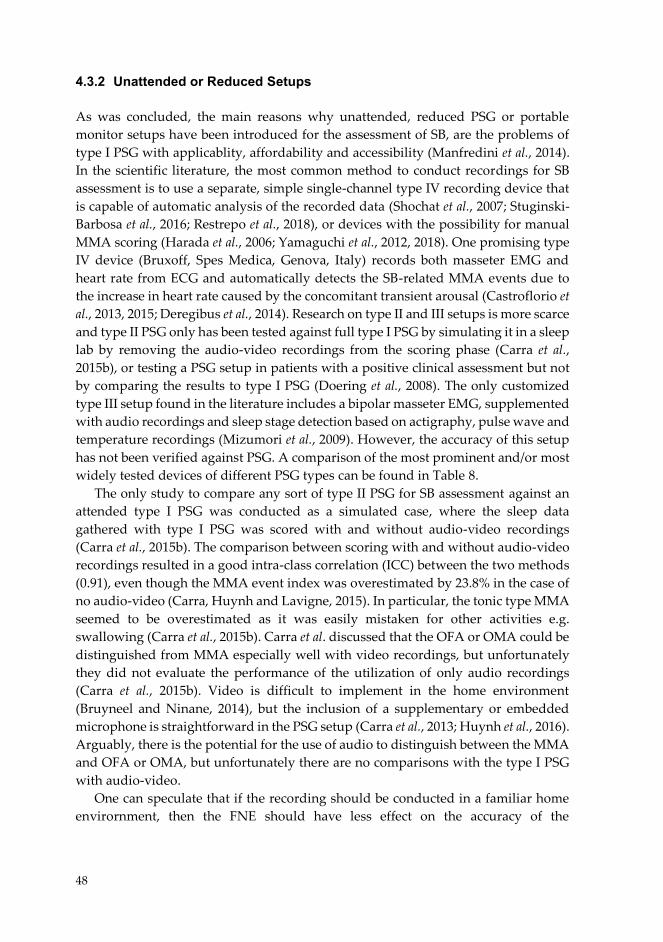
48
4.3.2 Unattended or Reduced Setups As was concluded, the main reasons why unattended, reduced PSG or portable monitor setups have been introduced for the assessment of SB, are the problems of type I PSG with applicablity, affordability and accessibility (Manfredini et al., 2014). In the scientific literature, the most common method to conduct recordings for SB assessment is to use a separate, simple single-channel type IV recording device that is capable of automatic analysis of the recorded data (Shochat et al., 2007; Stuginski-Barbosa et al., 2016; Restrepo et al., 2018), or devices with the possibility for manual MMA scoring (Harada et al., 2006; Yamaguchi et al., 2012, 2018). One promising type IV device (Bruxoff, Spes Medica, Genova, Italy) records both masseter EMG and heart rate from ECG and automatically detects the SB-related MMA events due to the increase in heart rate caused by the concomitant transient arousal (Castroflorio et al., 2013, 2015; Deregibus et al., 2014). Research on type II and III setups is more scarce and type II PSG only has been tested against full type I PSG by simulating it in a sleep lab by removing the audio-video recordings from the scoring phase (Carra et al., 2015b), or testing a PSG setup in patients with a positive clinical assessment but not by comparing the results to type I PSG (Doering et al., 2008). The only customized type III setup found in the literature includes a bipolar masseter EMG, supplemented with audio recordings and sleep stage detection based on actigraphy, pulse wave and temperature recordings (Mizumori et al., 2009). However, the accuracy of this setup has not been verified against PSG. A comparison of the most prominent and/or most widely tested devices of different PSG types can be found in Table 8.
The only study to compare any sort of type II PSG for SB assessment against an attended type I PSG was conducted as a simulated case, where the sleep data gathered with type I PSG was scored with and without audio-video recordings (Carra et al., 2015b). The comparison between scoring with and without audio-video recordings resulted in a good intra-class correlation (ICC) between the two methods (0.91), even though the MMA event index was overestimated by 23.8% in the case of no audio-video (Carra, Huynh and Lavigne, 2015). In particular, the tonic type MMA seemed to be overestimated as it was easily mistaken for other activities e.g. swallowing (Carra et al., 2015b). Carra et al. discussed that the OFA or OMA could be distinguished from MMA especially well with video recordings, but unfortunately they did not evaluate the performance of the utilization of only audio recordings (Carra et al., 2015b). Video is difficult to implement in the home environment (Bruyneel and Ninane, 2014), but the inclusion of a supplementary or embedded microphone is straightforward in the PSG setup (Carra et al., 2013; Huynh et al., 2016). Arguably, there is the potential for the use of audio to distinguish between the MMA and OFA or OMA, but unfortunately there are no comparisons with the type I PSG with audio-video.
One can speculate that if the recording should be conducted in a familiar home envirornment, then the FNE should have less effect on the accuracy of the
31227203_UEF_Vaitoskirja_NO_351_Tomi_Miettinen_LUMET_sisus_19_10_02.indd 70 02/10/2019 7.48
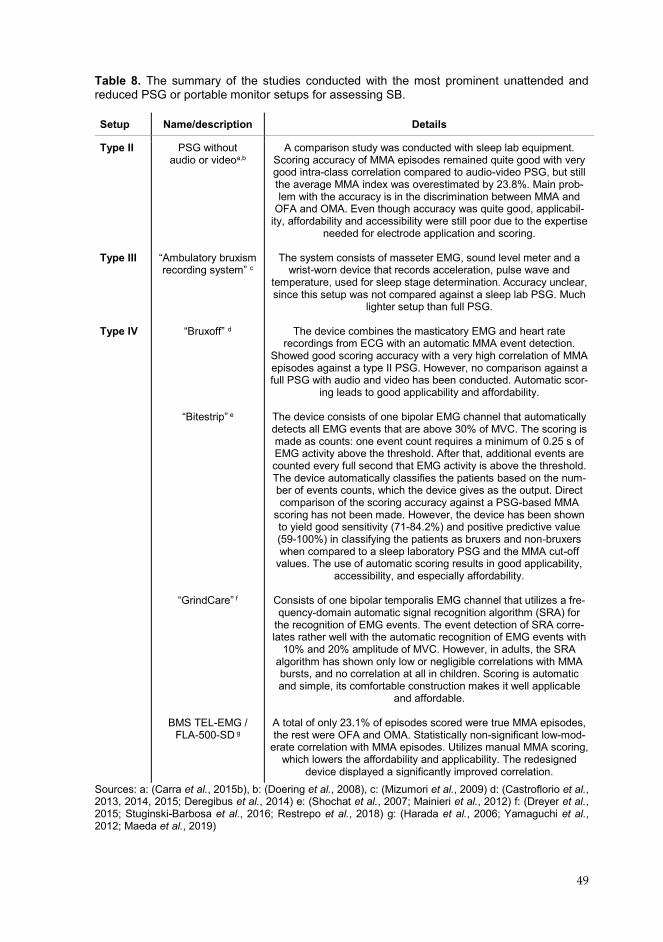
49
Table 8. The summary of the studies conducted with the most prominent unattended and reduced PSG or portable monitor setups for assessing SB.
Sources: a: (Carra et al., 2015b), b: (Doering et al., 2008), c: (Mizumori et al., 2009) d: (Castroflorio et al., 2013, 2014, 2015; Deregibus et al., 2014) e: (Shochat et al., 2007; Mainieri et al., 2012) f: (Dreyer et al., 2015; Stuginski-Barbosa et al., 2016; Restrepo et al., 2018) g: (Harada et al., 2006; Yamaguchi et al., 2012; Maeda et al., 2019)
Setup Name/description Details
Type II Type III Type IV
PSG without audio or videoa,b
“Ambulatory bruxism recording system” c
“Bruxoff” d
“Bitestrip” e
“GrindCare” f
BMS TEL-EMG /
FLA-500-SD g
A comparison study was conducted with sleep lab equipment. Scoring accuracy of MMA episodes remained quite good with very good intra-class correlation compared to audio-video PSG, but still the average MMA index was overestimated by 23.8%. Main prob-lem with the accuracy is in the discrimination between MMA and
OFA and OMA. Even though accuracy was quite good, applicabil-ity, affordability and accessibility were still poor due to the expertise
needed for electrode application and scoring.
The system consists of masseter EMG, sound level meter and a wrist-worn device that records acceleration, pulse wave and
temperature, used for sleep stage determination. Accuracy unclear, since this setup was not compared against a sleep lab PSG. Much
lighter setup than full PSG.
The device combines the masticatory EMG and heart rate recordings from ECG with an automatic MMA event detection.
Showed good scoring accuracy with a very high correlation of MMA episodes against a type II PSG. However, no comparison against a full PSG with audio and video has been conducted. Automatic scor-
ing leads to good applicability and affordability.
The device consists of one bipolar EMG channel that automatically detects all EMG events that are above 30% of MVC. The scoring is made as counts: one event count requires a minimum of 0.25 s of EMG activity above the threshold. After that, additional events are counted every full second that EMG activity is above the threshold. The device automatically classifies the patients based on the num-ber of events counts, which the device gives as the output. Direct comparison of the scoring accuracy against a PSG-based MMA
scoring has not been made. However, the device has been shown to yield good sensitivity (71-84.2%) and positive predictive value (59-100%) in classifying the patients as bruxers and non-bruxers when compared to a sleep laboratory PSG and the MMA cut-off
values. The use of automatic scoring results in good applicability, accessibility, and especially affordability.
Consists of one bipolar temporalis EMG channel that utilizes a fre-quency-domain automatic signal recognition algorithm (SRA) for
the recognition of EMG events. The event detection of SRA corre-lates rather well with the automatic recognition of EMG events with
10% and 20% amplitude of MVC. However, in adults, the SRA algorithm has shown only low or negligible correlations with MMA bursts, and no correlation at all in children. Scoring is automatic and simple, its comfortable construction makes it well applicable
and affordable.
A total of only 23.1% of episodes scored were true MMA episodes, the rest were OFA and OMA. Statistically non-significant low-mod-
erate correlation with MMA episodes. Utilizes manual MMA scoring, which lowers the affordability and applicability. The redesigned
device displayed a significantly improved correlation.
31227203_UEF_Vaitoskirja_NO_351_Tomi_Miettinen_LUMET_sisus_19_10_02.indd 71 02/10/2019 7.48
50
recording, as seems to be the case with sleep-related FNE (Le Bon et al., 2001; Herbst et al., 2010). However, the night-to-night MMA index variability has been found to be slightly higher in the home setting, as the mean coefficient of variation (CV) is 37% in type II PSG (Van Der Zaag et al., 2008), whereas in type I PSG, it is in the range of 22-30% (Dal Fabbro and Tufik, 1996; Lavigne et al., 2001; Hasegawa et al., 2013). Patient compliance is usually improved when sleeping in their own homes, making the type II PSG more applicable than its type I counterpart (Carra et al., 2013; Bruyneel and Ninane, 2014). The costs are also lower compared to a sleep laboratory, as the patient does not need hospitalization, the infrastructure costs are lower (no need for a separate, adequately equipped room) and no need for a night-shift technician (Bruyneel and Ninane, 2014).
However, with the unattended recordings there is also an increased risk for recording failures. The failure rate of recordings (requiring repetition) in type II PSG conducted for the assessment of SDB is typically between 4 – 20%, whereas in the sleep laboratory, the failure rate is between 0 – 5% (Bruyneel and Ninane, 2014). The failure rate is lower when a technician applies the electrodes and other devices at the patient’s home (between 4% and 8%) and higher (as high as 20%) when the appliance is conducted at a hospital and the patient returns home for sleeping with the electrodes and devices attached (Bruyneel and Ninane, 2014). The failure of the recording usually results in the need for repetition, which hinders the improvements in the applicability and affordability (Bruyneel and Ninane, 2014).
Overall, the type II PSG has slightly better applicability when compared to the type I as it is not performed in a sleep laboratory, patient compliance is better, and it is cheaper. However, the electrode appliance still requires the expertise of a sleep technician, as the success of the recording and signal quality depends greatly on the preparation of the skin, i.e. there should be low enough impedance values in the electrode-skin interface as well as the exact positioning of the electrodes. Another factor affecting the applicability, affordability and accessibility is the lack of reliable automated means to assess the sleep data, and as the scoring is traditionally done manually, this results in a need for special expertise in the staff assessing the recordings. These two issues are probably the prime reasons that inhibit the use of type II devices in dental clinics and in research. Nevertheless, the type II PSG has good scoring accuracy compared to a type I PSG with only a slight overestimation in MMA index that possibly could be overcome by either taking this overestimation into account in the assessment (Carra et al., 2015b) or by potentially improving the MMA scoring accuracy with audio recordings. Actually, this would make the type II as a good starting point for developing more applicable, affordable and accessible recording setups that should have a guaranteed good accuracy.
The use of portable monitors (types III-IV) is one solution to the low applicability, affordability and accessibility of PSG. Their applicability is much higher, as the devices are so simple to use that the patients can self-apply the devices in their home with minimal instructions and/or training (Castroflorio et al., 2013; Deregibus et al.,
31227203_UEF_Vaitoskirja_NO_351_Tomi_Miettinen_LUMET_sisus_19_10_02.indd 72 02/10/2019 7.48

51
2014; Stuginski-Barbosa et al., 2016; Restrepo et al., 2018). Furthermore, most of the devices utilize automatic MMA event detection, which removes the need for manual scoring (Mainieri et al., 2012; Castroflorio et al., 2013; Dreyer et al., 2015). These factors also minimize the expense of the recording, as no technicians are required to apply the electrodes or to supervise sleep stage and event scoring, and the conclusions on the patient’s condition are easy to understand thanks to the simple output from the device (Mainieri et al., 2012). The construction of the devices is typically rather simple, and they are usually wholly or partially disposable (Mainieri et al., 2012; Castroflorio et al., 2015) and inexpensive to manufacture, reducing the costs and making the devices even more affordable. These simple devices could potentially even be distributed in local dental clinics, thus making them easily accessible. Furthermore, the simple and inexpensive devices allow the recordings to last for several nights, which is a very useful feature in the research setting (Stuginski-Barbosa et al., 2016; Restrepo et al., 2018).
However, based on the current scientific knowledge, the accuracy of many of these devices suffers greatly from the oversimplification of the recording setup. The devices have difficulties in discriminating between patients with high and low levels of MMA, and the MMA event scoring accuracy may be at an unacceptable level as the devices are unable to recognize the differences between MMA, OFA and OMA (Shochat et al., 2007; Mainieri et al., 2012; Yamaguchi et al., 2012; Stuginski-Barbosa et al., 2016; Restrepo et al., 2018). Furthermore, due to the fact that the devices record only one or two parameters, it is impossible to make a comprehensive analysis of the associated co-morbidities, or to discriminate between AB and SB. The TST possibly needs to be replaced with a longer TRT, which may alter the MMA index. Due to these restrictions, the type IV devices are considered useful only as a screening tool for the occurrence of SB, not as a comprehensive method of assessing the level of MMA (Mainieri et al., 2012; Deregibus et al., 2014).
The most promising of the type IV devices is arguably the Bruxoff device (Castroflorio et al., 2013, 2014, 2015; Deregibus et al., 2014). It records masseter EMG bilaterally with disposable, adhesive concentric AgCl electrodes and automatically recognizes MMA events based on the detection of concomitant arousals in the ECG signal (Castroflorio et al., 2013). Compared against a type II PSG, it has good sensitivity (91.6%) and specificity (84.6%) in classifying patients either as bruxers or non-bruxers when four MMA episodes/h is used as the threshold (Castroflorio et al., 2014). In addition, it revealed a very good correlation (Pearson’s correlation coefficient: 0.95) with MMA events detected with the type II PSG (Castroflorio et al., 2014). Unfortunately, the accuracy of the device has not been validated against a sleep laboratory type I PSG, so the actual ability to distinguish between MMA and non-pathological OFA and OMA is unknown (Castroflorio et al., 2014). Furthermore, the failure rate of the Bruxoff recordings has not been explicitly reported. However, in the first study presenting results of Bruxoff home recordings, the authors reported that 8% of subjects did not finish the recording, as 4 out of 50 subjects either felt the
31227203_UEF_Vaitoskirja_NO_351_Tomi_Miettinen_LUMET_sisus_19_10_02.indd 73 02/10/2019 7.48
52
device was uncomfortable to sleep with (one subject), or interrupted the recording after less than 4 hours from its onset (Castroflorio et al., 2013). The 8% failure rate would mean that the reliablity of Bruxoff was approximately at the same level as type II PSG. Nevertheless, its true technical reliablity is still unknown.
Another type IV device with some promising accuracy results is the Bitestrip (Scientific Laboratory Products, Ltd., Tel Aviv, Israel) (Shochat et al., 2007; Mainieri et al., 2012). The small device (7 cm x 2 cm, 4 g) consists of two self-applicable EMG electrodes (designed to be attached on the left masseter) and an embedded analysis unit that automatically detects SB events (Shochat et al., 2007). The device is designed to be used in a home setting and it is self-applicable by the patients (Isa Kara et al., 2017). Instead of confirming the EMG events as MMA with the help some other recorded parameter such as done with the Bruxoff, Bitestrip merely counts the EMG bursts as counts with a maximum of 1 second duration (Table 8), allowing a very simple construct and thus applicability for the device (Shochat et al., 2007). The device has displayed good sensitivity (71-84.2%) and positive predictive value (59-100%) in classifying the patients as either bruxers or non-bruxers when compared to a sleep laboratory PSG, but only low to moderate agreement when trying to classify patients based on the severity of SB (Shochat et al., 2007; Mainieri et al., 2012). No published data on the failure rate of the recordings is available.
Two other type IV self-applicable devices that have been tested for the assessment of SB are GrindCare (Medotech, Herlev, Denmark) with an automatic event detection, and BMS TEL-EMG (Harada Electronics Industry Ltd., Sapporo, Japan), a basic two-channel EMG with manual scoring, but both with unsatisfactory accuracy results (Yamaguchi et al., 2012; Stuginski-Barbosa et al., 2016; Restrepo et al., 2018). Both of these devices are unable to distinguish the MMA from OFA and OMA (Manfredini et al., 2014; Restrepo et al., 2018). The GrindCare, which has an automatic frequency domain-based MMA detection algorithm, shows only a low or negligible correlation with the number MMA bursts compared to a type I PSG (Dreyer et al., 2015; Stuginski-Barbosa et al., 2016; Restrepo et al., 2018). The failure rate for GrindCare recordings was 12% when GrindCare recordings were conducted in fifty children aged 8 – 12 and the parents applied the recording device with the help of video and illustrated instructions (Restrepo et al., 2018). No data could not be found about the failure rate when adults were using GrindCare. In the BMS TEL-EMG device, the MMA recognition is based on manual scoring, and apparently only 23.1% of all scored events were actually MMA, resulting in an unacceptable overestimation of the MMA index (Yamaguchi et al., 2012). With an redesigned device (FLA-500-SD), the same group was able to produce a good MMA index correlation with the standard PSG with audio and video footage (Pearson’s correlation coefficient: 0.77), even though the MMA indices were still overestimated (Maeda et al., 2019). To conclude, some of these single channel devices might be feasible for the recording of EMG activity generally, but their MMA detection accuracy is not good enough for
31227203_UEF_Vaitoskirja_NO_351_Tomi_Miettinen_LUMET_sisus_19_10_02.indd 74 02/10/2019 7.48
53
the more demanding SB assessments e.g. as required in research settings (Manfredini et al., 2014).
In addition to those devices that are based on recording bioelectrical signals from the surface of the skin, there is another group of devices for instrumental SB assessment: the intra-oral appliances (Nishigawa et al., 2001; Baba et al., 2003; Ommerborn et al., 2005; Hokama et al., 2017). One of these appliances is based on an occlusal disclosure sheet, from which pieces of paint become detached during the nocturnal biting (Hokama et al., 2017). Another example of intraoral assessment are the piezoelectic plate-based bite-force analyzers (Nishigawa et al., 2001; Baba et al., 2003). However, a severe problem with these devices is that when a patient starts using any intra-oral device, it clearly inhibits the MMA from occurring for a couple of weeks (Harada et al., 2006). For this reason, these devices may severly influence the activity they are trying to measure and therefore their reliability is highly questionable.
Even though the type IV devices, especially Bruxoff, might prove very useful tools for the instrumental screening of SB, there still is not any method which is sufficiently applicable, affordable or accessible to allow the comprehensive, accurate assessment of SB when the presence of co-morbidities is suspected. Furthermore, in more demanding research settings e.g. where there may be the presence of several health conditions as well as SB or where the consequences of SB or efficacy of management approaches are being assessed, it would be arguably beneficial if there was an easily convertible recording setup with high availability. Type I PSG is definitely not feasible for these purposes, at least in a large scale, due to its high costs and the need to confine the patient to the hospital environment, but type II PSG has great potential, especially if some of its problems with the applicability, affordability and accessibility could be resolved. Based on the literature review in this chapter, in order that type II PSG could overcome these problems, there are two steps that should be taken:
1) The need for special expertise in electrode application and scoring should be
reduced or removed. This could be achieved by a) simplifying the application of the electrodes, and b) automating the MMA event scoring, without losing too much technical reliablity and scoring accuracy.
2) If either automatic or manual scoring is utilized, their accuracy should be
ensured. The effect of utilizing audio recordings in the recognition of MMA should be assessed.
Furthermore, according to the literature review, the following questions require attention whenever any unattended and reduced setup for sleep studies is being introduced:
31227203_UEF_Vaitoskirja_NO_351_Tomi_Miettinen_LUMET_sisus_19_10_02.indd 75 02/10/2019 7.48
54
3) What is the technical reliablity and the failure rate of the recordings? 4) What is the night-to-night variability of the recordings, is there a noticable
FNE present, and how do these affect the SB assessment? However, it should not be overlooked that the main factor for the justification for the use of type II PSG, is its potential to reach the goals achieveable in a type I sleep lab PSG in the context of SB assessment, but in the more patient-friendly home environment. It should be ensured whenever type II PSG is used that the three following factors related to the performance of the type I PSG should be achieved to the fullest extent:
5) Accurate detection of SB-related MMA events and distinguishing them from
orofacial movements or other muscular activities and AB-related MMA 6) Accurate determination of MMA index with the presence of TST assessment
by sleep stage scoring 7) Detection of possibly management-requiring co-morbidities and other
conditions, as well as the determination of whether SB is primary or secondary, since this fact affects the management decisions
Later on, these seven points will be the basis for guiding the process of developing of the type II-based solution for SB assessment and thus for fulfilling the aims of this thesis.
31227203_UEF_Vaitoskirja_NO_351_Tomi_Miettinen_LUMET_sisus_19_10_02.indd 76 02/10/2019 7.48
55
5 SCREEN-PRINTED ELECTRODE SETS
As has been stated on several occasions in the previous chapters, there are several obstacles to the widespread utilization of biosignal electrodes in situations when there are no medical personnel available with the expertise for applying the electrodes. The application of the most generally used cup electrodes is very cumbersome and takes a long time (Kolls et al., 2012). Furthermore, the electrodes are susceptible to become detached and are subject to movement artifacts if the application has not been done properly (Peacock et al., 2014), all of which prevent the type II PSG from gaining the potential it could have in the accurate detection of sleep disorders.
However, PSG recordings are not the only situation where there is a need for a more simple, easily applicable solution for biosignal recordings. Emergency room (ER), intensive care units (ICU), ambulances and primary health care units are all locations where there is a need for EEG recording but the personnel lacks expertise in applying EEG electrodes or there may be no recording equipment available due to the bulkiness of devices, their costs and inconvenience (Myllymaa et al., 2013a). Especially patients with altered mental state are considered to be individuals that would benefit greatly from an early diagnosis of the possibly underlying disorder e.g. epilepsy; in such cases it would be highly desirable to be able to undertake EEG recordings even in ER and ICU (Myllymaa et al., 2013b). The role of EEG is essential in ruling out status epilepticus, as this cannot be detected in any other imaging modality (Myllymaa et al., 2013b).
From these starting points, it was decided to develop an EEG electrode set for emergency use; this was started as a joint research project of the Department of Clinical Neurophysiology of Kuopio University Hospital and the Department of Applied Physics of the University of Eastern Finland in the early 2010s (Myllymaa et al., 2013a, 2013b). A screen-printed, hydrogel-covered electrode set was developed as a result of that project, and it has been the starting point also for the research conducted for this thesis. It was hypothesized that this technology would enable a more accurate, applicable, affordable and accessible type of II PSG based instrumental assessment of SB. 5.1 MATERIALS AND DESIGN The development of the original emergency EEG electrode set began with the choice of material design. Hydrogel-covered Ag-AgCl electrodes were chosen for several reasons, i.e. in the development process their selection was dictated mainly by their electrical performance, ease of manufacturing and the user environment. Predominantly, Ag-AgCl was chosen due to its excellent conductive properties, its
31227203_UEF_Vaitoskirja_NO_351_Tomi_Miettinen_LUMET_sisus_19_10_02.indd 77 02/10/2019 7.48
56
ease of handling in manufacturing processes, being inexpensive and containing no toxic materials (Neuman, 1995). Due to difficulties in utilizing electrodes that need a separate gel or paste, hydrogel was chosen to improve the contact between the electrode and the skin, because of its ease of use and good electrical conductive properties (Myllymaa et al., 2013a). Hydrogels are self-adhesive and provide a firm mechanical contact with the skin, especially when supported e.g. with adhesive foam tapes around the hydrogels (which also prevents the hydrogels from drying) (Lepola et al., 2014b). The conductive properties of the hydrogel membrane are enhanced by the ions contained within the membrane (Myllymaa et al., 2013a). These ions function in a similar fashion as the ions in the electrode gels used with cup electrodes (Alba et al., 2010; Myllymaa et al., 2013a).
The development continued with a proof-of concept study by comparing the electrical performance of the hydrogel and silver wire electrodes in EEG recordings with the commercial cup electrodes and other pre-gelled electrodes (Myllymaa et al., 2013b). After testing the performance of this preliminary electrode set prototype with patients of various clinical problems (Lepola et al., 2015), the actual screen-printed electrode set was introduced (Lepola et al., 2014b).
Screen-printing is the process of depositing non-ferromagnetic substances on top of a low-cost polymeric substrate, such as polyester (Tymecki et al., 2006; Myllymaa et al., 2013b). Ag and AgCl can be used in screen-printing, which is important when considering the production of biosignal electrodes with superior electrical performance (Tymecki et al., 2006; Myllymaa et al., 2013b). Furthermore, screen-printing is well suited for economical mass production of highly flexible and thin disposable electrode arrays with varying shapes, areas and inter-electrode distances (Tymecki et al., 2006; Myllymaa et al., 2013a; Lepola et al., 2014b). Screen-printing technology has already been utilized for other purposes e.g. in producing blood glucose monitoring systems and bi-spectral index electrodes (Newman and Turner, 2005; Bruhn et al., 2006). Furthermore, screen-printed electrodes have been successfully tested in around-the-ear EEG recordings for the assessment of sleep quantity and quality (Debener et al., 2015; Mikkelsen et al., 2019). When screen-printed electrodes are combined with hydrogel, the result is a highly adhesive, flexible and lightweight electrode structure (Myllymaa et al., 2013a). This sort of electrode set conforms to the irregular skin surface better than large, rigid electrodes and thus hypothetically, carries a lower risk for motion artifacts and electrode detachment (Myllymaa et al., 2013b; Lepola et al., 2014b). This would be highly beneficial in situations where the patient is lying down for long periods of time with the risk that the electrodes can become detached while he/she makes movements parallel to the skin surface e.g. while sleeping (Peacock et al., 2014).
The structure of the emergency EEG set is presented in Figure 10. The electrodes are embedded in a flexible polyester film (Lepola et al., 2014b). The electrodes and conduction traces are printed on top of the film with Ag and AgCl inks in a sheet silk screen-printing unit (Lepola et al., 2014b). In order to achieve good non-polarizable
31227203_UEF_Vaitoskirja_NO_351_Tomi_Miettinen_LUMET_sisus_19_10_02.indd 78 02/10/2019 7.48
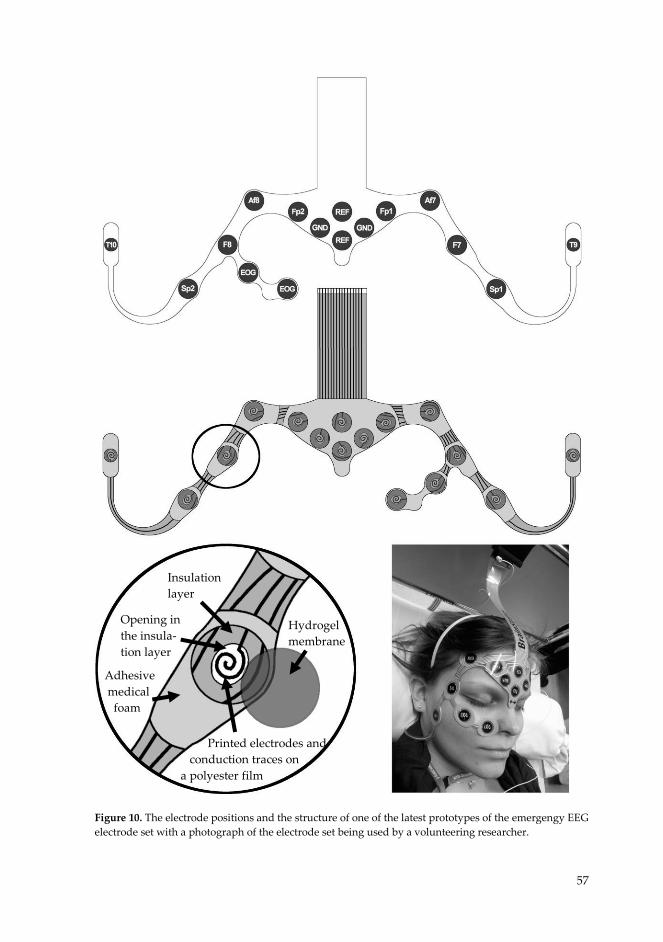
57
Figure 10. The electrode positions and the structure of one of the latest prototypes of the emergengy EEG electrode set with a photograph of the electrode set being used by a volunteering researcher.
Insulation layer
Opening in the insula- tion layer
Adhesive medical foam
Hydrogel membrane
Printed electrodes and conduction traces on a polyester film
31227203_UEF_Vaitoskirja_NO_351_Tomi_Miettinen_LUMET_sisus_19_10_02.indd 79 02/10/2019 7.48
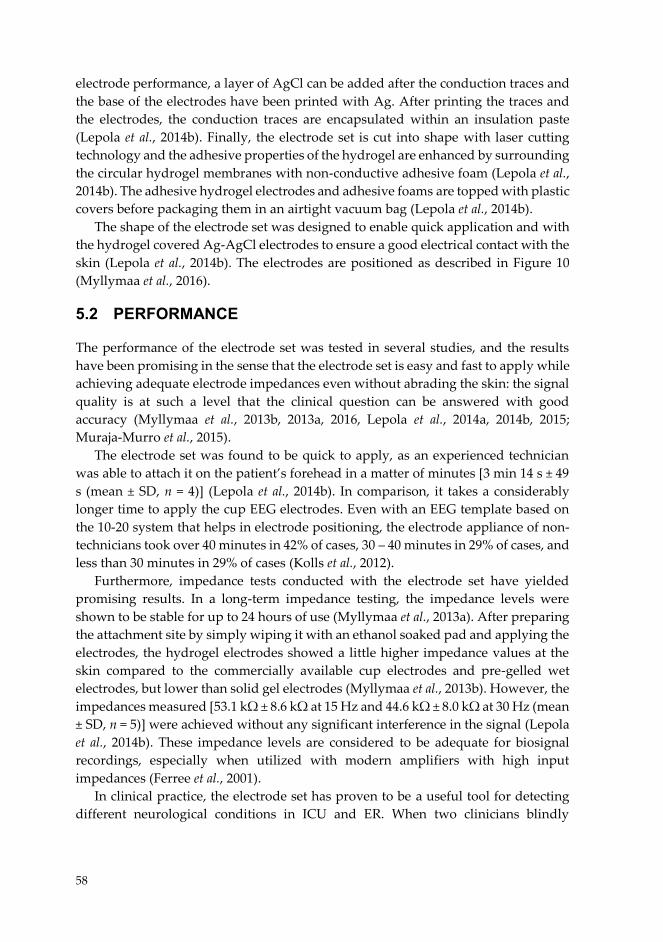
58
electrode performance, a layer of AgCl can be added after the conduction traces and the base of the electrodes have been printed with Ag. After printing the traces and the electrodes, the conduction traces are encapsulated within an insulation paste (Lepola et al., 2014b). Finally, the electrode set is cut into shape with laser cutting technology and the adhesive properties of the hydrogel are enhanced by surrounding the circular hydrogel membranes with non-conductive adhesive foam (Lepola et al., 2014b). The adhesive hydrogel electrodes and adhesive foams are topped with plastic covers before packaging them in an airtight vacuum bag (Lepola et al., 2014b).
The shape of the electrode set was designed to enable quick application and with the hydrogel covered Ag-AgCl electrodes to ensure a good electrical contact with the skin (Lepola et al., 2014b). The electrodes are positioned as described in Figure 10 (Myllymaa et al., 2016). 5.2 PERFORMANCE…….
The performance of the electrode set was tested in several studies, and the results have been promising in the sense that the electrode set is easy and fast to apply while achieving adequate electrode impedances even without abrading the skin: the signal quality is at such a level that the clinical question can be answered with good accuracy (Myllymaa et al., 2013b, 2013a, 2016, Lepola et al., 2014a, 2014b, 2015; Muraja-Murro et al., 2015).
The electrode set was found to be quick to apply, as an experienced technician was able to attach it on the patient’s forehead in a matter of minutes [3 min 14 s ± 49 s (mean ± SD, n = 4)] (Lepola et al., 2014b). In comparison, it takes a considerably longer time to apply the cup EEG electrodes. Even with an EEG template based on the 10-20 system that helps in electrode positioning, the electrode appliance of non-technicians took over 40 minutes in 42% of cases, 30 – 40 minutes in 29% of cases, and less than 30 minutes in 29% of cases (Kolls et al., 2012).
Furthermore, impedance tests conducted with the electrode set have yielded promising results. In a long-term impedance testing, the impedance levels were shown to be stable for up to 24 hours of use (Myllymaa et al., 2013a). After preparing the attachment site by simply wiping it with an ethanol soaked pad and applying the electrodes, the hydrogel electrodes showed a little higher impedance values at the skin compared to the commercially available cup electrodes and pre-gelled wet electrodes, but lower than solid gel electrodes (Myllymaa et al., 2013b). However, the impedances measured [53.1 kΩ ± 8.6 kΩ at 15 Hz and 44.6 kΩ ± 8.0 kΩ at 30 Hz (mean ± SD, n = 5)] were achieved without any significant interference in the signal (Lepola et al., 2014b). These impedance levels are considered to be adequate for biosignal recordings, especially when utilized with modern amplifiers with high input impedances (Ferree et al., 2001).
In clinical practice, the electrode set has proven to be a useful tool for detecting different neurological conditions in ICU and ER. When two clinicians blindly
31227203_UEF_Vaitoskirja_NO_351_Tomi_Miettinen_LUMET_sisus_19_10_02.indd 80 02/10/2019 7.48
59
evaluated 12 patients based on their referral without any prior knowledge of the findings, they agreed with their own findings made with standard set in 11 (clinician #1) and 12 (clinician #2) times out of 12 (Lepola et al., 2015). Even though the one recording for which that clinician #1 did not agree upon the findings was riddled with a powerline artifact (Lepola et al., 2015), generally the technical quality in the majority of recordings has been very good. Only 2 out of 100 recordings conducted in another study were partially rated as unsatisfactory due to artifacts, and even in these two cases, the analysis regarding the presence of status epilepticus could nonetheless be done (Muraja-Murro et al., 2015).
As the applicability of the electrode set was exceptionally quick and the quality of the recordings was good even when the electrode attachment sites were only wiped with an ethanol soaked pad, and since the set had been proven to possess clinical relevance, it was hypothesized that the electrode set could utilized also in type II PSG when supplemented with chin EMG electrodes. Hypothetically the electrode set would be so easy to apply that the patients could even do it by themselves in their homes without risking the quality of the recordings. The proof of concept for the accuracy in sleep staging was demonstrated in a study that compared a series (n = 31) of attended PSG recordings obtained with the electrode set against concomitant recordings with standard type I PSG (Myllymaa et al., 2016). There was found to be no statistically significant difference in the performance between the electrode set and the standard type I PSG for assessing TST, sleep efficiency or sleep latencies of any sleep stage (Myllymaa et al., 2016). For all sleep variables, there was a significant correlation between the electrode set PSG and standard PSG (0.47 – 0.94, p < 0.001) and the mean ± SD for patient-wise epoch-by-epoch agreement was 79.4% ± 8.7% (Myllymaa et al., 2016). The technical quality of the recordings was very good, as the scorers considered only 0.49% and 0.99% of all the 30 second-long epochs as unscorable and these unscorable epochs were found only in 3 out of 31 recordings (Myllymaa et al., 2016). The study revealed that the electrode set could be utilized for the recording of the TST and SE and possibly for the adequate detection of sleep structure (Myllymaa et al., 2016).
To conclude, the electrode set has the potential for solving the problem of the applicability, affordability and accessibility without losing to any meaningful extent the accuracy of type II PSG conducted for SB assessment. The screen-printing technology allows easy modification of the design of the electrode set and thus the inclusion of EMG electrodes that record the activity of masticatory muscles. The electrode set has been proven to be quick and simple to apply while still yielding good quality EEG recordings that could be used to detect clinically relevant health conditions. As no expertise for electrode attachment is needed with the electrode set and screen-printing is a cost-effective way to manufacture the electrode sets, the affordability could also be improved. Both of these factors also affect the accessibility, supported by the fact that electrode set could be easily modified to accompany any PSG recorder, making it available for any research environment or service provider.
31227203_UEF_Vaitoskirja_NO_351_Tomi_Miettinen_LUMET_sisus_19_10_02.indd 81 02/10/2019 7.48

31227203_UEF_Vaitoskirja_NO_351_Tomi_Miettinen_LUMET_sisus_19_10_02.indd 82 02/10/2019 7.48
61
6 AIMS OF THE THESIS
The overarching aim of this doctoral thesis is to evaluate and potentially improve the suitability of the screen-printed ambulatory electrode set for the assessment of SB in unattended type II PSG that is self-applied by the patients. The motivation of this investigation was driven by the need for an accurate, applicable, affordable and accessible method to make an SB assessment, and the fact that the previously presented results of the original investigations on emergency EEG electrode set indicated that it has the potential to overcome many of the problems that prevent the type II PSG from becoming more widely utilized. The research hypothesis on which this thesis is based is that the technology used in the original emergency EEG electrode set is suitable and could further be utilized for the accurate assessment of SB as part of type II PSG.
In order to accomplish the aim of the thesis, the following four aims and related research questions were set to guide the suitability assessment and the development process, based on the conclusions drawn at the end of chapter 4:
1) To determine the diagnostic accuracy of the original EEG electrode set as a proof-of-concept study: How well does the electrode set-based PSG recordings perform in the classification of patients in groups with SB and without SB when compared against the gold standard type I PSG? (Study I)
2) To assess the MMA scoring accuracy of the type II PSG with the electrode set supplemented with audio recordings: How does the scoring accuracy with electrode set compare to other unattended and reduced PSG and portable monitor setups and the gold standard type I PSG? (Study II)
3) To evaluate the applicability of the electrode set when re-designed to be self-applied by the patients in unattended type II PSG: What is the technical reliability and failure rate of the recordings? (Study III)
4) To assess the possible need for the repetition of recordings: Is there a detectable FNE and what is the night-to-night variablity of SB in self-applied type II PSG recordings? (Study IV)
Each of these research aim-question combinations and their numbers correspond to an article (notated with Roman numerals I-IV) upon which the results of this thesis are mainly based. Aims and questions 1 and 2 are related to the confirmation of the accuracy of the type II PSG supplemented with the electrode set. The scoring accuracy needed to be high enough to justify the use of the electrode set and to
31227203_UEF_Vaitoskirja_NO_351_Tomi_Miettinen_LUMET_sisus_19_10_02.indd 83 02/10/2019 7.48
62
conduct further research – otherwise there would be no point to continue with this technology – at least without a major redesign. Aims and questions 3 and 4 deal more broadly with factors related to applicability (the reliablity of the self-applied recordings), affordability (requirements for having recordings lasting several nights) and accessibility (the performance of the electrode set in everyday clinical use) – but also in one form of accuracy (night-to-night variablity and the possible presence of FNE).
In this thesis, the evaluation of the performance of the electrode set has mainly focused on its accuracy and technical reliablity. Even though the need to reduce the requirements for medical expertise in the time-consuming scoring process is also acknowledged, in this thesis only manual scoring methods have been utilized and their accuracy is evaluated.
31227203_UEF_Vaitoskirja_NO_351_Tomi_Miettinen_LUMET_sisus_19_10_02.indd 84 02/10/2019 7.48
63
7 METHODS
The four studies included in this thesis (I - IV) are all based on the data that was gathered as a part of series of PSG recordings conducted in a sleep laboratory (I and II) or in the home environment (III and IV) from volunteering test subjects. The data includes the recorded PSG data, the visual scoring of MMA, arousal events, and sleep stages based on the recordings, an estimation of the technical quality of the recordings, and the data gathered from the subjects in the form of questionnaires and interviews. Three designs of the electrode set were utilized in the studies: the original emergency EEG electrode set (I and II), and the first (III) and the second (III and IV) version of the newly designed electrode set to be self-applicable by patients in the home environment.
7.1 SUBJECTS……………….
All subjects involved in the studies I - IV were volunteers. Table 9 presents a summary of the participating study populations, the inclusion/exclusion criteria in each study, the number of included recordings, and the demographics of the included subjects. All subjects that attended the PSG recordings provided a signed, written informed consent after receiving the information regarding study protocol in oral and written form. The study protocols regarding all the studies in this thesis were reviewed and approved by the Research Ethics Committee of the Hospital District of Northern Savo, Kuopio, Finland (favorable opinion: 34/2013) and the permission for the research use of the electrode set was obtained from the National Supervisory Authority for Welfare and Health (Valvira, 220/2013).
The first set of recordings (studies I and II) was conducted as a one-night study in a sleep laboratory during the years 2013 and 2014. A self-reported sleep bruxers group (n = 22) as well as a group of self-claimed non-sleep bruxers (n = 9) based on an interview were recruited in the studies.
In study I, two equal-sized groups of bruxers and non-bruxers (i.e. healthy controls) were formed. The use of equal sized groups was well justified, as it is common in studies where the validity of a diagnostic test is determined, as it eases the evaluation of the sensitivity and specificity of that diagnostic test (Palinkas et al., 2016b). The exclusion criteria for the subjects in this study was that either audio or video footage (or both) were missing from the recording. This was the case in the recordings of 9 volunteer subjects, of which three were non-bruxers. As the non-bruxer group was smaller, it was determined that the size of both groups should be six subjects.
31227203_UEF_Vaitoskirja_NO_351_Tomi_Miettinen_LUMET_sisus_19_10_02.indd 85 02/10/2019 7.48

64
Table 9. The number of volunteered test subjects that attended the recordings, the inclusion/exclusion criteria for each study, the number of included and excluded recordings and the demographics of the included volunteers.
* = median (interquartile range), ** = mean ± standard deviation
In study II, the recordings from the same population as examined in study I were
used to assess the MMA event scoring accuracy. There was no need for two equal sized groups, and thus all the subjects that passed the exclusion criteria were included. Due to the nature of the study, the exclusion criteria were stricter than in study I (Table 9). All the subjects included in study I were also included in study II.
Study No. of
participating volunteers
Inclusion/exclusion criteria
No. of included and excluded
recordings
Demographics of the included
volunteers
I II III IV
31
31
37 (16 in Stage 1, 18 in Stage 2, and 3 volun-teers in both)
24
(three nights of recordings)
Inclusion: Two equal sized groups of self-pro-
claimed bruxers and non-bruxers (based on inter-
view)
Exclusion: Audio or video footage missing from the
recording
Exclusion: (1) Missing audio or video footage, (2) video footage not focused on facial area, (3) missing data on any channel that
was used for scoring
Inclusion: Self-reported bruxer (based on OBC questionnaire, at least
once a week)
Inclusion: Self-reported bruxer (based on OBC questionnaire, at least
once a week), daytime job with regular working hours,
regular sleep schedule
Exclusion: (1) Any ongo-ing illness, disorder or
medical condition besides SB, (2) use of any medica-tion that could affect sleep
or motor behavior, (3) smoking or excessive use
of alcohol, (4) missing more than one posterior
tooth (excluding third mo-lars), and (5) one or more missing recordings from
the series of three
Included: 12 (6 bruxers and 6
non-bruxers)
Excluded: 19 (16 bruxers,
3 non-bruxers)
Included: 19
Excluded: 12
Included: 40
Excluded: 0
Included: 48 (from 16 sub-
jects)
Excluded: 24 (from 8 subjects)
Bruxers: Age: 25 (21 – 58) years*
5 Females. 1 Male
Non-bruxers: Age: 24 (21 – 25) years*
4 Males, 2 Females
Age: 31.1 ± 12.9**
13 Female, 6 Male
Age: 39.6 ± 11.6 years**
32 Female, 5 Male
Age: 38.3 ± 9.1 years**
14 Female, 2 Male
31227203_UEF_Vaitoskirja_NO_351_Tomi_Miettinen_LUMET_sisus_19_10_02.indd 86 02/10/2019 7.48
65
In studies III and IV, two prototypes of newly designed electrode sets were tested in home PSG for the duration of one (study III) or three nights (study IV). In 2015, nineteen subjects were recruited for one night of PSG recording with the first design of the new electrode sets (stage 1) after an open call for volunteers in the intrawebs of Kuopio University Hospital and University of Eastern Finland. In 2016, eleven more volunteers were recruited in stage 2 of study III. These eleven volunteers also participated in study IV, and for that reason, three consecutive nights of recordings were obtained, although only the first recording night was assessed in stage 2 of study III. In addition, one night of recording was obtained from ten volunteers that were recruited in the dental clinic of the Unit of Specialized Oral Care in the Metropolitan Area and Kirkkonummi (Helsinki, Finland) in 2016.
As study III was intended to assess the technical reliability of the recordings made with the electrode set, all recordings were included in the assessment. The only inclusion criterion for the subjects in study III was being a self-reported bruxer (the group that would actually use the device). The self-reporting was based on the OBC questionnaire, according to which the subject was classified as a self-reported bruxer when he/she answered positively about having clenched or ground teeth when asleep at least once a week during the last month, based on any information.
Thirteen new volunteers were recruited for study IV in 2017 with open calls, similarly as done in study III. In order to draw conclusions of the presence of FNE and to assess the night-to-night variability in the presence of self-reported primary SB, it was essential to reduce the effects of co-morbidities and other confounding factors that might affect the results, such as an irregular sleep schedule. Based on the literature review, the new factors included in the inclusion/exclusion criteria were considered to possibly exert an effect on the FNE or the nature of the bruxism activity (Table 9). Furthermore, to ease the statistical interpretation of the results, only those subjects with a successful series of three consecutive recordings were included. This led to the inclusion of a total of 16 subjects, with 48 recordings. Eight subjects and 24 recordings had to be excluded.
7.2 DATA ACQUISITION The PSG recordings utilized in studies I and II were conducted in the sleep laboratory and in studies III and IV in the home environment. The distinctive set of recorded channels and used settings forms a recording montage that is unique for every study or recording environment and has been described in more detail in the original pub-lications. 7.2.1 Sleep Laboratory Polysomnography The full PSG recordings for studies I and II were conducted in the sleep laboratory of the Department of Clinical Neurophysiology, Diagnostic Imaging Center, Kuopio University Hospital (Kuopio, Finland). Concomitant recordings with the standard
31227203_UEF_Vaitoskirja_NO_351_Tomi_Miettinen_LUMET_sisus_19_10_02.indd 87 02/10/2019 7.48

66
type I PSG montage and the electrode set-based PSG montage were conducted to allow a direct comparison between these two set-ups.
The standard Ag-AgCl cup electrodes (Neuroline 726, Ambu A/S, Ballerup, Den-mark) were applied to obtain the AASM recommended unipolar EEG and EOG, and bipolar chin EMG montage (see chapter 3.3.). In addition, a bipolar EMG montage was obatained from the masseter and sternocleidomastoid muscles with Ag-AgCl self-adhesive solid gel electrodes (Neuroline 700, Ambu A/S, Ballerup, Denmark), and temporal muscles with Ag-AgCl cup electrodes (Neuroline 726), all bilaterally. A technician applied the original emergency EEG electrode set (BrainStatus, Bittium Biosignals Oy, Kuopio, Finland) by preparing the electrode application sites of the electrode set with an ethanol soaked pad, in order to simulate the preparation that would take place in the patient’s home environment. With the cup electrodes, the skin was also abraded. The electrode positions are described in Figures 11, 12 and 13. In addition to the previously mentioned electrodes, the recording montage included audio and video recordings of the sleeping subject, a single channel ECG (modified lead II, Neuroline 726) and oxygen saturation detected by finger pulse oximetry (Nonin XPOD 3012; Nonin Medical, Plymouth, MN, USA).
All the bioelectric signal channels were sampled at 500 Hz. The recorded deriva-tions and the software-based filtering settings that were applied are presented in Ta-ble 10.
Figure 11. The cup and solid gel electrodes positioned in the AASM recommended unipolar EEG and EOG montage positions (F3, F4, C3, C4, O1, O2, E1, E2. M1, M2), the bipolar EMG at masseter, sternocleidomastoid and temporal muscles, the ground electrode in Cz (not visible), the reference electrode on the forehead, and chin EMG electrodes, worn by the main investigator.
67
Figure 12. The original emergency EEG electrode set worn by the main investigator. Electrode positions at Fp1, Fp2, Af7, Af8, F7, F8, Sp1, Sp2, T9, T10, in addition to an EOG electrode and two reference and ground electrodes on the forehead.
Figure 13. The original emergency EEG electrode set (BrainStatus, Bittium Biosignals Oy, Kuopio, Finland) utilized in the sleep laboratory recordings for studies I and II.
31227203_UEF_Vaitoskirja_NO_351_Tomi_Miettinen_LUMET_sisus_19_10_02.indd 88 02/10/2019 7.48

66
type I PSG montage and the electrode set-based PSG montage were conducted to allow a direct comparison between these two set-ups.
The standard Ag-AgCl cup electrodes (Neuroline 726, Ambu A/S, Ballerup, Den-mark) were applied to obtain the AASM recommended unipolar EEG and EOG, and bipolar chin EMG montage (see chapter 3.3.). In addition, a bipolar EMG montage was obatained from the masseter and sternocleidomastoid muscles with Ag-AgCl self-adhesive solid gel electrodes (Neuroline 700, Ambu A/S, Ballerup, Denmark), and temporal muscles with Ag-AgCl cup electrodes (Neuroline 726), all bilaterally. A technician applied the original emergency EEG electrode set (BrainStatus, Bittium Biosignals Oy, Kuopio, Finland) by preparing the electrode application sites of the electrode set with an ethanol soaked pad, in order to simulate the preparation that would take place in the patient’s home environment. With the cup electrodes, the skin was also abraded. The electrode positions are described in Figures 11, 12 and 13. In addition to the previously mentioned electrodes, the recording montage included audio and video recordings of the sleeping subject, a single channel ECG (modified lead II, Neuroline 726) and oxygen saturation detected by finger pulse oximetry (Nonin XPOD 3012; Nonin Medical, Plymouth, MN, USA).
All the bioelectric signal channels were sampled at 500 Hz. The recorded deriva-tions and the software-based filtering settings that were applied are presented in Ta-ble 10.
Figure 11. The cup and solid gel electrodes positioned in the AASM recommended unipolar EEG and EOG montage positions (F3, F4, C3, C4, O1, O2, E1, E2. M1, M2), the bipolar EMG at masseter, sternocleidomastoid and temporal muscles, the ground electrode in Cz (not visible), the reference electrode on the forehead, and chin EMG electrodes, worn by the main investigator.
67
Figure 12. The original emergency EEG electrode set worn by the main investigator. Electrode positions at Fp1, Fp2, Af7, Af8, F7, F8, Sp1, Sp2, T9, T10, in addition to an EOG electrode and two reference and ground electrodes on the forehead.
Figure 13. The original emergency EEG electrode set (BrainStatus, Bittium Biosignals Oy, Kuopio, Finland) utilized in the sleep laboratory recordings for studies I and II.
31227203_UEF_Vaitoskirja_NO_351_Tomi_Miettinen_LUMET_sisus_19_10_02.indd 89 02/10/2019 7.49
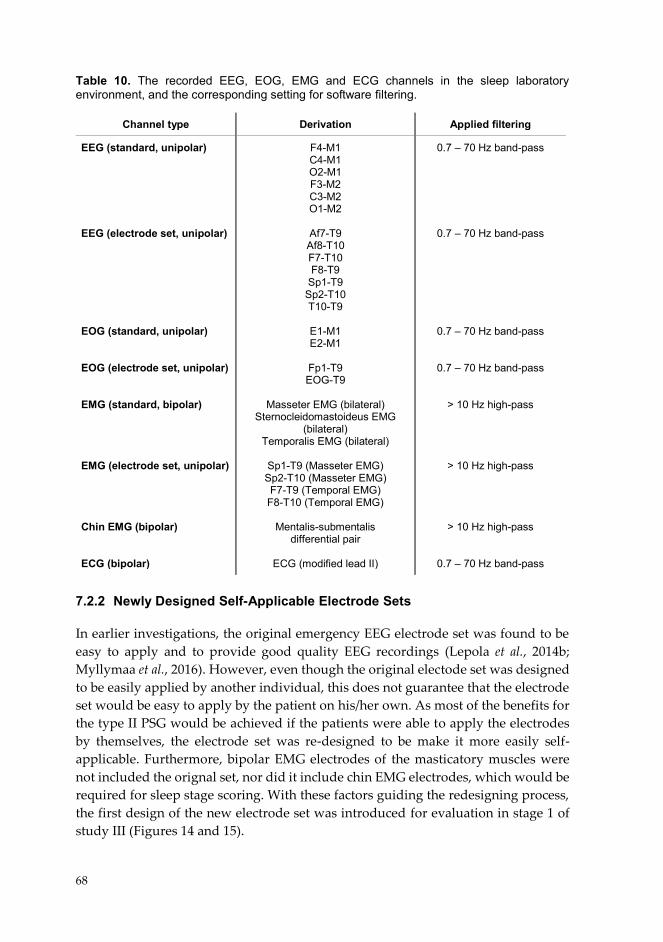
68
Table 10. The recorded EEG, EOG, EMG and ECG channels in the sleep laboratory environment, and the corresponding setting for software filtering.
7.2.2 Newly Designed Self-Applicable Electrode Sets In earlier investigations, the original emergency EEG electrode set was found to be easy to apply and to provide good quality EEG recordings (Lepola et al., 2014b; Myllymaa et al., 2016). However, even though the original electode set was designed to be easily applied by another individual, this does not guarantee that the electrode set would be easy to apply by the patient on his/her own. As most of the benefits for the type II PSG would be achieved if the patients were able to apply the electrodes by themselves, the electrode set was re-designed to be make it more easily self-applicable. Furthermore, bipolar EMG electrodes of the masticatory muscles were not included the orignal set, nor did it include chin EMG electrodes, which would be required for sleep stage scoring. With these factors guiding the redesigning process, the first design of the new electrode set was introduced for evaluation in stage 1 of study III (Figures 14 and 15).
Channel type Derivation Applied filtering
EEG (standard, unipolar) EEG (electrode set, unipolar) EOG (standard, unipolar) EOG (electrode set, unipolar) EMG (standard, bipolar) EMG (electrode set, unipolar) Chin EMG (bipolar) ECG (bipolar)
F4-M1 C4-M1 O2-M1 F3-M2 C3-M2 O1-M2
Af7-T9 Af8-T10 F7-T10 F8-T9
Sp1-T9 Sp2-T10 T10-T9
E1-M1 E2-M1
Fp1-T9 EOG-T9
Masseter EMG (bilateral)
Sternocleidomastoideus EMG (bilateral)
Temporalis EMG (bilateral)
Sp1-T9 (Masseter EMG) Sp2-T10 (Masseter EMG) F7-T9 (Temporal EMG)
F8-T10 (Temporal EMG)
Mentalis-submentalis differential pair
ECG (modified lead II)
0.7 – 70 Hz band-pass
0.7 – 70 Hz band-pass
0.7 – 70 Hz band-pass
0.7 – 70 Hz band-pass
> 10 Hz high-pass
> 10 Hz high-pass
> 10 Hz high-pass
0.7 – 70 Hz band-pass
69
Figure 14. The first design of the new self-applicable EEG electrode set.
Figure 15. The first design of the new self-applicable electrode set that was utilized in stage 1 of study III (worn by a member of the research group).
31227203_UEF_Vaitoskirja_NO_351_Tomi_Miettinen_LUMET_sisus_19_10_02.indd 90 02/10/2019 7.49
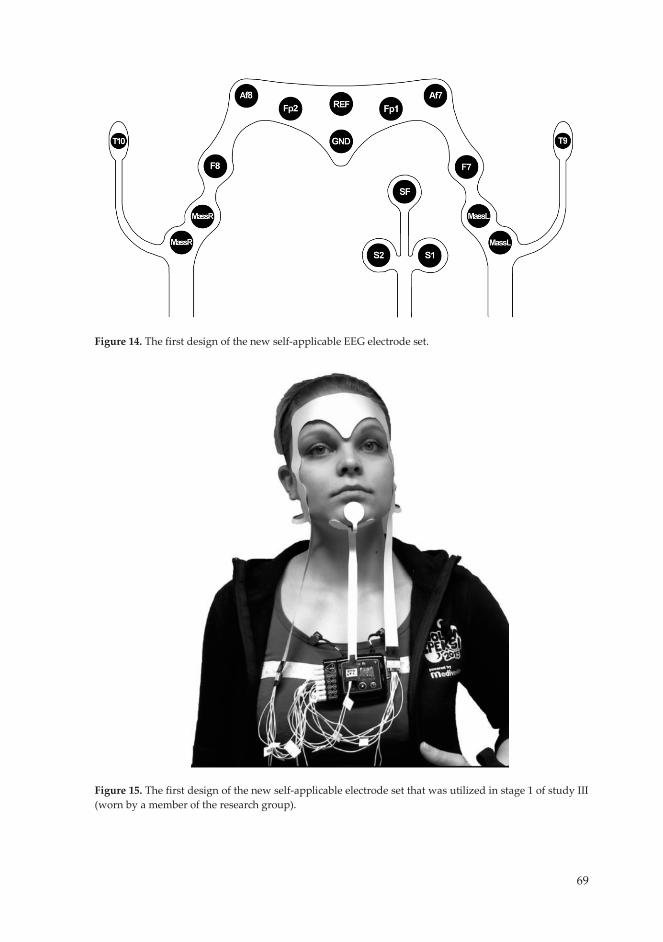
69
Figure 14. The first design of the new self-applicable EEG electrode set.
Figure 15. The first design of the new self-applicable electrode set that was utilized in stage 1 of study III (worn by a member of the research group).
31227203_UEF_Vaitoskirja_NO_351_Tomi_Miettinen_LUMET_sisus_19_10_02.indd 91 02/10/2019 7.49
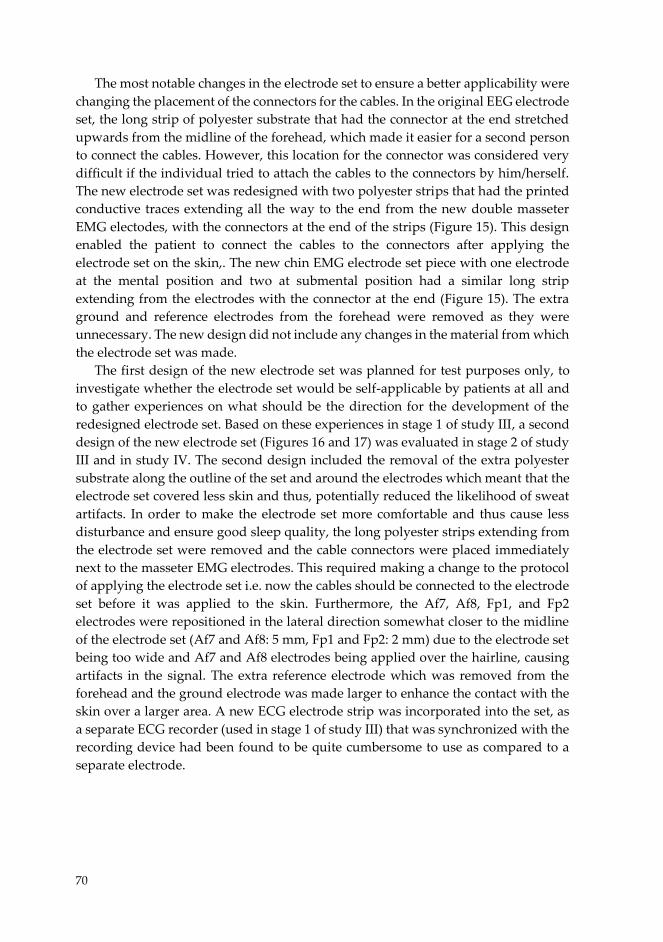
70
The most notable changes in the electrode set to ensure a better applicability were changing the placement of the connectors for the cables. In the original EEG electrode set, the long strip of polyester substrate that had the connector at the end stretched upwards from the midline of the forehead, which made it easier for a second person to connect the cables. However, this location for the connector was considered very difficult if the individual tried to attach the cables to the connectors by him/herself. The new electrode set was redesigned with two polyester strips that had the printed conductive traces extending all the way to the end from the new double masseter EMG electodes, with the connectors at the end of the strips (Figure 15). This design enabled the patient to connect the cables to the connectors after applying the electrode set on the skin,. The new chin EMG electrode set piece with one electrode at the mental position and two at submental position had a similar long strip extending from the electrodes with the connector at the end (Figure 15). The extra ground and reference electrodes from the forehead were removed as they were unnecessary. The new design did not include any changes in the material from which the electrode set was made.
The first design of the new electrode set was planned for test purposes only, to investigate whether the electrode set would be self-applicable by patients at all and to gather experiences on what should be the direction for the development of the redesigned electrode set. Based on these experiences in stage 1 of study III, a second design of the new electrode set (Figures 16 and 17) was evaluated in stage 2 of study III and in study IV. The second design included the removal of the extra polyester substrate along the outline of the set and around the electrodes which meant that the electrode set covered less skin and thus, potentially reduced the likelihood of sweat artifacts. In order to make the electrode set more comfortable and thus cause less disturbance and ensure good sleep quality, the long polyester strips extending from the electrode set were removed and the cable connectors were placed immediately next to the masseter EMG electrodes. This required making a change to the protocol of applying the electrode set i.e. now the cables should be connected to the electrode set before it was applied to the skin. Furthermore, the Af7, Af8, Fp1, and Fp2 electrodes were repositioned in the lateral direction somewhat closer to the midline of the electrode set (Af7 and Af8: 5 mm, Fp1 and Fp2: 2 mm) due to the electrode set being too wide and Af7 and Af8 electrodes being applied over the hairline, causing artifacts in the signal. The extra reference electrode which was removed from the forehead and the ground electrode was made larger to enhance the contact with the skin over a larger area. A new ECG electrode strip was incorporated into the set, as a separate ECG recorder (used in stage 1 of study III) that was synchronized with the recording device had been found to be quite cumbersome to use as compared to a separate electrode.
71
Figure 16. The second design of the new self-applicable EEG electrode set.
Figure 17. The second design of the new self-applicable electrode set that was utilized in stage 2 of study III and in study IV (worn by the main investigator).
31227203_UEF_Vaitoskirja_NO_351_Tomi_Miettinen_LUMET_sisus_19_10_02.indd 92 02/10/2019 7.49
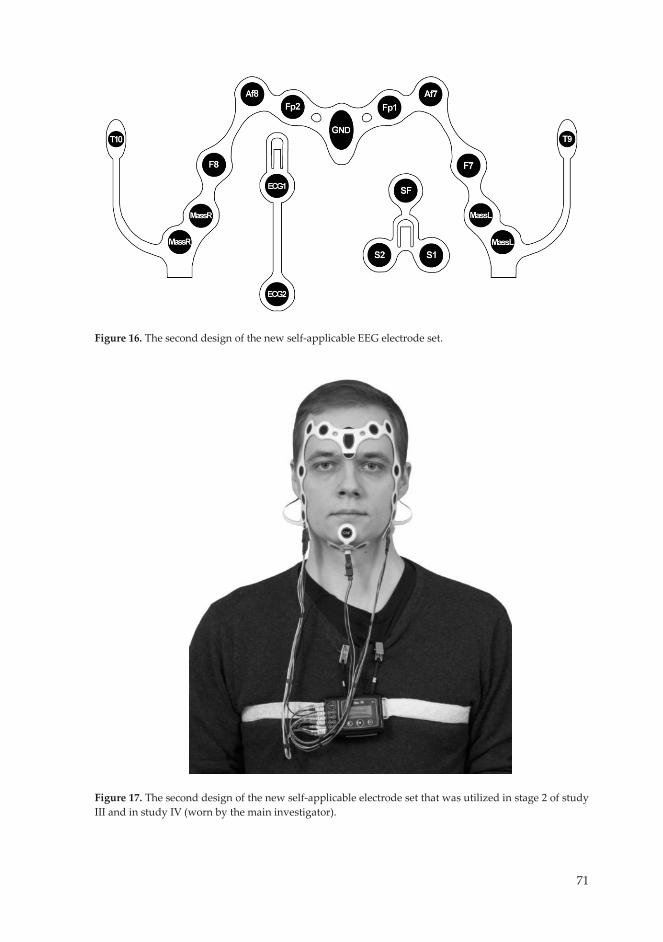
71
Figure 16. The second design of the new self-applicable EEG electrode set.
Figure 17. The second design of the new self-applicable electrode set that was utilized in stage 2 of study III and in study IV (worn by the main investigator).
31227203_UEF_Vaitoskirja_NO_351_Tomi_Miettinen_LUMET_sisus_19_10_02.indd 93 02/10/2019 7.49
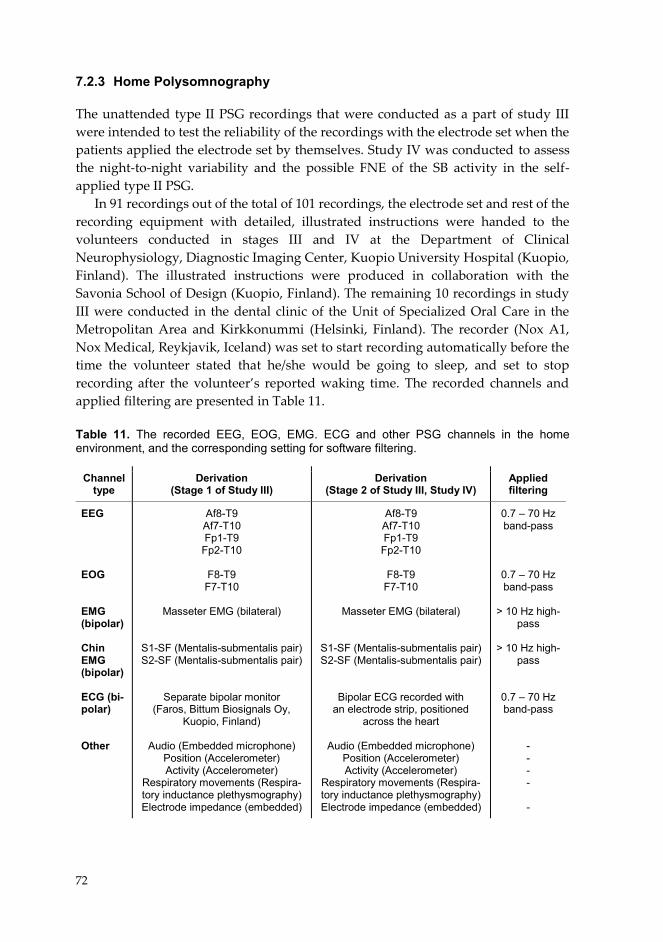
72
7.2.3 Home Polysomnography
The unattended type II PSG recordings that were conducted as a part of study III were intended to test the reliability of the recordings with the electrode set when the patients applied the electrode set by themselves. Study IV was conducted to assess the night-to-night variability and the possible FNE of the SB activity in the self-applied type II PSG.
In 91 recordings out of the total of 101 recordings, the electrode set and rest of the recording equipment with detailed, illustrated instructions were handed to the volunteers conducted in stages III and IV at the Department of Clinical Neurophysiology, Diagnostic Imaging Center, Kuopio University Hospital (Kuopio, Finland). The illustrated instructions were produced in collaboration with the Savonia School of Design (Kuopio, Finland). The remaining 10 recordings in study III were conducted in the dental clinic of the Unit of Specialized Oral Care in the Metropolitan Area and Kirkkonummi (Helsinki, Finland). The recorder (Nox A1, Nox Medical, Reykjavik, Iceland) was set to start recording automatically before the time the volunteer stated that he/she would be going to sleep, and set to stop recording after the volunteer’s reported waking time. The recorded channels and applied filtering are presented in Table 11. Table 11. The recorded EEG, EOG, EMG. ECG and other PSG channels in the home environment, and the corresponding setting for software filtering.
Channel type
Derivation (Stage 1 of Study III)
Derivation (Stage 2 of Study III, Study IV)
Applied filtering
EEG EOG EMG (bipolar) Chin EMG (bipolar) ECG (bi-polar) Other
Af8-T9 Af7-T10 Fp1-T9
Fp2-T10
F8-T9 F7-T10
Masseter EMG (bilateral)
S1-SF (Mentalis-submentalis pair) S2-SF (Mentalis-submentalis pair)
Separate bipolar monitor (Faros, Bittum Biosignals Oy,
Kuopio, Finland)
Audio (Embedded microphone) Position (Accelerometer) Activity (Accelerometer)
Respiratory movements (Respira-tory inductance plethysmography) Electrode impedance (embedded)
Af8-T9 Af7-T10 Fp1-T9 Fp2-T10
F8-T9
F7-T10
Masseter EMG (bilateral)
S1-SF (Mentalis-submentalis pair) S2-SF (Mentalis-submentalis pair)
Bipolar ECG recorded with an electrode strip, positioned
across the heart
Audio (Embedded microphone) Position (Accelerometer) Activity (Accelerometer)
Respiratory movements (Respira-tory inductance plethysmography) Electrode impedance (embedded)
0.7 – 70 Hz band-pass
0.7 – 70 Hz band-pass
> 10 Hz high-
pass
> 10 Hz high-pass
0.7 – 70 Hz band-pass
- - - - -
31227203_UEF_Vaitoskirja_NO_351_Tomi_Miettinen_LUMET_sisus_19_10_02.indd 94 02/10/2019 7.49

73
In the evening, the subject was instructed to wipe the electrode application sites with ethanol soaked pads to ensure good electric impedances at the electrode-skin interface and to avoid placing the electrode set on the hairy areas. Men were requested to shave before making the recording.
In studies III and IV, the subjects filled in the Finnish version of the OBC questionnaire, which was used to assess the presence of self-reported SB. As the self-applicability of the electrode set was considered an important factor for the quality of the recordings, the subjects were asked to answer out several questions concerning the ease of application of the electrode set and the rest of the recording equipment, and to inform about any problems encountered in their use. The results of these questionnaires were utilized in the development of the second design of the electrode set, especially the factors regarding problems in electrode application and the comfortability of the electrode set. 7.3 SLEEP STUDY SCORING The sleep study scoring in this thesis was conducted in accordance with the AASM recommendations for the MMA event scoring (presented in chapter 3.4.1), supplemented with a selection of additional channels as recommended in scientific literature (see chapter 4.3.1), and the AASM recommendations for the sleep stage scoring presented in the chapter 3.4.2 (Berry et al., 2018). The metrics utilized for the comparisons made in all studies were based on those that are the most prominently endorsed in the scientific literature, i.e. the MMA index, the burst index or the BTI (see chapter 4.3.1). The exact rules for scoring OFA and OMA were employed by ourselves, as no studies describing them were found. As the micro-arousals have been shown to be associated with the MMA events, arousal events were also scored in the recordings to test the arousal detection capabilities of the electrode sets. In studies I and II, scoring was conducted with RemLogic software (Embla Systems, Inc., Broomfield, CO, USA) and in studies III and IV with Noxturnal software (Nox A1, Nox Medical, Reykjavik, Iceland). 7.3.1 Masticatory Muscle Activity Events The scoring of the MMA events was based on the scoring rules issued by AASM, utilizing the threshold of twice the background amplitude for the MMA bursts (see chapter 3.4.1. Figure 18) (Berry et al., 2018). The events were scored by having only a 30 second long epoch of the recording visible at any given time. All events were scored regardless of the sleep stage, as the scoring software allowed the exclusion of MMA events during wakefulness after the scoring was conducted. The episodes were scored as an MMA event if audio, video (in study I), movement artifacts (in studies II-IV) or actigraph (in studies III and IV) did not provide any indication of the MMA episode possibly being anything other than MMA. Tooth grinding sounds were utilized as a clear indicator of MMA and were scored in all recordings where
31227203_UEF_Vaitoskirja_NO_351_Tomi_Miettinen_LUMET_sisus_19_10_02.indd 95 02/10/2019 7.49

74
Figure 18. An example of the scored a) phasic, b) tonic, and c) mixed MMA event (in black), consisting of varying number of MMA bursts (in gray).
audio footage was utilized. One scorer (the main author) scored the MMA events in all recordings. The scoring rules for the MMA events were the same in all studies, but in the four studies, there were differences in the scoring procedure of the MMA events and the discrimination between MMA, OFA and OMA.
In study I, the MMA events were first scored by using the electrode set based PSG montage with the recordings in a random order. The MMA events were scored based on the unipolar Sp1-T9 and Sp2-T10 channels of the electrode set. The audio footage was available for scoring the OFA and OMA, but video footage was hidden and not referred to at the time of the scoring. This was chosen as a way to simulate scoring that would occur in type II PSG that does not include video footage. After the scoring of MMA events in a recording file was completed, all MMA events were checked and the video footage was referred at the timepoint of every MMA event. If the video footage revealed that the event was OFA or OMA, a marking was set to indicate that the event was distinguished only after the referral to video footage. At least two weeks passed between scoring the MMA events in the electrode set PSG montage and the standard PSG montage, so that the scorer would not recognize the randomized recordings. The events in the standard PSG montage were scored by having both audio and video available at the time of scoring, and the MMA events were scored on the bipolar masseter EMG channels. The MMA events during wakefulness were excluded based on the sleep stage scoring. In order to find out the approximate effect of the sleep stage scoring for the SB assessment in type II PSG, the SB activity metrics including the awake-time MMA and using TRT as the denominator in MMA index instead of TST, were also counted for the electrode set
31227203_UEF_Vaitoskirja_NO_351_Tomi_Miettinen_LUMET_sisus_19_10_02.indd 96 02/10/2019 7.49
75
PSG montage without the video. In both montages, the MMA events were scored if the characteristic EMG pattern was found on either one of the two masseter EMG channels.
In study II, the MMA events were scored in seven different montages, to allow comparisons between different (simulated) unattended or reduded PSG montages (including the electrode set montage with audio) against standard type I PSG with audio and video. In all montages, the MMA events were scored on the bipolar masseter and/or temporalis EMG channels recorded with the solid gel electrodes or cup electrodes. These seven montages were scored in five scoring rounds after the recordings were pseudonymized and arranged in a random order. At least 3 weeks passed between each subsequent scoring round, all randomized differently, so that the scorer would not recognize the recordings and results of scoring. The OFA and OMA were distinguished from MMA based on the rules presented in the next subchapter (7.3.2). After all scoring rounds, MMA events were re-scored for 10 randomly selected subjects in all seven montages, the recordings being pseudonymized and in random order.
In studies III and IV, MMA events were scored in all included recordings. In study III, this was done in spite of the results for the MMA scoring not actually being utilized in that study. Instead, in study III, MMA scoring was conducted only to have a realistic setting for the estimation of the quality of the recorded signals utilized in the MMA event scoring. The rules for the estimation of the technical quality are presented in chapter 7.4.
In studies III and IV, the MMA event scoring was primarily done in a similar manner as had been conducted for the electrode set-based channels in study II: MMA events were scored based on those events visible in both of the masseter EMG channels (2-channel MMA events). One-channel MMA event scoring was used when either one of the masseter EMG channels was uninterpretable due to a bad contact or being riddled with artifacts. The recordings were pseudonymized and arranged in a random order for the MMA and sleep stage scoring.
7.3.2 Orofacial Movement and Other Muscular Activity Events The rules for scoring the OFA and OMA events were not given in studies I – IV, but are now detailed here. In study I, the MMA events were distinguished from the OMA and OFA events by only reviewing audio and video footage either i) during the scoring with the audio footage, and referring to video footage only after scoring was over (electrode set based PSG montage), or ii) based on both audio and video footage during initial scoring (standard PSG montage). In this study, the events were principally interpreted as MMA. The events with the characteristic MMA pattern were considered OFA or OMA only in the case of clear major movements or the activity clearly being nothing else than e.g. swallowing or coughing (even with a concomitant MMA pattern). This interpretation was based on the viewpoint in the
31227203_UEF_Vaitoskirja_NO_351_Tomi_Miettinen_LUMET_sisus_19_10_02.indd 97 02/10/2019 7.49
76
literature that SB often occurs in conjunction with other muscular activities e.g. leg movements or swallowing (Velly Miguel et al., 1992; Miyawaki et al., 2003a). Nevertheless, in the presence of tooth grinding sounds, the event was always scored as MMA. OFA or OMA events were not distinguished from one another, simply marked as a movement event instead of MMA. Furthermore, OFA or OMA events that were not scorable as MMA, were not analyzed.
In study II, stricter scoring rules for OMA and OFA were employed to allow better comparitivity with the study by Carra et al. that evaluated the PSG recordings without audio and video (Carra et al., 2015b). The presence of any movement artifacts in EEG, EOG and chin EMG channels was considered as a sign of OMA and was ruled out as not being MMA. Furthermore, when referring to audio or video footage, if there was any ambiguity in the interpretation between MMA, OFA and OMA, masticatory EMG activity occurring during any movement activity of any other orofacial movement was ruled out as being a part of that activity and not MMA. When OFA or OMA occurred in connection to MMA and only when they were clearly separate from MMA, both MMA and OFA or OMA were scored as separate events. The OFA events were further divided into the following subclasses: eye blinking, chewing (not MMA), coughing, lip or tongue movement, mandibular myoclonus, swallowing, talking and yawning. The scoring rules for these events are presented in Table 12. OMA was scored in the presence of indications of any large movement based on the audio and video footage or movement artifacts on the EEG, EOG and EMG channels. All found OFA and OMA events were scored regardless of the possibility that they could be scored as MMA.
In studies III and IV, the OFA and OMA events were distinguished from MMA based on the audio recordings and artifacts in other traces similarly as in study II (Table 12). The only distinction was that only the events that were scorable as MMA were analyzed. Furthermore, the actigraph data embedded in the recorder was utilized in the detection of the OMA in addition to revealing large artifacts, but no separate thresholds for this parameter were set. OFA and OMA events were not separately marked in the recordings, only indicated as a movement event other than MMA.
7.3.3 Sleep Stages and Cortical Arousals Sleep stages were scored in all recordings that were included in the four studies of this thesis, according to the rules provided in the AASM manual for scoring of the sleep stages described in chapter 3.4.2. Whenever sleep stages were scored in a montage recorded with the frontal electrodes, the alternative rule for scoring the N1 sleep stage (for individuals who do not generate alpha rhythm) was used (Berry et al., 2018). This rule was used due to the fact that the electrode set does not have any occipital electrodes. The attenuation of alpha rhythm would normally be utilized for the detection of N1 sleep, but as the alpha rhythm predominantly occurs in the
31227203_UEF_Vaitoskirja_NO_351_Tomi_Miettinen_LUMET_sisus_19_10_02.indd 98 02/10/2019 7.49
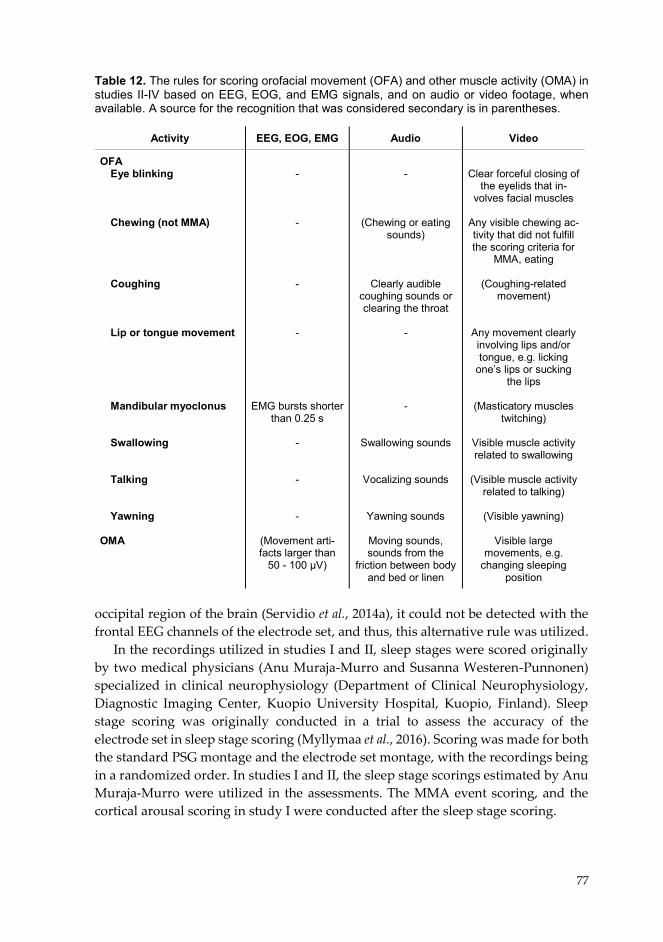
77
Table 12. The rules for scoring orofacial movement (OFA) and other muscle activity (OMA) in studies II-IV based on EEG, EOG, and EMG signals, and on audio or video footage, when available. A source for the recognition that was considered secondary is in parentheses.
occipital region of the brain (Servidio et al., 2014a), it could not be detected with the frontal EEG channels of the electrode set, and thus, this alternative rule was utilized.
In the recordings utilized in studies I and II, sleep stages were scored originally by two medical physicians (Anu Muraja-Murro and Susanna Westeren-Punnonen) specialized in clinical neurophysiology (Department of Clinical Neurophysiology, Diagnostic Imaging Center, Kuopio University Hospital, Kuopio, Finland). Sleep stage scoring was originally conducted in a trial to assess the accuracy of the electrode set in sleep stage scoring (Myllymaa et al., 2016). Scoring was made for both the standard PSG montage and the electrode set montage, with the recordings being in a randomized order. In studies I and II, the sleep stage scorings estimated by Anu Muraja-Murro were utilized in the assessments. The MMA event scoring, and the cortical arousal scoring in study I were conducted after the sleep stage scoring.
Activity EEG, EOG, EMG Audio Video
OFA Eye blinking
Chewing (not MMA) Coughing Lip or tongue movement Mandibular myoclonus
Swallowing Talking Yawning
OMA
- - - -
EMG bursts shorter than 0.25 s
- - -
(Movement arti-facts larger than
50 - 100 µV)
-
(Chewing or eating sounds)
Clearly audible
coughing sounds or clearing the throat
- -
Swallowing sounds
Vocalizing sounds
Yawning sounds
Moving sounds, sounds from the
friction between body and bed or linen
Clear forceful closing of
the eyelids that in-volves facial muscles
Any visible chewing ac-tivity that did not fulfill the scoring criteria for
MMA, eating
(Coughing-related movement)
Any movement clearly involving lips and/or tongue, e.g. licking
one’s lips or sucking the lips
(Masticatory muscles
twitching)
Visible muscle activity related to swallowing
(Visible muscle activity
related to talking)
(Visible yawning)
Visible large movements, e.g.
changing sleeping position
31227203_UEF_Vaitoskirja_NO_351_Tomi_Miettinen_LUMET_sisus_19_10_02.indd 99 02/10/2019 7.49
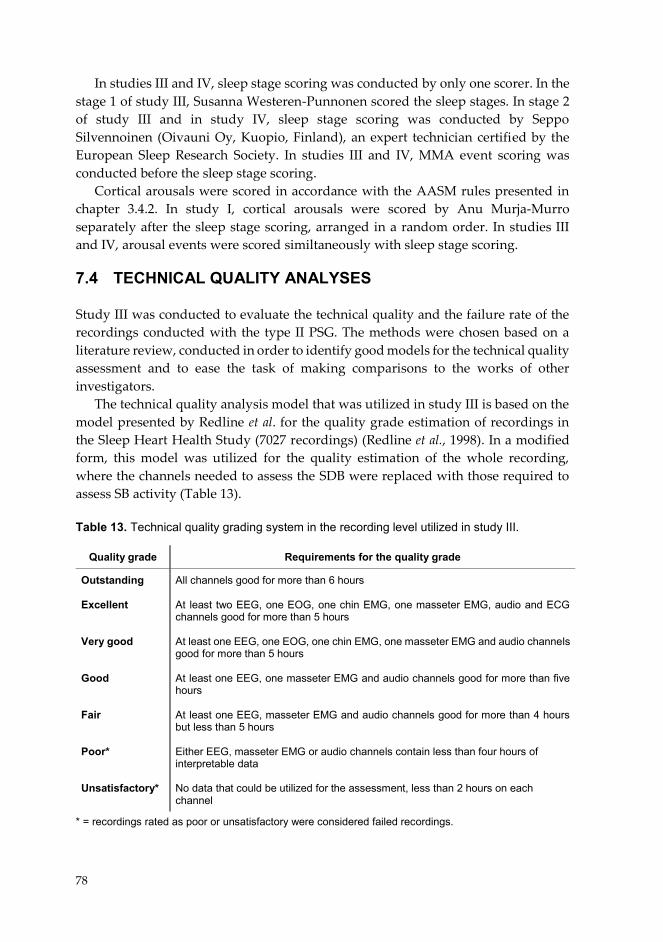
78
In studies III and IV, sleep stage scoring was conducted by only one scorer. In the stage 1 of study III, Susanna Westeren-Punnonen scored the sleep stages. In stage 2 of study III and in study IV, sleep stage scoring was conducted by Seppo Silvennoinen (Oivauni Oy, Kuopio, Finland), an expert technician certified by the European Sleep Research Society. In studies III and IV, MMA event scoring was conducted before the sleep stage scoring.
Cortical arousals were scored in accordance with the AASM rules presented in chapter 3.4.2. In study I, cortical arousals were scored by Anu Murja-Murro separately after the sleep stage scoring, arranged in a random order. In studies III and IV, arousal events were scored similtaneously with sleep stage scoring. 7.4 TECHNICAL QUALITY ANALYSES Study III was conducted to evaluate the technical quality and the failure rate of the recordings conducted with the type II PSG. The methods were chosen based on a literature review, conducted in order to identify good models for the technical quality assessment and to ease the task of making comparisons to the works of other investigators.
The technical quality analysis model that was utilized in study III is based on the model presented by Redline et al. for the quality grade estimation of recordings in the Sleep Heart Health Study (7027 recordings) (Redline et al., 1998). In a modified form, this model was utilized for the quality estimation of the whole recording, where the channels needed to assess the SDB were replaced with those required to assess SB activity (Table 13).
Table 13. Technical quality grading system in the recording level utilized in study III.
* = recordings rated as poor or unsatisfactory were considered failed recordings.
Quality grade Requirements for the quality grade
Outstanding Excellent Very good Good Fair Poor* Unsatisfactory*
All channels good for more than 6 hours At least two EEG, one EOG, one chin EMG, one masseter EMG, audio and ECG channels good for more than 5 hours At least one EEG, one EOG, one chin EMG, one masseter EMG and audio channels good for more than 5 hours At least one EEG, one masseter EMG and audio channels good for more than five hours At least one EEG, masseter EMG and audio channels good for more than 4 hours but less than 5 hours Either EEG, masseter EMG or audio channels contain less than four hours of interpretable data No data that could be utilized for the assessment, less than 2 hours on each channel
31227203_UEF_Vaitoskirja_NO_351_Tomi_Miettinen_LUMET_sisus_19_10_02.indd 100 02/10/2019 7.49

79
Originally, the signal-level quality grading in this model was based on quality assessment of entire signal groups (EEG, EOG, chin EMG, thermocouple, chest band, abdominal band), instead of single channels. However, we wanted to assess these parameters in greater detail and to assess the quality of each channel separately and after that, the whole channel group altogether. We chose to utilize the model for the evaluation of the signal quality that was presented in the study of Bruyneel et al., which had been conducted to evaluate the effect of setting up a type II recording montage for OSA diagnostics in a hospital and in the patient’s home (Bruyneel et al., 2015). In that study, the assessment of the signal quality was based on classifying the number of recordings according to the percentage of interpretable and artifact-free data in each channel. The signal quality classes were 100 - 95%, 94 - 75%, 74 – 50% and < 50%, designated in study III as A, B, C and D, respectively.
The assessment of a signal being interpretable was based on a subjective evaluation by the author of this thesis. As a supporting information, the sleep stage scorers were also asked to mark the epochs that they considered as non-scorable in the recordings. The evaluation of the signals was conducted as a dichotomization of the signals in each channel as being either interpretable or non-interpretable in 30-second long epochs. The reasons for signal losses were analyzed at the same time.
In addition, the percentage of total scorable data to the TRT from each channel was calculated. The recorded data was considered as being scorable at any given time point whenever it met the minimum requirements to score MMA events, sleep stages and arousals: i) at least one interpretable EEG channel for the assessment of subject being asleep or awake, ii) one interpretable masseter EMG channel for the MMA scoring, and iii) audio recording for distinguishing MMA from OFA and OMA.
In order to avoid relying only on a subjective assessment of the quality of the recordings, the electrical impedance data of each working electrode, continuously recorded by the Nox A1 PSG device itself, was analyzed. Unfortunately, the reference electrode data was considered not to be reliable, having very high impedance values at a random point with absolutely no effect on the signal quality at all. Therefore, the reference electrode data was rejected even though the impedance of reference electrode is detrimental for the quality of unipolar recordings. The reference electrode quality estimation was therefore based only on the subjective evaluation.
As the ease of application of the electrode set was considered an important factor for the quality of the recordings, the results of the questionnaire concerning these questions were analyzed. The mean values and standard derivation of the subjective perceived ease of use were determined on an ordinal scale between one and ten for the i) EEG, EOG and masseter EMG electrodes, ii) Other sensors (mainly the separate ECG in stage 1 and the recorder), and iii) Cables in stage 1 of study III, and in stage 2 also the iv) chin EMG and v) ECG electrodes.
31227203_UEF_Vaitoskirja_NO_351_Tomi_Miettinen_LUMET_sisus_19_10_02.indd 101 02/10/2019 7.49
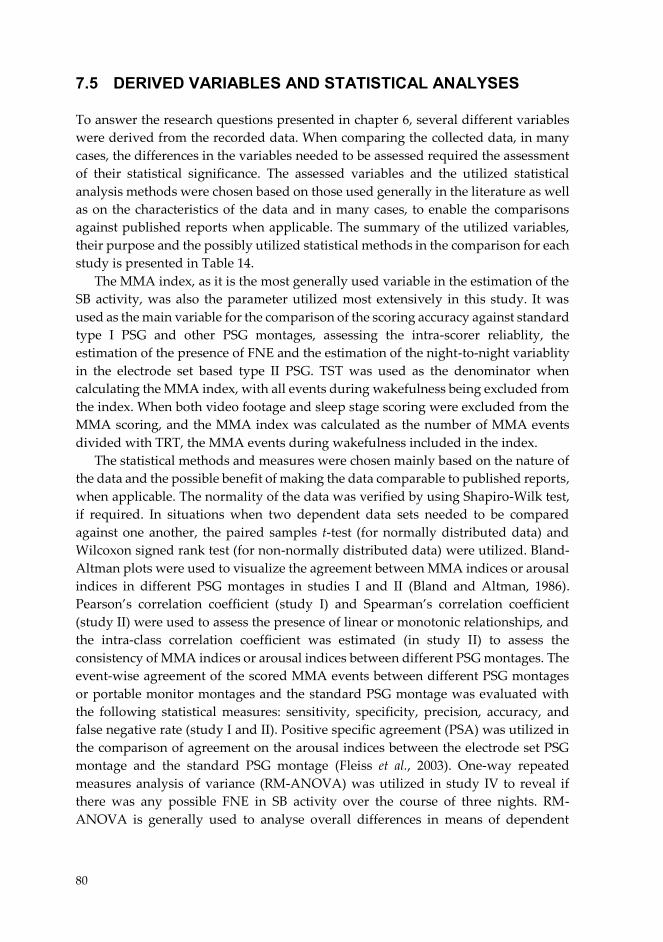
80
7.5 DERIVED VARIABLES AND STATISTICAL ANALYSES To answer the research questions presented in chapter 6, several different variables were derived from the recorded data. When comparing the collected data, in many cases, the differences in the variables needed to be assessed required the assessment of their statistical significance. The assessed variables and the utilized statistical analysis methods were chosen based on those used generally in the literature as well as on the characteristics of the data and in many cases, to enable the comparisons against published reports when applicable. The summary of the utilized variables, their purpose and the possibly utilized statistical methods in the comparison for each study is presented in Table 14.
The MMA index, as it is the most generally used variable in the estimation of the SB activity, was also the parameter utilized most extensively in this study. It was used as the main variable for the comparison of the scoring accuracy against standard type I PSG and other PSG montages, assessing the intra-scorer reliablity, the estimation of the presence of FNE and the estimation of the night-to-night variablity in the electrode set based type II PSG. TST was used as the denominator when calculating the MMA index, with all events during wakefulness being excluded from the index. When both video footage and sleep stage scoring were excluded from the MMA scoring, and the MMA index was calculated as the number of MMA events divided with TRT, the MMA events during wakefulness included in the index.
The statistical methods and measures were chosen mainly based on the nature of the data and the possible benefit of making the data comparable to published reports, when applicable. The normality of the data was verified by using Shapiro-Wilk test, if required. In situations when two dependent data sets needed to be compared against one another, the paired samples t-test (for normally distributed data) and Wilcoxon signed rank test (for non-normally distributed data) were utilized. Bland-Altman plots were used to visualize the agreement between MMA indices or arousal indices in different PSG montages in studies I and II (Bland and Altman, 1986). Pearson’s correlation coefficient (study I) and Spearman’s correlation coefficient (study II) were used to assess the presence of linear or monotonic relationships, and the intra-class correlation coefficient was estimated (in study II) to assess the consistency of MMA indices or arousal indices between different PSG montages. The event-wise agreement of the scored MMA events between different PSG montages or portable monitor montages and the standard PSG montage was evaluated with the following statistical measures: sensitivity, specificity, precision, accuracy, and false negative rate (study I and II). Positive specific agreement (PSA) was utilized in the comparison of agreement on the arousal indices between the electrode set PSG montage and the standard PSG montage (Fleiss et al., 2003). One-way repeated measures analysis of variance (RM-ANOVA) was utilized in study IV to reveal if there was any possible FNE in SB activity over the course of three nights. RM-ANOVA is generally used to analyse overall differences in means of dependent
31227203_UEF_Vaitoskirja_NO_351_Tomi_Miettinen_LUMET_sisus_19_10_02.indd 102 02/10/2019 7.49
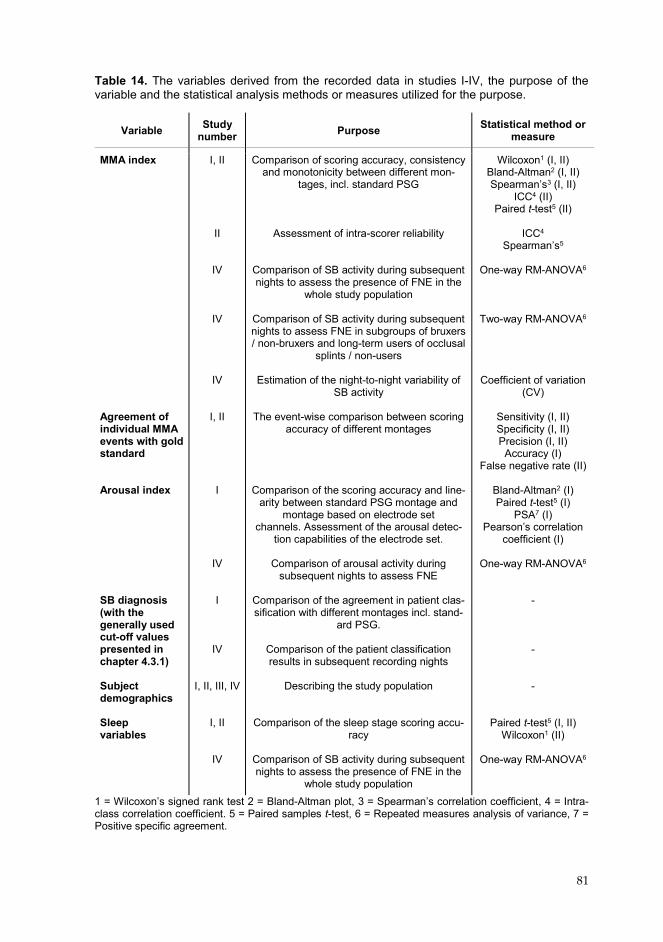
81
Table 14. The variables derived from the recorded data in studies I-IV, the purpose of the variable and the statistical analysis methods or measures utilized for the purpose.
1 = Wilcoxon’s signed rank test 2 = Bland-Altman plot, 3 = Spearman’s correlation coefficient, 4 = Intra-class correlation coefficient. 5 = Paired samples t-test, 6 = Repeated measures analysis of variance, 7 = Positive specific agreement.
Variable Study number Purpose Statistical method or
measure
MMA index Agreement of individual MMA events with gold standard Arousal index SB diagnosis (with the generally used cut-off values presented in chapter 4.3.1) Subject demographics Sleep variables
I, II
II
IV
IV
IV
I, II
I
IV
I
IV I, II, III, IV
I, II
IV
Comparison of scoring accuracy, consistency and monotonicity between different mon-
tages, incl. standard PSG
Assessment of intra-scorer reliability Comparison of SB activity during subsequent nights to assess the presence of FNE in the
whole study population
Comparison of SB activity during subsequent nights to assess FNE in subgroups of bruxers / non-bruxers and long-term users of occlusal
splints / non-users
Estimation of the night-to-night variability of SB activity
The event-wise comparison between scoring
accuracy of different montages
Comparison of the scoring accuracy and line-
arity between standard PSG montage and montage based on electrode set
channels. Assessment of the arousal detec-tion capabilities of the electrode set.
Comparison of arousal activity during
subsequent nights to assess FNE Comparison of the agreement in patient clas-sification with different montages incl. stand-
ard PSG.
Comparison of the patient classification results in subsequent recording nights
Describing the study population
Comparison of the sleep stage scoring accu-
racy Comparison of SB activity during subsequent nights to assess the presence of FNE in the
whole study population
Wilcoxon1 (I, II) Bland-Altman2 (I, II) Spearman’s3 (I, II)
ICC4 (II) Paired t-test5 (II)
ICC4
Spearman’s5
One-way RM-ANOVA6
Two-way RM-ANOVA6
Coefficient of variation (CV)
Sensitivity (I, II) Specificity (I, II) Precision (I, II) Accuracy (I)
False negative rate (II)
Bland-Altman2 (I) Paired t-test5 (I)
PSA7 (I) Pearson’s correlation
coefficient (I)
One-way RM-ANOVA6
- - -
Paired t-test5 (I, II) Wilcoxon1 (II)
One-way RM-ANOVA6
31227203_UEF_Vaitoskirja_NO_351_Tomi_Miettinen_LUMET_sisus_19_10_02.indd 103 02/10/2019 7.49
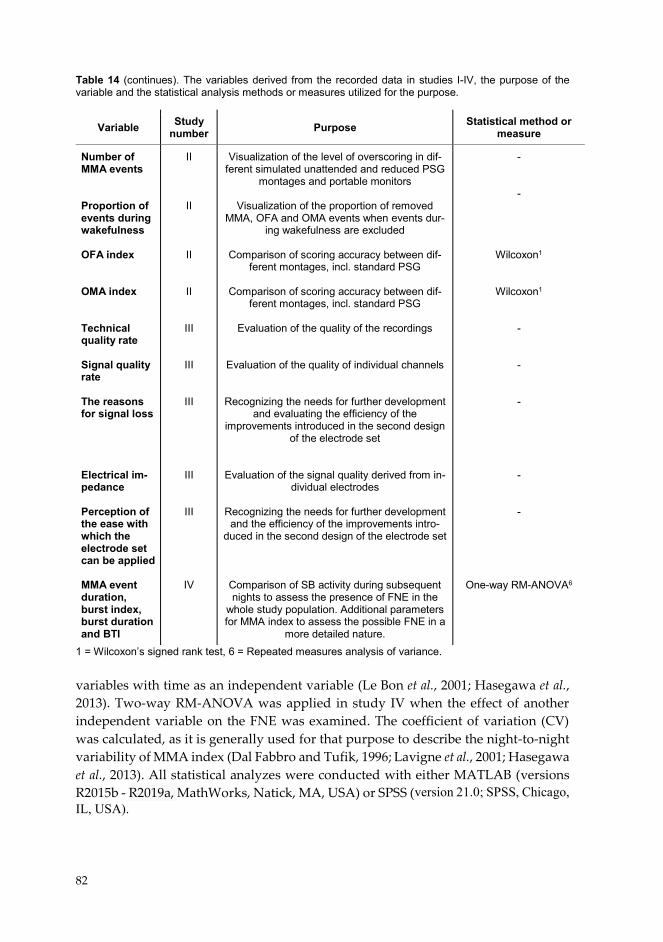
82
Table 14 (continues). The variables derived from the recorded data in studies I-IV, the purpose of the variable and the statistical analysis methods or measures utilized for the purpose.
1 = Wilcoxon’s signed rank test, 6 = Repeated measures analysis of variance. variables with time as an independent variable (Le Bon et al., 2001; Hasegawa et al., 2013). Two-way RM-ANOVA was applied in study IV when the effect of another independent variable on the FNE was examined. The coefficient of variation (CV) was calculated, as it is generally used for that purpose to describe the night-to-night variability of MMA index (Dal Fabbro and Tufik, 1996; Lavigne et al., 2001; Hasegawa et al., 2013). All statistical analyzes were conducted with either MATLAB (versions R2015b - R2019a, MathWorks, Natick, MA, USA) or SPSS (version 21.0; SPSS, Chicago, IL, USA).
Variable Study number Purpose Statistical method or
measure
Number of MMA events Proportion of events during wakefulness OFA index OMA index Technical quality rate Signal quality rate The reasons for signal loss Electrical im-pedance Perception of the ease with which the electrode set can be applied MMA event duration, burst index, burst duration and BTI
II
II
II
II
III
III
III
III
III
IV
Visualization of the level of overscoring in dif-ferent simulated unattended and reduced PSG
montages and portable monitors
Visualization of the proportion of removed MMA, OFA and OMA events when events dur-
ing wakefulness are excluded
Comparison of scoring accuracy between dif-ferent montages, incl. standard PSG
Comparison of scoring accuracy between dif-
ferent montages, incl. standard PSG
Evaluation of the quality of the recordings
Evaluation of the quality of individual channels
Recognizing the needs for further development and evaluating the efficiency of the
improvements introduced in the second design of the electrode set
Evaluation of the signal quality derived from in-dividual electrodes
Recognizing the needs for further development and the efficiency of the improvements intro-
duced in the second design of the electrode set
Comparison of SB activity during subsequent nights to assess the presence of FNE in the
whole study population. Additional parameters for MMA index to assess the possible FNE in a
more detailed nature.
- -
Wilcoxon1
Wilcoxon1 - - - - -
One-way RM-ANOVA6
31227203_UEF_Vaitoskirja_NO_351_Tomi_Miettinen_LUMET_sisus_19_10_02.indd 104 02/10/2019 7.49
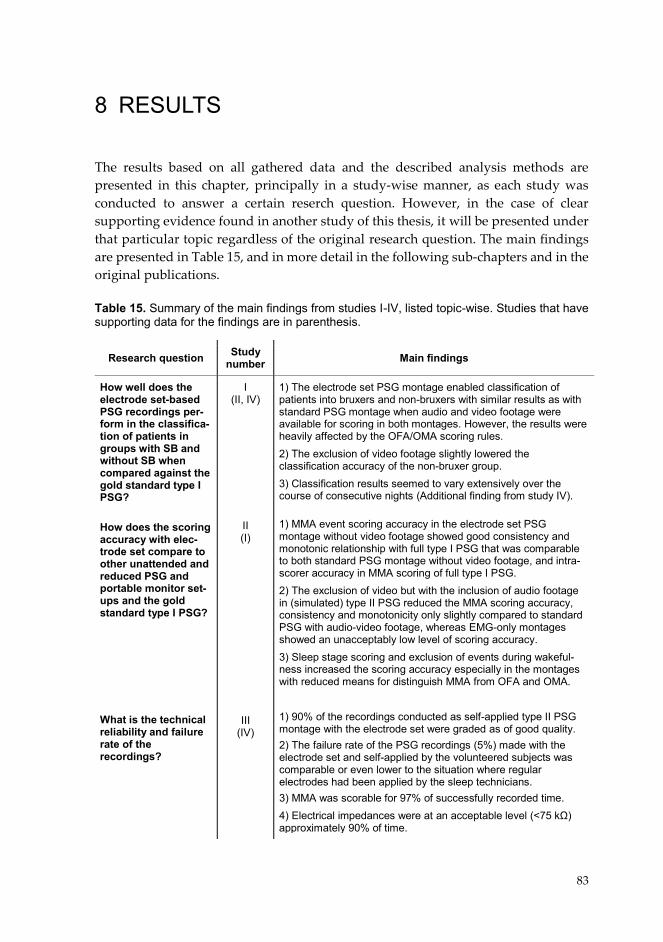
83
8 RESULTS
The results based on all gathered data and the described analysis methods are presented in this chapter, principally in a study-wise manner, as each study was conducted to answer a certain reserch question. However, in the case of clear supporting evidence found in another study of this thesis, it will be presented under that particular topic regardless of the original research question. The main findings are presented in Table 15, and in more detail in the following sub-chapters and in the original publications. Table 15. Summary of the main findings from studies I-IV, listed topic-wise. Studies that have supporting data for the findings are in parenthesis.
Research question Study number Main findings
How well does the electrode set-based PSG recordings per-form in the classifica-tion of patients in groups with SB and without SB when compared against the gold standard type I PSG? How does the scoring accuracy with elec-trode set compare to other unattended and reduced PSG and portable monitor set-ups and the gold standard type I PSG? What is the technical reliability and failure rate of the recordings?
I (II, IV)
II (I)
III
(IV)
1) The electrode set PSG montage enabled classification of patients into bruxers and non-bruxers with similar results as with standard PSG montage when audio and video footage were available for scoring in both montages. However, the results were heavily affected by the OFA/OMA scoring rules. 2) The exclusion of video footage slightly lowered the classification accuracy of the non-bruxer group. 3) Classification results seemed to vary extensively over the course of consecutive nights (Additional finding from study IV).
1) MMA event scoring accuracy in the electrode set PSG montage without video footage showed good consistency and monotonic relationship with full type I PSG that was comparable to both standard PSG montage without video footage, and intra-scorer accuracy in MMA scoring of full type I PSG. 2) The exclusion of video but with the inclusion of audio footage in (simulated) type II PSG reduced the MMA scoring accuracy, consistency and monotonicity only slightly compared to standard PSG with audio-video footage, whereas EMG-only montages showed an unacceptably low level of scoring accuracy. 3) Sleep stage scoring and exclusion of events during wakeful-ness increased the scoring accuracy especially in the montages with reduced means for distinguish MMA from OFA and OMA. 1) 90% of the recordings conducted as self-applied type II PSG montage with the electrode set were graded as of good quality. 2) The failure rate of the PSG recordings (5%) made with the electrode set and self-applied by the volunteered subjects was comparable or even lower to the situation where regular electrodes had been applied by the sleep technicians. 3) MMA was scorable for 97% of successfully recorded time. 4) Electrical impedances were at an acceptable level (<75 kΩ) approximately 90% of time.
31227203_UEF_Vaitoskirja_NO_351_Tomi_Miettinen_LUMET_sisus_19_10_02.indd 105 02/10/2019 7.49
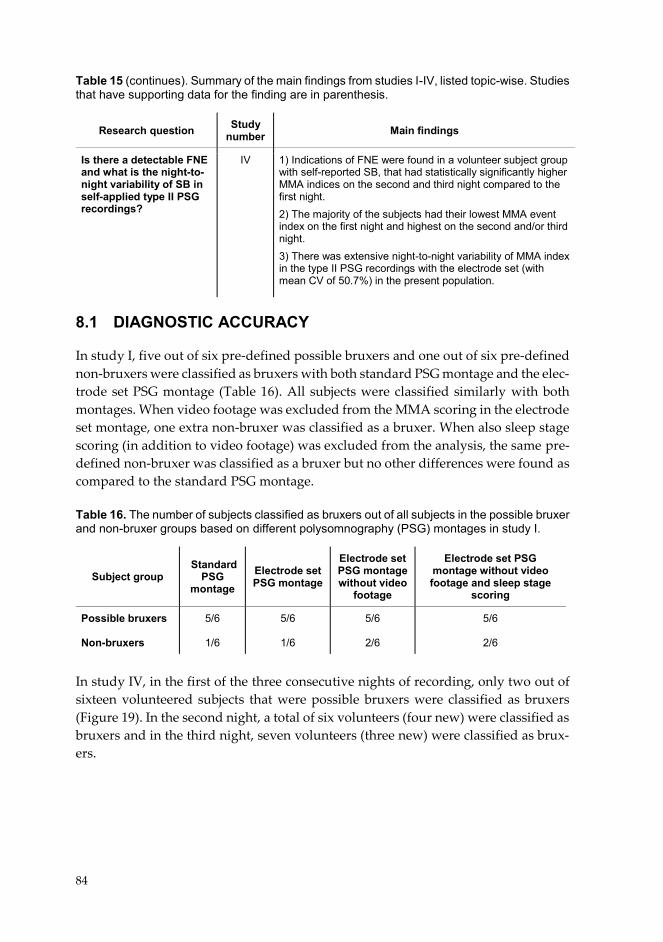
84
Table 15 (continues). Summary of the main findings from studies I-IV, listed topic-wise. Studies that have supporting data for the finding are in parenthesis.
8.1 DIAGNOSTIC ACCURACY
In study I, five out of six pre-defined possible bruxers and one out of six pre-defined non-bruxers were classified as bruxers with both standard PSG montage and the elec-trode set PSG montage (Table 16). All subjects were classified similarly with both montages. When video footage was excluded from the MMA scoring in the electrode set montage, one extra non-bruxer was classified as a bruxer. When also sleep stage scoring (in addition to video footage) was excluded from the analysis, the same pre-defined non-bruxer was classified as a bruxer but no other differences were found as compared to the standard PSG montage. Table 16. The number of subjects classified as bruxers out of all subjects in the possible bruxer and non-bruxer groups based on different polysomnography (PSG) montages in study I.
In study IV, in the first of the three consecutive nights of recording, only two out of sixteen volunteered subjects that were possible bruxers were classified as bruxers (Figure 19). In the second night, a total of six volunteers (four new) were classified as bruxers and in the third night, seven volunteers (three new) were classified as brux-ers.
Research question Study number Main findings
Is there a detectable FNE and what is the night-to-night variability of SB in self-applied type II PSG recordings?
IV 1) Indications of FNE were found in a volunteer subject group with self-reported SB, that had statistically significantly higher MMA indices on the second and third night compared to the first night. 2) The majority of the subjects had their lowest MMA event index on the first night and highest on the second and/or third night. 3) There was extensive night-to-night variability of MMA index in the type II PSG recordings with the electrode set (with mean CV of 50.7%) in the present population.
Subject group Standard
PSG montage
Electrode set PSG montage
Electrode set PSG montage without video
footage
Electrode set PSG montage without video footage and sleep stage
scoring
Possible bruxers Non-bruxers
5/6
1/6
5/6
1/6
5/6
2/6
5/6
2/6
31227203_UEF_Vaitoskirja_NO_351_Tomi_Miettinen_LUMET_sisus_19_10_02.indd 106 02/10/2019 7.49
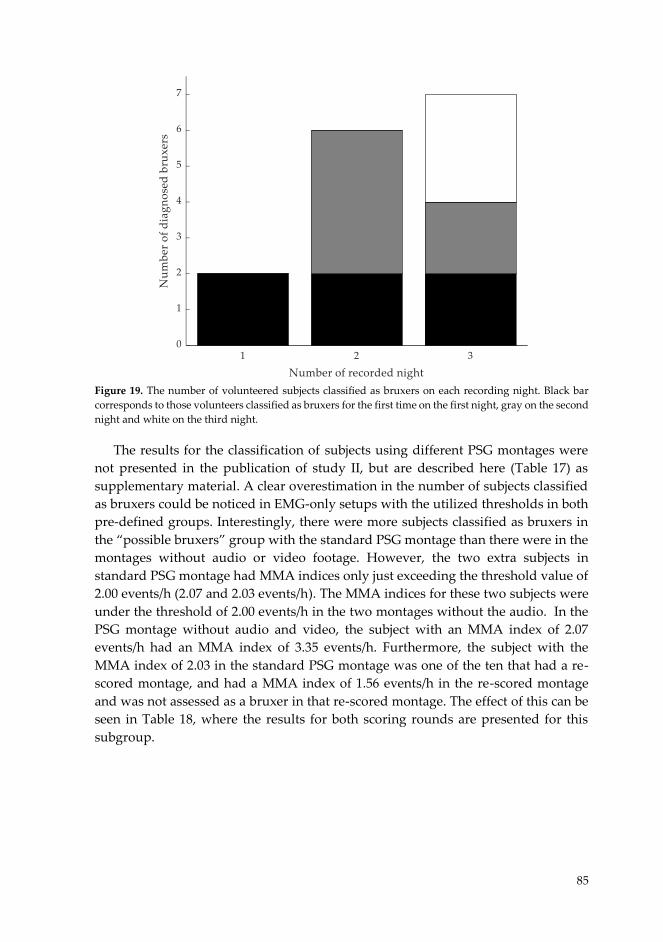
85
Figure 19. The number of volunteered subjects classified as bruxers on each recording night. Black bar corresponds to those volunteers classified as bruxers for the first time on the first night, gray on the second night and white on the third night.
The results for the classification of subjects using different PSG montages were
not presented in the publication of study II, but are described here (Table 17) as supplementary material. A clear overestimation in the number of subjects classified as bruxers could be noticed in EMG-only setups with the utilized thresholds in both pre-defined groups. Interestingly, there were more subjects classified as bruxers in the “possible bruxers” group with the standard PSG montage than there were in the montages without audio or video footage. However, the two extra subjects in standard PSG montage had MMA indices only just exceeding the threshold value of 2.00 events/h (2.07 and 2.03 events/h). The MMA indices for these two subjects were under the threshold of 2.00 events/h in the two montages without the audio. In the PSG montage without audio and video, the subject with an MMA index of 2.07 events/h had an MMA index of 3.35 events/h. Furthermore, the subject with the MMA index of 2.03 in the standard PSG montage was one of the ten that had a re-scored montage, and had a MMA index of 1.56 events/h in the re-scored montage and was not assessed as a bruxer in that re-scored montage. The effect of this can be seen in Table 18, where the results for both scoring rounds are presented for this subgroup.
31227203_UEF_Vaitoskirja_NO_351_Tomi_Miettinen_LUMET_sisus_19_10_02.indd 107 02/10/2019 7.49
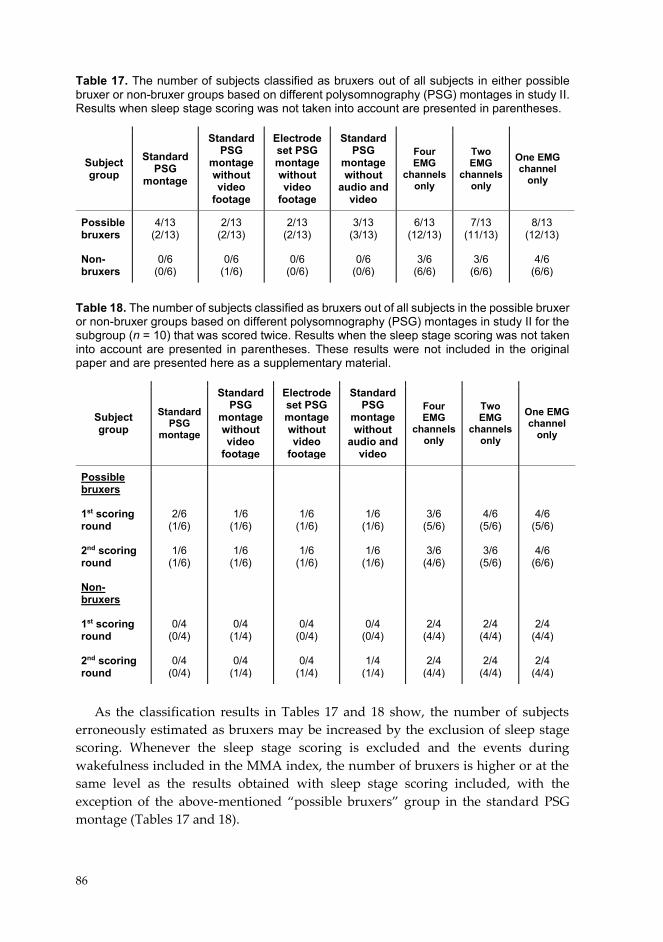
86
Table 17. The number of subjects classified as bruxers out of all subjects in either possible bruxer or non-bruxer groups based on different polysomnography (PSG) montages in study II. Results when sleep stage scoring was not taken into account are presented in parentheses.
Table 18. The number of subjects classified as bruxers out of all subjects in the possible bruxer or non-bruxer groups based on different polysomnography (PSG) montages in study II for the subgroup (n = 10) that was scored twice. Results when the sleep stage scoring was not taken into account are presented in parentheses. These results were not included in the original paper and are presented here as a supplementary material.
As the classification results in Tables 17 and 18 show, the number of subjects
erroneously estimated as bruxers may be increased by the exclusion of sleep stage scoring. Whenever the sleep stage scoring is excluded and the events during wakefulness included in the MMA index, the number of bruxers is higher or at the same level as the results obtained with sleep stage scoring included, with the exception of the above-mentioned “possible bruxers” group in the standard PSG montage (Tables 17 and 18).
Subject group
Standard PSG
montage
Standard PSG
montage without video
footage
Electrode set PSG montage without video
footage
Standard PSG
montage without
audio and video
Four EMG
channels only
Two EMG
channels only
One EMG channel
only
Possible bruxers Non-bruxers
4/13 (2/13)
0/6
(0/6)
2/13 (2/13)
0/6
(1/6)
2/13 (2/13)
0/6
(0/6)
3/13 (3/13)
0/6
(0/6)
6/13 (12/13)
3/6
(6/6)
7/13 (11/13)
3/6
(6/6)
8/13 (12/13)
4/6
(6/6)
Subject group
Standard PSG
montage
Standard PSG
montage without video
footage
Electrode set PSG montage without video
footage
Standard PSG
montage without
audio and video
Four EMG
channels only
Two EMG
channels only
One EMG channel
only
Possible bruxers 1st scoring round 2nd scoring round Non- bruxers 1st scoring round 2nd scoring round
2/6 (1/6)
1/6
(1/6)
0/4 (0/4)
0/4
(0/4)
1/6 (1/6)
1/6
(1/6)
0/4 (1/4)
0/4
(1/4)
1/6 (1/6)
1/6
(1/6)
0/4 (0/4)
0/4
(1/4)
1/6 (1/6)
1/6
(1/6)
0/4 (0/4)
1/4
(1/4)
3/6 (5/6)
3/6
(4/6)
2/4 (4/4)
2/4
(4/4)
4/6 (5/6)
3/6
(5/6)
2/4 (4/4)
2/4
(4/4)
4/6 (5/6)
4/6
(6/6)
2/4 (4/4)
2/4
(4/4)
31227203_UEF_Vaitoskirja_NO_351_Tomi_Miettinen_LUMET_sisus_19_10_02.indd 108 02/10/2019 7.49
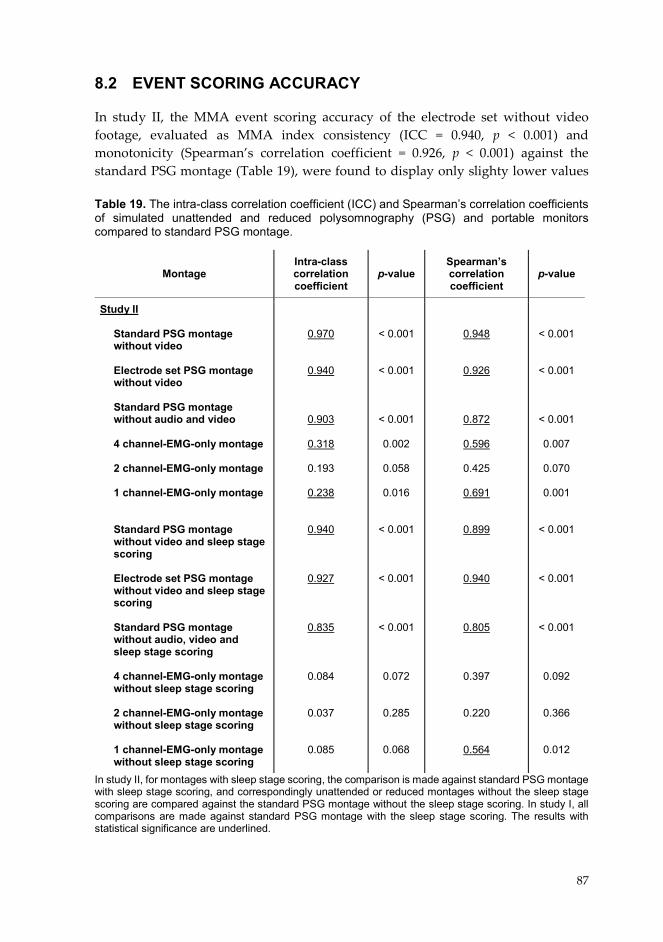
87
8.2 EVENT SCORING ACCURACY
In study II, the MMA event scoring accuracy of the electrode set without video footage, evaluated as MMA index consistency (ICC = 0.940, p < 0.001) and monotonicity (Spearman’s correlation coefficient = 0.926, p < 0.001) against the standard PSG montage (Table 19), were found to display only slighty lower values Table 19. The intra-class correlation coefficient (ICC) and Spearman’s correlation coefficients of simulated unattended and reduced polysomnography (PSG) and portable monitors compared to standard PSG montage.
In study II, for montages with sleep stage scoring, the comparison is made against standard PSG montage with sleep stage scoring, and correspondingly unattended or reduced montages without the sleep stage scoring are compared against the standard PSG montage without the sleep stage scoring. In study I, all comparisons are made against standard PSG montage with the sleep stage scoring. The results with statistical significance are underlined.
Montage Intra-class correlation coefficient
p-value Spearman’s correlation coefficient
p-value
Study II
Standard PSG montage without video Electrode set PSG montage without video Standard PSG montage without audio and video
4 channel-EMG-only montage
2 channel-EMG-only montage
1 channel-EMG-only montage
Standard PSG montage without video and sleep stage scoring Electrode set PSG montage without video and sleep stage scoring Standard PSG montage without audio, video and sleep stage scoring 4 channel-EMG-only montage without sleep stage scoring 2 channel-EMG-only montage without sleep stage scoring 1 channel-EMG-only montage without sleep stage scoring
0.970
0.940
0.903
0.318
0.193
0.238
0.940
0.927
0.835
0.084
0.037
0.085
< 0.001
< 0.001
< 0.001
0.002
0.058
0.016 < 0.001
< 0.001
< 0.001
0.072
0.285
0.068
0.948
0.926
0.872
0.596
0.425
0.691
0.899
0.940
0.805
0.397
0.220
0.564
< 0.001
< 0.001
< 0.001
0.007
0.070
0.001
< 0.001
< 0.001
< 0.001
0.092
0.366
0.012
31227203_UEF_Vaitoskirja_NO_351_Tomi_Miettinen_LUMET_sisus_19_10_02.indd 109 02/10/2019 7.49
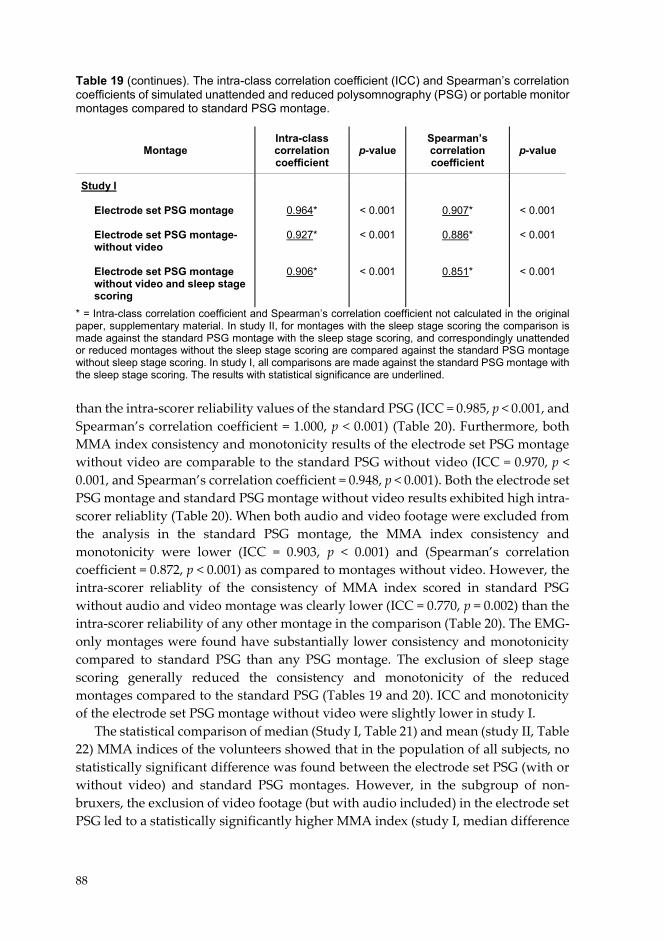
88
Table 19 (continues). The intra-class correlation coefficient (ICC) and Spearman’s correlation coefficients of simulated unattended and reduced polysomnography (PSG) or portable monitor montages compared to standard PSG montage.
* = Intra-class correlation coefficient and Spearman’s correlation coefficient not calculated in the original paper, supplementary material. In study II, for montages with the sleep stage scoring the comparison is made against the standard PSG montage with the sleep stage scoring, and correspondingly unattended or reduced montages without the sleep stage scoring are compared against the standard PSG montage without sleep stage scoring. In study I, all comparisons are made against the standard PSG montage with the sleep stage scoring. The results with statistical significance are underlined. than the intra-scorer reliability values of the standard PSG (ICC = 0.985, p < 0.001, and Spearman’s correlation coefficient = 1.000, p < 0.001) (Table 20). Furthermore, both MMA index consistency and monotonicity results of the electrode set PSG montage without video are comparable to the standard PSG without video (ICC = 0.970, p < 0.001, and Spearman’s correlation coefficient = 0.948, p < 0.001). Both the electrode set PSG montage and standard PSG montage without video results exhibited high intra-scorer reliablity (Table 20). When both audio and video footage were excluded from the analysis in the standard PSG montage, the MMA index consistency and monotonicity were lower (ICC = 0.903, p < 0.001) and (Spearman’s correlation coefficient = 0.872, p < 0.001) as compared to montages without video. However, the intra-scorer reliablity of the consistency of MMA index scored in standard PSG without audio and video montage was clearly lower (ICC = 0.770, p = 0.002) than the intra-scorer reliability of any other montage in the comparison (Table 20). The EMG-only montages were found have substantially lower consistency and monotonicity compared to standard PSG than any PSG montage. The exclusion of sleep stage scoring generally reduced the consistency and monotonicity of the reduced montages compared to the standard PSG (Tables 19 and 20). ICC and monotonicity of the electrode set PSG montage without video were slightly lower in study I.
The statistical comparison of median (Study I, Table 21) and mean (study II, Table 22) MMA indices of the volunteers showed that in the population of all subjects, no statistically significant difference was found between the electrode set PSG (with or without video) and standard PSG montages. However, in the subgroup of non-bruxers, the exclusion of video footage (but with audio included) in the electrode set PSG led to a statistically significantly higher MMA index (study I, median difference
Montage Intra-class correlation coefficient
p-value Spearman’s correlation coefficient
p-value
Study I
Electrode set PSG montage Electrode set PSG montage-without video Electrode set PSG montage without video and sleep stage scoring
0.964*
0.927*
0.906*
< 0.001 < 0.001
< 0.001
0.907*
0.886*
0.851*
< 0.001
< 0.001
< 0.001
31227203_UEF_Vaitoskirja_NO_351_Tomi_Miettinen_LUMET_sisus_19_10_02.indd 110 02/10/2019 7.49

89
Table 20. Intra-scorer reliablity as intra-class correlation coefficient (ICC) and Spearman’s correlation coefficient, comparison made against re-scoring of each montage for a subset of recordings in study II (n = 10). The results with statistical significance are underlined.
and interquartile range +0.83 (+0.40 – +1.54), p = 0.046) compared to the standard PSG, and also in the whole study population when also sleep stage scoring was excluded from the assessment (study I and II, Tables 21 and 22). As supplementary unpublished data, slightly, but significantly slightly higher MMA indices in the non-bruxer subgroup with the electrode set PSG montage compared to the standard PSG montage could also be found in study II that had different scoring rules (difference
Montage Intra-class correlation coefficient
p-value Spearman’s correlation coefficient
p-value
Study II
Standard PSG montage Standard PSG montage without video
Electrode set PSG montage without video
Standard PSG montage without audio and video
4 channel-EMG-only montage 2 channel-EMG-only montage
1 channel-EMG-only montage Standard PSG montage without sleep stage scoring Standard PSG montage without video and sleep stage scoring
Electrode set PSG montage without video and sleep stage scoring Standard PSG montage without audio, video and sleep stage scoring 4 channel-EMG-only montage without sleep stage scoring 2 channel-EMG-only montage without sleep stage scoring 1 channel-EMG-only montage without sleep stage scoring
0.985
0.986
0.956
0.770
0.948
0.953
0.989
0.981
0.978
0.939
0.764
0.965
0.958
0.985
< 0.001 < 0.001
< 0.001
0.002 < 0.001
< 0.001
< 0.001
< 0.001
< 0.001
< 0.001
0.002 < 0.001
< 0.001
< 0.001
1.000
0.960
0.961
0.976
0.964
0.952
0.988
0.981
0.976
0.927
0.867
0.964
0.952
0.964
< 0.001
< 0.001
< 0.001
< 0.001
< 0.001
< 0.001 < 0.001
< 0.001
< 0.001
< 0.001
0.003 < 0.001
< 0.001
< 0.001
31227203_UEF_Vaitoskirja_NO_351_Tomi_Miettinen_LUMET_sisus_19_10_02.indd 111 02/10/2019 7.49
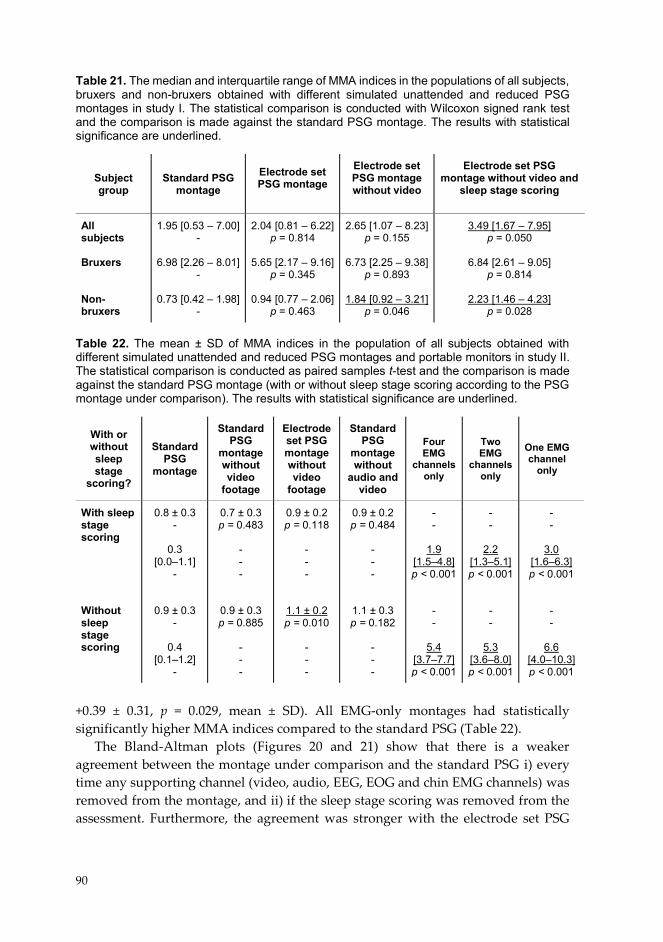
90
Table 21. The median and interquartile range of MMA indices in the populations of all subjects, bruxers and non-bruxers obtained with different simulated unattended and reduced PSG montages in study I. The statistical comparison is conducted with Wilcoxon signed rank test and the comparison is made against the standard PSG montage. The results with statistical significance are underlined.
Table 22. The mean ± SD of MMA indices in the population of all subjects obtained with different simulated unattended and reduced PSG montages and portable monitors in study II. The statistical comparison is conducted as paired samples t-test and the comparison is made against the standard PSG montage (with or without sleep stage scoring according to the PSG montage under comparison). The results with statistical significance are underlined.
+0.39 ± 0.31, p = 0.029, mean ± SD). All EMG-only montages had statistically significantly higher MMA indices compared to the standard PSG (Table 22).
The Bland-Altman plots (Figures 20 and 21) show that there is a weaker agreement between the montage under comparison and the standard PSG i) every time any supporting channel (video, audio, EEG, EOG and chin EMG channels) was removed from the montage, and ii) if the sleep stage scoring was removed from the assessment. Furthermore, the agreement was stronger with the electrode set PSG
Subject group
Standard PSG montage
Electrode set PSG montage
Electrode set PSG montage without video
Electrode set PSG montage without video and
sleep stage scoring
All subjects Bruxers Non- bruxers
1.95 [0.53 – 7.00] -
6.98 [2.26 – 8.01] -
0.73 [0.42 – 1.98] -
2.04 [0.81 – 6.22] p = 0.814
5.65 [2.17 – 9.16]
p = 0.345
0.94 [0.77 – 2.06] p = 0.463
2.65 [1.07 – 8.23] p = 0.155
6.73 [2.25 – 9.38]
p = 0.893
1.84 [0.92 – 3.21] p = 0.046
3.49 [1.67 – 7.95] p = 0.050
6.84 [2.61 – 9.05]
p = 0.814
2.23 [1.46 – 4.23] p = 0.028
With or without sleep stage
scoring?
Standard PSG
montage
Standard PSG
montage without video
footage
Electrode set PSG montage without video
footage
Standard PSG
montage without
audio and video
Four EMG
channels only
Two EMG
channels only
One EMG channel
only
With sleep stage scoring Without sleep stage scoring
0.8 ± 0.3 -
0.3 [0.0–1.1]
-
0.9 ± 0.3 -
0.4 [0.1–1.2]
-
0.7 ± 0.3 p = 0.483
- - -
0.9 ± 0.3 p = 0.885
- - -
0.9 ± 0.2 p = 0.118
- - -
1.1 ± 0.2 p = 0.010
- - -
0.9 ± 0.2 p = 0.484
- - -
1.1 ± 0.3 p = 0.182
- - -
- -
1.9 [1.5–4.8] p < 0.001
- -
5.4 [3.7–7.7] p < 0.001
- -
2.2 [1.3–5.1] p < 0.001
- -
5.3 [3.6–8.0] p < 0.001
- -
3.0 [1.6–6.3] p < 0.001
- -
6.6 [4.0–10.3] p < 0.001
91
Figure 20. Bland-Altman plots of masticatory muscle activity (MMA) indices between electrode set PSG montages and standard PSG montage in study I. smax = upper limit of agreement (mean + 1.96 x standard deviation (SD)), µ = mean MMA index difference, smin = lower limit of agreement (mean - 1.96 x SD).
Figure 21. Bland-Altman plots of masticatory muscle activity (MMA) indices between reduced montages and standard PSG montage in study II. smax = upper limit of agreement (mean + 1.96 x standard deviation (SD)), µ = mean MMA index difference, smin = lower limit of agreement (mean - 1.96 x SD).
31227203_UEF_Vaitoskirja_NO_351_Tomi_Miettinen_LUMET_sisus_19_10_02.indd 112 02/10/2019 7.49
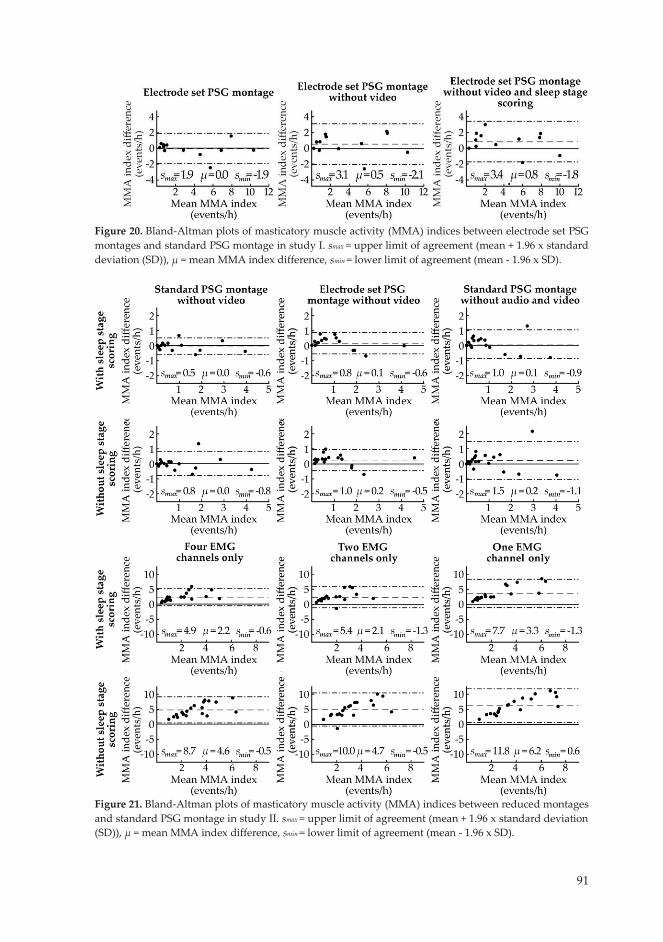
91
Figure 20. Bland-Altman plots of masticatory muscle activity (MMA) indices between electrode set PSG montages and standard PSG montage in study I. smax = upper limit of agreement (mean + 1.96 x standard deviation (SD)), µ = mean MMA index difference, smin = lower limit of agreement (mean - 1.96 x SD).
Figure 21. Bland-Altman plots of masticatory muscle activity (MMA) indices between reduced montages and standard PSG montage in study II. smax = upper limit of agreement (mean + 1.96 x standard deviation (SD)), µ = mean MMA index difference, smin = lower limit of agreement (mean - 1.96 x SD).
31227203_UEF_Vaitoskirja_NO_351_Tomi_Miettinen_LUMET_sisus_19_10_02.indd 113 02/10/2019 7.49
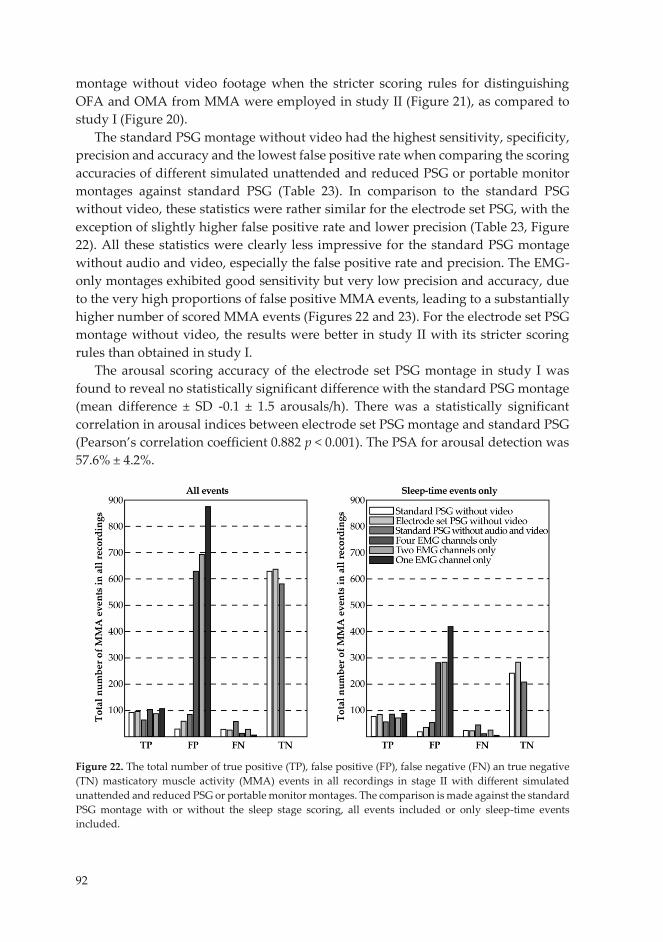
92
montage without video footage when the stricter scoring rules for distinguishing OFA and OMA from MMA were employed in study II (Figure 21), as compared to study I (Figure 20).
The standard PSG montage without video had the highest sensitivity, specificity, precision and accuracy and the lowest false positive rate when comparing the scoring accuracies of different simulated unattended and reduced PSG or portable monitor montages against standard PSG (Table 23). In comparison to the standard PSG without video, these statistics were rather similar for the electrode set PSG, with the exception of slightly higher false positive rate and lower precision (Table 23, Figure 22). All these statistics were clearly less impressive for the standard PSG montage without audio and video, especially the false positive rate and precision. The EMG-only montages exhibited good sensitivity but very low precision and accuracy, due to the very high proportions of false positive MMA events, leading to a substantially higher number of scored MMA events (Figures 22 and 23). For the electrode set PSG montage without video, the results were better in study II with its stricter scoring rules than obtained in study I.
The arousal scoring accuracy of the electrode set PSG montage in study I was found to reveal no statistically significant difference with the standard PSG montage (mean difference ± SD -0.1 ± 1.5 arousals/h). There was a statistically significant correlation in arousal indices between electrode set PSG montage and standard PSG (Pearson’s correlation coefficient 0.882 p < 0.001). The PSA for arousal detection was 57.6% ± 4.2%.
Figure 22. The total number of true positive (TP), false positive (FP), false negative (FN) an true negative (TN) masticatory muscle activity (MMA) events in all recordings in stage II with different simulated unattended and reduced PSG or portable monitor montages. The comparison is made against the standard PSG montage with or without the sleep stage scoring, all events included or only sleep-time events included.
31227203_UEF_Vaitoskirja_NO_351_Tomi_Miettinen_LUMET_sisus_19_10_02.indd 114 02/10/2019 7.49
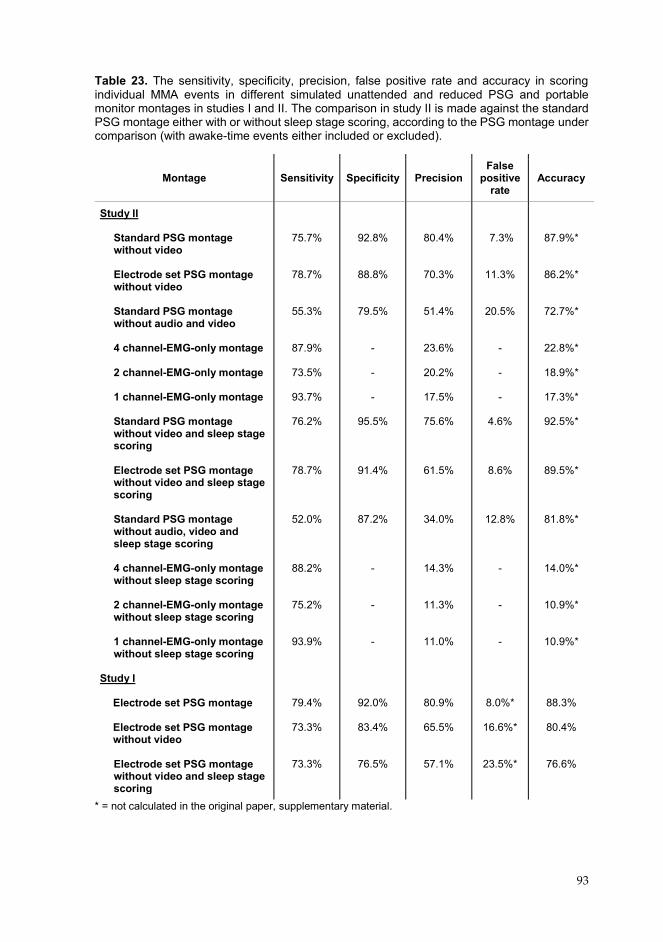
92
montage without video footage when the stricter scoring rules for distinguishing OFA and OMA from MMA were employed in study II (Figure 21), as compared to study I (Figure 20).
The standard PSG montage without video had the highest sensitivity, specificity, precision and accuracy and the lowest false positive rate when comparing the scoring accuracies of different simulated unattended and reduced PSG or portable monitor montages against standard PSG (Table 23). In comparison to the standard PSG without video, these statistics were rather similar for the electrode set PSG, with the exception of slightly higher false positive rate and lower precision (Table 23, Figure 22). All these statistics were clearly less impressive for the standard PSG montage without audio and video, especially the false positive rate and precision. The EMG-only montages exhibited good sensitivity but very low precision and accuracy, due to the very high proportions of false positive MMA events, leading to a substantially higher number of scored MMA events (Figures 22 and 23). For the electrode set PSG montage without video, the results were better in study II with its stricter scoring rules than obtained in study I.
The arousal scoring accuracy of the electrode set PSG montage in study I was found to reveal no statistically significant difference with the standard PSG montage (mean difference ± SD -0.1 ± 1.5 arousals/h). There was a statistically significant correlation in arousal indices between electrode set PSG montage and standard PSG (Pearson’s correlation coefficient 0.882 p < 0.001). The PSA for arousal detection was 57.6% ± 4.2%.
Figure 22. The total number of true positive (TP), false positive (FP), false negative (FN) an true negative (TN) masticatory muscle activity (MMA) events in all recordings in stage II with different simulated unattended and reduced PSG or portable monitor montages. The comparison is made against the standard PSG montage with or without the sleep stage scoring, all events included or only sleep-time events included.
93
Table 23. The sensitivity, specificity, precision, false positive rate and accuracy in scoring individual MMA events in different simulated unattended and reduced PSG and portable monitor montages in studies I and II. The comparison in study II is made against the standard PSG montage either with or without sleep stage scoring, according to the PSG montage under comparison (with awake-time events either included or excluded).
* = not calculated in the original paper, supplementary material.
Montage Sensitivity Specificity Precision False
positive rate
Accuracy
Study II
Standard PSG montage without video
Electrode set PSG montage without video
Standard PSG montage without audio and video
4 channel-EMG-only montage
2 channel-EMG-only montage 1 channel-EMG-only montage
Standard PSG montage without video and sleep stage scoring Electrode set PSG montage without video and sleep stage scoring Standard PSG montage without audio, video and sleep stage scoring 4 channel-EMG-only montage without sleep stage scoring 2 channel-EMG-only montage without sleep stage scoring 1 channel-EMG-only montage without sleep stage scoring
Study I
Electrode set PSG montage Electrode set PSG montage without video Electrode set PSG montage without video and sleep stage scoring
75.7%
78.7%
55.3%
87.9%
73.5%
93.7%
76.2%
78.7%
52.0%
88.2%
75.2%
93.9%
79.4%
73.3%
73.3%
92.8%
88.8%
79.5%
-
- -
95.5%
91.4%
87.2% - - -
92.0%
83.4%
76.5%
80.4%
70.3%
51.4%
23.6%
20.2%
17.5%
75.6%
61.5%
34.0%
14.3%
11.3%
11.0%
80.9%
65.5%
57.1%
7.3%
11.3%
20.5%
-
- -
4.6%
8.6%
12.8% - - -
8.0%*
16.6%*
23.5%*
87.9%*
86.2%*
72.7%*
22.8%*
18.9%*
17.3%*
92.5%*
89.5%*
81.8%*
14.0%*
10.9%*
10.9%*
88.3%
80.4%
76.6%
31227203_UEF_Vaitoskirja_NO_351_Tomi_Miettinen_LUMET_sisus_19_10_02.indd 115 02/10/2019 7.49

94
Figure 23. The total number of all scored events with different simulated unattended and reduced PSG and portable monitor montages in study II. 8.3 TECHNICAL QUALITY AND FAILURE RATE OF THE
RECORDINGS
The clear majority of the recordings (90%) assessed in stages 1 (19 recordings) and 2 (21 recordings) of study III were graded having a “good” or better quality (Table 24). The failure rate of the recordings in study III was 5%, as only two recordings failed, one in stage 1 and another in stage 2. In stage 1, the failed recording was caused by a malfunction of the recorder, as no data was found after the volunteer had returned the device. In stage 2, one recording failed as the volunteer did not remove the electrode covers before applying the set with the tape that was included in the equipment case. When full data losses caused by problems with the recorder were excluded, 96.9% of all TRT was scorable for SB. As a comparison for the failure rate results, a total of 72 recordings in 24 subjects were conducted in study IV (the first recorded night from 11 subjects was also assessed in the stage 2 of study III). Only two recordings failed technically due to recording device malfunctions, which resulted in a failure rate of only 2.8%, none due to the electrode set appliance. If all 101 recordings in stages III and IV are considered, then only 4 of them failed, corresponding to a failure rate of 4.0%. Only 1 out of the 101 recordings (1%) failed due to the electrode set.
31227203_UEF_Vaitoskirja_NO_351_Tomi_Miettinen_LUMET_sisus_19_10_02.indd 116 02/10/2019 7.49

95
Table 24. The technical quality grades of the recordings in stages 1 and 2 of study III, presented as the number and proportion of recordings with corresponding quality grades and the reasons explaining why the quality grade was anything other than outstanding. Recordings graded as poor or unsatisfactory were considered as failed studies.
There were occasionally high proportions of signal losses in individual channels, most commonly from the beginning of the recording, but problems with the electrodes were usually restricted to a couple of electrodes at one time (Table 25). At least one channel (any single channel) in all signal groups had the highest quality grade “A” in 84% or more recordings made in stage 1. Similarly, the proportion of recordings with the quality grade “A” in stage 2 was 81% or more in all signal groups, except for chin EMG that suffered from detachment of the cable connecting the electrodes to the recorder (Table 27). In single channels (e.g. Af8), the proportion of recordings with better signal quality grades was generally lower than in the
Quality Grade All recordings Stage 1 Reason Stage 2 Reason
Outstanding Excellent Very good Good Fair Poor Unsatisfactory
15/40 (37.5%)
17/40
(42.5%)
0/40 (0.0%)
4/40
(10.0%)
2/40 (5.0%)
1/40 (2.5%)
1/40
(2.5%)
7/19 (36.8%)
10/19
(52.6%)
0/19 (0.0%)
0/19
(0.0%)
1/19 (5.3%)
1/19 (5.3%)
0/19
(0.0%)
- 7 (36.8%): Bad contact in an EEG working electrode 2 (10.5%): EEG or EOG sweat artifact 1 (5.3%): Bad contact in a chin EMG reference electrode - - 1 (5.3%): Bad con-tact in both EEG reference electrodes 1 (5.3%): Recording device malfunction -
8/21 (38.1%)
7/21
(33.3%)
0/21
(0.0%)
4/21 (19.0%)
1/21 (4.7%)
0/21 (0.0%)
1/21
(4.7%)
- 2 (9.5%): Bad contact in an EEG working electrode 2 (9.5%): TRT less than six hours 1 (4.8%): Bad contact in a masseter EMG electrode 1 (4.8%): Recording ended prematurely 1 (4.8%): EEG or EOG sweat artifact - 4 (19.0%): Chin EMG electrode cable detached 1 (4.7%): Chin EMG electrode cable detached - 1 (4.7%): Electrode covers were not removed before recording
31227203_UEF_Vaitoskirja_NO_351_Tomi_Miettinen_LUMET_sisus_19_10_02.indd 117 02/10/2019 7.49
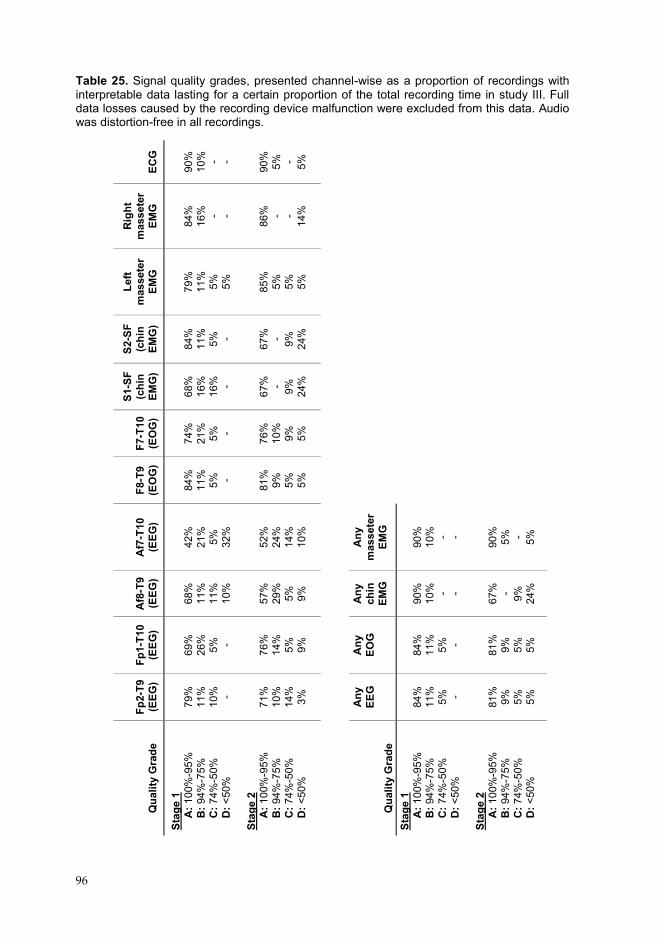
96
Table 25. Signal quality grades, presented channel-wise as a proportion of recordings with interpretable data lasting for a certain proportion of the total recording time in study III. Full data losses caused by the recording device malfunction were excluded from this data. Audio was distortion-free in all recordings.
ECG
90
%
10%
- -
90%
5%
- 5%
Rig
ht
mas
sete
r EM
G
84
%
16%
- -
86%
- -
14%
Left
mas
sete
r EM
G
79
%
11%
5%
5%
85%
5%
5%
5%
S2-S
F (c
hin
EMG
)
84
%
11%
5%
-
67%
- 9%
24
%
S1-S
F (c
hin
EMG
)
68
%
16%
16
%
- 67
%
- 9%
24%
F7-T
10
(EO
G)
74
%
21%
5%
-
76%
10
%
9%
5%
F8-T
9 (E
OG
)
84
%
11%
5%
-
81%
9%
5%
5%
Af7
-T10
(E
EG)
42
%
21%
5%
32
%
52
%
24%
14
%
10%
Any
m
asse
ter
EMG
90
%
10%
- -
90%
5%
- 5%
Af8
-T9
(EEG
)
68
%
11%
11
%
10%
57%
29
%
5%
9%
Any
ch
in
EMG
90
%
10%
- -
67%
- 9%
24
%
Fp1-
T10
(EEG
)
69
%
26%
5%
-
76%
14
%
5%
9%
Any
EO
G
84
%
11%
5%
-
81%
9%
5%
5%
Fp2-
T9
(EEG
)
79
%
11%
10
%
- 71
%
10%
14
%
3%
Any
EE
G
84
%
11%
5%
-
81%
9%
5%
5%
Qua
lity
Gra
de
Stag
e 1
A
: 100
%-9
5%
B
: 94%
-75%
C: 7
4%-5
0%
D
: <50
%
Stag
e 2
A
: 100
%-9
5%
B
: 94%
-75%
C: 7
4%-5
0%
D
: <50
%
Qua
lity
Gra
de
Stag
e 1
A
: 100
%-9
5%
B
: 94%
-75%
C: 7
4%-5
0%
D
: <50
%
Stag
e 2
A
: 100
%-9
5%
B
: 94%
-75%
C: 7
4%-5
0%
D
: <50
%
31227203_UEF_Vaitoskirja_NO_351_Tomi_Miettinen_LUMET_sisus_19_10_02.indd 118 02/10/2019 7.49

97
corresponding signal groups (e.g. all EEG channels) (Table 25). On average, the electrode set and the other parts of the recording equipment were considered as easy to apply by the volunteers (Table 26).
The proportions of lost signals were especially high with electrodes Af8 (10.7% of TRT) and Af7 (28.9% of TRT) in stage 1, due to the fact that the electrode set was too wide for some of the volunteers and the electrodes were applied on top of the hairline (Table 27). In stage 2, the electrodes were positioned laterally closer to the midline of the face, and the proportion of lost signals was reduced to 4.5% of TRT for the Af8 electrode and 4.1% of TRT for the Af7 electrode. Out of the 21 recordings in stage 2, 76.3% of all signal losses in minutes occurred in the ten recordings conducted in the dental clinic.
The electrical impedances of working electrodes were below 75 kΩ in approximately 90% of the measured data points (one in every full hour of the recording) in both stages, with the exception of the Af8 and Af7 electrodes that were often placed on the hairline in stage 1 (Table 28). The problem with the impedances of these electrodes was corrected in stage 2 due to the repositioning of the electrodes, resulting in fewer high impedance data points. The electrical impedances generally were stable throughout the recordings and high impedance values were commonly present only from the beginning of the recording as the result of an inadequate preparation of the skin or electrode misplacement.
Table 26. The subjective perception of the ease with which the recording equipment could be applied in study III by the volunteers. The perceived easiness was assessed with a questionnaire with a ten-point scale, 1 corresponding to “easy” and 10 corresponding to “difficult”. Results are presented as mean ± SD, and statistical significance of the difference between stages 1 and 2 was assessed with Mann-Whitney U-test.
* = Separately assessed only in stage 2. ** = Mainly the recorder in both stages and the separate ECG recorder in stage 1.
Equipment Stage 1 (mean ± SD)
Stage 2 (mean ± SD)
p-value (mean ± SD)
EEG, EOG, and masseter EMG electrodes Chin EMG electrodes* ECG electrodes* Other sensors** Cables
3.9 ± 2.4
- -
1.8 ± 1.0
1.7 ± 0.9
3.3 ± 2.0
2.1 ± 1.4
2.0 ± 1.9
2.0 ± 1.7
1.9 ± 1.2
0.44
- -
0.61
0.96
31227203_UEF_Vaitoskirja_NO_351_Tomi_Miettinen_LUMET_sisus_19_10_02.indd 119 02/10/2019 7.49
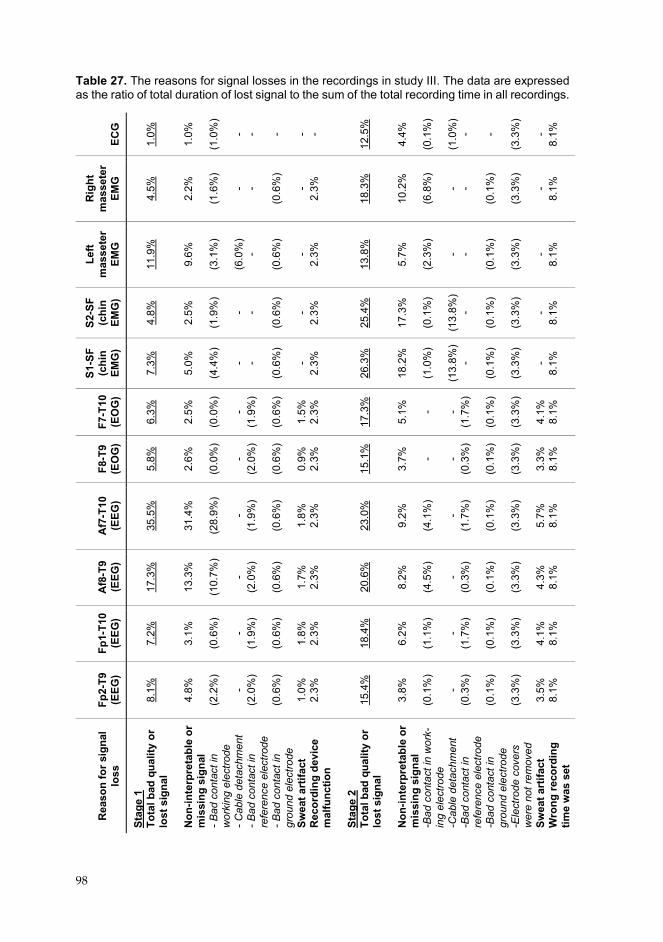
98
Table 27. The reasons for signal losses in the recordings in study III. The data are expressed as the ratio of total duration of lost signal to the sum of the total recording time in all recordings.
ECG
1.
0%
1.
0%
(1
.0%
) - - - - -
12.5
%
4.
4%
(0
.1%
)
(1.0
%)
- - (3
.3%
) -
8.1%
Rig
ht
mas
sete
r EM
G
4.
5%
2.
2%
(1
.6%
) - -
(0.6
%)
- 2.
3%
18
.3%
10.2
%
(6
.8%
) - -
(0.1
%)
(3
.3%
) -
8.1%
Left
mas
sete
r EM
G
11
.9%
9.6%
(3.1
%)
(6
.0%
) -
(0.6
%)
- 2.
3%
13
.8%
5.7%
(2.3
%)
- - (0
.1%
)
(3.3
%)
- 8.
1%
S2-S
F (c
hin
EMG
)
4.
8%
2.
5%
(1
.9%
) - -
(0.6
%)
- 2.
3%
25
.4%
17.3
%
(0
.1%
)
(13.
8%)
- (0
.1%
)
(3.3
%)
- 8.
1%
S1-S
F (c
hin
EMG
)
7.
3%
5.
0%
(4
.4%
) - -
(0.6
%)
- 2.
3%
26
.3%
18.2
%
(1
.0%
)
(13.
8%)
- (0
.1%
)
(3.3
%)
- 8.
1%
F7-T
10
(EO
G)
6.
3%
2.
5%
( 0
.0%
) -
(1.9
%)
(0
.6%
)
1.5%
2.
3%
17
.3%
5.1%
- -
(1.7
%)
(0
.1%
)
(3.3
%)
4.
1%
8.1%
F8-T
9 (E
OG
)
5.
8%
2.
6%
(0
.0%
) -
(2.0
%)
(0
.6%
)
0.9%
2.
3%
15
.1%
3.7%
- -
(0.3
%)
(0
.1%
)
(3.3
%)
3.
3%
8.1%
Af7
-T10
(E
EG)
35
.5%
31.4
%
(2
8.9%
) -
(1.9
%)
(0
.6%
)
1.8%
2.
3%
23
.0%
9.2%
(4.1
%)
- (1
.7%
)
(0.1
%)
(3
.3%
)
5.7%
8.
1%
Af8
-T9
(EEG
)
17
.3%
13.3
%
(1
0.7%
) -
(2.0
%)
(0
.6%
)
1.7%
2.
3%
20
.6%
8.2%
(4.5
%)
- (0
.3%
)
(0.1
%)
(3
.3%
)
4.3%
8.
1%
Fp1-
T10
(EEG
)
7.
2%
3.
1%
(0
.6%
) -
(1.9
%)
(0
.6%
)
1.8%
2.
3%
18
.4%
6.2%
(1.1
%)
- (1
.7%
)
(0.1
%)
(3
.3%
)
4.1%
8.
1%
Fp2-
T9
(EEG
)
8.
1%
4.
8%
(2
.2%
) -
(2.0
%)
(0
.6%
)
1.0%
2.
3%
15
.4%
3.8%
(0.1
%)
- (0
.3%
)
(0.1
%)
(3
.3%
)
3.5%
8.
1%
Rea
son
for s
igna
l lo
ss
Stag
e 1
Tota
l bad
qua
lity
or
lost
sig
nal
Non
-inte
rpre
tabl
e or
m
issi
ng s
igna
l - B
ad c
onta
ct in
w
orki
ng e
lect
rode
- C
able
det
achm
ent
- Bad
con
tact
in
refe
renc
e el
ectro
de
- Bad
con
tact
in
grou
nd e
lect
rode
Sw
eat a
rtifa
ct
Rec
ordi
ng d
evic
e m
alfu
nctio
n St
age
2 To
tal b
ad q
ualit
y or
lo
st s
igna
l N
on-in
terp
reta
ble
or
mis
sing
sig
nal
-Bad
con
tact
in w
ork-
ing
elec
trode
-C
able
det
achm
ent
-Bad
con
tact
in
refe
renc
e el
ectro
de
-Bad
con
tact
in
grou
nd e
lect
rode
-E
lect
rode
cov
ers
wer
e no
t rem
oved
Sw
eat a
rtifa
ct
Wro
ng re
cord
ing
time
was
set
31227203_UEF_Vaitoskirja_NO_351_Tomi_Miettinen_LUMET_sisus_19_10_02.indd 120 02/10/2019 7.49
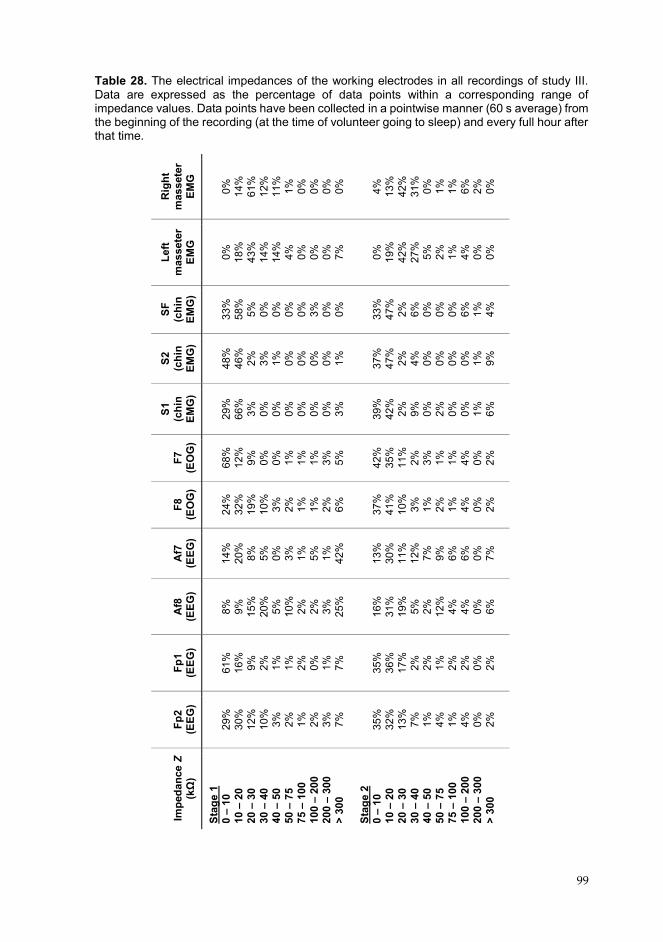
99
Table 28. The electrical impedances of the working electrodes in all recordings of study III. Data are expressed as the percentage of data points within a corresponding range of impedance values. Data points have been collected in a pointwise manner (60 s average) from the beginning of the recording (at the time of volunteer going to sleep) and every full hour after that time.
Rig
ht
mas
sete
r EM
G
0%
14
%
61%
12
%
11%
1%
0%
0%
0%
0%
4%
13%
42
%
31%
0%
1%
1%
6%
2%
0%
Left
mas
sete
r EM
G
0%
18
%
43%
14
%
14%
4%
0%
0%
0%
7%
0%
19%
42
%
27%
5%
2%
1%
4%
0%
0%
SF
(chi
n EM
G)
33
%
58%
5%
0%
0%
0%
0%
3%
0%
0%
33%
47
%
2%
6%
0%
0%
0%
6%
1%
4%
S2
(chi
n EM
G)
48
%
46%
2%
3%
1%
0%
0%
0%
0%
1%
37%
47
%
2%
4%
0%
0%
0%
0%
1%
9%
S1
(chi
n EM
G)
29
%
66%
3%
0%
0%
0%
0%
0%
0%
3%
39%
42
%
2%
9%
0%
2%
0%
0%
1%
6%
F7
(EO
G)
68
%
12%
9%
0%
0%
1%
1%
1%
3%
5%
42%
35
%
11%
2%
3%
1%
1%
4%
0%
2%
F8
(EO
G)
24
%
32%
19
%
10%
3%
2%
1%
1%
2%
6%
37%
41
%
10%
3%
1%
2%
1%
4%
0%
2%
Af7
(E
EG)
14
%
20%
8%
5%
0%
3%
1%
5%
1%
42
%
13
%
30%
11
%
12%
7%
9%
6%
6%
0%
7%
Af8
(E
EG)
8%
9%
15
%
20%
5%
10
%
2%
2%
3%
25%
16%
31
%
19%
5%
2%
12
%
4%
4%
0%
6%
Fp1
(EEG
)
61
%
16%
9%
2%
1%
1%
2%
0%
1%
7%
35%
36
%
17%
2%
2%
1%
2%
2%
0%
2%
Fp2
(EEG
)
29
%
30%
12
%
10%
3%
2%
1%
2%
3%
7%
35%
32
%
13%
7%
1%
4%
1%
4%
0%
2%
Impe
danc
e Z
(kΩ)
Stag
e 1
0 –
10
10 –
20
20 –
30
30 –
40
40 –
50
50 –
75
75 –
100
10
0 –
200
200 –
300
> 30
0 St
age
2 0 –
10
10 –
20
20 –
30
30 –
40
40 –
50
50 –
75
75 –
100
10
0 –
200
200 –
300
> 30
0
31227203_UEF_Vaitoskirja_NO_351_Tomi_Miettinen_LUMET_sisus_19_10_02.indd 121 02/10/2019 7.49
100
8.4 NIGHT-TO-NIGHT VARIABILITY AND THE PRESENCE OF THE FIRST-NIGHT EFFECT
A statistically significant difference across the three nights was found in one-way RM-ANOVA in three sleep bruxism variables (Table 29): MMA event index (p = 0.009), BTI (p = 0.016), and burst index (p = 0.049). The MMA index was low for the majority of the subjects on the first night (1.2 ± 1.2 events/h, mean ± SD), as 11/16 (68.8%) of subjects had their lowest MMA index on the first night (Figure 24). The mean MMA indices on the second and third nights were higher than on the first night with statistical significance in the post hoc pairwise Bonferroni tests (1.8 ± 1.3 events/h, p = 0.048, and 1.9 ± 1.4 events/h, p = 0.039, respectfully). Furthermore, most of the subjects (14/16, 87.5%) had their highest MMA index on the second (9/16, 56.3%) or third night (7/16, 43.8%). Two subjects had the same MMA index on both second and third nights. Furthermore, 12/16 (75.0%) of subjects had a higher MMA index on the second night compared to the first night and 13/16 (81.3%) on the third night in comparison to the first night. The intra-subject variablity of MMA event index ranged from 14.6% to 73.7%, and the mean CV for MMA index was 50.7%. No statistically significant differences in the post hoc Bonferroni tests were found for BTI and the burst index. Across the three nights, no differences between the nights were found with the RM-ANOVA for other sleep variables (Table 29).
In two-way RM-ANOVA, no two-way interactions were found between the night of the recording and the groups of bruxers (classified as such based on any recorded night) and non-bruxers (no MMA index higher than 2 events/h on any of the nights) (Table 30). However, statistically significant group differences were found in MMA event index (p < 0.001), BTI (p < 0.001) and burst index (p = 0.005), and statistically significant differences across the three nights in MMA event index (p = 0.010) and BTI (p = 0.020). These results indicate that both groups had experienced FNE, but the groups displayed statistically significant differences between the groups in the aforementioned sleep bruxism variables.
31227203_UEF_Vaitoskirja_NO_351_Tomi_Miettinen_LUMET_sisus_19_10_02.indd 122 02/10/2019 7.49
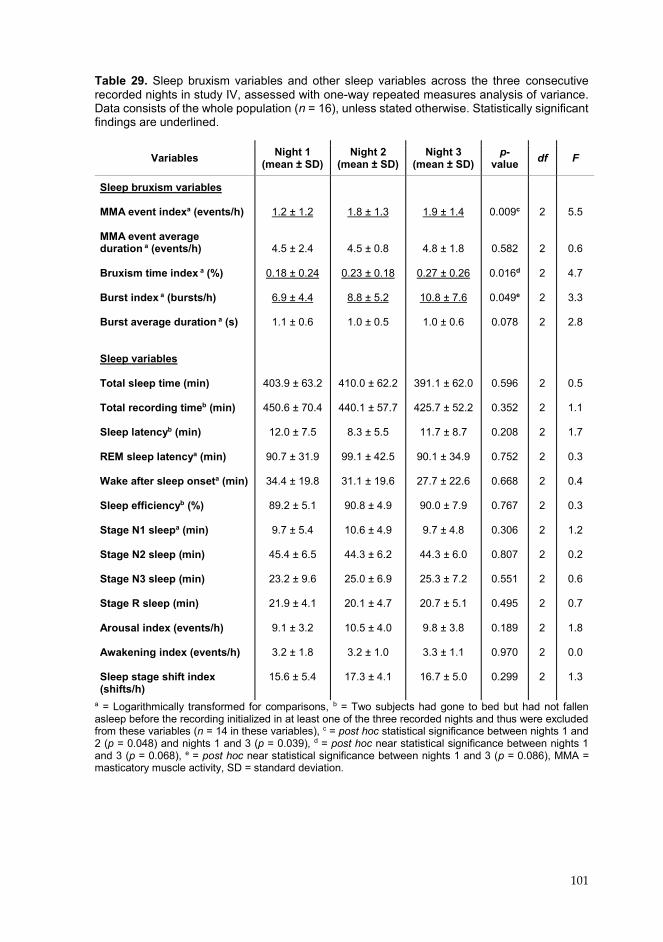
101
Table 29. Sleep bruxism variables and other sleep variables across the three consecutive recorded nights in study IV, assessed with one-way repeated measures analysis of variance. Data consists of the whole population (n = 16), unless stated otherwise. Statistically significant findings are underlined.
a = Logarithmically transformed for comparisons, b = Two subjects had gone to bed but had not fallen asleep before the recording initialized in at least one of the three recorded nights and thus were excluded from these variables (n = 14 in these variables), c = post hoc statistical significance between nights 1 and 2 (p = 0.048) and nights 1 and 3 (p = 0.039), d = post hoc near statistical significance between nights 1 and 3 (p = 0.068), e = post hoc near statistical significance between nights 1 and 3 (p = 0.086), MMA = masticatory muscle activity, SD = standard deviation.
Variables Night 1 (mean ± SD)
Night 2 (mean ± SD)
Night 3 (mean ± SD)
p-value df F
Sleep bruxism variables MMA event indexa (events/h) MMA event average duration a (events/h) Bruxism time index a (%) Burst index a (bursts/h) Burst average duration a (s) Sleep variables Total sleep time (min) Total recording timeb (min) Sleep latencyb (min) REM sleep latencya (min) Wake after sleep onseta (min) Sleep efficiencyb (%) Stage N1 sleepa (min) Stage N2 sleep (min) Stage N3 sleep (min) Stage R sleep (min) Arousal index (events/h) Awakening index (events/h) Sleep stage shift index (shifts/h)
1.2 ± 1.2
4.5 ± 2.4 0.18 ± 0.24
6.9 ± 4.4
1.1 ± 0.6
403.9 ± 63.2
450.6 ± 70.4
12.0 ± 7.5
90.7 ± 31.9
34.4 ± 19.8
89.2 ± 5.1
9.7 ± 5.4
45.4 ± 6.5
23.2 ± 9.6
21.9 ± 4.1
9.1 ± 3.2
3.2 ± 1.8
15.6 ± 5.4
1.8 ± 1.3
4.5 ± 0.8 0.23 ± 0.18
8.8 ± 5.2
1.0 ± 0.5
410.0 ± 62.2
440.1 ± 57.7
8.3 ± 5.5
99.1 ± 42.5
31.1 ± 19.6
90.8 ± 4.9
10.6 ± 4.9
44.3 ± 6.2
25.0 ± 6.9
20.1 ± 4.7
10.5 ± 4.0
3.2 ± 1.0
17.3 ± 4.1
1.9 ± 1.4
4.8 ± 1.8 0.27 ± 0.26
10.8 ± 7.6
1.0 ± 0.6
391.1 ± 62.0
425.7 ± 52.2
11.7 ± 8.7
90.1 ± 34.9
27.7 ± 22.6
90.0 ± 7.9
9.7 ± 4.8
44.3 ± 6.0
25.3 ± 7.2
20.7 ± 5.1
9.8 ± 3.8
3.3 ± 1.1
16.7 ± 5.0
0.009c
0.582 0.016d
0.049e
0.078
0.596
0.352
0.208
0.752
0.668
0.767
0.306
0.807
0.551
0.495
0.189
0.970
0.299
2
2 2
2
2
2
2
2
2
2
2
2
2
2
2
2
2
2
5.5 0.6
4.7
3.3
2.8
0.5
1.1
1.7
0.3
0.4
0.3
1.2
0.2
0.6
0.7
1.8
0.0
1.3
31227203_UEF_Vaitoskirja_NO_351_Tomi_Miettinen_LUMET_sisus_19_10_02.indd 123 02/10/2019 7.49

102
Figure 24. The masticatory muscle activity (MMA) event index, bruxism time index and burst index of each volunteer across the three consecutive recorded nights in study IV. The threshold value of MMA = 2 events/h is illustrated as a horizontal line in the leftmost graph. Table 30. Sleep bruxism variables assessed in the three consecutive recorded nights in the bruxer group (n = 9) and the non-bruxer group (n = 7) with two-way repeated measures analysis of variance (RM-ANOVA). Statistically significant findings are underlined.
a = Logarithmically transformed for comparisons, b = p-value across the three nights with RM-ANOVA, c = p-value between the bruxer and non-bruxer groups with RM-ANOVA, d = p-value of the interaction between time and group with RM-ANOVA, e = post hoc statistical significance between nights 1 and 2 (p = 0.048) and between nights 1 and 3 (p = 0.049), f = post hoc near statistical significance between nights 1 and 2 (p = 0.092), MMA = masticatory muscle activity, SD = standard deviation.
Variables Night 1 (mean ± SD)
Night 2 (mean ± SD)
Night 3 (mean ± SD) Timeb Groupc Inter-
actiond
MMA event indexa (events/h)
Bruxers Non-bruxers
MMA event average duration a (events/h)
Bruxers Non-bruxers
Bruxism time index a (%) Bruxers Non-bruxers
Burst index a (bursts/h) Bruxers Non-bruxers
Burst average duration a (s)
Bruxers Non-bruxers
1.7 ± 1.4 0.6 ± 0.6
5.1 ± 2.9 3.7 ± 1.5
0.27 ± 0.29 0.07 ± 0.08
8.2 ± 5.0 5.2 ± 3.0
1.3 ± 0.7 0.8 ± 0.2
2.5 ± 1.2 0.8 ± 0.4
4.7 ± 0.5 4.2 ± 1.1
0.33 ± 0.16 0.09 ± 0.06
11.7 ± 5.4 5.2 ± 1.6
1.1 ± 0.7 0.8 ± 0.2
2.9 ± 1.0 0.7 ± 0.4
4.9 ± 1.6 4.6 ± 2.2
0.42 ± 0.25 0.07 ± 0.04
14.9 ± 7.8 5.5 ± 2.3
1.1 ± 0.6 0.8 ± 0.2
0.010e
0.525
0.020f
0.075
0.106
<0.001
0.177
<0.001
0.005
0.258
0.611
0.616
0.647
0.268
0.367
31227203_UEF_Vaitoskirja_NO_351_Tomi_Miettinen_LUMET_sisus_19_10_02.indd 124 02/10/2019 7.49
103
9 DISCUSSION
The presented results can be summarized as follows: firstly, patient classification and the MMA event scoring accuracy of the electrode set PSG montage were found to show a good agreement with the standard PSG. Secondly, the electrode set was found to be reliable and easy enough for patient self-use such that high quality type II PSG recordings could be obtained with a failure rate comparable or even lower than standard type II PSG. Thirdly, indications of FNE were found and they were associated with high night-to-night variablity in this population of volunteers. 9.1 ACCURACY OF THE ELECTRODE SET IN THE ASSESSMENT
OF SLEEP BRUXISM As the results revealed, the patient classification and the MMA event scoring accuracy of the electrode set PSG montages corresponded to the standard PSG montages rather well when this was assessed in the present subject populations. In studies I and II, the montages with similar supplemented sets of audio and/or video footage under comparison either had very good consistency and monotonicity of MMA indices between them (in study I: electrode set PSG and standard PSG, both with audio and video), or the consistency and monotonicity of the montages under comparison were at a similar level when they were compared to the standard PSG with audio and video (in study II: electrode set PSG and standard PSG, both without video). Furthermore, patient classification results were similar, and no statistically significant differences in MMA indices were found between the above-mentioned montages. If any differences between the electrode set PSG montage and the standard PSG montage were found, the differences were mostly attributable to either i) a difference in the means to distinguish MMA from OFA or OMA, ii) a difference in the utilization of the sleep stage scoring and the concomitant exclusion or inclusion of the MMA events during wakefulness, or iii) a difference in the derivation type of the EMG channels or the number of EMG channels utilized in the MMA scoring. Furthermore, the utilization of different scoring rules was found to affect the classification and MMA scoring, regardless of the montage. 9.1.1 Patient Classification Accuracy The electrode set PSG montage yielded similar results with the standard PSG every time when both montages were supplemented with the same means to distinguish MMA from OFA and OMA. However, as stated, the exclusion of any of the means to distinguish MMA from OFA and OMA affected the classification or the MMA scoring accuracy significantly in both studies I and II. The effect was observed in
31227203_UEF_Vaitoskirja_NO_351_Tomi_Miettinen_LUMET_sisus_19_10_02.indd 125 02/10/2019 7.49
104
study I as the number of subjects classified as bruxers was overestimated by one subject with the electrode set PSG montage without video footage (when compared to standard PSG with audio and video), and also in study II with the standard PSG montage without audio and video by one subject (when compared to the standard PSG montage that included audio). The classification with the EMG-only setups with no means to distinguish the MMA from OFA and OMA resulted in significantly more subjects being classified as bruxers, when the same classification thresholds for MMA index were applied as in PSG.
It should be noted that the thresholds applied here are usually not used with type IV devices. The thresholds are often modified to correspond better to the recorded EMG activity (in addition to MMA, these consist of a varying number of OFA and OMA). Typically, the new thresholds are made to correspond to a certain level of MMA events or indices, or to a certain type of classification from the results obtained with standard PSG or even clinical symptoms (Mainieri et al., 2012; Stuginski-Barbosa et al., 2016; Yachida et al., 2016; Maeda et al., 2019). However, the implementation of these kinds of thresholds would require that there would be a highly linear or at least a monotonic relationship between the device and the standard PSG, which has been shown to be feasible (Castroflorio et al., 2014; Maeda et al., 2019), but is necessarily not the case with all devices based on our results for the EMG-only setups in study II and results obtained with some other devices (Stuginski-Barbosa et al., 2016; Restrepo et al., 2018). Our results in study II showed that a good monotonic relationship exists between the electrode set PSG and the standard PSG. Thus, if needed, the modified classification thresholds could presumably be utilized with the electrode set PSG with audio footage and without video footage. However, this would require a separate estimation to be conducted in much larger and also more representative patient populations. Nevertheless, the classification accuracy with electrode set PSG without video footage was remarkably good even with the currently used thresholds, holding promise for its further use. 9.1.2 Improving the Patient Classification Accuracy As the results of this thesis showed, the classification was not always unambiguous when it was based only on one recording. This view is supported by the finding that the standard PSG with both audio and video in study II had two extra predefined possible bruxers classified as bruxers as compared to the montages without video. Both these subjects had MMA indices only marginally over the threshold MMA index of 2.0 events/h. Subsequently, in one of these two subjects, the standard PSG recording was rescored and that time the subject was classified as a non-bruxer. If there are two clearly distinct groups of bruxers and non-bruxers, the classification produces clear, comparable results between two methods under investigation, but in the case of bruxers with MMA indices near the thresholds, the classification results may not be reliable. Furthermore, there is the question of how to designate those
31227203_UEF_Vaitoskirja_NO_351_Tomi_Miettinen_LUMET_sisus_19_10_02.indd 126 02/10/2019 7.49
105
patients that are classified differently on two or more nights, a very possible scenario due to the fact that some patients may have a FNE that requires repetition and as MMA is highly variable between nights, as has been shown both here (study IV) and by others (Dal Fabbro and Tufik, 1996; Lavigne et al., 2001; Hasegawa et al., 2013). In the future, it would be beneficial to test the classification accuracy of the electrode set based PSG with much larger patient population conducted with several recording nights. It would also be beneficial to clarify if there are better classification thresholds (or even other measures) available for the patient classification that would correspond better to the clinical symptoms or the progression of the health consequences (Lobbezoo et al., 2018). For example, Raphael et al. claimed that elevated background EMG activity is probably a stronger risk factor for TMD symptoms than SB (Raphael et al., 2013; Lobbezoo et al., 2018). Currently, the classification criteria that utilizes thresholds is not recommended for otherwise healthy patients, because current thresholds do not correspond very well to the detrimental health effects (Lobbezoo et al., 2018).
The current proposal by the recent SB diagnosis consensus group is that the results of a clinical and instrumental assessment should be evaluated in conjunction with the continuum of symptoms and MMA and thus should be evaluated case by case, but no practical guidelines have yet been issued (Lobbezoo et al., 2018). One reasonable suggestion to improve the classification was presented ten years ago: instead of arithmetic cut-off thresholds, perhaps cut-off bands could be utilized; these would be based on probabilities of how well the MMA index or its mean value in one, two or three nights corresponded to the probabilities of a patient being a bruxer and having a risk to experience detrimental health effects (Van Der Zaag et al., 2008). If the probability was considered too low to make a definite classification, a further assessment with the repetition of one or several more recordings would be required. However, creating such a model incorporating so many factors, would arguably require vast amounts of data on SB that it has not been previously been possible to collect. Furthermore, as was discussed before, the classification is heavily influenced by the recording montage being used and the thresholds selected, so the results would probably directly apply only to that montage. In addition, the presence of co-morbidities should probably be taken into account in such a model, as the co-morbidities potentially change the probabilities that the patient will develop detrimental health consequences with certain levels of MMA, e.g. patients with GERD that suffer from more severe tooth wear due to the fact that the effect of tooth grinding is amplified by the acidic environment caused by the acidic refluxes (Abe et al., 2009; Carra, 2018).
The above data collection and development of the means to classify patients more accurately would demand strict requirements for the recording equipment. As the MMA index is still considered as the most utilizable proxy for the level of SB severity, the first requirement would be having an accuracy level for scoring MMA as close as possible to the level of the standard type I PSG. The present electrode set has the
31227203_UEF_Vaitoskirja_NO_351_Tomi_Miettinen_LUMET_sisus_19_10_02.indd 127 02/10/2019 7.49
106
potential to fulfill this role, as results of this thesis have shown that the MMA scoring accuracy of the electrode set based PSG montage displayed a very good concordance and monotonicity with the standard PSG montage i.e. was comparable to the intra-scorer accuracy of the standard PSG montage. Furthermore, in addition to accuracy, the electrode set has the potential to fulfill the other requirements related to the other aspects of A4 principle (better applicability, affordability and accessibility) and these would be needed to collect of vast amounts of data in an affordable manner. 9.1.3 Event Scoring Accuracy The MMA scoring accuracy of the electrode set PSG montage without video was indeed found to have good concordance with the standard PSG with audio and video. The results were comparable to the intra-scorer accuracy of the standard PSG montage with audio and video (ICC: 0.985, p < 0.001), that on the other hand is also comparable to the intra-scorer agreement that Lavigne et al. have obtained for MMA scoring (ICC: 0.950, Lavigne et al., 1997). The ICC (0.940, p < 0.001) and monotonicity (Spearman’s correlation coefficient: 0.926, p < 0.001) of the electrode set PSG montage compared against the standard PSG montage were higher or at least nearly the same level with the unattended and reduced PSG and portable monitor montages that have been evaluated by others (ICC: 0.91, standard PSG without audio and video, Carra et al., 2015b), (Spearman’s correlation coefficient: 0.538 and 0.09, GrindCare, Stuginski-Barbosa et al., 2016; Restrepo et al., 2018), and (ICC: 0.88, Spearman’s correlation coefficient: 0.109, BMS TEL-EMG Yamaguchi et al., 2012).
However, the results revealed a possibility for the overestimation of the MMA index with the electrode set PSG montage without video. There were some cases where the mean MMA indices of the electrode set PSG montage compared to standard PSG montage were statistically significantly higher: i) in study I with the exclusion of video (in the non-bruxer group only), ii) in study I with the exclusion of video and sleep stage scoring (in the groups of non-bruxers and all subjects), as well as iii) in study II with the exclusion of video and sleep stage scoring (in the groups of non-bruxers and all subjects). However, especially in study II with stricter scoring rules, the differences in MMA indices between electrode set PSG and the standard PSG montage were rather small, especially when compared to the EMG-only setups that had no means to differentiate between MMA and OFA and OMA. As was shown in the Bland-Altman plots, the agreement weakened every time when any means to distinguish MMA from OFA or OMA was removed, as occurred with the individual event scoring accuracy in terms of precision (positive predictive value) and accuracy. Audio seemingly conferred some benefits in differentiating between MMA, OFA and OMA, as the precision and false positive rate in MMA event scoring were substantially lower in the standard PSG without audio and video montage when compared to the other PSG montages with audio.
31227203_UEF_Vaitoskirja_NO_351_Tomi_Miettinen_LUMET_sisus_19_10_02.indd 128 02/10/2019 7.49

107
As was already discussed, this sort of overestimation of the MMA index can be easily compensated for by changing the classification thresholds if the relationship between the true activity and the measured activity is linear or monotonous. One should also remember that the clinical findings associated with SB are currently the one factor that most strongly dictate the management approaches, and in the case of daily clinical practice the instrumental assessment is considered more as a mean to confirm the presence of SB. This process should be easily manageable with simple EMG-only devices with good linear or monotonous relationship with the true MMA frequency. The straightforward applicability, good affordability and accessibility are arguably more important in a clinical setting.
However, in research settings, any option with the best possible accuracy that is easily and affordably available is truly warranted to ensure that the assessment will be as accurate as possible, thus strengthening the power of the obtained results. Accurate MMA recognition is essential, especially in cases when the pathophysiology of SB or the efficacy of new treatment methods need to be evaluated. If one is unable to capture the true events related to SB, this could lead to serious outcomes. For example, if a drug company wishes to assess the efficacy of some sedative pharmaceutical product to reduce MMA events, and if the drug were only to reduce the number of movement events during the night but not actually to decrease the MMA events; in such a case, if the recorder would be unable to distinguish between MMA and these movement events, this would lead to possibly erroneous conclusions concerning the efficacy of the drug. As there are always numerous factors at play that may affect the outcomes of any research setting, it is preferable to minimize the error sources at every possible opportunity. The option of having the best possible accuracy with high enough applicablity supplemented with practicality-ensuring affordability and accessibility, would be highly beneficial. Any error source in the MMA assessment in the research setting should be minimized whenever possible. One possibility to improve the accuracy of unattended type II PSG recordings would be to assess the possibility of including video recordings, or some other novel means to distinguish MMA from OFA and OMA.
The results should also be repeatable, as was the case with most of the PSG montages in study II. Only the standard PSG montage without audio and video in study II did not show good repeatability, as it had substantially lower intra-scorer reliability than any other montage, even lower than the EMG-only montages. However, with appropriate scoring rules and having different channels for MMA recognition, it should be possible to utilize the standard PSG montages even without audio and video while achieving good intra-scorer reliability, as Carra et al. have showed (ICC: 0.97, Carra, Huynh and Lavigne, 2015). Unfortunately, we used only one scorer in all of these studies and thus the effect of scorer interpretation on inter-scorer accuracy could not be assessed. It has been nevertheless shown to usually be at a good level in other publications: (ICC: 0.91, Dutra et al., 2009) and (Kendall’s tau: > 0.54, Ferraz et al., 2015).
31227203_UEF_Vaitoskirja_NO_351_Tomi_Miettinen_LUMET_sisus_19_10_02.indd 129 02/10/2019 7.49

108
9.1.4 Factors Affecting the Scoring Accuracy The inclusion of sleep stage scoring and the exclusion of events during epochs scored as wakefulness resulted in slightly better consistency, monotonicity, and agreement of the MMA indices of the unattended and reduced PSG and portable monitor montages when they were compared to the standard PSG. The exclusion of events during wakefulness appeared to reduce OFA and OMA events more than MMA events, which explains these results. However, as also the excluded MMA events may have clinical relevance, their exclusion may not be appropriate e.g. in a research setting. In this thesis, no standpoint on the clinical relevance of these events was taken nor was it assessed in any way. The inclusion and exclusion of the events occurring during wakefulness were only tested as a way to improve the event scoring accuracy. In the scientific literature, there are examples of both exclusion and inclusion of the events during wakefulness (Yamaguchi et al., 2012; Carra et al., 2015b). It could be argued that MMA events during a 30 second, one-epoch long wakefulness probably are more SB-type MMA than AB-type MMA, and should not be excluded, whereas during long periods of wakefulness during the night, AB may also occur and that should be distinguished from SB. More work is required to assess the clinical relevance of the events occurring during wakefulness, as well as to decide whether it is advisable to exclude or include these events. If included, new scoring rules will probably be needed for these kinds of events. Nevertheless, the electrode set is able to provide good quality sleep staging even in self-applied type II PSG with clinical relevance (Myllymaa et al., 2016), if needed.
The differences in the type of EMG derivations, as well as in the number of utilized EMG channels contributed to some of the differences between the montages found in this thesis. In study I, the electrode set PSG montage was assessed with a unipolar masticatory EMG derivation by utilizing the electrodes Sp1, Sp2, F7 and F8 of the electrode set compared to the separate solid gel bipolar electrode derivations in the standard PSG. This was presumed to be the main contributor to the fact that in study I, a higher number of tonic events was found in the non-bruxer group and a lower number of phasic events in the bruxer group. The differences in the derivations were presumed to lead to differences in MMA scoring due to the different signal-to-noise ratios (Soderberg, 1992), common noise suppression and possible muscular activity cancellation in the bipolar derivation (Keenan et al., 2005). However, the exclusion of audio and video itself may lead to an increase of tonic MMA, as it is easily mistaken for other activities e.g. swallowing (Carra et al., 2015b).
In study II, the factor of different derivations was not present, as the same bipolar derivation of masseter EMG from standard PSG was utilized also in the electrode set PSG montage, to simulate the actual recording conditions in type II PSG. The differences in study II between the electrode set PSG montage without video and the standard PSG montage without video could be in turn be due to the fact that in the
31227203_UEF_Vaitoskirja_NO_351_Tomi_Miettinen_LUMET_sisus_19_10_02.indd 130 02/10/2019 7.49
109
electrode set PSG montage, only two masseter EMG channels were utilized for the scoring (to simulate the use of the new designs of the electrode set), whereas in all standard PSG montages there were a total of four EMG channels available for scoring. The difference in the scoring rules caused by the difference in the numbers of channels in these two cases was presumed to be the main culprit behind the differences between montages when there were similar means to distinguish between MMA, OFA and OMA. These differences were also visible with the EMG-only montages, as the utlilization of only two EMG channels led to a higher proportion of false positive events and fewer true positive events when compared to the case with four EMG channels. To confirm the effect of the number of channels and the associated scoring rules for the accuracy of the assessment, more detailed studies should probably be conducted with only one single PSG montage in the future.
The effect that the scoring rules and especially their details have on the scoring outcome was demonstrated as the difference in the classification outcomes and the difference in MMA indices between studies I and II. The stricter rules applied in the latter set-up seemingly led to a better agreement between the simulated unattended PSG setups and the standard PSG setups than the rules utilized in study I (see the Bland-Altman plots in chapter 8.2). However, even though both studies I and II involved the same twelve volunteers, due to the stricter interpretation of the scoring rules in study II, the number of classified bruxers was lower in all standard PSG montages and electrode set PSG montages than in study I. The currently utilized scoring rules issued by AASM when supplemented with the recommendation to distinguish MMA from OFA or OMA (Carra et al., 2012, 2015a; Berry et al., 2018) are somewhat problematic as there currently are no explicit, clearly determined rules for the audio-video based distinction. The MMA event scoring rules are undoubtedly clear and unambiguous, but there is uncertainty, especially for a new scorer, to know when to score an event as a movement and when to classify it as a MMA, e.g. in the case when the events are close to one another or overlap (which is the case with many MMA events). For example, 16 – 68% of MMA events have been shown to be associated with leg movements or changes in body position (Velly Miguel et al., 1992), and 57% of MMA events end up with swallowing (Miyawaki et al., 2003a). These events are critical: should one score all possible events as MMA regardless of the concomitant evidence that the events also display components of other facial movements or muscular activities i.e. only on clear occasions of OFA and OMA should the events be scored as such (as in study I), or should all events be scored as OFA or OMA even if they fulfill the criteria for being MMA events while exhibiting signs of some other activity (as in study II). Even though audio and video recordings are currently considered as the most accurate means to distinguish MMA from OFA and OMA, they are not perfect. In the audio-video recordings, slight movements may appear as if the patient is clenching, activities may be inaudible, the microphone may
31227203_UEF_Vaitoskirja_NO_351_Tomi_Miettinen_LUMET_sisus_19_10_02.indd 131 02/10/2019 7.49

110
be misplaced or the patient may be sleeping in a prone position or be obscured under a blanket.
This is an issue that should be addressed in the future by evaluating the differences between the different interpretations of scoring rules and probably by establishing new rules defining when to include and exclude an event. The scoring rules utilized in the research settings, including explicit, clear rules for the distinction OFA and OMA probably should always be described when presenting the findings in the literature, as they seem to affect both the outcomes and the reliability of the results. It could be hypothesized that if the stricter rules had been applied also in study I, this may have changed the results about whether a bruxer was classified as such in both assays. This clearly shows that a classification based on thresholds should always be linked to a set of clear scoring rules with as little ambiguouity as possible as otherwise the results might be skewed. However, the good concordance between both electrode set-based PSG and the standard PSG was found regardless of the differences in OFA and OMA scoring rules and the difference in MMA event indices between study I and II.
Even though the electrode set PSG montages showed good concordance with the standard PSG montages and several factors could be identified which affected the results of the scoring accuracies (in addition to the electrode set itself), this does not mean that the electrode set itself would be totally ready for the accurate PSG based SB assessments. The co-morbidity detection capabilities of the electrode set were not assessed in this thesis at all, even though it would be highly beneficial. However, in earlier studies the clinical relevance of the original electrode set in detecting different neurological conditions has already been proven in a hospital environment (Lepola et al., 2015; Muraja-Murro et al., 2015). It should not be too far-fetched to hypothesize that the electrode set could also be utilized in other situations e.g. RBD or epilepsy detection also in the home environment. It seems likely that the electrode set would be especially beneficial as a substitute for type I PSG in the more complex cases of SB assessment when other channels besides masticatory EMG for co-morbidity detection would have to be recorded. For this reason, in the future, it is recommended that feasibilty studies should be conducted with the electrode set for the concomitant detection of SB and its co-morbidities. 9.2 RELIABILITY OF THE ELECTRODE SET IN SELF-APPLIED
POLYSOMNOGRAPHY
In study III, especially the applicability aspect of the electrode set was demonstrated in the form of an evaluation of technical reliability of the self-applicable, unattended type II PSG recordings. The quality of the recordings was found to be at least at a “good” level in 90% of the recordings, 96.9% of recorded time was considered scorable for SB and the failure rate of the recordings was only 5%. The failure rate was considerably lower than that estimated for the Grindcare (12%), and Bruxoff
31227203_UEF_Vaitoskirja_NO_351_Tomi_Miettinen_LUMET_sisus_19_10_02.indd 132 02/10/2019 7.49
111
(8%), and at least at the same level with standard type II PSG distributed from hospitals (Castroflorio et al., 2013; Bruyneel and Ninane, 2014; Restrepo et al., 2018). In the repeated scorings of study IV, the failure rate was considered to be even better, 2.8%, being comparable to the reliability of standard type I PSG (0 – 5%) (Bruyneel and Ninane, 2014). However, the subject population of study III was mostly highly educated individuals, some subjects were even working in the health care sector themselves (volunteers recruited from Kuopio University Hospital), so one must be cautious of drawing too far-fetching conclusions on the reliability without further testing with more representative patient populations, similar to the small population of patients recruited in the dental clinic in study III. Furthermore the comparison against the type II PSG is not one-to-one accurate, as only the failure rate of recordings to allow an SDB assessment has been reported (Bruyneel and Ninane, 2014). Nevertheless, the results even with this population could be considered as promising, and the signal quality as adequate.
As the data revealed, the electrode set was highly reliable to use in the present population and the volunteers were able to self-apply the electrode set so that in most instances, good quality recordings were obtained. Furthermore, clearly most of the problems leading to failures in both studies III and IV were not related to the electrode set but rather with other parts of the recording equipment, as only one recording out of 101 recordings in both studies III and IV was due to the electrode set not being applied correctly. At the same time, three recordings out of 101 failed due to problems with the recorder.
There were considerably more problems with individual single channels than with almost any signal group (consisting of two or more channels). There were basically two reasons for signal problems: i) signal being not interpretable due to bad electrode contacts or the detachment of the cables, and ii) sweat artifacts (in addition to those due to problems with the recorder). Whenever the signal was not interpretable due to a bad electrode contact, it resulted in the signal being riddled with line frequency and channel-blocking artifacts. However, line frequency artifacts were almost non-existent in electrodes that were making a proper contact with the skin, showing that if done properly, the electrode set could enable good quality recordings with impedances mostly under 75 kΩ (around 90% of time). These results of the electrode impedances are comparable to those obtained with the original electrode set in a clinical setting [53.1 kΩ ± 8.6 kΩ at 15 Hz and 44.6 kΩ ± 8.0 kΩ at 30 Hz (mean ± SD, n = 5)], for which the subjective signal quality was considered to be adequate (Lepola et al., 2014b). Unfortunately, no information on the frequency at which the Nox A1 measures the electrical impedances was available which meant that it was not possible to compare these two devices directly. However, one could hypothesize that it would not be very far from the spectrum of regular electrical biosignals in PSG of 0.5 – 75 Hz. It was also unfortunate, that the impedance data on reference electrodes was found to be unreliable and was not assessed as part of study III. Nevertheless, the subjective evaluation of signal quality did not reveal any major
31227203_UEF_Vaitoskirja_NO_351_Tomi_Miettinen_LUMET_sisus_19_10_02.indd 133 02/10/2019 7.49

112
problems related to the reference electrodes (or at least to both of them at the same time), since this would have exerted a detrimental effect on the quality of the whole recording.
As single channels clearly had a lower quality than the larger signal groups, it would be beneficial to have several, at least one back-up channel in each signal group in a self-applied type II PSG. This finding differs from the results of Bruyneel et al. who concluded that extra back-up channels did not increase the reliablity of the technician-applied type II PSG recordings (Bruyneel et al., 2015).
The small proportions of sweat artifact in stage 1 of study III were a factor for which a solution was sought by making the second design of the electrode set cover less facial skin. However, in stage 2, where the second design was tested, a higher percentage of sweat artifact was found. The explanation for this was found in subsequent investigations (results not yet published), as the manufacturer of the electrode sets had changed the Ag-AgCl ink to a product from another supplier in the second design of the electrode set. In our investigations, this new ink proved to be more prone to the sweat artifacts than the ink used in the first design of the self-applicable electrode set. Nevertheless, even though one tries to prevent the sweat artifact occurring as much as possible, it probably could not be fully removed in home PSG as it is the result of several other independent factors, not only the electrode materials and the contact between electrode and the skin (Kappenman and Luck, 2010). It should be noted that even though the impedances even without skin abrasion in home environment seemed to be low enough not to evoke a line frequency artifact, presumably they were not low enough to prevent the occurrence of a sweat artifact.
One finding in study III implies that the recording location may affect the reliability results, as the majority of the bad signal quality recordings (76.3%) in stage 2 originated from the ten recordings conducted in patients from the dental clinic. This should be recognized as one factor that potentially could affect the accessibility of the device if it is not simple enough to be utilized in an environment where it would be naturally used; this factor will need to be investigated in the future. However, it could also be hypothesized that after the dentist gained more experience with the device and became accustomed to setting it up, perhaps by receiving an even more in-depth introduction to its use, so that he/she could better advise the patients on how best to apply the electrodes, and then the quality of the recordings would improve.
According to stage 2 of study III, there were some factors that revealed a need for further development of the electrode set. One of these factors was the detachment of the chin EMG cables; this was later resolved by incorporating lockable connectors which were used in latter half of the study IV recordings. Some of the other signal quality problems would also have been quite easy to resolve. For example, it was not difficult to alter the positioning of the EEG electrodes on top of the hairline by changing slightly the electrode positions, and this problem could be further
31227203_UEF_Vaitoskirja_NO_351_Tomi_Miettinen_LUMET_sisus_19_10_02.indd 134 02/10/2019 7.49
113
overcome with the introduction of different sized electrode sets. If possible, probably a more breathable substrate material or design for the electrode set could be introduced to reduce the sweating artifact. Wireless data transfer between the electrode set and the recorder could probably help even further in the application of the electrode set and this would probably also reduce the motion artifacts and patient discomfort caused by the cables. Even though the electrode set was proven to be reliable and provide good quality recordings in self-applicable PSG in the present population, it most probably has the potential to be made even more reliable and easier to apply if developed further. 9.3 THE FIRST-NIGHT EFFECT AND NIGHT-TO-NIGHT
VARIABILITY
Study IV found the presence of FNE in SB activity and high night-to-night variablity of the MMA index. These results tend to support the conclusion of Hasegawa et al. that recordings of patients with low MMA event indices should probably be repeated (Hasegawa et al., 2013). They also found that a majority of the patients with a low MMA index on the first night actually exhibited a higher MMA index on the second night, indicating that some SB patients probably have FNE (Hasegawa et al., 2013). However, as Hasegawa et al. and others have demonstrated, high levels of MMA remain high in the short- and in long-term, but even then the high night-to-night variability is present (Lavigne et al., 2001; Van Der Zaag et al., 2008; Hasegawa et al., 2013). Unfortunately, patients with lower levels of MMA have not been studied to such an extent. As the present subject population was small, our results seem to support the conclusion that it is possible, that there exists a subgroup of patients who have SB-related FNE. The proportion of all SB patients who have FNE is still unclear, nor is it known if co-morbidities had impact on FNE. In the present study, the night-to-night variability was also extensive (mean CV: 50.7%), which was actually somewhat higher than the values reported previously in a sleep laboratory PSG (22%, 25% and 30%) and in home PSG (37%) (Dal Fabbro and Tufik, 1996; Lavigne et al., 2001; Van Der Zaag et al., 2008; Hasegawa et al., 2013).
The present findings could have a major impact on the way that an instrumental assessment is currently performed, if more indications of the FNE in a larger population are later found. The presence of FNE could potentially lead to an underestimation of the severity of SB in individual patients in one-night recordings, but in research settings, FNE would have a major industry-changing impact. It would mean that one-night assessments which would possibly underestimate the SB activity could lead to false conclusions if one assumes that one night of recording represents the normal level of MMA of the study population. Especially in the case of studies assessing the efficacy of new treatment modalities based on only one or two recording nights, this error might prove crucial in the interpretation of the results.
31227203_UEF_Vaitoskirja_NO_351_Tomi_Miettinen_LUMET_sisus_19_10_02.indd 135 02/10/2019 7.49
114
It should be noted that the demographics of the subject population in the present study probably affected the obtained results, e.g. the majority of the subjects were older than in the study of Hasegawa et al. (Hasegawa et al., 2013). At least sleep-related FNE has been shown to be more severe in older individuals (Webb and Campbell, 1979), and it can be hypothesized that this is the case also with the SB-related FNE found in study IV. The effect of the population’s age probably is the most predominant reason for this finding. Another factor known to greatly affect FNE is the environment, and thus it was somewhat surprising that FNE was present in the home environment, where the FNE (sleep-related) is not considered to be as severe as encountered in a sleep laboratory (Edinger et al., 1997; Herbst et al., 2010).
There were some confounding factors in the study, one being that the caffeine or alcohol intake was not controlled, and it may have affected the results. Different medical conditions could have also affected, that could have left unnoticed, due to the fact that they were controlled only by the means of volunteer interview. Furthermore, the majority of the subjects were female, and studies with a more representative sex distribution should be conducted before the results can be generalized. However, at least with respect to sleep-related FNE, no gender-related differences in its prevalence have been reported (Maluly et al., 2013; Manfredini et al., 2013b).
The fact that no sleep-related FNE was found, even though there was a SB-related FNE, indicates that probably the physiological phenomena behind SB are more sensitive than actual sleep to changes in the sleeping environment, but also this proposal will require confirmation in studies with larger populations. The obtained results also indicated that subjects classified as bruxers and non-bruxers were both affected by the FNE, another result needing to be confirmed with larger and more variable populations.
To conclude, based on the results of study IV, it seems to be beneficial to record several nights when assessing SB, not only due to the night-to-night variability but also due to the possible FNE in some patients. As some of the subjects had their highest MMA event index only on the third night, probably at least 3 recorded nights may be required in some patients. In the future, it would probably be beneficial to find if there are any means to identify those patients that are most severely affected by the FNE. Were this possible, the need for several nights of recordings could be estimated beforehand. One possible way to circumvent the effects of FNE that was considered in the discussion of study IV, was to use of “dummy” electrodes and recording devices that physically correspond to the real ones before the actual recording night(s). In this way, the patients could become accustomed to the electrodes and device beforehand, and no expensive and cumbersome true recordings would need to be recorded when the FNE is still present.
31227203_UEF_Vaitoskirja_NO_351_Tomi_Miettinen_LUMET_sisus_19_10_02.indd 136 02/10/2019 7.49
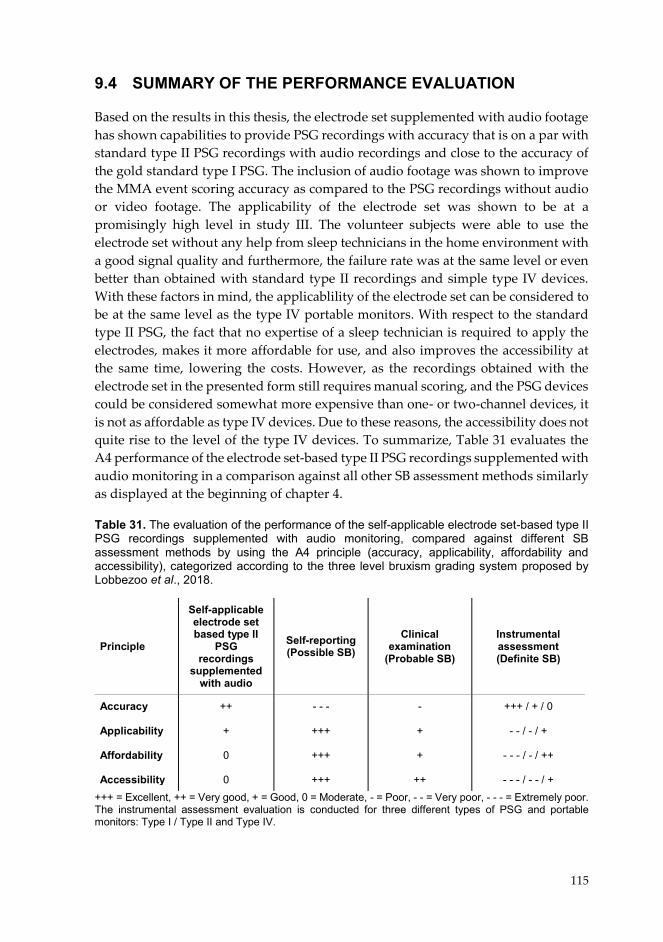
115
9.4 SUMMARY OF THE PERFORMANCE EVALUATION
Based on the results in this thesis, the electrode set supplemented with audio footage has shown capabilities to provide PSG recordings with accuracy that is on a par with standard type II PSG recordings with audio recordings and close to the accuracy of the gold standard type I PSG. The inclusion of audio footage was shown to improve the MMA event scoring accuracy as compared to the PSG recordings without audio or video footage. The applicability of the electrode set was shown to be at a promisingly high level in study III. The volunteer subjects were able to use the electrode set without any help from sleep technicians in the home environment with a good signal quality and furthermore, the failure rate was at the same level or even better than obtained with standard type II recordings and simple type IV devices. With these factors in mind, the applicablility of the electrode set can be considered to be at the same level as the type IV portable monitors. With respect to the standard type II PSG, the fact that no expertise of a sleep technician is required to apply the electrodes, makes it more affordable for use, and also improves the accessibility at the same time, lowering the costs. However, as the recordings obtained with the electrode set in the presented form still requires manual scoring, and the PSG devices could be considered somewhat more expensive than one- or two-channel devices, it is not as affordable as type IV devices. Due to these reasons, the accessibility does not quite rise to the level of the type IV devices. To summarize, Table 31 evaluates the A4 performance of the electrode set-based type II PSG recordings supplemented with audio monitoring in a comparison against all other SB assessment methods similarly as displayed at the beginning of chapter 4.
Table 31. The evaluation of the performance of the self-applicable electrode set-based type II PSG recordings supplemented with audio monitoring, compared against different SB assessment methods by using the A4 principle (accuracy, applicability, affordability and accessibility), categorized according to the three level bruxism grading system proposed by Lobbezoo et al., 2018.
+++ = Excellent, ++ = Very good, + = Good, 0 = Moderate, - = Poor, - - = Very poor, - - - = Extremely poor. The instrumental assessment evaluation is conducted for three different types of PSG and portable monitors: Type I / Type II and Type IV.
Principle
Self-applicable electrode set based type II
PSG recordings
supplemented with audio
Self-reporting (Possible SB)
Clinical examination
(Probable SB)
Instrumental assessment (Definite SB)
Accuracy Applicability Affordability Accessibility
++
+ 0 0
- - -
+++
+++
+++
-
+
+
++
+++ / + / 0
- - / - / +
- - - / - / ++
- - - / - - / +
31227203_UEF_Vaitoskirja_NO_351_Tomi_Miettinen_LUMET_sisus_19_10_02.indd 137 02/10/2019 7.49
116
The self-applicable electrode set could be considered to enhance the type II PSG recordings especially with improved applicablity, affordability and accessibility. The accuracy of manual scorings could be improved with the inclusion of audio recordings. Arguably, the combination of the highly increased accuracy and better applicablity would be especially useful in research settings. The fact is that there are still significant uncertainties surrounding many aspects of SB: for example, its etiology, associations with co-morbidities, prediction of the development of the possible detrimental health consequences, and efficacy of new treatment modalities, these are still mostly assessed only with self-reporting and/or clinical examination. Even if the requirement for a definite SB assessment using instrumental assessment has been fulfilled in research settings, this is currently being done with applicable, affordable and accessible EMG-only that is unfortunately unable to accurately estimate the true MMA events. Furthermore, long-term studies are currently virtually non-existent. As demonstrated in study IV, the presence of the FNE and the high night-to-night variability indicated that recording the MMA levels for several nights might prove to be crucial for the accurate assessment of the true levels of MMA. Based on the results of this thesis, the electrode set has the potential to be a feasible solution to overcome all of these current shortcomings in the SB assessment in research setting, replacing the currently highly inaccesible and costly type I PSG recordings.
For the every-day instrumental assessment of SB levels of individual SB patients, the electrode set possibly would have its uses in the more demanding patient cases requiring the assessment of the concomitant occurrence of SB and its co-morbidities. When assessing primary SB in a clinical setting, EMG recorders that have a good monotonic relationship with the true MMA events probably are more suitable for these situations. For more demanding setups, the electrode set enables the concomitant evaluation of EEG, EOG and chin EMG, and can be easily complemented with different devices required for the assessments of co-morbidities. However, the co-morbidity detection capabilities with the electrode set-based type II PSG still need to be investigated and verified.
It could be argued that there is still potential for improving the affordablility and accessibility of the electrode set even further by implementing automatic event detection in the scoring phase. This would help to further reduce the costs incurred by the analysis of the sleep recordings, and possibly totally eliminate the need for experts to assess the results. In study I, the electrode set was shown to possess good capabilities for arousal detection, a technique which is utilized for the automatic MMA event in one already existing device (Bruxoff) (Castroflorio et al., 2013). The automatic event detection would be especially useful in the clinical setting, but possibly would have its uses also in the research setting, especially when assessing large populations of patients. However, it would require that the automatic event detection would have to be very accurate, in order to avoid introducing a possibly significant source of error in research settings. In other words, in the research setting,
31227203_UEF_Vaitoskirja_NO_351_Tomi_Miettinen_LUMET_sisus_19_10_02.indd 138 02/10/2019 7.49

117
where accuracy is crucial, it may not be advisable to strive to improve the affordability and accessibility if there is a possibility that this will be at the expense of a loss of accuracy. If automatic event detection could be implemented in the clinical setting, it would be beneficial to also investigate the possibilities for concomitant co-morbidity event detection. Based on the results in study III, the implemention of automatic event detection must take into account the fact that single channels may possess high proportions of uninterpretable data.
It has to be stated that the new electrode set cannot resolve all problems in the assessment of SB, and developments also in the other aspects besides instrumentation will be necessary. As was discussed earlier, the development of standardized scoring rules, which are as unambiguous as possible, would be beneficial to ensure that all patients are being evaluated similarly; this would improve the comparability of SB assessments between different medical/dental centers and research groups. The rules to evaluate the associations between SB and co-morbidities should also be defined in greater detail. Furthermore, the development of the current instrumental set is not finished as its applicability could always be still improved, e.g. by implementing wireless data transfer. This could be worth to try, as during our studies the electrode set has shown good adaptability to be used with different PSG recorders. In this thesis it has been successfully tested with Embla and Nox Medical hardware, but in our other studies also with Compumedics and Somnomedics devices (unpublished data). Even though the electrode set could be a universal solution for home PSG, the accuracy and technical reliablity should be tested with each recorder separately. One possibility to further improve the accuracy of the type II PSG in SB assessment might be to implement a simple-to-use video camera to a separate recorder that is pointed at the facial area of the patient, and is wirelessly connected to the electrode set. However, if any of such improvements are pursued, their effects on the whole A4 performance will need to be evaluated with rigourous testing.
In the future, the high accuracy and good applicablity, affordablity and accessibility of the present electrode set could also be utilized for the development of other means to assess SB i.e. not only the instrumental means, used separately or as a combination of assessment methods. This latter approach was mentioned as a desirable path for the development of SB assessment in the latest consensus paper (Lobbezoo et al., 2018). Improvements of the accuracy of the self-reporting techniques would be especially beneficial as it is clearly the most applicable, affordable and accesible way to detect, or at least screen, the patients. Unfortunately, there are those patients that are fully unaware of their condition; for them, instrumental means might be the only suitable method to confirm SB e.g. in a case when it is not clear what is causing their symptoms. In the future, it would also be beneficial to be able to recognize the clinical symptoms and findings that in the long-term would predict the progression of SB and its possibly associated health consequences (either by the patient him/herself or supported by a finding in an instrumental assessment).
31227203_UEF_Vaitoskirja_NO_351_Tomi_Miettinen_LUMET_sisus_19_10_02.indd 139 02/10/2019 7.49
118
It is possible that in order to achieve high enough accuracy with any diagnostic device, it may require a somewhat higher level of cumbersomeness and thus, a tradeoff between the other A4 principles. Higher accuracy may result in somewhat lower applicability, affordability and accessibility, all of which should be contained at an acceptable level for each recording setting. In the research setting and the clinical settings requiring a co-morbidity assessment, the EMG based systems probably trade off too much accuracy in favor of the other A4 principles. Type II PSG exchanges some degree of accuracy with respect to type I PSG to achieve improvements in applicability, affordability and accessibility. But when the self-applicable electrode set based type II PSG is supplemented with audio recordings, a sufficiently high accuracy could still arguably be obtained at a level that is desirable for the more demanding settings, while still having rather high applicablity, affordability and accessibility. To sum up, since there are different options to conduct the SB assessment, the problem is merely in choosing the most suitable tools which can deliver an adequate performance for that particular task.
31227203_UEF_Vaitoskirja_NO_351_Tomi_Miettinen_LUMET_sisus_19_10_02.indd 140 02/10/2019 7.49
119
10 CONCLUSIONS
The overarching aim of this thesis was to evaluate and potentially improve the suitability of a screen-printed ambulatory electode set for the assessment of SB in unattended type II PSG that is self-applied by the patients. The research hypothesis was that the technology used in the original emergency EEG electrode set would be suitable and with redesigning could be further utilized to achieve an accurate assessment of SB as a part of type II PSG. Four specific aims and related research questions were set, and the following conclusions were drawn from the results.
1) The diagnostic accuracy of the original EEG electrode set based PSG was similar to the standard PSG when the means to distinguish MMA events were similar with both montages.
2) The MMA scoring accuracy of the type II PSG with the electrode set supplemented with audio recordings was very close to the intra-scorer accuracy of standard PSG recordings with audio and video, with only a slight risk for overestimation.
3) The re-designed electrode set was found to be easy to self-apply by the volunteered subjects in unattended type II PSG, providing reliable, good quality recordings with a low failure rate.
4) True MMA level detection and patient classification may require several nights of recordings, at least in patients with a low MMA index, due to FNE and the high night-to-night variability of MMA.
In conclusion, the research hypothesis was confirmed i.e. the electrode set was shown to enable high accuracy recordings, while at the same time being feasible for use in the patients’ home environments, making it substantially more applicable, affordable and accessible than both type I and type II standard PSG montages. The electrode set might prove to be a useful tool in replacing type I PSG since it allows the accurate and reliable assessment of SB activity in the more widely available and cost-effective self-applied type II PSG recording setting. In the clinic, it could be utilized for more demanding cases where SB and co-morbidity assessments need to be conducted concomitantly. In research settings, the electrode set could help to provide answers related to many still open questions concerning SB. In this thesis, the electrode set was also shown to be utilizable for recordings lasting several nights.
31227203_UEF_Vaitoskirja_NO_351_Tomi_Miettinen_LUMET_sisus_19_10_02.indd 141 02/10/2019 7.49
120
The combination of the electrode set’s high accuracy and good technical reliablity mean that it would be extremely beneficial for conducting long-term research on unanswered topics such as:
• SB prevalence: The possible long-term fluctuations and the absence of SB in some parts of an individual’s life, and the reasons behind these fluctuations
• SB risk factors: The role of different proposed risk factors of SB, including peripheral, psychological, genetic and neurophysiological factors, factors related to the oral physiology and their possible interactions
• The clinical findings related to SB: Long-term studies e.g. to evaluate the
connection between SB and tooth wear
• The progression of SB: Identification of findings, symptoms and SB phenotypes that would predict the progression of the SB and the possible associated health consequences
• The co-morbidities of SB: For example, long-term parallel SB and TMD
follow-up studies, or evaluating the connections between SB and SDB, and
• The efficacy of new treatment methods: Long-term randomized clinical trials of e.g. assessing the efficacy of pharmaceuticals to reduce SB activity.
At present, these research topics have been addressed in only a few high quality publications. One reason why so little has been done in this field can be traced to the lack of appropriate and easily available tools to conduct the research. If utilized and further developed, the electrode set, introduced in this thesis, has the potential to offer a mean to conduct accurate SB assessments in research settings. The electrode set represents an applicable, affordable and accessible way to perform these kinds of trials that would be based on quantitative, evidence-based direct observations rather than only on subjective self-reports and the currently inconclusive clinical signs and symptoms. With this in mind, in the best-case scenario, the electrode set could potentially revolutionize our understanding of SB and how it should be managed.
31227203_UEF_Vaitoskirja_NO_351_Tomi_Miettinen_LUMET_sisus_19_10_02.indd 142 02/10/2019 7.49
121
11 BIBLIOGRAPHY
Abe, S., Gagnon, J.-F., Montplaisir, J. Y., Postuma, R. B., Rompré, P. H., Huynh, N. T., Kato, T., Kawano, F. and Lavigne, G. J. (2013) ‘Sleep bruxism and oromandibular myoclonus in rapid eye movement sleep behavior disorder: a preliminary report’, Sleep Medicine, 14(10), pp. 1024–1030.
Abe, S., Yamaguchi, T., Rompré, P. H., De Grandmont, P., Chen, Y.-J. and Lavigne, G. J. (2009) ‘Tooth wear in young subjects: a discriminator between sleep bruxers and controls?’, The International journal of prosthodontics, 22(4), pp. 342–50.
Abe, Y., Suganuma, T., Ishii, M., Yamamoto, G., Gunji, T., Clark, G. T., Tachikawa, T., Kiuchi, Y., Igarashi, Y. and Baba, K. (2012) ‘Association of genetic, psychological and behavioral factors with sleep bruxism in a Japanese population.’, Journal of sleep research, 21(3), pp. 289–96.
Agerberg, G. and Carlsson, G. E. (1972) ‘Functional disorders of the masticatory system. I. Distribution of symptoms according to age and sex as judged from investigation by questionnaire.’, Acta odontologica Scandinavica, 30(6), pp. 597–613.
Alba, N. A., Sclabassi, R. J., Sun, M. and Cui, X. T. (2010) ‘Novel Hydrogel-Based Preparation-Free EEG Electrode’, IEEE Transactions on Neural Systems and Rehabilitation Engineering, 18(4), pp. 415–423.
American Academy of Sleep Medicine (2014) International classification of sleep disorders—third edition (ICSD-3). 3th edn.
Baba, K., Clark, G. T., Watanabe, T. and Ohyama, T. (2003) ‘Bruxism force detection by a piezoelectric film-based recording device in sleeping humans.’, Journal of orofacial pain. 17(1), pp. 58–64.
Bader, G. G., Kampe, T., Tagdae, T., Karlsson, S. and Blomqvist, M. (1997) ‘Descriptive physiological data on a sleep bruxism population.’, Sleep, 20(11), pp. 982–90.
Balasubramaniam, R., Klasser, G. D., Cistulli, P. A. and Lavigne, G. J. (2014) ‘The Link between Sleep Bruxism, Sleep Disordered Breathing and Temporomandibular Disorders: An Evidence-based Review’, Journal of Dental Sleep Medicine, 04(02), pp. 27–37.
Berry, R. B., Albertario, C. L., Harding, S. M., Lloyd, R. M., PLante, D. T., Quan, S. F., Troester, M. M. and Vaughn, B. V. (2018) The AASM manual for the scoring of sleep and associated events., Rules, Terminology and Technical Specifications. Version 2. Edited by I. L. Darien. Darien, Illinois, American Academy of Sleep Medicine: American Academy of Sleep Medicine.
Blanco Aguilera, A., Gonzalez Lopez, L., Blanco Aguilera, E., De la Hoz Aizpurua, J. L., Rodriguez Torronteras, A., Segura Saint-Gerons, R. and Blanco Hungría, A. (2014) ‘Relationship between self-reported sleep bruxism and pain in patients with temporomandibular disorders.’, Journal of oral rehabilitation, 41(8), pp. 564–72.
Bland, J. M. and Altman, D. G. (1986) ‘Statistical methods for assessing agreement between two methods of clinical measurement.’, Lancet. Elsevier, 1(8476), pp. 307–10.
Le Bon, O., Staner, L., Hoffmann, G., Dramaix, M., San Sebastian, I., Murphy, J. R., Kentos, M., Pelc, I. and Linkowski, P. (2001) ‘The first-night effect may last more than one night.’, Journal of psychiatric research. Elsevier, 35(3), pp. 165–72.
Bruhn, J., Myles, P. S., Sneyd, R. and Struys, M. M. R. F. (2006) ‘Depth of anaesthesia
31227203_UEF_Vaitoskirja_NO_351_Tomi_Miettinen_LUMET_sisus_19_10_02.indd 143 02/10/2019 7.49
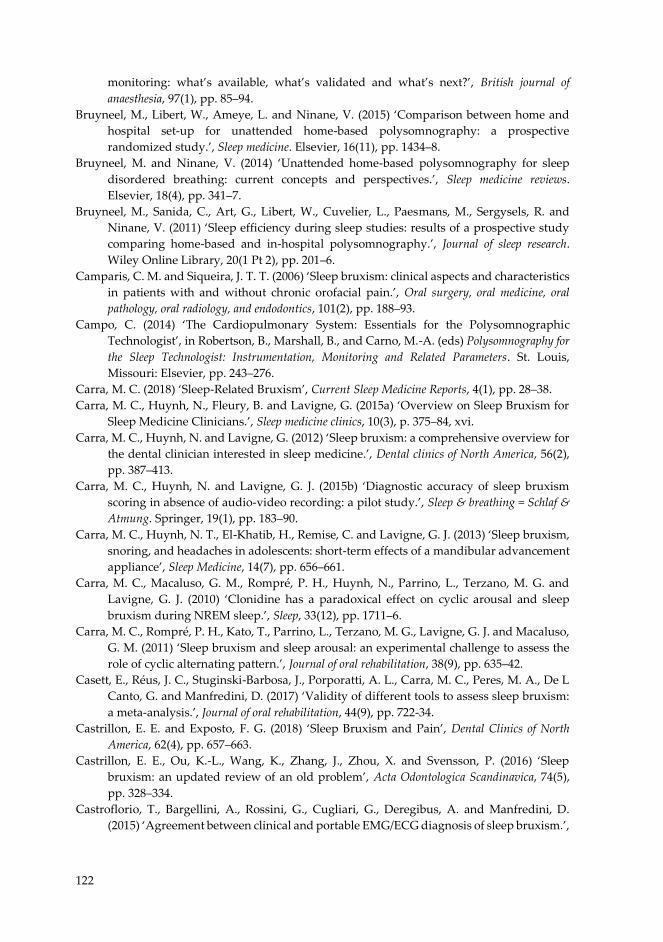
122
monitoring: what’s available, what’s validated and what’s next?’, British journal of anaesthesia, 97(1), pp. 85–94.
Bruyneel, M., Libert, W., Ameye, L. and Ninane, V. (2015) ‘Comparison between home and hospital set-up for unattended home-based polysomnography: a prospective randomized study.’, Sleep medicine. Elsevier, 16(11), pp. 1434–8.
Bruyneel, M. and Ninane, V. (2014) ‘Unattended home-based polysomnography for sleep disordered breathing: current concepts and perspectives.’, Sleep medicine reviews. Elsevier, 18(4), pp. 341–7.
Bruyneel, M., Sanida, C., Art, G., Libert, W., Cuvelier, L., Paesmans, M., Sergysels, R. and Ninane, V. (2011) ‘Sleep efficiency during sleep studies: results of a prospective study comparing home-based and in-hospital polysomnography.’, Journal of sleep research. Wiley Online Library, 20(1 Pt 2), pp. 201–6.
Camparis, C. M. and Siqueira, J. T. T. (2006) ‘Sleep bruxism: clinical aspects and characteristics in patients with and without chronic orofacial pain.’, Oral surgery, oral medicine, oral pathology, oral radiology, and endodontics, 101(2), pp. 188–93.
Campo, C. (2014) ‘The Cardiopulmonary System: Essentials for the Polysomnographic Technologist’, in Robertson, B., Marshall, B., and Carno, M.-A. (eds) Polysomnography for the Sleep Technologist: Instrumentation, Monitoring and Related Parameters. St. Louis, Missouri: Elsevier, pp. 243–276.
Carra, M. C. (2018) ‘Sleep-Related Bruxism’, Current Sleep Medicine Reports, 4(1), pp. 28–38. Carra, M. C., Huynh, N., Fleury, B. and Lavigne, G. (2015a) ‘Overview on Sleep Bruxism for
Sleep Medicine Clinicians.’, Sleep medicine clinics, 10(3), p. 375–84, xvi. Carra, M. C., Huynh, N. and Lavigne, G. (2012) ‘Sleep bruxism: a comprehensive overview for
the dental clinician interested in sleep medicine.’, Dental clinics of North America, 56(2), pp. 387–413.
Carra, M. C., Huynh, N. and Lavigne, G. J. (2015b) ‘Diagnostic accuracy of sleep bruxism scoring in absence of audio-video recording: a pilot study.’, Sleep & breathing = Schlaf & Atmung. Springer, 19(1), pp. 183–90.
Carra, M. C., Huynh, N. T., El-Khatib, H., Remise, C. and Lavigne, G. J. (2013) ‘Sleep bruxism, snoring, and headaches in adolescents: short-term effects of a mandibular advancement appliance’, Sleep Medicine, 14(7), pp. 656–661.
Carra, M. C., Macaluso, G. M., Rompré, P. H., Huynh, N., Parrino, L., Terzano, M. G. and Lavigne, G. J. (2010) ‘Clonidine has a paradoxical effect on cyclic arousal and sleep bruxism during NREM sleep.’, Sleep, 33(12), pp. 1711–6.
Carra, M. C., Rompré, P. H., Kato, T., Parrino, L., Terzano, M. G., Lavigne, G. J. and Macaluso, G. M. (2011) ‘Sleep bruxism and sleep arousal: an experimental challenge to assess the role of cyclic alternating pattern.’, Journal of oral rehabilitation, 38(9), pp. 635–42.
Casett, E., Réus, J. C., Stuginski-Barbosa, J., Porporatti, A. L., Carra, M. C., Peres, M. A., De L Canto, G. and Manfredini, D. (2017) ‘Validity of different tools to assess sleep bruxism: a meta-analysis.’, Journal of oral rehabilitation, 44(9), pp. 722-34.
Castrillon, E. E. and Exposto, F. G. (2018) ‘Sleep Bruxism and Pain’, Dental Clinics of North America, 62(4), pp. 657–663.
Castrillon, E. E., Ou, K.-L., Wang, K., Zhang, J., Zhou, X. and Svensson, P. (2016) ‘Sleep bruxism: an updated review of an old problem’, Acta Odontologica Scandinavica, 74(5), pp. 328–334.
Castroflorio, T., Bargellini, A., Rossini, G., Cugliari, G., Deregibus, A. and Manfredini, D. (2015) ‘Agreement between clinical and portable EMG/ECG diagnosis of sleep bruxism.’,
31227203_UEF_Vaitoskirja_NO_351_Tomi_Miettinen_LUMET_sisus_19_10_02.indd 144 02/10/2019 7.49
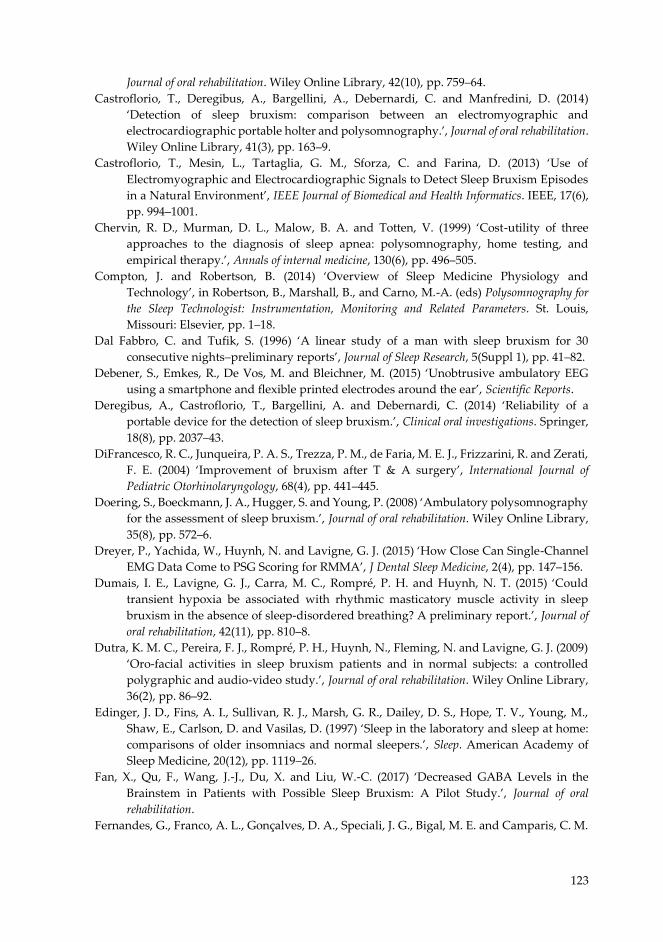
123
Journal of oral rehabilitation. Wiley Online Library, 42(10), pp. 759–64. Castroflorio, T., Deregibus, A., Bargellini, A., Debernardi, C. and Manfredini, D. (2014)
‘Detection of sleep bruxism: comparison between an electromyographic and electrocardiographic portable holter and polysomnography.’, Journal of oral rehabilitation. Wiley Online Library, 41(3), pp. 163–9.
Castroflorio, T., Mesin, L., Tartaglia, G. M., Sforza, C. and Farina, D. (2013) ‘Use of Electromyographic and Electrocardiographic Signals to Detect Sleep Bruxism Episodes in a Natural Environment’, IEEE Journal of Biomedical and Health Informatics. IEEE, 17(6), pp. 994–1001.
Chervin, R. D., Murman, D. L., Malow, B. A. and Totten, V. (1999) ‘Cost-utility of three approaches to the diagnosis of sleep apnea: polysomnography, home testing, and empirical therapy.’, Annals of internal medicine, 130(6), pp. 496–505.
Compton, J. and Robertson, B. (2014) ‘Overview of Sleep Medicine Physiology and Technology’, in Robertson, B., Marshall, B., and Carno, M.-A. (eds) Polysomnography for the Sleep Technologist: Instrumentation, Monitoring and Related Parameters. St. Louis, Missouri: Elsevier, pp. 1–18.
Dal Fabbro, C. and Tufik, S. (1996) ‘A linear study of a man with sleep bruxism for 30 consecutive nights–preliminary reports’, Journal of Sleep Research, 5(Suppl 1), pp. 41–82.
Debener, S., Emkes, R., De Vos, M. and Bleichner, M. (2015) ‘Unobtrusive ambulatory EEG using a smartphone and flexible printed electrodes around the ear’, Scientific Reports.
Deregibus, A., Castroflorio, T., Bargellini, A. and Debernardi, C. (2014) ‘Reliability of a portable device for the detection of sleep bruxism.’, Clinical oral investigations. Springer, 18(8), pp. 2037–43.
DiFrancesco, R. C., Junqueira, P. A. S., Trezza, P. M., de Faria, M. E. J., Frizzarini, R. and Zerati, F. E. (2004) ‘Improvement of bruxism after T & A surgery’, International Journal of Pediatric Otorhinolaryngology, 68(4), pp. 441–445.
Doering, S., Boeckmann, J. A., Hugger, S. and Young, P. (2008) ‘Ambulatory polysomnography for the assessment of sleep bruxism.’, Journal of oral rehabilitation. Wiley Online Library, 35(8), pp. 572–6.
Dreyer, P., Yachida, W., Huynh, N. and Lavigne, G. J. (2015) ‘How Close Can Single-Channel EMG Data Come to PSG Scoring for RMMA’, J Dental Sleep Medicine, 2(4), pp. 147–156.
Dumais, I. E., Lavigne, G. J., Carra, M. C., Rompré, P. H. and Huynh, N. T. (2015) ‘Could transient hypoxia be associated with rhythmic masticatory muscle activity in sleep bruxism in the absence of sleep-disordered breathing? A preliminary report.’, Journal of oral rehabilitation, 42(11), pp. 810–8.
Dutra, K. M. C., Pereira, F. J., Rompré, P. H., Huynh, N., Fleming, N. and Lavigne, G. J. (2009) ‘Oro-facial activities in sleep bruxism patients and in normal subjects: a controlled polygraphic and audio-video study.’, Journal of oral rehabilitation. Wiley Online Library, 36(2), pp. 86–92.
Edinger, J. D., Fins, A. I., Sullivan, R. J., Marsh, G. R., Dailey, D. S., Hope, T. V., Young, M., Shaw, E., Carlson, D. and Vasilas, D. (1997) ‘Sleep in the laboratory and sleep at home: comparisons of older insomniacs and normal sleepers.’, Sleep. American Academy of Sleep Medicine, 20(12), pp. 1119–26.
Fan, X., Qu, F., Wang, J.-J., Du, X. and Liu, W.-C. (2017) ‘Decreased GABA Levels in the Brainstem in Patients with Possible Sleep Bruxism: A Pilot Study.’, Journal of oral rehabilitation.
Fernandes, G., Franco, A. L., Gonçalves, D. A., Speciali, J. G., Bigal, M. E. and Camparis, C. M.
31227203_UEF_Vaitoskirja_NO_351_Tomi_Miettinen_LUMET_sisus_19_10_02.indd 145 02/10/2019 7.49

124
(2013) ‘Temporomandibular disorders, sleep bruxism, and primary headaches are mutually associated.’, Journal of orofacial pain, 27(1), pp. 14–20.
Ferraz, O., de Moura Guimarães, T., Maluly Filho, M., Dal-Fabbro, C., Abraão Crosara Cunha, T., Cristina Lotaif, A., Cristina Barros Schütz, T., Santos-Silva, R., Tufik, S. and Bittencourt, L. (2015) ‘Assessment of interobserver concordance in polysomnography scoring of sleep bruxism’, Sleep Science, 8(3), pp. 121–123.
Ferree, T. C., Luu, P., Russell, G. S. and Tucker, D. M. (2001) ‘Scalp electrode impedance, infection risk, and EEG data quality.’, Clinical neurophysiology : official journal of the International Federation of Clinical Neurophysiology. Elsevier, 112(3), pp. 536–44.
Feu, D., Catharino, F., Quintão, C. C. A. and Almeida, M. A. de O. (2013) ‘A systematic review of etiological and risk factors associated with bruxism.’, Journal of orthodontics, 40(2), pp. 163–71.
Fleiss, J. L., Levin, B. and Paik, M. C. (2003) ‘The Measurement of Interrater Agreement’, in Shewart, W. and Wilks, S. (eds) Statistical Methods for Rates and Proportions. 3rd edn. Hoboken, NJ, USA: John Wiley & Sons, Inc., pp. 598–626.
Gastaldo, E., Quatrale, R., Graziani, A., Eleopra, R., Tugnoli, V., Tola, M. R. and Granieri, E. (2006) ‘The excitability of the trigeminal motor system in sleep bruxism: a transcranial magnetic stimulation and brainstem reflex study.’, Journal of orofacial pain, 20(2), pp. 145–55.
Glaros, A. G. (1981) ‘Incidence of diurnal and nocturnal bruxism.’, The Journal of prosthetic dentistry, 45(5), pp. 545–9.
Griss, P., Enoksson, P., Tolvanen-Laakso, H. K., Merilainen, P., Ollmar, S. and Stemme, G. (2001) ‘Micromachined electrodes for biopotential measurements’, Journal of Microelectromechanical Systems, 10(1), pp. 10–16.
Guaita, M. and Högl, B. (2016) ‘Current Treatments of Bruxism.’, Current treatment options in neurology, 18(2), p. 10.
Guerrero, F. N. and Spinelli, E. M. (2018) ‘A Two-Wired Ultra-High Input Impedance Active Electrode’, IEEE Transactions on Biomedical Circuits and Systems, 12(2), pp. 437–445.
Halford, J. J. (2018) ‘Equipment and Instrumentation’, in Tatum, W. O. (ed.) Atlas of Artifacts in Clinical Neurophysiology. New York, New York: Springer Publishing Company, pp. 27–40.
Harada, T., Ichiki, R., Tsukiyama, Y. and Koyano, K. (2006) ‘The effect of oral splint devices on sleep bruxism: a 6-week observation with an ambulatory electromyographic recording device.’, Journal of oral rehabilitation. Wiley Online Library, 33(7), pp. 482–8.
Hasegawa, Y., Lavigne, G., Rompré, P., Kato, T., Urade, M. and Huynh, N. (2013) ‘Is there a first night effect on sleep bruxism? A sleep laboratory study’, Journal of Clinical Sleep Medicine, 9(11), pp. 1139–1145.
Herbst, E., Metzler, T. J., Lenoci, M., McCaslin, S. E., Inslicht, S., Marmar, C. R. and Neylan, T. C. (2010) ‘Adaptation effects to sleep studies in participants with and without chronic posttraumatic stress disorder.’, Psychophysiology. Wiley Online Library, 47(6), pp. 1127–33.
Herrero Babiloni, A. and Lavigne, G. J. (2018) ‘Sleep Bruxism: A "Bridge" Between Dental and Sleep Medicine.’, Journal of clinical sleep medicine : JCSM : official publication of the American Academy of Sleep Medicine. American Academy of Sleep Medicine, 14(8), pp. 1281–1283.
Hokama, H., Masaki, C., Mukaibo, T., Tsuka, S., Kondo, Y. and Hosokawa, R. (2017) ‘The effectiveness of an occlusal disclosure sheet to diagnose sleep bruxism: A pilot study.’,
31227203_UEF_Vaitoskirja_NO_351_Tomi_Miettinen_LUMET_sisus_19_10_02.indd 146 02/10/2019 7.49
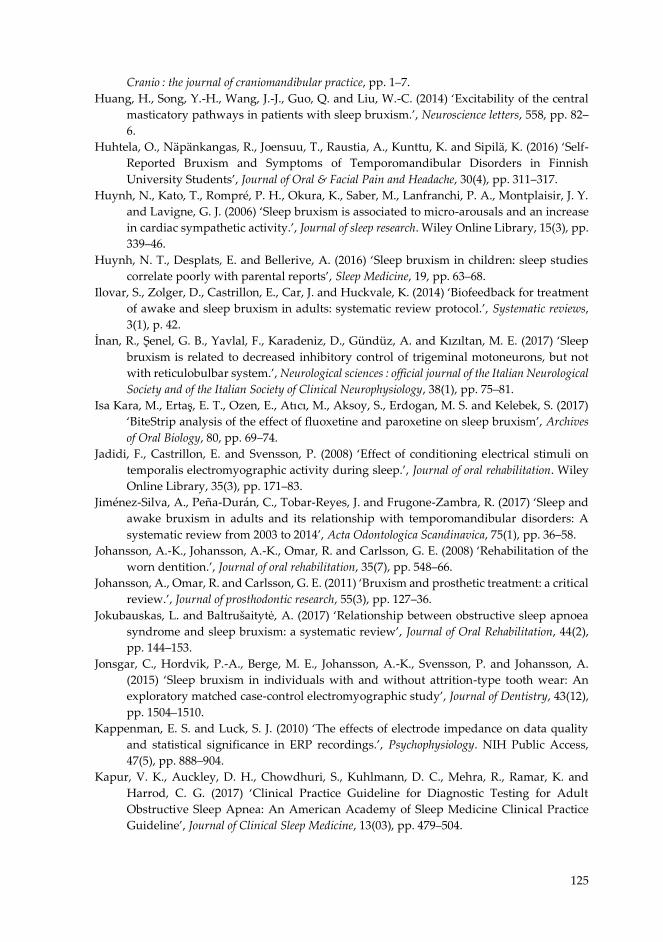
125
Cranio : the journal of craniomandibular practice, pp. 1–7. Huang, H., Song, Y.-H., Wang, J.-J., Guo, Q. and Liu, W.-C. (2014) ‘Excitability of the central
masticatory pathways in patients with sleep bruxism.’, Neuroscience letters, 558, pp. 82–6.
Huhtela, O., Näpänkangas, R., Joensuu, T., Raustia, A., Kunttu, K. and Sipilä, K. (2016) ‘Self-Reported Bruxism and Symptoms of Temporomandibular Disorders in Finnish University Students’, Journal of Oral & Facial Pain and Headache, 30(4), pp. 311–317.
Huynh, N., Kato, T., Rompré, P. H., Okura, K., Saber, M., Lanfranchi, P. A., Montplaisir, J. Y. and Lavigne, G. J. (2006) ‘Sleep bruxism is associated to micro-arousals and an increase in cardiac sympathetic activity.’, Journal of sleep research. Wiley Online Library, 15(3), pp. 339–46.
Huynh, N. T., Desplats, E. and Bellerive, A. (2016) ‘Sleep bruxism in children: sleep studies correlate poorly with parental reports’, Sleep Medicine, 19, pp. 63–68.
Ilovar, S., Zolger, D., Castrillon, E., Car, J. and Huckvale, K. (2014) ‘Biofeedback for treatment of awake and sleep bruxism in adults: systematic review protocol.’, Systematic reviews, 3(1), p. 42.
İnan, R., Şenel, G. B., Yavlal, F., Karadeniz, D., Gündüz, A. and Kızıltan, M. E. (2017) ‘Sleep bruxism is related to decreased inhibitory control of trigeminal motoneurons, but not with reticulobulbar system.’, Neurological sciences : official journal of the Italian Neurological Society and of the Italian Society of Clinical Neurophysiology, 38(1), pp. 75–81.
Isa Kara, M., Ertaş, E. T., Ozen, E., Atıcı, M., Aksoy, S., Erdogan, M. S. and Kelebek, S. (2017) ‘BiteStrip analysis of the effect of fluoxetine and paroxetine on sleep bruxism’, Archives of Oral Biology, 80, pp. 69–74.
Jadidi, F., Castrillon, E. and Svensson, P. (2008) ‘Effect of conditioning electrical stimuli on temporalis electromyographic activity during sleep.’, Journal of oral rehabilitation. Wiley Online Library, 35(3), pp. 171–83.
Jiménez-Silva, A., Peña-Durán, C., Tobar-Reyes, J. and Frugone-Zambra, R. (2017) ‘Sleep and awake bruxism in adults and its relationship with temporomandibular disorders: A systematic review from 2003 to 2014’, Acta Odontologica Scandinavica, 75(1), pp. 36–58.
Johansson, A.-K., Johansson, A.-K., Omar, R. and Carlsson, G. E. (2008) ‘Rehabilitation of the worn dentition.’, Journal of oral rehabilitation, 35(7), pp. 548–66.
Johansson, A., Omar, R. and Carlsson, G. E. (2011) ‘Bruxism and prosthetic treatment: a critical review.’, Journal of prosthodontic research, 55(3), pp. 127–36.
Jokubauskas, L. and Baltrušaitytė, A. (2017) ‘Relationship between obstructive sleep apnoea syndrome and sleep bruxism: a systematic review’, Journal of Oral Rehabilitation, 44(2), pp. 144–153.
Jonsgar, C., Hordvik, P.-A., Berge, M. E., Johansson, A.-K., Svensson, P. and Johansson, A. (2015) ‘Sleep bruxism in individuals with and without attrition-type tooth wear: An exploratory matched case-control electromyographic study’, Journal of Dentistry, 43(12), pp. 1504–1510.
Kappenman, E. S. and Luck, S. J. (2010) ‘The effects of electrode impedance on data quality and statistical significance in ERP recordings.’, Psychophysiology. NIH Public Access, 47(5), pp. 888–904.
Kapur, V. K., Auckley, D. H., Chowdhuri, S., Kuhlmann, D. C., Mehra, R., Ramar, K. and Harrod, C. G. (2017) ‘Clinical Practice Guideline for Diagnostic Testing for Adult Obstructive Sleep Apnea: An American Academy of Sleep Medicine Clinical Practice Guideline’, Journal of Clinical Sleep Medicine, 13(03), pp. 479–504.
31227203_UEF_Vaitoskirja_NO_351_Tomi_Miettinen_LUMET_sisus_19_10_02.indd 147 02/10/2019 7.49
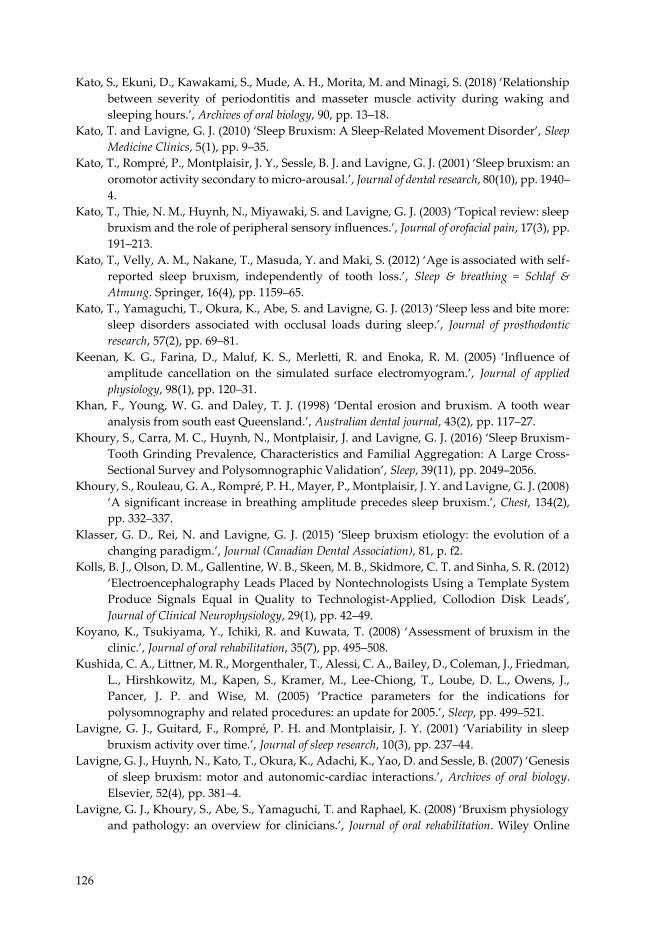
126
Kato, S., Ekuni, D., Kawakami, S., Mude, A. H., Morita, M. and Minagi, S. (2018) ‘Relationship between severity of periodontitis and masseter muscle activity during waking and sleeping hours.’, Archives of oral biology, 90, pp. 13–18.
Kato, T. and Lavigne, G. J. (2010) ‘Sleep Bruxism: A Sleep-Related Movement Disorder’, Sleep Medicine Clinics, 5(1), pp. 9–35.
Kato, T., Rompré, P., Montplaisir, J. Y., Sessle, B. J. and Lavigne, G. J. (2001) ‘Sleep bruxism: an oromotor activity secondary to micro-arousal.’, Journal of dental research, 80(10), pp. 1940–4.
Kato, T., Thie, N. M., Huynh, N., Miyawaki, S. and Lavigne, G. J. (2003) ‘Topical review: sleep bruxism and the role of peripheral sensory influences.’, Journal of orofacial pain, 17(3), pp. 191–213.
Kato, T., Velly, A. M., Nakane, T., Masuda, Y. and Maki, S. (2012) ‘Age is associated with self-reported sleep bruxism, independently of tooth loss.’, Sleep & breathing = Schlaf & Atmung. Springer, 16(4), pp. 1159–65.
Kato, T., Yamaguchi, T., Okura, K., Abe, S. and Lavigne, G. J. (2013) ‘Sleep less and bite more: sleep disorders associated with occlusal loads during sleep.’, Journal of prosthodontic research, 57(2), pp. 69–81.
Keenan, K. G., Farina, D., Maluf, K. S., Merletti, R. and Enoka, R. M. (2005) ‘Influence of amplitude cancellation on the simulated surface electromyogram.’, Journal of applied physiology, 98(1), pp. 120–31.
Khan, F., Young, W. G. and Daley, T. J. (1998) ‘Dental erosion and bruxism. A tooth wear analysis from south east Queensland.’, Australian dental journal, 43(2), pp. 117–27.
Khoury, S., Carra, M. C., Huynh, N., Montplaisir, J. and Lavigne, G. J. (2016) ‘Sleep Bruxism-Tooth Grinding Prevalence, Characteristics and Familial Aggregation: A Large Cross-Sectional Survey and Polysomnographic Validation’, Sleep, 39(11), pp. 2049–2056.
Khoury, S., Rouleau, G. A., Rompré, P. H., Mayer, P., Montplaisir, J. Y. and Lavigne, G. J. (2008) ‘A significant increase in breathing amplitude precedes sleep bruxism.’, Chest, 134(2), pp. 332–337.
Klasser, G. D., Rei, N. and Lavigne, G. J. (2015) ‘Sleep bruxism etiology: the evolution of a changing paradigm.’, Journal (Canadian Dental Association), 81, p. f2.
Kolls, B. J., Olson, D. M., Gallentine, W. B., Skeen, M. B., Skidmore, C. T. and Sinha, S. R. (2012) ‘Electroencephalography Leads Placed by Nontechnologists Using a Template System Produce Signals Equal in Quality to Technologist-Applied, Collodion Disk Leads’, Journal of Clinical Neurophysiology, 29(1), pp. 42–49.
Koyano, K., Tsukiyama, Y., Ichiki, R. and Kuwata, T. (2008) ‘Assessment of bruxism in the clinic.’, Journal of oral rehabilitation, 35(7), pp. 495–508.
Kushida, C. A., Littner, M. R., Morgenthaler, T., Alessi, C. A., Bailey, D., Coleman, J., Friedman, L., Hirshkowitz, M., Kapen, S., Kramer, M., Lee-Chiong, T., Loube, D. L., Owens, J., Pancer, J. P. and Wise, M. (2005) ‘Practice parameters for the indications for polysomnography and related procedures: an update for 2005.’, Sleep, pp. 499–521.
Lavigne, G. J., Guitard, F., Rompré, P. H. and Montplaisir, J. Y. (2001) ‘Variability in sleep bruxism activity over time.’, Journal of sleep research, 10(3), pp. 237–44.
Lavigne, G. J., Huynh, N., Kato, T., Okura, K., Adachi, K., Yao, D. and Sessle, B. (2007) ‘Genesis of sleep bruxism: motor and autonomic-cardiac interactions.’, Archives of oral biology. Elsevier, 52(4), pp. 381–4.
Lavigne, G. J., Khoury, S., Abe, S., Yamaguchi, T. and Raphael, K. (2008) ‘Bruxism physiology and pathology: an overview for clinicians.’, Journal of oral rehabilitation. Wiley Online
31227203_UEF_Vaitoskirja_NO_351_Tomi_Miettinen_LUMET_sisus_19_10_02.indd 148 02/10/2019 7.49
127
Library, 35(7), pp. 476–94. Lavigne, G. J. and Montplaisir, J. Y. (1994) ‘Restless legs syndrome and sleep bruxism:
prevalence and association among Canadians.’, Sleep, 17(8), pp. 739–43. Lavigne, G. J., Rompré, P. H. and Montplaisir, J. Y. (1996) ‘Sleep bruxism: validity of clinical
research diagnostic criteria in a controlled polysomnographic study.’, Journal of dental research, 75(1), pp. 546–52.
Lavigne, G. J., Rompré, P. H., Montplaisir, J. Y. and Lobbezoo, F. (1997) ‘Motor activity in sleep bruxism with concomitant jaw muscle pain. A retrospective pilot study.’, European journal of oral sciences, 105(1), pp. 92–5.
Lavigne, G., Manzini, C. and Huynh, N. T. (2011) ‘Sleep Bruxism’, in Kryger, M. H., Roth, T., and Dement, W. C. (eds) Principles and Practice of Sleep Medicine. 5th edn. Philadelphia: W.B. Saunders, pp. 1128–1139.
Lavigne, G. and Palla, S. (2010) ‘Transient morning headache: recognizing the role of sleep bruxism and sleep-disordered breathing.’, Journal of the American Dental Association (1939), 141(3), pp. 297–9.
Lee, S. and Kruse, J. (2008) ‘Biopotential electrode sensors in ECG/EEG/EMG systems’, Analog Devices.
de Leeuw, R. (ed.) (2008) Orofacial pain: guidelines for classification, assessment, and management. 4th edn, Quintessence Publ Co, Chicago. 4th edn. Chicago.
Lepola, P., Myllymaa, S., Töyräs, J., Hukkanen, T., Mervaala, E., Määttä, S., Lappalainen, R. and Myllymaa, K. (2015) ‘A Handy EEG Electrode Set for patients suffering from altered mental state.’, Journal of clinical monitoring and computing. Springer, 29(6), pp. 697–705.
Lepola, P., Myllymaa, S., Töyräs, J., Mervaala, E., Lappalainen, R. and Myllymaa, K. (2014a) ‘Shielded Design of Screen-Printed EEG Electrode Set Reduces Interference Pick-Up’, IEEE Sensors Journal. IEEE, 14(8), pp. 2692–2697.
Lepola, P., Myllymaa, S., Töyräs, J., Muraja-Murro, A., Mervaala, E., Lappalainen, R. and Myllymaa, K. (2014b) ‘Screen-printed EEG electrode set for emergency use’, Sensors and Actuators A: Physical. Elsevier, 213, pp. 19–26.
List, T. and Jensen, R. H. (2017) ‘Temporomandibular disorders: Old ideas and new concepts’, Cephalalgia, 37(7), pp. 692–704.
Lobbezoo, F., Ahlberg, J., Glaros, A. G., Kato, T., Koyano, K., Lavigne, G. J., de Leeuw, R., Manfredini, D., Svensson, P. and Winocur, E. (2013) ‘Bruxism defined and graded: an international consensus.’, Journal of oral rehabilitation. Wiley Online Library, 40(1), pp. 2–4.
Lobbezoo, F., Ahlberg, J., Raphael, K. G., Wetselaar, P., Glaros, A. G., Kato, T., Santiago, V., Winocur, E., De Laat, A., De Leeuw, R., Koyano, K., Lavigne, G. J., Svensson, P. and Manfredini, D. (2018) ‘International consensus on the assessment of bruxism: Report of a work in progress.’, Journal of oral rehabilitation, 45(11), pp. 837-44.
Lobbezoo, F., Lavigne, G. J., Tanguay, R. and Montplaisir, J. Y. (1997) ‘The effect of catecholamine precursor L-dopa on sleep bruxism: a controlled clinical trial.’, Movement disorders : official journal of the Movement Disorder Society, 12(1), pp. 73–8.
Lobbezoo, F. and Naeije, M. (2001) ‘Bruxism is mainly regulated centrally, not peripherally.’, Journal of oral rehabilitation, 28(12), pp. 1085–91.
Lobbezoo, F., Rompré, P. H., Soucy, J. P., Iafrancesco, C., Turkewicz, J., Montplaisir, J. Y. and Lavigne, G. J. (2001) ‘Lack of associations between occlusal and cephalometric measures, side imbalance in striatal D2 receptor binding, and sleep-related oromotor activities.’, Journal of orofacial pain, 15(1), pp. 64–71.
31227203_UEF_Vaitoskirja_NO_351_Tomi_Miettinen_LUMET_sisus_19_10_02.indd 149 02/10/2019 7.49

128
Lobbezoo, F., Visscher, C. M., Ahlberg, J. and Manfredini, D. (2014) ‘Bruxism and genetics: a review of the literature.’, Journal of oral rehabilitation, 41(9), pp. 709–14.
Lobbezoo, F., van der Zaag, J., van Selms, M. K. A., Hamburger, H. L. and Naeije, M. (2008) ‘Principles for the management of bruxism.’, Journal of oral rehabilitation, 35(7), pp. 509–23.
Lund, J. P., Donga, R., Widmer, C. G. and Stohler, C. S. (1991) ‘The pain-adaptation model: a discussion of the relationship between chronic musculoskeletal pain and motor activity.’, Canadian journal of physiology and pharmacology, 69(5), pp. 683–94.
Lynch, C. D. and McConnell, R. J. (2002) ‘The cracked tooth syndrome.’, Journal (Canadian Dental Association), 68(8), pp. 470–5.
Macaluso, G. M., Guerra, P., Di Giovanni, G., Boselli, M., Parrino, L. and Terzano, M. G. (1998) ‘Sleep bruxism is a disorder related to periodic arousals during sleep.’, Journal of dental research, 77(4), pp. 565–73.
Madihally, S. V. (2010) Principles of Biomedical Engineering (Engineering in Medicine & Biology). Artech House.
Maeda, M., Yamaguchi, T., Mikami, S., Yachida, W., Saito, T., Sakuma, T., Nakamura, H., Saito, M., Mizuno, M., Yamada, K. and Satoh, K. (2019) ‘Validity of single-channel masseteric electromyography by using an ultraminiature wearable electromyographic device for diagnosis of sleep bruxism’, Journal of Prosthodontic Research.
Mainieri, V. C., Saueressig, A. C., Pattussi, M. P., Fagondes, S. C. and Grossi, M. L. (2012) ‘Validation of the Bitestrip versus polysomnography in the diagnosis of patients with a clinical history of sleep bruxism.’, Oral surgery, oral medicine, oral pathology and oral radiology. Elsevier, 113(5), pp. 612–7.
Maluly, M., Andersen, M. L., Dal-Fabbro, C., Garbuio, S., Bittencourt, L., de Siqueira, J. T. T. and Tufik, S. (2013) ‘Polysomnographic study of the prevalence of sleep bruxism in a population sample.’, Journal of dental research, 92(7 Suppl), p. 97S–103S.
Manfredini, D., Ahlberg, J., Castroflorio, T., Poggio, C. E., Guarda-Nardini, L. and Lobbezoo, F. (2014) ‘Diagnostic accuracy of portable instrumental devices to measure sleep bruxism: a systematic literature review of polysomnographic studies.’, Journal of oral rehabilitation, 41(11), pp. 836–42.
Manfredini, D., Ahlberg, J., Winocur, E. and Lobbezoo, F. (2015a) ‘Management of sleep bruxism in adults: a qualitative systematic literature review’, Journal of Oral Rehabilitation, 42(11), pp. 862–874.
Manfredini, D., Guarda-Nardini, L., Marchese-Ragona, R. and Lobbezoo, F. (2015b) ‘Theories on possible temporal relationships between sleep bruxism and obstructive sleep apnea events. An expert opinion’, Sleep and Breathing, 19(4), pp. 1459–1465.
Manfredini, D., De Laat, A., Winocur, E. and Ahlberg, J. (2016) ‘Why not stop looking at bruxism as a black/white condition? Aetiology could be unrelated to clinical consequences.’, Journal of oral rehabilitation, 43(10), pp. 799–801.
Manfredini, D. and Lobbezoo, F. (2009) ‘Role of psychosocial factors in the etiology of bruxism.’, Journal of orofacial pain, 23(2), pp. 153–66.
Manfredini, D., Restrepo, C., Diaz-Serrano, K., Winocur, E. and Lobbezoo, F. (2013a) ‘Prevalence of sleep bruxism in children: a systematic review of the literature.’, Journal of oral rehabilitation, 40(8), pp. 631–42.
Manfredini, D., Visscher, C. M., Guarda-Nardini, L. and Lobbezoo, F. (2012) ‘Occlusal factors are not related to self-reported bruxism.’, Journal of orofacial pain, 26(3), pp. 163–7.
Manfredini, D., Winocur, E., Guarda-Nardini, L., Paesani, D. and Lobbezoo, F. (2013b)
31227203_UEF_Vaitoskirja_NO_351_Tomi_Miettinen_LUMET_sisus_19_10_02.indd 150 02/10/2019 7.49

129
‘Epidemiology of bruxism in adults: a systematic review of the literature.’, Journal of orofacial pain, 27(2), pp. 99–110.
Mayer, P., Heinzer, R. and Lavigne, G. (2016) ‘Sleep Bruxism in Respiratory Medicine Practice’, Chest, 149(1), pp. 262–271.
van der Meulen, M. J., Lobbezoo, F., Aartman, I. H. A. and Naeije, M. (2014) ‘Validity of the Oral Behaviours Checklist: correlations between OBC scores and intensity of facial pain’, Journal of Oral Rehabilitation. John Wiley & Sons, Ltd (10.1111), 41(2), pp. 115–121.
Mikkelsen, K. B., Ebajemito, J. K., Bonmati-Carrion, M. A., Santhi, N., Revell, V. L., Atzori, G., della Monica, C., Debener, S., Dijk, D. J., Sterr, A. and de Vos, M. (2019) ‘Machine-learning-derived sleep–wake staging from around-the-ear electroencephalogram outperforms manual scoring and actigraphy’, Journal of Sleep Research.
Miyawaki, S., Lavigne, G. J., Pierre, M., Guitard, F., Montplaisir, J. Y. and Kato, T. (2003a) ‘Association between sleep bruxism, swallowing-related laryngeal movement, and sleep positions.’, Sleep, 26(4), pp. 461–5.
Miyawaki, S., Tanimoto, Y., Araki, Y., Katayama, A., Fujii, A. and Takano-Yamamoto, T. (2003b) ‘Association between nocturnal bruxism and gastroesophageal reflux.’, Sleep, 26(7), pp. 888–92.
Mizumori, T., Inano, S., Sumiya, M., Kobayashi, Y., Watamoto, T. and Yatani, H. (2009) ‘Ambulatory bruxism recording system with sleep-stage analyzing function.’, Journal of prosthodontic research. Elsevier, 53(3), pp. 150–4.
Mizumori, T., Sumiya, M., Kobayashi, Y., Inano, S. and Yatani, H. (2013) ‘Prediction of sleep bruxism events by increased heart rate.’, The International journal of prosthodontics. Department of Fixed Prosthodontics, Osaka University, Osaka, Japan. [email protected], 26(3), pp. 239–43.
Muraja-Murro, A., Mervaala, E., Westeren-Punnonen, S., Lepola, P., Töyräs, J., Myllymaa, S., Julkunen, P., Kantanen, A.-M., Kälviäinen, R. and Myllymaa, K. (2015) ‘Forehead EEG electrode set versus full-head scalp EEG in 100 patients with altered mental state.’, Epilepsy & behavior, 49, pp. 245–9.
Myllymaa, S., Lepola, P., Hukkanen, T., Oun, A., Mervaala, E., Toyras, J., Lappalainen, R. and Myllymaa, K. (2013a) ‘Novel screen printed electrode set for routine EEG recordings in patients with altered mental status’, in 2013 35th Annual International Conference of the IEEE Engineering in Medicine and Biology Society (EMBC). IEEE, pp. 6724–27.
Myllymaa, S., Lepola, P., Töyräs, J., Hukkanen, T., Mervaala, E., Lappalainen, R. and Myllymaa, K. (2013b) ‘New disposable forehead electrode set with excellent signal quality and imaging compatibility.’, Journal of neuroscience methods, 215(1), pp. 103–9.
Myllymaa, S., Muraja-Murro, A., Westeren-Punnonen, S., Hukkanen, T., Lappalainen, R., Mervaala, E., Töyräs, J., Sipilä, K. and Myllymaa, K. (2016) ‘Assessment of the suitability of using a forehead EEG electrode set and chin EMG electrodes for sleep staging in polysomnography.’, Journal of sleep research, 25(6), pp. 636–645.
Nakamura, H., Takaba, M., Abe, Y., Yoshizawa, S., Suganuma, T., Yoshida, Y., Nakazato, Y., Ono, Y., Clark, G. T. and Baba, K. (2019) ‘Effects of a contingent vibratory stimulus delivered by an intra-oral device on sleep bruxism: a pilot study.’, Sleep & breathing = Schlaf & Atmung.
Nashed, A., Lanfranchi, P., Rompré, P., Carra, M. C., Mayer, P., Colombo, R., Huynh, N. and Lavigne, G. (2012) ‘Sleep bruxism is associated with a rise in arterial blood pressure.’, Sleep, 35(4), pp. 529–36.
Neuman, M. R. (1995) ‘Biopotential Electrodes’, in Webster, J. G. (ed.) Medical Instrumentation:
31227203_UEF_Vaitoskirja_NO_351_Tomi_Miettinen_LUMET_sisus_19_10_02.indd 151 02/10/2019 7.49
130
Application and Design; Second Edition. John Wiley & Sons, Inc. Newell, J., Mairesse, O., Verbanck, P. and Neu, D. (2012) ‘Is a one-night stay in the lab really
enough to conclude? First-night effect and night-to-night variability in polysomnographic recordings among different clinical population samples.’, Psychiatry research. Elsevier, 200(2–3), pp. 795–801.
Newman, J. D. and Turner, A. P. F. (2005) ‘Home blood glucose biosensors: a commercial perspective’, Biosensors and Bioelectronics, 20(12), pp. 2435–2453.
Nishigawa, K., Bando, E. and Nakano, M. (2001) ‘Quantitative study of bite force during sleep associated bruxism.’, Journal of oral rehabilitation, 28(5), pp. 485–91.
Nukazawa, S., Yoshimi, H. and Sato, S. (2017) ‘Autonomic nervous activities associated with bruxism events during sleep’, CRANIO®, pp. 1–7.
Ohayon, M. M., Li, K. K. and Guilleminault, C. (2001) ‘Risk factors for sleep bruxism in the general population.’, Chest. American College of Chest Physicians, 119(1), pp. 53–61.
Okeson, J. P., Phillips, B. A., Berry, D. T. and Baldwin, R. M. (1994) ‘Nocturnal bruxing events: a report of normative data and cardiovascular response.’, Journal of oral rehabilitation, 21(6), pp. 623–30.
De Oliveira Trindade, M. and Rodriguez, A. G. (2014) ‘Polysomnographic analysis of bruxism’, General Dentistry, 62(1), pp. 56-60.
Ommerborn, M. A., Depprich, R. A., Schneider, C., Giraki, M., Franz, M., Raab, W. H.-M. and Schäfer, R. (2019) ‘Pain perception and functional/occlusal parameters in sleep bruxism subjects following a therapeutic intervention’, Head & Face Medicine, 15(1), p. 4.
Ommerborn, M. A., Giraki, M., Schneider, C., Schaefer, R., Gotter, A., Franz, M. and Raab, W. H. M. (2005) ‘A new analyzing method for quantification of abrasion on the Bruxcore device for sleep bruxism diagnosis.’, Journal of orofacial pain, 19(3), pp. 232–8.
Ommerborn, M. A., Schneider, C., Giraki, M., Schäfer, R., Handschel, J., Franz, M. and Raab, W. H.-M. (2007) ‘Effects of an occlusal splint compared with cognitive-behavioral treatment on sleep bruxism activity’, European Journal of Oral Sciences, 115(1), pp. 7–14.
Paesani, D. A., Lobbezoo, F., Gelos, C., Guarda-Nardini, L., Ahlberg, J. and Manfredini, D. (2013) ‘Correlation between self-reported and clinically based diagnoses of bruxism in temporomandibular disorders patients.’, Journal of oral rehabilitation, 40(11), pp. 803–9.
Palinkas, M., Bataglion, C., de Luca Canto, G., Machado Camolezi, N., Theodoro, G. T., Siéssere, S., Semprini, M. and Regalo, S. C. H. (2016a) ‘Impact of sleep bruxism on masseter and temporalis muscles and bite force’, CRANIO®, 34(5), pp. 309–315.
Palinkas, M., Canto, G. D. L., Rodrigues, L. A. M., Bataglion, C., Siéssere, S., Semprini, M. and Regalo, S. C. H. (2016b) ‘The Real Role of Sensitivity, Specificity and Predictive Values in the Clinical Assessment.’, Journal of clinical sleep medicine : JCSM : official publication of the American Academy of Sleep Medicine. American Academy of Sleep Medicine, 12(2), pp. 279–80.
Palinkas, M., De Luca Canto, G., Rodrigues, L. A. M., Bataglion, C., Siéssere, S., Semprini, M. and Regalo, S. C. H. (2015) ‘Comparative Capabilities of Clinical Assessment, Diagnostic Criteria, and Polysomnography in Detecting Sleep Bruxism’, Journal of Clinical Sleep Medicine, 11(11), pp. 1319–1325.
Peacock, K. W., Robertson, B. and Marshall, B. (2014) ‘Recognizing, Evaluating, and Minimizing Recording Artifacts’, in Robertson, B., Marshall, B., and Carno, M.-A. (eds) Polysomnography for the Sleep Technologist: Instrumentation, Monitoring and Related Parameters. St. Louis, Missouri: Elsevier, pp. 201–242.
Ramfjord, S. P. (1961) ‘Bruxism, a clinical and electromyographic study.’, Journal of the American
31227203_UEF_Vaitoskirja_NO_351_Tomi_Miettinen_LUMET_sisus_19_10_02.indd 152 02/10/2019 7.49
131
Dental Association (1939), 62, pp. 21–44. Raphael, K. G. (2016) ‘Error in Calculation of Predictive Values in Paper on Screening for Sleep
Bruxism.’, Journal of clinical sleep medicine : JCSM : official publication of the American Academy of Sleep Medicine. American Academy of Sleep Medicine, 12(2), p. 277.
Raphael, K. G., Janal, M. N., Sirois, D. A., Dubrovsky, B., Klausner, J. J., Krieger, A. C. and Lavigne, G. J. (2015) ‘Validity of self-reported sleep bruxism among myofascial temporomandibular disorder patients and controls.’, Journal of oral rehabilitation, 42(10), pp. 751–8.
Raphael, K. G., Janal, M. N., Sirois, D. A., Dubrovsky, B., Wigren, P. E., Klausner, J. J., Krieger, A. C. and Lavigne, G. J. (2013) ‘Masticatory muscle sleep background electromyographic activity is elevated in myofascial temporomandibular disorder patients.’, Journal of oral rehabilitation, 40(12), pp. 883–91.
Raphael, K. G., Santiago, V. and Lobbezoo, F. (2016a) ‘Bruxism is a continuously distributed behaviour, but disorder decisions are dichotomous (Response to letter by Manfredini, De Laat, Winocur, & Ahlberg (2016)).’, Journal of oral rehabilitation, 43(10), pp. 802–3.
Raphael, K. G., Santiago, V. and Lobbezoo, F. (2016b) ‘Is bruxism a disorder or a behaviour? Rethinking the international consensus on defining and grading of bruxism.’, Journal of oral rehabilitation, 43(10), pp. 791–8.
Raphael, K. G., Sirois, D. A., Janal, M. N., Wigren, P. E., Dubrovsky, B., Nemelivsky, L. V, Klausner, J. J., Krieger, A. C. and Lavigne, G. J. (2012) ‘Sleep bruxism and myofascial temporomandibular disorders: a laboratory-based polysomnographic investigation.’, Journal of the American Dental Association (1939), 143(11), pp. 1223–31.
Redline, S., Sanders, M. H., Lind, B. K., Quan, S. F., Iber, C., Gottlieb, D. J., Bonekat, W. H., Rapoport, D. M., Smith, P. L. and Kiley, J. P. (1998) ‘Methods for obtaining and analyzing unattended polysomnography data for a multicenter study. Sleep Heart Health Research Group.’, Sleep. [New York]: Raven Press, 21(7), pp. 759–67.
Restrepo, C., Lobbezoo, F., Castrillon, E., Svensson, P., Santamaria, A., Alvarez, C., Manrique, R. and Manfredini, D. (2018) ‘Agreement between jaw-muscle activity measurement with portable single-channel electromyography and polysomnography in children’, International Journal of Paediatric Dentistry, 28(1).
Rintakoski, K., Hublin, C., Lobbezoo, F., Rose, R. J. and Kaprio, J. (2012) ‘Genetic factors account for half of the phenotypic variance in liability to sleep-related bruxism in young adults: a nationwide Finnish twin cohort study.’, Twin research and human genetics : the official journal of the International Society for Twin Studies, 15(6), pp. 714–9.
Rompré, P. H., Daigle-Landry, D., Guitard, F., Montplaisir, J. Y. and Lavigne, G. J. (2007) ‘Identification of a sleep bruxism subgroup with a higher risk of pain.’, Journal of dental research.., 86(9), pp. 837–42.
Rosell, J., Colominas, J., Riu, P., Pallas-Areny, R. and Webster, J. G. (1988) ‘Skin impedance from 1 Hz to 1 MHz’, IEEE Transactions on Biomedical Engineering, 35(8), pp. 649–651.
Rossetti, L. M. N., Pereira de Araujo, C. D. R., Rossetti, P. H. O. and Conti, P. C. R. (2008) ‘Association between rhythmic masticatory muscle activity during sleep and masticatory myofascial pain: a polysomnographic study.’, Journal of orofacial pain, 22(3), pp. 190–200.
Sakai, T., Kato, T., Yoshizawa, S., Suganuma, T., Takaba, M., Ono, Y., Yoshizawa, A., Yoshida, Y., Kurihara, T., Ishii, M., Kawana, F., Kiuchi, Y. and Baba, K. (2017) ‘Effect of clonazepam and clonidine on primary sleep bruxism: a double-blind, crossover, placebo-controlled trial.’, Journal of sleep research, 26(1), pp. 73–83.
31227203_UEF_Vaitoskirja_NO_351_Tomi_Miettinen_LUMET_sisus_19_10_02.indd 153 02/10/2019 7.49
132
Salemi, M. (2014) ‘Data Acquisition Systems’, in Robertson, B., Marshall, B., and Carno, M.-A. (eds) Polysomnography for the Sleep Technologist: Instrumentation, Monitoring and Related Parameters. St. Louis, Missouri: Elsevier, pp. 123–152.
Saletu, A., Parapatics, S., Anderer, P., Matejka, M. and Saletu, B. (2010) ‘Controlled clinical, polysomnographic and psychometric studies on differences between sleep bruxers and controls and acute effects of clonazepam as compared with placebo’, European Archives of Psychiatry and Clinical Neuroscience, 260(2), pp. 163–174.
Satoh, T. and Harada, Y. (1973) ‘Electrophysiological study on tooth-grinding during sleep.’, Electroencephalography and clinical neurophysiology, 35(3), pp. 267–75.
Schiffman, E., Ohrbach, R., Truelove, E., Look, J., Anderson, G., Goulet, J.-P., List, T., Svensson, P., Gonzalez, Y., Lobbezoo, F., Michelotti, A., Brooks, S. L., Ceusters, W., Drangsholt, M., Ettlin, D., Gaul, C., Goldberg, L. J., Haythornthwaite, J. A., Hollender, L., Jensen, R., John, M. T., De Laat, A., de Leeuw, R., Maixner, W., van der Meulen, M., Murray, G. M., Nixdorf, D. R., Palla, S., Petersson, A., Pionchon, P., Smith, B., Visscher, C. M., Zakrzewska, J., Dworkin, S. F., International RDC/TMD Consortium Network, International association for Dental Research and Orofacial Pain Special Interest Group, International Association for the Study of Pain (2014) ‘Diagnostic Criteria for Temporomandibular Disorders (DC/TMD) for Clinical and Research Applications: recommendations of the International RDC/TMD Consortium Network* and Orofacial Pain Special Interest Group†.’, Journal of oral & facial pain and headache, 28(1), pp. 6–27.
Schneider, C., Schaefer, R., Ommerborn, M. A., Giraki, M., Goertz, A., Raab, W. H.-M. and Franz, M. (2007) ‘Maladaptive coping strategies in patients with bruxism compared to non-bruxing controls.’, International journal of behavioral medicine, 14(4), pp. 257–61.
Semmlow, J. L. (2009) Biosignal and medical image processing, CRC Press. Servidio, K., Marshall, B., Robertson, B. and Carno, M.-A. (2014a) ‘Bioelectric Signals of Interest
in Sleep Medicine’, in Robertson, B., Marshall, B., and Carno, M.-A. (eds) Polysomnography for the Sleep Technologist: Instrumentation, Monitoring and Related Parameters. St. Louis, Missouri: Elsevier, pp. 77–98.
Servidio, K., Marshall, B., Robertson, B. and Carno, M.-A. (2014b) ‘Frequency, Voltage and Morphology of Signals’, in Robertson, B., Marshall, B., and Carno, M.-A. (eds) Polysomnography for the Sleep Technologist: Instrumentation, Monitoring and Related Parameters. St. Louis, Missouri: Elsevier, pp. 45–76.
Shochat, T., Gavish, A., Arons, E., Hadas, N., Molotsky, A., Lavie, P. and Oksenberg, A. (2007) ‘Validation of the BiteStrip screener for sleep bruxism.’, Oral surgery, oral medicine, oral pathology, oral radiology, and endodontics, 104(3), pp. e32-9.
Soderberg, G. L. (1992) ‘Recording techniques’, in Soderberg, G. L. (ed.) Selected topics in surface electromyography for use in the occupational setting: Expert perspectives. US Department of Health and Human Services, Center for Disease Control, National Institute for Occupational Safety and Health, pp. 31–35.
Stuginski-Barbosa, J., Porporatti, A. L., Costa, Y. M., Svensson, P. and Conti, P. C. R. (2016) ‘Diagnostic validity of the use of a portable single-channel electromyography device for sleep bruxism.’, Sleep & breathing = Schlaf & Atmung. Springer, 20(2), pp. 695–702.
Stuginski-Barbosa, J., Porporatti, A. L., Costa, Y. M., Svensson, P. and Conti, P. C. R. (2017) ‘Agreement of the International Classification of Sleep Disorders Criteria with polysomnography for sleep bruxism diagnosis: A preliminary study’, The Journal of Prosthetic Dentistry, 117(1), pp. 61–66.
Su, N., Liu, Y., Yang, X., Shen, J. and Wang, H. (2018) ‘Association of malocclusion, self-
31227203_UEF_Vaitoskirja_NO_351_Tomi_Miettinen_LUMET_sisus_19_10_02.indd 154 02/10/2019 7.49
133
reported bruxism and chewing-side preference with oral health-related quality of life in patients with temporomandibular joint osteoarthritis’, International Dental Journal. John Wiley & Sons, Ltd, 68(2), pp. 97–104.
Sumiya, M., Mizumori, T., Kobayashi, Y., Inano, S. and Yatani, H. (2014) ‘Suppression of Sleep Bruxism: Effect of Electrical Stimulation of the Masseter Muscle Triggered by Heart Rate Elevation’, The International Journal of Prosthodontics, 27(1), pp. 80–86.
Takaoka, R., Ishigaki, S., Yatani, H., Ogata, S. and Hayakawa, K. (2017) ‘Evaluation of genetic factors involved in nocturnal electromyographic activity of masticatory muscles in twins’, Clinical Oral Investigations, 21(1), pp. 319–325.
Takeuchi, T., Arima, T., Ernberg, M., Yamaguchi, T., Ohata, N. and Svensson, P. (2015) ‘Symptoms and Physiological Responses to Prolonged, Repeated, Low-Level Tooth Clenching in Humans’, Headache: The Journal of Head and Face Pain, 55(3), pp. 381–394.
‘The Glossary of Prosthodontic Terms’ (2017) The Journal of Prosthetic Dentistry, 117(5), pp. C1-e105.
Thie, N. M. R., Kato, T., Bader, G., Montplaisir, J. Y. and Lavigne, G. J. (2002) ‘The significance of saliva during sleep and the relevance of oromotor movements.’, Sleep medicine reviews, 6(3), pp. 213–27.
Tsujisaka, A., Haraki, S., Nonoue, S., Mikami, A., Adachi, H., Mizumori, T., Yatani, H., Yoshida, A. and Kato, T. (2018) ‘The occurrence of respiratory events in young subjects with a frequent rhythmic masticatory muscle activity: a pilot study.’, Journal of prosthodontic research.
Tsukiyama, Y., Baba, K. and Clark, G. T. (2001) ‘An evidence-based assessment of occlusal adjustment as a treatment for temporomandibular disorders’, The Journal of Prosthetic Dentistry, 86(1), pp. 57–66.
Tymecki, L., Glab, S., Koncki, R., Tymecki, L., Glab, S. and Koncki, R. (2006) ‘Miniaturized, Planar Ion-selective Electrodes Fabricated by Means of Thick-film Technology’, Sensors. Molecular Diversity Preservation International, 6(4), pp. 390–396.
Valiente López, M., van Selms, M. K. A., van der Zaag, J., Hamburger, H. L. and Lobbezoo, F. (2015) ‘Do sleep hygiene measures and progressive muscle relaxation influence sleep bruxism? Report of a randomised controlled trial’, Journal of Oral Rehabilitation, 42(4), pp. 259–265.
Velly Miguel, A., Montplaisir, J., Rompre, P. and Lavigne, G. (1992) ‘Bruxism and other orofacial movements during sleep’, J Craniomandib Dis Fac Oral Pain, 6(1), pp. 71–81.
Vendrame, M., Kaleyias, J., Valencia, I., Legido, A. and Kothare, S. V. (2008) ‘Polysomnographic findings in children with headaches.’, Pediatric neurology, 39(1), pp. 6–11.
Ware, J. C. and Rugh, J. D. (1988) ‘Destructive bruxism: sleep stage relationship.’, Sleep, 11(2), pp. 172–81.
Webb, W. B. and Campbell, S. S. (1979) ‘The first night effect revisited with age as a variable.’, Waking and sleeping, 3(4), pp. 319–24.
Webster, J. G. (1984) ‘Reducing Motion Artifacts and Interference in Biopotential Recording’, IEEE Transactions on Biomedical Engineering, 31(12), pp. 823–826.
Woidke, R. and Robertson, B. (2014) ‘The Polysomnogram: Prestudy Procedures, Monitoring Activities, and Poststudy Scoring and Interpretation’, in Robertson, B., Marshall, B., and Carno, M.-A. (eds) Polysomnography for the Sleep Technologist: Instrumentation, Monitoring and Related Parameters. St. Louis, Missouri: Elsevier, pp. 171–199.
Yachida, W., Arima, T., Castrillon, E. E., Baad-Hansen, L., Ohata, N. and Svensson, P. (2016)
31227203_UEF_Vaitoskirja_NO_351_Tomi_Miettinen_LUMET_sisus_19_10_02.indd 155 02/10/2019 7.49
134
‘Diagnostic validity of self-reported measures of sleep bruxism using an ambulatory single-channel EMG device’, Journal of Prosthodontic Research, 60(4), pp. 250–257.
Yamaguchi, T., Abe, S., Rompré, P. H., Manzini, C. and Lavigne, G. J. (2012) ‘Comparison of ambulatory and polysomnographic recording of jaw muscle activity during sleep in normal subjects.’, Journal of oral rehabilitation. Wiley Online Library, 39(1), pp. 2–10.
Yamaguchi, T., Mikami, S., Saito, M., Okada, K. and Gotouda, A. (2018) ‘A newly developed ultraminiature wearable electromyogram system useful for analyses of masseteric activity during the whole day’, Journal of Prosthodontic Research., 62(1), pp. 110-5.
Yap, A. U. and Chua, A. P. (2016) ‘Sleep bruxism: Current knowledge and contemporary management.’, Journal of conservative dentistry : JCD, 19(5), pp. 383–9.
Yoshida, Y., Suganuma, T., Takaba, M., Ono, Y., Abe, Y., Yoshizawa, S., Sakai, T., Yoshizawa, A., Nakamura, H., Kawana, F. and Baba, K. (2017) ‘Association between patterns of jaw motor activity during sleep and clinical signs and symptoms of sleep bruxism.’, Journal of sleep research, 26(4), pp. 415-21.
Yoshizawa, S., Suganuma, T., Takaba, M., Ono, Y., Sakai, T., Yoshizawa, A., Kawana, F., Kato, T. and Baba, K. (2014) ‘Phasic jaw motor episodes in healthy subjects with or without clinical signs and symptoms of sleep bruxism: a pilot study’, Sleep and Breathing, 18(1), pp. 187–193.
Van Der Zaag, J., Lobbezoo, F., Visscher, C. M., Hamburger, H. L. and Naeije, M. (2008) ‘Time-variant nature of sleep bruxism outcome variables using ambulatory polysomnography: implications for recognition and therapy evaluation.’, Journal of oral rehabilitation. Wiley Online Library, 35(8), pp. 577–84.
van der Zaag, J., Naeije, M., Wicks, D. J., Hamburger, H. L. and Lobbezoo, F. (2014) ‘Time-linked concurrence of sleep bruxism, periodic limb movements, and EEG arousals in sleep bruxers and healthy controls.’, Clinical oral investigations. Springer Berlin Heidelberg, 18(2), pp. 507–13.
Zhang, Y., Lu, J., Wang, Z., Zhong, Z., Xu, M., Zou, X., Yu, B. and Yao, D. (2017) ‘Companion of oral movements with limb movements in patients with sleep bruxism: preliminary findings’, Sleep Medicine, 36, pp. 156–164.
31227203_UEF_Vaitoskirja_NO_351_Tomi_Miettinen_LUMET_sisus_19_10_02.indd 156 02/10/2019 7.49
uef.fi
PUBLICATIONS OF THE UNIVERSITY OF EASTERN FINLAND
Dissertations in Forestry and Natural Sciences
ISBN 978-952-61-3183-2ISSN 1798-5668
Dissertations in Forestry and Natural Sciences
DIS
SE
RT
AT
ION
S | T
OM
I MIE
TT
INE
N | S
UIT
AB
ILIT
Y O
F A
SE
LF
-AP
PL
ICA
BL
E E
LE
CT
RO
DE
SE
T F
OR
... | No
351
TOMI MIETTINEN
SUITABILITY OF A SELF-APPLICABLE ELECTRODE SETFOR POLYSOMNOGRAPHIC ASSESSMENT OF
SLEEP BRUXISM IN THE HOME ENVIRONMENT
PUBLICATIONS OF THE UNIVERSITY OF EASTERN FINLAND
Sleep bruxism is a condition connected to several adverse effects on orofacial health. Currently, there is a serious lack of reliable and widely available means to quantify the level of sleep bruxism activity. The present
thesis introduces an electrode set that is shown to be easily self-applicable by the patients and capable of providing comprehensive, accurate and reliable quantification of the level of sleep
bruxism activity in a widely available and affordable way.
TOMI MIETTINEN
31227203_UEF_Vaitoskirja_NO_351_Tomi_Miettinen_LUMET_kansi_19_09_19.indd 1 19/09/2019 8.45