Embed Size (px)
Citation preview
ABSTRACT
Kimberly D. Crickmore. THE RELATIONSHIP BETWEEN PATIENT SATISFACTION AND
PATIENT-AND FAMILY-CENTERED CARE. (Under the direction of Dr. Martha Engelke)
College of Nursing, May, 2010.
Evidence of quality care is an important outcome in healthcare. Patient satisfaction, an
outcome of care, is considered by many experts to be a measure of quality. Patient- and family-
centered care (PFCC) is a healthcare delivery model that aims to enhance partnerships with
healthcare providers and patients and families. These partnerships are believed to play a
significant role in improving satisfaction and quality. However, there is a scarcity of research
that uses standardized tools and methods to show correlations between patient satisfaction and
PFCC.
The purpose of this study was to examine the relationship between the patient’s
perception of patient- and family-centered care (PFCC) as measured by questions defined by the
National Task Force on Patient- and Family-Centered Care Metrics for Press Ganey Survey
items and the patients’ perception of their inpatient care as measured by the HCAHPS Inpatient
Core Survey in patient care units in an academic medical center in the southeastern United
States.
A descriptive cross-sectional research design was used. The sample (N=1016) was
primarily white (57%) females (69%) with a mean age of 52.8 years. Those respondents that
were highly satisfied with their care also rated their perception of the presence of PFCC highly.
A relationship was also noted with respondent characteristics such as age, gender, and perceived
health status. Significant relationships were noted with domains of care in which nurses had the
most influence. Findings from this study validated relationships between patient satisfaction and
PFCC and provided evidence that nurses play a vital role in this outcome.

THE RELATIONSHIP BETWEEN PATIENT SATISFACTION AND
PATIENT-AND FAMILY-CENTERED CARE
A Dissertation
Presented to
The Faculty of the College of Nursing
East Carolina University
In Partial Fulfillment
of the Requirements for the Degree
Doctor of Nursing
by
Kimberly D. Crickmore
May, 2010

THE RELATIONSHIP BETWEEN PATIENT SATISFACTION AND
PATIENT-AND FAMILY-CENTERED CARE
by
Kimberly D. Crickmore
APPROVED BY:
DIRECTOR OF DISSERTATION:_________________________________________________
Martha Engelke
COMMITTEE MEMBER:________________________________________________________
Melvin Swanson
COMMITTEE MEMBER:________________________________________________________
Joan Wynn
COMMITTEE MEMBER:________________________________________________________
Mary Ann Rose
DEAN OF THE COLLEGE OF NURSING:
____________________________________________________
Sylvia Brown
ACTING DEAN OF THE GRADUATE SCHOOL:
____________________________________________________
Paul Gemperline

©Copyright 2010
Kimberly D. Crickmore

ACKNOWLEDGEMENTS
To my chair and friend, Dr. Martha Engelke, and my committee Dr. Melvin Swanson, Dr.
Joan Wynn, and Dr. Mary Ann Rose: thank you for your interest and your investment of time in
my research. Your support was critical to my success.
To Amy Jones, friend and colleague: thanks for your support of me on this journey and
for sharing the passion that I have for patient- and family-centered care. Your support will never
be forgotten.
To Jim Eggers, from HealthStream, and Amy Collard, my faithful assistant and friend:
your assistance with the data and formatting of results made it possible to reach my goal.
Thanks for your support.
To my fellow PhD candidates Cheryl Duke, Mary Wilson, Diana Bond, and Daphne
Brewington: these last few years have been a challenge in every sense of the word. Thanks for
your encouragement and support through all of my trials and joy. Best of luck to each of you in
all of your future endeavors. May we always keep in touch.
A special thanks to my parents, Christine and W. A. (posthumously) Crickmore: the
love, support, and solid foundation that you provided for me was most significant in the success
of this journey. You taught me to have faith in myself and God and to aim to be the best I could
be. I hope you are as proud of me as I am of you.

DEDICATION
To my wonderful husband, Brad Osborne, and my precious daughter, Ellie Osborne: you
two are my world. I would not be realizing this goal without your love, support, understanding,
and sacrifices. I am deeply grateful to you both. This work is dedicated to you.
TABLE OF CONTENTS
LIST OF FIGURES……………………………………………………………………… viii
LIST OF TABLES………………………………………………………………………. ix
CHAPTER 1 INTRODUCTION………………………………………………………… 1
Problem Statement/Significance…………………………………………………... 1
Purpose……………………………………………………………………………. 5
Psychometric Research Questions………………………………………………… 5
Primary Research Questions………………………………………………………. 5
Theoretical Approach……………………………………………………………... 6
Definitions………………………………………………………………………… 7
Patient-and Family-Centered Care (PFCC)………………………………… 7
Patient Satisfaction (HCAHPS)……………………………………………. 10
Summary…………………………………………………………………………... 11
CHAPTER 2 REVIEW OF LITERATURE…………………………………………… 12
Description of Search Methods…………………………………………………… 12
Patient- and Family-Centered Care……………………………………………...... 13
Summary of Patient- and Family-Centered Care…………………………………. 16
Patient Satisfaction………………………………………………………………... 17
Perceived Health Status…………………………………………………………… 19
Age, Gender, Race………………………………………………………………… 22
Summary of Patient Satisfaction………………………………………………….. 26
HCAHPS (as a Measure of Patient Satisfaction)………………………………….. 27
Summary for HCAHPS…………………………………………………………… 31

CHAPTER 3 METHODS AND DESIGN……………………………………………… 32
Research Design…………………………………………………………………... 32
Setting and Sample………………………………………………………………... 32
Instrumentation……………………………………………………………………. 33
HCAHPS Survey…………………………………………………………… 33
PFCC Press Ganey Questions………………………………………………. 34
Procedures………………………………………………………………………… 35
Data Analysis……………………………………………………………………… 36
Summary…………………………………………………………………………... 37
CHAPTER 4 RESULTS………………………………………………………………… 38
Characteristics of the Sample……………………………………………………... 38
Descriptive Analysis of Responses to Surveys…………………………………… 38
Psychometric Research Questions………………………………………………… 44
Primary Research Questions………………………………………………………. 44
Summary…………………………………………………………………………... 60
CHAPTER 5 DISCUSSION…………………………………………………………… 61
Significant Findings and Discussion……………………………………………… 61
Study Limitations…………………………………………………………………. 65
Implications for Practice, Education, and Research Practice……………………... 68
Practice……………………………………………………………………... 68
Education…………………………………………………………………… 69
Research……………………………………………………………………. 70
Summary…………………………………………………………………………... 71

REFERENCES………………………………………………………………………….. 72
Appendix A: Survey…………………………………………………………………….. 79
Appendix B: Patient- and Family- Centered Care Custom Question Set……………….. 80
Appendix C: Institutional Review Board Approval Letter……………………………… 81

LIST OF FIGURES
1. Adaptation of Kane’s outcomes model for measuring the relationship between
patient satisfaction as measured by HCAHPS and patient- and family-centered care
(PFCC)……………………………………………………………………………..
8

LIST OF TABLES
1. Demographics and Characteristics of the Study Sample (N=1016)…………………. 39
2. Frequency and Distribution of HCAHPS Responses.……………………………….. 40
3. Frequency and Distribution of PFCC Press Ganey Responses……………………… 43
4. Gamma Correlation of the Relationship Between PFCC and Overall Rating and
Likelihood to Recommend…………………………………………………………...
46
5. Frequency and Distribution of PFCC (total score) and Overall Rating and
Likelihood to Recommend…………………………………………………………...
47
6. Gamma Correlation of Relationship Between PFCC (total score) and Care from
Nurses, Care from Doctors, Hospital Environment and Hospital Experiences………
50
7. Percentage of Respondent Subgroups Reporting Highest Ratings for Overall
Hospital Rating, Likelihood to Recommend and PFCC Total Score………………...
52
8. Percentage of Respondent Subgroups Reporting Highest Ratings for Overall
Hospital Rating, Likelihood to Recommend and PFCC Total Score by Health Status
54
9. Stepwise Logistic Regression for Predictors for Overall Hospital Rating…………... 57
10. Stepwise Logistic Regression for Predictors for Likelihood to Recommend Hospital
59
11. Comparison of Stepwise Logistic Regression for Overall Hospital Rating and
Likelihood to Recommend Rating……………………………………………………
66

CHAPTER ONE INTRODUCTION
Problem Statement/Significance
Evidence of quality care is an important outcome of any health care system. The Institute
of Medicine (IOM) defines quality in healthcare as “the degree to which health services for
individuals and populations increase the likelihood of desired health outcomes and are consistent
with current professional knowledge” (IOM, 1999). The IOM (2001) also states that quality
health care should be safe, effective, patient-centered, timely, efficient, and equitable.
Improving the quality of health care has been a national priority for the last three decades.
Most studies have examined single diagnoses, payer sources, specific population segments and
have considered health outcomes without a link to the processes of care. Therefore, we lack a
comprehensive view of the level of quality care given to the average adult in the United States
(McGlynn et al., 2003).
Quality measures should be focused on three main areas for improvement: (1) structural
items such as the environment in which care is delivered; (2) processes of care such as
professional activities associated with the provision of care; and (3) outcomes which includes
changes in the patient’s current and future health status as a result of care as well as the patient’s
perception of their care (patient satisfaction) (Donabedian, 1988; Kane, Maciejewski, & Finch,
1997; Tomlinson & Ko, 2006). Patient satisfaction, an outcome of care, is generally viewed as
an important component in assessing quality of care (Cleary et al., 1991; Jha, Orav, Zheng, &
Epstein, 2008; Kane et al., 1997; Yellen, Davis, & Ricard, 2002).
Donabedian (1988), an advocate of nursing care and reputable quality researcher, defines
patient satisfaction as the ultimate validation of quality care. This foundational work which has

2
been expounded upon by agencies such as The Joint Commission on Accreditation of Healthcare
Organizations (JCAHO), the American Nurses Association (ANA), and others, has served as
support for using patient satisfaction as a measure of quality care (Yellen et al., 2002).
Tomlinson and Ko (2006) along with Wharam and Sulmasy (2009) note that patient
satisfaction is a very complex concept that is dependent on many factors and that controversy
exists around using this metric as a measure of quality. Tomlinson and Ko also note that whether
or not one agrees with patient satisfaction as a valid measure of quality, it is already being used
as such. Wharam and Sulmasy suggest that due to the urgency to improve quality, a prudent
short term strategy would be to focus on quality assessment from the patients’ perspective using
the Hospital Consumer Assessment of Healthcare Providers (HCAHPS) survey tool to assist in
assessing quality of care.
Numerous studies have examined various populations and factors associated with patient
satisfaction with care (perception of care). As previously noted, factors associated with quality
care and patient satisfaction are thought to include; structure, process and outcomes of care
(Donabedian, 1988; Kane et al., 1997). Other associated factors that have been examined in
studies include: patient socioeconomic status, education level, age, gender, race, marital status,
perception of health status, physical and psychological status, and attitudes and expectations
concerning care (Cleary et al., 1991; Sahin, Yilmaz, & Lee, 2007; Sitzia & Wood, 1997; Thi,
Brianco, Empereur, & Guillemin, 2002). Results, however, are inconsistent and sometimes
contradictory. This may be due largely to the considerable volume, variation, and lack of
validity and reliability of the tools used to measure patient satisfaction as a quality measure
(Castle, Brown, Hepner, & Hays, 2005; Sitzia, 1999).

3
In today’s healthcare arena, the increased focus on quality and safety outcomes,
satisfaction scores and new reimbursement structures, has motivated hospital leaders to develop
innovative models of care delivery (Charmel & Frampton, 2008). Patient- and family-centered
care (PFCC) is a model that addresses these challenges and issues.
PFCC is defined as “an innovative approach to the planning, delivery, and evaluation of
health care that is grounded in mutually beneficial partnerships among health care patients,
families, and providers” (Institute for Family Centered Care, 2008, p. 1). This model places an
emphasis on collaborating with patients and families of all ages, at all levels of care (including
the ICU), and in all health care settings. It also acknowledges that families, however they are
defined, are essential to patients’ health, recovery, and well being and are allies for quality and
safety within the health care system (Frampton, Gipin, & Charmel, 2003).
Influential stakeholders such as the Institute for Healthcare Improvement (IHI) and the
Institute of Medicine (IOM) suggest partnerships with patients, families, and healthcare
providers, as noted in the PFCC model, can reduce errors, reduce costs, and improve patient
satisfaction thus improving the quality of the care provided. The Joint Commission on
Accreditation of Healthcare Organizations (JCAHO) and the American Nurses’ Credentialing
Center (ANCC, the awarding body for Magnet status for nursing excellence) require that PFCC
concepts be integrated into practice as a means to address national patient safety goals and
quality of care. Implementation of the key concepts of PFCC is essential in order to meet
accreditation standards of these two organizations beginning in 2009 (ANCC, 2008; McCarthy,
2007). Therefore, hospitals aiming to obtain these credentials are beginning to implement
elements of the PFCC model of care.

4
Although PFCC is recommended and/or required by influential healthcare agencies such
as IHI, IOM, JCAHO, and ANCC (ANCC, 2008; Klein, 2007; McCarthy, 2007; Meyers, 2008),
there is minimal research that demonstrates the effectiveness of the model in achieving financial,
patient satisfaction, and quality goals (Hobbs, 2009). Additional research is needed to establish
consensus on whether this model has a positive impact on the outcomes of care including patient
satisfaction.
Some organizations suggest that the implementation of PFCC does indeed positively
impact patient satisfaction (Klein, 2007; McCarthy, 2007; Meyers, 2008). At least one study has
noted that the implementation of patient- and family-centered care had a positive effect on the
patient and family satisfaction scores in one ICU setting (Dowling, Vender, Guilianelli, & Wang,
2005). Further scientific inquiry is needed to substantiate this finding.
The American Association of Colleges of Nursing (AACN), in a 2006 position statement
on nursing research, validated the significance of nursing research pertaining to health systems
and outcomes. The focus of this type of nursing research is to identify ways by which the
organization and delivery of health care influence quality, cost, and the patient and family
experience. Because of the nature of nursing care, the nurse researcher is in a unique position to
examine both the clinical services and systematic structures in which these services are rendered.
There is an increased demand for nurse researchers to broaden their knowledge and skills in
health services research to meet the health and biomedical research agenda for the nation
(AACN, 2006). Therefore, a study designed to examine a health care delivery model (PFCC)
and its impact on patient satisfaction is significant to nursing research.

5
Purpose
The purpose of this study was to examine the relationship between the patient’s
perception of patient- and family-centered care (PFCC) as measured by questions defined by the
National Task Force on Patient- and Family-Centered Care Metrics for Press Ganey Survey
items and the patients’ perception of their inpatient care as measured by the HCAHPS Inpatient
Core Survey in patient care units in an academic medical center in the southeastern United
States. Prior to the examination of the primary research questions, the psychometric properties
of the Press Ganey and HCAHPS survey items were analyzed for the study sample.
Psychometric Research Questions
1. What is the internal reliability and of the HCAHPS survey items?
2. What is the internal reliability and dimensionality of the five-item Press Ganey
survey?
Primary Research Questions
1. Is there a relationship between the perception of PFCC (total score on Press Ganey
survey items) and the overall hospital rating and the likelihood to recommend rating
(HCAHPS survey)?
2. Is there a relationship between the individual components of PFCC (individual item
scores) and the overall hospital rating and the likelihood to recommend rating
(HCAHPS survey)?
3. Is there a relationship between the perception of PFCC (total score on Press Ganey
survey items) and the perception of care from nurses, care from doctors, hospital
environment, and experiences in the hospital (HCAHPS component scores)?
4. Does the perception of PFCC (total score on the Press Ganey survey) and

6
the overall rating of the hospital experience and the likelihood to recommend the
hospital (HCAHPS) vary based on respondent characteristics?
5. What variables are the best predictors that a patient is likely to give a high overall
rating for their hospital experience?
6. What variables are the best predictors that a patient is likely to recommend the
hospital to family and friends?
Theoretical Approach
The overall aim of a conceptual model or framework is to assist with making research
findings meaningful and generalizable (Polit & Beck, 2008). Robert Kane (1997, 2006)
developed a framework, known as an Outcomes Model, to consider how treatment interacts with
patient factors and clinical factors to produce outcomes of care. According to Kane’s
framework, there are three groups of factors that have substantial effects on patient outcomes: (1)
clinical factors which include factors such as diagnosis, prognosis, comorbidity, and severity of
disease; (2) patient factors which include age, gender, ethnicity, socioeconomic status, and payer
source; and (3) treatment factors which include accessibility, availability, frequency, and side
effects of care. Kane’s model is generally meant to be used for quantitative experimental studies
such as randomized controlled trials. However, Kane (1997) notes that it is not feasible to rely
solely on randomized controlled trials for all empirical data to link outcomes to processes of
care.
Academy Health (previously known as the Academy for Health Services Research and
Health Policy) defines outcomes research as “research on measures of changes in patient
outcomes, that is, patient health status and satisfaction, resulting from specific medical and

7
health interventions” (Academy Health, 2004, p. 28). Therefore, Kane’s model is adaptable for
this study.
Figure 1 depicts the adaptation of Kane’s model for this study. For this study, the factors
were defined as follows: (1) clinical factors included the patient’s self reported rating of overall
health (as noted on the HCAHPS survey), (2) patient factors included age, gender, and race (3)
treatment factors were defined as the implementation of key aspects of PFCC. The outcome for
this study was defined as patient satisfaction (as measured by HCAHPS) and included general
and specific measures of satisfaction with various components of care. Patient satisfaction with
health care is considered an outcomes measure because it is determined after a clinical treatment
has ended and recuperation has begun (Kane et al., 1997). To date, no studies have been
published that utilize this model in the suggested manner.
For the purposes of this study the following terms were defined.
Definitions
Patient-and Family-Centered Care (PFCC)
The Institute for Family-Centered Care, founded in 1992, defines PFCC as an “innovative
approach to the planning, delivery, and evaluation of health care that is grounded on mutually
beneficial partnerships among health care patients, families, and providers. Patient- and family-
centered care applies to patients of all ages, and it may be practiced in any health care setting”
(Institute for Family-Centered Care, 2008).
As noted by Conway et al. (2006, pp. 6-7), the core concepts of patient -and family-
centered care are:

8
Clinical Factors
� Self reported health status
“In general, how would you rate your overall health?”
Treatment � Perception of PFCC
(based on Press Ganey questions added to HCAHPS survey)
Patient Factors � Age
� Gender � Race
Outcomes � Patient satisfaction (as
measured by HCAHPS)
DOMAINS:
nurse care, doctor care, environment, experiences, overall rating, recommend
Figure 1. Adaptation of Kane’s outcomes model for measuring the relationship between patient
satisfaction as measured by HCAHPS and patient- and family-centered care (PFCC).

9
• Dignity and Respect. Providers listen to and honor patient and family perspective
and choices. Patient and family knowledge, values, beliefs and cultural backgrounds
are incorporated into the planning and delivery of care.
• Information Sharing. Providers communicate and share complete unbiased
information with patients and families. Patients and families receive timely,
complete and accurate information to better participate in care and decision- making.
• Participation. Patients and families are encouraged to participate in care and
decision making at the level they choose.
• Collaboration. Patients, families, providers, and hospital leaders collaborate in
policy and program development, implementation and evaluation; health care facility
design; in professional education as well as the delivery of care.
Although these core concepts delineate what characteristics are integral to PFCC
implementation, there is little in the literature that clearly defines ways in which to operationalize
and measure implementation of this model of care (Carmen, Teal, & Guzzetta, 2008; Hobbs,
2009). Until recently, no tool existed in the literature that measures these concepts for the adult
inpatient population (Carmen et al., 2008; Garcia, 2007). The IOM states that PFCC is a key
element of a high quality health care system; therefore, it is imperative that methods to evaluate
this model of care be developed (Jha et al., 2008).
In an effort to assist with measuring PFCC and its relationship to patient satisfaction, a
national task force of 11 pediatric and adult care hospitals from coast to coast and the Press
Ganey Research and Development Team developed, analyzed, and evaluated (measured validity
and reliability) a set of questions that were used to operationalize the perception of PFCC in this
study (Garcia, 2007). The questions are:

10
a. How often were you and your family able to participate in decisions about your care?
b. How often did staff explain their roles in your care?
c. How often did the staff support your family throughout your healthcare experience?
d. How often were your choices respected to have family members/ friends with you
during your care?
e. How often did staff respect your family’s cultural and spiritual needs?
Patient Satisfaction (HCAHPS)
As noted, patient satisfaction with care is generally viewed as an important component in
assessing quality of care (Jha et al., 2008; Kane et al., 1997; Yellen et al., 2002). Hospitals are
focusing on quality care as is mandated by the government and key influential healthcare bodies;
therefore, patient satisfaction is a variable that needs to be measured. For this study patient
satisfaction was measured by the scores produced on the Hospital Consumer Assessment of
Health Providers Survey (HCAHPS).
The purpose of the HCAHPS survey is to provide a standardized survey instrument and
data collection methodology for measuring patients' perspectives on hospital care. Prior to
HCAHPS there was no national standard for collecting or publicly reporting patients'
perspectives of their care experiences. Therefore, in order to make equitable comparisons to
support consumer or patient choice, it became necessary to introduce a standardized approach to
measuring patient satisfaction. HCAHPS is a federally mandated set of questions that can be
combined with broader, customized set of hospital-specific items. HCAHPS survey items
complement the data hospitals currently collect to support improvements in internal customer
services and quality related activities (Kirchheimer, 2007; NAPH, 2008; National Quality
Forum, 2005).

11
Beginning in July 2007, hospitals subject to the inpatient prospective payment system
provisions are required to submit data from the HCAHPS survey (for adult patients) to receive
full annual payment updates from the Center for Medicare and Medicaid Services (CMS)
(Kirchheimer, 2007; National Association of Public Hospitals and Health Systems [NAPH],
2008; National Quality Forum, 2005). To date, there are no studies in the literature that have
examined the impact of the PFCC model of care delivery on patient satisfaction using the
HCAHPS tool.
Summary
In summary, patient satisfaction, which serves as an indicator of quality care, is a key
element that needs to be addressed in outcomes research. Outcomes research should also focus
on measuring health interventions which will be defined in this study as the patients’ perception
of the implementation of PFCC. PFCC is believed to impact satisfaction and quality care.
Findings from this study may inform and assist hospital and nursing leaders in developing a
health care system that delivers quality care and improves patient satisfaction.

CHAPTER 2 REVIEW OF LITERATURE
The purpose of this study was to examine the relationships between patient satisfaction,
as measured by HCAHPS scores, and patients’ perceptions of the practice of patient-and family-
centered care (PFCC), as measured by the Press Ganey tool. First, this chapter presents a review
of the pertinent and significant literature beginning with PFCC, the treatment factor in Kane’s
model defined for this study. Second, a review of patient satisfaction and the related clinical
(perceived health status) and patient factors (age, gender, race) noted in Kane’s Outcomes Model
(see Figure 1, Chapter 1) adapted to guide this study are presented followed by a review of the
HCAHPS survey. Studies that examined relationships among these factors in the inpatient
hospital setting were the focus of this review. Finally, a summary will complete this review of
literature.
Description of Search Methods
The literature on patient satisfaction and PFCC was reviewed for the years 1993 -2009.
Research studies were queried from 2000-2009 in order to maintain a recent and current focus.
Key words used in the literature search included ‘patient-and family-centered care’, ‘patient
satisfaction in the hospital setting’, ‘HCAHPS’, ‘quality healthcare’, and ‘Kane’s outcomes
model’.
Electronic databases such as CINAHL, Medline, and Cochrane were searched via the
search engines PubMed, Ovid, Google, and Ebsco in order to identify pertinent literature and
research on these topics. Bibliographies were also used to locate relevant and foundational
literature. Literature was reviewed in various sciences including nursing, medicine, health
services research and the social sciences.

13
Patient-and Family-Centered Care
Proponents of patient- and family-centered care (PFCC) propose that quality and patient
satisfaction will be enhanced or improved by the implementation of this model of care delivery.
However, there are no studies in the current literature that have measured the impact of PFCC on
patient satisfaction with hospital care using HCAHPS. This gap in the literature needs to be
addressed, especially since regulatory agencies are requiring the implementation of the key
concepts of the PFCC model and the use of the HCAHPS tool.
The Picker Commonwealth Program for Patient-Centered Care, now the Picker Institute,
introduced patient-centered care in 1988. At that time, the Picker group began doing research on
patients’ needs and preferences to gain an understanding of the patient’s definition of high
quality care (Conway et al., 2006). Research initially was qualitative in nature and was aimed at
understanding how patients and their families defined quality of care in hospitals. The Picker
Commonwealth Program for Patient-Centered Care used the findings from focus groups and
patient and family interviews to develop survey instruments that measured the patient’s
experience of care. Telephone interviews with 6455 patients and 2000 of their identified care
givers were completed within six months of discharge (Gerteis, Edgman-Levitan, Daley, &
Delbanco, 1993). These surveys conducted for health care organizations in United States,
Canada, and Europe, measured the patients’ experiences in eight dimensions of care: (1) access,
(2) respect for values and preferences, (3) coordination of care, (4) information, communication
and education, (5) physical comfort, (6) emotional support, (7) involvement of family and
friends, and (8) preparation for discharge and transitions in care. In addition to safe and
excellent care, these dimensions are deemed to be the most critical aspects of the patient and
family experience (Conway et al.; Gerteis et al., 1993). A limitation of this work, despite the

14
large and diverse sample size, was that the survey was administered six months post discharge.
Patients and their care partners may not have had a vivid and accurate recall of inpatient
experiences six months after discharge.
Another study by Bruster, Jarman, Bosanquet, Weston, Erens, and Delbanco (1994),
included a stratified randomly chosen group of 5150 patients recently discharged (two to four
weeks) from 108 acute care hospitals in England. Patients were interviewed face to face at home
or at the place of discharge with a valid and reliable questionnaire. Findings were weighted to
ensure that they were representative both of hospitals within the sample and patients within each
hospital. Perceived problems with inpatient care were reported by patients with regard to staff
communication (56%), pain management (33%), and discharge planning (70%) (Bruster et al.,
1994). A limitation noted by the researchers included concerns over the length of the
questionnaire which took on average 47 minutes to complete. These earlier studies are
foundational as they aided contemporaries in defining PFCC and its core concepts.
In recent years, the term “patient-centered care” has been expanded to “patient- and
family-centered care”, which highlights the role that families play in the care of patients as well
as their contributions to the patient’s overall health and well-being (Conway et al., 2006; Ponte
& Peterson, 2008). The Institute for Family-Centered Care, founded in 1992, defines PFCC as
an “innovative approach to the planning, delivery, and evaluation of health care that is grounded
on mutually beneficial partnerships among health care patients, families, and providers. Patient-
and family-centered care applies to patients of all ages, and it may be practiced in any health care
setting” (Institute for Family-Centered Care, 2008, p. 1).
As noted by Conway et al. (2006, pp. 6-7), the core concepts of patient -and family-
centered care are:

15
• Dignity and Respect. Providers listen to and honor patient and family perspective
and choices. Patient and family knowledge, values, beliefs and cultural backgrounds
are incorporated into the planning and delivery of care.
• Information Sharing. Providers communicate and share complete unbiased
information with patients and families. Patients and families receive timely,
complete and accurate information to better participate in care and decision- making.
• Participation. Patients and families are encouraged to participate in care and
decision making at the level they choose.
• Collaboration. Patients, families, providers, and hospital leaders collaborate in
policy and program development, implementation and evaluation; health care facility
design; in professional education as well as the delivery of care.
Three case studies in the literature have attempted to measure an organization’s success
with implementation of the core concepts of the PFCC care delivery model (Klein, 2007;
McCarthy, 2007; Meyers, 2008). The first case study (Klein) found that medication errors in the
neurosciences unit at the Medical College of Georgia dropped by 62%, length of stay on the unit
dropped by 50%, and patient satisfaction rose to the 95th
percentile from the 10th
after the
implementation of key aspects of PFCC. The second case study (McCarthy) at Bronson’s
Methodist Hospital noted that patient satisfaction scores improved to the top 5% in the Gallup’s
national hospital database. This study also noted nurse vacancy rates fell to 5.5% as compared to
national benchmarks of 10.6%. A third case study (Meyers) from Joe DiMaggio’s Children’s
Hospital noted that PFCC resulted in a decrease in nurse turnover from 11% to 7% and patient
satisfaction scores ranked in the top 1-2% per Press Ganey surveys. While these case studies
suggested that PFCC improved patient and staff satisfaction scores, reduced costs, reduced

16
turnover, and reduced length of stay, there was no method of scientific inquiry that specifically
identified the implementation of the PFCC model as the reason for these improvements.
Additionally, no standardized tools or methods of evaluation were noted.
Carmen et al. (2008) published a landmark study that included validation of a PFCC
survey to objectively measure the integration of PFCC in children’s hospitals. The researchers
used focus groups and expert consultation to develop content for the survey. Survey items were
factor analyzed and Cronbach alpha scores on the subscales were calculated (ranged from .76-
.94). Subsequently, the survey was used by 83 children’s hospitals (internationally) to
benchmark practices and to help them determine if they were in the beginning, intermediate or
advance level of practice using the PFCC model of care. The majority of hospitals that
participated were found to be implementing PFCC at the intermediate level of practice. The
researchers also identified that perceptions of PFCC implementation differed by the groups
(patients / families, staff, and leadership) completing the survey. Overall, families and staff
tended to rate hospitals higher on PFCC practice than did leadership respondents. The findings
from this study are significant as health accreditation bodies such as JCAHO and ANCC as well
as reimbursement groups such as CMS (federal government) will be expecting hospitals to
implement PFCC in order to be accredited and financially reimbursed (Charmel & Frampton,
2008). Having a tool to measure PFCC implementation may prove helpful to hospital leaders
during strategic planning. The tool developed by these researchers was specific to pediatric
institutions, however, it could be modified to encompass adult care settings as well.
Summary of Patient- and Family- Centered Care
This review suggests that there is some evidence regarding the relationship of the PFCC
model of care delivery to patient satisfaction and thus quality care. Historical studies have

17
helped to determine the current definition of PFCC. Three case studies were cited that suggested
improvement with the PFCC model but research design limits generalizability of these claims.
Therefore, the implementation of this model and its impact requires further research. To date,
only one study (Carmen et al., 2008) has been published to objectively measure the
implementation of this model in pediatric healthcare settings. However, this study did not
examine the relationships between implementation and other indicators of patient satisfaction or
quality. More research is needed to show the effectiveness of this model of care delivery in adult
settings. Research that measures the impact of PFCC on patient satisfaction may equip and
enable healthcare leaders to implement PFCC to meet quality (patient satisfaction), patient
safety, and financial goals.
Patient Satisfaction
Patient satisfaction research has been ongoing for the last five decades and the literature
is quite extensive. This concept has been viewed as elusive and research on this topic has been
approached from numerous and varied perspectives over time (Rahmqvist, 2001; Sitzia, 1999).
Earlier research focused on nursing satisfaction in the primary care and hospital settings
and confirmed relationships between patient satisfaction and nursing care (Abdellah & Levine,
1957; Donabedian, 1966; Risser, 1975). As research continued, efforts became focused on the
relationship between quality and patient satisfaction. Donabedian (1988) noted that factors such
as structure, process and outcomes should also be included when examining this relationship.
Jenkinson, Coulter, Bruster, Richards, and Chandola (2002) suggests that patient
satisfaction scores historically tend to reveal very high ratings but may not be sensitive to the
delivery of quality care. This group of researchers also suggests that satisfaction surveys should

18
attempt to measure patients’ experiences of their care and then determine how these experiences
are related to satisfaction.
Wagner and Bear (2008) noted in a concept analysis of patient satisfaction with nursing
care, that there is a clear link between patient satisfaction with nursing care and overall
satisfaction in the literature. They also note that with the strong emphasis on the outcome of
patient satisfaction, it is imperative for researchers to find methods to measure and improve
patient satisfaction. Therefore, the overall patient experience with their hospitalization must
encompass other dimensions of care such as physician communication, facilities, feelings about
culture, family support, and decision making abilities such as those grounded in the core
concepts of PFCC. Drain and Clark (2004) note that patients deserve to be allowed to evaluate
the quality of their healthcare experience and that by evaluating patient satisfaction patients are
empowered by making them the ultimate arbiter of the quality of their experience.
Sitzia and Wood (1997) completed a comprehensive literature review of over 100 papers
published on patient satisfaction from the years 1965 through 1996. The review covered studies
in both the primary care and hospital settings. In general, this review highlighted the complexity
and breadth of literature on this topic. Sitzia and Wood also identified in this review the three
main purposes for measuring patient satisfaction: (1) to describe healthcare services from the
patient’s perspective, (2) to identify problem areas in healthcare organizations and generate ideas
for solutions, and (3) to evaluate healthcare which includes quality. The latter was considered
the most important reason for measuring the patient’s perspective of care.
Inherent in much of the literature reviewed was the notion that satisfaction is in some
way determined by certain subject characteristics. Countless studies have examined patient
satisfaction in a variety of venues considering multiple associated factors such as patient

19
socioeconomic status, education level, age, gender, race, marital status, perception of health
status, physical and psychological status, and attitudes and expectations concerning care (Cleary
et al., 1991; Cohen, 1996; Sahin et al., 2007; Sitzia, 1999; Sitzia & Wood, 1997; Thi et al.,
2002). In addition, methodological issues such as “social desirability response bias”, “self
interest or control bias”, “justification bias”, and the “Hawthorne effect” were shown to affect
responses to satisfaction surveys. Results, however, are inconsistent and sometimes
contradictory. This may be due largely to the considerable volume, variation, and lack of
validity and reliability of the tools used to measure patient satisfaction as a quality measure
(Castle et al., 2005; Sitzia; Sitzia & Wood). Nevertheless, there is some indication that specific
subject characteristics do affect ratings of patient satisfaction.
The next section of the review of literature will present contemporary studies that
investigate the relationship of patient satisfaction to perceived health status, age, race, and
gender.
Perceived Health Status
A patient’s perception of their health status has been examined to determine its impact on
patients’ scores on satisfaction surveys. Xiao and Barber (2008) conducted a secondary analysis
of the Medical Expenditure Panel Survey- Household Component for people ages 35-64 years to
examine the effect of perceived health status on patient satisfaction as measured by access to
care, provider quality and quality of care. Multivariate logistic regression was used to control for
the influence of extraneous variables. The study found that perceived health status was directly
related to all three measures: access, provider, and quality care. Those who rated their health
care as good or excellent had a higher level of satisfaction with their health care and those who
rated their health care as fair or poor had lower satisfaction levels.

20
Despite the large sample size (N=4417) from a 1999 full year database, this study may
not be representative of the general population. The sample was primarily white (68%) and
female (70%). This may have been due to the fact that the survey was to be answered by one
member of the family. It has been determined that the female of the household plays a large role
in decision making regarding family health issues (Kaiser Family Foundation, 2003). Therefore,
the health status for each person in the household may not have been reflected. Additionally, the
age range was limited to 35-64. Younger or older respondents were excluded which may have
altered the outcome. This study was not necessarily administered to people who had recently
had an inpatient hospital experience. Although the focus of this study is specific to the inpatient
hospital experience, this research was included as a contemporary study that measured perceived
health status and its relationship to patient satisfaction.
Jenkinson et al. (2002) conducted a study to determine what aspects of health care
provision were most likely to influence patient satisfaction. The sample included patients 18 and
older from five hospitals in Scotland. Picker surveys were mailed to patients’ homes within one
month of discharge from the hospital during a 12 month period. A 65% respondent rate (N=
2249) was noted. Patients were randomly selected from the hospital information system and
were stratified by provider unit, age, and gender. The sample representation was men (46%) and
women (53%). Most respondents described their experience as good, very good, or excellent
(90%).
A regression analysis was done to determine which of the seven dimensions of the Picker
survey (including age, gender, and self reported health status) seemed to be significantly
associated with patient satisfaction as the dependent variable. Spearman coefficients were
reported for all correlations. A multivariate linear regression revealed that age (p<0.02) is an

21
important factor in reported satisfaction, but that self- reported health status (p=0.27) was not.
The most important factors that influence patient satisfaction, as indicated by the regression,
appeared to be physical comfort, emotional support, and respect for patient preferences.
Furthermore, satisfaction was highly associated with willingness to recommend to others the
hospital in which they received care. The evidence provided here suggests that the patients’
perception about the manner in which care is delivered is more closely related to satisfaction
than age or the perception of one’s health. Respondent bias could be a risk as the surveys were
mailed to patients and dependent upon the patients’ desire to respond.
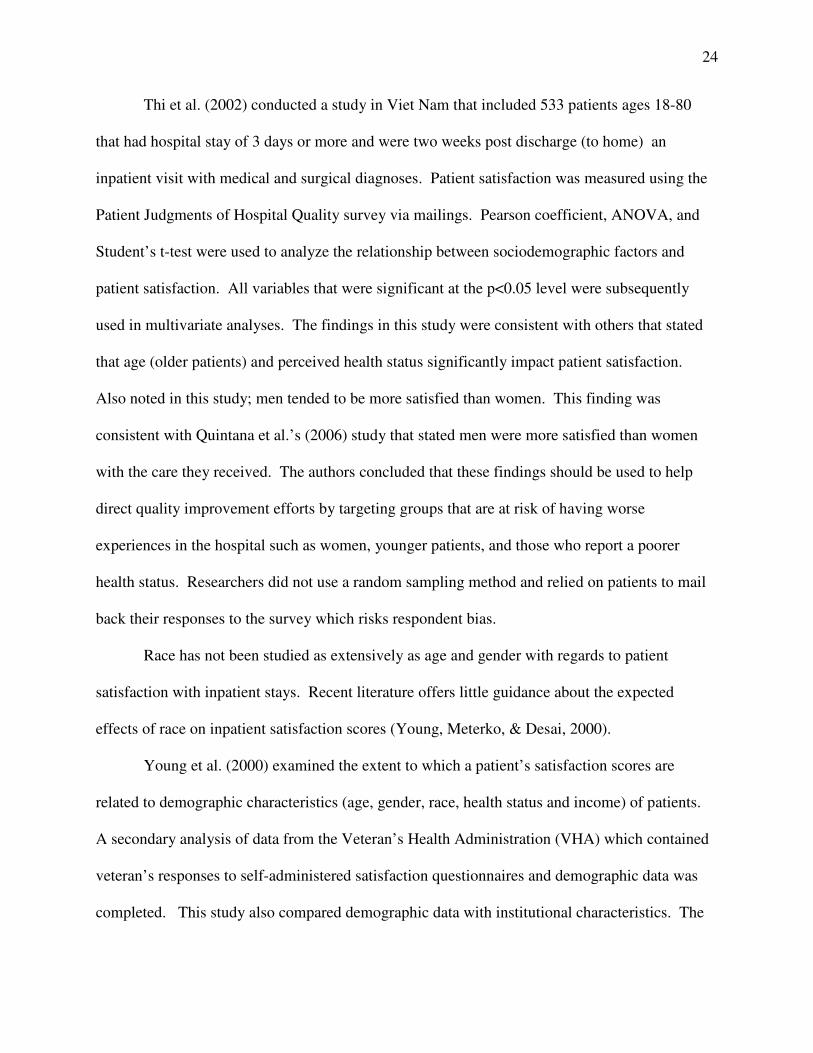
Thi et al. (2002) conducted a study in Viet Nam that included 533 patients ages 18-80
that had a hospital stay of 3 days or more and were two weeks post discharge (to home) an
inpatient visit with medical and surgical diagnoses. Patient satisfaction was measured using the
Patient Judgments of Hospital Quality survey via mailings. Pearson coefficient, ANOVA, and
Student’s t-test were used to analyze the relationship between sociodemographic factors and
patient satisfaction. All variables that were significant at the p<0.05 level were subsequently
used in multivariate analyses. The findings in this study were consistent with others that stated
that age (older patients) and perceived health status significantly impact patient satisfaction.
Also noted in this study; men tended to be more satisfied than women. The authors concluded
that these findings should be used to help direct quality improvement efforts by targeting groups
that are at risk of having worse experiences in the hospital such as women, younger patients, and
those who report a poorer health status. Researchers did not use a random sampling method and
relied on patients to mail back their responses to the survey which risks respondent bias.
Rahmqvist (2001) conducted a study to examine age, health status and other factors and
their relationship to patient satisfaction. The study sample included patients ranging from 1-94

22
years of age who had been discharged within six weeks from one of four hospitals in Sweden.
The Patient Satisfaction Index (PSI) was the survey used to obtain data. The survey was mailed
to all patients discharged with a 69% (N=3400) response rate. This study revealed via regression
analyses that age and perceived health status were significantly related to satisfaction as measure
by the PSI. This study noted that the older patient was more satisfied with care. In contrast to
Jenkinson et al.’s (2002) study, the patient’s who rated their health the poorest scored their
satisfaction the highest. Correlations with gender were not found in this study. The study also
examined differences among the specialties offered in the four hospitals. Only gynecology stood
out as a specialty that had more satisfied patients. The authors speculate that this may be related
to the physician-patient relationship which was not examined as a part of this study.
The impact of perceived health status on inpatient satisfaction is not clear. Neither,
historical studies nor the more contemporary studies noted here are definitive regarding whether
or not perceived health status is indeed a determinant in the patient’s measure of the satisfaction
with the care he received. This discrepancy may be attributed to the mortality associated with
certain diseases (not addressed in the studies noted in this review). This is very difficult to
measure in large scale randomized studies that are not population or disease specific. Thus, a
study that uses a standardized tool and sampling process whereby results could be compared
nationally across all hospitals may prove valuable in helping to further discern the impact of
perceived health status on inpatient satisfaction.
Age, Gender, Race
While researchers can not alter patient characteristics such as age, gender, and race when
investigating patient satisfaction, their role is important for at least two reasons. One is the need
to potentially adjust for these factors when making certain comparisons such as among medical

23
specialties. Second, noting these factors makes it possible for providers to target patients who
may be at risk for less positive experiences or outcomes (Thi et al., 2002).
Age, gender, and race have been studied repeatedly in patient satisfaction studies over the
last 50 years. These studies have been conducted in a variety of inpatient and outpatient settings
and have addressed numerous physical, emotional, and psychosocial characteristics as well
(Sitzia & Wood, 1997). In general, there has been more consistency in the relationship between
age and patient satisfaction than the relationship of patient satisfaction to either gender or race
(Jenkinson et al., 2002; Rahmqvist, 2001; Sitzia & Wood, 1997).
Quintana et al. (2006) utilized a self developed, valid and reliable survey tool to measure
predictors of patient satisfaction. This tool measured six different domains. Higher scores
indicated higher levels of patient satisfaction. A cross-sectional study of patients discharged
from the medical and surgical wards from four acute care hospitals (N=1910) was conducted.
The survey was mailed to a random sample of 650 discharged patients from each hospital with a
74% response rate. Age was correlated with all six domains (information and communication
with doctors, nursing care, comfort, visiting, privacy, cleanliness) and gender was correlated
with three domains (comfort, visiting, privacy). These correlations based on ANOVA and Chi-
squared analyses were statistically significant at the p<0.05 level.
Older patients and men tended to have higher satisfaction scores which remains
consistent with previous studies (Cohen, 1996; Thi et al., 2002). Additionally, the study results
suggest that those who were married or cohabitated and those that had lower levels of education
were more satisfied. The researchers did rely on patients to self-administer the survey, which
can lead to risk of respondent bias. This study supports that there is some evidence that patient
sociodemographic factors, at least age and gender, do affect patient satisfaction levels.
24
Thi et al. (2002) conducted a study in Viet Nam that included 533 patients ages 18-80
that had hospital stay of 3 days or more and were two weeks post discharge (to home) an
inpatient visit with medical and surgical diagnoses. Patient satisfaction was measured using the
Patient Judgments of Hospital Quality survey via mailings. Pearson coefficient, ANOVA, and
Student’s t-test were used to analyze the relationship between sociodemographic factors and
patient satisfaction. All variables that were significant at the p<0.05 level were subsequently
used in multivariate analyses. The findings in this study were consistent with others that stated
that age (older patients) and perceived health status significantly impact patient satisfaction.
Also noted in this study; men tended to be more satisfied than women. This finding was
consistent with Quintana et al.’s (2006) study that stated men were more satisfied than women
with the care they received. The authors concluded that these findings should be used to help
direct quality improvement efforts by targeting groups that are at risk of having worse
experiences in the hospital such as women, younger patients, and those who report a poorer
health status. Researchers did not use a random sampling method and relied on patients to mail
back their responses to the survey which risks respondent bias.
Race has not been studied as extensively as age and gender with regards to patient
satisfaction with inpatient stays. Recent literature offers little guidance about the expected
effects of race on inpatient satisfaction scores (Young, Meterko, & Desai, 2000).
Young et al. (2000) examined the extent to which a patient’s satisfaction scores are
related to demographic characteristics (age, gender, race, health status and income) of patients.
A secondary analysis of data from the Veteran’s Health Administration (VHA) which contained
veteran’s responses to self-administered satisfaction questionnaires and demographic data was
completed. This study also compared demographic data with institutional characteristics. The

25
inpatient questionnaire was comprised of nine subscales that consisted of three to five items
each. The VHA randomly selected 175 patients from each regional hospital across the United
States that were discharged home within three months. The questionnaires were distributed
using a mail out, mail back methodology. The response rate for this study was 61% (N=34,359).
The researchers used 2-level, random effects regression models for analysis.
Survey respondents were overwhelmingly male and the average age was between 60 and 70.
Results demonstrated that age, health status, and race have statistically significant effects on
patient’s satisfaction with their care. Older patients, patients who perceive better health status
and whites (versus non whites) were more satisfied with care. The researchers note that it is
important to consider whether these relationships reflect differences in patient expectations and
values or reflect actual differences in the way patients are treated. Despite the very large sample
size, this study had primarily male subjects most likely due to the military nature of the sample
which implies a lack of generalizability beyond the VHA. Again, respondent bias may be a risk
as patients were asked to mail back the questionnaires.
Racial and ethnic disparities in health care are known to affect access to care and
evidence suggests race and ethnicity are also significant predictors of quality of health care
received (Barr, 2004; IOM, 2003). The Institute of Medicine (2003) has noted in various studies,
mostly specific to primary care settings, and reviews that in general ethnic minority patients are
found to receive a lower quality of healthcare. However, there is very little evidence that race
has an effect on satisfaction with care.
Barr (2004) conducted a study in private primary care settings to look at the impact of
patient satisfaction in the primary care setting. Using a real time study, 537 patients selected at
random from those entering the practice were interviewed. Barr found after regression analyses

26
that age, health status and education did have a significant impact on satisfaction scores. No
differences in overall satisfaction between whites and non-whites were noted. However, he did
find that ethnic minorities (mostly Asian) are less satisfied than whites with their interactions
with physicians. Therefore, he suggested that satisfaction tools should include assessments of
satisfaction directly related to the care provided by the provider. While this study does not
specifically address satisfaction in the inpatient setting, it was included as a contemporary study
that addresses race and patient satisfaction as minimal research was found that addressed race
and inpatient satisfaction with care. Barr’s study suggests that satisfaction with care is linked to
satisfaction with the provider of care in some ethnic groups and tools which measure satisfaction
need to include a measure of provider satisfaction.
Summary of Patient Satisfaction
In general, most patients report being satisfied with care which makes finding predictors
of satisfaction and dissatisfaction more difficult. Attempts have been made to determine the
features of patient care that are likely to influence satisfaction and thus quality of patient care as
noted in the studies reviewed. There is some consensus that: (1) patients should be allowed to
measure their satisfaction with care, (2) the patient experience is a measure of the quality of care
received, and (3) patient satisfaction measures can assists organizations in quality improvement
opportunities.
Perceived health status, age, gender, and race have been studied but evidence of impact
on patient satisfaction is inconsistent with the exception of age and gender. Older patients tend
to be more satisfied with their care and men tend to be more satisfied than women with their care
in the hospital setting. As noted previously, this may be largely due to the lack of utilization of
consistent, valid, and reliable tools and collection methods. Also as noted in the studies in this

27
review, it is important to consider the impact of dimensions of care beyond perceived health
status, age, gender, and race on patient satisfaction.
HCAHPS (as a Measure of Patient Satisfaction)
Patient satisfaction surveys have proliferated over the last several decades. Many of
these tools were not valid and reliable beyond specific venues or populations. These satisfaction
tools have varied significantly in content, method of administration, sampling processes and
administration protocol making generalizability difficult at best (Castle et al., 2005; Sitzia, 1999;
Quintana et al., 2006).
Using a standardized tool, along with standardization in sampling, administration
protocol, and mode of administration could be beneficial in helping to identify predictors of
patient satisfaction (Castle et al., 2005). The Hospital Consumer Assessment of Healthcare
Providers survey (HCAHPS) incorporates these factors.
Beginning in July, 2007 hospitals subject to the inpatient prospective payment system
provisions are required to submit data from a standardized survey of their adult patients to
receive their full annual payment updates from the Center for Medicare and Medicaid Services
(CMS). Beginning in March 2008, the data from these patient surveys were posted publicly on
the Hospital Compare Website. Hospitals that choose not to participate can lose up to two
percentage points from their annual Medicare payment update (Kirchheimer, 2007; NAPH,
2008).
This first national standardized survey on hospital patient experience, known as
HCAHPS, was a joint project of the CMS and the Agency for Healthcare Research and Quality
(AHRQ) and was endorsed by the National Quality Forum (NQF) in May 2005 (National Quality
Forum, 2005). The NQF endorsement represents the consensus of health care providers,

28
professional associations, purchasers, federal agencies, and research and quality organizations
(HCAHPS on-line, 2009).
Three broad goals have shaped the HCAHPS survey. First, the survey was designed to
produce comparable data on the patient's perspective of care that allows objective and
meaningful comparisons between hospitals on seven domains (communication with doctors,
communication with nurses, responsiveness of hospital staff, cleanliness and quietness of the
hospital, pain control, communication about medicines, and discharge information) that are
important to consumers. Second, public reporting of the survey results were designed to create
incentives for hospitals to improve their quality of care. Third, public reporting will serve to
enhance public accountability in health care by increasing the transparency of the quality of
hospital care provided in return for public investment. With these goals in mind, the HCAHPS
development team took substantial steps to assure that the survey was credible, useful, and
practical (Agency for Healthcare Research and Quality [AHRQ], 2003; HCAHPS on-line, 2009).
CMS and AHRQ partnered to develop the HCAHPS survey. AHRQ carried out rigorous,
scientific processes to develop and test the HCAHPS instrument. These processes included a
public call for measures; review of existing literature; cognitive interviews; consumer focus
groups; stakeholder input; public response to several Federal Register notices; a three state pilot
study; consumer testing; and small scale field tests. With these processes, the HCAHPS team
reviewed the tool for reliability, validity, and agreement with the Institute of Medicine’s
indicators of quality health care (NAPH, 2008).
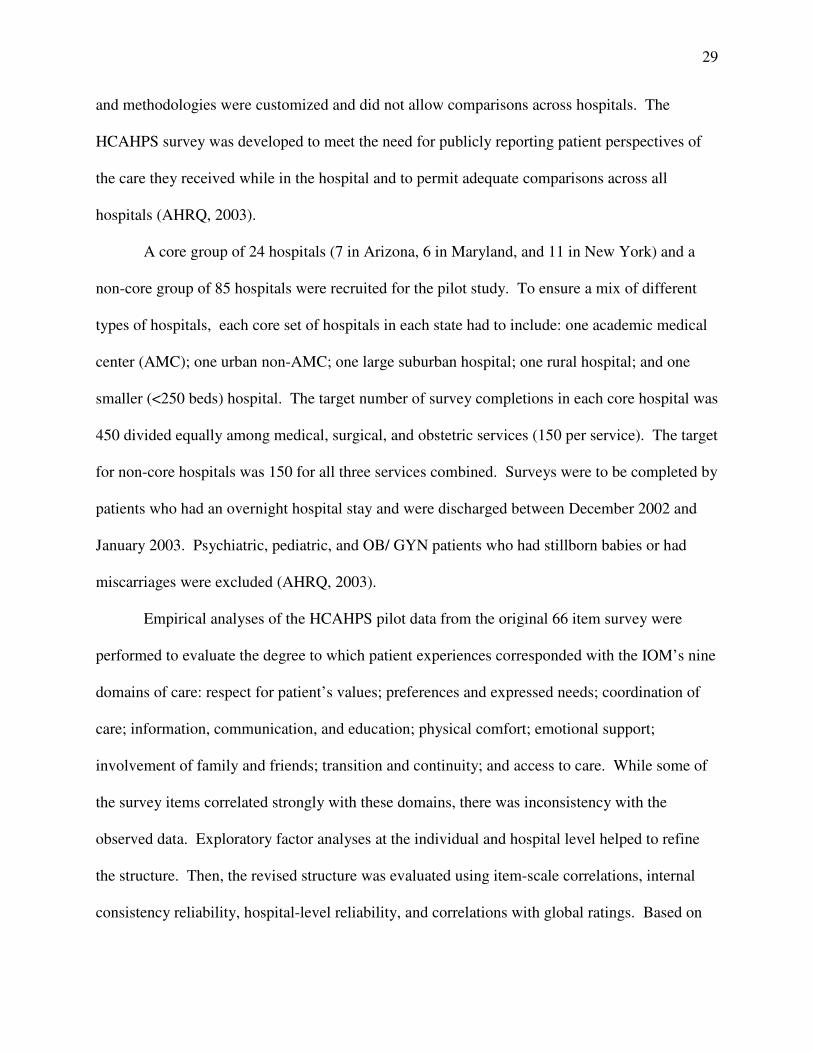
CMS and AHRQ designed a three state pilot test to draft the HCAHPS survey in 2003.
At that time many hospitals already used patient satisfaction surveys designed by and
administered by vendors as part of their quality improvement processes. However, the questions
29
and methodologies were customized and did not allow comparisons across hospitals. The
HCAHPS survey was developed to meet the need for publicly reporting patient perspectives of
the care they received while in the hospital and to permit adequate comparisons across all
hospitals (AHRQ, 2003).
A core group of 24 hospitals (7 in Arizona, 6 in Maryland, and 11 in New York) and a
non-core group of 85 hospitals were recruited for the pilot study. To ensure a mix of different
types of hospitals, each core set of hospitals in each state had to include: one academic medical
center (AMC); one urban non-AMC; one large suburban hospital; one rural hospital; and one
smaller (<250 beds) hospital. The target number of survey completions in each core hospital was
450 divided equally among medical, surgical, and obstetric services (150 per service). The target
for non-core hospitals was 150 for all three services combined. Surveys were to be completed by
patients who had an overnight hospital stay and were discharged between December 2002 and
January 2003. Psychiatric, pediatric, and OB/ GYN patients who had stillborn babies or had
miscarriages were excluded (AHRQ, 2003).
Empirical analyses of the HCAHPS pilot data from the original 66 item survey were
performed to evaluate the degree to which patient experiences corresponded with the IOM’s nine
domains of care: respect for patient’s values; preferences and expressed needs; coordination of
care; information, communication, and education; physical comfort; emotional support;
involvement of family and friends; transition and continuity; and access to care. While some of
the survey items correlated strongly with these domains, there was inconsistency with the
observed data. Exploratory factor analyses at the individual and hospital level helped to refine
the structure. Then, the revised structure was evaluated using item-scale correlations, internal
consistency reliability, hospital-level reliability, and correlations with global ratings. Based on
30
these results as well as feedback from responses to public notices in the Federal Register, the
original HCAHPS survey was revised to include only 32 questions encompassing seven
domains: nurse communication; nursing services; doctor communication; physical environment;
pain control; communication about medications; and discharge information. A single item was
also included to assess whether or not a patient would recommend the hospital to others. These
seven composites had a median internal consistency reliability of 0.69 and a median hospital
reliability of 0.74 in the pilot study. Variance components analyses were also performed to
estimate how much of the variation in reports and ratings are attributable to regions, hospitals,
service category, and patients. The results suggest that hospital service lines (medical, surgical,
obstetrics), self reported global health status, age, and education should be controlled for when
comparing hospital scores (AHRQ, 2003).
Subsequent revisions of the HCAHPS survey based on further studies and review of the
National Quality Forum (NQF), has yielded the current 27 item survey. Questions on the survey
encompass key aspects of the hospital experience (communication with doctors, communication
with nurses, responsiveness of the hospital staff, cleanliness and quietness of the hospital, pain
control, communication about medicines, and discharge information). Patient demographic
questions are also included (National Quality Forum [NQF], 2005) (see Appendix A). The
National Quality Forum endorsed the survey in 2005 with the specifications that sampling
methodology, mode of administration, scoring methods and patient mix adjustment, and methods
for reporting and analyzing data and reporting results were standardized (NQF).
Per federal government requirements, hospitals’ survey samples must: include a
minimum of 300 patients per year; be administered between 48 hours and 6 weeks after
discharge; be administered by mail, phone, mixed mode of mail and phone, or active interactive

31
voice response methods only to the patient himself; be chosen by a simple random sampling
method; be maintained as a rolling 12 month data file for the hospital; be administered as a
standalone instrument or combined with hospital specific questions; include patients 18 years or
older that spent at least one night in the hospital; and exclude prisoners, patients with a foreign
home address, patients discharged to hospice care, patients less than 18, and patients discharged
with a psychiatric diagnosis (NQF, 2005).
Summary for HCAHPS
In summary, HCAHPS is a nationally standardized tool to measure patients’ satisfaction
with their hospital care has been developed, rigorously tested, and now serves as at least one
method that hospitals must use to meet federal government requirements for meeting patient
safety and quality of care goals. The use of this relatively new tool along with other quality
improvement initiatives can assist hospitals and healthcare leaders in improving the care and
quality that patients receive during their hospital stay.

CHAPTER THREE METHODS AND DESIGN
The purpose of this study was to examine the relationships between patient satisfaction,
as measured by the Hospital Consumer Assessment of Healthcare Providers survey (HCAHPS),
and patients’ perceptions regarding the practice of key aspects of patient-and family-centered
care (PFCC) on inpatient care units at an academic medical center in the southeastern United
States.
Research Design
A descriptive cross-sectional research design was used. Relationships between patient
factors such as race, gender, age, clinical factors such as self reported health status and patient
satisfaction and perception of PFCC implementation were examined. This research design is
appropriate as the aim of this study was to describe a relationship between variables in a specific
population at a particular time (Polit & Beck, 2008).
Setting and Sample
The population for this study was adult patients discharged from inpatient units in an
academic medical center (AMC) in the southeastern United States. The medical center is an 861
bed tertiary care hospital with 8 adult general care units, 5 adult intermediate care units, and 5
adult intensive care units. Per federal guidelines, only patients 18 or older that speak English,
spent at least one night in the hospital, were not discharged as a psychiatric patient, did not have
a foreign address, were not prisoners, and were not discharged to hospice were included. The
sample included all patients who met these criteria and were discharged from an inpatient unit
from October through December 2009.

33
Instrumentation
Patient satisfaction was measured using the Hospital Consumer Assessment of Health
Providers Survey (HCAHPS). Patient-and family-centered care (PFCC) was measured by five
additional questions from Press Ganey that were added to the HCAHPS survey.
HCAHPS Survey
The HCAHPS core survey is composed of 27 questions. Questions on the survey
encompass seven key aspects of the hospital experience (communication with doctors,
communication with nurses, responsiveness of the hospital staff, cleanliness and quietness of the
hospital, pain control, communication about medicines, and discharge information). Patient
demographic questions are also included (NQF, 2005).
See Appendix A for copy of the core survey. Fourteen scaled questions are included with
always, usually, sometimes and never as choices for the responses. Six questions are yes / no
responses. One question is based on a 1-10 Likert scale. Another question addresses patient
disposition, five questions address specific patient demographics and one open ended question
that addresses the hospital experience is included by HealthStream, the vendor contracted to
administer the survey.
The current version (27 items) of the HCAHPS survey was developed in 2003 after
surveying 19,720 patients representing 132 hospitals. Using exploratory and confirmatory
factor analyses, construct validity was assessed as well as the relationship of the scale to the
overall hospital satisfaction rating (Goldstein et al., 2005; Keller et al., 2005).
Individual interviews were conducted to determine the importance of each item to overall
hospital satisfaction, a further assessment of construct validity. Items which were ranked as not
important to patients were deleted. This process yielded a 50% reduction of items in the original

34
survey representing the seven domains previously noted. These items were able to discriminate
the level of quality in different hospitals and had comparable levels of internal consistency to
other measures representing patient satisfaction (Goldstein et al., 2005; Keller et al., 2005).
The identified subscales and their internal consistencies defined by Cronbach’s
coefficient alpha are: (1) communication with doctors (.88), (2) communication with nurses
(.86), (3) responsiveness of hospital staff (.72), (4) cleanliness and quietness of the hospital (.51),
(5) pain control (.83), (6) communication about medicines (.67), and (7) discharge information
(.51). The median internal consistency reliability was (.72) (Keller et al., 2005).
Hospitals are permitted to add more questions to the core survey. The AMC where the
sample was drawn for this study added one open ended question regarding staff commendation,
one patient safety question and one open ended question that addresses what the hospital may
have done better. Since the questions are scripted, in some cases if a patient answers “no” to a
question, then the next question may be skipped as it would not be applicable
The Centers for Medicare and Medicaid Services (CMS) elects to report HCAHPS
information with “top box” scores on the hospital compare website, hospitalcompare.hhs.gov.
Specifically addressing the Likert scale (1-10) question that asks the participants to rate the
hospital overall, the “top box” scores include the percentage of valid responses that are 9 or 10.
Those questions answered with “don’t know” and those that patients refused to answer are
removed from the sample. For this study, all data was reviewed.
PFCC Press Ganey Questions
There is currently no valid and reliable tool in the literature that measures the
implementation or perception of PFCC in hospitals that provide care to adult patients. However,
in 2007, a national task force comprised of eleven hospitals and health care organizations

35
including a private research and development vendor (Press Ganey) authored five questions that
produced a reliability measure of .93 for the measurement (for the inpatient adult population) of
the key elements of PFCC and the impact on patient satisfaction (Garcia, 2007). See Appendix
B for questions. These questions were added to the HCAHPS core survey and were administered
during phone interview by HealthStream, the contracted vendor, for this study. These five
additional questions were scaled to mimic other HCAHPS questions with options for reply to
include always, usually, sometimes, and never. Therefore, patients surveyed for this study could
answer up to 35 total questions.
Procedures
After obtaining the support of senior leadership at the AMC, a proposal was submitted to
the University Medical Center Institutional Review Board (UMCIRB) that serves the associated
university and the hospital for approval. This study was deemed as exempt by the UMCIRB as it
only involved querying existing data that included no identifying information of the patient
sample to examine relationships. See Appendix C for approval letter.
Additionally, the researcher convened a meeting of key quality and operational
executives for the AMC to obtain approval to add the Press Ganey questions that measured the
patients’ perception of PFCC to the HCAHPS survey process for one quarter, October-
December 2009. The Chief Quality Officer for the health system negotiated with the vendor and
obtained an agreement to include these additional questions to the survey process for this study.
The researcher had direct email communication with the vendor to insure accuracy of wording
for these additional questions.
Patients who were eligible for the survey from the AMC were downloaded into a
database weekly via an automated process in the information systems division and sent to

36
HealthStream, the vendor that administers the satisfaction tool (HCAHPS) for the AMC. The
vendor then used a random function in the software to assign a random number to each patient in
the data file, then a sort was completed by this number and a standard sampling ratio was used to
identify potential participants for the survey. The survey was administered by phone; therefore,
if a patient refused to participate, then he or she was eliminated from the sample. The vendor
reported an 8.6% refusal rate (J. Eggers, HeatlhStream, personal communication, February 16,
2010).
If there was no answer to the initial telephone survey call, up to five attempts (once per
week for five weeks) were made to contact the patient. If the attempts failed, then that patient
was removed from the sample. The next randomly assigned patient was called. Informed
consent was implied by agreeing to participate in the survey (J. Eggers, HeatlhStream, personal
communication, February 16, 2010).
Data Analysis
Once data was obtained from the vendor, it was imported into version 16.0 SPSS and
examined for missing items and outliers. Descriptive statistics such as means and frequencies
were used to describe the sample. Several of the variables were recoded to permit appropriate
statistical analyses to be performed.
The psychometric properties of each tool (HCAHPS and PFCC measured by the Press
Ganey survey) were examined for the population studied. This was accomplished by measuring
reliability via measurement of the Cronbach’s coefficient alpha.
The primary research questions which examined the relationships between the
independent variables (age, race, gender, perceived health status, and the implementation of key
aspects of PFCC) noted in the outcomes model adapted from Kane (1997, 2006) and the

37
dependent variable (patient satisfaction as measured by HCAHPS) were measured by use of
Gamma correlation coefficient and stepwise logistic regression analyses. A statistician was
consulted to confirm the appropriate statistical methods of analysis. Statistical significance was
set at the p<.05 level.
Summary
This chapter described the setting and sample, sampling methods, and data analysis plan
used to address the research questions posited for this study. Also included is the description of
the HCAHPS instrument used to measure patient satisfaction as well as the collection procedures
to obtain the patient satisfaction data. Additionally, this chapter outlined methods to measure
patient perception of PFCC with the addition of five questions from Press Ganey to the
HCAHPS survey.

CHAPTER FOUR RESULTS
This chapter presents the results of this study. Demographic characteristics that describe
the study sample and an analysis of each of the research questions are presented.
Characteristics of the Sample
Frequencies and percentages were used to describe the categorical variables. Means,
standard deviations, and ranges were computed to further describe the continuous variables.
There were 1016 respondents included in this sample.
Demographic characteristics of the sample are displayed in Table 1. Most of the
respondents in this sample were white (57%) and female (69%) with a mean age of 52.8 years
and a range of 18-93 years. Seventy percent of the sample rated their overall health (perceived
health status) as good, very good, or excellent. The majority of respondents were black or white.
Less than five percent (5%) of the respondents represented other ethnic groups such as Hispanic,
Asian, American Indian or Alaskan Native, and Hawaiian or Pacific Islander.
Descriptive Analysis of Responses to Surveys
Frequencies and distributions of the questions answered for the HCAHPS survey are
displayed in Table 2. As previously noted, fourteen scaled questions are included on the survey
with always, usually, sometimes and never as choices for the responses. These questions
specifically addressed the patients’ responses to: care received from nurses; care received from
doctors; the physical environment (cleanliness and quietness) of the hospital; and certain hospital
experiences regarding receiving timely help with bedpan or bathroom needs, pain management,
and education regarding new medications.
When reviewing the responses of those that responded “always” on the survey, the lowest
percentage in the “care from nurses” domain was related to response of timely help after the call

39
Table 1
Demographics and Characteristics of the Study Sample (N=1016)
Demographics and Characteristics
Frequency
N (%)
Mean (SD)
Range
Age 52.8 (18.9) 18-93
18-29 165 (16.2)
30-49 239 (23.5)
50-64 288 (28.3)
65+ 324 (31.9)
Gender
Male 317 (31.2)
Female 699 (68.8)
Race
White 583 (57.4)
African American 324 (31.9)
Other 49 (4.8)
Missing 60 (5.9)
Perceived Health 2.74 (1.2) 1-5
Excellent 157 (15.5)
Very Good 262 (25.8)
Good 293 (28.8)
Fair 192 (18.9)
Poor 68 (6.7)
Missing 44 (4.3)

Table 2
Frequency and Distribution of HCAHPS Responses
M(SD)
Range
Always
N (%)
Usually
N (%)
Sometimes
N (%)
Never
N (%)
Total
CARE FROM NURSES
Nurse treats with courtesy and respect 3.87 (.44) 1-4 909 (91) 59 (5.9) 31 (3.1) 3 (.3) 1002
Nurse listens carefully to you 3.80 (.51) 1-4 851 (84) 118 (12) 38 (3.8) 4 (.4) 1011
Nurse explains so you can understand 3.75 (.59) 1-4 832 (82) 107 (11) 65 (6.4) 6 (.6) 1010
Nurse help timely after call button 3.56 (.71) 1-4 626 (68) 203 (22) 84 (9.1) 11 (1.2) 924
CARE FROM DOCTORS
Doctor treats with courtesy and respect 3.86 (.45) 1-4 908 (90) 66 (6.6) 28 (2.8) 5 (.5) 1007
Doctor listens carefully to you 3.80 (.53) 1-4 864 (86) 95 (9.4) 42 (4.2) 7 (.7) 1008
Doctor explains so you can understand 3.77 (.56) 1-4 837 (83) 114 (11) 46 (4.6) 7 (.7) 1004
HOSPITAL ENVIORNMENT
Room and bathroom kept clean 3.68 (.67) 1-4 780 (78) 136 (14) 71 (7.1) 14 (1.4) 1001
Quiet at night 3.53 (.77) 1-4 676 (67) 207 (21) 95 (9.5) 26 (2.6) 1004
EXPERIENCE IN THE HOSPITAL
Timely help with bedpan/ bathroom 3.64 (.69) 1-4 465 (75) 100 (16) 50 (8.0) 8 (1.3) 623
Pain was well controlled 3.61 (.68) 1-4 585 (71) 165 (20) 67 (8.1) 8 (1.0) 825
Staff did all they could to manage pain 3.79 (.52) 1-4 695 (84) 93 (11) 37 (4.5) 2 (.2) 827
New medicines explained 3.74 (.65) 1-4 429 (83) 52 (10) 22 (4.3) 12 (2.3) 515
New medicine side effects 3.26 (1.1) 1-4 308 (61) 75 (15) 63 (13) 56 (11) 502
40

Table 2
Frequency and Distribution of HCAHPS Responses (continued)
OVERALL RATINGS
Worst Hospital Best Hospital
M
(SD)
Range
0
N
(%)
1
N
(%)
2
N
(%)
3
N
(%)
4
N
(%)
5
N
(%)
6
N
(%)
7
N
(%)
8
N
(%)
9
N
(%)
10
N
(%)
Total
Rate
this
hospital
9.26
(1.2)
0-10 1
(.1)
0
(0)
2
(.2)
4
(.4)
1
(.1)
16
(1.6)
9
(.9)
28
(2.8)
123
(12)
230
(23)
575
(57)
989
M
(SD)
Range
Definitely Yes
N
(%)
Probably Yes
N
(%)
Probably No
N
(%)
Definitely No
N
(%)
Total
Recommend this
hospital to family or
friends
3.84
(.43)
1-4 842
(86)
119
(12)
6
(.6)
7
(.7)
974
41

42
button was pressed (68%, N=626). The lowest percentage, though still receiving a high rating,
in the “care from doctors” domain was whether the doctor explained things so they could be
understood (83%, N= 837). Ratings were generally lower for the “hospital environment” domain
regarding cleanliness (78%, N=780) and quiet at night (67%, N= 676) and “experiences in the
hospital” domain with management around new medications (83%, N= 429; 61%, N=308),
timely help with the bedpan/ bathroom needs (75%, N=465), and pain management (71%,
N=585; 84%, N=695).
Additionally, two questions that required ratings of the hospital were included. For the
overall hospital rating, respondents were asked to rate the hospital using a scale from 0 (worst
hospital possible) to 10 (best hospital possible). Of the 989 respondents that answered this
question, 805 (80%) rated the hospital a 9 or 10. Respondents were also asked if they would
recommend the hospital to family and friends and were asked to respond with definitely no (1),
probably no (2), probably yes (3), or definitely yes (4). Of the 974 respondents that answered
this question, 842 (86%) responded definitely yes. Therefore, these two questions were
negatively (highly favorable scores) skewed for the study sample. Even though respondents
gave lower scores on the “hospital environment” and “experience in the hospital” domains they
still gave high overall ratings for the hospital and likelihood to recommend questions and for the
“care from nurses” and “care from doctors” domains.
Frequencies and distribution of the questions answered for the PFCC Press Ganey survey
are displayed in Table 3. Respondents were asked five questions regarding their perceptions of
PFCC and were asked to respond with never (1), sometimes (2), usually (3), and always (4). The
highest possible score for each question was four. Possible total scores ranged from 5-20. The
two questions that were most often rated as “always” were “choices were respected to have

Table 3
Frequency and Distribution of PFCC Press Ganey Responses
M(SD)
Range
Always
N (%)
Usually
N (%)
Sometimes
N (%)
Never
N (%)
Total
You and family able to participate in care decisions 3.74 (.62) 1-4 800 (83) 100 (10) 53 (5.5) 14 (1.4) 967
Staff explained their roles in your care 3.72 (.62) 1-4 773 (80) 123 (13) 60 (6.2) 10 (1.0) 966
Staff supported your family 3.74 (.63) 1-4 779 (82) 110 (12) 46 (4.8) 16 (1.7) 951
Choices respected to have family/friends present 3.85 (.46) 1-4 848 (89) 71 (7.5) 28 (2.9) 4 (.4) 951
Respect for cultural/spiritual needs 3.87 (.48) 1-4 808 (91) 52 (5.8) 19 (2.1) 10 (1.1) 889
43

44
family and friends present during care” (89%, N = 848) and “respect for cultural and spiritual
needs” (91%, N= 808). The lowest rating was for “staff explaining their roles in care” (80%,
N=773).
Psychometric Research Questions
Question 1: What is the internal reliability of the HCAHPS survey items? The internal
reliability of the HCAHPS survey items for the study sample was .81 as measured by Cronbach’s
coefficient alpha.
Question 2: What is the internal reliability and dimensionality of the five-item Press
Ganey survey? The internal reliability for the Press Ganey survey items for the study sample
was .77 as measured by Crohnbach’s coefficient alpha. A principal component factor analysis
was computed for these five questions as confirmation that the five items constitute a single
dimension. Component (factor) loading values ranged from .67-.82.
Primary Research Questions
Question 1: Is there a relationship between the perception of PFCC (total score on Press
Ganey survey items) and the overall hospital rating and the likelihood to recommend rating
(HCAHPS survey)? Due to the highly favorable scores (negative skewness) on the overall
hospital rating (81% of the respondents chose 9 or 10) and the likelihood to recommend rating
(86% of the respondents chose definitely yes); it was necessary to use a non-parametric
correlation statistic (coefficient) to examine relationships between these two ratings and the
perception of PFCC in this study.
Generally, Spearman’s Rho is recommended when computing correlations between
ordinal variables. However, the Gamma correlation coefficient is preferred when there is an
extreme skewness in the data and when many “tied” observations or rankings in the responses

45
are noted (Hill & Lewicki, 2006). The Gamma coefficient computes the level of association
between two variables based on the number of agreements (Na) and the number of inversions or
differences (Ni) ; G = (Na- Ni)/ (Na- Ni). A positive Gamma indicates that there are more
agreements than inversions and that there is a positive relationship between two sets of ratings
(Hill & Lewicki, 2006). Table 4 displays the Gamma correlations with PFCC total score and the
overall rating of the hospital and the likelihood to recommend the hospital. A strong positive
correlation (r = .62 and r = .69) was noted between these variables. Each correlation was
significant at the p<.01 level.
Due to the skewness of the data, the PFCC total score was dichotomized (18-20 and <18)
to assist in equalizing the percentage of respondents at the top of the PFCC total score and those
who scored at the top totals for overall rating of the hospital and likelihood to recommend.
Table 5 displays frequencies and distributions for PFCC total scores and the overall hospital
rating and likelihood to recommend questions from the HCAHPS survey. It is noted of those
who scored between 18-20 on the PFCC total score, 88% reported scores of 9 or 10 on the
overall hospital rating, while only 47% of those who scored <18 on the PFCC total score
reported scores of 9 or 10. For those with total PFCC scores of 18-20, 92% said “definitely yes”
that they would recommend the hospital to family and friends compared to 58% of those who
scored < 18 on the total PFCC score. Therefore, this data suggests a strong relationship between
the respondents’ perception of PFCC and their tendency to give high scores for the overall rating
of the hospital and the likelihood to recommend the hospital.
Question 2: Is there a relationship between the individual components of PFCC
(individual item scores) and the overall hospital rating and the likelihood to recommend rating
(HCAHPS survey)? Gamma correlation coefficient was also used to address this question.
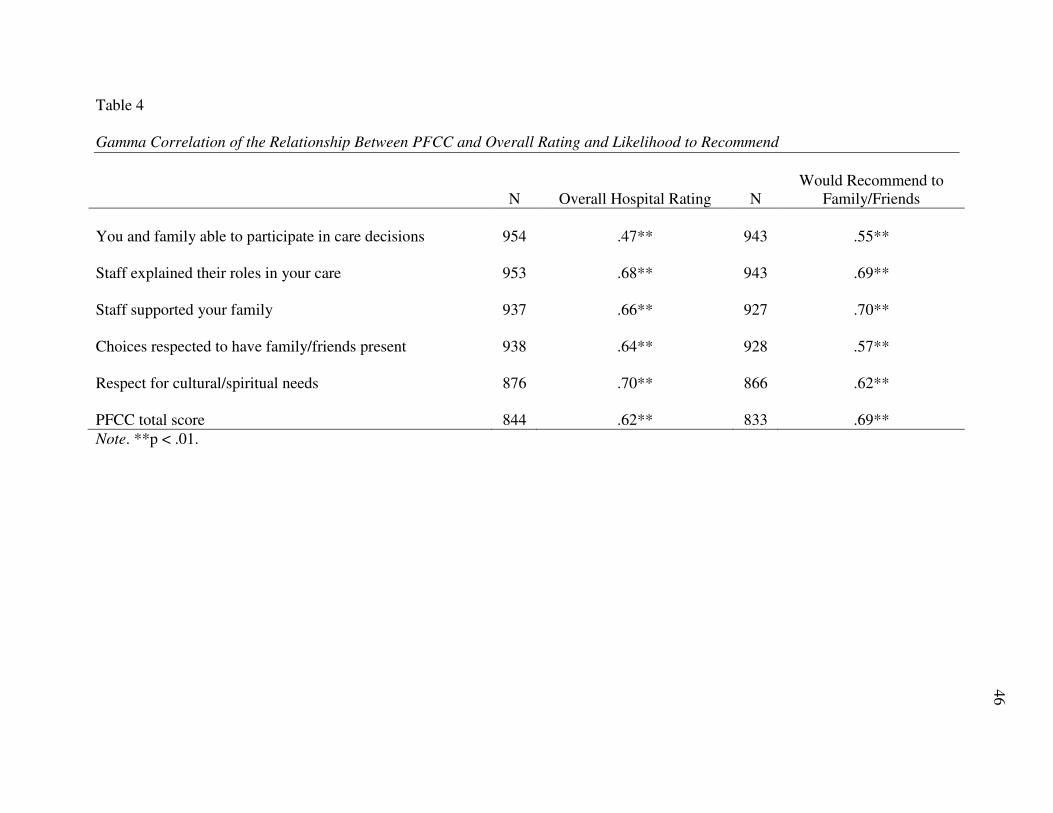
Table 4
Gamma Correlation of the Relationship Between PFCC and Overall Rating and Likelihood to Recommend
N
Overall Hospital Rating
N
Would Recommend to
Family/Friends
You and family able to participate in care decisions 954 .47** 943 .55**
Staff explained their roles in your care 953 .68** 943 .69**
Staff supported your family 937 .66** 927 .70**
Choices respected to have family/friends present 938 .64** 928 .57**
Respect for cultural/spiritual needs 876 .70** 866 .62**
PFCC total score 844 .62** 833 .69**
Note. **p < .01.
46

47
Table 5
Frequency and Distribution of PFCC (total score) and Overall Rating and Likelihood to
Recommend
PFCC total
<18
N (%)
18-20
N (%)
Total
N (%)
Overall Rating
0-8 71 (53) 86 (12) 157 (19)
9-10 62 (47) 625 (88) 687 (81)
Total 133 (100) 711 (100) 844 (100)
Likelihood to Recommend
1-3 56 (42) 53 (8) 109 (13)
4 78 (58) 646 (92) 724 (87)
Total 134 (100) 699 (100) 833 (100)

48
Table 4 displays the data for each of the five questions asked regarding patient perceptions of
PFCC and their relationship to the overall rating for the hospital as well as the likelihood to
recommend the hospital to family and friends. Each correlation was significant at the p<.01
level.
Strong positive correlations were noted for questions addressing how often respect was
shown for cultural and spiritual needs (r = .70); how often staff explained their roles in care (r =
.68); how often staffed supported family during their healthcare experience (r = .66); and how
often staff respected the patients’ choice to have family/ friends present (r = .64) with the overall
hospital rating. A moderate correlation was noted for the question addressing how often the
patient and family were able to participate in decisions about their care (r = .47) with the overall
rating of the hospital.
Strong positive correlations were noted with each PFCC component question and
whether or not the patient would recommend the hospital to family and friends. These
correlations were as follows: how often staff supported family during this healthcare experience
(r = .70); how often staff explained their roles in care (r = .69); how often the patients’ family
spiritual and cultural needs were respected (r = .62); how often the staff respected the patients’
choice to have family present (r = .57); and how often the patient and their family were able to
participate in decisions about their care (r =.55). Support of the family and explanation of the
role one plays in patient care were the strongest correlations noted. Therefore, this data also
suggests a strong relationship between the respondents’ perception of PFCC and their tendency
to give high scores for the overall rating of the hospital and the likelihood to recommend the
hospital.

49
Question 3: Is there a relationship between the perception of PFCC (total score on Press
Ganey survey items) and the perception of care from nurses, care from doctors, hospital
environment, and experiences in the hospital (HCAHPS component scores)? Gamma correlation
coefficient was used to examine these relationships. Table 6 displays the data for each of the
fourteen questions on the HCAHPS survey that asked patients about the care received and their
experiences in the hospital and the relationship with the PFCC total score. Each correlation was
significant at the p <.01 level.
Strong positive correlations were noted with each question examined in the HCAHPS
survey and the PFCC total score. Overall, the strongest correlations were noted with the care
from nurses (r = .74; r =.67; r = .71) versus the care from doctors (r = .69; r =.64; r = .66) and
the hospital environment (r = .50; r = .54) with only one exception, timely help after the call
button was pressed (r =.56). Also noted were the strong correlations with the PFCC total score
and experiences in the hospital: timely help with bedpan/ bathroom needs (r =.65), pain
management (r = .65; r = .76), and new medication management (r = .70; r = .61). The (N) was
lower for these domains of the HCAHPS survey as not all respondents in the sample had these
experiences.
Hence, in general, there were strong positive correlations with the respondents’ overall
perception of the presence of patient- and family- centered care and care received during their
hospitalization.
Question 4: Does perception of PFCC (total score on Press Ganey survey items), the
overall rating of the hospital experience, and the likelihood to recommend the hospital

50
Table 6
Gamma Correlation of Relationship Between PFCC (total score) and Care from Nurses, Care
from Doctors, Hospital Environment and Hospital Experiences
PFCC total N
CARE FROM NURSES
Nurse treats with courtesy and respect .74** 843
Nurse listens carefully to you .67** 852
Nurse explains so you can understand .71** 850
Nurse help timely after call button .56** 854
Total NURSE .55** 854
CARE FROM DOCTORS
Doctor treats with courtesy and respect .69** 848
Doctor listens carefully to you .64** 850
Doctor explains so you can understand .66** 849
Total DOCTOR .62** 851
HOSPITAL ENVIORNMENT
Room and bathroom kept clean .50** 844
Quiet at night .54** 847
Total HOSPITAL ENVIORNMENT .53** 852
EXPERIENCE IN THE HOSPITAL
Timely help .65** 534
Pain was well controlled .65** 702
Staff did all they could to manage pain .76** 704
Total PAIN .67** 706
New medicines explained .70** 439
New medicine side effects .61** 431
Total MED .58** 442
Note. ** p < .01.
51
(HCAHPS) vary based on respondent characteristics? The purpose of this question was to
examine whether patient characteristics (age, gender, and race) or clinical characteristics
(perceived health status) were related to high PFCC total scores (18-20), high the overall rating
of the hospital (9 or 10) and the greatest likelihood to recommend the hospital (4) questions.
Table 7 displays the frequency and percentage of respondents in the various subgroups (age,
gender, race, perceived health status) that provided the highest ratings on these questions.
Age, in years, was categorized as 18-35 (the lower quartile), 68+ (the upper quartile) and
36-67 (the remaining age groups). Race was categorized as black or white as less than 5% of the
study population were in other categories. Perceived health status was defined as “good health”
for those who rated their health as good, very good, or excellent. Perceived health status was
defined as “poor health” for those that ranked their health status as fair or poor.
Some differences were noted among the subgroups and their responses. Males gave the
highest ratings for overall rating (82%) and likelihood to recommend (87%), while females (only
slightly higher) rated highest on the PFCC total score (74%). Blacks gave slightly higher ratings
on overall hospital rating (84%) and PFCC total score (75%), while blacks and whites gave the
same rating for likelihood to recommend (87%). Those that were in the 68+ age group gave
higher scores on overall hospital rating (83%) and likelihood to recommend (88%) while those
18-35 gave higher scores on PFCC total score (82%) and those 36-67 gave the lowest for the
PFCC total score (69%). The likelihood to recommend category remained high across all age
categories. Both males and females gave lower scores on the PFCC total score than the other top
ratings. Blacks and whites also rated the PFCC total score lower than the other top ratings.

52
Table 7
Percentage of Respondent Subgroups Reporting Highest Ratings for Overall Hospital Rating,
Likelihood to Recommend and PFCC Total Score
Overall Rating
(9-10)
N (%)
Definitely
Recommend
N (%)
PFCC
(total score 18-20)
N (%)
Gender
Male 314 (82) 304 (87) 310 (72)
Female 687 (80) 670 (86) 676 (74)
Total 1001 (80) 974 (86) 986 (73)
Race
White 578 (81) 574 (87) 575 (73)
Black 317 (84) 313 (87) 322 (75)
Total 895 (82) 887 (87) 897 (74)
Age
18-35 255 (76) 251 (87) 248 (82)
36-67 491 (81) 478 (86) 480 (69)
68+ 255 (83) 245 (88) 258 (72)
Total 1001 (80) 974 (86) 986 (73)
Perceived Health Status
Good 700 (84) 693 (89) 704 (75)
Poor 259 (77) 255 (82) 258 (69)
Total 959 (82) 948 (87) 962 (73)

53
Overall, those who perceive their health as poor gave the lowest scores on all of the
categories: PFCC total score (69%), overall hospital rating (77%), and likelihood to recommend
rating (82%). Since overall satisfaction was lower for those with perceived poor health, further
investigation to assess whether perceived health status affected the other demographic variables
was completed. Table 8 displays this data.
The most noteworthy findings displayed in the Table 8 are as follows: (1) the highest
overall satisfaction among the three top ratings is observed in the 68+ age group with good
health (90%); males in good health (88%); and blacks in good health (86%), (2) the highest
proportion definitely recommending the hospital is noted in males with good health (92%), those
in the 68+ age group with good health (92%), and blacks with good health, (3) the highest
perception of PFCC was noted in the 18-35 age group with good health (82%) and the 18-35 age
group with poor health (80%), (4) the lowest overall satisfaction was noted in males with poor
health (71%) and those in the 68+ age group with poor health (74%), (5) the lowest proportion
definitely recommending the hospital was noted in males with poor health (75%), blacks with
poor health (79%), and those in the 35-67 age group with poor health (79%), and (6) the lowest
perception of PFCC was observed in whites with poor health (66%), males with poor health
(67%) and those in the 35-67 age group with poor health (67%). Therefore, this data suggests
that respondent characteristics do have some impact on the likelihood that they will provide the
highest rating for overall hospital rating, likelihood to recommend the hospital, and the PFCC
total score.
Question 5: What variables are the best predictors that a patient is likely to give a high
overall rating for their hospital experience? A forward stepwise logistic regression was
performed to assess which of the possible 18 predictor variables provide a model for

54
Table 8
Percentage of Respondent Subgroups Reporting Highest Ratings for Overall Hospital Rating,
Likelihood to Recommend and PFCC Total Score by Health Status
Overall Rating
(9-10)
N (%)
Definitely
Recommend
N (%)
PFCC
(total score 18-20)
N (%)
GOOD HEALTH
Gender
Male 216 (88) 211 (92) 217 (74)
Female 484 (82) 482 (87) 487 (75)
Total 700 (84) 693 (89) 704 (75)
Race
White 418 (83) 415 (89) 415 (76)
Black 228 (86) 225 (90) 233 (77)
Total 646 (84) 640 (89) 648 (76)
Age
18-35 223 (77) 222 (86) 220 (82)
36-67 319 (85) 316 (89) 317 (70)
68+ 158 (90) 155 (92) 167 (74)
Total 700 (84) 693 (89) 704 (75)
POOR HEALTH
Gender
Male 91 (71) 89 (75) 90 (67)
Female 168 (80) 166 (85) 168 (70)
Total 259 (77) 255 (82) 258 (69)
Race
White 155 (76) 153 (83) 154 (66)
Black 86 (79) 85 (79) 86 (71)
Total 241 (77) 238 (82) 240 (67)

55
Table 8
Percentage of Respondent Subgroups Reporting Highest Ratings for Overall Hospital Rating,
Likelihood to Recommend and PFCC Total Score by Health Status (continued)
Overall Rating
(9-10)
N (%)
Definitely
Recommend
N (%)
PFCC
(total score 18-20)
N (%)
Age
18-35 25 (76) 25 (88) 25 (80)
36-67 153 (79) 151 (79) 152 (67)
68+ 81 (74) 79 (84) 81 (68)
Total 259 (77) 255 (82) 258 (69)

56
predicting the likelihood that patients would provide a high overall hospital rating (9 or 10).
Stepwise logistic regression was chosen for the model building process because there was no
prior theoretical basis for determining which subset of the 18 variables to select first in the model
building process. Hosmer and Lemeshow (2000) report that there has been a shift away from
models such as stepwise procedures in which a preset computer package determines the order
and number of variables for purposeful selection. However, this procedure was considered as a
useful and effective data analysis tool as the outcome being studied is relatively new and the
predictor variables and the association with the outcome is not well understood or documented in
the literature. In such cases, most studies collect many possible variables and screen them for
significant associations as an effective means to identify predictor variables.
For this analysis, following the advice of Hosmer and Lemeshow (2000), a probability to
enter (Pe) value of 0.15 was used. These 18 variables were selected because all of the HCAHPS
variables (9), PFCC variables (5), age, and health were strongly related (p<.05) to the outcome of
a high overall hospital rating. Race and gender, although not strongly related to the outcome
(p>.05), were selected because of their potential relevance to the outcome in the multivariate
model.
The model produced in this analysis consisted of 8 variables which resulted in a
Nagelkerke R squared of .384. Thus, this model explained 38% of the variance in the overall
hospital rating and correctly classified or predicted 87% of the cases. Odds ratios (OR) and the
lower and upper limits of the 95% confidence interval (CI) are displayed for each variable in
Table 9. Each variable in the model was significant at the p< .05 level.
For those respondents that gave the highest overall rating for the hospital (versus those
who gave lower overall ratings), they were: (1) three times more likely to have reported that the

57
Table 9
Stepwise Logistic Regression for Predictors for Overall Hospital Rating
Variable
Unadjusted OR
95% CI
Adjusted OR
95% CI
Nurse listens carefully to you 9.67 [6.04, 15.47] 3.09 [1.71, 5.57]
Staff explained roles 6.78 [4.40, 10.43] 2.19 [1.19, 4.02]
Choices respected to have
family/friends present
8.06 [4.84, 13.44] 2.07 [1.04, 4.13]
Doctor listens carefully to you 6.26 [3.88, 10.10] 1.98 [1.08, 3.64]
Staff supported your family 8.87 [5.68, 13.86] 1.93 [1.02, 3.65]
Quiet at night 4.02 [2.67, 6.05] 1.81 [1.10, 3.00]
Perceived Health Status 1.55 [1.01, 2.37] 1.73 [1.01, 2.96]
Age 1.02 [1.00, 1.03] 1.03 [1.02, 1.04]

58
nurse always listened carefully to them (OR = 3.09), (2) two times more likely to have reported
that the staff always explained their roles in care (OR =2.19) and that their choices were
respected to have family and friends present during care (OR = 2.07), (3) nearly 2 times more
likely to have reported that the doctor always listened carefully to them (OR =1.98); that staff
supported their family (OR=1.93); that it was quiet at night (OR=1.81); that their perceived their
health status was good (OR=1.73), and (4) more likely to be older (OR=1.03).
Question 6: What variables are the best predictors that a patient is likely to recommend
the hospital to family and friends? The same forward stepwise logistic regression analysis was
performed to predict which variables provide a model for predicting the likelihood of the
respondents definitely recommending the hospital to family and friends. The model produced in
this analysis consisted of 6 variables which resulted in a Nagelkerke R squared of .383. This
model explained 38% of the variance in the likelihood to recommend rating and correctly
classified or predicted 91% of the cases. Odds ratios (OR) and the lower and upper limits of the
95% confidence interval (CI) are displayed for each variable in Table 10. Each variable was
significant at the p<.05 level.
For those respondents that would definitely recommend the hospital to family and friends
(versus those that probably would or would not), they were: (1) nearly 4 times more likely to
have reported that the nurse treated them with dignity and respect (OR=3.77), (2) three times
more likely to report that the doctor listened carefully to them (OR=3.26), (3) nearly 2.5 times
more likely to have reported that their room was quiet at night (OR=2.48) and that staff
supported their family (OR=2.43), and (4) nearly two times more likely to have reported that the
nurse explained things so that they could understand (OR=2.11) and that their perceived health
status was good (OR=1.89).
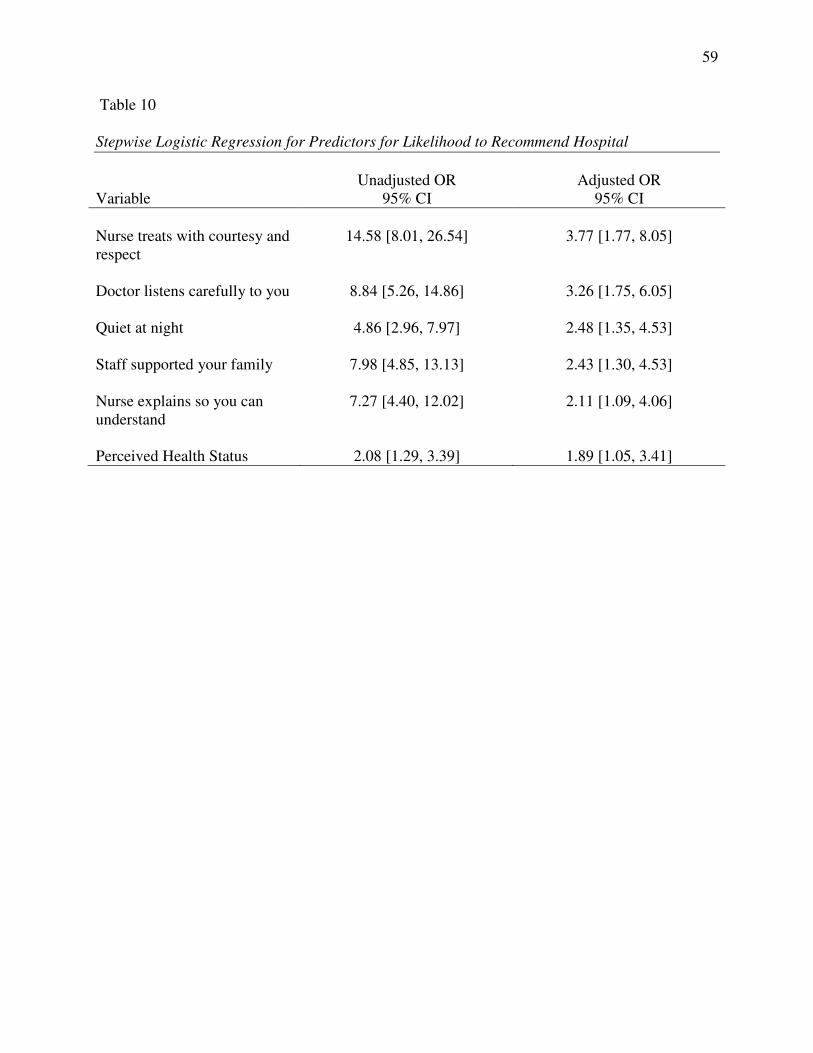
59
Table 10
Stepwise Logistic Regression for Predictors for Likelihood to Recommend Hospital
Variable
Unadjusted OR
95% CI
Adjusted OR
95% CI
Nurse treats with courtesy and
respect
14.58 [8.01, 26.54] 3.77 [1.77, 8.05]
Doctor listens carefully to you 8.84 [5.26, 14.86] 3.26 [1.75, 6.05]
Quiet at night 4.86 [2.96, 7.97] 2.48 [1.35, 4.53]
Staff supported your family 7.98 [4.85, 13.13] 2.43 [1.30, 4.53]
Nurse explains so you can
understand
7.27 [4.40, 12.02] 2.11 [1.09, 4.06]
Perceived Health Status 2.08 [1.29, 3.39] 1.89 [1.05, 3.41]

60
Summary
This chapter presented the findings of the study. Characteristics of the population studied
and the instruments used were presented. An analysis of each of the research questions posited
concluded the chapter.

CHAPTER FIVE DISCUSSION
Evidence of quality is an important outcome in healthcare. Patient satisfaction, an
outcome of care, is an important component of quality (Cleary et al., 1991; Jha et al., 2008; Kane
et al., 1997; Yellen et al., 2002).
Patient- and family-centered care (PFCC) is a health care delivery model that aims to
enhance partnerships with health care providers and patients and their families. These
partnerships are believed to play a significant role in improving patient satisfaction, quality and
safety, and retention rates of staff (ANCC, 2008; Klein, 2007; McCarthy, 2007; Meyers, 2008).
The purpose of this study was to examine relationships between patient satisfaction, as
measured by HCAHPS, and the perception of patient- and family-centered care (PFCC), as
measured by the Press Ganey tool. The implementation of both HCAHPS, to measure patient
satisfaction, and PFCC are being recommended and/or required by major stakeholders such as
the federal government, IHI, ANCC, IOM, and JCAHO (ANCC, 2008; Kirchheimer, 2007;
McCarthy, 2007; NAPH, 2008; National Quality Forum, 2005). However, to date, no studies
have been published that examine relationships between patient satisfaction, as measured by
HCAHPS, and PFCC.
This chapter provides a summary of the significant findings of the study, a discussion of
those findings, and a review of the study limitations. This chapter concludes with implications
of the findings for practice, education, and future research.
Significant Findings and Discussion
In this study, 81% of the respondents rated the hospital highly (9 or 10). Eighty-six
percent (86%) said that they would definitely recommend the hospital to family and friends.
This finding corresponds with Jenkinson et al.’s (2002) findings which suggest that historically

62
patient satisfaction scores tend to be very high which often makes it difficult to distinguish what
variables actually have the most impact on overall satisfaction.
In this study, 88% of respondents that perceived that PFCC elements were present (gave
the highest score on the PFCC total score [18-20]) also gave an overall rating of 9 or 10 for the
hospital. Ninety-two percent (92%) of respondents that perceived that PFCC elements were
present (gave the highest score on the PFCC total score) said that they would definitely
recommend the hospital to family and friends. However, only 47% of those respondents whose
perception indicated a lesser presence of PFCC elements (scored <18 on the PFCC total score)
gave an overall rating of 9 or 10, while 58% of those respondents scoring less than 18 on the
PFCC total score said that they would definitely recommend the hospital to family and friends.
Gamma correlation of the perception of PFCC and the overall rating and the likelihood
to recommend rating revealed strong correlations with four questions and a moderate correlation
with the question addressing the respondents’ and their families abilities to participate in care
decisions. These findings may lend support to the case studies by Klein (2007), McCarthy
(2007), and Meyers (2008) which noted improved patient satisfaction scores on units in their
hospitals that had implemented elements of PFCC.
Strong positive correlations between PFCC total score as well as individual components
of PFCC on the Press Ganey survey were noted with the HCAHPS survey questions regarding
overall rating of the hospital and likelihood to recommend as well as with the HCAHPS
component scores regarding care from nurses, care from doctors, the hospital environment and
experiences during hospitalization (timely help with bedpan/ bathroom needs, pain management,
and new medication management). The Gamma correlation coefficient ( r ) was .50 or greater
on all correlations with the perception of PFCC and patient satisfaction with only one exception.

63
The correlation between the overall hospital rating (HCAHPS) and the ability of the respondent
and their family to participate in care decisions (PFCC component) was r = .47, indicating only a
moderate correlation. The strongest correlations were noted in domains in which nurses had the
most influence: “care from nurses” and “experiences in the hospital”.
These findings support the work of Wagner and Bear (2008) who noted a clear link with
nursing care and overall patient satisfaction. It also lends support to earlier foundational studies
on patient satisfaction that confirmed relationships between patient satisfaction and nursing care
(Abdellah & Levine, 1957; Donabedian, 1966; Risser, 1975).
Some variation to responses in the highest ratings were noted for: (1) the overall hospital
rating, (2) the likelihood to recommend the hospital rating, and (3) the PFCC total score based on
respondent characteristics (age, race, gender, and perceived health status). Males had the highest
scores for overall rating (82%) and likelihood to recommend (87%), while females rated (only
slightly higher than males) the highest PFCC total score (74%). Blacks gave slightly higher
ratings on the overall hospital rating (84%) and PFCC total score (75%), while blacks and whites
gave the same rating for likelihood to recommend (87%). Respondents in the 68+ and the 18-35
age groups had high levels of satisfaction with their hospitalization. Those 68+ gave higher
scores for overall hospital rating (83%) and likelihood to recommend (88%) while those 18-35
(82%) gave higher scores for perceived patient- and family-centered care (PFCC total score).
Those respondents 36-67 (69%) scored lowest for the PFCC total score. The likelihood to
recommend category remained high across all age categories. Both males and females gave
lower ratings for PFCC total score than for overall hospital rating and likelihood to recommend.
Blacks and whites also gave lower ratings on the PFCC total score than the other top ratings.
Overall, those who perceived their health as poor rated the hospital lower (only 77% scored a 9

64
or 10) and they were less likely to recommend the hospital when compared to respondents who
rated their health as good. They also had a lower perception of the presence of PFCC during
their hospitalization. Only 69% had high perceptions of PFCC compared to 75% of those
respondents who rated their health as good.
In this study, age, gender, and perceived health status had an impact on respondents’
ratings of the overall hospital rating, likelihood to recommend rating, and the PFCC total score.
Older respondents and males seemed more likely to be satisfied overall. This finding is
supported in previous studies (Cohen, 1996; Jenkinson et al., 2002; Quintana et al., 2006;
Rahmqvist, 2001; Sitzia & Wood, 1997). However, perceived health status was the
characteristic that seemed most important in this study. Greater differences in the percentage in
ratings were noted for those who perceived their health as poor when compared to those who
perceived their health as good. This finding was in contrast to the work of Jenkinson et al.
(2002) but was supported by other research (Rahmqvist; Thi et al., 2002; Xiao & Barber, 2008).
Forward stepwise logistic regression assisted with providing models that predicted the
likelihood that respondents would provide a high overall rating for the hospital and would
definitely recommend the hospital to family and friends. The model for predicting a high
hospital overall rating included the following eight variables that were drawn from the HCAHPS
survey, the PFCC Press Ganey survey, and respondent (patient) characteristics: (1) nurse
listened carefully, (2) staff explained their roles in care, (3) choices respected to have family/
friends present, (4) doctor listened carefully, (5) staff supported family, (6) quiet at night, (7)
good perceived health status, (8) age (older). The model for predicting that respondents would
definitely recommend the hospital to family and friends included six variables: (1) nurse treats
with dignity and respect, (2) doctor listened carefully, (3) quiet at night, (4) staff supported

65
family, (5) nurse explained things so could understand, and (6) good perceived health status.
There were some similarities noted in the variables that predicted the scores on overall hospital
rating and the likelihood to recommend rating. Both models included perceived health status, the
doctor listening carefully, quiet at night, and staff support of family. Both models also included
variables related to nursing care, although the specific variables were different. See Table 11 for
comparisons in the two models.
These findings are supported by other researchers who state that when examining
determinants of patient satisfaction that it is important to look not only at nursing care and
patient demographics but to include the overall patient experience with their hospitalization;
including respect, communication, physical environment, feelings about respect for culture,
family support, and decision making abilities (Conway et al., 2006; Gerteis et al., 1993;
Jenkinson et al., 2002; Wagner & Bear, 2008).
Kane’s Outcomes Model that was adapted for this study provided structural support for
designing the study and interpreting the study findings. Patient factors (age, race, gender) and
clinical factors (perceived health status) interacted with the treatment factor (perception of PFCC
implementation) to impact the outcome of overall patient satisfaction. The HCAHPS survey
included four domains and two overall ratings that encompassed the factors noted above when
examining overall patient satisfaction. In summary, this model served this study well in defining
factors that impact overall satisfaction in the population studied.
Study Limitations
A limitation of this study was the measure of perception of PFCC implementation, the
Press Ganey tool. There was limited data to support validity and reliability for this tool and it
has not been widely used or reported in the literature. This inhibits the ability to state that the

66
Table 11
Comparison of Stepwise Logistic Regression for Overall Hospital Rating and Likelihood to
Recommend
Overall Hospital Rating
Adjusted
OR
Likelihood to Recommend
Adjusted
OR
Nurse listened carefully 3.09 Nurse treated with dignity and
respect 3.77
Staff always explained their roles in
care 2.19 Doctor listened carefully 3.26
Choices respected to have family/
friends present 2.07 Quiet at night 2.48
Doctor listened carefully 1.98 Staff supported family 2.43
Staff supported family 1.93 Nurse explained things so they
were understood 2.11
Quiet at night 1.81 Perceived good health status 1.89
Perceived good health status 1.73
Older age 1.03

67
results of this study were typical or generalizable. This tool also did not address the specific
areas in the collaboration or information sharing components of PFCC. For example, no
questions were asked of the respondents regarding facility design, the receipt of information in a
timely fashion, their thoughts about policy and procedure, and the education of professionals.
Therefore, a comprehensive review reflective of all key components of PFCC could not be
obtained.
The study may have revealed more specifics if the survey responses were tied back to
specific units in the hospital. Unfortunately, the respondents’ answers are linked to the unit from
which the patient was discharged. This may not be truly reflective of the patients’ hospital stay
if they encountered more than one unit while in the hospital.
Another limitation of this study was the time frame from which the sample was drawn.
Due to constraints of time and finances, only one quarter of data was used, October-December,
2009. This quarter may not have been reflective of the general hospital population over time and
overall satisfaction ratings. Including more quarters of data would have provided a much larger
sample size and may have affected the findings.
For this study, data were examined for only one academic medical center in the
southeastern United States. A multi-center study would have strengthened the ability to
generalize results to other hospitals. Including other hospitals would have also increased the
sample size and may have revealed additional or different relationships among the variables
examined in this study.

68
Implications for Practice, Education, and Research
Practice
The findings from this study validated that hospital personnel including nurse, doctors,
and staff have a significant impact on patient satisfaction. Respondents noted that the way staff
treated them, communicated with them, and responded to them (and their families) and their
needs affected the overall rating of the hospital and the likelihood to recommend the hospital
rating. Nurses spend more time with patients than any other care giver in the hospital.
Therefore, it is important for nurses to be mindful of their approach to patients and families as
well as to the care they provide.
This study also revealed that overall scores on the domain of “experiences in the
hospital” were lower than other scores on the patient satisfaction survey (HCAHPS). Included in
this domain are items related to timely help with bedpan/ bathroom needs, managing pain, and
education on new medications and side effects. While these items did not seem to affect the
scores on the overall hospital rating or likelihood to recommend rating (they remained high),
they remain important for a good outcome for the patient. Nurses need to explore opportunities
to improve upon these specific items. Examples of this may include: (1) consulting with other
disciplines (pharmacists, physicians, physical or occupational therapists) to design strategies
focused on assessing, managing, and reassessing pain, (2) working with nursing assistants to
strategize on ways to remove barriers related to assisting patients with elimination needs, and (3)
working with discharge nurses or case managers to strategize about opportunities to educate
patients on new medicines and their side effects prior to discharge.
Nurse leaders should also utilize strategies to educate nurses about the components of
patient satisfaction scores for their units. Regular roundtables, huddles or rounding techniques

69
should be implemented to discuss patient satisfaction as it is a measure of quality. Quality
experts note that what is measured and discussed is generally improved (IOM, 2001).
In this study, it was noted in general that males, those that are older (68+), and those that
perceive their health status as good were more satisfied. Perhaps strategies that focus on
populations such as women, those 18-67 years, and those who perceive their health status as poor
may assist in improving satisfaction and quality. For example, those with poorer health may have
a unique set of characteristics that are not captured by the surveys used in this study.
Additionally, those with poorer health may have longer lengths of stay, require more pain
management, or be more dependent on nurses and staff compared to those in good health. More
research specific to those in poorer health may reveal different relationships or highlight
different practice strategies that could assist nurses in enhancing the satisfaction and quality of
care specific to this group.
Finally, nurses need to incorporate strategies related to the key components of PFCC into
the daily management of their patients. Nurse leaders should encourage staff to engage in
bedside shift report which includes the patient and family. Hourly rounding to assess and
address patient and family needs may address and enhance both PFCC and patient satisfaction.
Education
Nurse educators should be aware of initiatives to improve quality of patient care. Many
times gaps exist between what is taught in the classroom and what is opertationalized at the
patient care unit level. Assuring that new graduates are educated about quality and its
measurement is important to facilitate improvement.
Educators should be informed about the Quality and Safety Education for Nurses (QSEN)
national initiative funded by Robert Wood Johnson. This project aims to meet the challenges of

70
educating future nurses to insure that they have the knowledge, skills and attitudes to improve
the quality and safety of health systems. Other aims of this initiative are to incorporate faculty
development and to insure that quality and safety is integrated into curricula for schools of
nursing (Quality and Safety Education for Nurses, 2010). As previously noted, patient
satisfaction is an outcome of care and a measure of quality. Educating nurses about quality may
assist in improving satisfaction which is an indicator of quality care.
Education regarding HCAHPS and PFCC are also important in addressing patient
satisfaction and quality in schools of nursing curricula. Now that HCAHPS is a standardized
tool that hospitals are required to use by the federal government, and PFCC is a health care
delivery model that is recommended and/ or required, student nurses and faculty alike should be
knowledgeable about these two concepts. Nurse educators need to focus not only on the didactic
and clinical content related to physiological nursing care but also on techniques that will assist
nurses in meeting psychosocial, cultural, and communication needs of patients and families.
Research
Future studies examining the relationship of patient satisfaction using HCAHPS and
PFCC should be designed to include other hospitals and at least six months of data. More data is
likely to give a better representation of patient satisfaction as a measure of quality. A research
design that allows for data to be linked back to the specific unit(s) where the patient received
care rather than just the unit of discharge would permit the development and implementation of
specific and focused strategies for improvement.
The nurse is the care provider who spends the most time with the patient and their family.
If the nurse is not engaged in quality improvement strategies such as patient satisfaction or
PFCC, improvement is not likely to happen or be sustainable. A qualitative study designed to

71
capture nurses’ thoughts and perceptions about the elements of PFCC and patient satisfaction
could educate nurse and hospital leaders regarding risk, benefits, and barriers perceived by
nurses. What is learned from the stories of the nurses could assist leadership in developing plans
to educate nurses, remove barriers, and to implement policies to attain the goal of successful
implementation of PFCC and improvement of patient satisfaction.
This study found that there is a strong relationship between patient satisfaction and the
perception of PFCC. Future research needs to focus on exploring this relationship further.
Specifically, a study that includes not only perceptions but objective measures of PFCC is
needed. Including variables such as the number of medical errors or staffing patterns, as
measures of quality, as well as process measures such as interdisciplinary rounds that include
family and contribute to the PFCC model of healthcare delivery are essential. Findings from this
type of study would be a significant contribution to the current body of knowledge.
Summary
This descriptive research study examined the relationship between patient satisfaction
and patient and family-centered care in a tertiary care hospital. The study suggests that a
supportive environment and positive communication provided by nurses, physicians and other
staff leads to higher satisfaction with care. However, patients who rate their health less favorably
tend to be less satisfied with their care when compared to patients who rate their health better.
This study provides a foundation for future studies which should focus on further
exploration of this relationship. In particular, the inclusion of additional indicators of patient and
family-centered care with a more diverse patient population is warranted so that clinicians,
administrators, and educators can collaborate to insure that all patients receive high quality care
that addresses their individual needs and preferences.

REFERENCES
Abdellah, F., & Levine, E. (1957). Developing a measure of patient and personnel satisfaction
with nursing care. Nursing Research 5, 100-108.
Academy Health. (2004). Glossary of terms commonly used in healthcare. Washington, DC:
Author. Retrieved February 14, 2009, from
http://www.academyhealth.org/publications/glossary.pdf
American Association of Colleges of Nursing. (2006). Position statement on nursing research.
Washington, DC: Author
Agency for Healthcare Research and Quality. (2003). HCAHPS three-state pilot study results.
Rockville, MD: Author
American Nurses Credentialing Center. (2008). Recognizing nursing excellence: Application
manual. Magnet recognition program. Silver Spring, MD: Author
Barr, D. (2004). Race/ethnicity and patient satisfaction: Using the appropriate method to
test for perceived differences in care. Journal of General Internal Medicine, 19(4), 937-
943.
Bruster, S., Jarman, B., Bosanquet, N., Weston, D., Erens, R., & Delbanco, T. (1994). National
survey of hospital patients. British Medical Journal, 309, 1542-1546.
Carmen, S., Teal, S., & Guzzetta, C. (2008). Development, testing, and national evaluation of a
pediatric patient family centered care benchmarking survey. Holistic Nursing Practice,
22(2), 61-74.
Castle, N., Brown, J., Hepner, K., & Hays, R. (2005). Review of literature on survey
instruments used to collect data on hospital patients’ perceptions of care. Health Services
Research, 40(6), Part II, 1996-2017.

73
Charmel, P., & Frampton, S. (2008, March). Building the business case for patient-centered
care. Healthcare Financial Management, 80-85.
Cleary, P., Edgman-Levitan, S., Roberts, M., Moloney, T., McMullen, W., Walker, J., &
Delbanco, T. (1991). Patients evaluate their hospital care: A national survey. Health
Affairs, 10(4), 254-267.
Cohen, G. (1996). Age and health status in a patient satisfaction survey. Social Science and
Medicine, 42(7), 1085-1093.
Conway, J., Johnson, B., Edgman-Levitan, S., Schlucter, J., Ford, D., Sodomka, P., & Simmons,
L. (2006, June). Partnering with patients and families to design a patient- and family-
centered health care system: A roadmap to the future. A work in progress. Institute for
Family-Centered Care and Institute for Healthcare Improvement. Retrieved March 10,
2008, from http://www.familycenteredcare.org/pdf/Roadmap.pdf
Donabedian, A. (1966). Evaluating the quality of medical care. The Millbank Memorial Fund
Quarterly, 44(3), 166-203.
Donabedian, A. (1988). The quality of care: how can it be assessed? Journal of the American
Medical Association, 260, 1743-1748.
Dowling, J., Vender, J, Guilianelli, S., & Wang, B. (2005). A model of family-centered care
and satisfaction predictors. Chest,128, 81S-92S.
Drain, M., & Clark, P. (2004, July/ August). Measuring experience from the patient’s
perspective: Implications for national initiatives. Journal for Health Care Quality
Online, W4-16. Retrieved July 20, 2009, from
http://www.nahq.org/journal/ce/article.html?article_id=215

74
Frampton, S., Gilpin, L., & Charmel, P. (2003). Putting patients first: Designing and practicing
patient-centered care. San Francisco: Jossey- Bass.
Garcia, C. (2007, March). Satisfaction measurement of patient-and family-centered care: A
progress report [PowerPoint slides]. Retrieved May 30, 2009, from
https://www.uhc.edu/docs/003721413_RedesignCareGarcia.pdf
Gerteis, M., Edgman-Levitan, S., Daley, J., & Delbanco, T. (1993). Through the patient’s eyes:
Understanding and promoting patient-centered care. San Francisco: Jossey-Bass.
Goldstein, E., Farquhar, M., Crofton, C., Darby, C., & Garfinkel, S. (2005). Measuring hospital
care from the patients’ perspective: An overview of the CAHPS hospital survey
development process. Health Research and Educational Trust, DOI: 10.1111/j.1475-
6773.2005.00477.x, 1977-1995.
HCAHPS on-line. Centers for Medicare & Medicaid Services, Baltimore, MD. Retrieved
November 22, 2009, from http://www.hcahpsonline.org
Hill, T., & Lewicki, P. (2006). Statistics methods and applications. Tulsa, OK: StatSoft, Inc.
Hobbs, J. (2009). A dimensional analysis of patient-centered care. Nursing Research,
58(1), 52-62.
Hosmer, D., & Lemeshow, S. (2000). Applied logistic regression (2nd
ed.). New York: John
Wiley & Sons, Inc.
Institute for Family Centered Care. (2008). Retrieved March 17, 2008, from
http://www.familycenteredcare.org/faq.html
Institute of Medicine. (1999). To err is human: Building a safer health system. The National
Academies Press. Retrieved November 6, 2008, from
http://www.iom.edu/Object.File/Master/4/117/ToErr-8pager.pdf

75
Institute of Medicine. (2001). Crossing the quality chasm: A new health system for the 21st
century. Washington, DC: National Academy Press.
Institute of Medicine. (2003). Unequal treatment: Confronting racial and ethnic disparities in
health care. Washington, DC: National Academy Press. Retrieved October 20, 2009,
from http://www.nap.edu/catalog/10260.html
Jenkinson, C., Coulter, A., Bruster, S., Richards, N., & Chandola, T. (2002). Patients’
experiences and satisfaction with health care: Results of a questionnaire study of specific
aspects of care. Quality and Safety in Health Care, 11, 335-339.
Jha, K., Orav, E., Zheng, J., & Epstein, A. (2008). Patients’ perceptions of hospital care in the
United States. New England Journal of Medicine, 359(18), 1921-1931.
Kaiser Family Foundation. (2003, April). Women, work, and family health: A balancing act.
Retrieved October 18, 2009, from
www.kff.org/womenshealth/upload/Women-Work-and-Family-Health-A-Balancing-
Act.pdf
Kane, R. (1997). Understanding health outcomes research. Gaithersburg, Maryland: Aspen
Publishers, Inc.
Kane, R. (Ed.). (2006). Understanding health outcomes research (2nd
ed.). Boston: Jones and
Bartlett Publishers.
Kane, R., Maciejewski, M., & Finch, M. (1997). The relationship of patient satisfaction with
care and clinical outcomes. Medical Care, 359(7), 714-730.
Keller, S., O’Malley, A., Hays, R., Matthew, R., Zaslavsky, A., Hepner, K., & Cleary, P. (2005).
Methods used to streamline the CAHPS hospital survey. Health Research and
Educational Trust, DOI:10.1111/j.1475-6773.2005.00478.x, 2057-2077

76
Kirchheimer, B. (2007, July 23). The patient’s perspective. Modern Healthcare, 26-30.
Klein, S. (2007, March 15). Quality matters: Patient-centered care. Retrieved March 24, 2008,
from
http://www.commonwealthfund.org/publications/publications_show.htm?doc_id=468284
McCarthy, D. (2007, March 19). Case study: Achieving a culture of patient-and family-
centered care at Bronson Methodist Hospital. Retrieved March 25, 2008, from
http://www.commonwealthfund.org/innovations/innovation_show.htm?doc_id=470043
McGlynn, E., Asch, S., Adams, J., Keesey, J., Hicks, J., DeCristofaro, A., & Kerr, E. (2003).
The quality of health care delivered to adults in the United States. New England Journal
of Medicine, 348(26), 2635-2645.
Meyers, S. (2008, February 25). Patient- & family-centered care improves Florida ICUs.
Retrieved March 24, 2008, from
http://include.nurse.com/apps/pbcs.dll/article?AID=/20080225/PED02/302260015
National Association of Public Hospitals and Health Systems. (2008). HCAHPS
survey: Patients’ perspectives of care. Retrieved February 1, 2009, from
www.naph.org/naph/HCAHPSBrief.pdf
National Quality Forum. (2005). Standardizing a measure of patient perspectives of hospital
care. Washington, DC: Author.
Polit, D., & Beck, C. (2008). Nursing research: Principles and methods (8th
ed.). Philadelphia:
Lippincott, Williams, and Wilkins.
Ponte, P., & Peterson, K. (2008). A patient- and family-centered care model paves the way for a
culture of quality and safety. Critical Care Nursing Clinics of North America, 20, 451-
464.

77
Quality and Safety Education for Nurses. (2010). Retrieved March 14, 2010, from
http://www.qsen.org/about_qsen.php
Quintana, J., Gonzalez, N., Bilbao, A., Aizpuru, F., Escobar, A., Esteban, C., San-Sebastian, J.,
De-la-Sierra, E., & Thompson, A. (2006). Predictors of patient satisfaction with hospital
care. BMC Health Services Research, 6(102), DOI:10.1186/1472-6963-6-102. Retrieved
December, 15, 2009, from http://www.biomedcentral.com/1472-6963/6/102
Rahmqvist, M. (2001). Patient satisfaction in relation to age, health status and other background
factors: A model for comparisons of care units. International Journal for Quality in
Health Care, 13(5), 385-390.
Risser, N. (1975). Development of an instrument to measure patient satisfaction with nurses and
nursing care in the primary care settings. Nursing Research, 24, 45-52.
Sahin, B., Yilmaz, F., & Lee, K. (2007). Factors affecting inpatient satisfaction: Structural
equation modeling. Journal of Medical Systems, 31, 9-16.
Sitzia, J. (1999). How valid and reliable are patient satisfaction data? An analysis of 195
studies. International Journal for Quality in Health Care, 11(4), 319-328.
Sitzia, J., & Wood, N. (1997). Patient satisfaction: A review of issues and concepts. Social
Science and Medicine, 45(12), 1829-1843.
Thi, P., Briancon, S., Empereur, F., & Guillemin, F. (2002). Factors determining inpatient
satisfaction with care. Social Science & Medicine, 54, 493-504.
Tomlinson, J., & Ko, C. (2006). Patient satisfaction: An increasingly important measure of
quality. Annals of Surgical Oncology, 13(6), 764-765.
Wagner, D., & Bear, M. (2008). Patient satisfaction with nursing care: A concept analysis
within a nursing framework. Journal of Advanced Nursing, 65(3), 692-701.

78
Wharam, J., & Sulmasy, D. (2009). Improving the quality of health care: Who is responsible
for what? Journal of the American Medical Association, 301(2), 215-217.
Xiao, H., & Barber, J. (2008). The effect of perceived health status on patient satisfaction.
Value in Health, 11(2), 719- 725.
Yellen, E., Davis, G., & Ricard, R. (2002). The measurement of patient satisfaction. Journal of
Nursing Care Quality, 16(4), 23-29.
Young, G., Meterko, M., & Desai, K. (2000). Patient satisfaction with hospital care: Effects of
demographic and institutional characteristics. Medical Care, 38(3), 325-334.

Appendix A: Survey

Appendix B: Patient- and Family- Centered Care Custom Question Set
Developed by
The National Task Force on Patient- and Family-Centered Care Metrics
For the Press Ganey Survey
1. How often were you and your family able to participate in decisions about your care?
2. How often did staff explain their roles in your care?
3. How often did the staff support your family throughout your healthcare experience?
4. How often were your choices respected to have family members/ friends with you
during your care?
5. How often did staff respect your family’s cultural and spiritual needs?

Appendix C: Institutional Review Board Approval Letter