Embed Size (px)
Citation preview
Marketing material for professional investors or advisers only. This material is not suitable for retail clients.
Matthew Dobbs, Fund Manager
Disruption in AsiaSelect 2018
June 2018
1
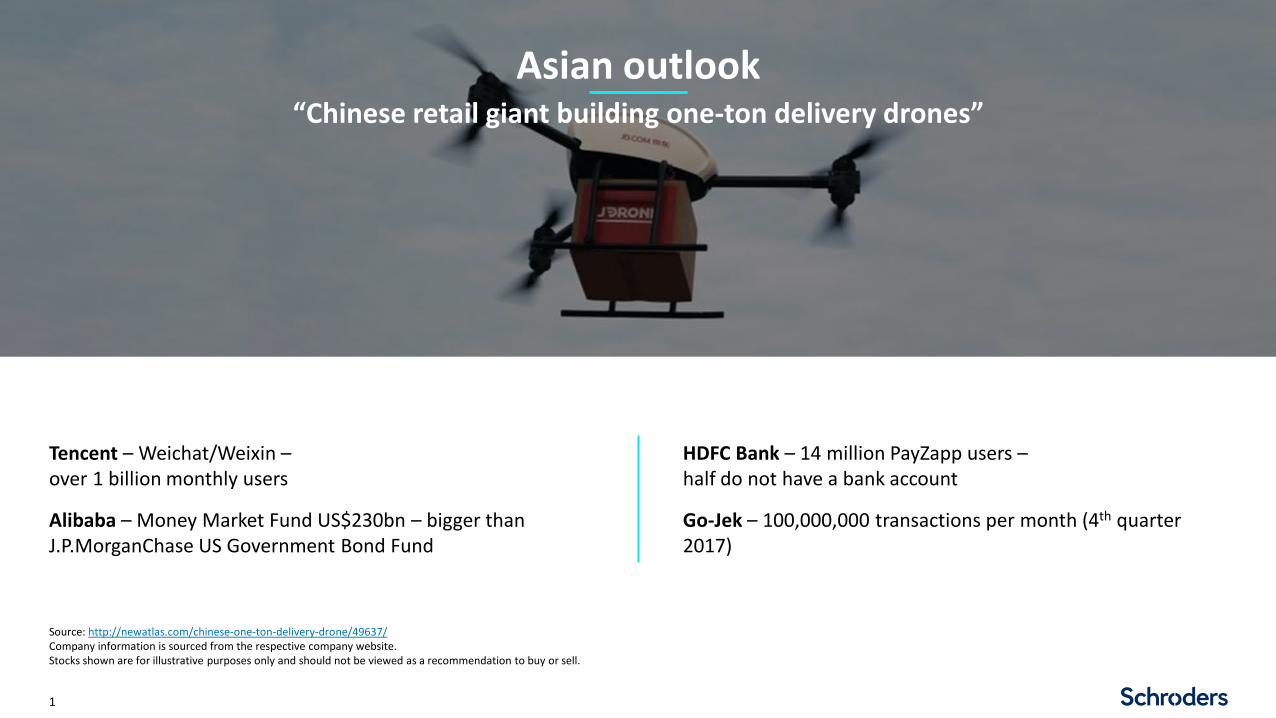
Source: http://newatlas.com/chinese-one-ton-delivery-drone/49637/Company information is sourced from the respective company website.Stocks shown are for illustrative purposes only and should not be viewed as a recommendation to buy or sell.
Asian outlook“Chinese retail giant building one-ton delivery drones”
Tencent – Weichat/Weixin –over 1 billion monthly users
Alibaba – Money Market Fund US$230bn – bigger than J.P.MorganChase US Government Bond Fund
HDFC Bank – 14 million PayZapp users –half do not have a bank account
Go-Jek – 100,000,000 transactions per month (4th quarter 2017)
Asian outlook
2
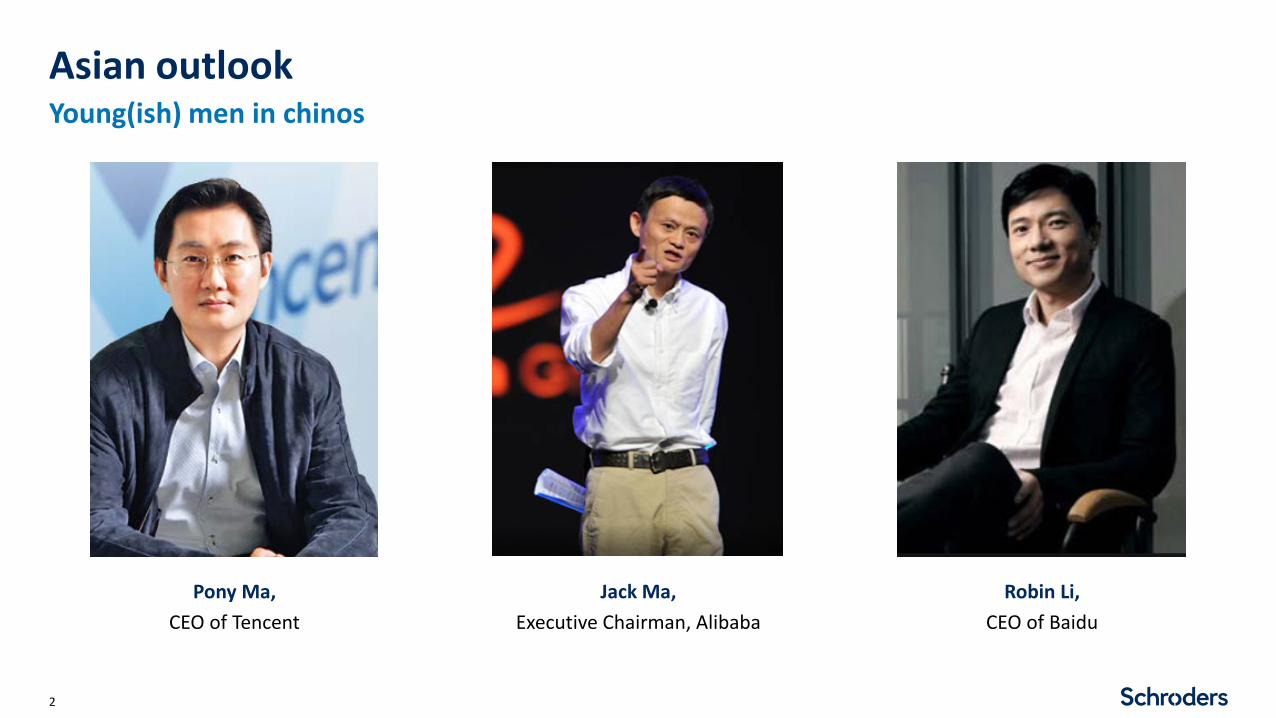
Young(ish) men in chinos
Jack Ma, Executive Chairman, Alibaba
Robin Li, CEO of Baidu
Pony Ma, CEO of Tencent

Asian outlook
3
18th century fishwives
Source: www.wsj.com, April 10, 2018
Apr 10, 2018 at 5:55 pm ET
Facebook Is an 'Only in America' Story... Right?
America-focused lawmakers and globally minded Facebook CEO Mark Zuckerberg don't always see eye-to-eye on the world order
When Sen. Dan Sullivan (R., Alaska) said Facebook's meteoric rise from a startup in a dorm room seemed like an "Only in America" story, Mr. Zuckerberg demurred
"You couldn't do this in China, right?" Sen. Sullivan asked
"Well, senator, there are some very strong Chinese internet companies," Mr. Zuckerberg responded
The moment, which Sen. Sullivan said was meant to be a complimentary levity, was lost in translation
"Come on, I'm trying to help you," Sen. Sullivan said. "Give me a break; you're in front of a bunch of senators. The answer is yes“
Lawmakers and the audience laughed
Asian outlook
4
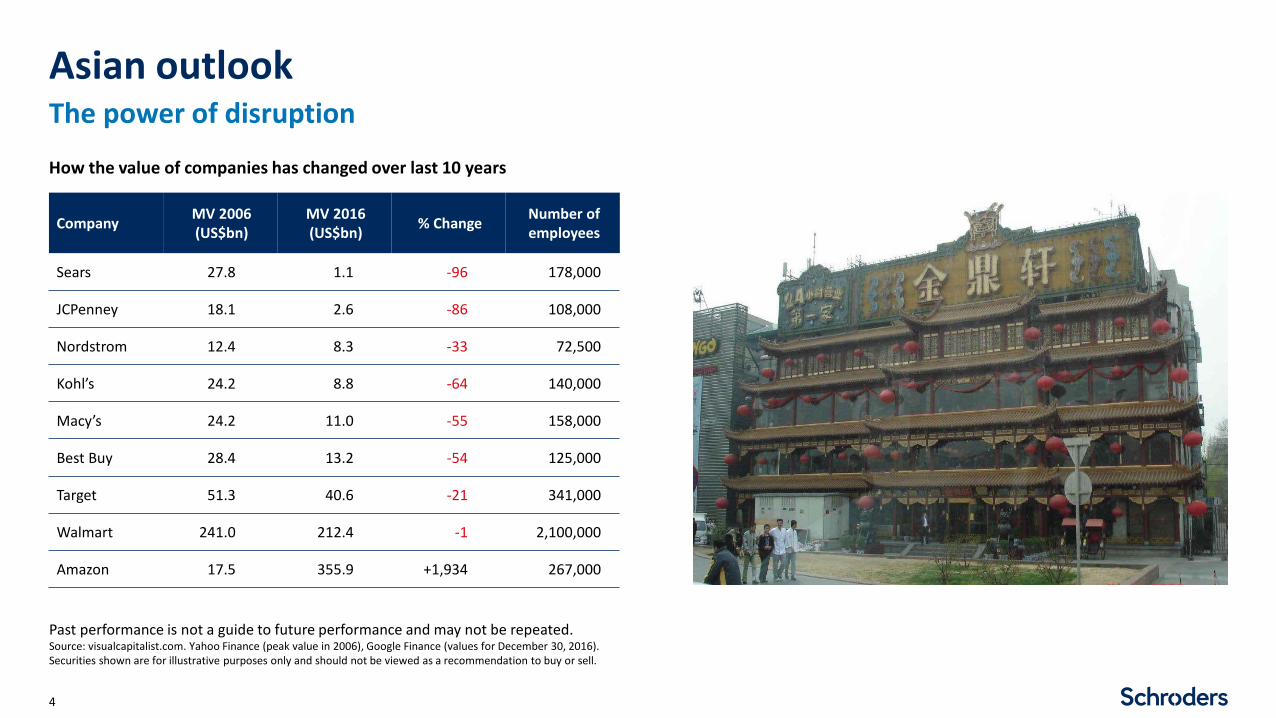
The power of disruption
Past performance is not a guide to future performance and may not be repeated.Source: visualcapitalist.com. Yahoo Finance (peak value in 2006), Google Finance (values for December 30, 2016). Securities shown are for illustrative purposes only and should not be viewed as a recommendation to buy or sell.
How the value of companies has changed over last 10 years
Company MV 2006 (US$bn)
MV 2016 (US$bn) % Change Number of
employees
Sears 27.8 1.1 -96 178,000
JCPenney 18.1 2.6 -86 108,000
Nordstrom 12.4 8.3 -33 72,500
Kohl’s 24.2 8.8 -64 140,000
Macy’s 24.2 11.0 -55 158,000
Best Buy 28.4 13.2 -54 125,000
Target 51.3 40.6 -21 341,000
Walmart 241.0 212.4 -1 2,100,000
Amazon 17.5 355.9 +1,934 267,000

Asian outlook
5
Demographics - but not as we know it
Source: www.whyMillennialsmatter.com, Macquarie Research, July 2017
Who are the millennials?
Asian outlook
6
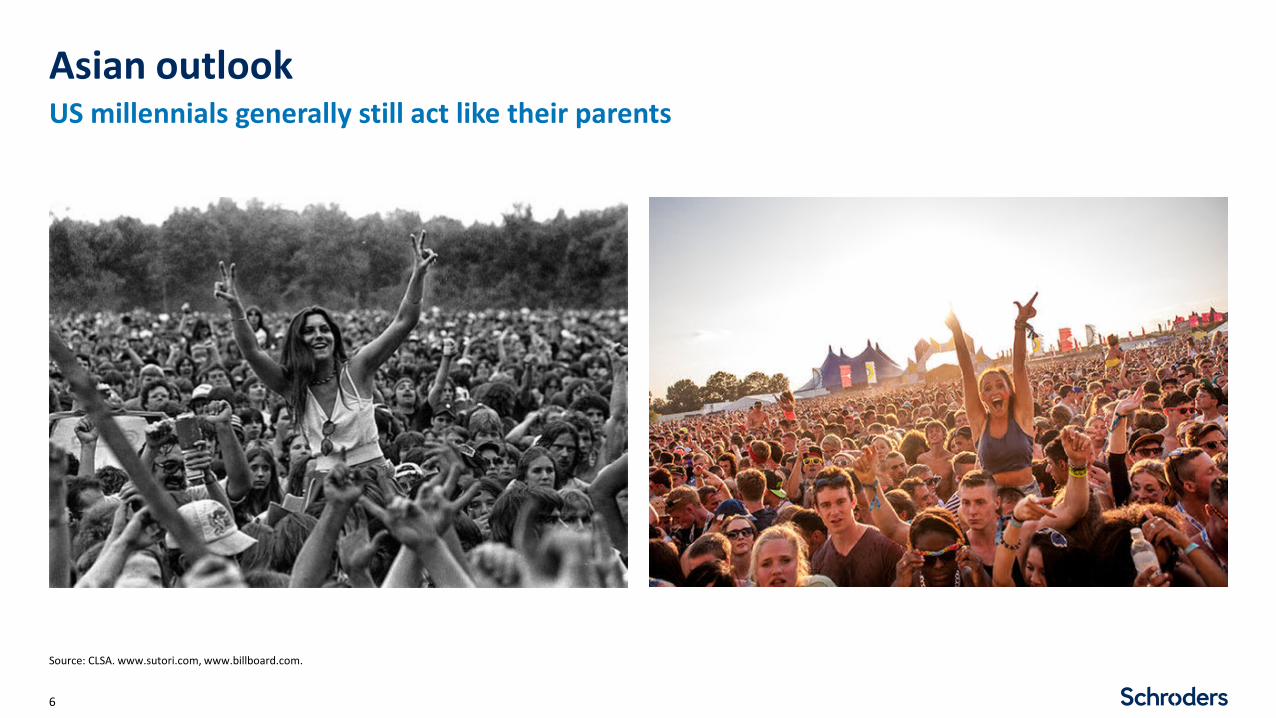
US millennials generally still act like their parents
Source: CLSA. www.sutori.com, www.billboard.com.
Asian outlook
7
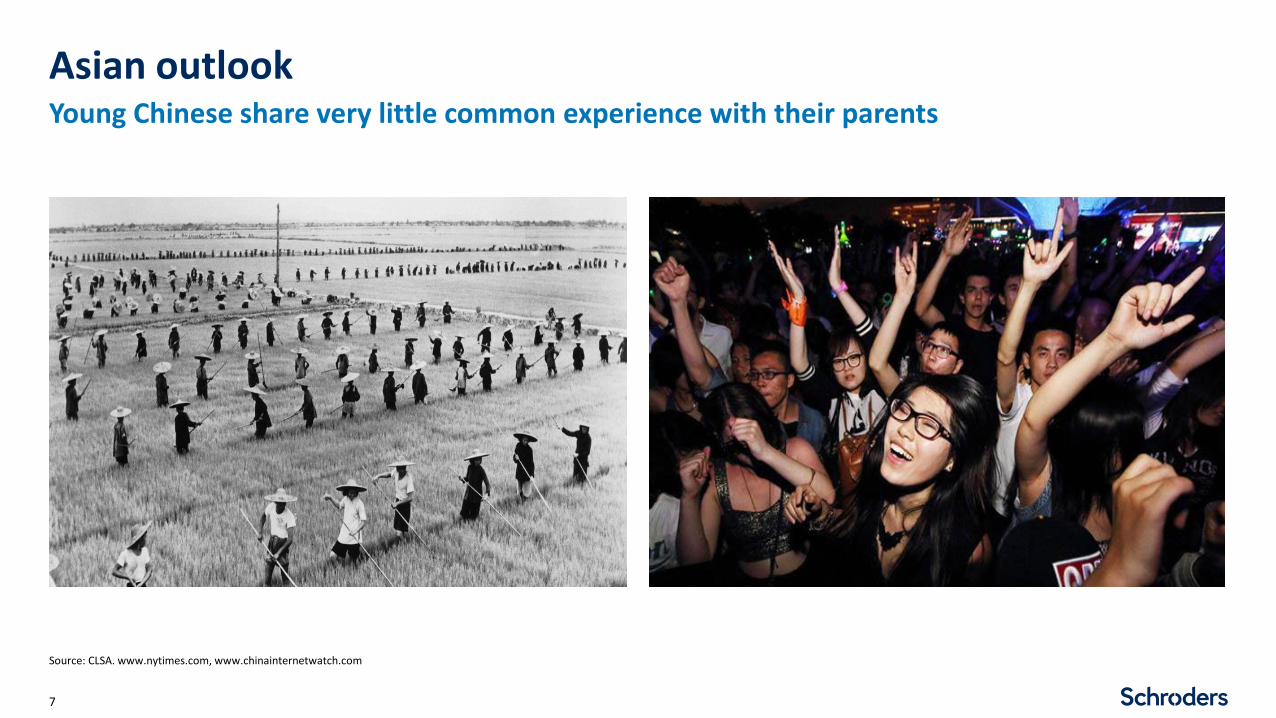
Young Chinese share very little common experience with their parents
Source: CLSA. www.nytimes.com, www.chinainternetwatch.com

Asian outlook
8
Hope…
Source:1http://uk.businessinsider.com/trump-trade-policy-lead-to-global-recession-2016-11?r=US&IR=T November 2016. 2WIN/GALLUP Annual Global Survey 2016.
Developed Markets’ middle and lower-middle income families have not benefitted from global growth over the past two decades1 Global survey results2
Next year will be better
Economic prosperity will
improve
Happy or unhappy
Average of all three
18-34 vs>55s
China +56 +34 +60 +50 +22
India +55 +54 +42 +50 +60
Indonesia +38 +17 +75 +44 +35
Thailand +29 +9 +63 +34 +20
South Korea -31 -62 +40 -18 -7
Hong Kong -34 -56 +14 -25 =
United States +11 -2 +48 +19 -3
Germany +6 -24 +46 +9 -15
Japan +7 -17 +55 +15 -21
UK +4 -38 +47 +4 -7
Asian outlook
9
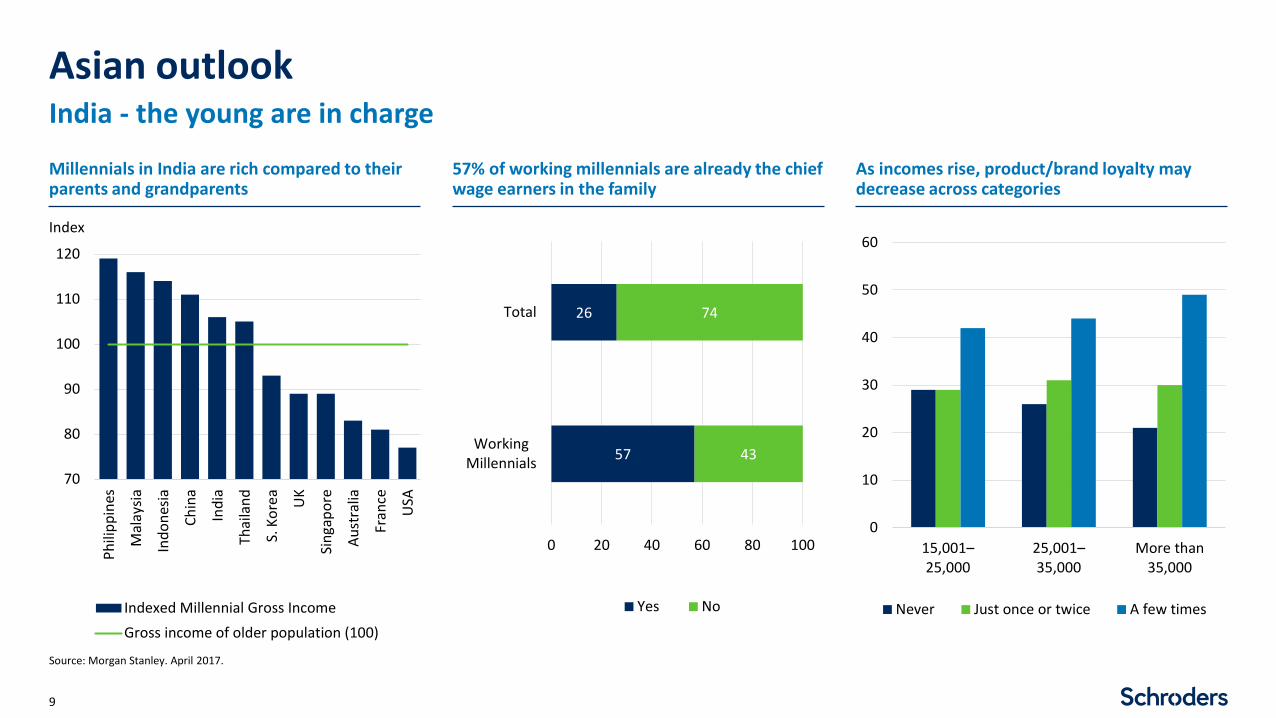
India - the young are in charge
Source: Morgan Stanley. April 2017.
Millennials in India are rich compared to their parents and grandparents
57% of working millennials are already the chief wage earners in the family
As incomes rise, product/brand loyalty may decrease across categories
Index
70
80
90
100
110
120
Phili
ppin
es
Mal
aysia
Indo
nesia
Chin
a
Indi
a
Thai
land
S. K
orea U
K
Sing
apor
e
Aust
ralia
Fran
ce
USA
Indexed Millennial Gross IncomeGross income of older population (100)
57
26
43
74
0 20 40 60 80 100
WorkingMillennials
Total
Yes No
0
10
20
30
40
50
60
15,001–25,000
25,001–35,000
More than35,000
Never Just once or twice A few times

Asian outlook
10
China’s young online shoppers are leaving the US in their trail
Source: CLSA, Euromonitor, iResearch, US Department of Commerce, October 2017
China and USA online retail sales China online shopper by age
0
5
10
15
20
25
30
35
2005
2006
2007
2008
2009
2010
2011
2012
2013
2014
2015
2016USA online retail sales as % of total retail sales
China online retail sales as % of total retail sales
0%
5%
10%
15%
20%
25%
30%
35%
40%
45%
19 to 30 31 to 40 41 to 50 51 or above
China online shopper by age 2015
%
Asian outlook
11
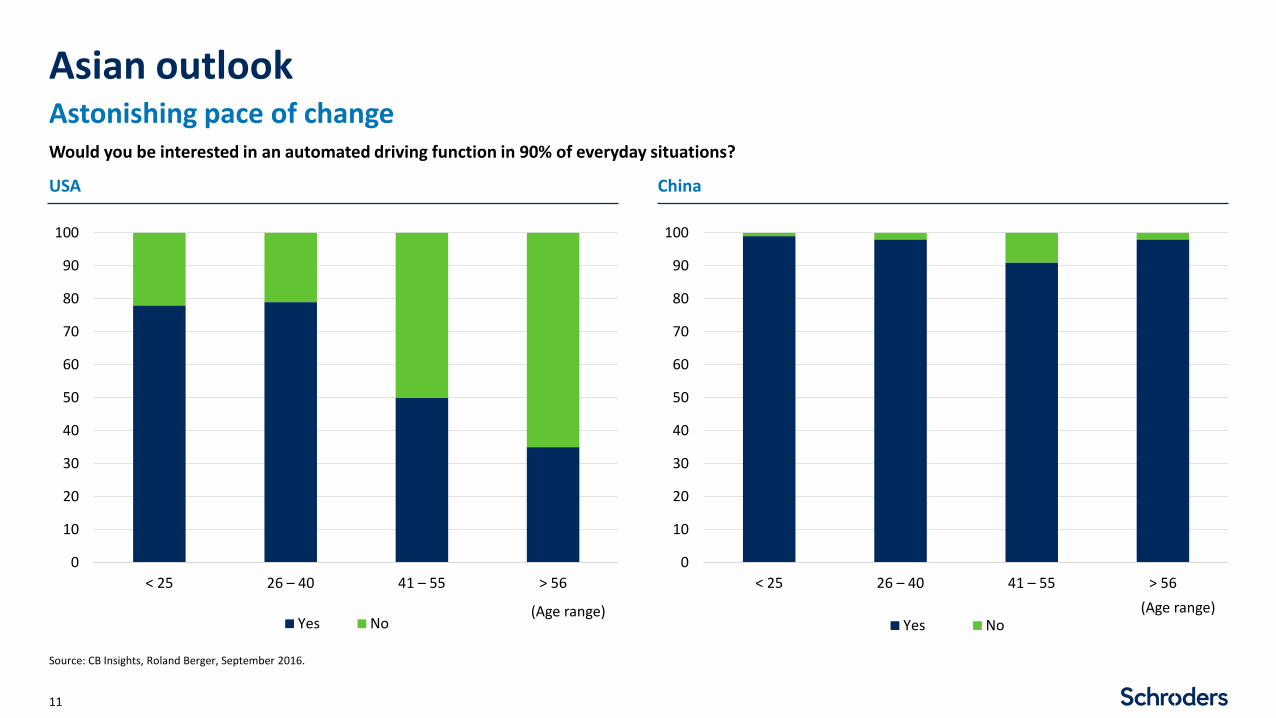
Astonishing pace of change
Source: CB Insights, Roland Berger, September 2016.
Would you be interested in an automated driving function in 90% of everyday situations?
USA China
0
10
20
30
40
50
60
70
80
90
100
< 25 26 – 40 41 – 55 > 56
Yes No
0
10
20
30
40
50
60
70
80
90
100
< 25 26 – 40 41 – 55 > 56
Yes No(Age range) (Age range)

Asian outlook
12
Build - and they will come
Source: ITU, InternetWorldStates, UN, US Census Bureau, wearesocial.com, Macquarie Research, July 2017. Regions shown are for illustrative purposes only and are not a recommendation to buy or sell.
Regional internet penetrationInternet penetrationInternet users, millions
0%
20%
40%
60%
80%
100%
0
200
400
600
800
1000
East Asia South Asia Africa West Europe NorthAmerica
East Europe SoutheastEurope
SouthAmerica
Middle East CentralAmerica
Oceania Central Asia
Internet Users (M) Internet penetration (%), rhs
Asian outlook
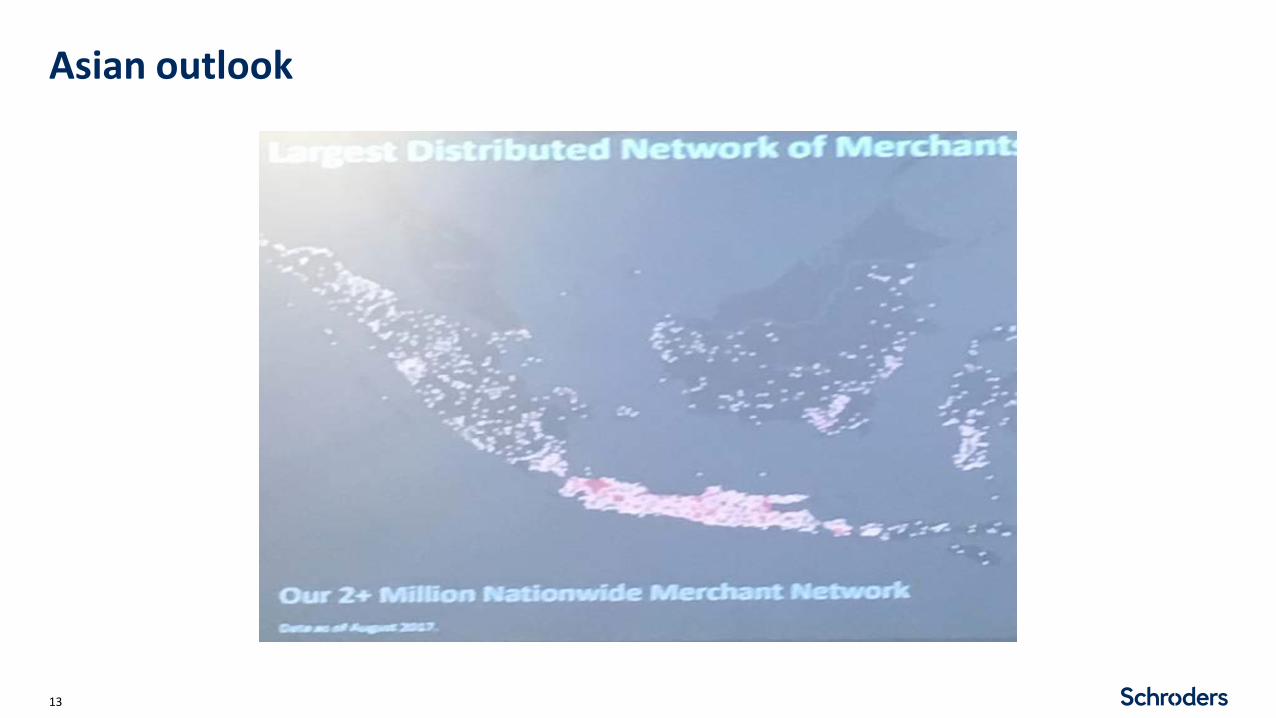
13
Asian outlook
14
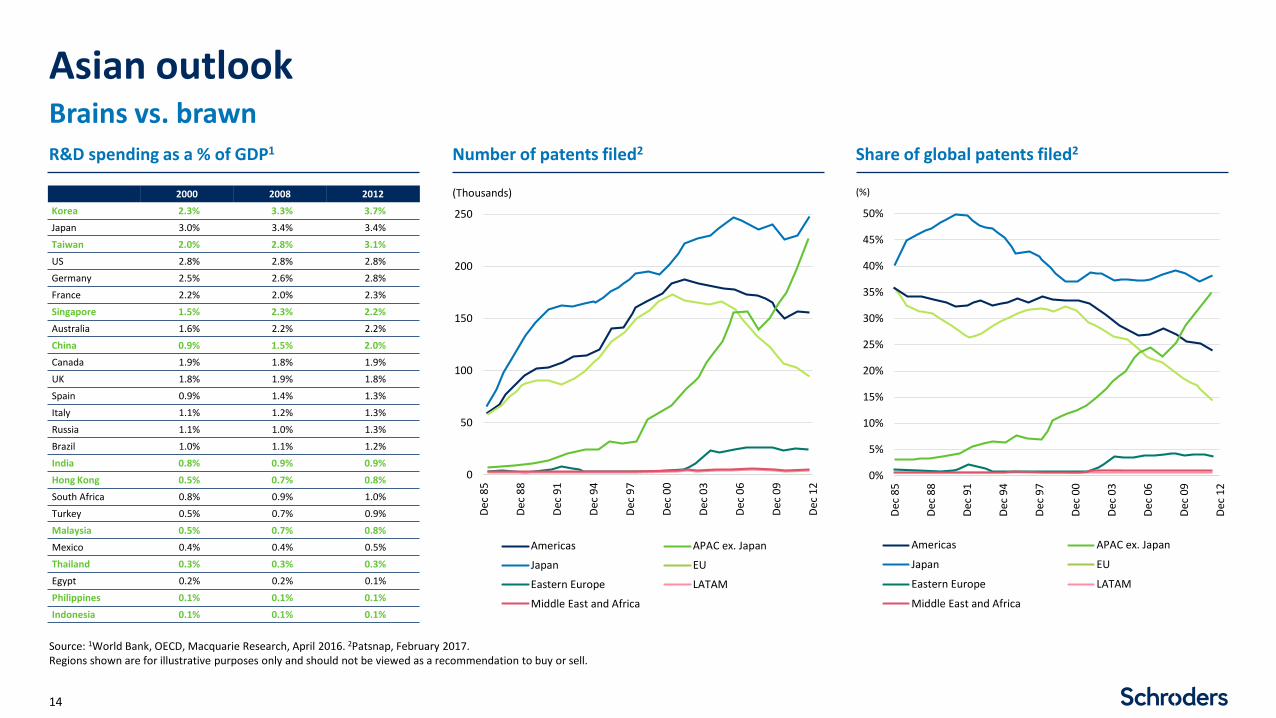
Brains vs. brawn
Source: 1World Bank, OECD, Macquarie Research, April 2016. 2Patsnap, February 2017. Regions shown are for illustrative purposes only and should not be viewed as a recommendation to buy or sell.
R&D spending as a % of GDP1 Number of patents filed2 Share of global patents filed2
2000 2008 2012Korea 2.3% 3.3% 3.7%Japan 3.0% 3.4% 3.4%Taiwan 2.0% 2.8% 3.1%US 2.8% 2.8% 2.8%Germany 2.5% 2.6% 2.8%France 2.2% 2.0% 2.3%Singapore 1.5% 2.3% 2.2%Australia 1.6% 2.2% 2.2%China 0.9% 1.5% 2.0%Canada 1.9% 1.8% 1.9%UK 1.8% 1.9% 1.8%Spain 0.9% 1.4% 1.3%Italy 1.1% 1.2% 1.3%Russia 1.1% 1.0% 1.3%Brazil 1.0% 1.1% 1.2%India 0.8% 0.9% 0.9%Hong Kong 0.5% 0.7% 0.8%South Africa 0.8% 0.9% 1.0%Turkey 0.5% 0.7% 0.9%Malaysia 0.5% 0.7% 0.8%Mexico 0.4% 0.4% 0.5%Thailand 0.3% 0.3% 0.3%Egypt 0.2% 0.2% 0.1%Philippines 0.1% 0.1% 0.1%Indonesia 0.1% 0.1% 0.1%
(Thousands)
0
50
100
150
200
250
Dec
85
Dec
88
Dec
91
Dec
94
Dec
97
Dec
00
Dec
03
Dec
06
Dec
09
Dec
12
Americas APAC ex. Japan
Japan EU
Eastern Europe LATAM
Middle East and Africa
0%
5%
10%
15%
20%
25%
30%
35%
40%
45%
50%
Dec
85
Dec
88
Dec
91
Dec
94
Dec
97
Dec
00
Dec
03
Dec
06
Dec
09
Dec
12
Americas APAC ex. Japan
Japan EU
Eastern Europe LATAM
Middle East and Africa
(%)
Asian outlook
15
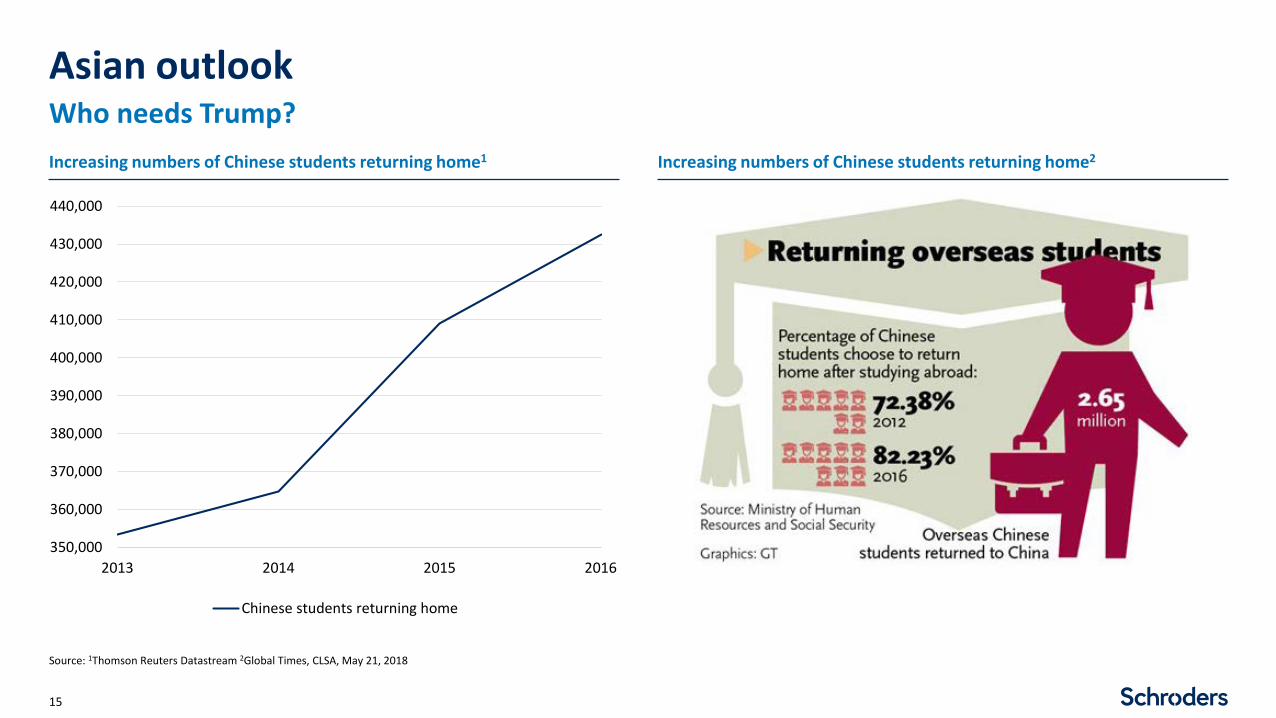
Who needs Trump?
Source: 1Thomson Reuters Datastream 2Global Times, CLSA, May 21, 2018
Increasing numbers of Chinese students returning home1 Increasing numbers of Chinese students returning home2
350,000
360,000
370,000
380,000
390,000
400,000
410,000
420,000
430,000
440,000
2013 2014 2015 2016
Chinese students returning home
Asian outlook
16
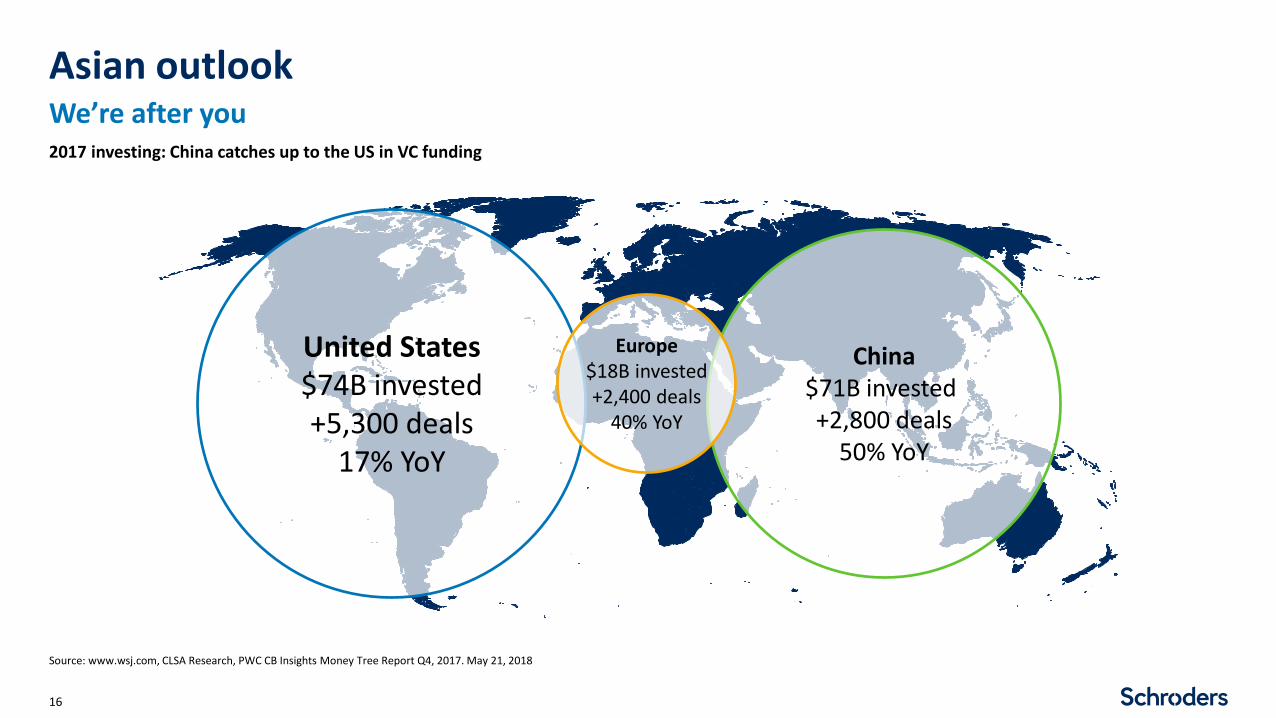
We’re after you
Source: www.wsj.com, CLSA Research, PWC CB Insights Money Tree Report Q4, 2017. May 21, 2018
2017 investing: China catches up to the US in VC funding
China$71B invested +2,800 deals
50% YoY
Europe$18B invested +2,400 deals
40% YoY
United States$74B invested +5,300 deals
17% YoY

Asian outlook
17
The challenge to California
Source: Best of AI Journals and Conferences. Keith Woolcock – 5th Column
Artificial Intelligence Research
(%)
Chinese Authors of Research as % of Total
Citations for Chinese Research as % of total
23.29
42.89
25.5
55.8
0
10
20
30
40
50
60
70
80
90
100
2008 2015 2008 2015
Asian outlook
18
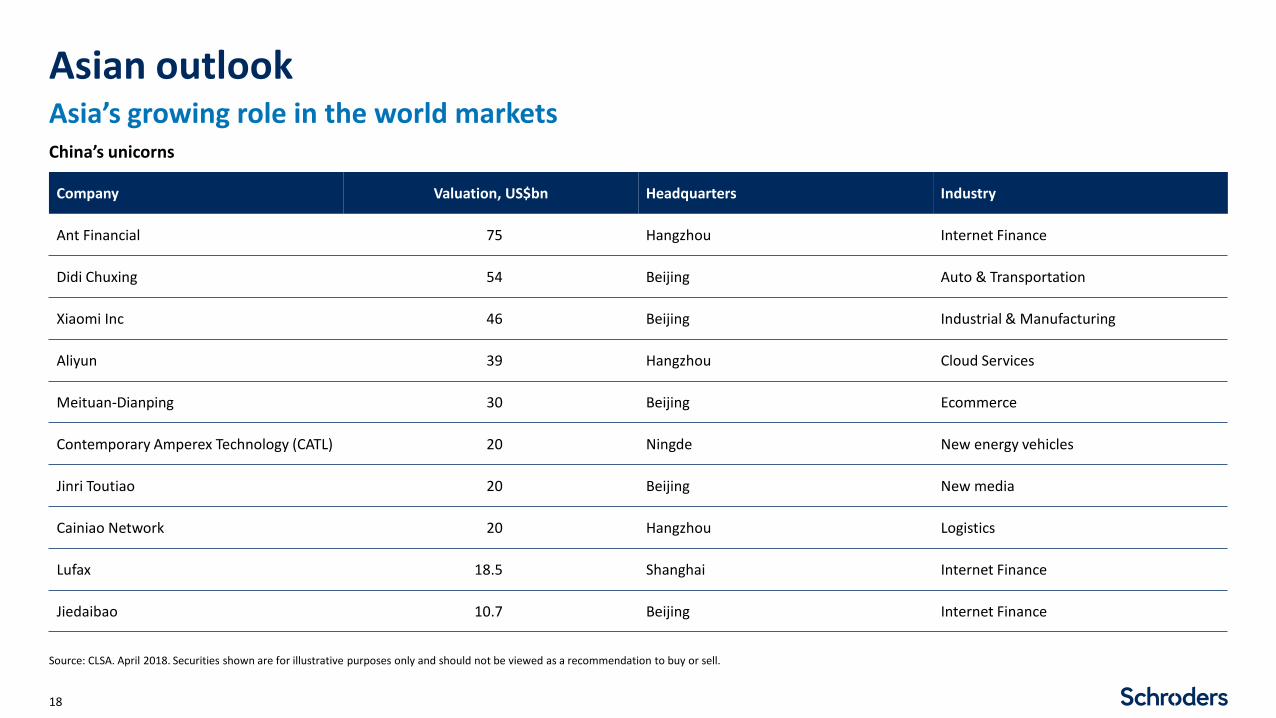
Asia’s growing role in the world markets
Source: CLSA. April 2018. Securities shown are for illustrative purposes only and should not be viewed as a recommendation to buy or sell.
Company Valuation, US$bn Headquarters Industry
Ant Financial 75 Hangzhou Internet Finance
Didi Chuxing 54 Beijing Auto & Transportation
Xiaomi Inc 46 Beijing Industrial & Manufacturing
Aliyun 39 Hangzhou Cloud Services
Meituan-Dianping 30 Beijing Ecommerce
Contemporary Amperex Technology (CATL) 20 Ningde New energy vehicles
Jinri Toutiao 20 Beijing New media
Cainiao Network 20 Hangzhou Logistics
Lufax 18.5 Shanghai Internet Finance
Jiedaibao 10.7 Beijing Internet Finance
China’s unicorns

Asian outlook
19
You may be hearing more about them
Cheng Wei, CEO of Didi Chuxing
Lei Jun, CEO of xiaomi inc
Eric Jing,CEO of Ant Financial

Asian outlook
20
Grey chaps in suits
Wang Qishan Liu He

Asian outlook
21
Stimulus definitely on the wane in China
Source: TS Lombard. February 2018.*Non Bank Financial Institutions (NBFI), Gross Domestic Product (GDP)Countries mentioned are for illustrative purposes only and are not a recommendation to buy or sell.
Banks' claim on NBFI*, RMB trn Credit growth vs nominal GDP* growth
-20
-10
0
10
20
30
40
50
60
70
80
90
0
5
10
15
20
25
30
2010 2011 2012 2013 2014 2015 2016 2017 2018
Banks' claim on NBFI Growth rate, yoy, RHS
0%
10%
20%
30%
40%
2010 2011 2012 2013 2014 2015 2016 2017 2018
Gap Total credit growth Nominal GDP growth

Asian outlook
22
What might support the Chinese economy?
Source: Credit Suisse, January 2018. Countries mentioned are for illustrative purposes only and are not a recommendation to buy or sell. The forecast should be regarded as illustrative of trends. Actual figures will differ from forecasts. Please refer to the important information slide at the end of this presentation.
China – working age population China real wages versus productivity
-15%
-10%
-5%
0%
5%
10%
15%
20%
1965
1970
1975
1980
1985
1990
1995
2000
2005
2010
2015
2020
2025
2030
2035
2040
2045
2050
Working age population (15-59), 5y% chg
Projected
5%
6%
7%
8%
9%
10%
11%
12%
13%
14%
1994 1999 2004 2009 2014
China productivity growth (%, yoy) China real wage growth (%, yoy)

Asian outlook
23
Summary
Source: Schroders
Perhaps the active stock picker has a future
The new era Disruption/Demographics/Inno
vation
The new phaseAttractive stage in capital cycle
RisksGlobal growth, China’s tricky
adjustment, US strategic thrust

Thank you
25
For professional investors and advisers only.
Past performance is not a guide to future performance and may not be repeated. The value of investments and the income from them may go down as well as up and investors may not get back the amount originally invested
Schroders has expressed its own views and these may change. The data contained in this document has been sourced by Schroders and should be independently verified before further publication or use. This presentation is intended to be for information purposes only and it is not intended as promotional material in any respect
The material is not intended as an offer or solicitation for the purchase or sale of any financial instrument. The material is not intended to provide, and should not be relied on for, accounting, legal or tax advice, or investment recommendations. Information herein is believed to be reliable but Schroder Unit Trusts Limited (Schroders) does not warrant its completeness or accuracy. No responsibility can be accepted for error of fact or opinion. This does not exclude or restrict any duty or liability that Schroders has to its customers under the Financial Services and Markets Act 2000 (as amended from time to time) or any other regulatory system. Reliance should not be placed on the views and information in the document when taking individual investment and/or strategic decisions
The forecasts included should not be relied upon, are not guaranteed and are provided only as at the date of issue. Our forecasts are based on our own assumptions which may change. We accept no responsibility for any errors of fact or opinion and assume no obligation to provide you with any changes to our assumptions or forecasts. Forecasts and assumptions may be affected by external economic or other factors
Issued in June 2018 by Schroder Unit Trusts Limited, 31 Gresham Street, London EC2V 7QA. Registered No. 4191730 England. Authorised and regulated by the Financial Conduct Authority. ASI00304
Disclaimer