Embed Size (px)
Citation preview
The 8th Yonsei-Nagoya University
Research Exchange Meeting on Health Sciences & Nursing
1st~3rd November, 2017
Yonsei University Wonju Campus
Wonju, Republic of Korea
- 1 -

- 2 -
Table of Contents
1. Preface …………………………………………………………………………..….…………3
2. Welcoming remarks ………………………………………………………..….……….4
3. Schedule …………………………………………………………………………..…….……5
4. Organizing committee ………………………………………………………..….…...6
5. Abstract
A. Physical Therapy ……………………………………………………………...7
B. Occupational Therapy ……………………………………………………21
C. Radiological Technology ………………………………………………..39
D. Biomedical Laboratory Science ……………………………………..59
E. Nursing …………………………………………………………………………..81
6. List of participants…………………………………………………….……………….96

Preface
As Dean of College of Health Sciences, it is my utmost pleasure to host 2017 Yonsei-Nagoya
University Research Exchange Meeting in Health Sciences (November 1-3rd, 2017) at the Yonsei
University Wonju Campus. On behalf of the Yonsei University Wonju Campus, I would like to
extend my heartfelt welcome to the delegates from Nagoya University who take part in this
research exchange meeting. I believe that this meeting will be a unique forum to exchange ideas,
discuss not only the results of their research work but also matters of mutual interest and
concerns, and share experiences among professors and students between the two universities.
This is the 8th meeting jointly held by the two institutions, since the 1st meeting was held in
Nagoya University in 2010. I hope that this meeting is still useful for each other, and continue our
joint efforts in the future. Even if we don’t make any wonderful research output until now, the
students have had wonderful experiences by this program. I hope to see continuously what we
will be able to produce and accomplish through this joint meeting.
As you know, Yonsei University is the best private university in Korea, since 1885 year. We have
the 132th anniversary at this year. And Wonju campus is the one of the three campuses of Yonsei
University (Shincho, Songdo and Wonju). The Wonju campus is focused on Health science fields.
The College of health science in Wonju campus is the first and best college among any other
universities in Korea.
I also hope that your visit to our campus will provide you with a great opportunity to get to
know Korea and the Korean people as well as experience Korean culture in a fragrant fall
atmosphere. Now is the best time to see the very best and most beautiful autumn foliage. I once
again welcome all of you who are visiting Yonsei University Wonju Campus and I believe that your
visit to our campus ensure for our bilateral cooperation and partnership between the two
institutions to closely work together in the years to come.
Thank you.
Haejong Lee, PhD
Dean, College of Health Sciences
Yonsei University
- 3 -

Welcoming remarks
On behalf of the Yonsei University Wonju College of Medicine, I would like to extend a
warm-hearted welcome to you for taking the time to be here with us in this exchange
program.
It has been 5 years since the University of Nagoya and the Yonsei University agreed on a
collaboration that would include our professors as well as our graduate students in
research. I strongly believe that the students who had a chance to take part in our
exchange program could develop the skills and knowledge though academic, cultural,
and research exchanges.
Nursing is the protection, promotion, and optimization of health and abilities, prevention
of illness and injury, facilitation of healing, alleviation of suffering through the diagnosis
and treatment of human response, and advocacy in the care of individuals, families,
groups, communities, and populations. One of the goals of this program is to provide
students the global experience opportunities and be able to enhance the health of
individuals as well as the local and global communities.
I look forward to seeing more students to be involved in this academic exchange and
international exposure, which will help them to advance in their careers and pursue
academic ambitions in their chosen field.
I wish your stay in Wonju will be a pleasant and enriching experience and return home
with new insights and vigor.
Thank you very much.
Kang Hyun Lee, M.D., Ph.D.
Dean, Yonsei University Wonju College of Medicine
- 4 -

Schedule
November 2nd, 2017
Time Schedule Place
10:00~10:45 Opening
Ceremony
Mirae-hall #443
11:00~12:00 Presentation Physical Therapy: Univ. Headquarters #223
Occupational Therapy: Baekun-hall #103
Radiological Sci. & Tech: Baekun-hall #534
Biological Lab. Sci.: Miae-hall #325
12:00~13:50 Lunch/ Executive
Committee
Meeting
Meeting at Baekun-hall 4th FL, iBMW room
14:00~17:00 Presentation Physical Therapy: Univ. Headquarters #223
Occupational Therapy: Baekun-hall #103
Radiological Sci. & Tech: Baekun-hall #534
Biological Lab. Sci.: Miae-hall #325
Nursing: Jinri-hall #421 (College of Medicine
campus)
Dinner arranged by each dept.
- 5 -

Organizing Committee
Dean
Hae-Jong LEE
Vice Dean
Yong-Hyun CHUNG
Contact person
Sang-Hyun CHO
Dept. of Physical Therapy
Woo-Chol CHOI
Dept. of Occupational Therapy
Hae-Yean PARK
Dept. of Radiological Science and Technology
Chul-Hee MIN
Dept. of Biomedical Science and Laboratory
Ki-Jong RHEE
Dept. of Nursing
Ji-Hae CHOI
Sponsor
Institute of Health Science
Yonsei University Wonju Campus
- 6 -

Abstract
Physical Therapy
- 7 -

- 8 -

2017 Yonsei-Nagoya University Joint Symposium on Physical Therapy
Date: November 2nd, 2017 Location: Univ. Headquarters #223
11:00 – 11:05 Opening remarks
Dr. H. S. Jeon (Yonsei Univ)
11:05 – 11:45 Session I Chair: Dr. H. S. Jeon
11:05 – 11:45 The effect of short foot exercise with different ankle position
on the EMG and medial longitudinal arch angle
H. B. Yoon (Yonsei Univ)
12:00 – 14:00 Lunch/Executive meeting
14:00 – 15:20 Session II Chair: Dr. Y. Uchiyama
14:00 – 14:40 The relationship between six-minute walk distance and serum
amino acids in elderly people aged 75 or over: A cross-
sectional study
Y. Ishimaru (Nagoya Univ)
14:40 – 15:20 Physical function and self-perceived ability related to life
space mobility in community-dwelling older people
Y. Tsuchida (Nagoya Univ)
Break
15:30 – 16:50 Session III Chair: Dr. S. H. Kim
15:30 – 16:10 Relationship between body function and structure and activity
based on ICF model with children with cerebral palsy
J. S. Hwang (Yonsei Univ)
16:10 – 16:50 Comparison of shoulder strength in males with and without
myofascial trigger points in the upper trapezius
H. A. Kim (Yonsei Univ)
16:50 – 16:55 Closing remarks
Dr. Y. Uchiyama (Nagoya Univ)
16:55 – 17:00 Commemorative photographing
17:00 - Dinner at WoonChae (747-1993)
*20 min presentation, followed by 20 min discussion for each speaker
- 9 -
Comparison of the Foot Muscle EMG and Medial Longitudinal Arch Angle during Short Foot Exercises at Different Ankle Position
Hyeo-Bin Yoon, BPT, PT1), Ji-Hyun Kim, BPT, PT1), Joo-Hee Park, Msc, PT1), Hye-Seon Jeon, Ph.D, PT2) 1) Department of Physical Therapy, The Graduate School, Yonsei University
2) Department of Physical Therapy, College of Health Science, Yonsei University
Introduction The medial longitudinal arch (MLA), which is consisted of
several tarsal and metatarsal bones, functions that distributing body weight and absorbing shock during walking (Franco, 1987). It has been generally known that the height of MLA is supported by both abductor hallucis (ABH) and extrinsic muscles (Murley, Menz, & Landorf, 2009; O’Connor & Hamill, 2004; Jung et al., 2011). Insufficient muscular support could lower the MLA when the body weight was applied to foot. Previous studies revealed that the short foot exercise (SFE) is
effective for the people with pronated foot by increasing the height of MLA (Jung et al., 2011). Most of the research related to short foot exercise simply evaluated the efficiency of SFE using the enhanced ABH electromyography (EMG) activation. However, Murley et al. (2009) reported that the people with pronated foot had increased activation of tibialis anterior (TA) and decreased activation of peroneus longus (PL). Since the TA, PL and ABH are all involved in supporting MLA, the new experiment design examined the EMG of selected muscles during SFE should be conducted for clarify the effect of SFE. Therefore, we examined a modified short foot exercise
(MSFE) with three different ankle joint angles to optimize the involvement of the foot extrinsic muscles together with ABH. The purpose of this study was to clarify the effect of MSFE on MLA angle and activation of both intrinsic and extrinsic muscles, and to determine the best condition for a pronated foot. Materials and methods Study design: This study was an experimental study to
compare the influence of different ankle position to the activation of arch support muscles and the angle of MLA.
Participants: In this study, twenty healthy subjects (8 males; 12 females; age=22.3, height=167.8, mass=61.4, passive DF ROM=35.12, passive PF ROM=47.89) with normal feet were recruited from the local University.
Measurement: We used the Surface EMG (Noraxon TeleMyo DTS, Noraxon Inc., Scottsdale, AZ, USA) to collect muscle activation data of TA, PL, and ABH. The EMG data were analyzed using the Noraxon MyoResearch 1.06 software (Noraxon Inc., Scottsdale, AXZ, USA). While conducting SFE, the alternation of MLA angle was recorded by the personal camera (Sony a500, Sony Korea, Seoul, South Korea), and calculated using ImageJ software. Myo U6 was used to clarify the location of ABH not for measurement.
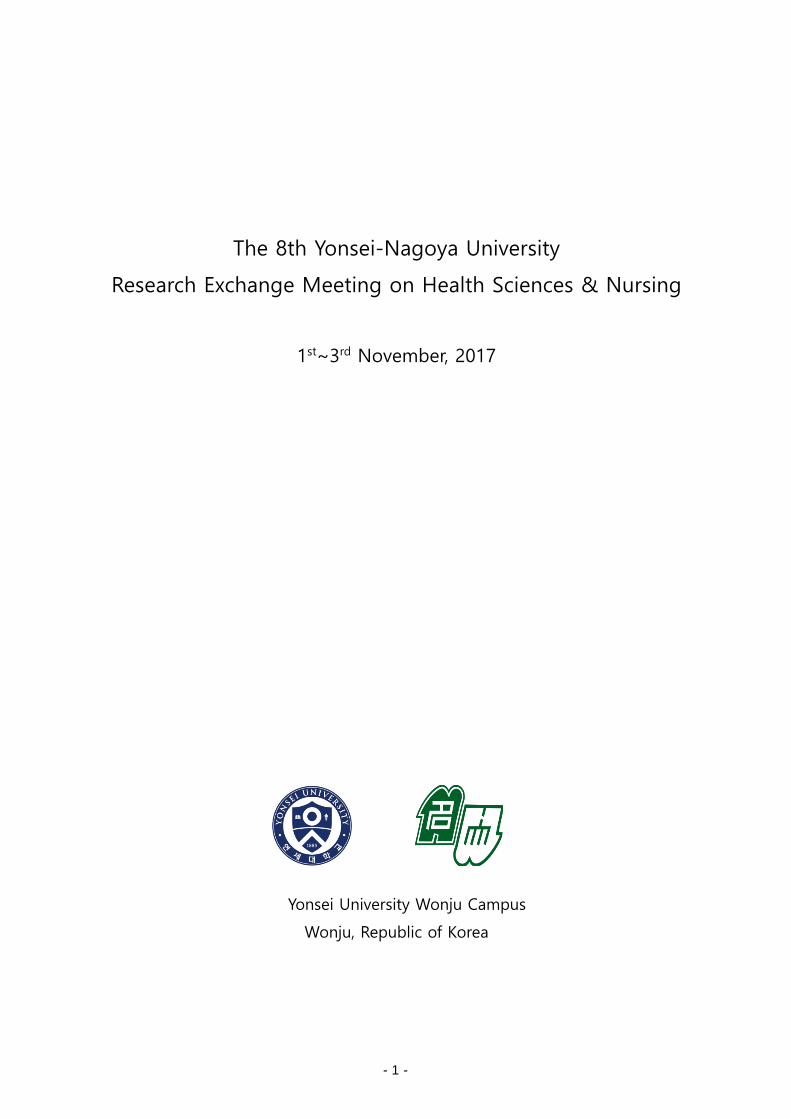
Procedure: The subjects performed MSFE in sitting at three different ankle positions [neutral (NL), dorsiflexion (DF) at
30º, and plantar flexion (PF) at 30º] (Figure 1.). During each MSFE, we measured the activity of the TA, PL and ABH and the angle of MLA. The three reflective markers were attached on navicular tuberosity, the medial aspect of the first metatarsal head, and the medial side of the calcaneal bone. When conducting SFE, the height of middle marker increased and the distance between markers located in both ends decreased, so the increased height of MLA had the common mean with the decreased angle of MLA. Subtracting values in
angle of MLA between resting position and during SFE position compared among the ankle position. Data analysis: within subject one-way repeated ANOVA was used to analyze the collected EMG data and angle of MLA.
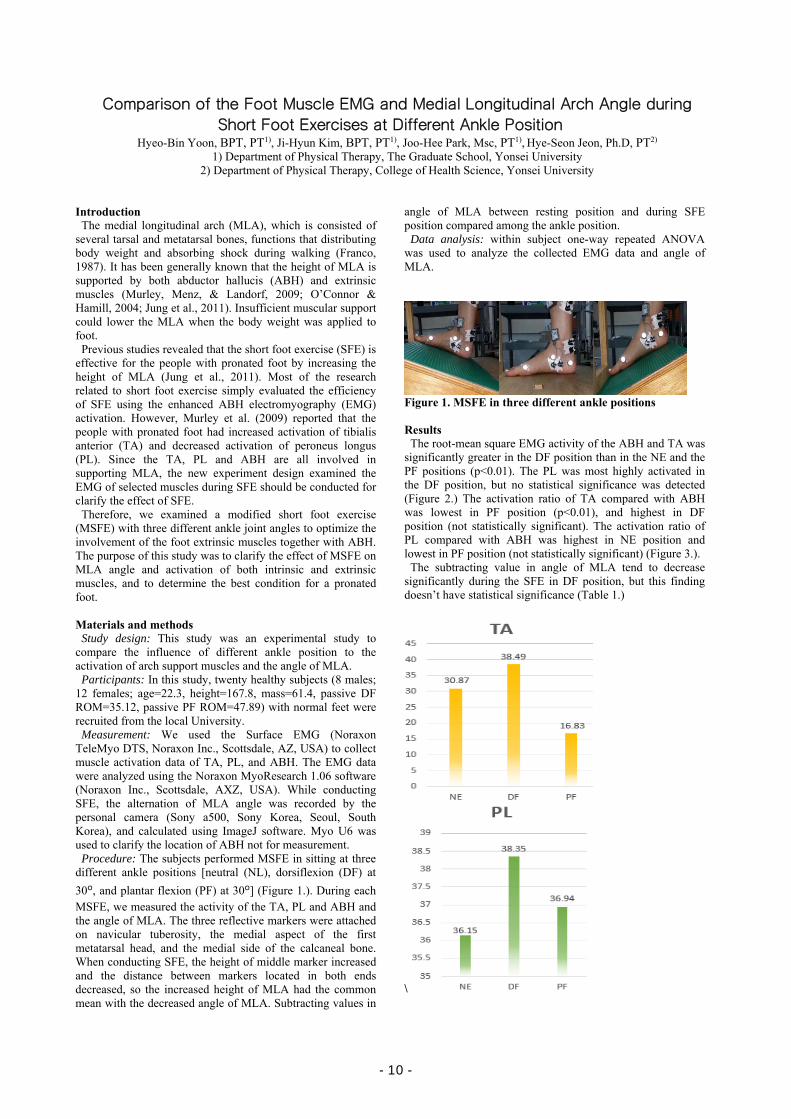
Figure 1. MSFE in three different ankle positions Results The root-mean square EMG activity of the ABH and TA was significantly greater in the DF position than in the NE and the PF positions (p<0.01). The PL was most highly activated in the DF position, but no statistical significance was detected (Figure 2.) The activation ratio of TA compared with ABH was lowest in PF position (p<0.01), and highest in DF position (not statistically significant). The activation ratio of PL compared with ABH was highest in NE position and lowest in PF position (not statistically significant) (Figure 3.). The subtracting value in angle of MLA tend to decrease significantly during the SFE in DF position, but this finding doesn’t have statistical significance (Table 1.)
\
- 10 -
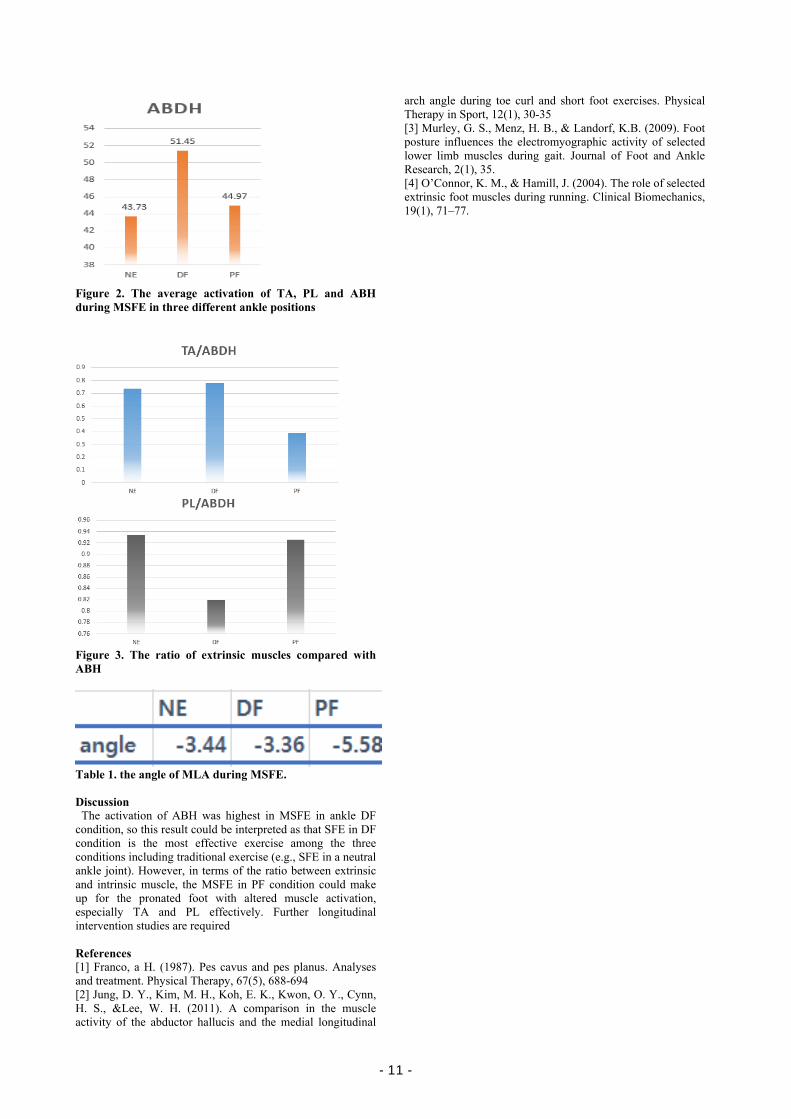
Figure 2. The average activation of TA, PL and ABH during MSFE in three different ankle positions
Figure 3. The ratio of extrinsic muscles compared with ABH
Table 1. the angle of MLA during MSFE. Discussion The activation of ABH was highest in MSFE in ankle DF
condition, so this result could be interpreted as that SFE in DF condition is the most effective exercise among the three conditions including traditional exercise (e.g., SFE in a neutral ankle joint). However, in terms of the ratio between extrinsic and intrinsic muscle, the MSFE in PF condition could make up for the pronated foot with altered muscle activation, especially TA and PL effectively. Further longitudinal intervention studies are required References [1] Franco, a H. (1987). Pes cavus and pes planus. Analyses and treatment. Physical Therapy, 67(5), 688-694 [2] Jung, D. Y., Kim, M. H., Koh, E. K., Kwon, O. Y., Cynn, H. S., &Lee, W. H. (2011). A comparison in the muscle activity of the abductor hallucis and the medial longitudinal
arch angle during toe curl and short foot exercises. Physical Therapy in Sport, 12(1), 30-35 [3] Murley, G. S., Menz, H. B., & Landorf, K.B. (2009). Foot posture influences the electromyographic activity of selected lower limb muscles during gait. Journal of Foot and Ankle Research, 2(1), 35. [4] O’Connor, K. M., & Hamill, J. (2004). The role of selected extrinsic foot muscles during running. Clinical Biomechanics, 19(1), 71–77.
- 11 -
The relationship between six-minute walk distance and serum amino acids in elderly people aged 75 or over: A cross-sectional study
Yo Ishimaru1), Hironobu Ashikawa1), Takuji Adachi1), Shota Urano1), Yuko Ueda2), Jun Ueyama2), Sumio. Yamada3) 1. Department of Physical and Occupational Therapy, Graduate School of Medicine, Nagoya University, Nagoya, Japan
2. Department of Pathophysiological Laboratory Sciences, Graduate School of Medicine, Nagoya University, Nagoya, Japan
3. Department Rehabilitation Science, Graduate School of Medicine, Nagoya University, Nagoya, Japan
Introduction
Exercise capacity (EC), defined as maximum amount of
physical exertion that a patient can sustain, is a well-known
prognostic factor in cardiac patients. EC, expressed as
oxygen uptake, is determined mainly by cardiovascular
performance and skeletal muscle metabolism. In particular,
EC is reduced in patients with heart failure (HF) due to
skeletal muscle abnormalities such as impaired energy
metabolism, fiber type transition and atrophy, as well as
cardiovascular dysfunction.
Numerous studies have demonstrated the effect of amino
acid (AA) supplement on improved EC, although the
evidence in HF has not been well established. An anabolic
effect is considered as a major mechanism of this favorable
effect of AA. Moreover, AA also plays a key role in energy
production as substrates of citric acid cycle1. The citric acid
cycle produces adenosine triphosphate by using various AAs
in addition to branched chain amino acids. Yet, previous
studies to address the effect of AA have mainly focused on
branched chain amino acid because of its close relationship
with protein synthesis. Therefore, there is a lack of evidence
on the relationship between EC and detailed AA profile.
We hypothesized that AA profile is related to EC in HF
patients via energy metabolism, as well as muscle protein
synthesis. In this preliminary study, we examined the
relationship between EC and AA profile in healthy
community-dwelling elderly people aged 75 or over using
metabolome analysis.
Methods
Study design and subjects
This cross-sectional study was performed as a secondary
study of a prospective cohort study undertaken by our
laboratory. The inclusion criterion of the main cohort study is
community-dwelling elderly people aged 75 or over. The
study protocol was approved by the Ethics Committee of the
School of Health Sciences, Nagoya University (approval
number: 2012-0131). This secondary study was also
approved by the Ethics Committee of the School of Health
Sciences, Nagoya University (approval number: 16-509).
The subjects who participated in follow-up survey in 2015
were enrolled into the present study. The subjects with some
missing data were excluded.
Measurement of six-minute walk distance
We assessed six-minute walk distance (6MWD) as an
indicator of EC. Preparations and procedures were conducted
in accordance with the guidelines of American Thoracic
Society. Participants were asked to walk as long as possible
in six minutes. Walking aids were used if the participants
normally required these for daily walking.
Measurement of serum amino acids
Blood samples were collected to measure the AA
(essential amino acid; EAA, non- essential amino acid;
NEAA, and other amino acids); 250µL was drawn from the
serum obtained by centrifugation, and stored at -80℃ until
analysis.
Measurement of the AA was performed using liquid
chromatography–mass spectrometry (LC-MS) coupled with
amino acid mixture standard solution type AN-Ⅱ and type B.
LC-MS analysis was run on an Agilent 1200 infinity LC
coupled with an Agilent 6430 Triple Quadrupole LC/MS
System (Agilent Technologies, Inc., Santa Clara, CA, USA).
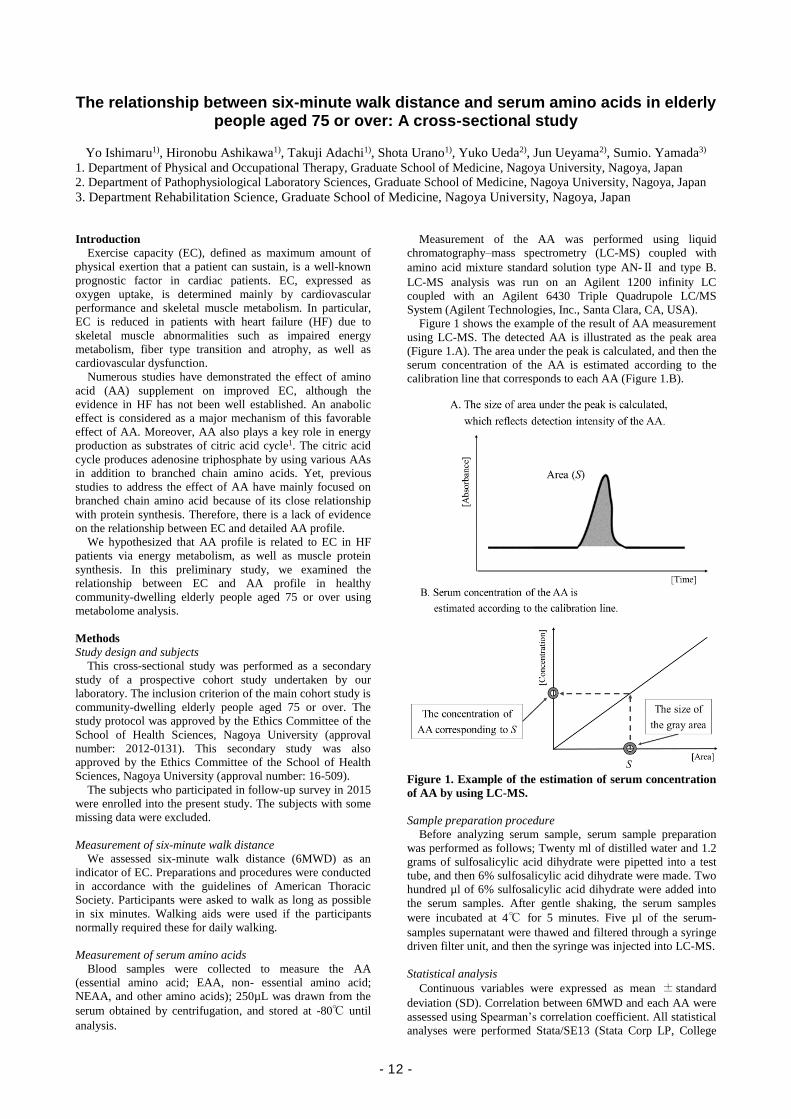
Figure 1 shows the example of the result of AA measurement
using LC-MS. The detected AA is illustrated as the peak area
(Figure 1.A). The area under the peak is calculated, and then the
serum concentration of the AA is estimated according to the
calibration line that corresponds to each AA (Figure 1.B).
Figure 1. Example of the estimation of serum concentration
of AA by using LC-MS.
Sample preparation procedure
Before analyzing serum sample, serum sample preparation
was performed as follows; Twenty ml of distilled water and 1.2
grams of sulfosalicylic acid dihydrate were pipetted into a test
tube, and then 6% sulfosalicylic acid dihydrate were made. Two
hundred µl of 6% sulfosalicylic acid dihydrate were added into
the serum samples. After gentle shaking, the serum samples
were incubated at 4℃ for 5 minutes. Five µl of the serum-
samples supernatant were thawed and filtered through a syringe
driven filter unit, and then the syringe was injected into LC-MS.
Statistical analysis
Continuous variables were expressed as mean ± standard
deviation (SD). Correlation between 6MWD and each AA were
assessed using Spearman’s correlation coefficient. All statistical
analyses were performed Stata/SE13 (Stata Corp LP, College
- 12 -
Station, TX, USA), and P value <0.05 was regarded as
statistically significant.
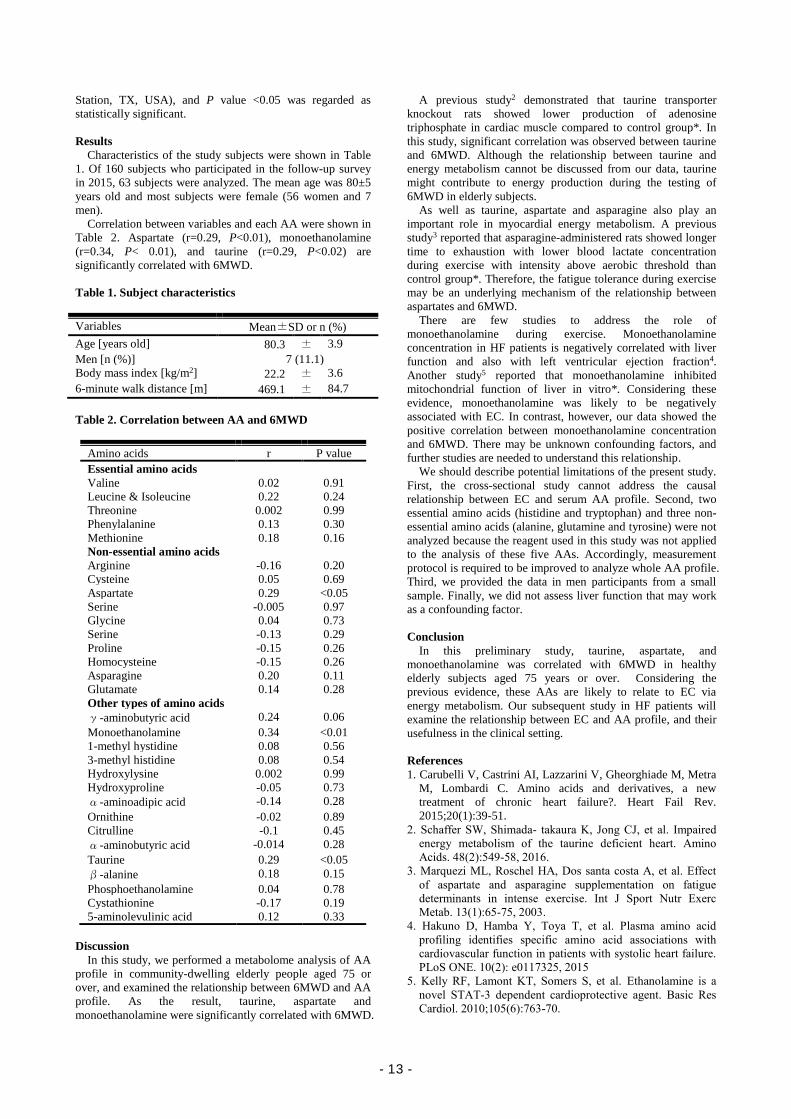
Results
Characteristics of the study subjects were shown in Table
1. Of 160 subjects who participated in the follow-up survey
in 2015, 63 subjects were analyzed. The mean age was 80±5
years old and most subjects were female (56 women and 7
men).
Correlation between variables and each AA were shown in
Table 2. Aspartate (r=0.29, P<0.01), monoethanolamine
(r=0.34, P< 0.01), and taurine (r=0.29, P<0.02) are
significantly correlated with 6MWD.
Table 1. Subject characteristics
Variables Mean±SD or n (%)
Age [years old] 80.3 ± 3.9
Men [n (%)] 7 (11.1)
Body mass index [kg/m2] 22.2 ± 3.6
6-minute walk distance [m] 469.1 ± 84.7
Table 2. Correlation between AA and 6MWD
Amino acids r P value
Essential amino acids
Valine 0.02 0.91
Leucine & Isoleucine 0.22 0.24
Threonine 0.002 0.99
Phenylalanine 0.13 0.30
Methionine 0.18 0.16
Non-essential amino acids
Arginine -0.16 0.20
Cysteine 0.05 0.69
Aspartate 0.29 <0.05
Serine -0.005 0.97
Glycine 0.04 0.73
Serine -0.13 0.29
Proline -0.15 0.26
Homocysteine -0.15 0.26
Asparagine 0.20 0.11
Glutamate 0.14 0.28
Other types of amino acids
γ-aminobutyric acid 0.24 0.06
Monoethanolamine 0.34 <0.01
1-methyl hystidine 0.08 0.56
3-methyl histidine 0.08 0.54
Hydroxylysine 0.002 0.99
Hydroxyproline -0.05 0.73
α-aminoadipic acid -0.14 0.28
Ornithine -0.02 0.89
Citrulline -0.1 0.45
α-aminobutyric acid -0.014 0.28
Taurine 0.29 <0.05
β-alanine 0.18 0.15
Phosphoethanolamine 0.04 0.78
Cystathionine -0.17 0.19
5-aminolevulinic acid 0.12 0.33
Discussion
In this study, we performed a metabolome analysis of AA
profile in community-dwelling elderly people aged 75 or
over, and examined the relationship between 6MWD and AA
profile. As the result, taurine, aspartate and
monoethanolamine were significantly correlated with 6MWD.
A previous study2 demonstrated that taurine transporter
knockout rats showed lower production of adenosine
triphosphate in cardiac muscle compared to control group*. In
this study, significant correlation was observed between taurine
and 6MWD. Although the relationship between taurine and
energy metabolism cannot be discussed from our data, taurine
might contribute to energy production during the testing of
6MWD in elderly subjects.
As well as taurine, aspartate and asparagine also play an
important role in myocardial energy metabolism. A previous
study3 reported that asparagine-administered rats showed longer
time to exhaustion with lower blood lactate concentration
during exercise with intensity above aerobic threshold than
control group*. Therefore, the fatigue tolerance during exercise
may be an underlying mechanism of the relationship between
aspartates and 6MWD.
There are few studies to address the role of
monoethanolamine during exercise. Monoethanolamine
concentration in HF patients is negatively correlated with liver
function and also with left ventricular ejection fraction4.
Another study5 reported that monoethanolamine inhibited
mitochondrial function of liver in vitro*. Considering these
evidence, monoethanolamine was likely to be negatively
associated with EC. In contrast, however, our data showed the
positive correlation between monoethanolamine concentration
and 6MWD. There may be unknown confounding factors, and
further studies are needed to understand this relationship.
We should describe potential limitations of the present study.
First, the cross-sectional study cannot address the causal
relationship between EC and serum AA profile. Second, two
essential amino acids (histidine and tryptophan) and three non-
essential amino acids (alanine, glutamine and tyrosine) were not
analyzed because the reagent used in this study was not applied
to the analysis of these five AAs. Accordingly, measurement
protocol is required to be improved to analyze whole AA profile.
Third, we provided the data in men participants from a small
sample. Finally, we did not assess liver function that may work
as a confounding factor.
Conclusion
In this preliminary study, taurine, aspartate, and
monoethanolamine was correlated with 6MWD in healthy
elderly subjects aged 75 years or over. Considering the
previous evidence, these AAs are likely to relate to EC via
energy metabolism. Our subsequent study in HF patients will
examine the relationship between EC and AA profile, and their
usefulness in the clinical setting.
References
1. Carubelli V, Castrini AI, Lazzarini V, Gheorghiade M, Metra
M, Lombardi C. Amino acids and derivatives, a new
treatment of chronic heart failure?. Heart Fail Rev.
2015;20(1):39-51.
2. Schaffer SW, Shimada- takaura K, Jong CJ, et al. Impaired
energy metabolism of the taurine deficient heart. Amino
Acids. 48(2):549-58, 2016.
3. Marquezi ML, Roschel HA, Dos santa costa A, et al. Effect
of aspartate and asparagine supplementation on fatigue
determinants in intense exercise. Int J Sport Nutr Exerc
Metab. 13(1):65-75, 2003.
4. Hakuno D, Hamba Y, Toya T, et al. Plasma amino acid
profiling identifies specific amino acid associations with
cardiovascular function in patients with systolic heart failure.
PLoS ONE. 10(2): e0117325, 2015
5. Kelly RF, Lamont KT, Somers S, et al. Ethanolamine is a
novel STAT-3 dependent cardioprotective agent. Basic Res
Cardiol. 2010;105(6):763-70.
- 13 -
Physical Function and Self-Perceived Ability
Related to Life Space Mobility in Community-Dwelling Older People
Y. Tsuchida1), S. Nakashima1), T. Ito2), Y. Uchiyama1)
1)1) Department of Physical Therapy, School of Health Sciences, Nagoya University, Nagoya, Japan
2)General Center of Rehabilitation in Syutaikai Hospital, Mie, Japan
Introduction
Life space mobility is the important conception as older
people to maintain and expand activity. It may represents
physical function, cognition, psychological function, physical
actibity and participation. It is known that Life Space
Assessment(LSA) is an one of the validitive index for the
older people[1]. Scores on the LSA range from 0 to 120, with
higher scores reflecting greater life-space. Researchers ask
subjects frequency of movement (how many days within a
week) and necessity of any aid, equipment or help from other
people during the 4 weeks prior to assessment for five
different life-space levels. Recentry several studies have
showed relationships between LSA and kinds of risks:
Alzheimer disease[2], frailty[3], mortality[4] and other
problems. Futhermore, the correlation between LSA and a lot
of functions such as cognition, depression, muscle strength,
gait speed and other functions have been reported[1][5].
In addition, it is known that not only actual physical
function but also self-perceived ability decline for aging. The
difference value between actual physical function and self-
perceived ability is called estimation errors. Robinovitch and
Cronin reported a tendency for older people to over-estimate,
and young people to under-estimate their reaching ability[6].
Fujimoto et al showed the relationship between fall and over-
estimation of their step ability[7]. The same result was
reported on step-over ability by Sakurai et al[8]. It is
important for actibities and participations of older people to
intervene in not only actual physical function but also
estimation errors.
The purpose of this study was to investigate factors of life
space mobility in community-dwelling older people in terms
of physical function and self-perceived ability.
Materials and Methods
Subjects: The total number of subjects were 39 community-
dwelling older people. We included older people received the
certificate of long-term care needs. Long-term care was
formal insurance system in Japan. Some care services were
available for insured people. We excepted a parson who was
under 65 years old, long-term care level 4&5 and
hospitalized patient.
Measurements: Life space mobility was measured using
Life Space Assessment(LSA). We conducted 4 performance
tests: Obstacle Single Leg Forward Step test (OSFS), 2 steps
test, Functional Reach test(FRT) and 30s Chair Stand test
(CST). In OSFS, subjects stepped forward while stepping
over an obstacle which the height was 10cm and returned to
original place while stepping over an obstacle and repeated
this process five times, as fast as possible. We measured total
time. In 2 steps test, subjects took two steps as large as
possible. In FRT, subjects performed maximum reach. In
CST, we measured the times subjects were enabled to stand
up from a chair for 30 seconds. These perforamnce tests were
used to assess actual physical function and self-perceived
ability. The ratio of self-estimated to actual was used for data
analysis as a measurement of estimation errors. Other
measurements included Mini-Mental State
Examination(MMSE), Fall Efficacy Scale(FES), Short Form of
Geriatric Depression Scale(GDS-5), the 25-question Geriatric
Locomotive Function Scale(locomo25) and fall experiences.
Statistics analysis: We conducted analysis for extracting
factors of LSA. Simple bivariate correlation coefficients were
used to examine the relationships between LSA scores and all
variables. This analysis was first unadjusted and subsequentry
adjusted for age. Multiple regression by forced entry was used
to determine which physical ability was important for LSA.
We also investigated the characteristics of estimation errors of
physical function related to LSA. We defineded exactry
perception as the ratio of self-estimated to actual was within 97-
103%. And we defineded over-estimation as the ratio was
>103% and under-estimation as the ratio was <97%(only in
OSFS, this definision was reversed). Chi-squared goodness of
fit test was used to analize the deviation of the number of
exactry perception, over-estimation, under-estimation. Simple
bivariate correlation coefficients were used to examine the
relationships between actual physical function and estimation
errors. A probability of 0.05 was considerd statistically
significant.
Results
A mean age of subjects was 76.7±8.0. There were 22 men and
17 women. The number of subjects who had the certification of
long-term care needs were 19. A mean score of LSA was 74.4
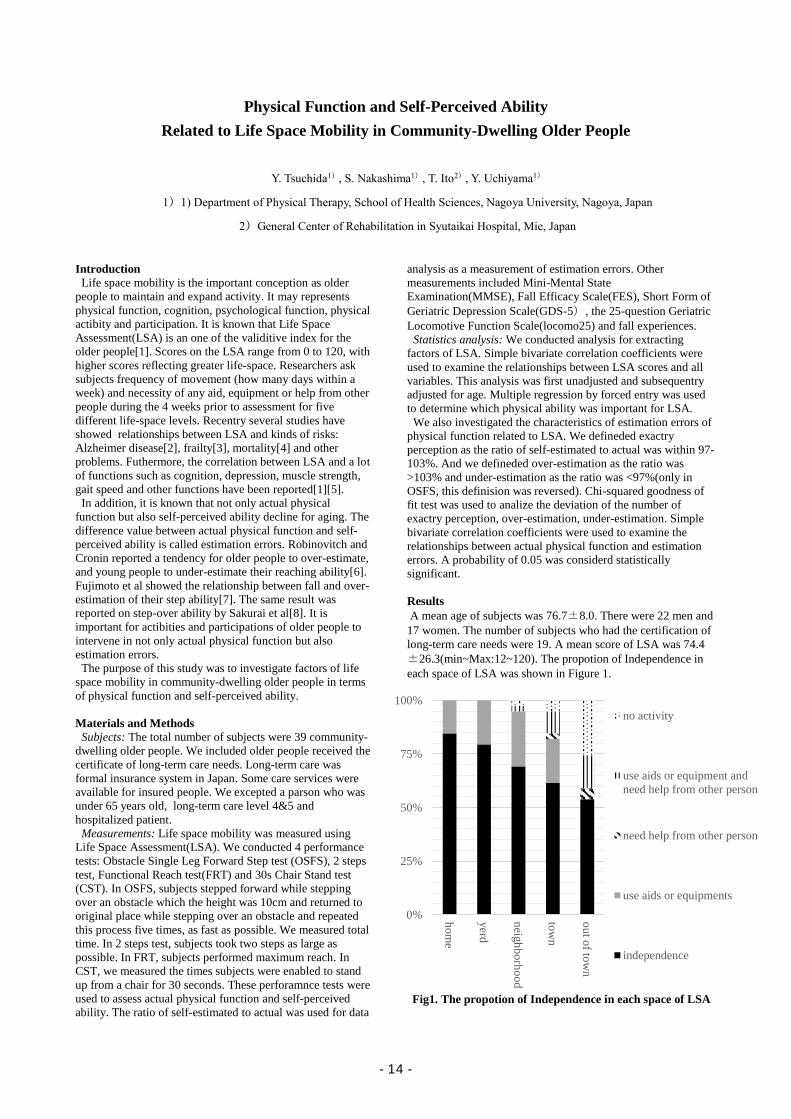
±26.3(min~Max:12~120). The propotion of Independence in
each space of LSA was shown in Figure 1.
Fig1. The propotion of Independence in each space of LSA
0%
25%
50%
75%
100%
ho
me
yerd
neig
hb
orh
oo
d
tow
n
ou
t of to
wn
no activity
use aids or equipment and
need help from other person
need help from other person
use aids or equipments
independence
- 14 -
LSA was siginificant correlated with OSFS(r=-0.473), 2
steps test(0.577), FRT(0.523), CST(0.328), MMSE(0.502),
FES(0.531), GDS-5(-0.341) and locomo25(-0.747) (P<0.05).
When it was caluclated with adjust of age, LSA was
significant correlated with OSFS(r=-0.419), 2steps
test(0.390), FRT(0.354), MMSE(0.366), FES(0.545), GDS-
5(-0.473), locomo25(-0.564)(P<0.05). Multiple regression
analysis suggested significant associations between LSA and
OSFS and 2 steps test(table1).
Table1. Multiple regression analysis of LSA
VIF: Variance Inflation Factor, R2=0.532, P<0.05
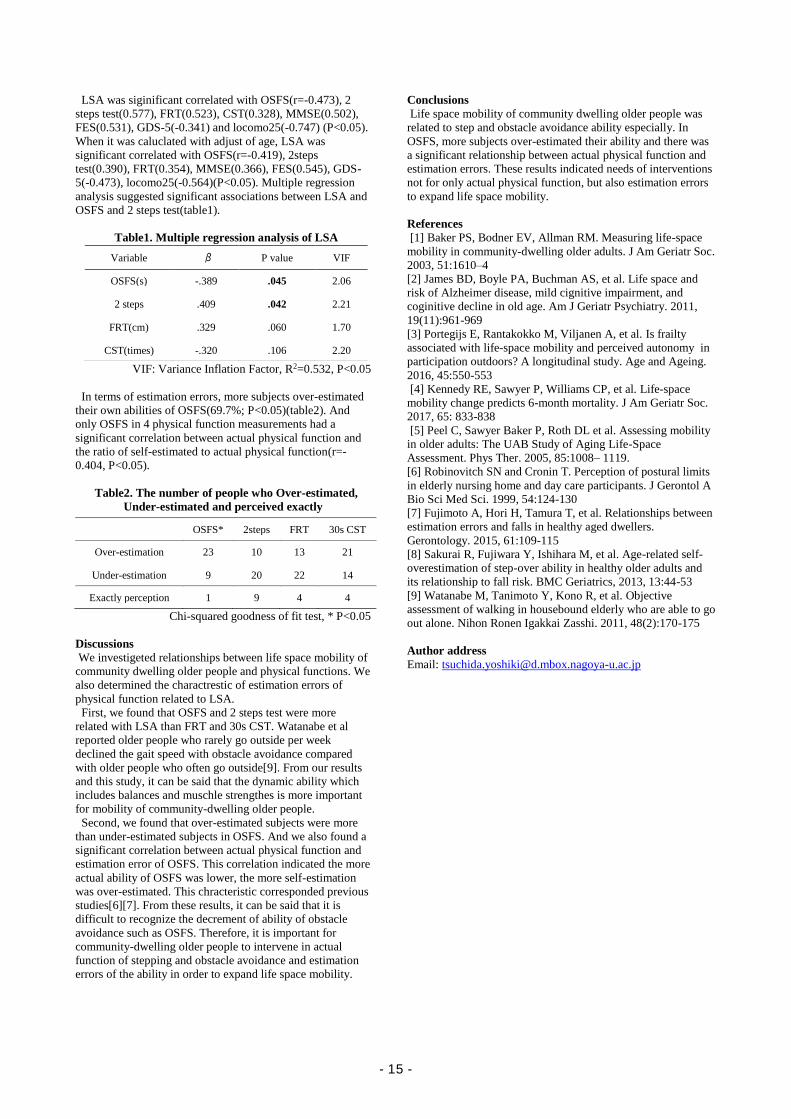
In terms of estimation errors, more subjects over-estimated
their own abilities of OSFS(69.7%; P<0.05)(table2). And
only OSFS in 4 physical function measurements had a
significant correlation between actual physical function and
the ratio of self-estimated to actual physical function(r=-
0.404, P<0.05).
Table2. The number of people who Over-estimated,
Under-estimated and perceived exactly
Chi-squared goodness of fit test, * P<0.05
Discussions
We investigeted relationships between life space mobility of
community dwelling older people and physical functions. We
also determined the charactrestic of estimation errors of
physical function related to LSA.
First, we found that OSFS and 2 steps test were more
related with LSA than FRT and 30s CST. Watanabe et al
reported older people who rarely go outside per week
declined the gait speed with obstacle avoidance compared
with older people who often go outside[9]. From our results
and this study, it can be said that the dynamic ability which
includes balances and muschle strengthes is more important
for mobility of community-dwelling older people.
Second, we found that over-estimated subjects were more
than under-estimated subjects in OSFS. And we also found a
significant correlation between actual physical function and
estimation error of OSFS. This correlation indicated the more
actual ability of OSFS was lower, the more self-estimation
was over-estimated. This chracteristic corresponded previous
studies[6][7]. From these results, it can be said that it is
difficult to recognize the decrement of ability of obstacle
avoidance such as OSFS. Therefore, it is important for
community-dwelling older people to intervene in actual
function of stepping and obstacle avoidance and estimation
errors of the ability in order to expand life space mobility.
Conclusions
Life space mobility of community dwelling older people was
related to step and obstacle avoidance ability especially. In
OSFS, more subjects over-estimated their ability and there was
a significant relationship between actual physical function and
estimation errors. These results indicated needs of interventions
not for only actual physical function, but also estimation errors
to expand life space mobility.
References
[1] Baker PS, Bodner EV, Allman RM. Measuring life-space
mobility in community-dwelling older adults. J Am Geriatr Soc.
2003, 51:1610–4
[2] James BD, Boyle PA, Buchman AS, et al. Life space and
risk of Alzheimer disease, mild cignitive impairment, and
coginitive decline in old age. Am J Geriatr Psychiatry. 2011,
19(11):961-969
[3] Portegijs E, Rantakokko M, Viljanen A, et al. Is frailty
associated with life-space mobility and perceived autonomy in
participation outdoors? A longitudinal study. Age and Ageing.
2016, 45:550-553
[4] Kennedy RE, Sawyer P, Williams CP, et al. Life-space
mobility change predicts 6-month mortality. J Am Geriatr Soc.
2017, 65: 833-838
[5] Peel C, Sawyer Baker P, Roth DL et al. Assessing mobility
in older adults: The UAB Study of Aging Life-Space
Assessment. Phys Ther. 2005, 85:1008– 1119.
[6] Robinovitch SN and Cronin T. Perception of postural limits
in elderly nursing home and day care participants. J Gerontol A
Bio Sci Med Sci. 1999, 54:124-130
[7] Fujimoto A, Hori H, Tamura T, et al. Relationships between
estimation errors and falls in healthy aged dwellers.
Gerontology. 2015, 61:109-115
[8] Sakurai R, Fujiwara Y, Ishihara M, et al. Age-related self-
overestimation of step-over ability in healthy older adults and
its relationship to fall risk. BMC Geriatrics, 2013, 13:44-53
[9] Watanabe M, Tanimoto Y, Kono R, et al. Objective
assessment of walking in housebound elderly who are able to go
out alone. Nihon Ronen Igakkai Zasshi. 2011, 48(2):170-175
Author address
Email: [email protected]
OSFS* 2steps FRT 30s CST
Over-estimation 23 10 13 21
Under-estimation 9 20 22 14
Exactly perception 1 9 4 4
Variable β P value VIF
OSFS(s) -.389 .045 2.06
2 steps .409 .042 2.21
FRT(cm) .329 .060 1.70
CST(times) -.320 .106 2.20
- 15 -
Relationship between body function and structure and activity based on ICF
model with children with cerebral palsy Jongseok. Hwnag, MS, PT
1), Jung-A Lee, PhD
2), Joshua H. You, PhD, PT
3)
1) SportsMovement Artificial-intelligence Robotics Technology(SMART) Institute, Department of Physical Therapy,
Yonsei University, Wonju, Republic of Korea. 2)
Department of Motor & Cognitive Rehabilitation, Korea National Rehabilitation Research Institute, Seoul, Republic of
Korea. 3)
Sports Movement Artificial-intelligence Robotics Technology(SMART) Institute, Department of Physical Therapy, The
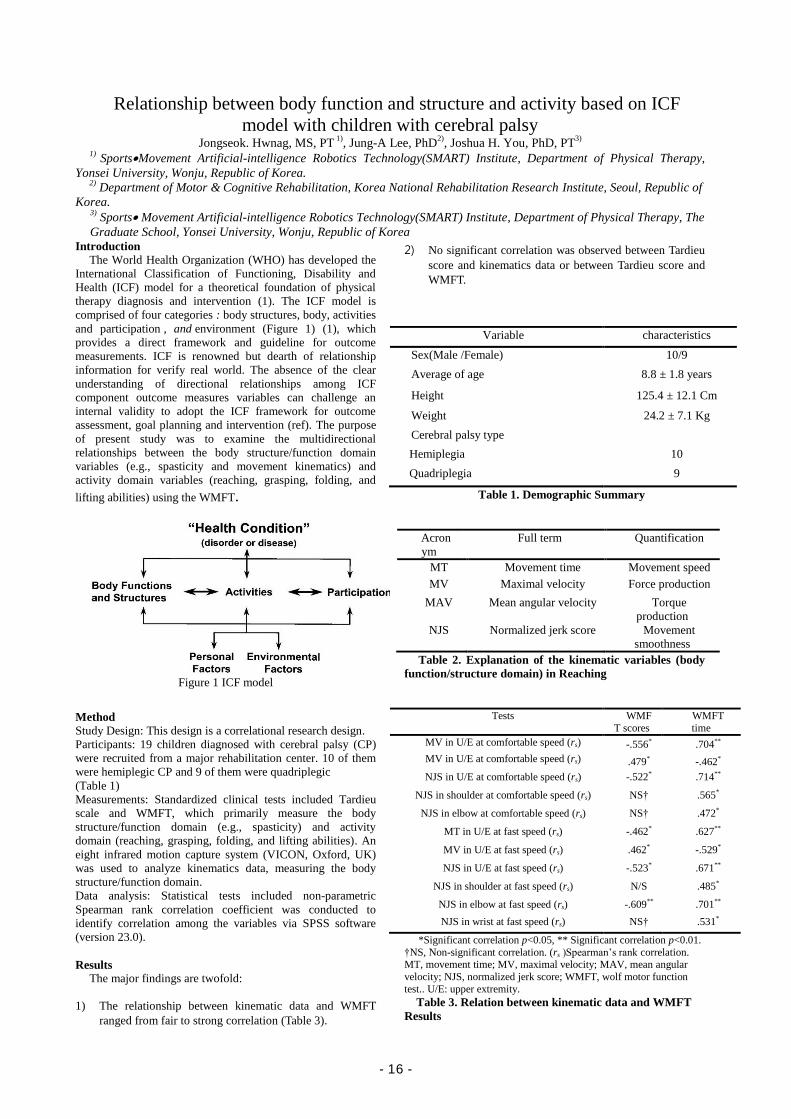
Graduate School, Yonsei University, Wonju, Republic of KoreaIntroduction
The World Health Organization (WHO) has developed the
International Classification of Functioning, Disability and
Health (ICF) model for a theoretical foundation of physical
therapy diagnosis and intervention (1). The ICF model is
comprised of four categories : body structures, body, activities
and participation , and environment (Figure 1) (1), which
provides a direct framework and guideline for outcome
measurements. ICF is renowned but dearth of relationship
information for verify real world. The absence of the clear
understanding of directional relationships among ICF
component outcome measures variables can challenge an
internal validity to adopt the ICF framework for outcome
assessment, goal planning and intervention (ref). The purpose
of present study was to examine the multidirectional
relationships between the body structure/function domain
variables (e.g., spasticity and movement kinematics) and
activity domain variables (reaching, grasping, folding, and
lifting abilities) using the WMFT.
Figure 1 ICF model
Method
Study Design: This design is a correlational research design.
Participants: 19 children diagnosed with cerebral palsy (CP)
were recruited from a major rehabilitation center. 10 of them
were hemiplegic CP and 9 of them were quadriplegic
(Table 1)
Measurements: Standardized clinical tests included Tardieu
scale and WMFT, which primarily measure the body
structure/function domain (e.g., spasticity) and activity
domain (reaching, grasping, folding, and lifting abilities). An
eight infrared motion capture system (VICON, Oxford, UK)
was used to analyze kinematics data, measuring the body
structure/function domain.
Data analysis: Statistical tests included non-parametric
Spearman rank correlation coefficient was conducted to
identify correlation among the variables via SPSS software
(version 23.0).
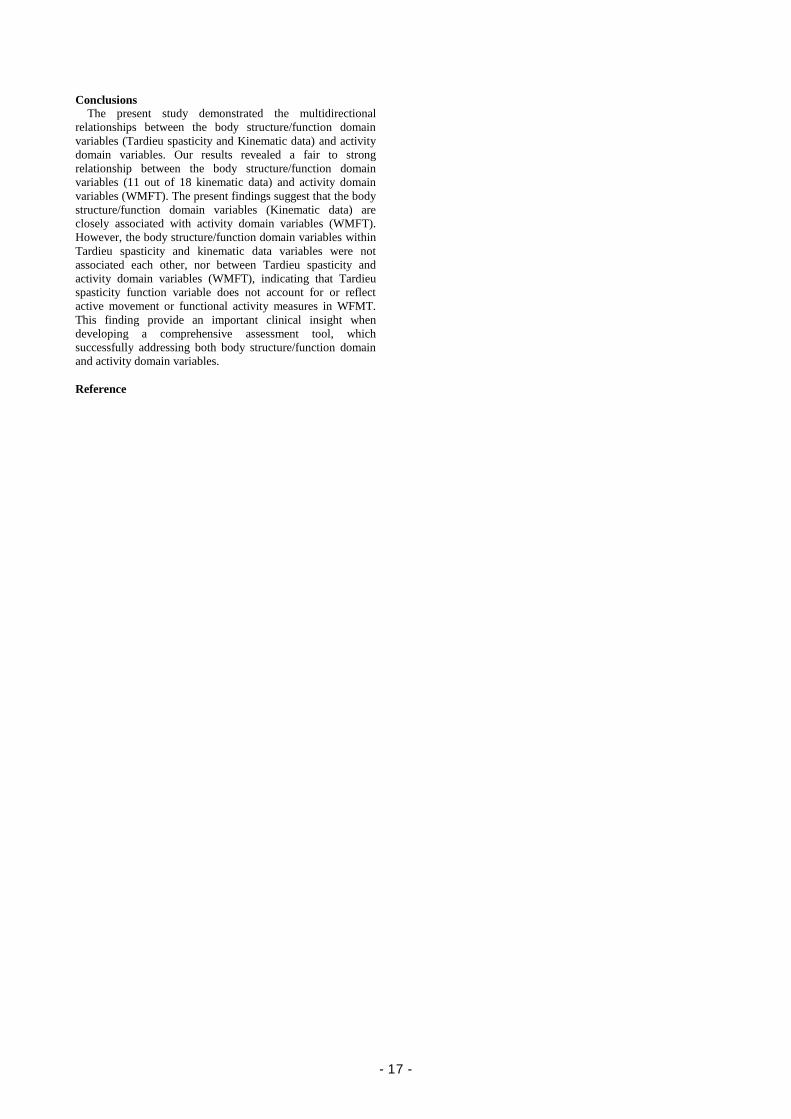
Results
The major findings are twofold:
1) The relationship between kinematic data and WMFT
ranged from fair to strong correlation (Table 3).
2) No significant correlation was observed between Tardieu
score and kinematics data or between Tardieu score and
WMFT.
Variable characteristics
Sex(Male /Female) 10/9
Average of age 8.8 ± 1.8 years
Height 125.4 ± 12.1 Cm
Weight 24.2 ± 7.1 Kg
Cerebral palsy type
Hemiplegia 10
Quadriplegia 9
Table 1. Demographic Summary
Acron
ym
Full term Quantification
MT Movement time Movement speed
MV Maximal velocity Force production
MAV Mean angular velocity Torque
production
NJS Normalized jerk score Movement
smoothness
Table 2. Explanation of the kinematic variables (body
function/structure domain) in Reaching
Tests WMF
T scores
WMFT
time
MV in U/E at comfortable speed (rs) -.556* .704**
MV in U/E at comfortable speed (rs) .479* -.462*
NJS in U/E at comfortable speed (rs) -.522* .714**
NJS in shoulder at comfortable speed (rs) NS† .565*
NJS in elbow at comfortable speed (rs) NS† .472*
MT in U/E at fast speed (rs) -.462* .627**
MV in U/E at fast speed (rs) .462* -.529*
NJS in U/E at fast speed (rs) -.523* .671**
NJS in shoulder at fast speed (rs) N/S .485*
NJS in elbow at fast speed (rs) -.609** .701**
NJS in wrist at fast speed (rs) NS† .531*
*Significant correlation p<0.05, ** Significant correlation p<0.01.
†NS, Non-significant correlation. (rs )Spearman’s rank correlation. MT, movement time; MV, maximal velocity; MAV, mean angular
velocity; NJS, normalized jerk score; WMFT, wolf motor function
test.. U/E: upper extremity.
Table 3. Relation between kinematic data and WMFT
Results
- 16 -
Conclusions
The present study demonstrated the multidirectional
relationships between the body structure/function domain
variables (Tardieu spasticity and Kinematic data) and activity
domain variables. Our results revealed a fair to strong
relationship between the body structure/function domain
variables (11 out of 18 kinematic data) and activity domain
variables (WMFT). The present findings suggest that the body
structure/function domain variables (Kinematic data) are
closely associated with activity domain variables (WMFT).
However, the body structure/function domain variables within
Tardieu spasticity and kinematic data variables were not
associated each other, nor between Tardieu spasticity and
activity domain variables (WMFT), indicating that Tardieu
spasticity function variable does not account for or reflect
active movement or functional activity measures in WFMT.
This finding provide an important clinical insight when
developing a comprehensive assessment tool, which
successfully addressing both body structure/function domain
and activity domain variables.
Reference
- 17 -
Comparison of shoulder strength in males with and without myofascial trigger points in the upper trapezius
Hyun-a Kim, MS, PT1), Ui-jae Hwang, PhD, PT1), Sung-hoon Jung, BPT, PT1),, Sun-hee Ahn , MS, PT1), Jun-hee Kim , BPT, PT1), Oh-yun Kwon, PhD, PT 2)
1) Dept. of Physical Therapy, The Graduate School, Yonsei University
2) Department of Physical Therapy, College of Health Science, Laboratory of Kinetic Ergocise Based on Movement Analysis, Yonsei University
Introduction
Overuse of the upper trapezius (UT) muscle during shoulder movements can interfere with scapular alignment and the movement pattern can lead to specific errors in choosing an appropriate movement strategy (Arlotta et al., 2011).
Pain and tenderness in the UT due to increased muscle tension cause complaints in individuals with chronic neck and shoulder problems (Leong et al., 2013). It may lead to involuntary shortening, insufficient nutrient supply, and metabolic demand on local tissues (Gerwin et al., 2004; Ruiz-Sáez et al., 2007).
There are many studies about causes of UT pain. Ge, et al. (2014) demonstrated that intermuscular muscle activity of latent MTPs increased significantly in the UT muscle compared with non-MTPs during 90° shoulder abduction and at rest due to overloading of the UT muscle (Ge et al., 2014).
However, Naef et al. (2014) demonstrated that subjects with chronic shoulder pain showed no difference from healthy subjects in arm abduction maximal strength or recruitment patterns of the serratus anterior, middle deltoid, and UT (Naef et al., 2015). However, no reported study has demonstrated maximum isometric shoulder abductor without synergistic action.
The aim of this study was to compare scapular elevator and shoulder abductor strength with and without restricted scapular elevation in male subjects with and without UT pain.
Materials and methods
Study design: This study was an experimental study to compare the strength of scapular elevator and shoulder abductor with and without restricted scapular elevation between male subjects with and without myofascial trigger points in the upper trapezius .
Participants: In total, 15 subjects with MTP in UT and 15 age- and weight-matched subjects without MTP in UT were enrolled.
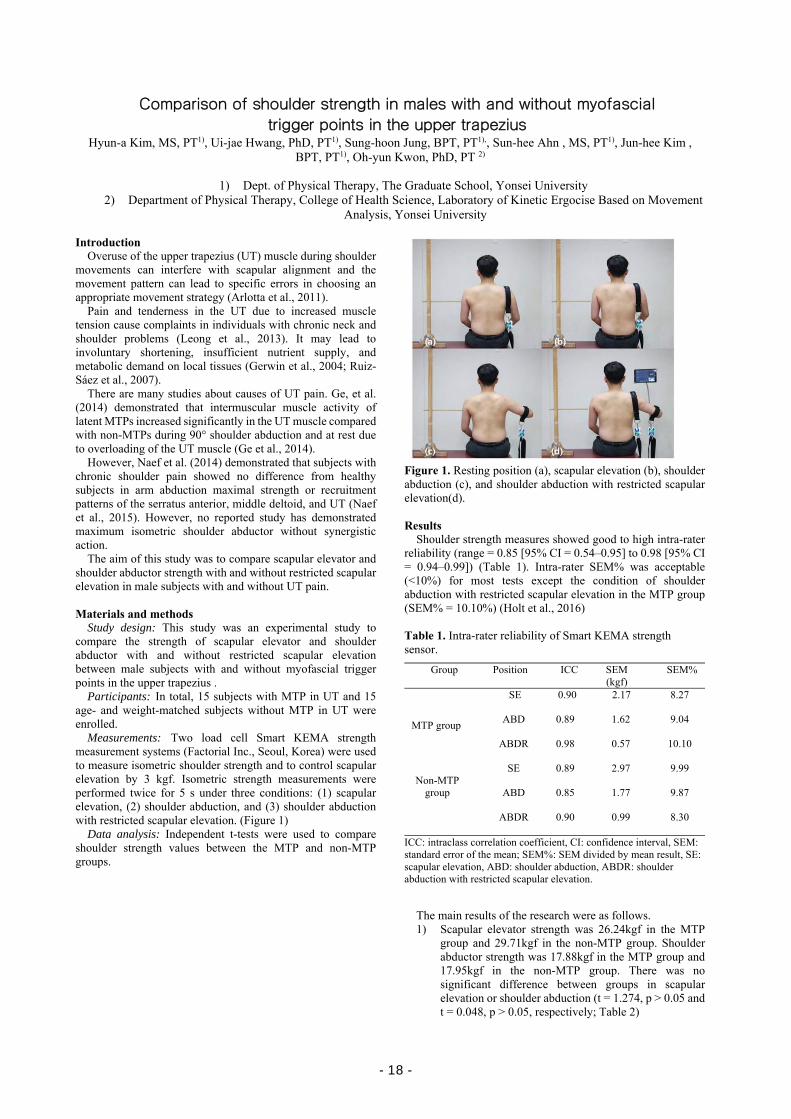
Measurements: Two load cell Smart KEMA strength measurement systems (Factorial Inc., Seoul, Korea) were used to measure isometric shoulder strength and to control scapular elevation by 3 kgf. Isometric strength measurements were performed twice for 5 s under three conditions: (1) scapular elevation, (2) shoulder abduction, and (3) shoulder abduction with restricted scapular elevation. (Figure 1)
Data analysis: Independent t-tests were used to compare shoulder strength values between the MTP and non-MTP groups.
Figure 1. Resting position (a), scapular elevation (b), shoulder abduction (c), and shoulder abduction with restricted scapular elevation(d). Results
Shoulder strength measures showed good to high intra-rater reliability (range = 0.85 [95% CI = 0.54–0.95] to 0.98 [95% CI = 0.94–0.99]) (Table 1). Intra-rater SEM% was acceptable (<10%) for most tests except the condition of shoulder abduction with restricted scapular elevation in the MTP group (SEM% = 10.10%) (Holt et al., 2016)
Table 1. Intra-rater reliability of Smart KEMA strength sensor.
Group Position ICC SEM (kgf)
SEM%
MTP group
SE 0.90 2.17 8.27
ABD 0.89 1.62 9.04
ABDR 0.98 0.57 10.10
Non-MTP
group
SE 0.89 2.97 9.99
ABD 0.85 1.77 9.87
ABDR 0.90 0.99 8.30
ICC: intraclass correlation coefficient, CI: confidence interval, SEM: standard error of the mean; SEM%: SEM divided by mean result, SE: scapular elevation, ABD: shoulder abduction, ABDR: shoulder abduction with restricted scapular elevation.
The main results of the research were as follows. 1) Scapular elevator strength was 26.24kgf in the MTP
group and 29.71kgf in the non-MTP group. Shoulder abductor strength was 17.88kgf in the MTP group and 17.95kgf in the non-MTP group. There was no significant difference between groups in scapular elevation or shoulder abduction (t = 1.274, p > 0.05 and t = 0.048, p > 0.05, respectively; Table 2)
- 18 -
2) However, the results showed that shoulder abductor strength in the group with MTP (5.64 kgf) was significantly lower than in the group without MTP (11.96 kgf) when scapular elevation was restricted (p < 0.05; Table 2).
Table 2. Shoulder strengths in three conditions (n=30)
Parameter MTP
group
Non
MTP group t p
SE
26.24 (6.42)
29.71 (8.38)
1.274 0.213
ABD 17.88 (4.53)
17.95 (4.22)
0.048 0.962
ABDR 5.64
(3.99)
11.96 (3.02)
4.894 0.000*
Values are means (SD), MTP: group with myofascial trigger points, Non-MTP group: group without myofascial trigger points, SE: scapular elevator, ABD: shoulder abductor, ABDS: shoulder abductor with restricted scapular elevation. *Significant difference at p<0.05.
Discussion
The main finding of this study was that there was no significant difference in strength of the scapular elevator and shoulder abductor without restricted scapular elevation between males with and without MTPs in the UT. However, shoulder abductor strength was significantly lower in the MTP group than in the non-MTP group when scapular elevation was restricted.
Many studies have investigated shoulder strength and the UT. However, few studies have compared the strength of the scapular elevator between individuals with and without MTPs in the UT. Thus, we measured the strength of scapular elevators between groups with and without MTPs to determine the effect on UT strength of MTPs in the UT. However, we found no significant difference between the groups (MTP: 26.24kgf; non-MTP: 29.71kgf). Thus, we postulated that UT strength does not directly cause MTP.
Many studies have used a convenient and lightweight hand-held dynamometer (HHD) to measure the strength of the scapular elevator and shoulder abductor (Michener et al., 2005). However, previous studies also determined that above 120 N, the force measured with a HHD could be affected by tester strength and that the intraexaminer reliability of HHDs was not acceptable for shoulder measurement (Schrama et al., 2014). Thus, we measured scapular elevator and shoulder abductor strength using a convenient and lightweight Smart KEMA measurement strength system that can measure the subjects’ own strength by Make tests (ICC > 0.85).
Shoulder abductor strength was measured to compare strength between individuals with and without UT pain. When subjects performed maximal isometric shoulder abduction without restricted scapular movement, both groups had similar strength values (MTP = 17.88kgf; non-MTP = 17.95kgf); however, the strength values of the shoulder abduction were significantly lower in the MTP group (5.64kgf) than in the non-MTP group (11.96kgf) with restricted scapular movement. It was shown that prime mover strength in shoulder abduction was lower in the MTP group than in the non-MTP group when the synergistic muscle was restricted.
Sharrman (2002) explained the dominance of the UT by modular element impairment in the nervous system. This is
the case where people have complaints or pain in the UT despite having strong muscles. It is important to teach patients to control delicate movements by conscious effort rather than by increasing their muscle bulk (Sahrmann, 2002). The results of this study showed that weakness of shoulder abductor with restricted scapular elevation may be one cause of MTPs in the UT. Conclusion
In conclusion, we demonstrated that there was no difference in strength of the scapular elevator and shoulder abductor between males with and without MTPs in the UT. However, when scapular elevation was restricted, shoulder abductor strength was significantly lower in the MTP group than in the non-MTP group. We suggest that overuse of the UT can cause MTP by compensatory movements in shoulder abduction. Clinicians should evaluate strength of the shoulder abductor with restricted scapular elevation and apply interventions to adjust individuals’ exercises by conscious effort rather than intervention to increase muscle volume when assessing individuals with MTPs.
References [1] Arlotta M, LoVasc, G, McLea L, Selective recruitment of
the lower fibers of the trapezius muscle. Journal of Electromyography and Kinesiology. 2011; 21(3), 403-410.
[2] Ge HY, Monterde S, Graven-Nielsen T, et al. Latent myofascial trigger points are associated with an increased intramuscular electromyographic activity during synergistic muscle activation. The journal of pain. 2014; 15(2), 181-187.
[3] Gerwin RD, Dommerholt J, Shah JP. An expansion of Simons’ integrated hypothesis of trigger point formation. Current pain and headache reports. 2004; 8(6), 468-475.
[4] Holt KL, Raper DP, Boettcher CE, et al. Hand-held dynamometry strength measures for internal and external rotation demonstrate superior reliability, lower minimal detectable change and higher correlation to isokinetic dynamometry than externally-fixed dynamometry of the shoulder. Physical Therapy in Sport. 2016. 21, 75-81.
[5] Leong HT, Ng GY, Leung VY, Fu SN. Quantitative estimation of muscle shear elastic modulus of the upper trapezius with supersonic shear imaging during arm positioning. PLoS One. 2013.8(6), e67199.
[6] Michener LA, Boardman ND, Pidcoe PE, et al. Scapular muscle tests in subjects with shoulder pain and functional loss: reliability and construct validity. Physical therapy. 2005. 85(11), 1128-1138.
[7] Naef F, Grace S, Crowley-McHattan Z, et al. The effect of chronic shoulder pain on maximal force of shoulder abduction. Journal of bodywork and movement therapies. 2015. 19(3), 410-416.
[8] Ruiz-Sáez M1, Fernández-de-las-Peñas C, Blanco CR, et al. Changes in pressure pain sensitivity in latent myofascial trigger points in the upper trapezius muscle after a cervical spine manipulation in pain-free subjects. Journal of manipulative and physiological therapeutics. 2007; 30(8), 578-583.
[9] Sahrmann S. Diagnosis and treatment of movement impairment syndromes. Elsevier Health Sciences. 2002.
[10] Stratford PW, Balsor BE. A comparison of make and break tests using a hand-held dynamometer and the Kin-Com. Journal of Orthopaedic & Sports Physical Therapy. 1994. 19(1), 28-32.
- 19 -

- 20 -

Abstract
Occupational Therapy
- 21 -

- 22 -

2017' Yonsei-Nagoya University Joint Symposium on Occupational Therapy
(2017/11/02 on Thursday), Baekun Hall #103
11:00~12:00 Campus tour
12:00~13:00 Lunch
13:00~14:00 Laboratory tour
14:00~15:00 Session I Chair: Prof. Junichi Uemura (Nagoya Univ.)
14:00~14:20 Review on Concept and Measurement of Occupational Balance: Trend and Therapeutic Prospects Presenter: Sangmi Park, Ji-Hyuk Park (Yonsei Univ.)
14:20~14:40 A Study of the Ways of Holding Chopsticks and the Respective Functions of Children with Autistic Spectrum Disorder and Children Suspected Autistic Spectrum Disorder Presenter: Takuto Sakuma, Chieko Karashima (Nagoya Univ.)
14:40~15:00 A systematic review of randomized controlled trials(RCTs) with community-based intervention for patients with dementia
Presenter: Ga-in Shin, Ye-Shin Woo, Hae Yean Park (Yonsei Univ.)
15:00~15:15 Coffee break
15:15~16:35 Session II Chair: Prof. Arum Han (Yonsei Univ.)
15:15~15:35 The effect of cross-cultural exchange program for occupational therapy students: A preliminary study
Presenter: Hyun Jung Kim, Min-Ye Jung, PhD, (Yonsei Univ.)
15:35~15:55 The study of the brain functional connectivity during somatosensory image execution
Presenter: Ryosuke Suzuki, Jun-ichi Uemura (Nagoya Univ.)
15:55~16:15 A systematic review of effects of cognitive rehabilitation therapy for
- 23 -

community dwelling adults with early dementia or mild cognitive impairment Presenter: Sangmi Park, Ji-Sun Lee, Kyu-Won Lee, Won-Seuk Choi, Jung-Ran Kim (Yonsei Univ.)
16:15~16:35 Study on the production of lightweight customized wrist splint using 3d modeling and 3d printer Presenter: Won-Seuk Choi, Jong-Bae Kim (Yonsei Univ.)
16:35~16:40 Closing Remark Prof. Aiko Hoshino (Nagoya Univ.)
16:40~17:00 Group Photos
※ 15 minutes presentation and 5 minutes Q&A
- 24 -
Review on Concept and Measurement of Occupational Balance: Trend and Therapeutic Prospects
Sangmi Park, BHSc, OT1), Hae Yean Park, PhD, OT2), Ji-Hyuk Park, PhD, OT2)
1) Dept. of Occupational Therapy, The Graduate School, Yonsei University 2) Dept. of Occupational Therapy, College of Health Science, Yonsei University
Introduction
People are satisfied with their life patterns when they are in certain point of balance. The status is called as occupational balance in occupational therapy or occupational science[1]. The concept of occupational balance is complex but it is known that occupational balance is related to health, wellbeing and satisfaction[2].
Although occupational balance has been considered important concept in occupational therapy for a long time, a single definition of occupational balance doesn’t exist yet[3]. There are several definitions of occupational balance by scholars for example, ‘A balance among different kinds of daily occupations[4]’, ‘A balance of engagement in occupation that leads to wellbeing[5], ‘the condition of proper distribution on time, areas of occupations and energy[6]’, ‘subjective perception of having the right amount and variation of occupations[7]’, ‘a personally satisfying pattern of daily occupations[1]’.
Giving chances to participate in meaningful occupations for clients is the most important part of occupational therapy for their health, wellbeing, and quality of life[8]. And it is possible when the therapists understand clients’ life patterns and how much they are satisfied with their life patterns[9].
The first aim of this study was to understand the trend of research on occupational balance by analyzing the studies about occupational balance. And then, attributes of occupational balance were analyzed to find considerations for improving clients’ occupational balance. Finally, confirming the correlation between concept of occupational balance and health or health related factors. Materials and methods
Searching strategy: National Digital Science Library(NDSL), Riss, Pubmed, and Google Scholar were used to search the articles published from October 2007 to September 2016 and ‘occupational balance’ OR ‘작업균형’ were used as search terms. Inclusion criterion were articles 1) published in peer-reviewed journals, 2) contained results of measuring occupational balance and reported quantitatively, 3) published in Korean or English, 4) had at least one author who was an occupational therapist. Exclusion criterion were articles 1) about occupational balance referring to occupation as a meaning of job or balance as a meaning of physical balance or postural balance, 2) we cannot access to full text, 3) about developing occupational balance measurement.
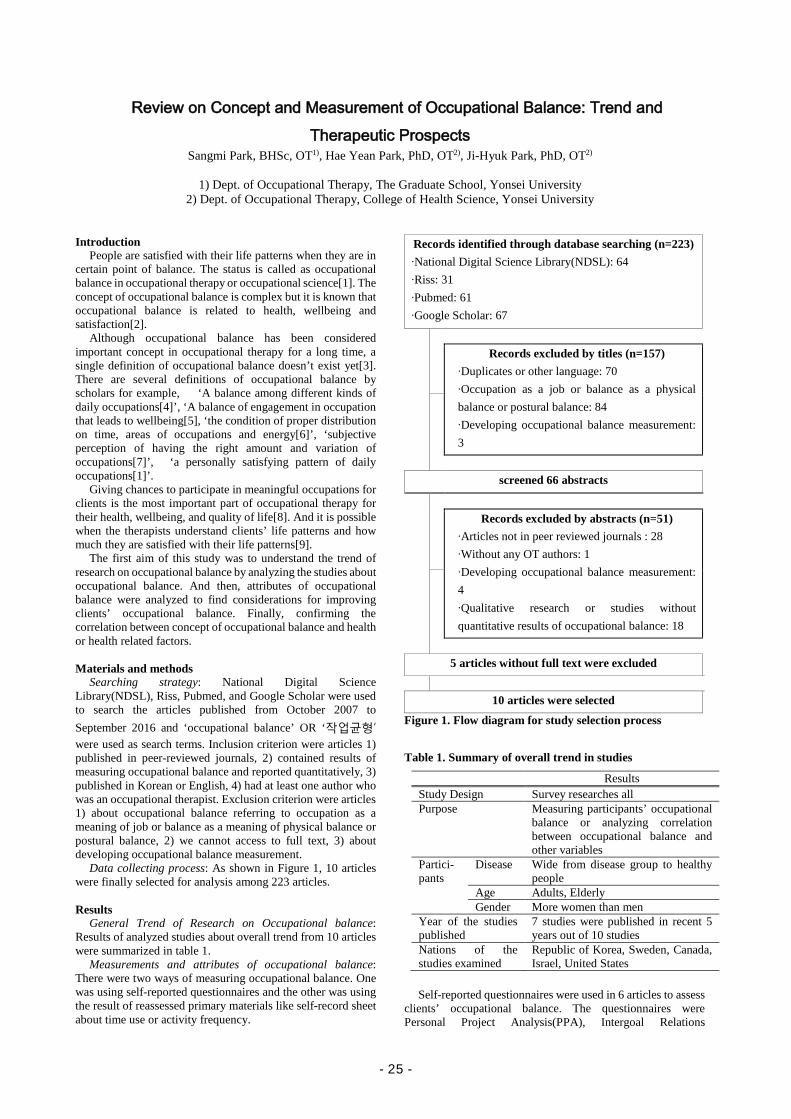
Data collecting process: As shown in Figure 1, 10 articles were finally selected for analysis among 223 articles.
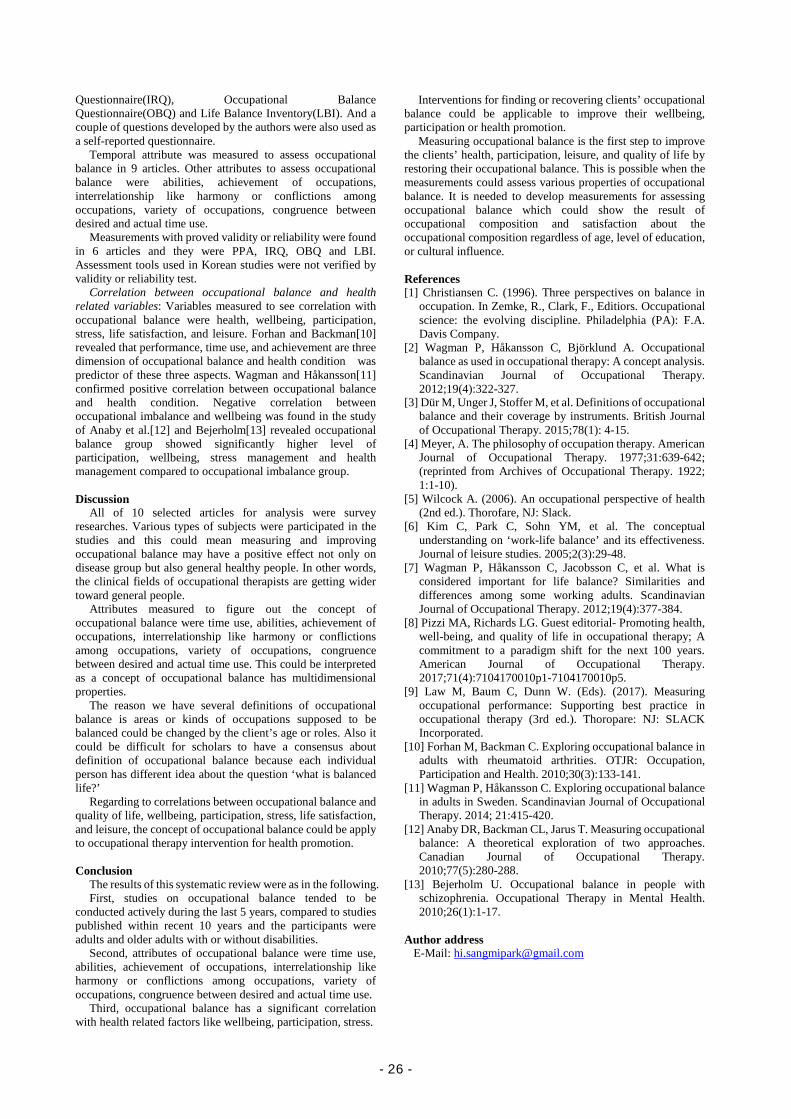
Results General Trend of Research on Occupational balance:
Results of analyzed studies about overall trend from 10 articles were summarized in table 1.
Measurements and attributes of occupational balance: There were two ways of measuring occupational balance. One was using self-reported questionnaires and the other was using the result of reassessed primary materials like self-record sheet about time use or activity frequency.
Records identified through database searching (n=223) ∙National Digital Science Library(NDSL): 64 ∙Riss: 31 ∙Pubmed: 61 ∙Google Scholar: 67
Records excluded by titles (n=157)
∙Duplicates or other language: 70 ∙Occupation as a job or balance as a physical balance or postural balance: 84 ∙Developing occupational balance measurement: 3
screened 66 abstracts
Records excluded by abstracts (n=51) ∙Articles not in peer reviewed journals : 28 ∙Without any OT authors: 1 ∙Developing occupational balance measurement: 4 ∙Qualitative research or studies without quantitative results of occupational balance: 18
5 articles without full text were excluded
10 articles were selected
Figure 1. Flow diagram for study selection process
Table 1. Summary of overall trend in studies
Results Study Design Survey researches all Purpose Measuring participants’ occupational
balance or analyzing correlation between occupational balance and other variables
Partici- pants
Disease Wide from disease group to healthy people
Age Adults, Elderly Gender More women than men
Year of the studies published
7 studies were published in recent 5 years out of 10 studies
Nations of the studies examined
Republic of Korea, Sweden, Canada, Israel, United States
Self-reported questionnaires were used in 6 articles to assess
clients’ occupational balance. The questionnaires were Personal Project Analysis(PPA), Intergoal Relations
- 25 -
Questionnaire(IRQ), Occupational Balance Questionnaire(OBQ) and Life Balance Inventory(LBI). And a couple of questions developed by the authors were also used as a self-reported questionnaire.
Temporal attribute was measured to assess occupational balance in 9 articles. Other attributes to assess occupational balance were abilities, achievement of occupations, interrelationship like harmony or conflictions among occupations, variety of occupations, congruence between desired and actual time use.
Measurements with proved validity or reliability were found in 6 articles and they were PPA, IRQ, OBQ and LBI. Assessment tools used in Korean studies were not verified by validity or reliability test.
Correlation between occupational balance and health related variables: Variables measured to see correlation with occupational balance were health, wellbeing, participation, stress, life satisfaction, and leisure. Forhan and Backman[10] revealed that performance, time use, and achievement are three dimension of occupational balance and health condition was predictor of these three aspects. Wagman and Håkansson[11] confirmed positive correlation between occupational balance and health condition. Negative correlation between occupational imbalance and wellbeing was found in the study of Anaby et al.[12] and Bejerholm[13] revealed occupational balance group showed significantly higher level of participation, wellbeing, stress management and health management compared to occupational imbalance group. Discussion
All of 10 selected articles for analysis were survey researches. Various types of subjects were participated in the studies and this could mean measuring and improving occupational balance may have a positive effect not only on disease group but also general healthy people. In other words, the clinical fields of occupational therapists are getting wider toward general people.
Attributes measured to figure out the concept of occupational balance were time use, abilities, achievement of occupations, interrelationship like harmony or conflictions among occupations, variety of occupations, congruence between desired and actual time use. This could be interpreted as a concept of occupational balance has multidimensional properties.
The reason we have several definitions of occupational balance is areas or kinds of occupations supposed to be balanced could be changed by the client’s age or roles. Also it could be difficult for scholars to have a consensus about definition of occupational balance because each individual person has different idea about the question ‘what is balanced life?’
Regarding to correlations between occupational balance and quality of life, wellbeing, participation, stress, life satisfaction, and leisure, the concept of occupational balance could be apply to occupational therapy intervention for health promotion.
Conclusion
The results of this systematic review were as in the following. First, studies on occupational balance tended to be
conducted actively during the last 5 years, compared to studies published within recent 10 years and the participants were adults and older adults with or without disabilities.
Second, attributes of occupational balance were time use, abilities, achievement of occupations, interrelationship like harmony or conflictions among occupations, variety of occupations, congruence between desired and actual time use.
Third, occupational balance has a significant correlation with health related factors like wellbeing, participation, stress.
Interventions for finding or recovering clients’ occupational balance could be applicable to improve their wellbeing, participation or health promotion.
Measuring occupational balance is the first step to improve the clients’ health, participation, leisure, and quality of life by restoring their occupational balance. This is possible when the measurements could assess various properties of occupational balance. It is needed to develop measurements for assessing occupational balance which could show the result of occupational composition and satisfaction about the occupational composition regardless of age, level of education, or cultural influence.
References [1] Christiansen C. (1996). Three perspectives on balance in
occupation. In Zemke, R., Clark, F., Editiors. Occupational science: the evolving discipline. Philadelphia (PA): F.A. Davis Company.
[2] Wagman P, Håkansson C, Björklund A. Occupational balance as used in occupational therapy: A concept analysis. Scandinavian Journal of Occupational Therapy. 2012;19(4):322-327.
[3] Dür M, Unger J, Stoffer M, et al. Definitions of occupational balance and their coverage by instruments. British Journal of Occupational Therapy. 2015;78(1): 4-15.
[4] Meyer, A. The philosophy of occupation therapy. American Journal of Occupational Therapy. 1977;31:639-642; (reprinted from Archives of Occupational Therapy. 1922; 1:1-10).
[5] Wilcock A. (2006). An occupational perspective of health (2nd ed.). Thorofare, NJ: Slack.
[6] Kim C, Park C, Sohn YM, et al. The conceptual understanding on ‘work-life balance’ and its effectiveness. Journal of leisure studies. 2005;2(3):29-48.
[7] Wagman P, Håkansson C, Jacobsson C, et al. What is considered important for life balance? Similarities and differences among some working adults. Scandinavian Journal of Occupational Therapy. 2012;19(4):377-384.
[8] Pizzi MA, Richards LG. Guest editorial- Promoting health, well-being, and quality of life in occupational therapy; A commitment to a paradigm shift for the next 100 years. American Journal of Occupational Therapy. 2017;71(4):7104170010p1-7104170010p5.
[9] Law M, Baum C, Dunn W. (Eds). (2017). Measuring occupational performance: Supporting best practice in occupational therapy (3rd ed.). Thoropare: NJ: SLACK Incorporated.
[10] Forhan M, Backman C. Exploring occupational balance in adults with rheumatoid arthrities. OTJR: Occupation, Participation and Health. 2010;30(3):133-141.
[11] Wagman P, Håkansson C. Exploring occupational balance in adults in Sweden. Scandinavian Journal of Occupational Therapy. 2014; 21:415-420.
[12] Anaby DR, Backman CL, Jarus T. Measuring occupational balance: A theoretical exploration of two approaches. Canadian Journal of Occupational Therapy. 2010;77(5):280-288.
[13] Bejerholm U. Occupational balance in people with schizophrenia. Occupational Therapy in Mental Health. 2010;26(1):1-17.
Author address
E-Mail: [email protected]
- 26 -
A Study of the Ways of Holding Chopsticks and the Respective Functions of Children with Autistic Spectrum Disorder and Children Suspected Autistic Spectrum Disorder.
Takuto Sakuma*, Chieko Karashima
Department of Occupational Therapy, Graduate School of Medicine, Nagoya University, Japan
Introduction
DSM-5 defined Autistic Spectrum Disorder (ASD) as having persistent deficits in social communication and social interaction across contexts and restricted, repetitive patterns of behavior, interests, or activities. Previous studies reported that children with ASD had a lower motor function as compared with typically developing children[1], especialy in their writing ability and the ability to throw a ball [2][3]. For this reason, occupational therapists suspect that chldren with ASD have dyspraxia, and make an approach to their activities of daily living (ADL) in perspective of dyspraxia and sensory modulation dysfunction [4]. In particular, dyspraxia makes it difficult to perform ADL well because of the impairment in performance of movement such as ideation, planning and execution of motion. Occupational therapists often take an intervention for children with ASD using chopsticks. In Japan, there is a way of holding chopsticks called "traditional type". Parents of children with ASD become anxious when their chidren do not hold the chopsticks in traditional type and they suspect that it is due to ASD. In the previous studies, it was not clear regarding the relationship between ASD and not being able to use chopsticks in traditional type. On the other hand, there were many studies showing that traditional type was the most functional and most kinematically advanced compared to other ways of holding chopsticks among typically developing children[5]. The purposes of this study were as follows, I) to explore the ways of holding chopsticks, and II) to examine the functionality of each way of holding chopsticks respectively among children with ASD. Study I explored the ways of holding chopsticks among children with ASD and typically developing children, and then, compared between each group.Study II examined the functionality of each type of holding chopsticks of children with ASD, and compared the results with those of typically developing children. Significance of the study
This study can allow occupational therapists to provide more effective and evidence based interventions by using the most functional type of holding chopsticks as a model for children with ASD in response to the parents’ anxiety about their children's ability. Materials and Methods 【study I】
Participants: The participants were 102 typically developing children and 33 children with ASD or with suspected ASD who went to both kindergarten and child development support center(from 5 to 6 years old). For the data of typically developing children, we used existing data collected by our laboratory in 2016 for the study “The ways of holding chopsticks and the respective functions in typically developing children”(the study of typically developing children).
Method: The children in this study picked up and carried soybeans and rice to the container at a height of the mouth (15cm) and we videotaped their performances.
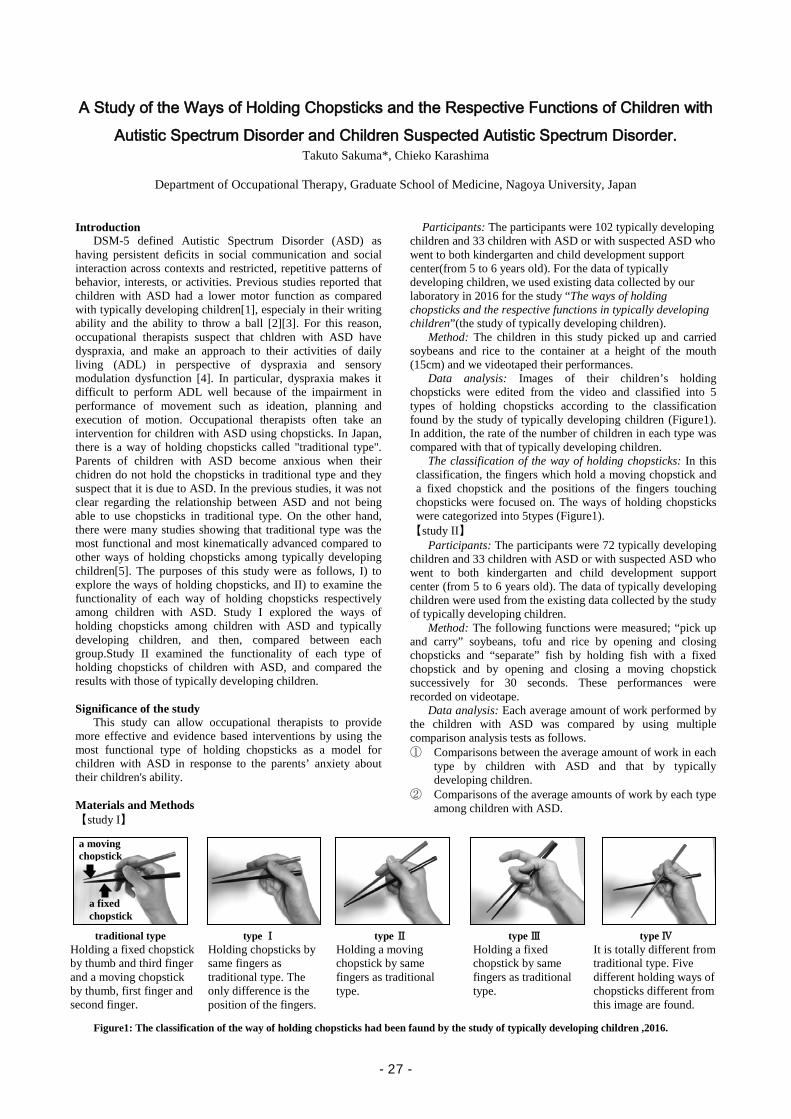
Data analysis: Images of their children’s holding chopsticks were edited from the video and classified into 5 types of holding chopsticks according to the classification found by the study of typically developing children (Figure1). In addition, the rate of the number of children in each type was compared with that of typically developing children.
The classification of the way of holding chopsticks: In this classification, the fingers which hold a moving chopstick and a fixed chopstick and the positions of the fingers touching chopsticks were focused on. The ways of holding chopsticks were categorized into 5types (Figure1).
【study II】 Participants: The participants were 72 typically developing
children and 33 children with ASD or with suspected ASD who went to both kindergarten and child development support center (from 5 to 6 years old). The data of typically developing children were used from the existing data collected by the study of typically developing children.
Method: The following functions were measured; “pick up and carry” soybeans, tofu and rice by opening and closing chopsticks and “separate” fish by holding fish with a fixed chopstick and by opening and closing a moving chopstick successively for 30 seconds. These performances were recorded on videotape.
Data analysis: Each average amount of work performed by the children with ASD was compared by using multiple comparison analysis tests as follows. ① Comparisons between the average amount of work in each
type by children with ASD and that by typically developing children.
② Comparisons of the average amounts of work by each type among children with ASD.
a moving chopstick
a fixed chopstick
traditional type type Ⅰ type Ⅱ type Ⅲ type Ⅳ Holding a fixed chopstick by thumb and third finger and a moving chopstick by thumb, first finger and second finger.
Holding chopsticks by same fingers as traditional type. The only difference is the position of the fingers.
Holding a moving chopstick by same fingers as traditional type.
Holding a fixed chopstick by same fingers as traditional type.
It is totally different from traditional type. Five different holding ways of chopsticks different from this image are found.
Figure1: The classification of the way of holding chopsticks had been faund by the study of typically developing children ,2016.
- 27 -
Results 【study I】The data of 102 typically developing children and 33 children with ASD were analyzed. The number of children in each type were as follows. [typically developing children] traditional type 17(17%), typeI 37(36%),typeII 28(27%), typeIII 3(3%), typeIV 17(17%) [children with ASD] traditional type 5(15%), typeI 12(37%), typeII 8(24%), typeIII 0(0%), typeIV8(24%)
There was no significant difference among the rate of the number of children in each type between typically developing children and children with ASD (p>.05). No statistical calculations was given to type III because there was no children with ASD using type III. 【study II】The data of 72 typically developing children and 33 children with ASD were analyzed. ① Comparisons between the average amount of work in
each type by children with ASD and that by typically developing children.
As for traditional type, there was no significant difference of the average amount of work between children with ASD and typically developing children (p>.05). As for type I, the average amount of work in fish among children with ASD was significantly lower than that among typically developing children (p<.05). As for type II, the average amounts of work in using soybeans and fish among children with ASD were significantly lower than those among typically developing children (p<.05). As for type IV, the average amounts of work in using soybeans and fish among children with ASD were significantly lower than those among typically developing children (p<.05). ② Comparisons of the average amounts of work by each
type among children with ASD. As for using soybeans, the average amount of work for
traditional type was significantly higher than that for type II and type IV, and the average amount of work for type I was significantly higher than that for type IV (p<.05). As for using tofu, there was no significant difference among the average amounts of work in each type (p>.05). As for using rice, the average amount of work for traditional type was significantly higher than that for type II and type IV (p<.05). As for using fish, the average amount of work for traditional type was significantly higher than that for type IV (p<.05). And then, as for all ingredients in this study, there was no significant difference between the average amount of work for traditional type and that for type I. Discussion 【 study I 】 We assumed that children with ASD had difficulties in holding chopsticks in traditional way compared with typically developing children because of dyspraxia. However, there was no significant difference of distribution ratio; traditional type, type I and IV. Participants of this study were children with ASD who went to kindergarten. Therefore, although no evidence was presented, there might be a possibility that the same experiences and education for children with ASD as typically developing children affected this result. Thus, our results showed a new perspective of hand skills of children with ASD. 【study II】The functionality of traditional type was similar between children with ASD and typically developing children in all ingredients. Therefore when children with ASD kinematically acquired the skill of using traditional type which is considered as an advanced way of holding chopsticks, it seems that their functionality has already matured as well as typically developing children.
Except for tofu, traditional type using other ingredients was more functional compared to type IV which has no functional
elements of traditional type. When people hold the chopsticks in traditional type, it is considered that they can open a moving chopstick steadily without moving a fixed chopstick. In contrast, when people hold chopsticks by type IV, it is impossible to move only a moving chopstick. Thus, traditional type had higher functionality than type IV. The reason why there was no significant difference between the average amount of work in using tofu in traditional type and type IV was that the tofu was firm and cubes. This made it easy to handle the tofu in any type.
Among children with ASD, typeI, which is similar to traditional type, had the same functionality as traditional type, while typeII, which is also similar to traditional type, had lower functionality than traditional type in soybeans and rice. Type I uses the same fingers to hold a moving chopstick and a fixed chopstick as traditional type. The only difference is the position of the fingers. Therefore, type I had the same function to move the chopsticks without needing to move a fixed chopstick as traditional type. On the other hand, TypeII uses same fingers to hold a moving chopstick as traditional type but uses different fingers to hold a fixed chopstick. Because of this, typeII was considered to have more instability of the fixed chopsticks, and as a result, the functionality became lowered.
Conclusion
This study was designed to explore the ways of holding chopsticks and examine the functionality of each type of holding chopsticks among children with ASD and typically developing children (from 5 to 6 years old).
There was no significant difference among the rate of the number of children in each type between typically developing children and children with ASD.
The functionality of traditional type was similar among children with ASD and typically developing children.
Among children with ASD, the functionality of traditional type was higher than the other type which had no similar elements to traditional type. The type which held a moving chopstick and a fixed chopstick in the same way as traditional type had higher functionality than other type which was similar to traditional type. References [1] L. Kerri, G. Reid. Fundamental movement skills and autism
spectrum disorders. J Autism Dev Disord. 2015; 40: 209-217. [2] N. Grace, P. G. Enticott, B. P. Johnson. N. J. Rinehart, Do
handwriting difficulties correlate with core symptomology, motor proficiency and attentional behaviours?. J Autism Dev Disord. 2016; 44: 1006-1017.
[3] S. Hirata, Y. Ikeda, M. Kokubunn. Relationship between skillfulness of fingers and ability to adjust forces in autistic spectrum children. Tokyo gakugei college. 2013; 27: 81-88.
[4] C. Smith, J. Arbesman. Evidence-based review of interventions for autism used in or of relevance to occupational therapy. American Journal of Occupational Therapy. 2008; 62(4): 416-429.
[5] T. Ooka, J. Kuroishi, M. Mukai. Developmental changes of chopstick operation method and capture function in early childhood. The Japanese Journal of Pediatric Dentistry. 2006; 44: 713-719.
Author address
E-Mail: [email protected]
- 28 -
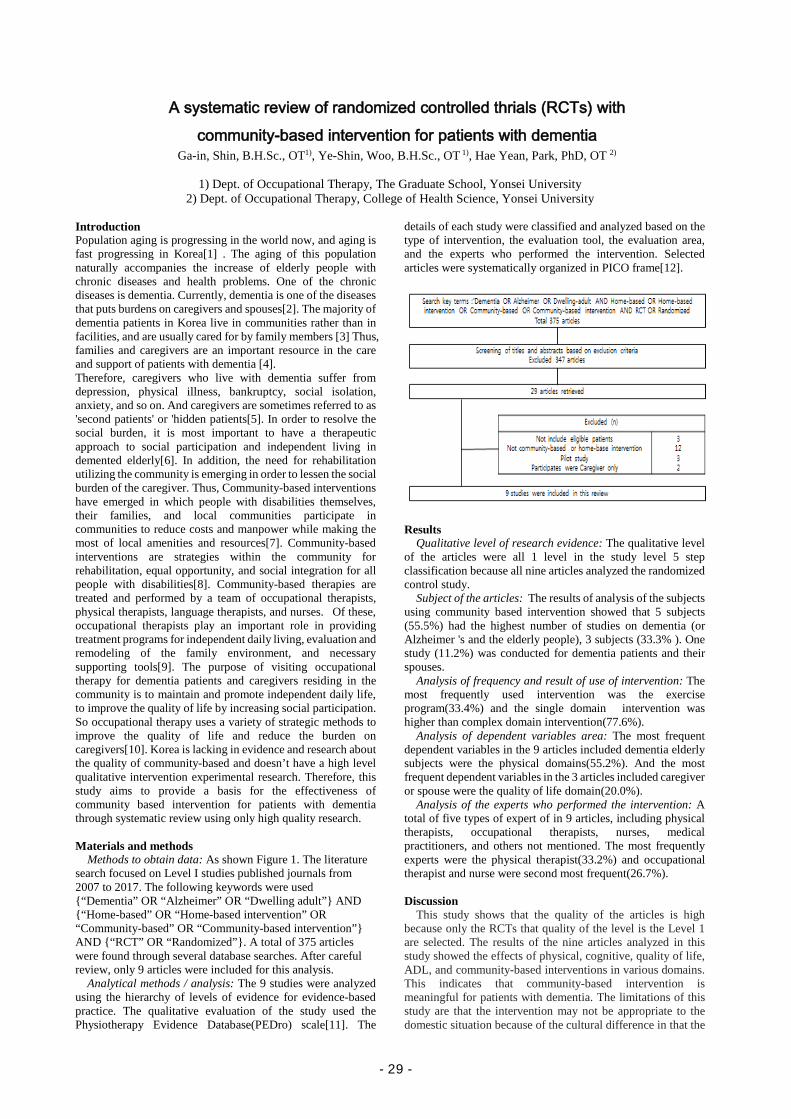
A systematic review of randomized controlled thrials (RCTs) with community-based intervention for patients with dementia
Ga-in, Shin, B.H.Sc., OT1), Ye-Shin, Woo, B.H.Sc., OT 1), Hae Yean, Park, PhD, OT 2)
1) Dept. of Occupational Therapy, The Graduate School, Yonsei University 2) Dept. of Occupational Therapy, College of Health Science, Yonsei University
Introduction Population aging is progressing in the world now, and aging is fast progressing in Korea[1] . The aging of this population naturally accompanies the increase of elderly people with chronic diseases and health problems. One of the chronic diseases is dementia. Currently, dementia is one of the diseases that puts burdens on caregivers and spouses[2]. The majority of dementia patients in Korea live in communities rather than in facilities, and are usually cared for by family members [3] Thus, families and caregivers are an important resource in the care and support of patients with dementia [4]. Therefore, caregivers who live with dementia suffer from depression, physical illness, bankruptcy, social isolation, anxiety, and so on. And caregivers are sometimes referred to as 'second patients' or 'hidden patients[5]. In order to resolve the social burden, it is most important to have a therapeutic approach to social participation and independent living in demented elderly[6]. In addition, the need for rehabilitation utilizing the community is emerging in order to lessen the social burden of the caregiver. Thus, Community-based interventions have emerged in which people with disabilities themselves, their families, and local communities participate in communities to reduce costs and manpower while making the most of local amenities and resources[7]. Community-based interventions are strategies within the community for rehabilitation, equal opportunity, and social integration for all people with disabilities[8]. Community-based therapies are treated and performed by a team of occupational therapists, physical therapists, language therapists, and nurses. Of these, occupational therapists play an important role in providing treatment programs for independent daily living, evaluation and remodeling of the family environment, and necessary supporting tools[9]. The purpose of visiting occupational therapy for dementia patients and caregivers residing in the community is to maintain and promote independent daily life, to improve the quality of life by increasing social participation. So occupational therapy uses a variety of strategic methods to improve the quality of life and reduce the burden on caregivers[10]. Korea is lacking in evidence and research about the quality of community-based and doesn’t have a high level qualitative intervention experimental research. Therefore, this study aims to provide a basis for the effectiveness of community based intervention for patients with dementia through systematic review using only high quality research.
Materials and methods
Methods to obtain data: As shown Figure 1. The literature search focused on Level I studies published journals from 2007 to 2017. The following keywords were used {“Dementia” OR “Alzheimer” OR “Dwelling adult”} AND {“Home-based” OR “Home-based intervention” OR “Community-based” OR “Community-based intervention”} AND {“RCT” OR “Randomized”}. A total of 375 articles were found through several database searches. After careful review, only 9 articles were included for this analysis.
Analytical methods / analysis: The 9 studies were analyzed using the hierarchy of levels of evidence for evidence-based practice. The qualitative evaluation of the study used the Physiotherapy Evidence Database(PEDro) scale[11]. The
details of each study were classified and analyzed based on the type of intervention, the evaluation tool, the evaluation area, and the experts who performed the intervention. Selected articles were systematically organized in PICO frame[12].
Results
Qualitative level of research evidence: The qualitative level of the articles were all 1 level in the study level 5 step classification because all nine articles analyzed the randomized control study.
Subject of the articles: The results of analysis of the subjects using community based intervention showed that 5 subjects (55.5%) had the highest number of studies on dementia (or Alzheimer 's and the elderly people), 3 subjects (33.3% ). One study (11.2%) was conducted for dementia patients and their spouses.
Analysis of frequency and result of use of intervention: The most frequently used intervention was the exercise program(33.4%) and the single domain intervention was higher than complex domain intervention(77.6%).
Analysis of dependent variables area: The most frequent dependent variables in the 9 articles included dementia elderly subjects were the physical domains(55.2%). And the most frequent dependent variables in the 3 articles included caregiver or spouse were the quality of life domain(20.0%).
Analysis of the experts who performed the intervention: A total of five types of expert of in 9 articles, including physical therapists, occupational therapists, nurses, medical practitioners, and others not mentioned. The most frequently experts were the physical therapist(33.2%) and occupational therapist and nurse were second most frequent(26.7%). Discussion
This study shows that the quality of the articles is high because only the RCTs that quality of the level is the Level 1 are selected. The results of the nine articles analyzed in this study showed the effects of physical, cognitive, quality of life, ADL, and community-based interventions in various domains. This indicates that community-based intervention is meaningful for patients with dementia. The limitations of this study are that the intervention may not be appropriate to the domestic situation because of the cultural difference in that the
- 29 -
intervention is local rather than domestic. In addition, among the papers analyzed, there are two papers in which the occupational therapist plays a role of mediator. In addition, most of the dementia residents in the community are mild and moderate, but because this study do not search the level of dementia and there is no systematic protocol for the effectiveness of the study, it is difficult to interpret the effect of the intervention. Therefore, it will be necessary to develop a protocol on intervention effects and research on community intervention based on dementia level.
Conclusion
When the number of dementia patients increases and many elderly people live in the community due to social cost burden, community based intervention will be more emphasized in the future. Therefore, occupational therapists should be aware of the importance of community participation, quality of life of dementia patients and their caregivers, and appropriate intervention methods, frequency and duration of intervention should be studied in Korea. This study suggests that community-based intervention may have a positive effect on patients with dementia. Based on this, we can use various community-based interventions to increase patient participation in the community, You should be able to present it. References [1] Choi, S. H., Lee, J., Kim, S. J., Choi, J. Y., Kwon, J. W.,
Yoon, B. N., ... Jeong, J. H. (2014). Driving in patients with dementia: A CREDOS (clinical research center for dementia of south Korea) Study. Dementia and Neurocognitive Disorders, 13, 83-88.
[2] Han, Y. S. (2011). A study on the welfare service improvement of the old with dementia [dissertation]. Seoul: Hanyang Univ.
[3] Jo, Y. Y. (2008). A study of the caregiver appraisal in family caregivers of patients with dementia. (Master’s thesis), Yonsei University, Seoul.
[4] Cantor, M. H., & Brennan, M. (2000). Social care of the elderly: The effects of ethnicity, class and culture. Springer Publishing Company.
[5] Schulz, R., & Beach, S. R. (1999). Caregiving as a risk factor for mortality: The caregiver health effects study. Jama, 282, 2215-2219.
[6] Park, C.S., Jung, W.M., Oh, H.C. (2010). Analysis of caregiver needs for home-based occupational therapy programs for elderly community dwellers with dementia based on symptom level and caregiver burden. Journal of Korean Academy of Occupational Therapy, 18(4), 51-62.
[7] Won, J. I. (2008). Necessity of community-based rehabilitation system after stroke. Journal of the Korea Contents Association, 8(1), 16-26.
[8] World Health Organization. (1994). Community-based rehabilitation for and with people with disabilities: 1994 joint position paper.
[9] Wood, V. A., & Hewer, R. L. (1996). The prevention and management of stroke. Journal of Public Health, 18, 423-431.
[10] Gitlin, L. N., Winter, L., Dennis, M. P., Hodgson, N., & Hauck, W. W. (2010). A biobehavioral home-based intervention and the well-being of patients with dementia and their caregivers: The cope randomized trial.
[11] Tooth, L., McCluskey, A., Hoffmann, T., McKenna, K., & Lovarini, M. (2005). Appraising the quality of randomized controlled trials: Inter‐rater reliability for the OTseeker evidence database. Journal of Evaluation in Clinical Practice, 11(6), 547-555.
[12] Cozzolino, M. (2009). A review of evidence-based rehabilitation: A guide to practice, 2nd edition.
Author address
E-Mail: [email protected]
- 30 -
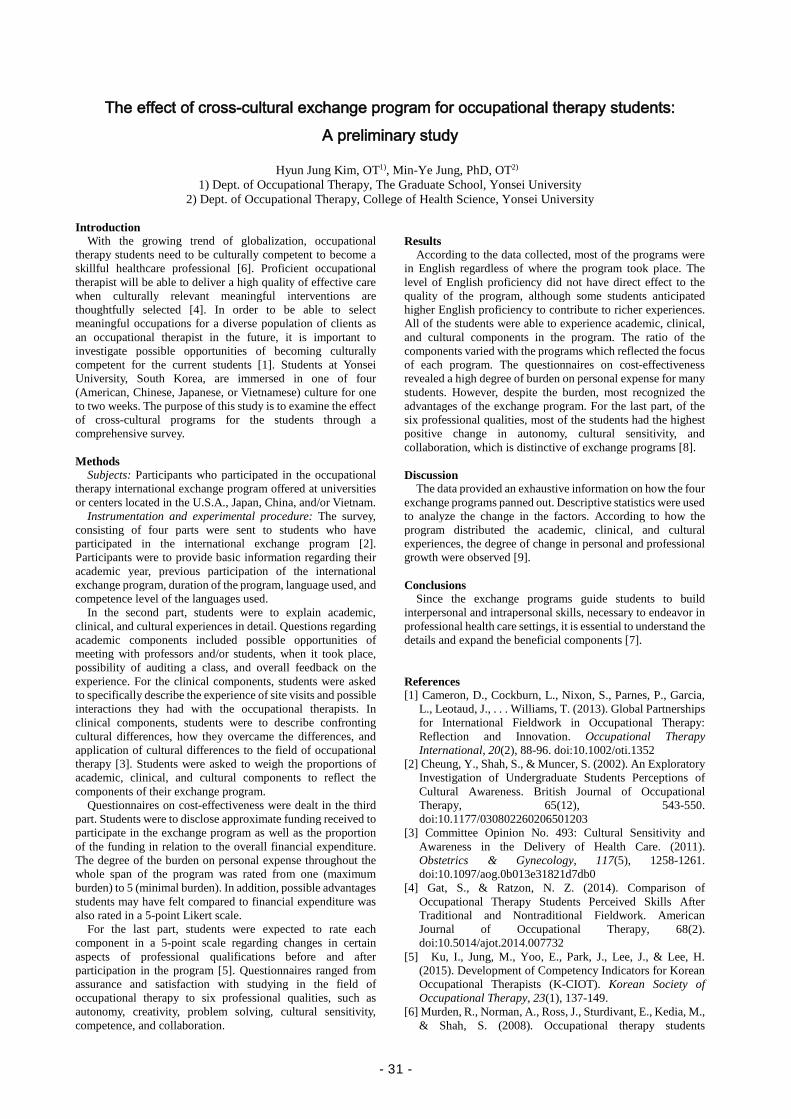
The effect of cross-cultural exchange program for occupational therapy students: A preliminary study
Hyun Jung Kim, OT1), Min-Ye Jung, PhD, OT2)
1) Dept. of Occupational Therapy, The Graduate School, Yonsei University 2) Dept. of Occupational Therapy, College of Health Science, Yonsei University
Introduction
With the growing trend of globalization, occupational therapy students need to be culturally competent to become a skillful healthcare professional [6]. Proficient occupational therapist will be able to deliver a high quality of effective care when culturally relevant meaningful interventions are thoughtfully selected [4]. In order to be able to select meaningful occupations for a diverse population of clients as an occupational therapist in the future, it is important to investigate possible opportunities of becoming culturally competent for the current students [1]. Students at Yonsei University, South Korea, are immersed in one of four (American, Chinese, Japanese, or Vietnamese) culture for one to two weeks. The purpose of this study is to examine the effect of cross-cultural programs for the students through a comprehensive survey. Methods
Subjects: Participants who participated in the occupational therapy international exchange program offered at universities or centers located in the U.S.A., Japan, China, and/or Vietnam.
Instrumentation and experimental procedure: The survey, consisting of four parts were sent to students who have participated in the international exchange program [2]. Participants were to provide basic information regarding their academic year, previous participation of the international exchange program, duration of the program, language used, and competence level of the languages used.
In the second part, students were to explain academic, clinical, and cultural experiences in detail. Questions regarding academic components included possible opportunities of meeting with professors and/or students, when it took place, possibility of auditing a class, and overall feedback on the experience. For the clinical components, students were asked to specifically describe the experience of site visits and possible interactions they had with the occupational therapists. In clinical components, students were to describe confronting cultural differences, how they overcame the differences, and application of cultural differences to the field of occupational therapy [3]. Students were asked to weigh the proportions of academic, clinical, and cultural components to reflect the components of their exchange program.
Questionnaires on cost-effectiveness were dealt in the third part. Students were to disclose approximate funding received to participate in the exchange program as well as the proportion of the funding in relation to the overall financial expenditure. The degree of the burden on personal expense throughout the whole span of the program was rated from one (maximum burden) to 5 (minimal burden). In addition, possible advantages students may have felt compared to financial expenditure was also rated in a 5-point Likert scale.
For the last part, students were expected to rate each component in a 5-point scale regarding changes in certain aspects of professional qualifications before and after participation in the program [5]. Questionnaires ranged from assurance and satisfaction with studying in the field of occupational therapy to six professional qualities, such as autonomy, creativity, problem solving, cultural sensitivity, competence, and collaboration.
Results
According to the data collected, most of the programs were in English regardless of where the program took place. The level of English proficiency did not have direct effect to the quality of the program, although some students anticipated higher English proficiency to contribute to richer experiences. All of the students were able to experience academic, clinical, and cultural components in the program. The ratio of the components varied with the programs which reflected the focus of each program. The questionnaires on cost-effectiveness revealed a high degree of burden on personal expense for many students. However, despite the burden, most recognized the advantages of the exchange program. For the last part, of the six professional qualities, most of the students had the highest positive change in autonomy, cultural sensitivity, and collaboration, which is distinctive of exchange programs [8].
Discussion
The data provided an exhaustive information on how the four exchange programs panned out. Descriptive statistics were used to analyze the change in the factors. According to how the program distributed the academic, clinical, and cultural experiences, the degree of change in personal and professional growth were observed [9].
Conclusions
Since the exchange programs guide students to build interpersonal and intrapersonal skills, necessary to endeavor in professional health care settings, it is essential to understand the details and expand the beneficial components [7].
References [1] Cameron, D., Cockburn, L., Nixon, S., Parnes, P., Garcia,
L., Leotaud, J., . . . Williams, T. (2013). Global Partnerships for International Fieldwork in Occupational Therapy: Reflection and Innovation. Occupational Therapy International, 20(2), 88-96. doi:10.1002/oti.1352
[2] Cheung, Y., Shah, S., & Muncer, S. (2002). An Exploratory Investigation of Undergraduate Students Perceptions of Cultural Awareness. British Journal of Occupational Therapy, 65(12), 543-550. doi:10.1177/030802260206501203
[3] Committee Opinion No. 493: Cultural Sensitivity and Awareness in the Delivery of Health Care. (2011). Obstetrics & Gynecology, 117(5), 1258-1261. doi:10.1097/aog.0b013e31821d7db0
[4] Gat, S., & Ratzon, N. Z. (2014). Comparison of Occupational Therapy Students Perceived Skills After Traditional and Nontraditional Fieldwork. American Journal of Occupational Therapy, 68(2). doi:10.5014/ajot.2014.007732
[5] Ku, I., Jung, M., Yoo, E., Park, J., Lee, J., & Lee, H. (2015). Development of Competency Indicators for Korean Occupational Therapists (K-CIOT). Korean Society of Occupational Therapy, 23(1), 137-149.
[6] Murden, R., Norman, A., Ross, J., Sturdivant, E., Kedia, M., & Shah, S. (2008). Occupational therapy students
- 31 -

perceptions of their cultural awareness and competency. Occupational Therapy International, 15(3), 191-203. doi:10.1002/oti.253
[7] Rasmussen, T. M., Lloyd, C., & Wielandt, T. (2005). Cultural awareness among Queensland undergraduate occupational therapy students. Australian Occupational Therapy Journal, 52(4), 302-310. doi:10.1111/j.1440-1630.2005.00508.x
[8] Sood, D., Cepa, D., Dsouza, S. A., Saha, S., Aikat, R., & Tuuk, A. (2014). Impact of International Collaborative Project on Cultural Competence among Occupational Therapy Students. The Open Journal of Occupational Therapy, 2(3). doi:10.15453/2168-6408.1111
[9] Whiteford, G., & St-Clair, V. W. (2002). Being Prepared for Diversity in Practice: Occupational Therapy Students Perceptions of Valuable Intercultural Learning Experiences. British Journal of Occupational Therapy, 65(3), 129-137. doi:10.1177/030802260206500305
Author address E-mail: [email protected]
- 32 -
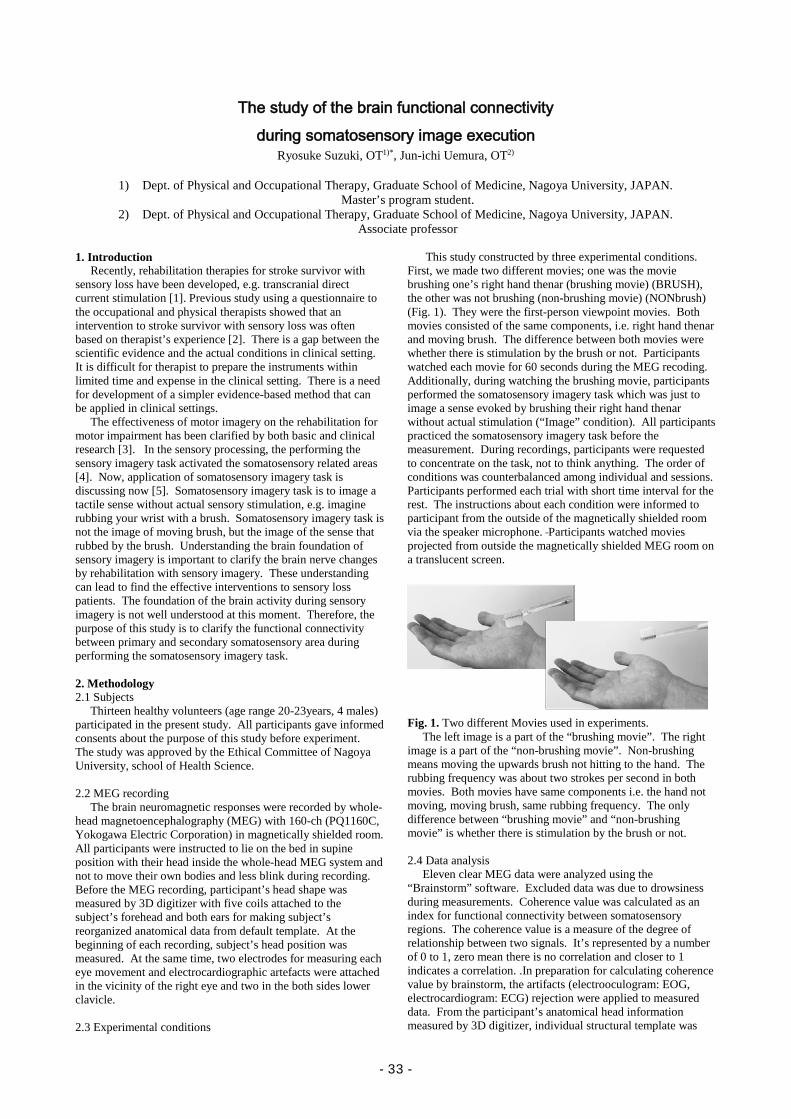
The study of the brain functional connectivity during somatosensory image execution
Ryosuke Suzuki, OT1)*, Jun-ichi Uemura, OT2)
1) Dept. of Physical and Occupational Therapy, Graduate School of Medicine, Nagoya University, JAPAN.
Master’s program student. 2) Dept. of Physical and Occupational Therapy, Graduate School of Medicine, Nagoya University, JAPAN.
Associate professor 1. Introduction Recently, rehabilitation therapies for stroke survivor with sensory loss have been developed, e.g. transcranial direct current stimulation [1]. Previous study using a questionnaire to the occupational and physical therapists showed that an intervention to stroke survivor with sensory loss was often based on therapist’s experience [2]. There is a gap between the scientific evidence and the actual conditions in clinical setting. It is difficult for therapist to prepare the instruments within limited time and expense in the clinical setting. There is a need for development of a simpler evidence-based method that can be applied in clinical settings. The effectiveness of motor imagery on the rehabilitation for motor impairment has been clarified by both basic and clinical research [3]. In the sensory processing, the performing the sensory imagery task activated the somatosensory related areas [4]. Now, application of somatosensory imagery task is discussing now [5]. Somatosensory imagery task is to image a tactile sense without actual sensory stimulation, e.g. imagine rubbing your wrist with a brush. Somatosensory imagery task is not the image of moving brush, but the image of the sense that rubbed by the brush. Understanding the brain foundation of sensory imagery is important to clarify the brain nerve changes by rehabilitation with sensory imagery. These understanding can lead to find the effective interventions to sensory loss patients. The foundation of the brain activity during sensory imagery is not well understood at this moment. Therefore, the purpose of this study is to clarify the functional connectivity between primary and secondary somatosensory area during performing the somatosensory imagery task. 2. Methodology 2.1 Subjects Thirteen healthy volunteers (age range 20-23years, 4 males) participated in the present study. All participants gave informed consents about the purpose of this study before experiment. The study was approved by the Ethical Committee of Nagoya University, school of Health Science. 2.2 MEG recording The brain neuromagnetic responses were recorded by whole-head magnetoencephalography (MEG) with 160-ch (PQ1160C, Yokogawa Electric Corporation) in magnetically shielded room. All participants were instructed to lie on the bed in supine position with their head inside the whole-head MEG system and not to move their own bodies and less blink during recording. Before the MEG recording, participant’s head shape was measured by 3D digitizer with five coils attached to the subject’s forehead and both ears for making subject’s reorganized anatomical data from default template. At the beginning of each recording, subject’s head position was measured. At the same time, two electrodes for measuring each eye movement and electrocardiographic artefacts were attached in the vicinity of the right eye and two in the both sides lower clavicle. 2.3 Experimental conditions
This study constructed by three experimental conditions. First, we made two different movies; one was the movie brushing one’s right hand thenar (brushing movie) (BRUSH), the other was not brushing (non-brushing movie) (NONbrush) (Fig. 1). They were the first-person viewpoint movies. Both movies consisted of the same components, i.e. right hand thenar and moving brush. The difference between both movies were whether there is stimulation by the brush or not. Participants watched each movie for 60 seconds during the MEG recoding. Additionally, during watching the brushing movie, participants performed the somatosensory imagery task which was just to image a sense evoked by brushing their right hand thenar without actual stimulation (“Image” condition). All participants practiced the somatosensory imagery task before the measurement. During recordings, participants were requested to concentrate on the task, not to think anything. The order of conditions was counterbalanced among individual and sessions. Participants performed each trial with short time interval for the rest. The instructions about each condition were informed to participant from the outside of the magnetically shielded room via the speaker microphone. Participants watched movies projected from outside the magnetically shielded MEG room on a translucent screen. Fig. 1. Two different Movies used in experiments. The left image is a part of the “brushing movie”. The right image is a part of the “non-brushing movie”. Non-brushing means moving the upwards brush not hitting to the hand. The rubbing frequency was about two strokes per second in both movies. Both movies have same components i.e. the hand not moving, moving brush, same rubbing frequency. The only difference between “brushing movie” and “non-brushing movie” is whether there is stimulation by the brush or not. 2.4 Data analysis Eleven clear MEG data were analyzed using the “Brainstorm” software. Excluded data was due to drowsiness during measurements. Coherence value was calculated as an index for functional connectivity between somatosensory regions. The coherence value is a measure of the degree of relationship between two signals. It’s represented by a number of 0 to 1, zero mean there is no correlation and closer to 1 indicates a correlation. .In preparation for calculating coherence value by brainstorm, the artifacts (electrooculogram: EOG, electrocardiogram: ECG) rejection were applied to measured data. From the participant’s anatomical head information measured by 3D digitizer, individual structural template was
- 33 -
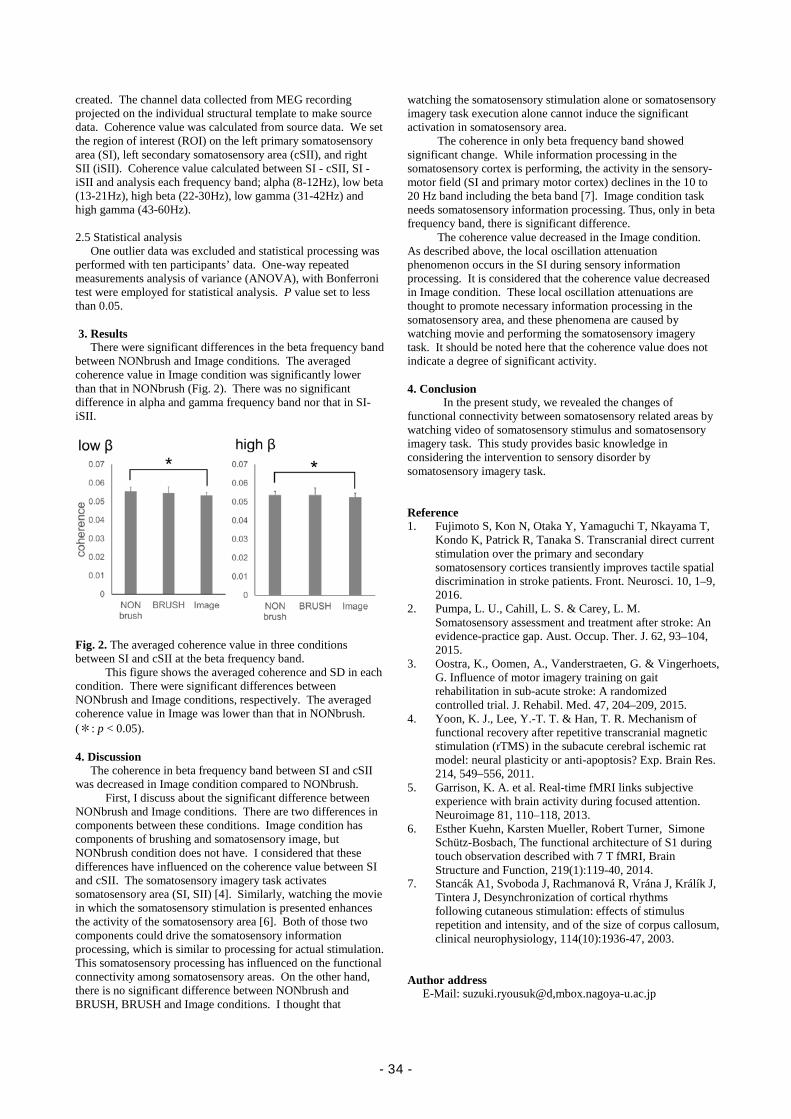
created. The channel data collected from MEG recording projected on the individual structural template to make source data. Coherence value was calculated from source data. We set the region of interest (ROI) on the left primary somatosensory area (SI), left secondary somatosensory area (cSII), and right SII (iSII). Coherence value calculated between SI - cSII, SI - iSII and analysis each frequency band; alpha (8-12Hz), low beta (13-21Hz), high beta (22-30Hz), low gamma (31-42Hz) and high gamma (43-60Hz). 2.5 Statistical analysis One outlier data was excluded and statistical processing was performed with ten participants’ data. One-way repeated measurements analysis of variance (ANOVA), with Bonferroni test were employed for statistical analysis. P value set to less than 0.05. 3. Results There were significant differences in the beta frequency band between NONbrush and Image conditions. The averaged coherence value in Image condition was significantly lower than that in NONbrush (Fig. 2). There was no significant difference in alpha and gamma frequency band nor that in SI-iSII.
Fig. 2. The averaged coherence value in three conditions between SI and cSII at the beta frequency band.
This figure shows the averaged coherence and SD in each condition. There were significant differences between NONbrush and Image conditions, respectively. The averaged coherence value in Image was lower than that in NONbrush. (*: p < 0.05). 4. Discussion The coherence in beta frequency band between SI and cSII was decreased in Image condition compared to NONbrush.
First, I discuss about the significant difference between NONbrush and Image conditions. There are two differences in components between these conditions. Image condition has components of brushing and somatosensory image, but NONbrush condition does not have. I considered that these differences have influenced on the coherence value between SI and cSII. The somatosensory imagery task activates somatosensory area (SI, SII) [4]. Similarly, watching the movie in which the somatosensory stimulation is presented enhances the activity of the somatosensory area [6]. Both of those two components could drive the somatosensory information processing, which is similar to processing for actual stimulation. This somatosensory processing has influenced on the functional connectivity among somatosensory areas. On the other hand, there is no significant difference between NONbrush and BRUSH, BRUSH and Image conditions. I thought that
watching the somatosensory stimulation alone or somatosensory imagery task execution alone cannot induce the significant activation in somatosensory area.
The coherence in only beta frequency band showed significant change. While information processing in the somatosensory cortex is performing, the activity in the sensory-motor field (SI and primary motor cortex) declines in the 10 to 20 Hz band including the beta band [7]. Image condition task needs somatosensory information processing. Thus, only in beta frequency band, there is significant difference.
The coherence value decreased in the Image condition. As described above, the local oscillation attenuation phenomenon occurs in the SI during sensory information processing. It is considered that the coherence value decreased in Image condition. These local oscillation attenuations are thought to promote necessary information processing in the somatosensory area, and these phenomena are caused by watching movie and performing the somatosensory imagery task. It should be noted here that the coherence value does not indicate a degree of significant activity. 4. Conclusion
In the present study, we revealed the changes of functional connectivity between somatosensory related areas by watching video of somatosensory stimulus and somatosensory imagery task. This study provides basic knowledge in considering the intervention to sensory disorder by somatosensory imagery task. Reference 1. Fujimoto S, Kon N, Otaka Y, Yamaguchi T, Nkayama T,
Kondo K, Patrick R, Tanaka S. Transcranial direct current stimulation over the primary and secondary somatosensory cortices transiently improves tactile spatial discrimination in stroke patients. Front. Neurosci. 10, 1–9, 2016.
2. Pumpa, L. U., Cahill, L. S. & Carey, L. M. Somatosensory assessment and treatment after stroke: An evidence-practice gap. Aust. Occup. Ther. J. 62, 93–104, 2015.
3. Oostra, K., Oomen, A., Vanderstraeten, G. & Vingerhoets, G. Influence of motor imagery training on gait rehabilitation in sub-acute stroke: A randomized controlled trial. J. Rehabil. Med. 47, 204–209, 2015.
4. Yoon, K. J., Lee, Y.-T. T. & Han, T. R. Mechanism of functional recovery after repetitive transcranial magnetic stimulation (rTMS) in the subacute cerebral ischemic rat model: neural plasticity or anti-apoptosis? Exp. Brain Res. 214, 549–556, 2011.
5. Garrison, K. A. et al. Real-time fMRI links subjective experience with brain activity during focused attention. Neuroimage 81, 110–118, 2013.
6. Esther Kuehn, Karsten Mueller, Robert Turner, Simone Schütz-Bosbach, The functional architecture of S1 during touch observation described with 7 T fMRI, Brain Structure and Function, 219(1):119-40, 2014.
7. Stancák A1, Svoboda J, Rachmanová R, Vrána J, Králík J, Tintera J, Desynchronization of cortical rhythms following cutaneous stimulation: effects of stimulus repetition and intensity, and of the size of corpus callosum, clinical neurophysiology, 114(10):1936-47, 2003.
Author address E-Mail: suzuki.ryousuk@d,mbox.nagoya-u.ac.jp
- 34 -
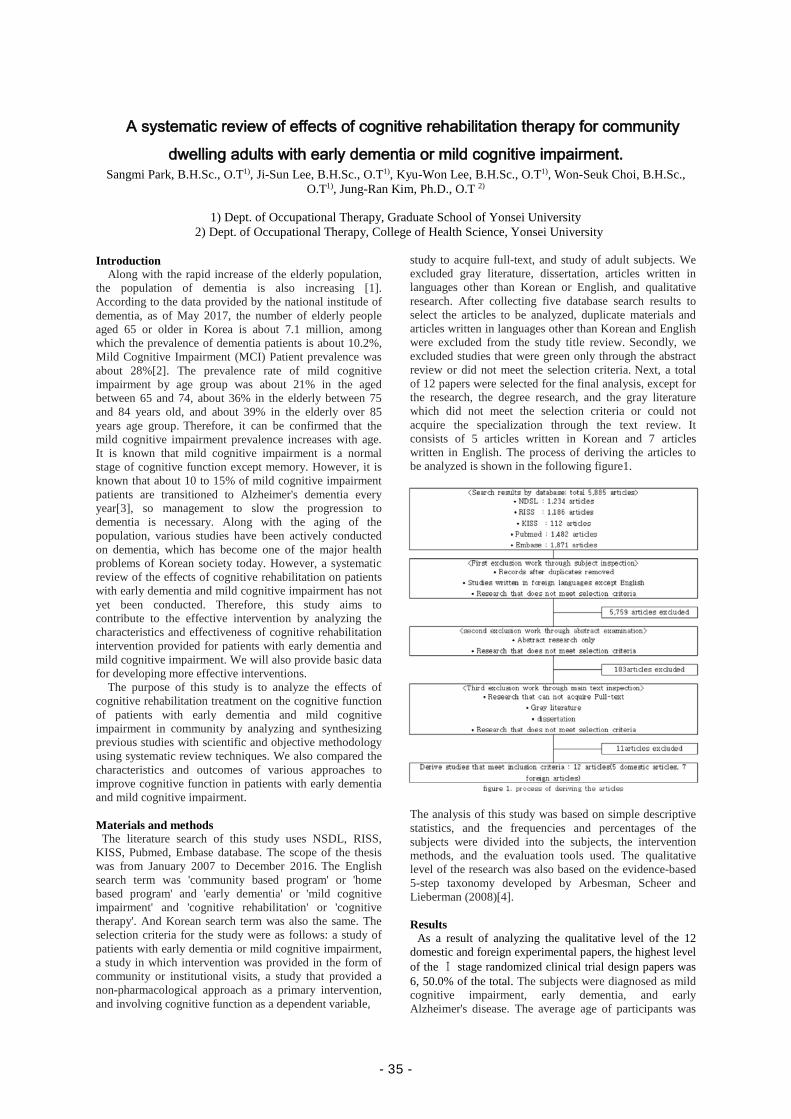
A systematic review of effects of cognitive rehabilitation therapy for community dwelling adults with early dementia or mild cognitive impairment.
Sangmi Park, B.H.Sc., O.T1), Ji-Sun Lee, B.H.Sc., O.T1), Kyu-Won Lee, B.H.Sc., O.T1), Won-Seuk Choi, B.H.Sc., O.T1), Jung-Ran Kim, Ph.D., O.T 2)
1) Dept. of Occupational Therapy, Graduate School of Yonsei University
2) Dept. of Occupational Therapy, College of Health Science, Yonsei University Introduction
Along with the rapid increase of the elderly population, the population of dementia is also increasing [1]. According to the data provided by the national institude of dementia, as of May 2017, the number of elderly people aged 65 or older in Korea is about 7.1 million, among which the prevalence of dementia patients is about 10.2%, Mild Cognitive Impairment (MCI) Patient prevalence was about 28%[2]. The prevalence rate of mild cognitive impairment by age group was about 21% in the aged between 65 and 74, about 36% in the elderly between 75 and 84 years old, and about 39% in the elderly over 85 years age group. Therefore, it can be confirmed that the mild cognitive impairment prevalence increases with age. It is known that mild cognitive impairment is a normal stage of cognitive function except memory. However, it is known that about 10 to 15% of mild cognitive impairment patients are transitioned to Alzheimer's dementia every year[3], so management to slow the progression to dementia is necessary. Along with the aging of the population, various studies have been actively conducted on dementia, which has become one of the major health problems of Korean society today. However, a systematic review of the effects of cognitive rehabilitation on patients with early dementia and mild cognitive impairment has not yet been conducted. Therefore, this study aims to contribute to the effective intervention by analyzing the characteristics and effectiveness of cognitive rehabilitation intervention provided for patients with early dementia and mild cognitive impairment. We will also provide basic data for developing more effective interventions.
The purpose of this study is to analyze the effects of cognitive rehabilitation treatment on the cognitive function of patients with early dementia and mild cognitive impairment in community by analyzing and synthesizing previous studies with scientific and objective methodology using systematic review techniques. We also compared the characteristics and outcomes of various approaches to improve cognitive function in patients with early dementia and mild cognitive impairment.
Materials and methods
The literature search of this study uses NSDL, RISS, KISS, Pubmed, Embase database. The scope of the thesis was from January 2007 to December 2016. The English search term was 'community based program' or 'home based program' and 'early dementia' or 'mild cognitive impairment' and 'cognitive rehabilitation' or 'cognitive therapy'. And Korean search term was also the same. The selection criteria for the study were as follows: a study of patients with early dementia or mild cognitive impairment, a study in which intervention was provided in the form of community or institutional visits, a study that provided a non-pharmacological approach as a primary intervention, and involving cognitive function as a dependent variable,
study to acquire full-text, and study of adult subjects. We excluded gray literature, dissertation, articles written in languages other than Korean or English, and qualitative research. After collecting five database search results to select the articles to be analyzed, duplicate materials and articles written in languages other than Korean and English were excluded from the study title review. Secondly, we excluded studies that were green only through the abstract review or did not meet the selection criteria. Next, a total of 12 papers were selected for the final analysis, except for the research, the degree research, and the gray literature which did not meet the selection criteria or could not acquire the specialization through the text review. It consists of 5 articles written in Korean and 7 articles written in English. The process of deriving the articles to be analyzed is shown in the following figure1.
The analysis of this study was based on simple descriptive statistics, and the frequencies and percentages of the subjects were divided into the subjects, the intervention methods, and the evaluation tools used. The qualitative level of the research was also based on the evidence-based 5-step taxonomy developed by Arbesman, Scheer and Lieberman (2008)[4]. Results As a result of analyzing the qualitative level of the 12 domestic and foreign experimental papers, the highest level of the Ⅰ stage randomized clinical trial design papers was 6, 50.0% of the total. The subjects were diagnosed as mild cognitive impairment, early dementia, and early Alzheimer's disease. The average age of participants was
- 35 -
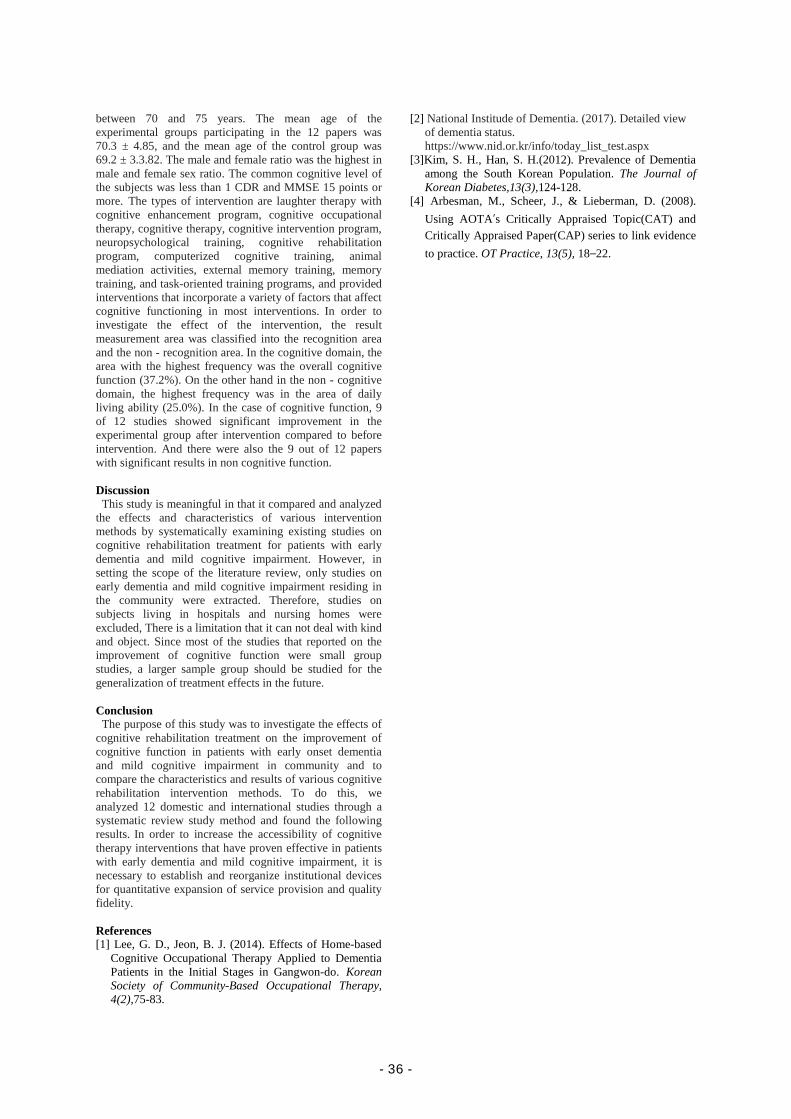
between 70 and 75 years. The mean age of the experimental groups participating in the 12 papers was 70.3 ± 4.85, and the mean age of the control group was 69.2 ± 3.3.82. The male and female ratio was the highest in male and female sex ratio. The common cognitive level of the subjects was less than 1 CDR and MMSE 15 points or more. The types of intervention are laughter therapy with cognitive enhancement program, cognitive occupational therapy, cognitive therapy, cognitive intervention program, neuropsychological training, cognitive rehabilitation program, computerized cognitive training, animal mediation activities, external memory training, memory training, and task-oriented training programs, and provided interventions that incorporate a variety of factors that affect cognitive functioning in most interventions. In order to investigate the effect of the intervention, the result measurement area was classified into the recognition area and the non - recognition area. In the cognitive domain, the area with the highest frequency was the overall cognitive function (37.2%). On the other hand in the non - cognitive domain, the highest frequency was in the area of daily living ability (25.0%). In the case of cognitive function, 9 of 12 studies showed significant improvement in the experimental group after intervention compared to before intervention. And there were also the 9 out of 12 papers with significant results in non cognitive function. Discussion This study is meaningful in that it compared and analyzed the effects and characteristics of various intervention methods by systematically examining existing studies on cognitive rehabilitation treatment for patients with early dementia and mild cognitive impairment. However, in setting the scope of the literature review, only studies on early dementia and mild cognitive impairment residing in the community were extracted. Therefore, studies on subjects living in hospitals and nursing homes were excluded, There is a limitation that it can not deal with kind and object. Since most of the studies that reported on the improvement of cognitive function were small group studies, a larger sample group should be studied for the generalization of treatment effects in the future. Conclusion The purpose of this study was to investigate the effects of cognitive rehabilitation treatment on the improvement of cognitive function in patients with early onset dementia and mild cognitive impairment in community and to compare the characteristics and results of various cognitive rehabilitation intervention methods. To do this, we analyzed 12 domestic and international studies through a systematic review study method and found the following results. In order to increase the accessibility of cognitive therapy interventions that have proven effective in patients with early dementia and mild cognitive impairment, it is necessary to establish and reorganize institutional devices for quantitative expansion of service provision and quality fidelity. References [1] Lee, G. D., Jeon, B. J. (2014). Effects of Home-based
Cognitive Occupational Therapy Applied to Dementia Patients in the Initial Stages in Gangwon-do. Korean Society of Community-Based Occupational Therapy, 4(2),75-83.
[2] National Institude of Dementia. (2017). Detailed view of dementia status. https://www.nid.or.kr/info/today_list_test.aspx
[3]Kim, S. H., Han, S. H.(2012). Prevalence of Dementia among the South Korean Population. The Journal of Korean Diabetes,13(3),124-128.
[4] Arbesman, M., Scheer, J., & Lieberman, D. (2008). Using AOTA’s Critically Appraised Topic(CAT) and Critically Appraised Paper(CAP) series to link evidence to practice. OT Practice, 13(5), 18–22.
- 36 -
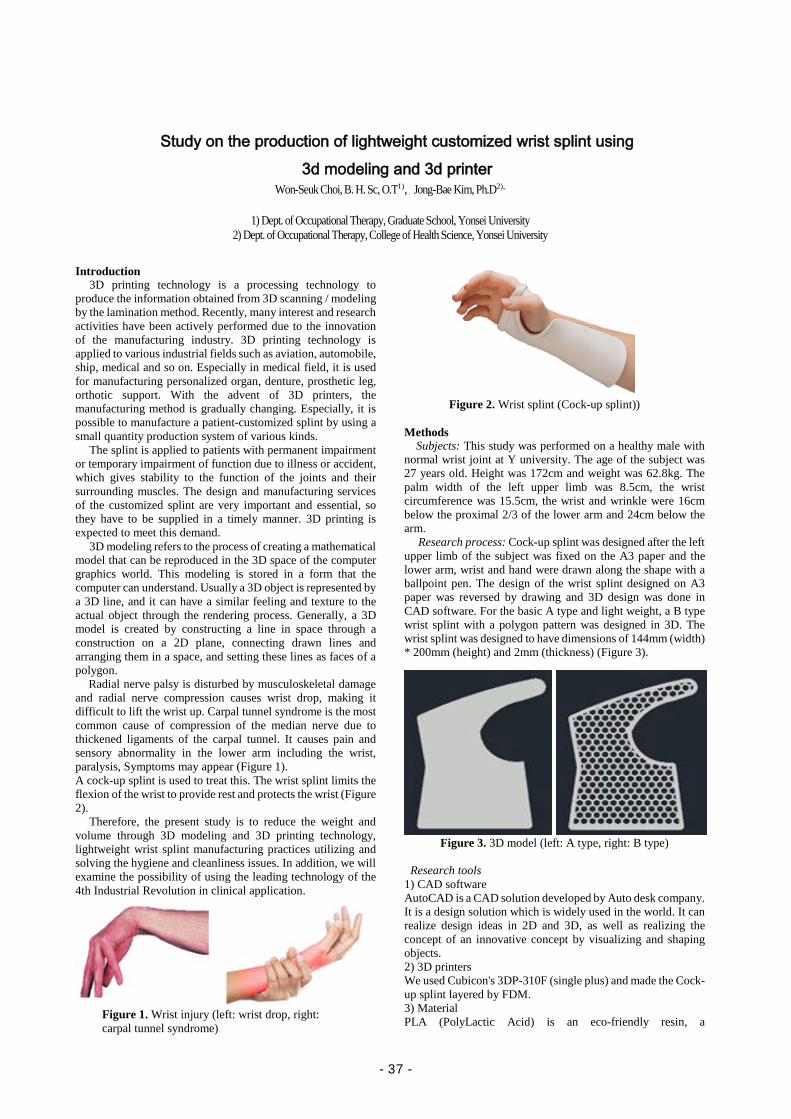
Study on the production of lightweight customized wrist splint using 3d modeling and 3d printer
Won-Seuk Choi, B. H. Sc, O.T1), Jong-Bae Kim, Ph.D2),
1) Dept. of Occupational Therapy, Graduate School, Yonsei University 2) Dept. of Occupational Therapy, College of Health Science, Yonsei University
Introduction 3D printing technology is a processing technology to
produce the information obtained from 3D scanning / modeling by the lamination method. Recently, many interest and research activities have been actively performed due to the innovation of the manufacturing industry. 3D printing technology is applied to various industrial fields such as aviation, automobile, ship, medical and so on. Especially in medical field, it is used for manufacturing personalized organ, denture, prosthetic leg, orthotic support. With the advent of 3D printers, the manufacturing method is gradually changing. Especially, it is possible to manufacture a patient-customized splint by using a small quantity production system of various kinds.
The splint is applied to patients with permanent impairment or temporary impairment of function due to illness or accident, which gives stability to the function of the joints and their surrounding muscles. The design and manufacturing services of the customized splint are very important and essential, so they have to be supplied in a timely manner. 3D printing is expected to meet this demand.
3D modeling refers to the process of creating a mathematical model that can be reproduced in the 3D space of the computer graphics world. This modeling is stored in a form that the computer can understand. Usually a 3D object is represented by a 3D line, and it can have a similar feeling and texture to the actual object through the rendering process. Generally, a 3D model is created by constructing a line in space through a construction on a 2D plane, connecting drawn lines and arranging them in a space, and setting these lines as faces of a polygon.
Radial nerve palsy is disturbed by musculoskeletal damage and radial nerve compression causes wrist drop, making it difficult to lift the wrist up. Carpal tunnel syndrome is the most common cause of compression of the median nerve due to thickened ligaments of the carpal tunnel. It causes pain and sensory abnormality in the lower arm including the wrist, paralysis, Symptoms may appear (Figure 1). A cock-up splint is used to treat this. The wrist splint limits the flexion of the wrist to provide rest and protects the wrist (Figure 2).
Therefore, the present study is to reduce the weight and volume through 3D modeling and 3D printing technology, lightweight wrist splint manufacturing practices utilizing and solving the hygiene and cleanliness issues. In addition, we will examine the possibility of using the leading technology of the 4th Industrial Revolution in clinical application.
Figure 1. Wrist injury (left: wrist drop, right: carpal tunnel syndrome)
Figure 2. Wrist splint (Cock-up splint)) Methods
Subjects: This study was performed on a healthy male with normal wrist joint at Y university. The age of the subject was 27 years old. Height was 172cm and weight was 62.8kg. The palm width of the left upper limb was 8.5cm, the wrist circumference was 15.5cm, the wrist and wrinkle were 16cm below the proximal 2/3 of the lower arm and 24cm below the arm.
Research process: Cock-up splint was designed after the left upper limb of the subject was fixed on the A3 paper and the lower arm, wrist and hand were drawn along the shape with a ballpoint pen. The design of the wrist splint designed on A3 paper was reversed by drawing and 3D design was done in CAD software. For the basic A type and light weight, a B type wrist splint with a polygon pattern was designed in 3D. The wrist splint was designed to have dimensions of 144mm (width) * 200mm (height) and 2mm (thickness) (Figure 3).
Figure 3. 3D model (left: A type, right: B type)
Research tools 1) CAD software AutoCAD is a CAD solution developed by Auto desk company. It is a design solution which is widely used in the world. It can realize design ideas in 2D and 3D, as well as realizing the concept of an innovative concept by visualizing and shaping objects. 2) 3D printers We used Cubicon's 3DP-310F (single plus) and made the Cock-up splint layered by FDM. 3) Material PLA (PolyLactic Acid) is an eco-friendly resin, a
- 37 -
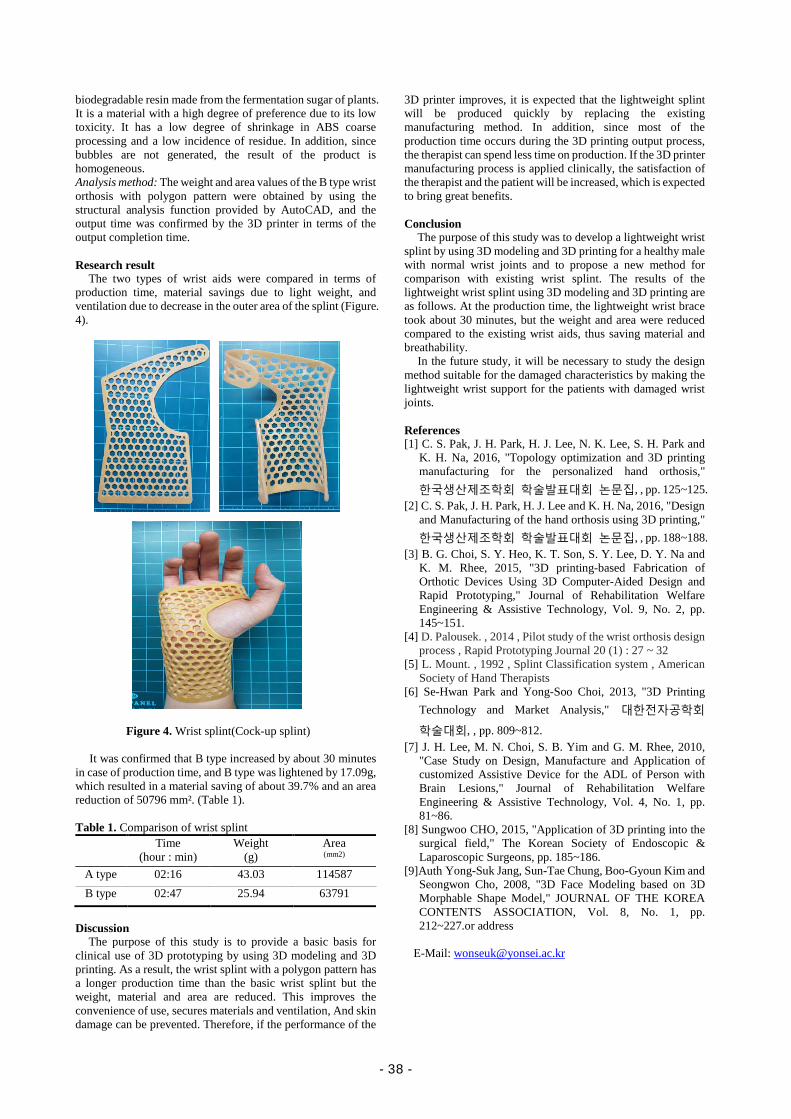
biodegradable resin made from the fermentation sugar of plants. It is a material with a high degree of preference due to its low toxicity. It has a low degree of shrinkage in ABS coarse processing and a low incidence of residue. In addition, since bubbles are not generated, the result of the product is homogeneous. Analysis method: The weight and area values of the B type wrist orthosis with polygon pattern were obtained by using the structural analysis function provided by AutoCAD, and the output time was confirmed by the 3D printer in terms of the output completion time. Research result
The two types of wrist aids were compared in terms of production time, material savings due to light weight, and ventilation due to decrease in the outer area of the splint (Figure. 4).
Figure 4. Wrist splint(Cock-up splint)
It was confirmed that B type increased by about 30 minutes
in case of production time, and B type was lightened by 17.09g, which resulted in a material saving of about 39.7% and an area reduction of 50796 mm². (Table 1). Table 1. Comparison of wrist splint
Time (hour : min)
Weight (g)
Area (mm2)
A type 02:16 43.03 114587 B type 02:47 25.94 63791
Discussion
The purpose of this study is to provide a basic basis for clinical use of 3D prototyping by using 3D modeling and 3D printing. As a result, the wrist splint with a polygon pattern has a longer production time than the basic wrist splint but the weight, material and area are reduced. This improves the convenience of use, secures materials and ventilation, And skin damage can be prevented. Therefore, if the performance of the
3D printer improves, it is expected that the lightweight splint will be produced quickly by replacing the existing manufacturing method. In addition, since most of the production time occurs during the 3D printing output process, the therapist can spend less time on production. If the 3D printer manufacturing process is applied clinically, the satisfaction of the therapist and the patient will be increased, which is expected to bring great benefits. Conclusion
The purpose of this study was to develop a lightweight wrist splint by using 3D modeling and 3D printing for a healthy male with normal wrist joints and to propose a new method for comparison with existing wrist splint. The results of the lightweight wrist splint using 3D modeling and 3D printing are as follows. At the production time, the lightweight wrist brace took about 30 minutes, but the weight and area were reduced compared to the existing wrist aids, thus saving material and breathability.
In the future study, it will be necessary to study the design method suitable for the damaged characteristics by making the lightweight wrist support for the patients with damaged wrist joints. References [1] C. S. Pak, J. H. Park, H. J. Lee, N. K. Lee, S. H. Park and
K. H. Na, 2016, "Topology optimization and 3D printing manufacturing for the personalized hand orthosis," 한국생산제조학회 학술발표대회 논문집, , pp. 125~125.
[2] C. S. Pak, J. H. Park, H. J. Lee and K. H. Na, 2016, "Design and Manufacturing of the hand orthosis using 3D printing," 한국생산제조학회 학술발표대회 논문집, , pp. 188~188.
[3] B. G. Choi, S. Y. Heo, K. T. Son, S. Y. Lee, D. Y. Na and K. M. Rhee, 2015, "3D printing-based Fabrication of Orthotic Devices Using 3D Computer-Aided Design and Rapid Prototyping," Journal of Rehabilitation Welfare Engineering & Assistive Technology, Vol. 9, No. 2, pp. 145~151.
[4] D. Palousek. , 2014 , Pilot study of the wrist orthosis design process , Rapid Prototyping Journal 20 (1) : 27 ~ 32
[5] L. Mount. , 1992 , Splint Classification system , American Society of Hand Therapists
[6] Se-Hwan Park and Yong-Soo Choi, 2013, "3D Printing Technology and Market Analysis," 대한전자공학회
학술대회, , pp. 809~812. [7] J. H. Lee, M. N. Choi, S. B. Yim and G. M. Rhee, 2010,
"Case Study on Design, Manufacture and Application of customized Assistive Device for the ADL of Person with Brain Lesions," Journal of Rehabilitation Welfare Engineering & Assistive Technology, Vol. 4, No. 1, pp. 81~86.
[8] Sungwoo CHO, 2015, "Application of 3D printing into the surgical field," The Korean Society of Endoscopic & Laparoscopic Surgeons, pp. 185~186.
[9]Auth Yong-Suk Jang, Sun-Tae Chung, Boo-Gyoun Kim and Seongwon Cho, 2008, "3D Face Modeling based on 3D Morphable Shape Model," JOURNAL OF THE KOREA CONTENTS ASSOCIATION, Vol. 8, No. 1, pp. 212~227.or address
E-Mail: [email protected]
- 38 -

Abstract
Radiological Science and
Technology
- 39 -

- 40 -

Exchange Meeting
* Date: 2017.11.02.
* Place: Baekun Hall 534
11:00~11:10 Opening Session Prof. Chul-Hee Min (Yonsei Univ.)
11:10~12:10 Session I Chair: Prof. Masataka Komori and Chul Hee Min 11:10~11:25 Development of SiPM based Scintillation Detector for Energy
Selective X-ray Imaging C. W. Park, K. B. Kim, H. K. Song, I. S. Kang, and Y. H. Chung (Yonsei Univ.)
11:25~11:40 Quantification of in vivo 1H Spectrum Using an Experimentally measured basis-set at 9.4 T C. S. Yoon, Y. H. Hwang, M. H. Lee, Areum Min, H. M. Baek, B. S. Han, and D. Y. Kim (Yonsei Univ.)
11:40~11:55 A Method to Detect Arterial Thrombosis Using 3D cine Phase Contrast Magnetic Resonance Imaging T. Mizuno, H. Lsoda, S, Tajima, R. Perera, T. Izumi, T. Tsukada, S. Naganawa (Nagoya Univ.)
11:55~12:10 Development of the Accurate Skin Dose Evaluation Techniques Using Tetrahedral-Mesh-Based Computational Human Phantom B. W. Cheon, D. H. Yoo, H. J. Choi, H. J. Park, J. I. Park, C. H.Min (Yonsei Univ.)
12:30~14:00 Lunch
- 41 -

14:00~15:00 Session II Chair: Prof. Masataka Komori and Chul Hee Min
14:00~14:15 Single Projection-Based New Software Scheme for Scatter Correction K. S. Kim, S. Y. Kang, W. S. Kim, H. S. Cho (Yonsei Univ.)
14:15~14:30 Estimation of Optical Artifacts in Luminescence Imaging of Water during Proton-Beam Irradiations T. Yabe, M. Komori, R. Horita, H. Oguchi, T. Toshito, and S. Yamamoto (Nagoya Univ.)
14:30~14:45 Beam-Quality Factor Evaluation for Passive Scattering Proton Therapy with Farmer Type Ionization Chamber Using Monte Carlo Method J. W. Jang, W. G. Shin, and C. H. Min (Yonsei Univ.)
14:45~15:00 Breast-Dedicated PET System with a Personalized Gantry I. S. Kang, C. W. Park, H. K. Song, K. B. Kim, Y. H. Chung (Yonsei
Univ.)
15:00~15:10 Closing Remark Prof. Masataka Komori (Nagoya Univ.)
15:10~15:20 Group Photos
※ 12 minutes presentation and 3 minutes Q&A
- 42 -
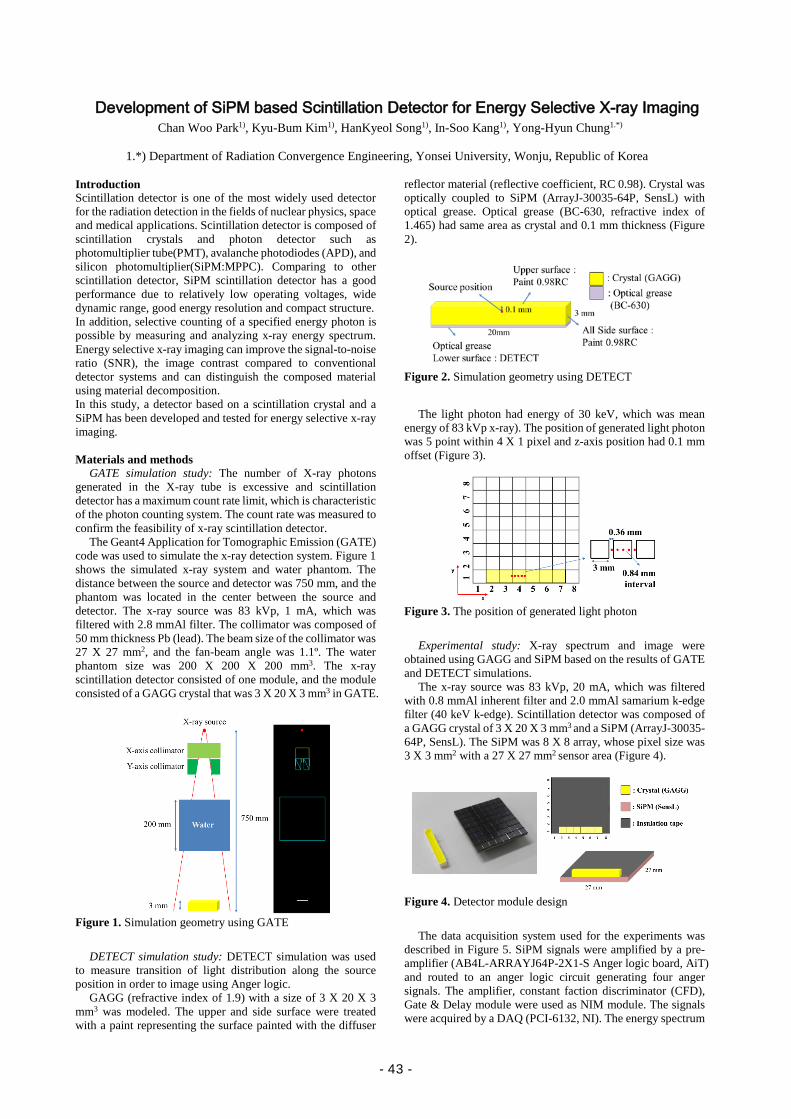
Development of SiPM based Scintillation Detector for Energy Selective X-ray Imaging Chan Woo Park1), Kyu-Bum Kim1), HanKyeol Song1), In-Soo Kang1), Yong-Hyun Chung1.*)
1.*) Department of Radiation Convergence Engineering, Yonsei University, Wonju, Republic of Korea
Introduction Scintillation detector is one of the most widely used detector for the radiation detection in the fields of nuclear physics, space and medical applications. Scintillation detector is composed of scintillation crystals and photon detector such as photomultiplier tube(PMT), avalanche photodiodes (APD), and silicon photomultiplier(SiPM:MPPC). Comparing to other scintillation detector, SiPM scintillation detector has a good performance due to relatively low operating voltages, wide dynamic range, good energy resolution and compact structure. In addition, selective counting of a specified energy photon is possible by measuring and analyzing x-ray energy spectrum. Energy selective x-ray imaging can improve the signal-to-noise ratio (SNR), the image contrast compared to conventional detector systems and can distinguish the composed material using material decomposition. In this study, a detector based on a scintillation crystal and a SiPM has been developed and tested for energy selective x-ray imaging. Materials and methods
GATE simulation study: The number of X-ray photons generated in the X-ray tube is excessive and scintillation detector has a maximum count rate limit, which is characteristic of the photon counting system. The count rate was measured to confirm the feasibility of x-ray scintillation detector.
The Geant4 Application for Tomographic Emission (GATE) code was used to simulate the x-ray detection system. Figure 1 shows the simulated x-ray system and water phantom. The distance between the source and detector was 750 mm, and the phantom was located in the center between the source and detector. The x-ray source was 83 kVp, 1 mA, which was filtered with 2.8 mmAl filter. The collimator was composed of 50 mm thickness Pb (lead). The beam size of the collimator was 27 X 27 mm2, and the fan-beam angle was 1.1º. The water phantom size was 200 X 200 X 200 mm3. The x-ray scintillation detector consisted of one module, and the module consisted of a GAGG crystal that was 3 X 20 X 3 mm3 in GATE.
Figure 1. Simulation geometry using GATE
DETECT simulation study: DETECT simulation was used
to measure transition of light distribution along the source position in order to image using Anger logic.
GAGG (refractive index of 1.9) with a size of 3 X 20 X 3 mm3 was modeled. The upper and side surface were treated with a paint representing the surface painted with the diffuser
reflector material (reflective coefficient, RC 0.98). Crystal was optically coupled to SiPM (ArrayJ-30035-64P, SensL) with optical grease. Optical grease (BC-630, refractive index of 1.465) had same area as crystal and 0.1 mm thickness (Figure 2).
Figure 2. Simulation geometry using DETECT
The light photon had energy of 30 keV, which was mean
energy of 83 kVp x-ray). The position of generated light photon was 5 point within 4 X 1 pixel and z-axis position had 0.1 mm offset (Figure 3).
Figure 3. The position of generated light photon
Experimental study: X-ray spectrum and image were
obtained using GAGG and SiPM based on the results of GATE and DETECT simulations.
The x-ray source was 83 kVp, 20 mA, which was filtered with 0.8 mmAl inherent filter and 2.0 mmAl samarium k-edge filter (40 keV k-edge). Scintillation detector was composed of a GAGG crystal of 3 X 20 X 3 mm3 and a SiPM (ArrayJ-30035-64P, SensL). The SiPM was 8 X 8 array, whose pixel size was 3 X 3 mm2 with a 27 X 27 mm2 sensor area (Figure 4).
Figure 4. Detector module design
The data acquisition system used for the experiments was
described in Figure 5. SiPM signals were amplified by a pre-amplifier (AB4L-ARRAYJ64P-2X1-S Anger logic board, AiT) and routed to an anger logic circuit generating four anger signals. The amplifier, constant faction discriminator (CFD), Gate & Delay module were used as NIM module. The signals were acquired by a DAQ (PCI-6132, NI). The energy spectrum
- 43 -
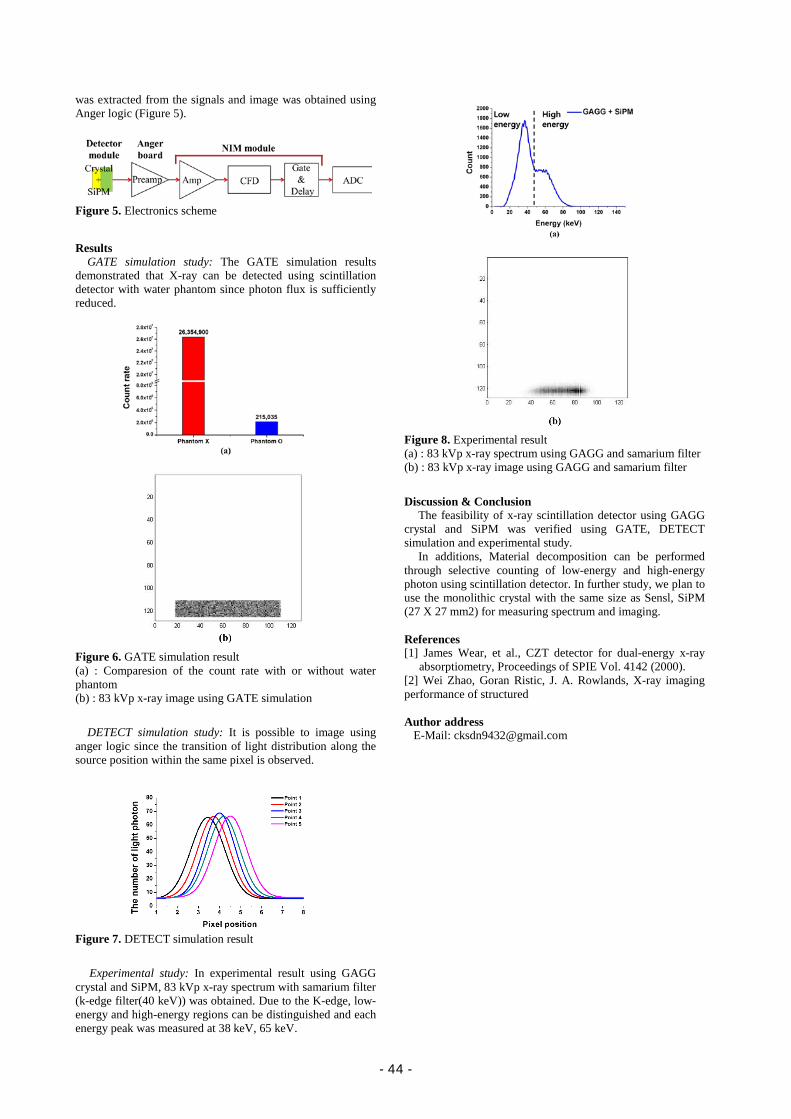
was extracted from the signals and image was obtained using Anger logic (Figure 5).
Figure 5. Electronics scheme
Results
GATE simulation study: The GATE simulation results demonstrated that X-ray can be detected using scintillation detector with water phantom since photon flux is sufficiently reduced.
Figure 6. GATE simulation result (a) : Comparesion of the count rate with or without water phantom (b) : 83 kVp x-ray image using GATE simulation
DETECT simulation study: It is possible to image using
anger logic since the transition of light distribution along the source position within the same pixel is observed.
Figure 7. DETECT simulation result
Experimental study: In experimental result using GAGG
crystal and SiPM, 83 kVp x-ray spectrum with samarium filter (k-edge filter(40 keV)) was obtained. Due to the K-edge, low-energy and high-energy regions can be distinguished and each energy peak was measured at 38 keV, 65 keV.
Figure 8. Experimental result (a) : 83 kVp x-ray spectrum using GAGG and samarium filter (b) : 83 kVp x-ray image using GAGG and samarium filter
Discussion & Conclusion
The feasibility of x-ray scintillation detector using GAGG crystal and SiPM was verified using GATE, DETECT simulation and experimental study.
In additions, Material decomposition can be performed through selective counting of low-energy and high-energy photon using scintillation detector. In further study, we plan to use the monolithic crystal with the same size as Sensl, SiPM (27 X 27 mm2) for measuring spectrum and imaging. References [1] James Wear, et al., CZT detector for dual-energy x-ray
absorptiometry, Proceedings of SPIE Vol. 4142 (2000). [2] Wei Zhao, Goran Ristic, J. A. Rowlands, X-ray imaging performance of structured Author address
E-Mail: [email protected]
- 44 -
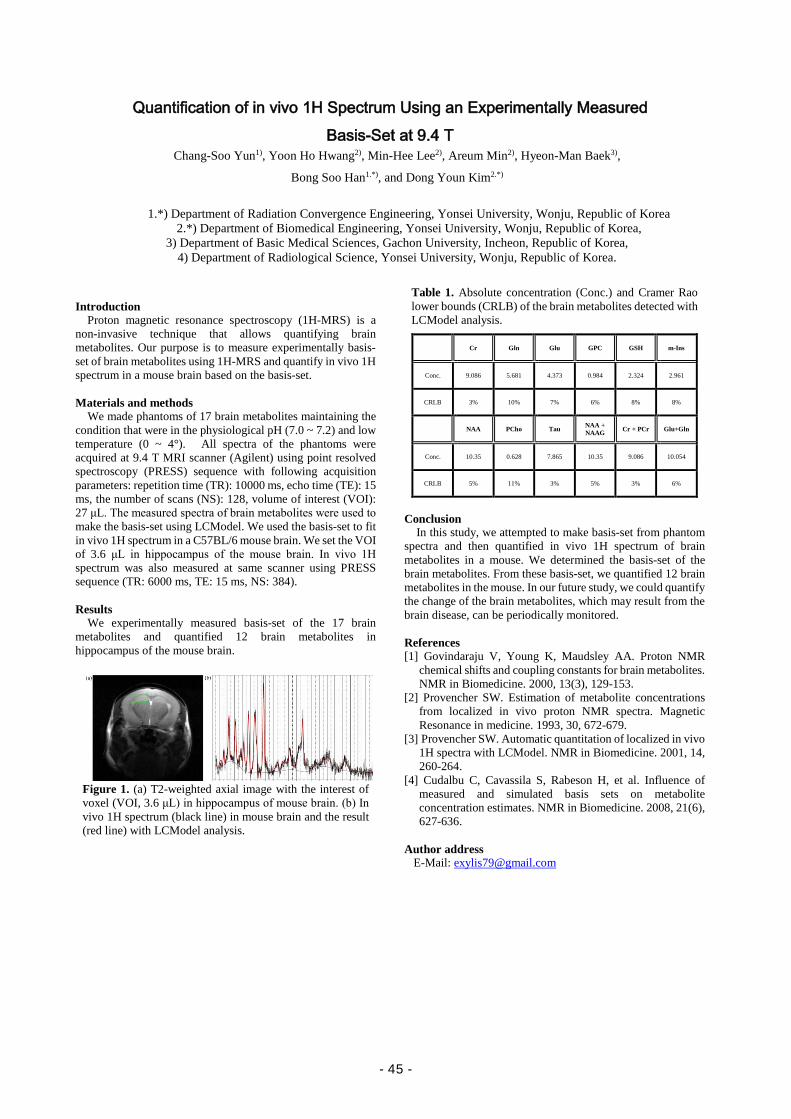
Quantification of in vivo 1H Spectrum Using an Experimentally Measured Basis-Set at 9.4 T
Chang-Soo Yun1), Yoon Ho Hwang2), Min-Hee Lee2), Areum Min2), Hyeon-Man Baek3),
Bong Soo Han1.*), and Dong Youn Kim2.*)
1.*) Department of Radiation Convergence Engineering, Yonsei University, Wonju, Republic of Korea 2.*) Department of Biomedical Engineering, Yonsei University, Wonju, Republic of Korea,
3) Department of Basic Medical Sciences, Gachon University, Incheon, Republic of Korea, 4) Department of Radiological Science, Yonsei University, Wonju, Republic of Korea.
Introduction Proton magnetic resonance spectroscopy (1H-MRS) is a non-invasive technique that allows quantifying brain metabolites. Our purpose is to measure experimentally basis-set of brain metabolites using 1H-MRS and quantify in vivo 1H spectrum in a mouse brain based on the basis-set. Materials and methods We made phantoms of 17 brain metabolites maintaining the condition that were in the physiological pH (7.0 ~ 7.2) and low temperature (0 ~ 4°). All spectra of the phantoms were acquired at 9.4 T MRI scanner (Agilent) using point resolved spectroscopy (PRESS) sequence with following acquisition parameters: repetition time (TR): 10000 ms, echo time (TE): 15 ms, the number of scans (NS): 128, volume of interest (VOI): 27 μL. The measured spectra of brain metabolites were used to make the basis-set using LCModel. We used the basis-set to fit in vivo 1H spectrum in a C57BL/6 mouse brain. We set the VOI of 3.6 μL in hippocampus of the mouse brain. In vivo 1H spectrum was also measured at same scanner using PRESS sequence (TR: 6000 ms, TE: 15 ms, NS: 384). Results We experimentally measured basis-set of the 17 brain metabolites and quantified 12 brain metabolites in hippocampus of the mouse brain.
Figure 1. (a) T2-weighted axial image with the interest of voxel (VOI, 3.6 μL) in hippocampus of mouse brain. (b) In vivo 1H spectrum (black line) in mouse brain and the result (red line) with LCModel analysis.
Table 1. Absolute concentration (Conc.) and Cramer Rao lower bounds (CRLB) of the brain metabolites detected with LCModel analysis.
Cr Gln Glu GPC GSH m-Ins
Conc. 9.086 5.681 4.373 0.984 2.324 2.961
CRLB 3% 10% 7% 6% 8% 8%
NAA PCho Tau NAA + NAAG Cr + PCr Glu+Gln
Conc. 10.35 0.628 7.865 10.35 9.086 10.054
CRLB 5% 11% 3% 5% 3% 6%
Conclusion In this study, we attempted to make basis-set from phantom spectra and then quantified in vivo 1H spectrum of brain metabolites in a mouse. We determined the basis-set of the brain metabolites. From these basis-set, we quantified 12 brain metabolites in the mouse. In our future study, we could quantify the change of the brain metabolites, which may result from the brain disease, can be periodically monitored. References [1] Govindaraju V, Young K, Maudsley AA. Proton NMR
chemical shifts and coupling constants for brain metabolites. NMR in Biomedicine. 2000, 13(3), 129-153.
[2] Provencher SW. Estimation of metabolite concentrations from localized in vivo proton NMR spectra. Magnetic Resonance in medicine. 1993, 30, 672-679.
[3] Provencher SW. Automatic quantitation of localized in vivo 1H spectra with LCModel. NMR in Biomedicine. 2001, 14, 260-264.
[4] Cudalbu C, Cavassila S, Rabeson H, et al. Influence of measured and simulated basis sets on metabolite concentration estimates. NMR in Biomedicine. 2008, 21(6), 627-636.
Author address
E-Mail: [email protected]
- 45 -
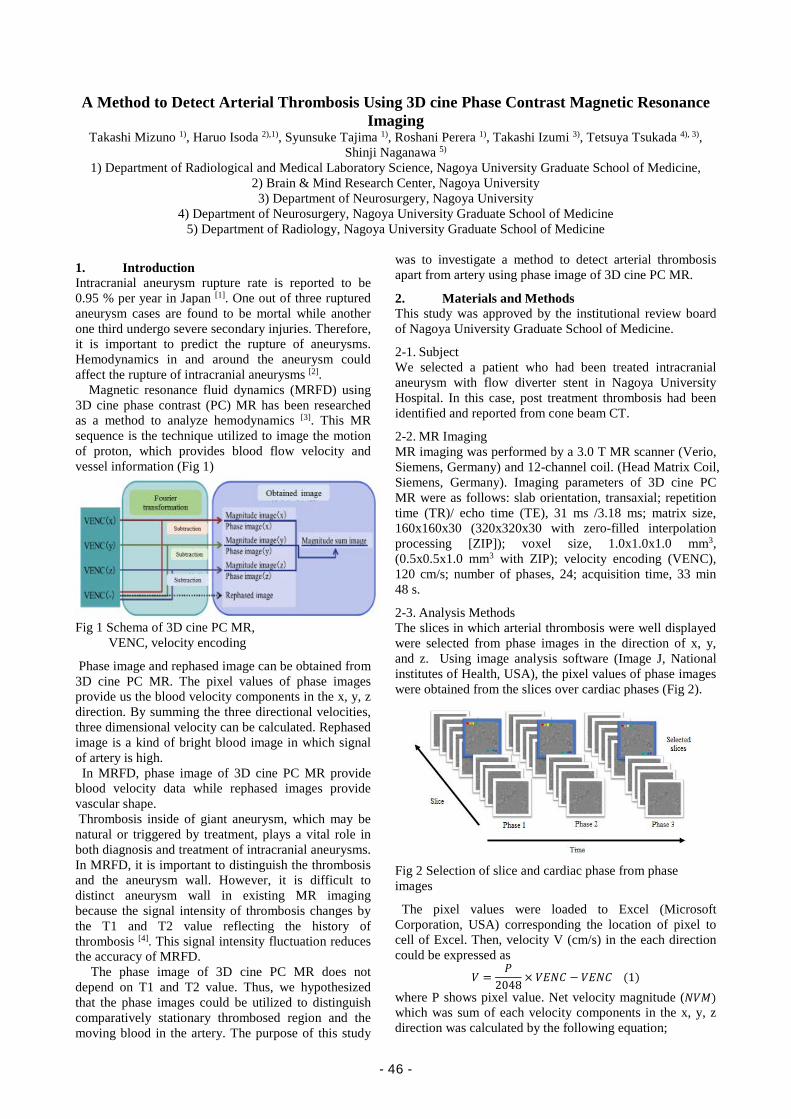
A Method to Detect Arterial Thrombosis Using 3D cine Phase Contrast Magnetic Resonance Imaging
Takashi Mizuno 1), Haruo Isoda 2),1), Syunsuke Tajima 1), Roshani Perera 1), Takashi Izumi 3), Tetsuya Tsukada 4), 3), Shinji Naganawa 5)
1) Department of Radiological and Medical Laboratory Science, Nagoya University Graduate School of Medicine, 2) Brain & Mind Research Center, Nagoya University 3) Department of Neurosurgery, Nagoya University
4) Department of Neurosurgery, Nagoya University Graduate School of Medicine 5) Department of Radiology, Nagoya University Graduate School of Medicine
1. Introduction Intracranial aneurysm rupture rate is reported to be 0.95 % per year in Japan [1]. One out of three ruptured aneurysm cases are found to be mortal while another one third undergo severe secondary injuries. Therefore, it is important to predict the rupture of aneurysms. Hemodynamics in and around the aneurysm could affect the rupture of intracranial aneurysms [2]. Magnetic resonance fluid dynamics (MRFD) using 3D cine phase contrast (PC) MR has been researched as a method to analyze hemodynamics [3]. This MR sequence is the technique utilized to image the motion of proton, which provides blood flow velocity and vessel information (Fig 1)
Fig 1 Schema of 3D cine PC MR,
VENC, velocity encoding
Phase image and rephased image can be obtained from 3D cine PC MR. The pixel values of phase images provide us the blood velocity components in the x, y, z direction. By summing the three directional velocities, three dimensional velocity can be calculated. Rephased image is a kind of bright blood image in which signal of artery is high. In MRFD, phase image of 3D cine PC MR provide blood velocity data while rephased images provide vascular shape. Thrombosis inside of giant aneurysm, which may be natural or triggered by treatment, plays a vital role in both diagnosis and treatment of intracranial aneurysms. In MRFD, it is important to distinguish the thrombosis and the aneurysm wall. However, it is difficult to distinct aneurysm wall in existing MR imaging because the signal intensity of thrombosis changes by the T1 and T2 value reflecting the history of thrombosis [4]. This signal intensity fluctuation reduces the accuracy of MRFD. The phase image of 3D cine PC MR does not depend on T1 and T2 value. Thus, we hypothesized that the phase images could be utilized to distinguish comparatively stationary thrombosed region and the moving blood in the artery. The purpose of this study
was to investigate a method to detect arterial thrombosis apart from artery using phase image of 3D cine PC MR.
2. Materials and Methods This study was approved by the institutional review board of Nagoya University Graduate School of Medicine.
2-1. Subject We selected a patient who had been treated intracranial aneurysm with flow diverter stent in Nagoya University Hospital. In this case, post treatment thrombosis had been identified and reported from cone beam CT.
2-2. MR Imaging MR imaging was performed by a 3.0 T MR scanner (Verio, Siemens, Germany) and 12-channel coil. (Head Matrix Coil, Siemens, Germany). Imaging parameters of 3D cine PC MR were as follows: slab orientation, transaxial; repetition time (TR)/ echo time (TE), 31 ms /3.18 ms; matrix size, 160x160x30 (320x320x30 with zero-filled interpolation processing [ZIP]); voxel size, 1.0x1.0x1.0 mm3, (0.5x0.5x1.0 mm3 with ZIP); velocity encoding (VENC), 120 cm/s; number of phases, 24; acquisition time, 33 min 48 s.
2-3. Analysis Methods The slices in which arterial thrombosis were well displayed were selected from phase images in the direction of x, y, and z. Using image analysis software (Image J, National institutes of Health, USA), the pixel values of phase images were obtained from the slices over cardiac phases (Fig 2).
Fig 2 Selection of slice and cardiac phase from phase images
The pixel values were loaded to Excel (Microsoft Corporation, USA) corresponding the location of pixel to cell of Excel. Then, velocity V (cm/s) in the each direction could be expressed as
𝑉𝑉 =𝑃𝑃
2048× 𝑉𝑉𝑉𝑉𝑉𝑉𝑉𝑉 − 𝑉𝑉𝑉𝑉𝑉𝑉𝑉𝑉 (1)
where P shows pixel value. Net velocity magnitude (𝑉𝑉𝑉𝑉𝑁𝑁) which was sum of each velocity components in the x, y, z direction was calculated by the following equation;
- 46 -
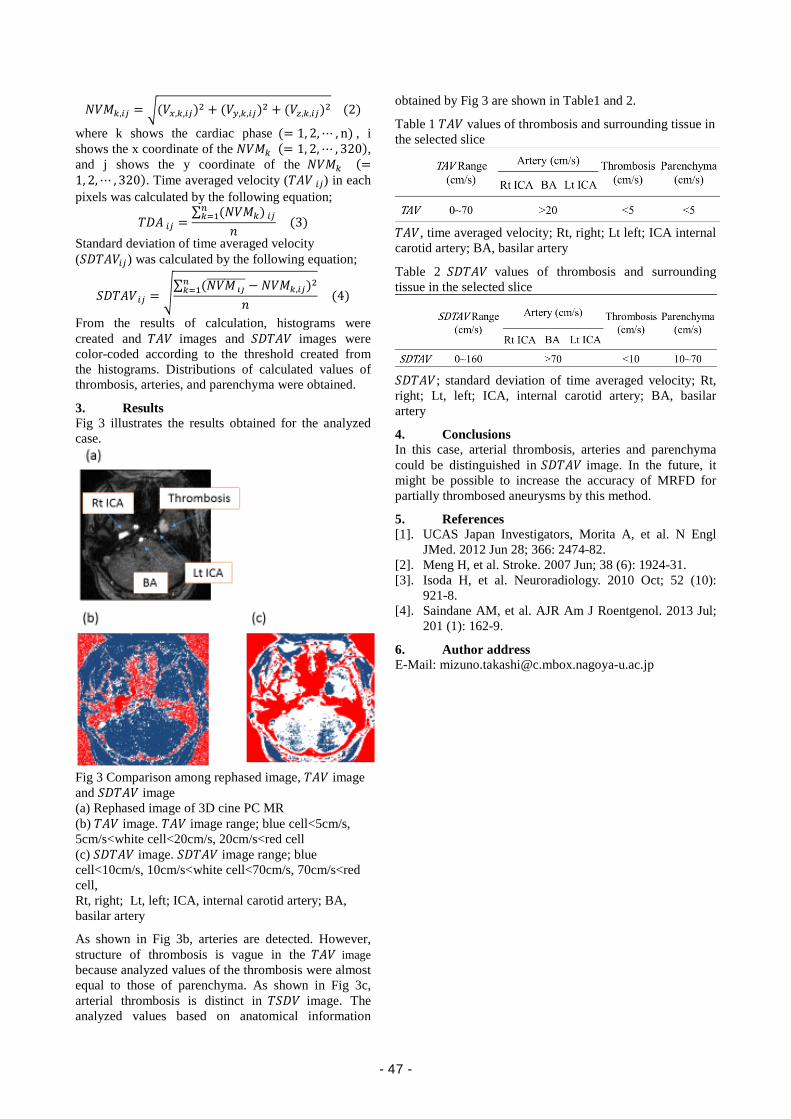
𝑉𝑉𝑉𝑉𝑁𝑁𝑘𝑘,𝑖𝑖𝑖𝑖 = �(𝑉𝑉𝑥𝑥,𝑘𝑘,𝑖𝑖𝑖𝑖)2 + (𝑉𝑉𝑦𝑦,𝑘𝑘,𝑖𝑖𝑖𝑖)2 + (𝑉𝑉𝑧𝑧,𝑘𝑘,𝑖𝑖𝑖𝑖)2 (2)
where k shows the cardiac phase (= 1, 2,⋯ , n) , i shows the x coordinate of the 𝑉𝑉𝑉𝑉𝑁𝑁𝑘𝑘 (= 1, 2,⋯ , 320), and j shows the y coordinate of the 𝑉𝑉𝑉𝑉𝑁𝑁𝑘𝑘 (=1, 2,⋯ , 320). Time averaged velocity (𝑇𝑇𝑇𝑇𝑉𝑉 𝑖𝑖𝑖𝑖) in each pixels was calculated by the following equation;
𝑇𝑇𝑇𝑇𝑇𝑇 𝑖𝑖𝑖𝑖 =∑ (𝑉𝑉𝑉𝑉𝑁𝑁𝑘𝑘) 𝑖𝑖𝑖𝑖𝑛𝑛𝑘𝑘=1
𝑛𝑛 (3)
Standard deviation of time averaged velocity (𝑆𝑆𝑇𝑇𝑇𝑇𝑇𝑇𝑉𝑉𝑖𝑖𝑖𝑖) was calculated by the following equation;
𝑆𝑆𝑇𝑇𝑇𝑇𝑇𝑇𝑉𝑉 𝑖𝑖𝑖𝑖 = �∑ (𝑉𝑉𝑉𝑉𝑁𝑁 𝚤𝚤𝚤𝚤��������� − 𝑉𝑉𝑉𝑉𝑁𝑁𝑘𝑘,𝑖𝑖𝑖𝑖)2𝑛𝑛𝑘𝑘=1
𝑛𝑛 (4)
From the results of calculation, histograms were created and 𝑇𝑇𝑇𝑇𝑉𝑉 images and 𝑆𝑆𝑇𝑇𝑇𝑇𝑇𝑇𝑉𝑉 images were color-coded according to the threshold created from the histograms. Distributions of calculated values of thrombosis, arteries, and parenchyma were obtained.
3. Results Fig 3 illustrates the results obtained for the analyzed case.
Fig 3 Comparison among rephased image, 𝑇𝑇𝑇𝑇𝑉𝑉 image and 𝑆𝑆𝑇𝑇𝑇𝑇𝑇𝑇𝑉𝑉 image (a) Rephased image of 3D cine PC MR (b) 𝑇𝑇𝑇𝑇𝑉𝑉 image. 𝑇𝑇𝑇𝑇𝑉𝑉 image range; blue cell<5cm/s, 5cm/s<white cell<20cm/s, 20cm/s<red cell (c) 𝑆𝑆𝑇𝑇𝑇𝑇𝑇𝑇𝑉𝑉 image. 𝑆𝑆𝑇𝑇𝑇𝑇𝑇𝑇𝑉𝑉 image range; blue cell<10cm/s, 10cm/s<white cell<70cm/s, 70cm/s<red cell, Rt, right; Lt, left; ICA, internal carotid artery; BA, basilar artery
As shown in Fig 3b, arteries are detected. However, structure of thrombosis is vague in the 𝑇𝑇𝑇𝑇𝑉𝑉 image because analyzed values of the thrombosis were almost equal to those of parenchyma. As shown in Fig 3c, arterial thrombosis is distinct in 𝑇𝑇𝑆𝑆𝑇𝑇𝑉𝑉 image. The analyzed values based on anatomical information
obtained by Fig 3 are shown in Table1 and 2.
Table 1 𝑇𝑇𝑇𝑇𝑉𝑉 values of thrombosis and surrounding tissue in the selected slice
𝑇𝑇𝑇𝑇𝑉𝑉 , time averaged velocity; Rt, right; Lt left; ICA internal carotid artery; BA, basilar artery
Table 2 𝑆𝑆𝑇𝑇𝑇𝑇𝑇𝑇𝑉𝑉 values of thrombosis and surrounding tissue in the selected slice
𝑆𝑆𝑇𝑇𝑇𝑇𝑇𝑇𝑉𝑉 ; standard deviation of time averaged velocity; Rt, right; Lt, left; ICA, internal carotid artery; BA, basilar artery
4. Conclusions In this case, arterial thrombosis, arteries and parenchyma could be distinguished in 𝑆𝑆𝑇𝑇𝑇𝑇𝑇𝑇𝑉𝑉 image. In the future, it might be possible to increase the accuracy of MRFD for partially thrombosed aneurysms by this method.
5. References [1]. UCAS Japan Investigators, Morita A, et al. N Engl
JMed. 2012 Jun 28; 366: 2474-82. [2]. Meng H, et al. Stroke. 2007 Jun; 38 (6): 1924-31. [3]. Isoda H, et al. Neuroradiology. 2010 Oct; 52 (10):
921-8. [4]. Saindane AM, et al. AJR Am J Roentgenol. 2013 Jul;
201 (1): 162-9.
6. Author address E-Mail: [email protected]
- 47 -
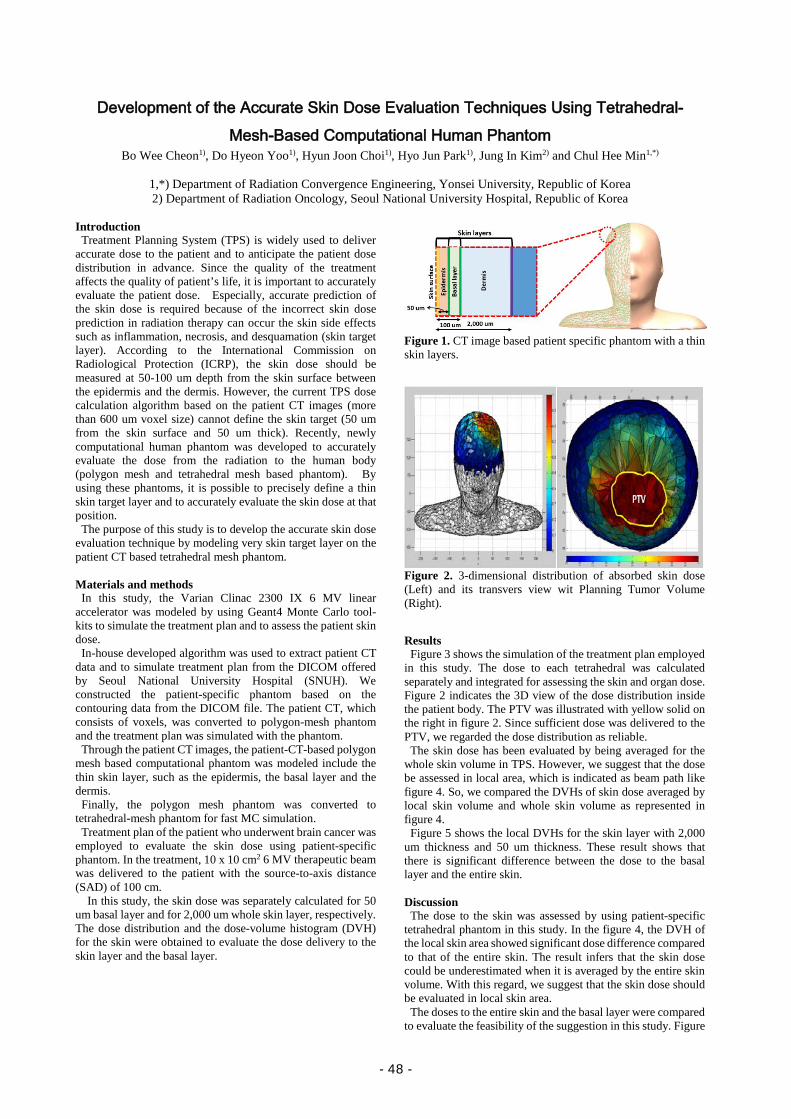
Development of the Accurate Skin Dose Evaluation Techniques Using Tetrahedral-Mesh-Based Computational Human Phantom
Bo Wee Cheon1), Do Hyeon Yoo1), Hyun Joon Choi1), Hyo Jun Park1), Jung In Kim2) and Chul Hee Min1,*)
1,*) Department of Radiation Convergence Engineering, Yonsei University, Republic of Korea 2) Department of Radiation Oncology, Seoul National University Hospital, Republic of Korea
Introduction
Treatment Planning System (TPS) is widely used to deliver accurate dose to the patient and to anticipate the patient dose distribution in advance. Since the quality of the treatment affects the quality of patient’s life, it is important to accurately evaluate the patient dose. Especially, accurate prediction of the skin dose is required because of the incorrect skin dose prediction in radiation therapy can occur the skin side effects such as inflammation, necrosis, and desquamation (skin target layer). According to the International Commission on Radiological Protection (ICRP), the skin dose should be measured at 50-100 um depth from the skin surface between the epidermis and the dermis. However, the current TPS dose calculation algorithm based on the patient CT images (more than 600 um voxel size) cannot define the skin target (50 um from the skin surface and 50 um thick). Recently, newly computational human phantom was developed to accurately evaluate the dose from the radiation to the human body (polygon mesh and tetrahedral mesh based phantom). By using these phantoms, it is possible to precisely define a thin skin target layer and to accurately evaluate the skin dose at that position. The purpose of this study is to develop the accurate skin dose evaluation technique by modeling very skin target layer on the patient CT based tetrahedral mesh phantom. Materials and methods
In this study, the Varian Clinac 2300 IX 6 MV linear accelerator was modeled by using Geant4 Monte Carlo tool-kits to simulate the treatment plan and to assess the patient skin dose.
In-house developed algorithm was used to extract patient CT data and to simulate treatment plan from the DICOM offered by Seoul National University Hospital (SNUH). We constructed the patient-specific phantom based on the contouring data from the DICOM file. The patient CT, which consists of voxels, was converted to polygon-mesh phantom and the treatment plan was simulated with the phantom.
Through the patient CT images, the patient-CT-based polygon mesh based computational phantom was modeled include the thin skin layer, such as the epidermis, the basal layer and the dermis.
Finally, the polygon mesh phantom was converted to tetrahedral-mesh phantom for fast MC simulation.
Treatment plan of the patient who underwent brain cancer was employed to evaluate the skin dose using patient-specific phantom. In the treatment, 10 x 10 cm2 6 MV therapeutic beam was delivered to the patient with the source-to-axis distance (SAD) of 100 cm.
In this study, the skin dose was separately calculated for 50 um basal layer and for 2,000 um whole skin layer, respectively. The dose distribution and the dose-volume histogram (DVH) for the skin were obtained to evaluate the dose delivery to the skin layer and the basal layer.
Figure 1. CT image based patient specific phantom with a thin skin layers.
Figure 2. 3-dimensional distribution of absorbed skin dose (Left) and its transvers view wit Planning Tumor Volume (Right).
Results Figure 3 shows the simulation of the treatment plan employed in this study. The dose to each tetrahedral was calculated separately and integrated for assessing the skin and organ dose. Figure 2 indicates the 3D view of the dose distribution inside the patient body. The PTV was illustrated with yellow solid on the right in figure 2. Since sufficient dose was delivered to the PTV, we regarded the dose distribution as reliable. The skin dose has been evaluated by being averaged for the whole skin volume in TPS. However, we suggest that the dose be assessed in local area, which is indicated as beam path like figure 4. So, we compared the DVHs of skin dose averaged by local skin volume and whole skin volume as represented in figure 4. Figure 5 shows the local DVHs for the skin layer with 2,000 um thickness and 50 um thickness. These result shows that there is significant difference between the dose to the basal layer and the entire skin. Discussion
The dose to the skin was assessed by using patient-specific tetrahedral phantom in this study. In the figure 4, the DVH of the local skin area showed significant dose difference compared to that of the entire skin. The result infers that the skin dose could be underestimated when it is averaged by the entire skin volume. With this regard, we suggest that the skin dose should be evaluated in local skin area.
The doses to the entire skin and the basal layer were compared to evaluate the feasibility of the suggestion in this study. Figure
- 48 -
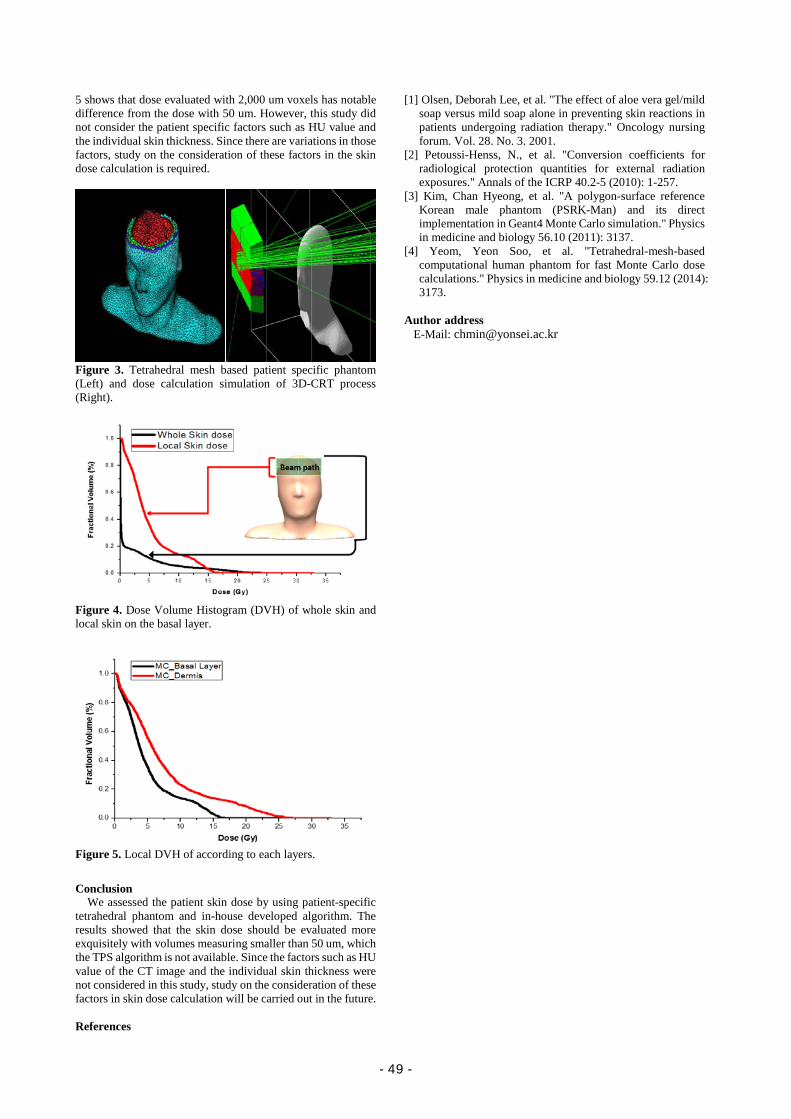
5 shows that dose evaluated with 2,000 um voxels has notable difference from the dose with 50 um. However, this study did not consider the patient specific factors such as HU value and the individual skin thickness. Since there are variations in those factors, study on the consideration of these factors in the skin dose calculation is required.
Figure 3. Tetrahedral mesh based patient specific phantom (Left) and dose calculation simulation of 3D-CRT process (Right).
Figure 4. Dose Volume Histogram (DVH) of whole skin and local skin on the basal layer.
Figure 5. Local DVH of according to each layers.
Conclusion
We assessed the patient skin dose by using patient-specific tetrahedral phantom and in-house developed algorithm. The results showed that the skin dose should be evaluated more exquisitely with volumes measuring smaller than 50 um, which the TPS algorithm is not available. Since the factors such as HU value of the CT image and the individual skin thickness were not considered in this study, study on the consideration of these factors in skin dose calculation will be carried out in the future. References
[1] Olsen, Deborah Lee, et al. "The effect of aloe vera gel/mild soap versus mild soap alone in preventing skin reactions in patients undergoing radiation therapy." Oncology nursing forum. Vol. 28. No. 3. 2001.
[2] Petoussi-Henss, N., et al. "Conversion coefficients for radiological protection quantities for external radiation exposures." Annals of the ICRP 40.2-5 (2010): 1-257.
[3] Kim, Chan Hyeong, et al. "A polygon-surface reference Korean male phantom (PSRK-Man) and its direct implementation in Geant4 Monte Carlo simulation." Physics in medicine and biology 56.10 (2011): 3137.
[4] Yeom, Yeon Soo, et al. "Tetrahedral-mesh-based computational human phantom for fast Monte Carlo dose calculations." Physics in medicine and biology 59.12 (2014): 3173.
Author address
E-Mail: [email protected]
- 49 -
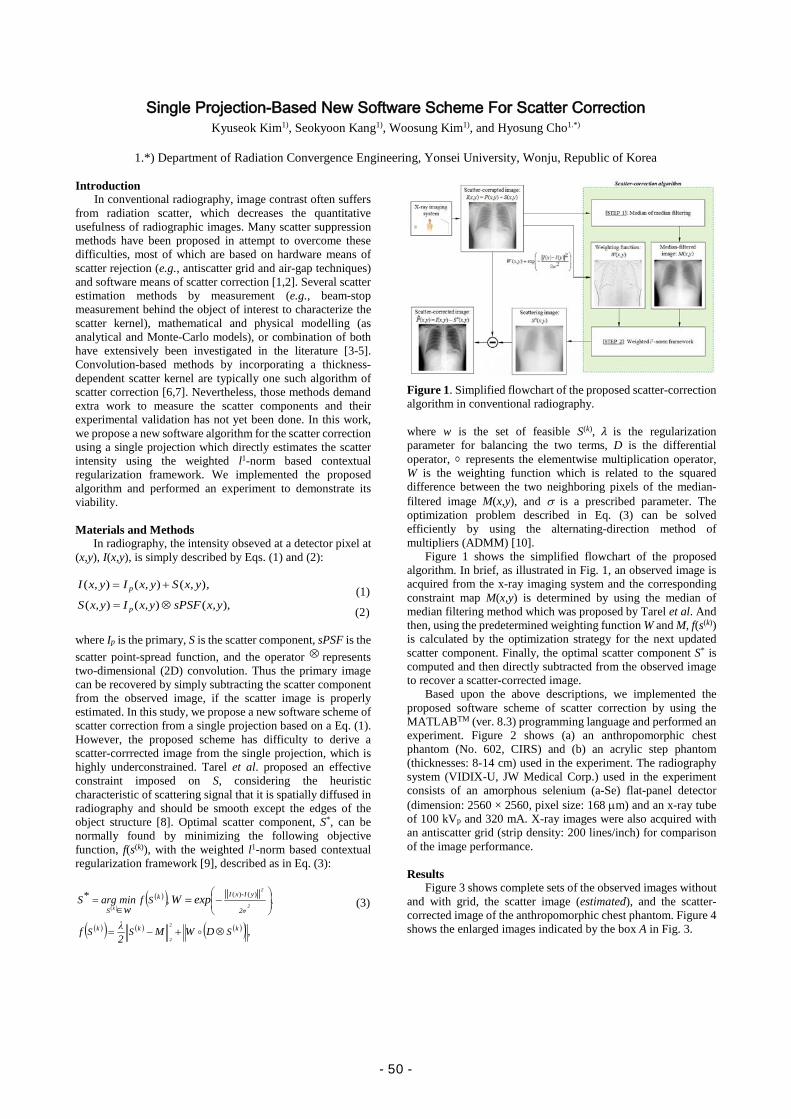
Single Projection-Based New Software Scheme For Scatter Correction Kyuseok Kim1), Seokyoon Kang1), Woosung Kim1), and Hyosung Cho1.*)
1.*) Department of Radiation Convergence Engineering, Yonsei University, Wonju, Republic of Korea
Introduction
In conventional radiography, image contrast often suffers from radiation scatter, which decreases the quantitative usefulness of radiographic images. Many scatter suppression methods have been proposed in attempt to overcome these difficulties, most of which are based on hardware means of scatter rejection (e.g., antiscatter grid and air-gap techniques) and software means of scatter correction [1,2]. Several scatter estimation methods by measurement (e.g., beam-stop measurement behind the object of interest to characterize the scatter kernel), mathematical and physical modelling (as analytical and Monte-Carlo models), or combination of both have extensively been investigated in the literature [3-5]. Convolution-based methods by incorporating a thickness-dependent scatter kernel are typically one such algorithm of scatter correction [6,7]. Nevertheless, those methods demand extra work to measure the scatter components and their experimental validation has not yet been done. In this work, we propose a new software algorithm for the scatter correction using a single projection which directly estimates the scatter intensity using the weighted l1-norm based contextual regularization framework. We implemented the proposed algorithm and performed an experiment to demonstrate its viability. Materials and Methods
In radiography, the intensity obseved at a detector pixel at (x,y), I(x,y), is simply described by Eqs. (1) and (2):
,yx,Syx,Iyx,I p )()()( += (1)
),( )( )( yx,sPSFyx,Iyx,S p ⊗= (2)
where Ip is the primary, S is the scatter component, sPSF is the scatter point-spread function, and the operator ⊗ represents two-dimensional (2D) convolution. Thus the primary image can be recovered by simply subtracting the scatter component from the observed image, if the scatter image is properly estimated. In this study, we propose a new software scheme of scatter correction from a single projection based on a Eq. (1). However, the proposed scheme has difficulty to derive a scatter-corrrected image from the single projection, which is highly underconstrained. Tarel et al. proposed an effective constraint imposed on S, considering the heuristic characteristic of scattering signal that it is spatially diffused in radiography and should be smooth except the edges of the object structure [8]. Optimal scatter component, S*, can be normally found by minimizing the following objective function, f(s(k)), with the weighted l1-norm based contextual regularization framework [9], described as in Eq. (3):
( )
( )( )( )( ) ( ) ( )( ) ,
,*
2
2
,)()(
kkk
2σ
yI-xIk
S
SSS
S
DWM2λf
f w
min argS2
2
kexpW
⊗+−=
∈=
−=
(3)
Figure 1. Simplified flowchart of the proposed scatter-correction algorithm in conventional radiography. where w is the set of feasible S(k), 𝜆𝜆 is the regularization parameter for balancing the two terms, D is the differential operator, represents the elementwise multiplication operator, W is the weighting function which is related to the squared difference between the two neighboring pixels of the median-filtered image M(x,y), and σ is a prescribed parameter. The optimization problem described in Eq. (3) can be solved efficiently by using the alternating-direction method of multipliers (ADMM) [10].
Figure 1 shows the simplified flowchart of the proposed algorithm. In brief, as illustrated in Fig. 1, an observed image is acquired from the x-ray imaging system and the corresponding constraint map M(x,y) is determined by using the median of median filtering method which was proposed by Tarel et al. And then, using the predetermined weighting function W and M, f(s(k)) is calculated by the optimization strategy for the next updated scatter component. Finally, the optimal scatter component S* is computed and then directly subtracted from the observed image to recover a scatter-corrected image.
Based upon the above descriptions, we implemented the proposed software scheme of scatter correction by using the MATLABTM (ver. 8.3) programming language and performed an experiment. Figure 2 shows (a) an anthropomorphic chest phantom (No. 602, CIRS) and (b) an acrylic step phantom (thicknesses: 8-14 cm) used in the experiment. The radiography system (VIDIX-U, JW Medical Corp.) used in the experiment consists of an amorphous selenium (a-Se) flat-panel detector (dimension: 2560 × 2560, pixel size: 168 µm) and an x-ray tube of 100 kVp and 320 mA. X-ray images were also acquired with an antiscatter grid (strip density: 200 lines/inch) for comparison of the image performance.
Results
Figure 3 shows complete sets of the observed images without and with grid, the scatter image (estimated), and the scatter-corrected image of the anthropomorphic chest phantom. Figure 4 shows the enlarged images indicated by the box A in Fig. 3.
- 50 -
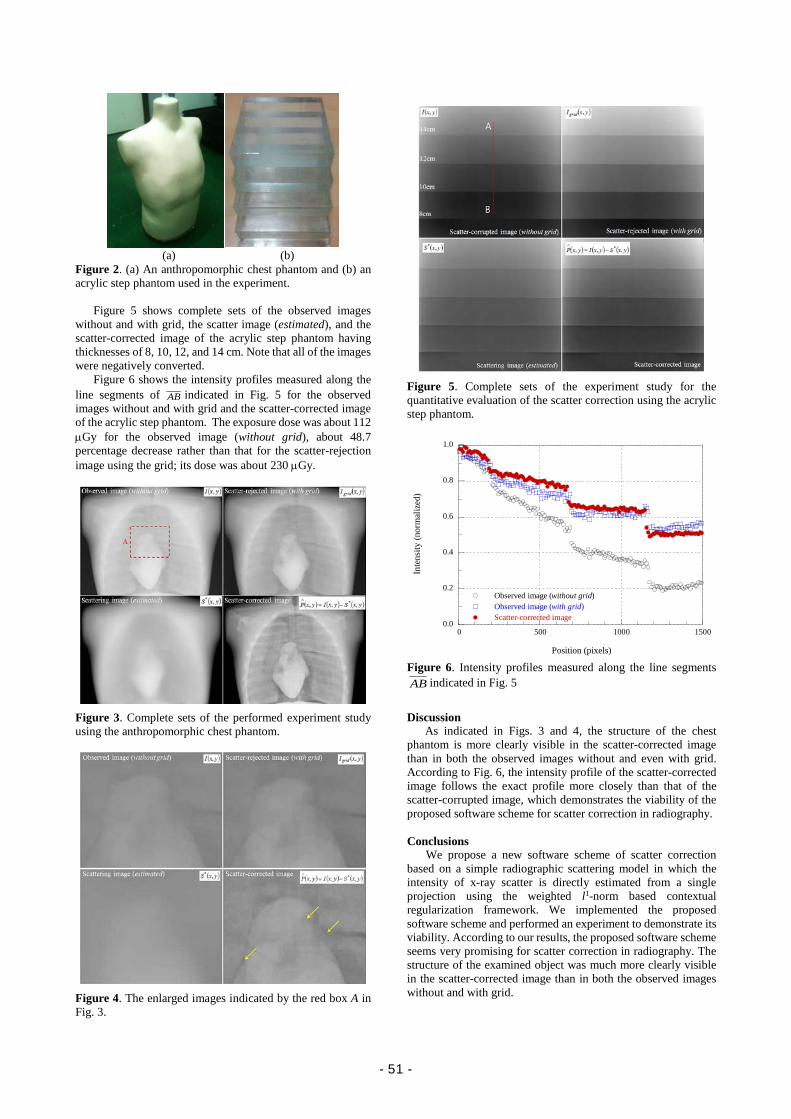
(a) (b) Figure 2. (a) An anthropomorphic chest phantom and (b) an acrylic step phantom used in the experiment.
Figure 5 shows complete sets of the observed images without and with grid, the scatter image (estimated), and the scatter-corrected image of the acrylic step phantom having thicknesses of 8, 10, 12, and 14 cm. Note that all of the images were negatively converted.
Figure 6 shows the intensity profiles measured along the line segments of AB indicated in Fig. 5 for the observed images without and with grid and the scatter-corrected image of the acrylic step phantom. The exposure dose was about 112 µGy for the observed image (without grid), about 48.7 percentage decrease rather than that for the scatter-rejection image using the grid; its dose was about 230 µGy.
Figure 3. Complete sets of the performed experiment study using the anthropomorphic chest phantom.
Figure 4. The enlarged images indicated by the red box A in Fig. 3.
Figure 5. Complete sets of the experiment study for the quantitative evaluation of the scatter correction using the acrylic step phantom.
Figure 6. Intensity profiles measured along the line segments AB indicated in Fig. 5
Discussion As indicated in Figs. 3 and 4, the structure of the chest
phantom is more clearly visible in the scatter-corrected image than in both the observed images without and even with grid. According to Fig. 6, the intensity profile of the scatter-corrected image follows the exact profile more closely than that of the scatter-corrupted image, which demonstrates the viability of the proposed software scheme for scatter correction in radiography.
Conclusions
We propose a new software scheme of scatter correction based on a simple radiographic scattering model in which the intensity of x-ray scatter is directly estimated from a single projection using the weighted l1-norm based contextual regularization framework. We implemented the proposed software scheme and performed an experiment to demonstrate its viability. According to our results, the proposed software scheme seems very promising for scatter correction in radiography. The structure of the examined object was much more clearly visible in the scatter-corrected image than in both the observed images without and with grid.
0.0
0.2
0.4
0.6
0.8
1.0
0 500 1000 1500
Observed image (without grid)Observed image (with grid)Scatter-corrected image
Inte
nsity
(nor
mal
ized
)
Position (pixels)
- 51 -
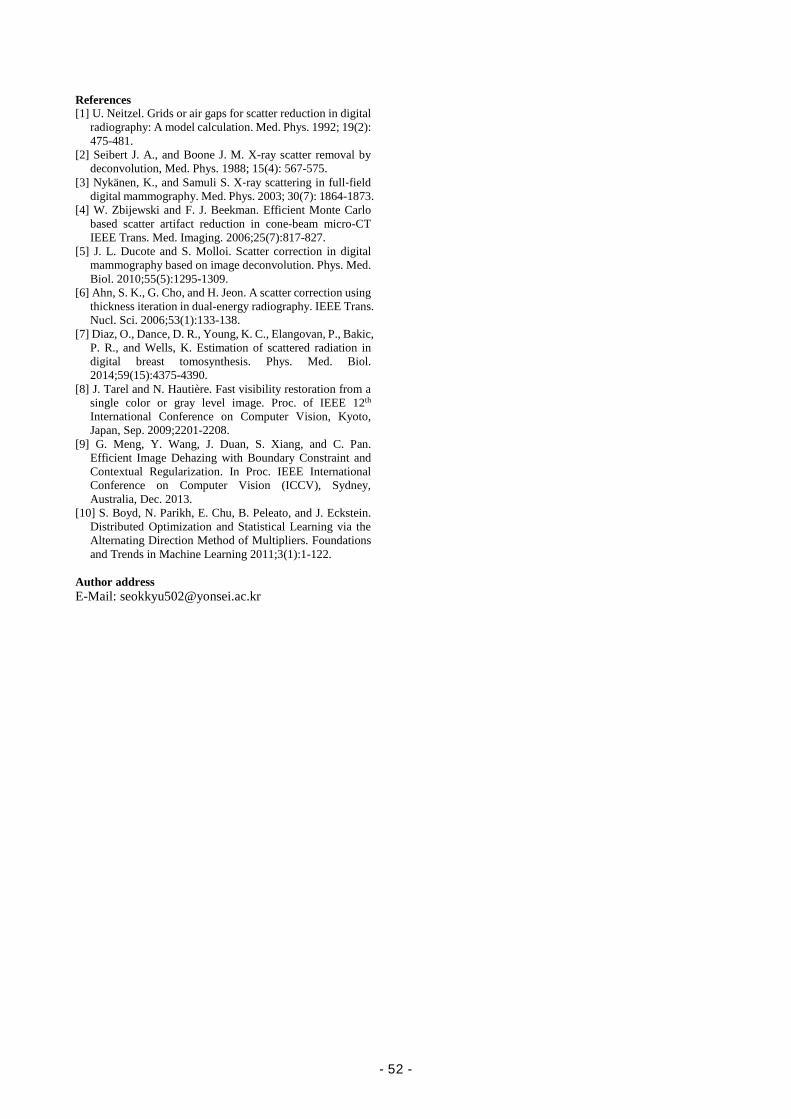
References [1] U. Neitzel. Grids or air gaps for scatter reduction in digital
radiography: A model calculation. Med. Phys. 1992; 19(2): 475-481.
[2] Seibert J. A., and Boone J. M. X-ray scatter removal by deconvolution, Med. Phys. 1988; 15(4): 567-575.
[3] Nykänen, K., and Samuli S. X‐ray scattering in full‐field digital mammography. Med. Phys. 2003; 30(7): 1864-1873.
[4] W. Zbijewski and F. J. Beekman. Efficient Monte Carlo based scatter artifact reduction in cone-beam micro-CT IEEE Trans. Med. Imaging. 2006;25(7):817-827.
[5] J. L. Ducote and S. Molloi. Scatter correction in digital mammography based on image deconvolution. Phys. Med. Biol. 2010;55(5):1295-1309.
[6] Ahn, S. K., G. Cho, and H. Jeon. A scatter correction using thickness iteration in dual-energy radiography. IEEE Trans. Nucl. Sci. 2006;53(1):133-138.
[7] Diaz, O., Dance, D. R., Young, K. C., Elangovan, P., Bakic, P. R., and Wells, K. Estimation of scattered radiation in digital breast tomosynthesis. Phys. Med. Biol. 2014;59(15):4375-4390.
[8] J. Tarel and N. Hautière. Fast visibility restoration from a single color or gray level image. Proc. of IEEE 12th International Conference on Computer Vision, Kyoto, Japan, Sep. 2009;2201-2208.
[9] G. Meng, Y. Wang, J. Duan, S. Xiang, and C. Pan. Efficient Image Dehazing with Boundary Constraint and Contextual Regularization. In Proc. IEEE International Conference on Computer Vision (ICCV), Sydney, Australia, Dec. 2013.
[10] S. Boyd, N. Parikh, E. Chu, B. Peleato, and J. Eckstein. Distributed Optimization and Statistical Learning via the Alternating Direction Method of Multipliers. Foundations and Trends in Machine Learning 2011;3(1):1-122.
Author address E-Mail: [email protected]
- 52 -
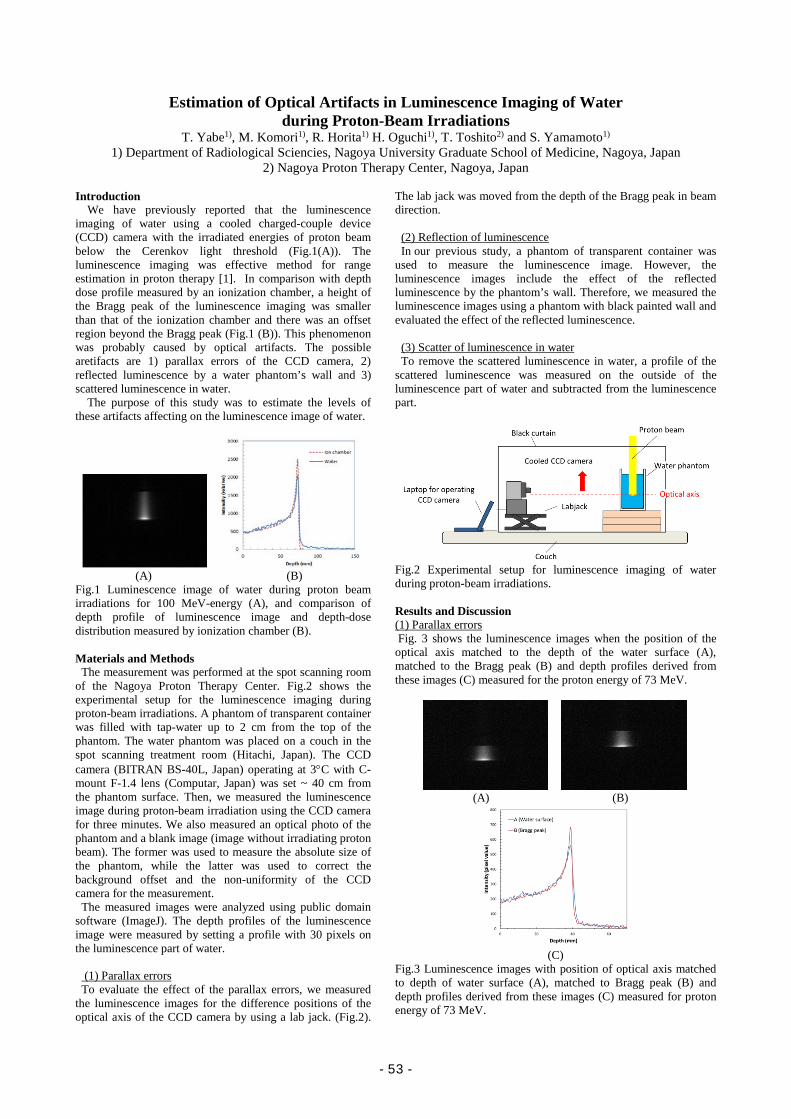
Estimation of Optical Artifacts in Luminescence Imaging of Water during Proton-Beam Irradiations
T. Yabe1), M. Komori1), R. Horita1) H. Oguchi1), T. Toshito2) and S. Yamamoto1) 1) Department of Radiological Sciencies, Nagoya University Graduate School of Medicine, Nagoya, Japan
2) Nagoya Proton Therapy Center, Nagoya, Japan Introduction
We have previously reported that the luminescence imaging of water using a cooled charged-couple device (CCD) camera with the irradiated energies of proton beam below the Cerenkov light threshold (Fig.1(A)). The luminescence imaging was effective method for range estimation in proton therapy [1]. In comparison with depth dose profile measured by an ionization chamber, a height of the Bragg peak of the luminescence imaging was smaller than that of the ionization chamber and there was an offset region beyond the Bragg peak (Fig.1 (B)). This phenomenon was probably caused by optical artifacts. The possible aretifacts are 1) parallax errors of the CCD camera, 2) reflected luminescence by a water phantom’s wall and 3) scattered luminescence in water.
The purpose of this study was to estimate the levels of these artifacts affecting on the luminescence image of water.
(A) (B)
Fig.1 Luminescence image of water during proton beam irradiations for 100 MeV-energy (A), and comparison of depth profile of luminescence image and depth-dose distribution measured by ionization chamber (B). Materials and Methods
The measurement was performed at the spot scanning room of the Nagoya Proton Therapy Center. Fig.2 shows the experimental setup for the luminescence imaging during proton-beam irradiations. A phantom of transparent container was filled with tap-water up to 2 cm from the top of the phantom. The water phantom was placed on a couch in the spot scanning treatment room (Hitachi, Japan). The CCD camera (BITRAN BS-40L, Japan) operating at 3°C with C-mount F-1.4 lens (Computar, Japan) was set ~ 40 cm from the phantom surface. Then, we measured the luminescence image during proton-beam irradiation using the CCD camera for three minutes. We also measured an optical photo of the phantom and a blank image (image without irradiating proton beam). The former was used to measure the absolute size of the phantom, while the latter was used to correct the background offset and the non-uniformity of the CCD camera for the measurement.
The measured images were analyzed using public domain software (ImageJ). The depth profiles of the luminescence image were measured by setting a profile with 30 pixels on the luminescence part of water.
(1) Parallax errors To evaluate the effect of the parallax errors, we measured
the luminescence images for the difference positions of the optical axis of the CCD camera by using a lab jack. (Fig.2).
The lab jack was moved from the depth of the Bragg peak in beam direction.
(2) Reflection of luminescence In our previous study, a phantom of transparent container was
used to measure the luminescence image. However, the luminescence images include the effect of the reflected luminescence by the phantom’s wall. Therefore, we measured the luminescence images using a phantom with black painted wall and evaluated the effect of the reflected luminescence.
(3) Scatter of luminescence in water To remove the scattered luminescence in water, a profile of the
scattered luminescence was measured on the outside of the luminescence part of water and subtracted from the luminescence part.
Fig.2 Experimental setup for luminescence imaging of water during proton-beam irradiations. Results and Discussion (1) Parallax errors Fig. 3 shows the luminescence images when the position of the optical axis matched to the depth of the water surface (A), matched to the Bragg peak (B) and depth profiles derived from these images (C) measured for the proton energy of 73 MeV.
(A) (B)
(C)
Fig.3 Luminescence images with position of optical axis matched to depth of water surface (A), matched to Bragg peak (B) and depth profiles derived from these images (C) measured for proton energy of 73 MeV.
- 53 -
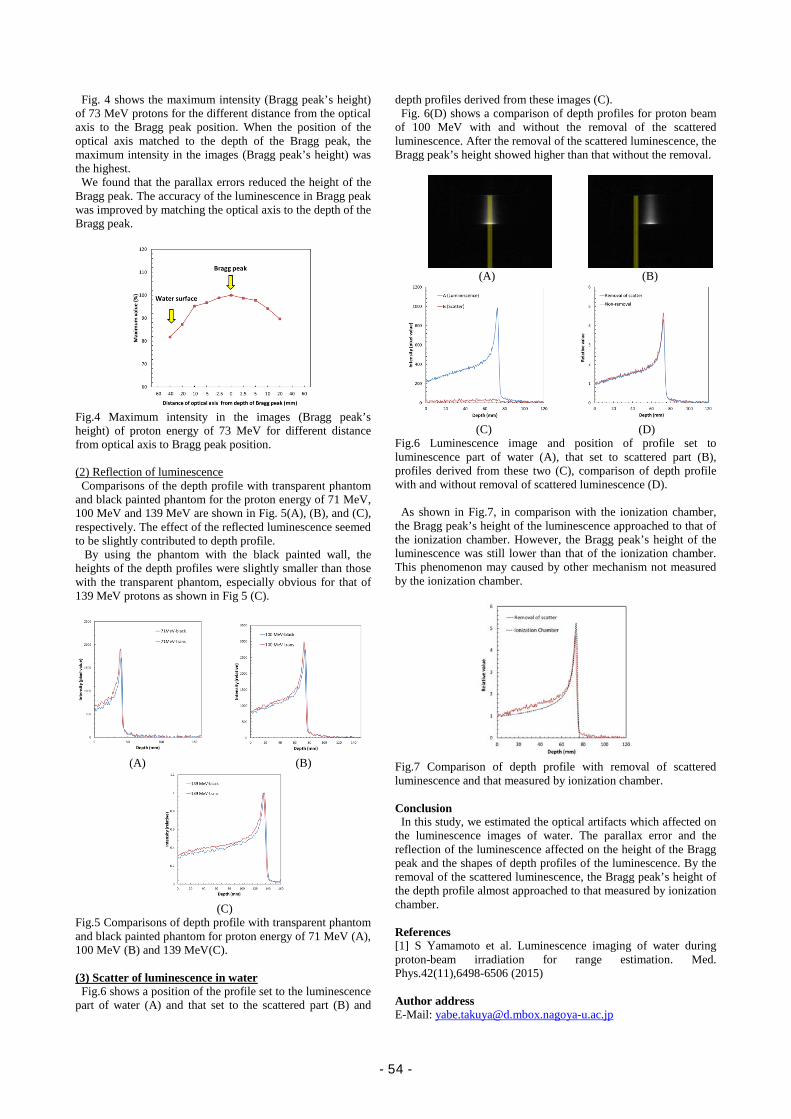
Fig. 4 shows the maximum intensity (Bragg peak’s height) of 73 MeV protons for the different distance from the optical axis to the Bragg peak position. When the position of the optical axis matched to the depth of the Bragg peak, the maximum intensity in the images (Bragg peak’s height) was the highest.
We found that the parallax errors reduced the height of the Bragg peak. The accuracy of the luminescence in Bragg peak was improved by matching the optical axis to the depth of the Bragg peak.
Fig.4 Maximum intensity in the images (Bragg peak’s height) of proton energy of 73 MeV for different distance from optical axis to Bragg peak position. (2) Reflection of luminescence
Comparisons of the depth profile with transparent phantom and black painted phantom for the proton energy of 71 MeV, 100 MeV and 139 MeV are shown in Fig. 5(A), (B), and (C), respectively. The effect of the reflected luminescence seemed to be slightly contributed to depth profile.
By using the phantom with the black painted wall, the heights of the depth profiles were slightly smaller than those with the transparent phantom, especially obvious for that of 139 MeV protons as shown in Fig 5 (C).
(A) (B)
(C)
Fig.5 Comparisons of depth profile with transparent phantom and black painted phantom for proton energy of 71 MeV (A), 100 MeV (B) and 139 MeV(C). (3) Scatter of luminescence in water
Fig.6 shows a position of the profile set to the luminescence part of water (A) and that set to the scattered part (B) and
depth profiles derived from these images (C). Fig. 6(D) shows a comparison of depth profiles for proton beam
of 100 MeV with and without the removal of the scattered luminescence. After the removal of the scattered luminescence, the Bragg peak’s height showed higher than that without the removal.
(A) (B)
(C) (D)
Fig.6 Luminescence image and position of profile set to luminescence part of water (A), that set to scattered part (B), profiles derived from these two (C), comparison of depth profile with and without removal of scattered luminescence (D).
As shown in Fig.7, in comparison with the ionization chamber, the Bragg peak’s height of the luminescence approached to that of the ionization chamber. However, the Bragg peak’s height of the luminescence was still lower than that of the ionization chamber. This phenomenon may caused by other mechanism not measured by the ionization chamber.
Fig.7 Comparison of depth profile with removal of scattered luminescence and that measured by ionization chamber. Conclusion
In this study, we estimated the optical artifacts which affected on the luminescence images of water. The parallax error and the reflection of the luminescence affected on the height of the Bragg peak and the shapes of depth profiles of the luminescence. By the removal of the scattered luminescence, the Bragg peak’s height of the depth profile almost approached to that measured by ionization chamber.
References [1] S Yamamoto et al. Luminescence imaging of water during proton-beam irradiation for range estimation. Med. Phys.42(11),6498-6506 (2015) Author address E-Mail: [email protected]
- 54 -
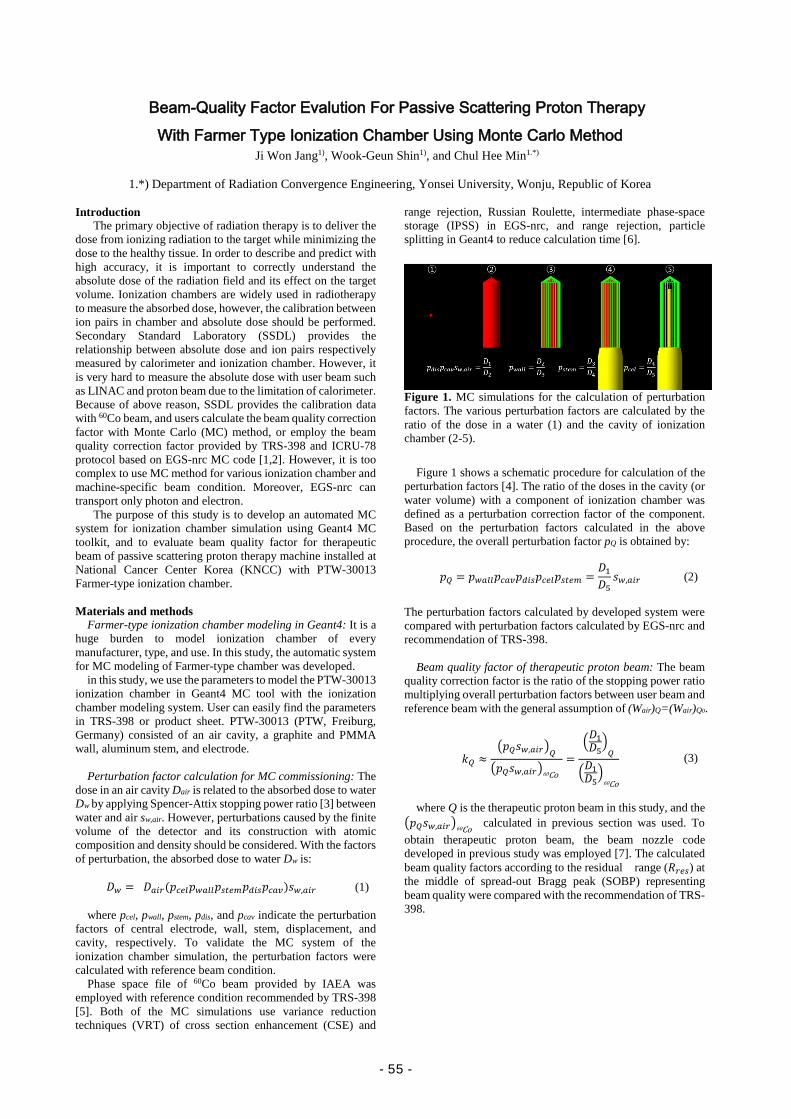
Beam-Quality Factor Evalution For Passive Scattering Proton Therapy With Farmer Type Ionization Chamber Using Monte Carlo Method
Ji Won Jang1), Wook-Geun Shin1), and Chul Hee Min1.*)
1.*) Department of Radiation Convergence Engineering, Yonsei University, Wonju, Republic of Korea Introduction
The primary objective of radiation therapy is to deliver the dose from ionizing radiation to the target while minimizing the dose to the healthy tissue. In order to describe and predict with high accuracy, it is important to correctly understand the absolute dose of the radiation field and its effect on the target volume. Ionization chambers are widely used in radiotherapy to measure the absorbed dose, however, the calibration between ion pairs in chamber and absolute dose should be performed. Secondary Standard Laboratory (SSDL) provides the relationship between absolute dose and ion pairs respectively measured by calorimeter and ionization chamber. However, it is very hard to measure the absolute dose with user beam such as LINAC and proton beam due to the limitation of calorimeter. Because of above reason, SSDL provides the calibration data with 60Co beam, and users calculate the beam quality correction factor with Monte Carlo (MC) method, or employ the beam quality correction factor provided by TRS-398 and ICRU-78 protocol based on EGS-nrc MC code [1,2]. However, it is too complex to use MC method for various ionization chamber and machine-specific beam condition. Moreover, EGS-nrc can transport only photon and electron.
The purpose of this study is to develop an automated MC system for ionization chamber simulation using Geant4 MC toolkit, and to evaluate beam quality factor for therapeutic beam of passive scattering proton therapy machine installed at National Cancer Center Korea (KNCC) with PTW-30013 Farmer-type ionization chamber.
Materials and methods
Farmer-type ionization chamber modeling in Geant4: It is a huge burden to model ionization chamber of every manufacturer, type, and use. In this study, the automatic system for MC modeling of Farmer-type chamber was developed.
in this study, we use the parameters to model the PTW-30013 ionization chamber in Geant4 MC tool with the ionization chamber modeling system. User can easily find the parameters in TRS-398 or product sheet. PTW-30013 (PTW, Freiburg, Germany) consisted of an air cavity, a graphite and PMMA wall, aluminum stem, and electrode.
Perturbation factor calculation for MC commissioning: The
dose in an air cavity Dair is related to the absorbed dose to water Dw by applying Spencer-Attix stopping power ratio [3] between water and air sw,air. However, perturbations caused by the finite volume of the detector and its construction with atomic composition and density should be considered. With the factors of perturbation, the absorbed dose to water Dw is:
𝐷𝐷𝑤𝑤 = 𝐷𝐷𝑎𝑎𝑎𝑎𝑎𝑎(𝑝𝑝𝑐𝑐𝑐𝑐𝑐𝑐𝑝𝑝𝑤𝑤𝑎𝑎𝑐𝑐𝑐𝑐𝑝𝑝𝑠𝑠𝑠𝑠𝑐𝑐𝑠𝑠𝑝𝑝𝑑𝑑𝑎𝑎𝑠𝑠𝑝𝑝𝑐𝑐𝑎𝑎𝑐𝑐)𝑠𝑠𝑤𝑤,𝑎𝑎𝑎𝑎𝑎𝑎 (1)
where pcel, pwall, pstem, pdis, and pcav indicate the perturbation
factors of central electrode, wall, stem, displacement, and cavity, respectively. To validate the MC system of the ionization chamber simulation, the perturbation factors were calculated with reference beam condition.
Phase space file of 60Co beam provided by IAEA was employed with reference condition recommended by TRS-398 [5]. Both of the MC simulations use variance reduction techniques (VRT) of cross section enhancement (CSE) and
range rejection, Russian Roulette, intermediate phase-space storage (IPSS) in EGS-nrc, and range rejection, particle splitting in Geant4 to reduce calculation time [6].
Figure 1. MC simulations for the calculation of perturbation factors. The various perturbation factors are calculated by the ratio of the dose in a water (1) and the cavity of ionization chamber (2-5).
Figure 1 shows a schematic procedure for calculation of the
perturbation factors [4]. The ratio of the doses in the cavity (or water volume) with a component of ionization chamber was defined as a perturbation correction factor of the component. Based on the perturbation factors calculated in the above procedure, the overall perturbation factor pQ is obtained by:
𝑝𝑝𝑄𝑄 = 𝑝𝑝𝑤𝑤𝑎𝑎𝑐𝑐𝑐𝑐𝑝𝑝𝑐𝑐𝑎𝑎𝑐𝑐𝑝𝑝𝑑𝑑𝑎𝑎𝑠𝑠𝑝𝑝𝑐𝑐𝑐𝑐𝑐𝑐𝑝𝑝𝑠𝑠𝑠𝑠𝑐𝑐𝑠𝑠 =𝐷𝐷1𝐷𝐷5
𝑠𝑠𝑤𝑤,𝑎𝑎𝑎𝑎𝑎𝑎 (2)
The perturbation factors calculated by developed system were compared with perturbation factors calculated by EGS-nrc and recommendation of TRS-398.
Beam quality factor of therapeutic proton beam: The beam
quality correction factor is the ratio of the stopping power ratio multiplying overall perturbation factors between user beam and reference beam with the general assumption of (Wair)Q=(Wair)Q0.
𝑘𝑘𝑄𝑄 ≈�𝑝𝑝𝑄𝑄𝑠𝑠𝑤𝑤,𝑎𝑎𝑎𝑎𝑎𝑎�𝑄𝑄�𝑝𝑝𝑄𝑄𝑠𝑠𝑤𝑤,𝑎𝑎𝑎𝑎𝑎𝑎�60Co
=�𝐷𝐷1𝐷𝐷5
�𝑄𝑄
�𝐷𝐷1𝐷𝐷5�
60Co
(3)
where Q is the therapeutic proton beam in this study, and the
�𝑝𝑝𝑄𝑄𝑠𝑠𝑤𝑤,𝑎𝑎𝑎𝑎𝑎𝑎�60Co calculated in previous section was used. To obtain therapeutic proton beam, the beam nozzle code developed in previous study was employed [7]. The calculated beam quality factors according to the residual range (𝑅𝑅𝑎𝑎𝑐𝑐𝑠𝑠) at the middle of spread-out Bragg peak (SOBP) representing beam quality were compared with the recommendation of TRS-398.
- 55 -
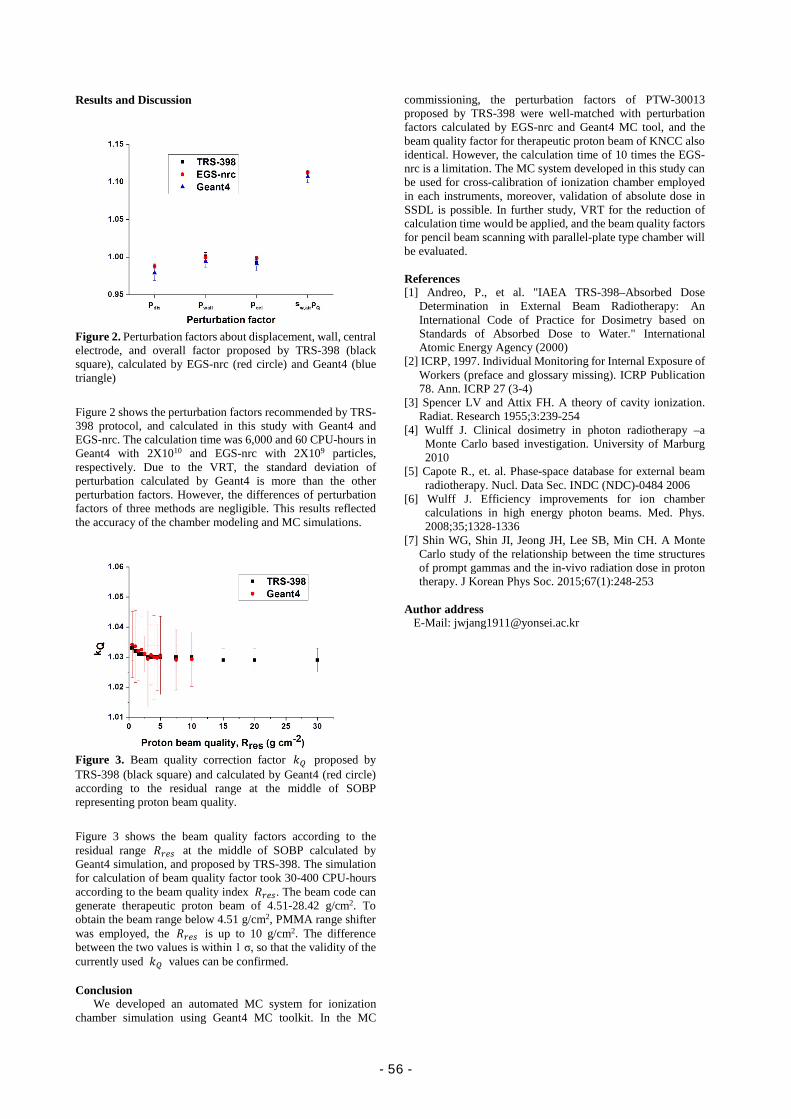
Results and Discussion
Figure 2. Perturbation factors about displacement, wall, central electrode, and overall factor proposed by TRS-398 (black square), calculated by EGS-nrc (red circle) and Geant4 (blue triangle)
Figure 2 shows the perturbation factors recommended by TRS-398 protocol, and calculated in this study with Geant4 and EGS-nrc. The calculation time was 6,000 and 60 CPU-hours in Geant4 with 2X10¹⁰ and EGS-nrc with 2X10⁹ particles, respectively. Due to the VRT, the standard deviation of perturbation calculated by Geant4 is more than the other perturbation factors. However, the differences of perturbation factors of three methods are negligible. This results reflected the accuracy of the chamber modeling and MC simulations.
Figure 3. Beam quality correction factor 𝑘𝑘𝑄𝑄 proposed by TRS-398 (black square) and calculated by Geant4 (red circle) according to the residual range at the middle of SOBP representing proton beam quality.
Figure 3 shows the beam quality factors according to the residual range 𝑅𝑅𝑎𝑎𝑐𝑐𝑠𝑠 at the middle of SOBP calculated by Geant4 simulation, and proposed by TRS-398. The simulation for calculation of beam quality factor took 30-400 CPU-hours according to the beam quality index 𝑅𝑅𝑎𝑎𝑐𝑐𝑠𝑠. The beam code can generate therapeutic proton beam of 4.51-28.42 g/cm2. To obtain the beam range below 4.51 g/cm2, PMMA range shifter was employed, the 𝑅𝑅𝑎𝑎𝑐𝑐𝑠𝑠 is up to 10 g/cm2. The difference between the two values is within 1 σ, so that the validity of the currently used 𝑘𝑘𝑄𝑄 values can be confirmed. Conclusion
We developed an automated MC system for ionization chamber simulation using Geant4 MC toolkit. In the MC
commissioning, the perturbation factors of PTW-30013 proposed by TRS-398 were well-matched with perturbation factors calculated by EGS-nrc and Geant4 MC tool, and the beam quality factor for therapeutic proton beam of KNCC also identical. However, the calculation time of 10 times the EGS-nrc is a limitation. The MC system developed in this study can be used for cross-calibration of ionization chamber employed in each instruments, moreover, validation of absolute dose in SSDL is possible. In further study, VRT for the reduction of calculation time would be applied, and the beam quality factors for pencil beam scanning with parallel-plate type chamber will be evaluated.
References [1] Andreo, P., et al. "IAEA TRS-398–Absorbed Dose
Determination in External Beam Radiotherapy: An International Code of Practice for Dosimetry based on Standards of Absorbed Dose to Water." International Atomic Energy Agency (2000)
[2] ICRP, 1997. Individual Monitoring for Internal Exposure of Workers (preface and glossary missing). ICRP Publication 78. Ann. ICRP 27 (3-4)
[3] Spencer LV and Attix FH. A theory of cavity ionization. Radiat. Research 1955;3:239-254
[4] Wulff J. Clinical dosimetry in photon radiotherapy –a Monte Carlo based investigation. University of Marburg 2010
[5] Capote R., et. al. Phase-space database for external beam radiotherapy. Nucl. Data Sec. INDC (NDC)-0484 2006
[6] Wulff J. Efficiency improvements for ion chamber calculations in high energy photon beams. Med. Phys. 2008;35;1328-1336
[7] Shin WG, Shin JI, Jeong JH, Lee SB, Min CH. A Monte Carlo study of the relationship between the time structures of prompt gammas and the in-vivo radiation dose in proton therapy. J Korean Phys Soc. 2015;67(1):248-253
Author address
E-Mail: [email protected]
- 56 -
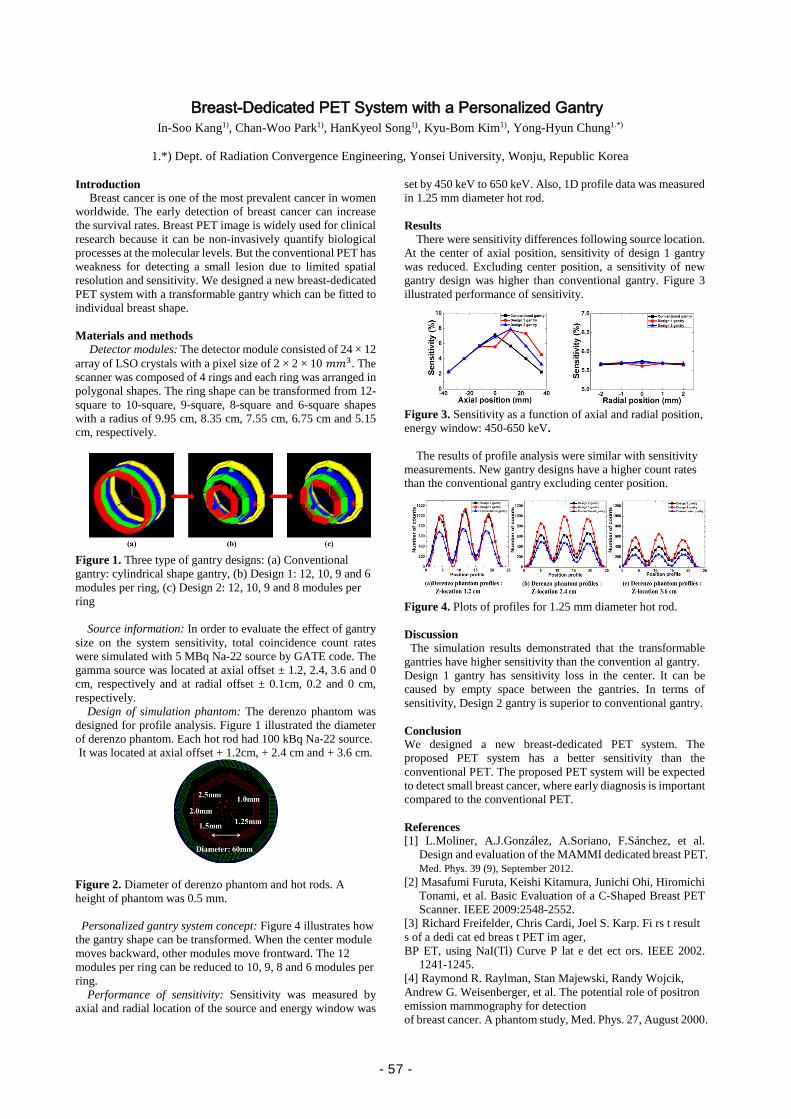
Breast-Dedicated PET System with a Personalized Gantry In-Soo Kang1), Chan-Woo Park1), HanKyeol Song1), Kyu-Bom Kim1), Yong-Hyun Chung1.*)
1.*) Dept. of Radiation Convergence Engineering, Yonsei University, Wonju, Republic Korea
Introduction
Breast cancer is one of the most prevalent cancer in women worldwide. The early detection of breast cancer can increase the survival rates. Breast PET image is widely used for clinical research because it can be non-invasively quantify biological processes at the molecular levels. But the conventional PET has weakness for detecting a small lesion due to limited spatial resolution and sensitivity. We designed a new breast-dedicated PET system with a transformable gantry which can be fitted to individual breast shape. Materials and methods
Detector modules: The detector module consisted of 24 × 12 array of LSO crystals with a pixel size of 2 × 2 × 10 𝑚𝑚𝑚𝑚3. The scanner was composed of 4 rings and each ring was arranged in polygonal shapes. The ring shape can be transformed from 12-square to 10-square, 9-square, 8-square and 6-square shapes with a radius of 9.95 cm, 8.35 cm, 7.55 cm, 6.75 cm and 5.15 cm, respectively.
Figure 1. Three type of gantry designs: (a) Conventional gantry: cylindrical shape gantry, (b) Design 1: 12, 10, 9 and 6 modules per ring, (c) Design 2: 12, 10, 9 and 8 modules per ring
Source information: In order to evaluate the effect of gantry size on the system sensitivity, total coincidence count rates were simulated with 5 MBq Na-22 source by GATE code. The gamma source was located at axial offset ± 1.2, 2.4, 3.6 and 0 cm, respectively and at radial offset ± 0.1cm, 0.2 and 0 cm, respectively.
Design of simulation phantom: The derenzo phantom was designed for profile analysis. Figure 1 illustrated the diameter of derenzo phantom. Each hot rod had 100 kBq Na-22 source. It was located at axial offset + 1.2cm, + 2.4 cm and + 3.6 cm.
Figure 2. Diameter of derenzo phantom and hot rods. A height of phantom was 0.5 mm. Personalized gantry system concept: Figure 4 illustrates how the gantry shape can be transformed. When the center module moves backward, other modules move frontward. The 12 modules per ring can be reduced to 10, 9, 8 and 6 modules per ring.
Performance of sensitivity: Sensitivity was measured by axial and radial location of the source and energy window was
set by 450 keV to 650 keV. Also, 1D profile data was measured in 1.25 mm diameter hot rod.
Results
There were sensitivity differences following source location. At the center of axial position, sensitivity of design 1 gantry was reduced. Excluding center position, a sensitivity of new gantry design was higher than conventional gantry. Figure 3 illustrated performance of sensitivity.
Figure 3. Sensitivity as a function of axial and radial position, energy window: 450-650 keV.
The results of profile analysis were similar with sensitivity measurements. New gantry designs have a higher count rates than the conventional gantry excluding center position.
Figure 4. Plots of profiles for 1.25 mm diameter hot rod. Discussion
The simulation results demonstrated that the transformable gantries have higher sensitivity than the convention al gantry. Design 1 gantry has sensitivity loss in the center. It can be caused by empty space between the gantries. In terms of sensitivity, Design 2 gantry is superior to conventional gantry. Conclusion We designed a new breast-dedicated PET system. The proposed PET system has a better sensitivity than the conventional PET. The proposed PET system will be expected to detect small breast cancer, where early diagnosis is important compared to the conventional PET. References [1] L.Moliner, A.J.González, A.Soriano, F.Sánchez, et al.
Design and evaluation of the MAMMI dedicated breast PET. Med. Phys. 39 (9), September 2012.
[2] Masafumi Furuta, Keishi Kitamura, Junichi Ohi, Hiromichi Tonami, et al. Basic Evaluation of a C-Shaped Breast PET Scanner. IEEE 2009:2548-2552.
[3] Richard Freifelder, Chris Cardi, Joel S. Karp. Fi rs t result s of a dedi cat ed breas t PET im ager, BP ET, using NaI(Tl) Curve P lat e det ect ors. IEEE 2002.
1241-1245. [4] Raymond R. Raylman, Stan Majewski, Randy Wojcik, Andrew G. Weisenberger, et al. The potential role of positron emission mammography for detection of breast cancer. A phantom study, Med. Phys. 27, August 2000.
- 57 -

[5] FanzhenMeng, Xu Cao, Xuezhou Cao, Jianxun Wang, et al. Influence of Rotation Increments on Imaging Performance for a Rotatory Dual-Head PET System, BioMed Research International, Volume 2017, Article ID 8615086, 11 pages Author address
E-Mail: [email protected]
- 58 -

Abstract
Biomedical Laboratory
Science
- 59 -

- 60 -

2017 Yonsei-Nagoya University Joint Symposium in Biomedical Laboratory Science
Miare-Hall #325
11:00 ~ 11:05 Opening Session Prof. Ki-Jong Rhee (Yonsei Univ.)
11:05 ~ 11:55 Session I Chair: Korea (Yonsei Univ.)
11:05 ~ 11:30 Diagnostic and clinicopathological value of ΔNp63 in cervical cancer and cervical
intraepithelial neoplasia (Suji Lee – Yonsei Univ)
11:30 ~ 11:55 Assessment of F9 mutation associated with inhibitor development in Japanese
hemophilia B patients (Hiroto Sakane – Nagoya Univ)
12:00 ~ 14:00 Lunch
14:00 ~ 15:15 Session II Chair: Prof. Jun (Nagoya Univ.)
14:00 ~ 14:25 Plumbagin inhibits expression of virulence factor and growth of Helicobacter
pylori (Hye Jin Kwon – Yonsei Univ)
14:25 ~ 14:50 Development of diagnostic assay against for Chikungunya fever (Monoldorova
Sezim-Yonsei Univ)
14:50 ~ 15:15 Highly sensitive and simultaneous determination of urinary metabolites of
pyrethroids using gas chromatography-tandem mass spectrometry (Yuko Ueda –
Nagoya Univ)
15:15 ~ 15:30 Coffee Break
15:30 ~ 16:45 Session III Chair: Korea (Yonsei Univ.)
15:30 ~ 15:55 Improved colitis-associated cancer model using ETBF (Soonjae Hwang – Yonsei
Univ)
15:55 ~ 16:20 Development of anti-EGFR lipid micellar nanoparticles co-encapsulating
quantum dots and paclitaxel for tumor-specific theranosis (Seong Jae Kang –
- 61 -

Yonsei Univ)
16:20 ~ 16:45 Amplification of distinct α-synuclein fibril conformers using protein misfolding
cyclic amplification (Byung Chul Jung – Yonsei Univ)
16:45 ~ 17:00 Closing Remarks and Group photo Prof. Ki-Jong Rhee (Yonsei Univ.)
18:00 ~ 20:00 Dinner
- 62 -
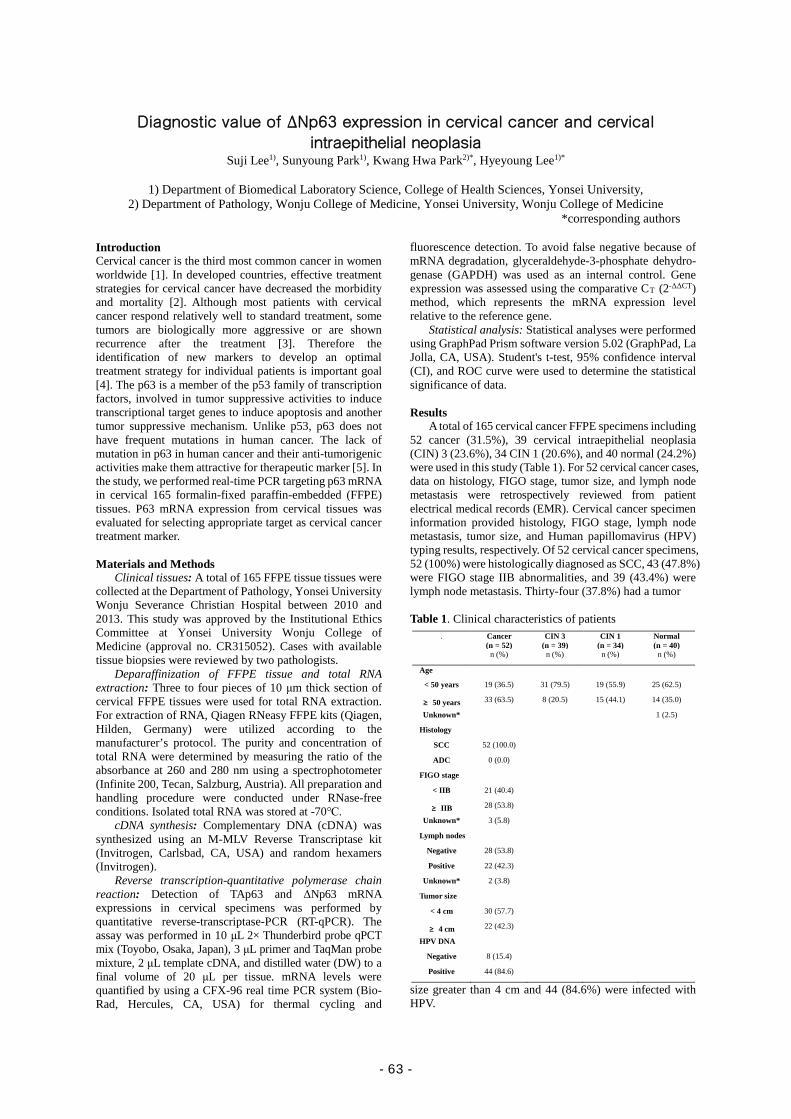
Diagnostic value of ΔNp63 expression in cervical cancer and cervical intraepithelial neoplasia
Suji Lee1), Sunyoung Park1), Kwang Hwa Park2)*, Hyeyoung Lee1)*
1) Department of Biomedical Laboratory Science, College of Health Sciences, Yonsei University, 2) Department of Pathology, Wonju College of Medicine, Yonsei University, Wonju College of Medicine
*corresponding authors Introduction Cervical cancer is the third most common cancer in women worldwide [1]. In developed countries, effective treatment strategies for cervical cancer have decreased the morbidity and mortality [2]. Although most patients with cervical cancer respond relatively well to standard treatment, some tumors are biologically more aggressive or are shown recurrence after the treatment [3]. Therefore the identification of new markers to develop an optimal treatment strategy for individual patients is important goal [4]. The p63 is a member of the p53 family of transcription factors, involved in tumor suppressive activities to induce transcriptional target genes to induce apoptosis and another tumor suppressive mechanism. Unlike p53, p63 does not have frequent mutations in human cancer. The lack of mutation in p63 in human cancer and their anti-tumorigenic activities make them attractive for therapeutic marker [5]. In the study, we performed real-time PCR targeting p63 mRNA in cervical 165 formalin-fixed paraffin-embedded (FFPE) tissues. P63 mRNA expression from cervical tissues was evaluated for selecting appropriate target as cervical cancer treatment marker. Materials and Methods
Clinical tissues: A total of 165 FFPE tissue tissues were collected at the Department of Pathology, Yonsei University Wonju Severance Christian Hospital between 2010 and 2013. This study was approved by the Institutional Ethics Committee at Yonsei University Wonju College of Medicine (approval no. CR315052). Cases with available tissue biopsies were reviewed by two pathologists.
Deparaffinization of FFPE tissue and total RNA extraction: Three to four pieces of 10 μm thick section of cervical FFPE tissues were used for total RNA extraction. For extraction of RNA, Qiagen RNeasy FFPE kits (Qiagen, Hilden, Germany) were utilized according to the manufacturer’s protocol. The purity and concentration of total RNA were determined by measuring the ratio of the absorbance at 260 and 280 nm using a spectrophotometer (Infinite 200, Tecan, Salzburg, Austria). All preparation and handling procedure were conducted under RNase-free conditions. Isolated total RNA was stored at -70℃.
cDNA synthesis: Complementary DNA (cDNA) was synthesized using an M-MLV Reverse Transcriptase kit (Invitrogen, Carlsbad, CA, USA) and random hexamers (Invitrogen).
Reverse transcription-quantitative polymerase chain reaction: Detection of TAp63 and ΔNp63 mRNA expressions in cervical specimens was performed by quantitative reverse-transcriptase-PCR (RT-qPCR). The assay was performed in 10 μL 2× Thunderbird probe qPCT mix (Toyobo, Osaka, Japan), 3 μL primer and TaqMan probe mixture, 2 μL template cDNA, and distilled water (DW) to a final volume of 20 μL per tissue. mRNA levels were quantified by using a CFX-96 real time PCR system (Bio-Rad, Hercules, CA, USA) for thermal cycling and
fluorescence detection. To avoid false negative because of mRNA degradation, glyceraldehyde-3-phosphate dehydro-genase (GAPDH) was used as an internal control. Gene expression was assessed using the comparative CT (2-ΔΔCT) method, which represents the mRNA expression level relative to the reference gene.
Statistical analysis: Statistical analyses were performed using GraphPad Prism software version 5.02 (GraphPad, La Jolla, CA, USA). Student's t-test, 95% confidence interval (CI), and ROC curve were used to determine the statistical significance of data. Results
A total of 165 cervical cancer FFPE specimens including 52 cancer (31.5%), 39 cervical intraepithelial neoplasia (CIN) 3 (23.6%), 34 CIN 1 (20.6%), and 40 normal (24.2%) were used in this study (Table 1). For 52 cervical cancer cases, data on histology, FIGO stage, tumor size, and lymph node metastasis were retrospectively reviewed from patient electrical medical records (EMR). Cervical cancer specimen information provided histology, FIGO stage, lymph node metastasis, tumor size, and Human papillomavirus (HPV) typing results, respectively. Of 52 cervical cancer specimens, 52 (100%) were histologically diagnosed as SCC, 43 (47.8%) were FIGO stage IIB abnormalities, and 39 (43.4%) were lymph node metastasis. Thirty-four (37.8%) had a tumor
Table 1. Clinical characteristics of patients
size greater than 4 cm and 44 (84.6%) were infected with HPV.
. Cancer (n = 52)
CIN 3 (n = 39)
CIN 1 (n = 34)
Normal (n = 40)
n (%) n (%) n (%) n (%)
Age
< 50 years 19 (36.5) 31 (79.5) 19 (55.9) 25 (62.5)
≥ 50 years 33 (63.5) 8 (20.5) 15 (44.1) 14 (35.0)
Unknown* 1 (2.5)
Histology
SCC 52 (100.0)
ADC 0 (0.0)
FIGO stage
< IIB 21 (40.4)
≥ IIB 28 (53.8)
Unknown* 3 (5.8)
Lymph nodes
Negative 28 (53.8)
Positive 22 (42.3)
Unknown* 2 (3.8)
Tumor size
< 4 cm 30 (57.7)
≥ 4 cm 22 (42.3)
HPV DNA
Negative 8 (15.4)
Positive 44 (84.6)
- 63 -
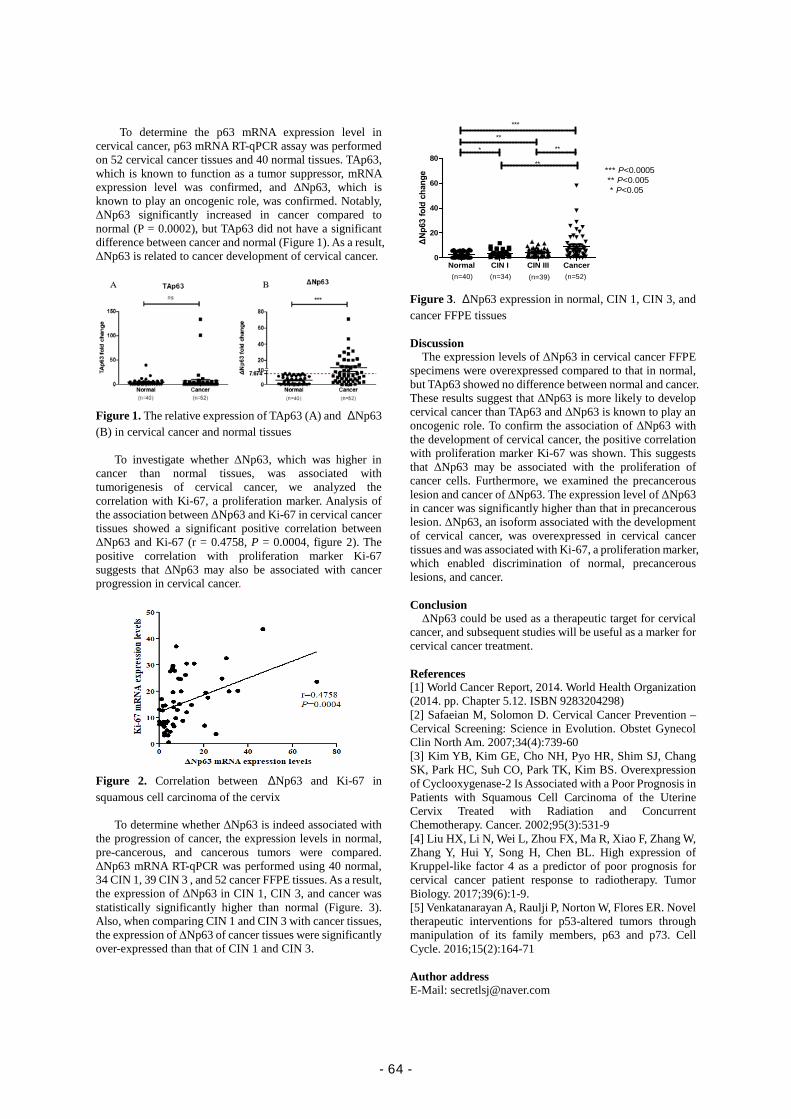
To determine the p63 mRNA expression level in
cervical cancer, p63 mRNA RT-qPCR assay was performed on 52 cervical cancer tissues and 40 normal tissues. TAp63, which is known to function as a tumor suppressor, mRNA expression level was confirmed, and ΔNp63, which is known to play an oncogenic role, was confirmed. Notably, ΔNp63 significantly increased in cancer compared to normal (P = 0.0002), but TAp63 did not have a significant difference between cancer and normal (Figure 1). As a result, ΔNp63 is related to cancer development of cervical cancer.
Figure 1. The relative expression of TAp63 (A) and ΔNp63 (B) in cervical cancer and normal tissues
To investigate whether ΔNp63, which was higher in cancer than normal tissues, was associated with tumorigenesis of cervical cancer, we analyzed the correlation with Ki-67, a proliferation marker. Analysis of the association between ΔNp63 and Ki-67 in cervical cancer tissues showed a significant positive correlation between ΔNp63 and Ki-67 (r = 0.4758, P = 0.0004, figure 2). The positive correlation with proliferation marker Ki-67 suggests that ΔNp63 may also be associated with cancer progression in cervical cancer.
Figure 2. Correlation between ΔNp63 and Ki-67 in squamous cell carcinoma of the cervix
To determine whether ΔNp63 is indeed associated with the progression of cancer, the expression levels in normal, pre-cancerous, and cancerous tumors were compared.
ΔNp63 mRNA RT-qPCR was performed using 40 normal, 34 CIN 1, 39 CIN 3 , and 52 cancer FFPE tissues. As a result, the expression of ΔNp63 in CIN 1, CIN 3, and cancer was statistically significantly higher than normal (Figure. 3). Also, when comparing CIN 1 and CIN 3 with cancer tissues, the expression of ΔNp63 of cancer tissues were significantly over-expressed than that of CIN 1 and CIN 3.
Normal CIN I CIN III Cancer0
20
40
60
80*
(n=40) (n=52)(n=34) (n=39)
*** P<0.0005 ** P<0.005 * P<0.05
**
***
**
**
ΔNp6
3 fo
ld c
hang
e
Figure 3. ΔNp63 expression in normal, CIN 1, CIN 3, and cancer FFPE tissues Discussion
The expression levels of ΔNp63 in cervical cancer FFPE specimens were overexpressed compared to that in normal, but TAp63 showed no difference between normal and cancer. These results suggest that ΔNp63 is more likely to develop cervical cancer than TAp63 and ΔNp63 is known to play an oncogenic role. To confirm the association of ΔNp63 with the development of cervical cancer, the positive correlation with proliferation marker Ki-67 was shown. This suggests that ΔNp63 may be associated with the proliferation of cancer cells. Furthermore, we examined the precancerous lesion and cancer of ΔNp63. The expression level of ΔNp63 in cancer was significantly higher than that in precancerous lesion. ΔNp63, an isoform associated with the development of cervical cancer, was overexpressed in cervical cancer tissues and was associated with Ki-67, a proliferation marker, which enabled discrimination of normal, precancerous lesions, and cancer. Conclusion ΔNp63 could be used as a therapeutic target for cervical
cancer, and subsequent studies will be useful as a marker for cervical cancer treatment. References [1] World Cancer Report, 2014. World Health Organization (2014. pp. Chapter 5.12. ISBN 9283204298) [2] Safaeian M, Solomon D. Cervical Cancer Prevention – Cervical Screening: Science in Evolution. Obstet Gynecol Clin North Am. 2007;34(4):739-60 [3] Kim YB, Kim GE, Cho NH, Pyo HR, Shim SJ, Chang SK, Park HC, Suh CO, Park TK, Kim BS. Overexpression of Cyclooxygenase-2 Is Associated with a Poor Prognosis in Patients with Squamous Cell Carcinoma of the Uterine Cervix Treated with Radiation and Concurrent Chemotherapy. Cancer. 2002;95(3):531-9 [4] Liu HX, Li N, Wei L, Zhou FX, Ma R, Xiao F, Zhang W, Zhang Y, Hui Y, Song H, Chen BL. High expression of Kruppel-like factor 4 as a predictor of poor prognosis for cervical cancer patient response to radiotherapy. Tumor Biology. 2017;39(6):1-9. [5] Venkatanarayan A, Raulji P, Norton W, Flores ER. Novel therapeutic interventions for p53-altered tumors through manipulation of its family members, p63 and p73. Cell Cycle. 2016;15(2):164-71 Author address E-Mail: [email protected]
- 64 -
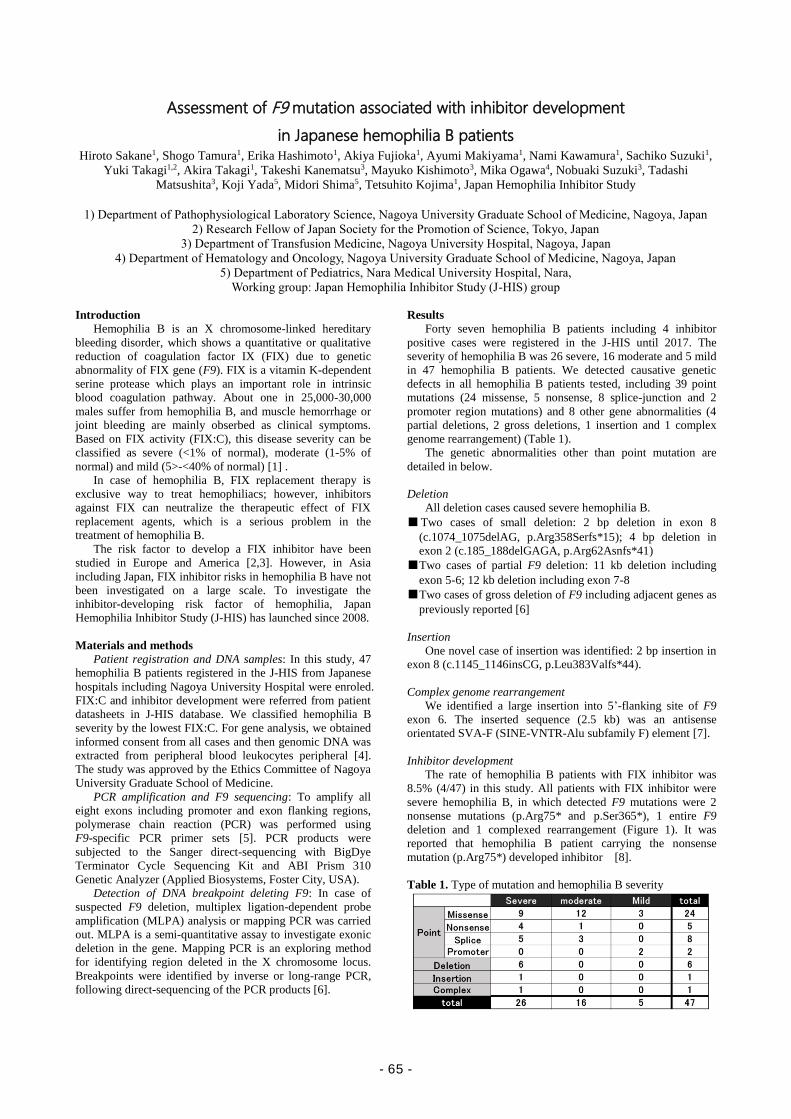
Assessment of F9 mutation associated with inhibitor development
in Japanese hemophilia B patients Hiroto Sakane1, Shogo Tamura1, Erika Hashimoto1, Akiya Fujioka1, Ayumi Makiyama1, Nami Kawamura1, Sachiko Suzuki1,
Yuki Takagi1,2, Akira Takagi1, Takeshi Kanematsu3, Mayuko Kishimoto3, Mika Ogawa4, Nobuaki Suzuki3, Tadashi
Matsushita3, Koji Yada5, Midori Shima5, Tetsuhito Kojima1, Japan Hemophilia Inhibitor Study
1) Department of Pathophysiological Laboratory Science, Nagoya University Graduate School of Medicine, Nagoya, Japan
2) Research Fellow of Japan Society for the Promotion of Science, Tokyo, Japan
3) Department of Transfusion Medicine, Nagoya University Hospital, Nagoya, Japan
4) Department of Hematology and Oncology, Nagoya University Graduate School of Medicine, Nagoya, Japan
5) Department of Pediatrics, Nara Medical University Hospital, Nara,
Working group: Japan Hemophilia Inhibitor Study (J-HIS) group
Introduction
Hemophilia B is an X chromosome-linked hereditary
bleeding disorder, which shows a quantitative or qualitative
reduction of coagulation factor IX (FIX) due to genetic
abnormality of FIX gene (F9). FIX is a vitamin K-dependent
serine protease which plays an important role in intrinsic
blood coagulation pathway. About one in 25,000-30,000
males suffer from hemophilia B, and muscle hemorrhage or
joint bleeding are mainly obserbed as clinical symptoms.
Based on FIX activity (FIX:C), this disease severity can be
classified as severe (<1% of normal), moderate (1-5% of
normal) and mild (5>-<40% of normal) [1] .
In case of hemophilia B, FIX replacement therapy is
exclusive way to treat hemophiliacs; however, inhibitors
against FIX can neutralize the therapeutic effect of FIX
replacement agents, which is a serious problem in the
treatment of hemophilia B.
The risk factor to develop a FIX inhibitor have been
studied in Europe and America [2,3]. However, in Asia
including Japan, FIX inhibitor risks in hemophilia B have not
been investigated on a large scale. To investigate the
inhibitor-developing risk factor of hemophilia, Japan
Hemophilia Inhibitor Study (J-HIS) has launched since 2008.
Materials and methods
Patient registration and DNA samples: In this study, 47
hemophilia B patients registered in the J-HIS from Japanese
hospitals including Nagoya University Hospital were enroled.
FIX:C and inhibitor development were referred from patient
datasheets in J-HIS database. We classified hemophilia B
severity by the lowest FIX:C. For gene analysis, we obtained
informed consent from all cases and then genomic DNA was
extracted from peripheral blood leukocytes peripheral [4].
The study was approved by the Ethics Committee of Nagoya
University Graduate School of Medicine.
PCR amplification and F9 sequencing: To amplify all
eight exons including promoter and exon flanking regions,
polymerase chain reaction (PCR) was performed using
F9-specific PCR primer sets [5]. PCR products were
subjected to the Sanger direct-sequencing with BigDye
Terminator Cycle Sequencing Kit and ABI Prism 310
Genetic Analyzer (Applied Biosystems, Foster City, USA).
Detection of DNA breakpoint deleting F9: In case of
suspected F9 deletion, multiplex ligation-dependent probe
amplification (MLPA) analysis or mapping PCR was carried
out. MLPA is a semi-quantitative assay to investigate exonic
deletion in the gene. Mapping PCR is an exploring method
for identifying region deleted in the X chromosome locus.
Breakpoints were identified by inverse or long-range PCR,
following direct-sequencing of the PCR products [6].
Results
Forty seven hemophilia B patients including 4 inhibitor
positive cases were registered in the J-HIS until 2017. The
severity of hemophilia B was 26 severe, 16 moderate and 5 mild
in 47 hemophilia B patients. We detected causative genetic
defects in all hemophilia B patients tested, including 39 point
mutations (24 missense, 5 nonsense, 8 splice-junction and 2
promoter region mutations) and 8 other gene abnormalities (4
partial deletions, 2 gross deletions, 1 insertion and 1 complex
genome rearrangement) (Table 1).
The genetic abnormalities other than point mutation are
detailed in below.
Deletion
All deletion cases caused severe hemophilia B.
■Two cases of small deletion: 2 bp deletion in exon 8
(c.1074_1075delAG, p.Arg358Serfs*15); 4 bp deletion in
exon 2 (c.185_188delGAGA, p.Arg62Asnfs*41)
■Two cases of partial F9 deletion: 11 kb deletion including
exon 5-6; 12 kb deletion including exon 7-8
■Two cases of gross deletion of F9 including adjacent genes as
previously reported [6]
Insertion
One novel case of insertion was identified: 2 bp insertion in
exon 8 (c.1145_1146insCG, p.Leu383Valfs*44).
Complex genome rearrangement
We identified a large insertion into 5’-flanking site of F9
exon 6. The inserted sequence (2.5 kb) was an antisense
orientated SVA-F (SINE-VNTR-Alu subfamily F) element [7].
Inhibitor development
The rate of hemophilia B patients with FIX inhibitor was
8.5% (4/47) in this study. All patients with FIX inhibitor were
severe hemophilia B, in which detected F9 mutations were 2
nonsense mutations (p.Arg75* and p.Ser365*), 1 entire F9
deletion and 1 complexed rearrangement (Figure 1). It was
reported that hemophilia B patient carrying the nonsense
mutation (p.Arg75*) developed inhibitor [8].
Table 1. Type of mutation and hemophilia B severity
- 65 -
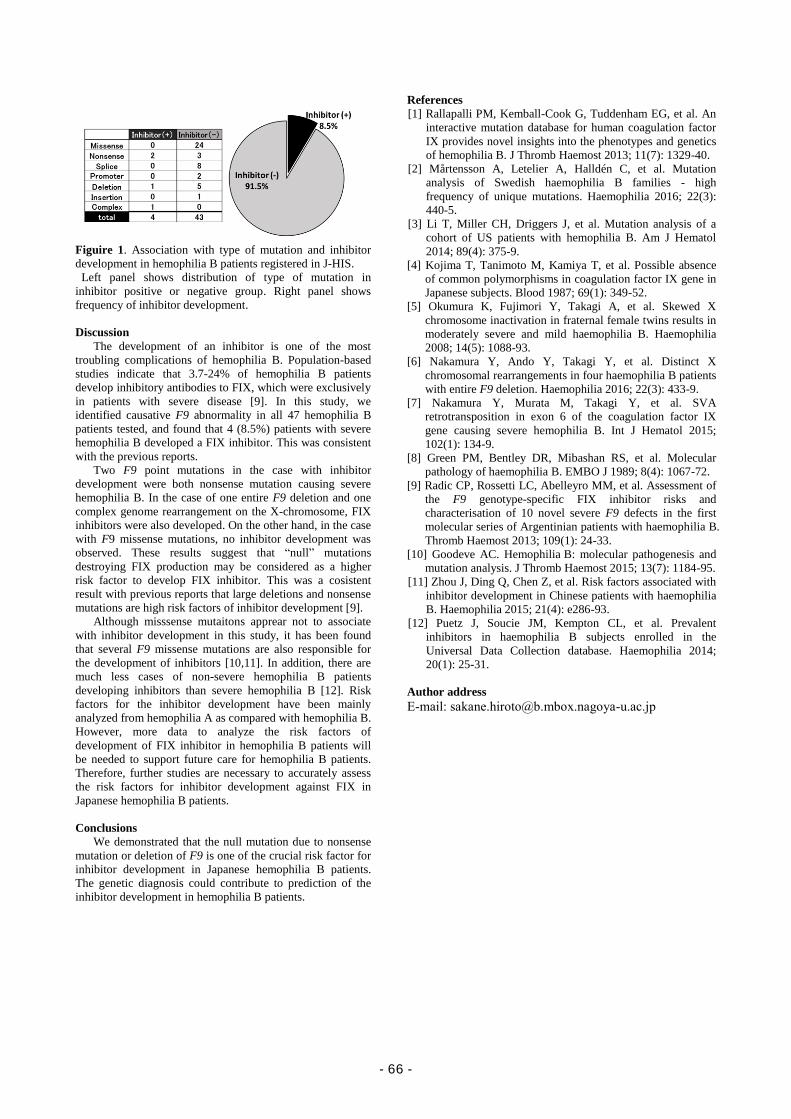
Figuire 1. Association with type of mutation and inhibitor
development in hemophilia B patients registered in J-HIS.
Left panel shows distribution of type of mutation in
inhibitor positive or negative group. Right panel shows
frequency of inhibitor development.
Discussion
The development of an inhibitor is one of the most
troubling complications of hemophilia B. Population-based
studies indicate that 3.7-24% of hemophilia B patients
develop inhibitory antibodies to FIX, which were exclusively
in patients with severe disease [9]. In this study, we
identified causative F9 abnormality in all 47 hemophilia B
patients tested, and found that 4 (8.5%) patients with severe
hemophilia B developed a FIX inhibitor. This was consistent
with the previous reports.
Two F9 point mutations in the case with inhibitor
development were both nonsense mutation causing severe
hemophilia B. In the case of one entire F9 deletion and one
complex genome rearrangement on the X-chromosome, FIX
inhibitors were also developed. On the other hand, in the case
with F9 missense mutations, no inhibitor development was
observed. These results suggest that “null” mutations
destroying FIX production may be considered as a higher
risk factor to develop FIX inhibitor. This was a cosistent
result with previous reports that large deletions and nonsense
mutations are high risk factors of inhibitor development [9].
Although misssense mutaitons apprear not to associate
with inhibitor development in this study, it has been found
that several F9 missense mutations are also responsible for
the development of inhibitors [10,11]. In addition, there are
much less cases of non-severe hemophilia B patients
developing inhibitors than severe hemophilia B [12]. Risk
factors for the inhibitor development have been mainly
analyzed from hemophilia A as compared with hemophilia B.
However, more data to analyze the risk factors of
development of FIX inhibitor in hemophilia B patients will
be needed to support future care for hemophilia B patients.
Therefore, further studies are necessary to accurately assess
the risk factors for inhibitor development against FIX in
Japanese hemophilia B patients.
Conclusions
We demonstrated that the null mutation due to nonsense
mutation or deletion of F9 is one of the crucial risk factor for
inhibitor development in Japanese hemophilia B patients.
The genetic diagnosis could contribute to prediction of the
inhibitor development in hemophilia B patients.
References
[1] Rallapalli PM, Kemball-Cook G, Tuddenham EG, et al. An
interactive mutation database for human coagulation factor
IX provides novel insights into the phenotypes and genetics
of hemophilia B. J Thromb Haemost 2013; 11(7): 1329-40.
[2] Mårtensson A, Letelier A, Halldén C, et al. Mutation
analysis of Swedish haemophilia B families - high
frequency of unique mutations. Haemophilia 2016; 22(3):
440-5.
[3] Li T, Miller CH, Driggers J, et al. Mutation analysis of a
cohort of US patients with hemophilia B. Am J Hematol
2014; 89(4): 375-9.
[4] Kojima T, Tanimoto M, Kamiya T, et al. Possible absence
of common polymorphisms in coagulation factor IX gene in
Japanese subjects. Blood 1987; 69(1): 349-52.
[5] Okumura K, Fujimori Y, Takagi A, et al. Skewed X
chromosome inactivation in fraternal female twins results in
moderately severe and mild haemophilia B. Haemophilia
2008; 14(5): 1088-93.
[6] Nakamura Y, Ando Y, Takagi Y, et al. Distinct X
chromosomal rearrangements in four haemophilia B patients
with entire F9 deletion. Haemophilia 2016; 22(3): 433-9.
[7] Nakamura Y, Murata M, Takagi Y, et al. SVA
retrotransposition in exon 6 of the coagulation factor IX
gene causing severe hemophilia B. Int J Hematol 2015;
102(1): 134-9.
[8] Green PM, Bentley DR, Mibashan RS, et al. Molecular
pathology of haemophilia B. EMBO J 1989; 8(4): 1067-72.
[9] Radic CP, Rossetti LC, Abelleyro MM, et al. Assessment of
the F9 genotype-specific FIX inhibitor risks and
characterisation of 10 novel severe F9 defects in the first
molecular series of Argentinian patients with haemophilia B.
Thromb Haemost 2013; 109(1): 24-33.
[10] Goodeve AC. Hemophilia B: molecular pathogenesis and
mutation analysis. J Thromb Haemost 2015; 13(7): 1184-95.
[11] Zhou J, Ding Q, Chen Z, et al. Risk factors associated with
inhibitor development in Chinese patients with haemophilia
B. Haemophilia 2015; 21(4): e286-93.
[12] Puetz J, Soucie JM, Kempton CL, et al. Prevalent
inhibitors in haemophilia B subjects enrolled in the
Universal Data Collection database. Haemophilia 2014;
20(1): 25-31.
Author address
E-mail: [email protected]
- 66 -
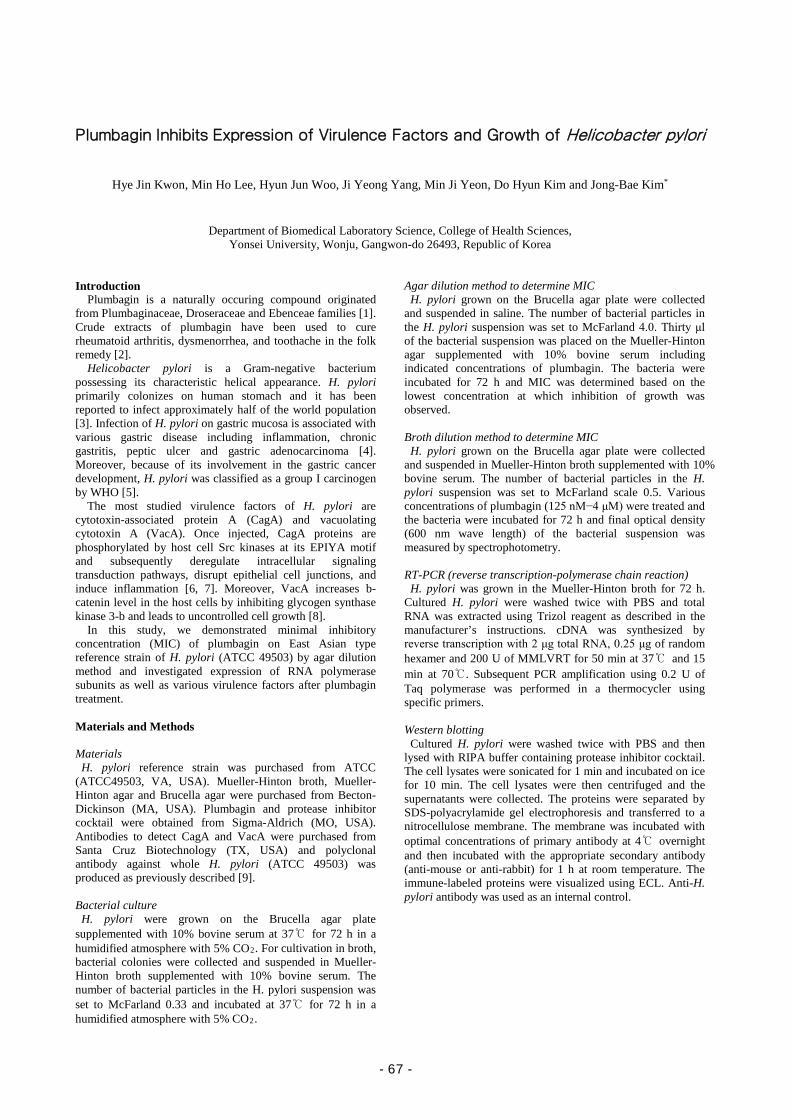
Plumbagin Inhibits Expression of Virulence Factors and Growth of Helicobacter pylori
Hye Jin Kwon, Min Ho Lee, Hyun Jun Woo, Ji Yeong Yang, Min Ji Yeon, Do Hyun Kim and Jong-Bae Kim*
Department of Biomedical Laboratory Science, College of Health Sciences, Yonsei University, Wonju, Gangwon-do 26493, Republic of Korea
Introduction
Plumbagin is a naturally occuring compound originated from Plumbaginaceae, Droseraceae and Ebenceae families [1]. Crude extracts of plumbagin have been used to cure rheumatoid arthritis, dysmenorrhea, and toothache in the folk remedy [2].
Helicobacter pylori is a Gram-negative bacterium possessing its characteristic helical appearance. H. pylori primarily colonizes on human stomach and it has been reported to infect approximately half of the world population [3]. Infection of H. pylori on gastric mucosa is associated with various gastric disease including inflammation, chronic gastritis, peptic ulcer and gastric adenocarcinoma [4]. Moreover, because of its involvement in the gastric cancer development, H. pylori was classified as a group I carcinogen by WHO [5].
The most studied virulence factors of H. pylori are cytotoxin-associated protein A (CagA) and vacuolating cytotoxin A (VacA). Once injected, CagA proteins are phosphorylated by host cell Src kinases at its EPIYA motif and subsequently deregulate intracellular signaling transduction pathways, disrupt epithelial cell junctions, and induce inflammation [6, 7]. Moreover, VacA increases b-catenin level in the host cells by inhibiting glycogen synthase kinase 3-b and leads to uncontrolled cell growth [8].
In this study, we demonstrated minimal inhibitory concentration (MIC) of plumbagin on East Asian type reference strain of H. pylori (ATCC 49503) by agar dilution method and investigated expression of RNA polymerase subunits as well as various virulence factors after plumbagin treatment. Materials and Methods Materials
H. pylori reference strain was purchased from ATCC (ATCC49503, VA, USA). Mueller-Hinton broth, Mueller-Hinton agar and Brucella agar were purchased from Becton-Dickinson (MA, USA). Plumbagin and protease inhibitor cocktail were obtained from Sigma-Aldrich (MO, USA). Antibodies to detect CagA and VacA were purchased from Santa Cruz Biotechnology (TX, USA) and polyclonal antibody against whole H. pylori (ATCC 49503) was produced as previously described [9]. Bacterial culture
H. pylori were grown on the Brucella agar plate supplemented with 10% bovine serum at 37℃ for 72 h in a humidified atmosphere with 5% CO2. For cultivation in broth, bacterial colonies were collected and suspended in Mueller-Hinton broth supplemented with 10% bovine serum. The number of bacterial particles in the H. pylori suspension was set to McFarland 0.33 and incubated at 37℃ for 72 h in a humidified atmosphere with 5% CO2.
Agar dilution method to determine MIC H. pylori grown on the Brucella agar plate were collected
and suspended in saline. The number of bacterial particles in the H. pylori suspension was set to McFarland 4.0. Thirty μl of the bacterial suspension was placed on the Mueller-Hinton agar supplemented with 10% bovine serum including indicated concentrations of plumbagin. The bacteria were incubated for 72 h and MIC was determined based on the lowest concentration at which inhibition of growth was observed. Broth dilution method to determine MIC
H. pylori grown on the Brucella agar plate were collected and suspended in Mueller-Hinton broth supplemented with 10% bovine serum. The number of bacterial particles in the H. pylori suspension was set to McFarland scale 0.5. Various concentrations of plumbagin (125 nM−4 μM) were treated and the bacteria were incubated for 72 h and final optical density (600 nm wave length) of the bacterial suspension was measured by spectrophotometry. RT-PCR (reverse transcription-polymerase chain reaction)
H. pylori was grown in the Mueller-Hinton broth for 72 h. Cultured H. pylori were washed twice with PBS and total RNA was extracted using Trizol reagent as described in the manufacturer’s instructions. cDNA was synthesized by reverse transcription with 2 μg total RNA, 0.25 μg of random hexamer and 200 U of MMLVRT for 50 min at 37℃ and 15 min at 70℃. Subsequent PCR amplification using 0.2 U of Taq polymerase was performed in a thermocycler using specific primers. Western blotting
Cultured H. pylori were washed twice with PBS and then lysed with RIPA buffer containing protease inhibitor cocktail. The cell lysates were sonicated for 1 min and incubated on ice for 10 min. The cell lysates were then centrifuged and the supernatants were collected. The proteins were separated by SDS-polyacrylamide gel electrophoresis and transferred to a nitrocellulose membrane. The membrane was incubated with optimal concentrations of primary antibody at 4℃ overnight and then incubated with the appropriate secondary antibody (anti-mouse or anti-rabbit) for 1 h at room temperature. The immune-labeled proteins were visualized using ECL. Anti-H. pylori antibody was used as an internal control.
- 67 -
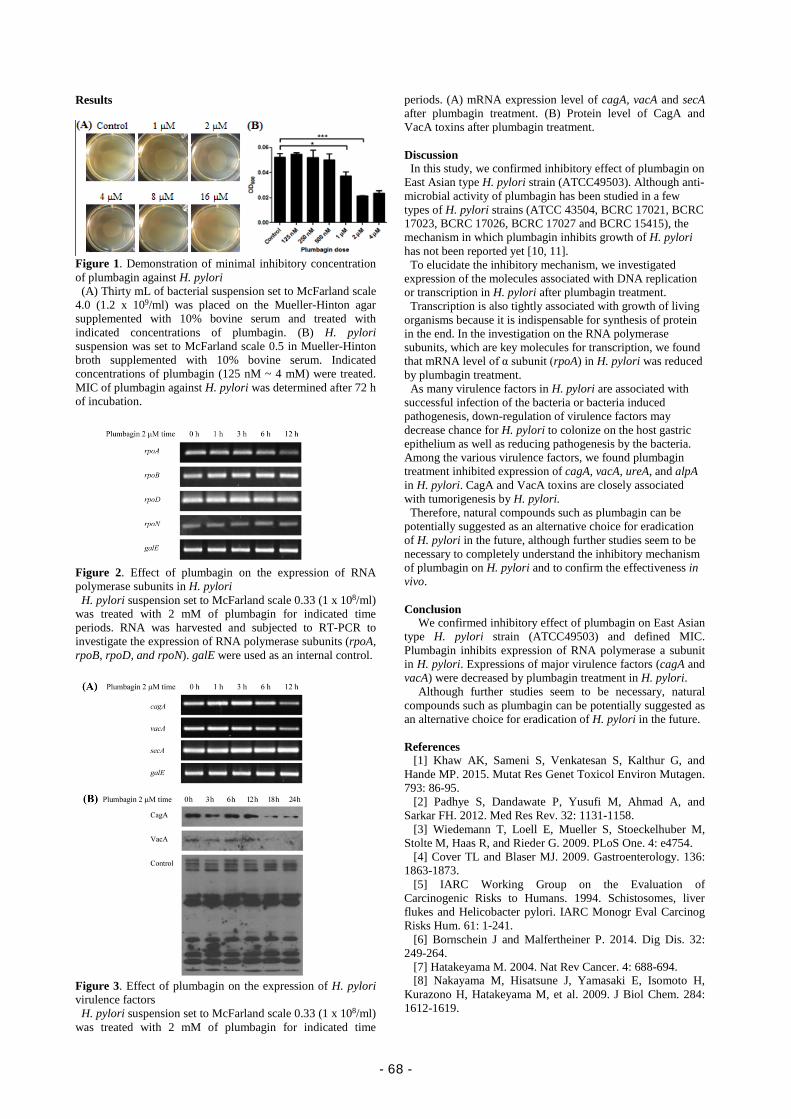
Results
Figure 1. Demonstration of minimal inhibitory concentration of plumbagin against H. pylori
(A) Thirty mL of bacterial suspension set to McFarland scale 4.0 (1.2 x 10⁹/ml) was placed on the Mueller-Hinton agar supplemented with 10% bovine serum and treated with indicated concentrations of plumbagin. (B) H. pylori suspension was set to McFarland scale 0.5 in Mueller-Hinton broth supplemented with 10% bovine serum. Indicated concentrations of plumbagin (125 nM ~ 4 mM) were treated. MIC of plumbagin against H. pylori was determined after 72 h of incubation.
Figure 2. Effect of plumbagin on the expression of RNA polymerase subunits in H. pylori
H. pylori suspension set to McFarland scale 0.33 (1 x 10⁸/ml) was treated with 2 mM of plumbagin for indicated time periods. RNA was harvested and subjected to RT-PCR to investigate the expression of RNA polymerase subunits (rpoA, rpoB, rpoD, and rpoN). galE were used as an internal control.
Figure 3. Effect of plumbagin on the expression of H. pylori virulence factors
H. pylori suspension set to McFarland scale 0.33 (1 x 10⁸/ml) was treated with 2 mM of plumbagin for indicated time
periods. (A) mRNA expression level of cagA, vacA and secA after plumbagin treatment. (B) Protein level of CagA and VacA toxins after plumbagin treatment. Discussion
In this study, we confirmed inhibitory effect of plumbagin on East Asian type H. pylori strain (ATCC49503). Although anti-microbial activity of plumbagin has been studied in a few types of H. pylori strains (ATCC 43504, BCRC 17021, BCRC 17023, BCRC 17026, BCRC 17027 and BCRC 15415), the mechanism in which plumbagin inhibits growth of H. pylori has not been reported yet [10, 11].
To elucidate the inhibitory mechanism, we investigated expression of the molecules associated with DNA replication or transcription in H. pylori after plumbagin treatment.
Transcription is also tightly associated with growth of living organisms because it is indispensable for synthesis of protein in the end. In the investigation on the RNA polymerase subunits, which are key molecules for transcription, we found that mRNA level of α subunit (rpoA) in H. pylori was reduced by plumbagin treatment.
As many virulence factors in H. pylori are associated with successful infection of the bacteria or bacteria induced pathogenesis, down-regulation of virulence factors may decrease chance for H. pylori to colonize on the host gastric epithelium as well as reducing pathogenesis by the bacteria. Among the various virulence factors, we found plumbagin treatment inhibited expression of cagA, vacA, ureA, and alpA in H. pylori. CagA and VacA toxins are closely associated with tumorigenesis by H. pylori.
Therefore, natural compounds such as plumbagin can be potentially suggested as an alternative choice for eradication of H. pylori in the future, although further studies seem to be necessary to completely understand the inhibitory mechanism of plumbagin on H. pylori and to confirm the effectiveness in vivo. Conclusion
We confirmed inhibitory effect of plumbagin on East Asian type H. pylori strain (ATCC49503) and defined MIC. Plumbagin inhibits expression of RNA polymerase a subunit in H. pylori. Expressions of major virulence factors (cagA and vacA) were decreased by plumbagin treatment in H. pylori.
Although further studies seem to be necessary, natural compounds such as plumbagin can be potentially suggested as an alternative choice for eradication of H. pylori in the future. References
[1] Khaw AK, Sameni S, Venkatesan S, Kalthur G, and Hande MP. 2015. Mutat Res Genet Toxicol Environ Mutagen. 793: 86-95.
[2] Padhye S, Dandawate P, Yusufi M, Ahmad A, and Sarkar FH. 2012. Med Res Rev. 32: 1131-1158.
[3] Wiedemann T, Loell E, Mueller S, Stoeckelhuber M, Stolte M, Haas R, and Rieder G. 2009. PLoS One. 4: e4754.
[4] Cover TL and Blaser MJ. 2009. Gastroenterology. 136: 1863-1873.
[5] IARC Working Group on the Evaluation of Carcinogenic Risks to Humans. 1994. Schistosomes, liver flukes and Helicobacter pylori. IARC Monogr Eval Carcinog Risks Hum. 61: 1-241.
[6] Bornschein J and Malfertheiner P. 2014. Dig Dis. 32: 249-264.
[7] Hatakeyama M. 2004. Nat Rev Cancer. 4: 688-694. [8] Nakayama M, Hisatsune J, Yamasaki E, Isomoto H,
Kurazono H, Hatakeyama M, et al. 2009. J Biol Chem. 284: 1612-1619.
- 68 -

[9] Kim SH, Park M, Woo H, Tharmalingam N, Lee G, Rhee KJ, et al. 2012. Int. J. Med. Sci. 9: 838−842.
[10] Park BS, Lee HK, Lee SE, Piao XL, Takeoka GR, Wong RY, et al. 2006. J. Ethnopharmacol. 105:255−262.
[11] Wang YC, Huang TL. 2005. J. Chromatogr A. 1094: 99−104.
- 69 -
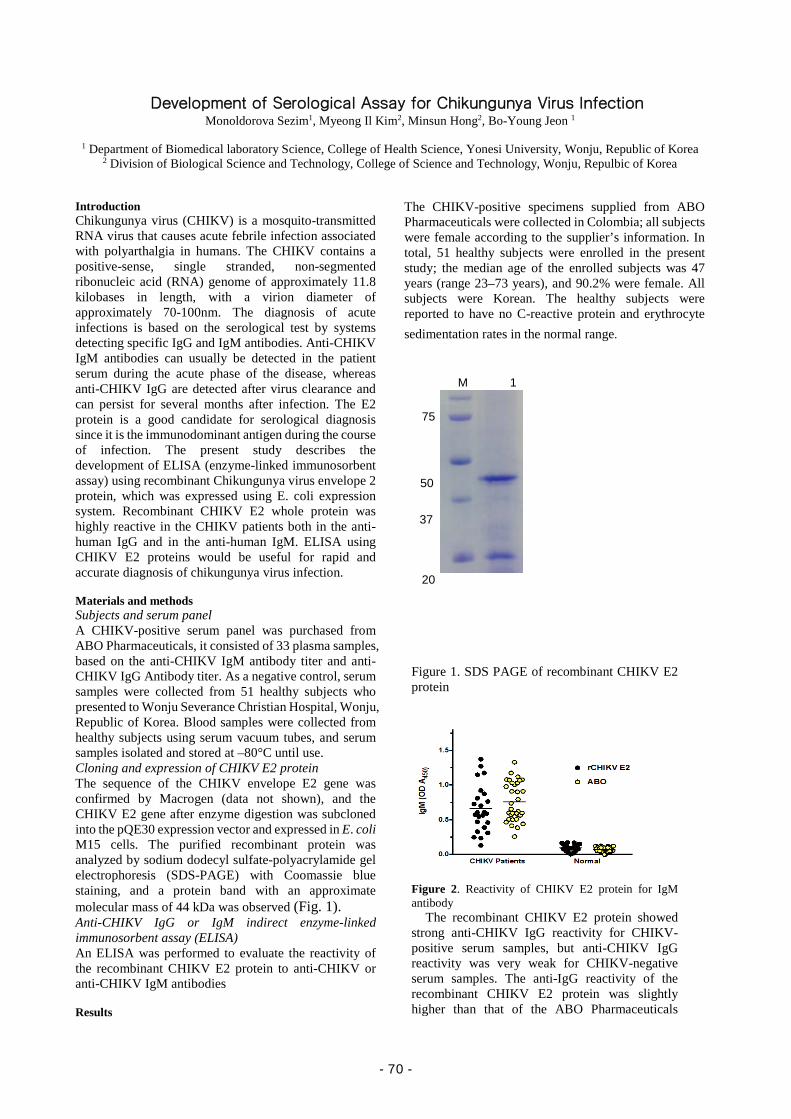
Development of Serological Assay for Chikungunya Virus Infection Monoldorova Sezim1, Myeong Il Kim2, Minsun Hong2, Bo-Young Jeon 1
1 Department of Biomedical laboratory Science, College of Health Science, Yonesi University, Wonju, Republic of Korea
2 Division of Biological Science and Technology, College of Science and Technology, Wonju, Repulbic of Korea Introduction Chikungunya virus (CHIKV) is a mosquito-transmitted RNA virus that causes acute febrile infection associated with polyarthalgia in humans. The CHIKV contains a positive-sense, single stranded, non-segmented ribonucleic acid (RNA) genome of approximately 11.8 kilobases in length, with a virion diameter of approximately 70-100nm. The diagnosis of acute infections is based on the serological test by systems detecting specific IgG and IgM antibodies. Anti-CHIKV IgM antibodies can usually be detected in the patient serum during the acute phase of the disease, whereas anti-CHIKV IgG are detected after virus clearance and can persist for several months after infection. The E2 protein is a good candidate for serological diagnosis since it is the immunodominant antigen during the course of infection. The present study describes the development of ELISA (enzyme-linked immunosorbent assay) using recombinant Chikungunya virus envelope 2 protein, which was expressed using E. coli expression system. Recombinant CHIKV E2 whole protein was highly reactive in the CHIKV patients both in the anti-human IgG and in the anti-human IgM. ELISA using CHIKV E2 proteins would be useful for rapid and accurate diagnosis of chikungunya virus infection. Materials and methods Subjects and serum panel A CHIKV-positive serum panel was purchased from ABO Pharmaceuticals, it consisted of 33 plasma samples, based on the anti-CHIKV IgM antibody titer and anti-CHIKV IgG Antibody titer. As a negative control, serum samples were collected from 51 healthy subjects who presented to Wonju Severance Christian Hospital, Wonju, Republic of Korea. Blood samples were collected from healthy subjects using serum vacuum tubes, and serum samples isolated and stored at –80°C until use. Cloning and expression of CHIKV E2 protein The sequence of the CHIKV envelope E2 gene was confirmed by Macrogen (data not shown), and the CHIKV E2 gene after enzyme digestion was subcloned into the pQE30 expression vector and expressed in E. coli M15 cells. The purified recombinant protein was analyzed by sodium dodecyl sulfate-polyacrylamide gel electrophoresis (SDS-PAGE) with Coomassie blue staining, and a protein band with an approximate molecular mass of 44 kDa was observed (Fig. 1). Anti-CHIKV IgG or IgM indirect enzyme-linked immunosorbent assay (ELISA) An ELISA was performed to evaluate the reactivity of the recombinant CHIKV E2 protein to anti-CHIKV or anti-CHIKV IgM antibodies Results
The CHIKV-positive specimens supplied from ABO Pharmaceuticals were collected in Colombia; all subjects were female according to the supplier’s information. In total, 51 healthy subjects were enrolled in the present study; the median age of the enrolled subjects was 47 years (range 23–73 years), and 90.2% were female. All subjects were Korean. The healthy subjects were reported to have no C-reactive protein and erythrocyte sedimentation rates in the normal range.
Figure 1. SDS PAGE of recombinant CHIKV E2 protein
Figure 2. Reactivity of CHIKV E2 protein for IgM antibody
The recombinant CHIKV E2 protein showed strong anti-CHIKV IgG reactivity for CHIKV-positive serum samples, but anti-CHIKV IgG reactivity was very weak for CHIKV-negative serum samples. The anti-IgG reactivity of the recombinant CHIKV E2 protein was slightly higher than that of the ABO Pharmaceuticals
20
37
50
75
M 1
- 70 -
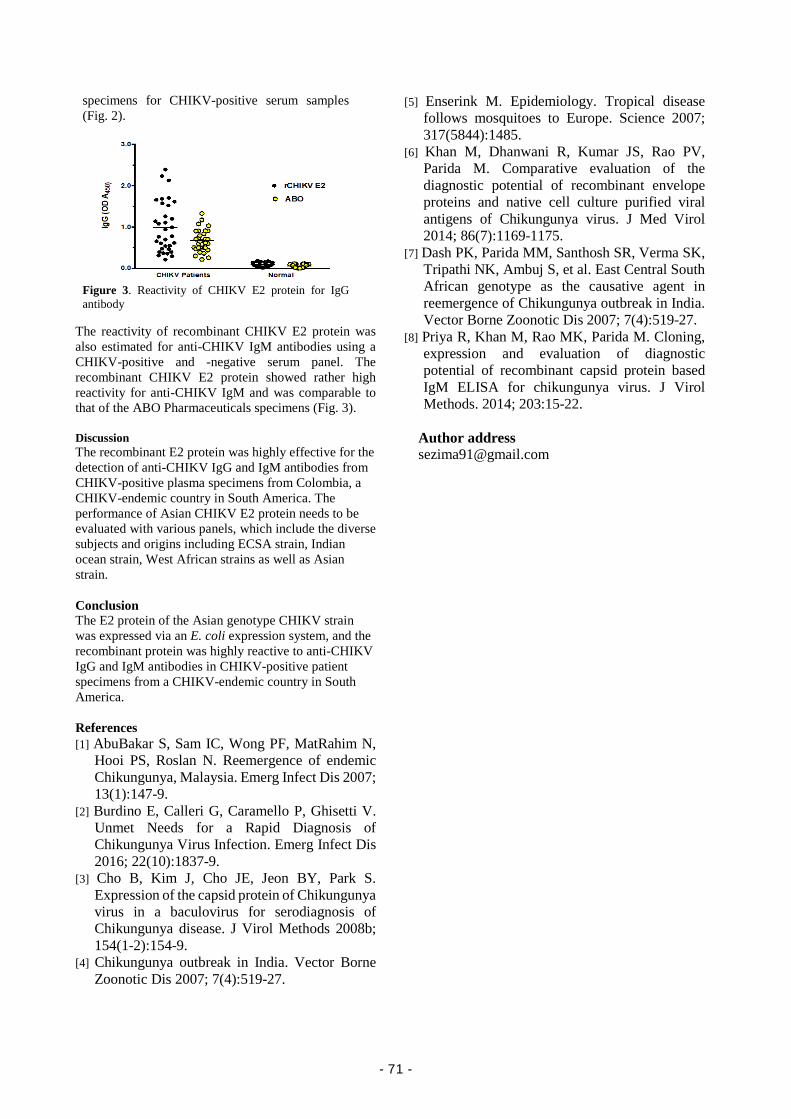
specimens for CHIKV-positive serum samples (Fig. 2).
Figure 3. Reactivity of CHIKV E2 protein for IgG antibody
The reactivity of recombinant CHIKV E2 protein was also estimated for anti-CHIKV IgM antibodies using a CHIKV-positive and -negative serum panel. The recombinant CHIKV E2 protein showed rather high reactivity for anti-CHIKV IgM and was comparable to that of the ABO Pharmaceuticals specimens (Fig. 3). Discussion The recombinant E2 protein was highly effective for the detection of anti-CHIKV IgG and IgM antibodies from CHIKV-positive plasma specimens from Colombia, a CHIKV-endemic country in South America. The performance of Asian CHIKV E2 protein needs to be evaluated with various panels, which include the diverse subjects and origins including ECSA strain, Indian ocean strain, West African strains as well as Asian strain. Conclusion The E2 protein of the Asian genotype CHIKV strain was expressed via an E. coli expression system, and the recombinant protein was highly reactive to anti-CHIKV IgG and IgM antibodies in CHIKV-positive patient specimens from a CHIKV-endemic country in South America. References [1] AbuBakar S, Sam IC, Wong PF, MatRahim N,
Hooi PS, Roslan N. Reemergence of endemic Chikungunya, Malaysia. Emerg Infect Dis 2007; 13(1):147-9.
[2] Burdino E, Calleri G, Caramello P, Ghisetti V. Unmet Needs for a Rapid Diagnosis of Chikungunya Virus Infection. Emerg Infect Dis 2016; 22(10):1837-9.
[3] Cho B, Kim J, Cho JE, Jeon BY, Park S. Expression of the capsid protein of Chikungunya virus in a baculovirus for serodiagnosis of Chikungunya disease. J Virol Methods 2008b; 154(1-2):154-9.
[4] Chikungunya outbreak in India. Vector Borne Zoonotic Dis 2007; 7(4):519-27.
[5] Enserink M. Epidemiology. Tropical disease follows mosquitoes to Europe. Science 2007; 317(5844):1485.
[6] Khan M, Dhanwani R, Kumar JS, Rao PV, Parida M. Comparative evaluation of the diagnostic potential of recombinant envelope proteins and native cell culture purified viral antigens of Chikungunya virus. J Med Virol 2014; 86(7):1169-1175.
[7] Dash PK, Parida MM, Santhosh SR, Verma SK, Tripathi NK, Ambuj S, et al. East Central South African genotype as the causative agent in reemergence of Chikungunya outbreak in India. Vector Borne Zoonotic Dis 2007; 7(4):519-27.
[8] Priya R, Khan M, Rao MK, Parida M. Cloning, expression and evaluation of diagnostic potential of recombinant capsid protein based IgM ELISA for chikungunya virus. J Virol Methods. 2014; 203:15-22.
Author address [email protected]
- 71 -
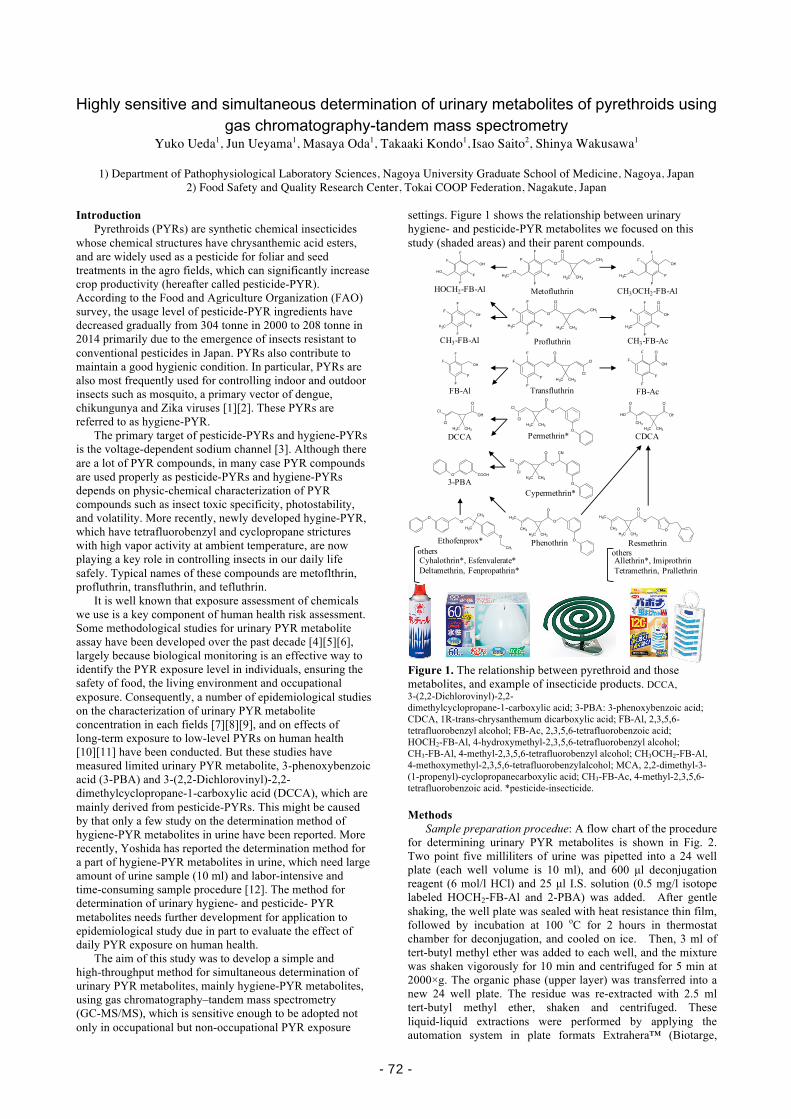
Highly sensitive and simultaneous determination of urinary metabolites of pyrethroids using gas chromatography-tandem mass spectrometry
Yuko Ueda1, Jun Ueyama1, Masaya Oda1, Takaaki Kondo1, Isao Saito2, Shinya Wakusawa1
1) Department of Pathophysiological Laboratory Sciences, Nagoya University Graduate School of Medicine, Nagoya, Japan 2) Food Safety and Quality Research Center, Tokai COOP Federation, Nagakute, Japan
Introduction Pyrethroids (PYRs) are synthetic chemical insecticides whose chemical structures have chrysanthemic acid esters, and are widely used as a pesticide for foliar and seed treatments in the agro fields, which can significantly increase crop productivity (hereafter called pesticide-PYR). According to the Food and Agriculture Organization (FAO) survey, the usage level of pesticide-PYR ingredients have decreased gradually from 304 tonne in 2000 to 208 tonne in 2014 primarily due to the emergence of insects resistant to conventional pesticides in Japan. PYRs also contribute to maintain a good hygienic condition. In particular, PYRs are also most frequently used for controlling indoor and outdoor insects such as mosquito, a primary vector of dengue, chikungunya and Zika viruses [1][2]. These PYRs are referred to as hygiene-PYR. The primary target of pesticide-PYRs and hygiene-PYRs is the voltage-dependent sodium channel [3]. Although there are a lot of PYR compounds, in many case PYR compounds are used properly as pesticide-PYRs and hygiene-PYRs depends on physic-chemical characterization of PYR compounds such as insect toxic specificity, photostability, and volatility. More recently, newly developed hygine-PYR, which have tetrafluorobenzyl and cyclopropane strictures with high vapor activity at ambient temperature, are now playing a key role in controlling insects in our daily life safely. Typical names of these compounds are metoflthrin, profluthrin, transfluthrin, and tefluthrin. It is well known that exposure assessment of chemicals we use is a key component of human health risk assessment. Some methodological studies for urinary PYR metabolite assay have been developed over the past decade [4][5][6], largely because biological monitoring is an effective way to identify the PYR exposure level in individuals, ensuring the safety of food, the living environment and occupational exposure. Consequently, a number of epidemiological studies on the characterization of urinary PYR metabolite concentration in each fields [7][8][9], and on effects of long-term exposure to low-level PYRs on human health [10][11] have been conducted. But these studies have measured limited urinary PYR metabolite, 3-phenoxybenzoic acid (3-PBA) and 3-(2,2-Dichlorovinyl)-2,2- dimethylcyclopropane-1-carboxylic acid (DCCA), which are mainly derived from pesticide-PYRs. This might be caused by that only a few study on the determination method of hygiene-PYR metabolites in urine have been reported. More recently, Yoshida has reported the determination method for a part of hygiene-PYR metabolites in urine, which need large amount of urine sample (10 ml) and labor-intensive and time-consuming sample procedure [12]. The method for determination of urinary hygiene- and pesticide- PYR metabolites needs further development for application to epidemiological study due in part to evaluate the effect of daily PYR exposure on human health. The aim of this study was to develop a simple and high-throughput method for simultaneous determination of urinary PYR metabolites, mainly hygiene-PYR metabolites, using gas chromatography–tandem mass spectrometry (GC-MS/MS), which is sensitive enough to be adopted not only in occupational but non-occupational PYR exposure
settings. Figure 1 shows the relationship between urinary hygiene- and pesticide-PYR metabolites we focused on this study (shaded areas) and their parent compounds.
Figure 1. The relationship between pyrethroid and those metabolites, and example of insecticide products. DCCA, 3-(2,2-Dichlorovinyl)-2,2- dimethylcyclopropane-1-carboxylic acid; 3-PBA: 3-phenoxybenzoic acid; CDCA, 1R-trans-chrysanthemum dicarboxylic acid; FB-Al, 2,3,5,6- tetrafluorobenzyl alcohol; FB-Ac, 2,3,5,6-tetrafluorobenzoic acid; HOCH2-FB-Al, 4-hydroxymethyl-2,3,5,6-tetrafluorobenzyl alcohol; CH3-FB-Al, 4-methyl-2,3,5,6-tetrafluorobenzyl alcohol; CH3OCH2-FB-Al, 4-methoxymethyl-2,3,5,6-tetrafluorobenzylalcohol; MCA, 2,2-dimethyl-3- (1-propenyl)-cyclopropanecarboxylic acid; CH3-FB-Ac, 4-methyl-2,3,5,6- tetrafluorobenzoic acid. *pesticide-insecticide. Methods Sample preparation procedue: A flow chart of the procedure for determining urinary PYR metabolites is shown in Fig. 2. Two point five milliliters of urine was pipetted into a 24 well plate (each well volume is 10 ml), and 600 µl deconjugation reagent (6 mol/l HCl) and 25 µl I.S. solution (0.5 mg/l isotope labeled HOCH2-FB-Al and 2-PBA) was added. After gentle shaking, the well plate was sealed with heat resistance thin film, followed by incubation at 100 oC for 2 hours in thermostat chamber for deconjugation, and cooled on ice. Then, 3 ml of tert-butyl methyl ether was added to each well, and the mixture was shaken vigorously for 10 min and centrifuged for 5 min at 2000×g. The organic phase (upper layer) was transferred into a new 24 well plate. The residue was re-extracted with 2.5 ml tert-butyl methyl ether, shaken and centrifuged. These liquid-liquid extractions were performed by applying the automation system in plate formats Extrahera™ (Biotarge,
OO
CH3
CH3
O
CH3
Ethofenprox*
OH
O
CH3CH3CH3
OH
O
CDCA
F
F
F
F
O
OH
FB-Ac
F
F
F
F
O
OH
CH3
CH3-FB-AcF
F
F
F
OH
FB-Al
F
F
F
F
OH
CH3
CH3-FB-Al
HOCH2-FB-Al
F
F
F
F
OH
OH
CH3OCH2-FB-Al
F
F
F
F
OH
OCH3
O COOH
3-PBA
Cl
Cl
OH
CH3 CH3
O
DCCA
F
F
F
F
O
O
CH3 CH3
OCH3
CH3
Metofluthrin
Profluthrin
F
F
F
F
O
O
CH3 CH3CH3
CH3
CH3
CH3
O
OCH3 CH3
O
Phenothrin
CH3
CH3CH3CH3
O
O
O
Resmethrin
Cl
Cl
O
OCH3 CH3
O
Permethrin*
Transfluthrin
F
F
F
F
O
O
CH3 CH3
Cl
Cl
Cyhalothrin*, Esfenvalerate*Deltamethrin, Fenpropathrin*
othersAllethrin*, ImiprothrinTetramethrin, Prallethrin
others
Cl
Cl
O
OCH3 CH3
O CN
Cypermethrin*
- 72 -
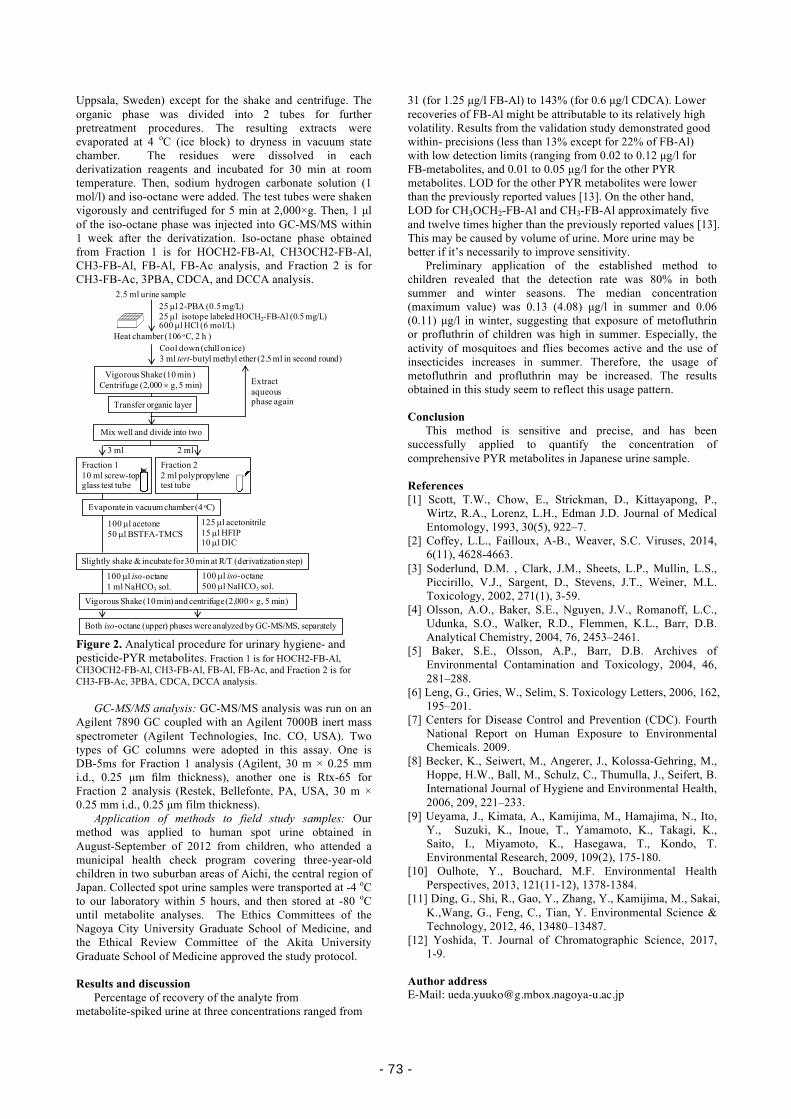
Uppsala, Sweden) except for the shake and centrifuge. The organic phase was divided into 2 tubes for further pretreatment procedures. The resulting extracts were evaporated at 4 oC (ice block) to dryness in vacuum state chamber. The residues were dissolved in each derivatization reagents and incubated for 30 min at room temperature. Then, sodium hydrogen carbonate solution (1 mol/l) and iso-octane were added. The test tubes were shaken vigorously and centrifuged for 5 min at 2,000×g. Then, 1 µl of the iso-octane phase was injected into GC-MS/MS within 1 week after the derivatization. Iso-octane phase obtained from Fraction 1 is for HOCH2-FB-Al, CH3OCH2-FB-Al, CH3-FB-Al, FB-Al, FB-Ac analysis, and Fraction 2 is for CH3-FB-Ac, 3PBA, CDCA, and DCCA analysis.
Figure 2. Analytical procedure for urinary hygiene- and pesticide-PYR metabolites. Fraction 1 is for HOCH2-FB-Al, CH3OCH2-FB-Al, CH3-FB-Al, FB-Al, FB-Ac, and Fraction 2 is for CH3-FB-Ac, 3PBA, CDCA, DCCA analysis. GC-MS/MS analysis: GC-MS/MS analysis was run on an Agilent 7890 GC coupled with an Agilent 7000B inert mass spectrometer (Agilent Technologies, Inc. CO, USA). Two types of GC columns were adopted in this assay. One is DB-5ms for Fraction 1 analysis (Agilent, 30 m × 0.25 mm i.d., 0.25 µm film thickness), another one is Rtx-65 for Fraction 2 analysis (Restek, Bellefonte, PA, USA, 30 m × 0.25 mm i.d., 0.25 µm film thickness). Application of methods to field study samples: Our method was applied to human spot urine obtained in August-September of 2012 from children, who attended a municipal health check program covering three-year-old children in two suburban areas of Aichi, the central region of Japan. Collected spot urine samples were transported at -4 oC to our laboratory within 5 hours, and then stored at -80 oC until metabolite analyses. The Ethics Committees of the Nagoya City University Graduate School of Medicine, and the Ethical Review Committee of the Akita University Graduate School of Medicine approved the study protocol. Results and discussion Percentage of recovery of the analyte from metabolite-spiked urine at three concentrations ranged from
31 (for 1.25 µg/l FB-Al) to 143% (for 0.6 µg/l CDCA). Lower recoveries of FB-Al might be attributable to its relatively high volatility. Results from the validation study demonstrated good within- precisions (less than 13% except for 22% of FB-Al) with low detection limits (ranging from 0.02 to 0.12 µg/l for FB-metabolites, and 0.01 to 0.05 µg/l for the other PYR metabolites. LOD for the other PYR metabolites were lower than the previously reported values [13]. On the other hand, LOD for CH3OCH2-FB-Al and CH3-FB-Al approximately five and twelve times higher than the previously reported values [13]. This may be caused by volume of urine. More urine may be better if it’s necessarily to improve sensitivity. Preliminary application of the established method to children revealed that the detection rate was 80% in both summer and winter seasons. The median concentration (maximum value) was 0.13 (4.08) µg/l in summer and 0.06 (0.11) µg/l in winter, suggesting that exposure of metofluthrin or profluthrin of children was high in summer. Especially, the activity of mosquitoes and flies becomes active and the use of insecticides increases in summer. Therefore, the usage of metofluthrin and profluthrin may be increased. The results obtained in this study seem to reflect this usage pattern. Conclusion This method is sensitive and precise, and has been successfully applied to quantify the concentration of comprehensive PYR metabolites in Japanese urine sample. References [1] Scott, T.W., Chow, E., Strickman, D., Kittayapong, P.,
Wirtz, R.A., Lorenz, L.H., Edman J.D. Journal of Medical Entomology, 1993, 30(5), 922–7.
[2] Coffey, L.L., Failloux, A-B., Weaver, S.C. Viruses, 2014, 6(11), 4628-4663.
[3] Soderlund, D.M. , Clark, J.M., Sheets, L.P., Mullin, L.S., Piccirillo, V.J., Sargent, D., Stevens, J.T., Weiner, M.L. Toxicology, 2002, 271(1), 3-59.
[4] Olsson, A.O., Baker, S.E., Nguyen, J.V., Romanoff, L.C., Udunka, S.O., Walker, R.D., Flemmen, K.L., Barr, D.B. Analytical Chemistry, 2004, 76, 2453–2461.
[5] Baker, S.E., Olsson, A.P., Barr, D.B. Archives of Environmental Contamination and Toxicology, 2004, 46, 281–288.
[6] Leng, G., Gries, W., Selim, S. Toxicology Letters, 2006, 162, 195–201.
[7] Centers for Disease Control and Prevention (CDC). Fourth National Report on Human Exposure to Environmental Chemicals. 2009.
[8] Becker, K., Seiwert, M., Angerer, J., Kolossa-Gehring, M., Hoppe, H.W., Ball, M., Schulz, C., Thumulla, J., Seifert, B. International Journal of Hygiene and Environmental Health, 2006, 209, 221–233.
[9] Ueyama, J., Kimata, A., Kamijima, M., Hamajima, N., Ito, Y., Suzuki, K., Inoue, T., Yamamoto, K., Takagi, K., Saito, I., Miyamoto, K., Hasegawa, T., Kondo, T. Environmental Research, 2009, 109(2), 175-180.
[10] Oulhote, Y., Bouchard, M.F. Environmental Health Perspectives, 2013, 121(11-12), 1378-1384.
[11] Ding, G., Shi, R., Gao, Y., Zhang, Y., Kamijima, M., Sakai, K.,Wang, G., Feng, C., Tian, Y. Environmental Science & Technology, 2012, 46, 13480–13487.
[12] Yoshida, T. Journal of Chromatographic Science, 2017, 1-9.
Author address E-Mail: [email protected]
25 µl 2-PBA (0.5 mg/L) 25 µl isotope labeled HOCH2-FB-Al (0.5 mg/L)600 µl HCl (6 mol/L)
Heat chamber (106 oC, 2 h )Cool down (chill on ice)3 ml tert-butyl methyl ether (2.5 ml in second round)
Slightly shake & incubate for 30 min at R/T (derivatization step)
Vigorous Shake (10 min)and centrifuge (2,000 ́ g, 5 min)
Transfer organic layer
100 µl iso-octane500 µl NaHCO3 sol.
Both iso-octane (upper) phases were analyzed by GC-MS/MS, separately
Extract aqueous phase again
2.5 ml urine sample
Mix well and divide into two
Fraction 110 ml screw-top glass test tube
Vigorous Shake (10 min )Centrifuge (2,000 ́ g, 5 min)
Fraction 22 ml polypropylene test tube
3 ml 2 ml
Evaporate in vacuum chamber (4 oC)
125 µl acetonitrile15 µl HFIP10 µl DIC
100 µl acetone50 µl BSTFA-TMCS
100 µl iso-octane1 ml NaHCO3 sol.
- 73 -
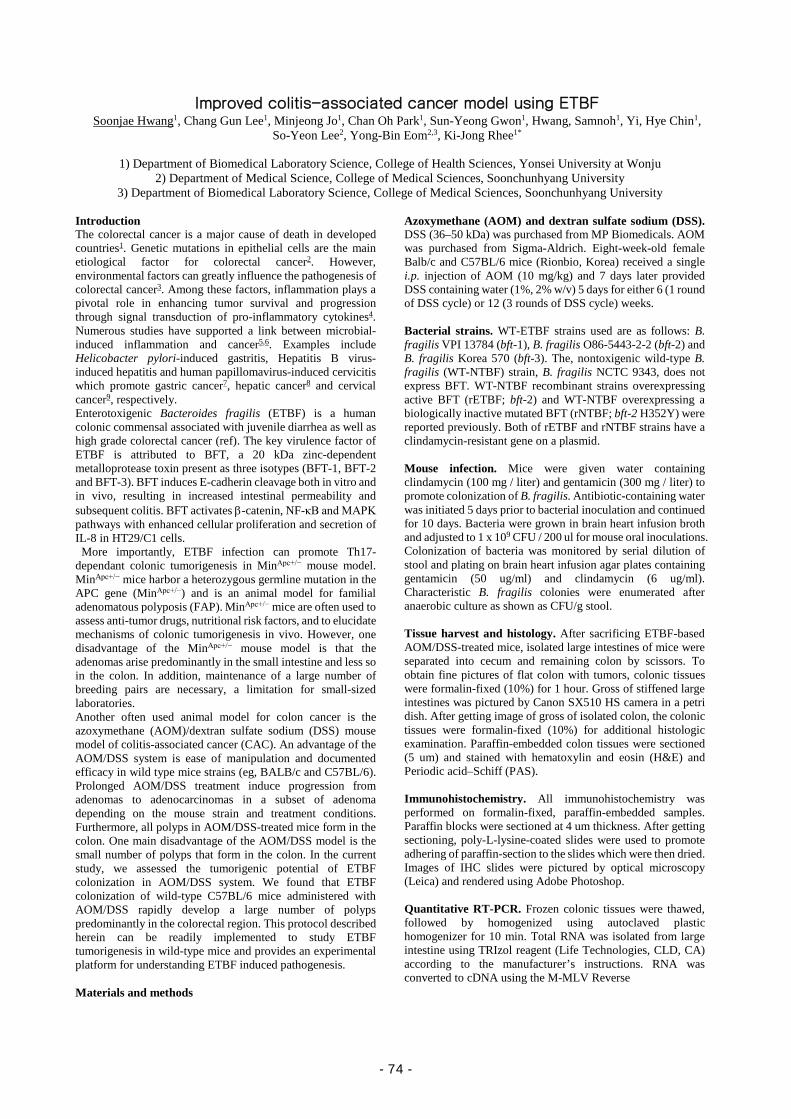
Improved colitis-associated cancer model using ETBF Soonjae Hwang1, Chang Gun Lee1, Minjeong Jo1, Chan Oh Park1, Sun-Yeong Gwon1, Hwang, Samnoh1, Yi, Hye Chin1,
So-Yeon Lee2, Yong-Bin Eom2,3, Ki-Jong Rhee1*
1) Department of Biomedical Laboratory Science, College of Health Sciences, Yonsei University at Wonju
2) Department of Medical Science, College of Medical Sciences, Soonchunhyang University 3) Department of Biomedical Laboratory Science, College of Medical Sciences, Soonchunhyang University
Introduction The colorectal cancer is a major cause of death in developed countries1. Genetic mutations in epithelial cells are the main etiological factor for colorectal cancer2. However, environmental factors can greatly influence the pathogenesis of colorectal cancer3. Among these factors, inflammation plays a pivotal role in enhancing tumor survival and progression through signal transduction of pro-inflammatory cytokines4. Numerous studies have supported a link between microbial-induced inflammation and cancer5,6. Examples include Helicobacter pylori-induced gastritis, Hepatitis B virus-induced hepatitis and human papillomavirus-induced cervicitis which promote gastric cancer7, hepatic cancer8 and cervical cancer9, respectively. Enterotoxigenic Bacteroides fragilis (ETBF) is a human colonic commensal associated with juvenile diarrhea as well as high grade colorectal cancer (ref). The key virulence factor of ETBF is attributed to BFT, a 20 kDa zinc-dependent metalloprotease toxin present as three isotypes (BFT-1, BFT-2 and BFT-3). BFT induces E-cadherin cleavage both in vitro and in vivo, resulting in increased intestinal permeability and subsequent colitis. BFT activates β-catenin, NF-κB and MAPK pathways with enhanced cellular proliferation and secretion of IL-8 in HT29/C1 cells.
More importantly, ETBF infection can promote Th17-dependant colonic tumorigenesis in MinApc+/− mouse model. MinApc+/− mice harbor a heterozygous germline mutation in the APC gene (MinApc+/−) and is an animal model for familial adenomatous polyposis (FAP). MinApc+/− mice are often used to assess anti-tumor drugs, nutritional risk factors, and to elucidate mechanisms of colonic tumorigenesis in vivo. However, one disadvantage of the MinApc+/− mouse model is that the adenomas arise predominantly in the small intestine and less so in the colon. In addition, maintenance of a large number of breeding pairs are necessary, a limitation for small-sized laboratories. Another often used animal model for colon cancer is the azoxymethane (AOM)/dextran sulfate sodium (DSS) mouse model of colitis-associated cancer (CAC). An advantage of the AOM/DSS system is ease of manipulation and documented efficacy in wild type mice strains (eg, BALB/c and C57BL/6). Prolonged AOM/DSS treatment induce progression from adenomas to adenocarcinomas in a subset of adenoma depending on the mouse strain and treatment conditions. Furthermore, all polyps in AOM/DSS-treated mice form in the colon. One main disadvantage of the AOM/DSS model is the small number of polyps that form in the colon. In the current study, we assessed the tumorigenic potential of ETBF colonization in AOM/DSS system. We found that ETBF colonization of wild-type C57BL/6 mice administered with AOM/DSS rapidly develop a large number of polyps predominantly in the colorectal region. This protocol described herein can be readily implemented to study ETBF tumorigenesis in wild-type mice and provides an experimental platform for understanding ETBF induced pathogenesis. Materials and methods
Azoxymethane (AOM) and dextran sulfate sodium (DSS). DSS (36–50 kDa) was purchased from MP Biomedicals. AOM was purchased from Sigma-Aldrich. Eight-week-old female Balb/c and C57BL/6 mice (Rionbio, Korea) received a single i.p. injection of AOM (10 mg/kg) and 7 days later provided DSS containing water (1%, 2% w/v) 5 days for either 6 (1 round of DSS cycle) or 12 (3 rounds of DSS cycle) weeks. Bacterial strains. WT-ETBF strains used are as follows: B. fragilis VPI 13784 (bft-1), B. fragilis O86-5443-2-2 (bft-2) and B. fragilis Korea 570 (bft-3). The, nontoxigenic wild-type B. fragilis (WT-NTBF) strain, B. fragilis NCTC 9343, does not express BFT. WT-NTBF recombinant strains overexpressing active BFT (rETBF; bft-2) and WT-NTBF overexpressing a biologically inactive mutated BFT (rNTBF; bft-2 H352Y) were reported previously. Both of rETBF and rNTBF strains have a clindamycin-resistant gene on a plasmid. Mouse infection. Mice were given water containing clindamycin (100 mg / liter) and gentamicin (300 mg / liter) to promote colonization of B. fragilis. Antibiotic-containing water was initiated 5 days prior to bacterial inoculation and continued for 10 days. Bacteria were grown in brain heart infusion broth and adjusted to 1 x 10⁹ CFU / 200 ul for mouse oral inoculations. Colonization of bacteria was monitored by serial dilution of stool and plating on brain heart infusion agar plates containing gentamicin (50 ug/ml) and clindamycin (6 ug/ml). Characteristic B. fragilis colonies were enumerated after anaerobic culture as shown as CFU/g stool. Tissue harvest and histology. After sacrificing ETBF-based AOM/DSS-treated mice, isolated large intestines of mice were separated into cecum and remaining colon by scissors. To obtain fine pictures of flat colon with tumors, colonic tissues were formalin-fixed (10%) for 1 hour. Gross of stiffened large intestines was pictured by Canon SX510 HS camera in a petri dish. After getting image of gross of isolated colon, the colonic tissues were formalin-fixed (10%) for additional histologic examination. Paraffin-embedded colon tissues were sectioned (5 um) and stained with hematoxylin and eosin (H&E) and Periodic acid–Schiff (PAS). Immunohistochemistry. All immunohistochemistry was performed on formalin-fixed, paraffin-embedded samples. Paraffin blocks were sectioned at 4 um thickness. After getting sectioning, poly-L-lysine-coated slides were used to promote adhering of paraffin-section to the slides which were then dried. Images of IHC slides were pictured by optical microscopy (Leica) and rendered using Adobe Photoshop. Quantitative RT-PCR. Frozen colonic tissues were thawed, followed by homogenized using autoclaved plastic homogenizer for 10 min. Total RNA was isolated from large intestine using TRIzol reagent (Life Technologies, CLD, CA) according to the manufacturer’s instructions. RNA was converted to cDNA using the M-MLV Reverse
- 74 -
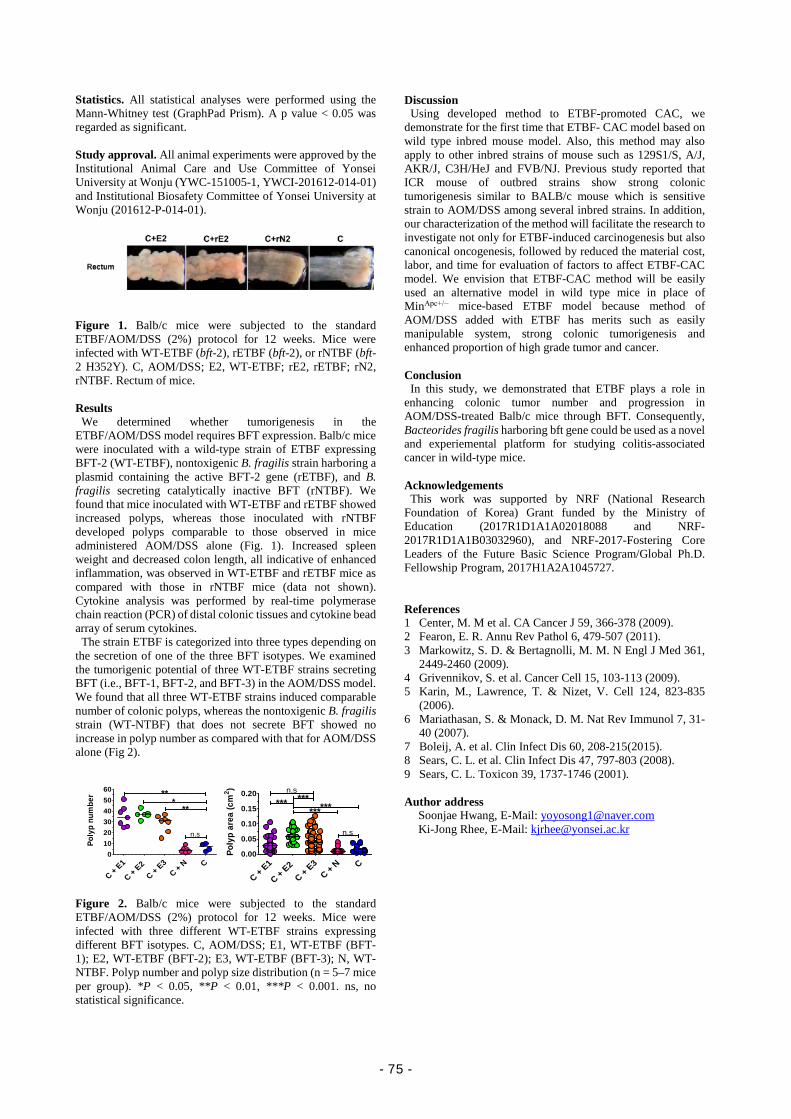
Statistics. All statistical analyses were performed using the Mann-Whitney test (GraphPad Prism). A p value < 0.05 was regarded as significant. Study approval. All animal experiments were approved by the Institutional Animal Care and Use Committee of Yonsei University at Wonju (YWC-151005-1, YWCI-201612-014-01) and Institutional Biosafety Committee of Yonsei University at Wonju (201612-P-014-01).
Figure 1. Balb/c mice were subjected to the standard ETBF/AOM/DSS (2%) protocol for 12 weeks. Mice were infected with WT-ETBF (bft-2), rETBF (bft-2), or rNTBF (bft-2 H352Y). C, AOM/DSS; E2, WT-ETBF; rE2, rETBF; rN2, rNTBF. Rectum of mice. Results
We determined whether tumorigenesis in the ETBF/AOM/DSS model requires BFT expression. Balb/c mice were inoculated with a wild-type strain of ETBF expressing BFT-2 (WT-ETBF), nontoxigenic B. fragilis strain harboring a plasmid containing the active BFT-2 gene (rETBF), and B. fragilis secreting catalytically inactive BFT (rNTBF). We found that mice inoculated with WT-ETBF and rETBF showed increased polyps, whereas those inoculated with rNTBF developed polyps comparable to those observed in mice administered AOM/DSS alone (Fig. 1). Increased spleen weight and decreased colon length, all indicative of enhanced inflammation, was observed in WT-ETBF and rETBF mice as compared with those in rNTBF mice (data not shown). Cytokine analysis was performed by real-time polymerase chain reaction (PCR) of distal colonic tissues and cytokine bead array of serum cytokines.
The strain ETBF is categorized into three types depending on the secretion of one of the three BFT isotypes. We examined the tumorigenic potential of three WT-ETBF strains secreting BFT (i.e., BFT-1, BFT-2, and BFT-3) in the AOM/DSS model. We found that all three WT-ETBF strains induced comparable number of colonic polyps, whereas the nontoxigenic B. fragilis strain (WT-NTBF) that does not secrete BFT showed no increase in polyp number as compared with that for AOM/DSS alone (Fig 2). Figure 2. Balb/c mice were subjected to the standard ETBF/AOM/DSS (2%) protocol for 12 weeks. Mice were infected with three different WT-ETBF strains expressing different BFT isotypes. C, AOM/DSS; E1, WT-ETBF (BFT-1); E2, WT-ETBF (BFT-2); E3, WT-ETBF (BFT-3); N, WT-NTBF. Polyp number and polyp size distribution (n = 5–7 mice per group). *P < 0.05, **P < 0.01, ***P < 0.001. ns, no statistical significance.
Discussion Using developed method to ETBF-promoted CAC, we
demonstrate for the first time that ETBF- CAC model based on wild type inbred mouse model. Also, this method may also apply to other inbred strains of mouse such as 129S1/S, A/J, AKR/J, C3H/HeJ and FVB/NJ. Previous study reported that ICR mouse of outbred strains show strong colonic tumorigenesis similar to BALB/c mouse which is sensitive strain to AOM/DSS among several inbred strains. In addition, our characterization of the method will facilitate the research to investigate not only for ETBF-induced carcinogenesis but also canonical oncogenesis, followed by reduced the material cost, labor, and time for evaluation of factors to affect ETBF-CAC model. We envision that ETBF-CAC method will be easily used an alternative model in wild type mice in place of MinApc+/− mice-based ETBF model because method of AOM/DSS added with ETBF has merits such as easily manipulable system, strong colonic tumorigenesis and enhanced proportion of high grade tumor and cancer. Conclusion
In this study, we demonstrated that ETBF plays a role in enhancing colonic tumor number and progression in AOM/DSS-treated Balb/c mice through BFT. Consequently, Bacteorides fragilis harboring bft gene could be used as a novel and experiemental platform for studying colitis-associated cancer in wild-type mice. Acknowledgements
This work was supported by NRF (National Research Foundation of Korea) Grant funded by the Ministry of Education (2017R1D1A1A02018088 and NRF-2017R1D1A1B03032960), and NRF-2017-Fostering Core Leaders of the Future Basic Science Program/Global Ph.D. Fellowship Program, 2017H1A2A1045727.
References 1 Center, M. M et al. CA Cancer J 59, 366-378 (2009). 2 Fearon, E. R. Annu Rev Pathol 6, 479-507 (2011). 3 Markowitz, S. D. & Bertagnolli, M. M. N Engl J Med 361,
2449-2460 (2009). 4 Grivennikov, S. et al. Cancer Cell 15, 103-113 (2009). 5 Karin, M., Lawrence, T. & Nizet, V. Cell 124, 823-835
(2006). 6 Mariathasan, S. & Monack, D. M. Nat Rev Immunol 7, 31-
40 (2007). 7 Boleij, A. et al. Clin Infect Dis 60, 208-215(2015). 8 Sears, C. L. et al. Clin Infect Dis 47, 797-803 (2008). 9 Sears, C. L. Toxicon 39, 1737-1746 (2001). Author address
Soonjae Hwang, E-Mail: [email protected] Ki-Jong Rhee, E-Mail: [email protected]
C +
E1
C +
E2
C +
E3
C +
N C
0
10
20
30
40
50
60**
***
n.s
Po
lyp
nu
mb
er
C +
E1
C +
E2
C +
E3
C +
N C
0.00
0.05
0.10
0.15
0.20
******
n.s
******
n.s
Po
lyp
are
a (
cm
2)
- 75 -
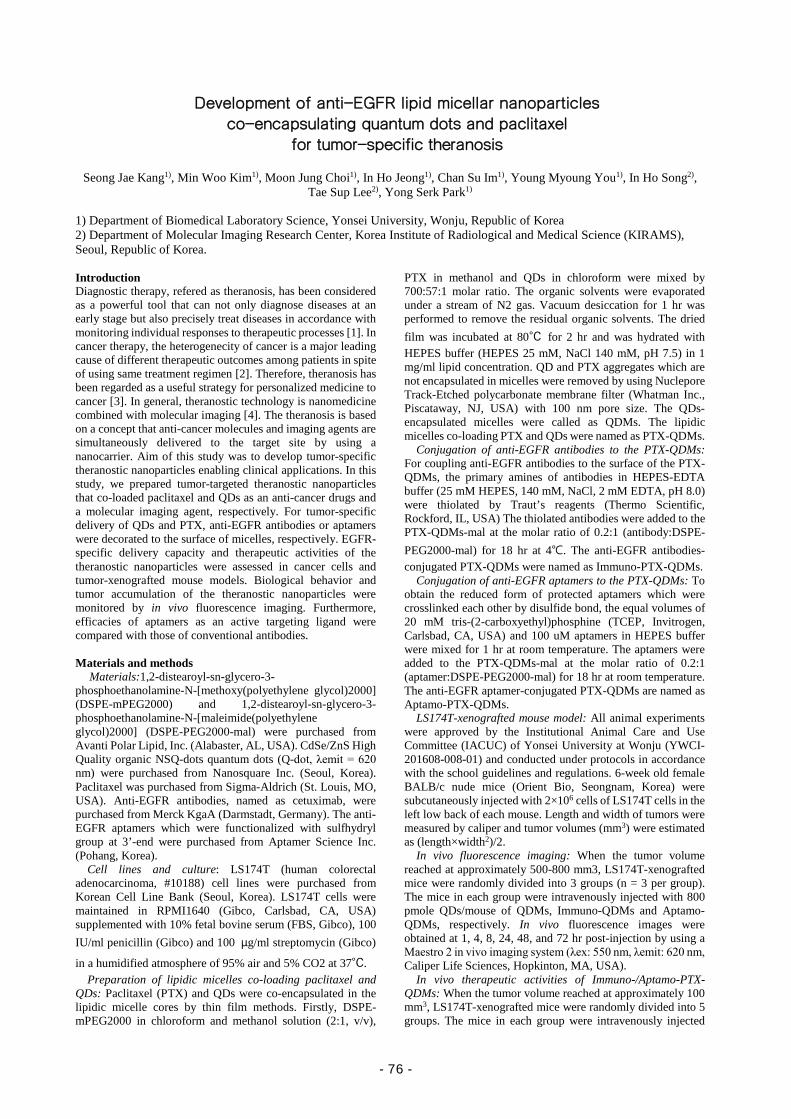
Development of anti-EGFR lipid micellar nanoparticles co-encapsulating quantum dots and paclitaxel
for tumor-specific theranosis
Seong Jae Kang1), Min Woo Kim1), Moon Jung Choi1), In Ho Jeong1), Chan Su Im1), Young Myoung You1), In Ho Song2), Tae Sup Lee2), Yong Serk Park1)
1) Department of Biomedical Laboratory Science, Yonsei University, Wonju, Republic of Korea 2) Department of Molecular Imaging Research Center, Korea Institute of Radiological and Medical Science (KIRAMS), Seoul, Republic of Korea. Introduction Diagnostic therapy, refered as theranosis, has been considered as a powerful tool that can not only diagnose diseases at an early stage but also precisely treat diseases in accordance with monitoring individual responses to therapeutic processes [1]. In cancer therapy, the heterogenecity of cancer is a major leading cause of different therapeutic outcomes among patients in spite of using same treatment regimen [2]. Therefore, theranosis has been regarded as a useful strategy for personalized medicine to cancer [3]. In general, theranostic technology is nanomedicine combined with molecular imaging [4]. The theranosis is based on a concept that anti-cancer molecules and imaging agents are simultaneously delivered to the target site by using a nanocarrier. Aim of this study was to develop tumor-specific theranostic nanoparticles enabling clinical applications. In this study, we prepared tumor-targeted theranostic nanoparticles that co-loaded paclitaxel and QDs as an anti-cancer drugs and a molecular imaging agent, respectively. For tumor-specific delivery of QDs and PTX, anti-EGFR antibodies or aptamers were decorated to the surface of micelles, respectively. EGFR-specific delivery capacity and therapeutic activities of the theranostic nanoparticles were assessed in cancer cells and tumor-xenografted mouse models. Biological behavior and tumor accumulation of the theranostic nanoparticles were monitored by in vivo fluorescence imaging. Furthermore, efficacies of aptamers as an active targeting ligand were compared with those of conventional antibodies. Materials and methods
Materials:1,2-distearoyl-sn-glycero-3-phosphoethanolamine-N-[methoxy(polyethylene glycol)2000] (DSPE-mPEG2000) and 1,2-distearoyl-sn-glycero-3-phosphoethanolamine-N-[maleimide(polyethylene glycol)2000] (DSPE-PEG2000-mal) were purchased from Avanti Polar Lipid, Inc. (Alabaster, AL, USA). CdSe/ZnS High Quality organic NSQ-dots quantum dots (Q-dot, λemit = 620 nm) were purchased from Nanosquare Inc. (Seoul, Korea). Paclitaxel was purchased from Sigma-Aldrich (St. Louis, MO, USA). Anti-EGFR antibodies, named as cetuximab, were purchased from Merck KgaA (Darmstadt, Germany). The anti-EGFR aptamers which were functionalized with sulfhydryl group at 3’-end were purchased from Aptamer Science Inc. (Pohang, Korea).
Cell lines and culture: LS174T (human colorectal adenocarcinoma, #10188) cell lines were purchased from Korean Cell Line Bank (Seoul, Korea). LS174T cells were maintained in RPMI1640 (Gibco, Carlsbad, CA, USA) supplemented with 10% fetal bovine serum (FBS, Gibco), 100 IU/ml penicillin (Gibco) and 100 μg/ml streptomycin (Gibco)
in a humidified atmosphere of 95% air and 5% CO2 at 37℃. Preparation of lipidic micelles co-loading paclitaxel and
QDs: Paclitaxel (PTX) and QDs were co-encapsulated in the lipidic micelle cores by thin film methods. Firstly, DSPE-mPEG2000 in chloroform and methanol solution (2:1, v/v),
PTX in methanol and QDs in chloroform were mixed by 700:57:1 molar ratio. The organic solvents were evaporated under a stream of N2 gas. Vacuum desiccation for 1 hr was performed to remove the residual organic solvents. The dried film was incubated at 80℃ for 2 hr and was hydrated with HEPES buffer (HEPES 25 mM, NaCl 140 mM, pH 7.5) in 1 mg/ml lipid concentration. QD and PTX aggregates which are not encapsulated in micelles were removed by using Nuclepore Track-Etched polycarbonate membrane filter (Whatman Inc., Piscataway, NJ, USA) with 100 nm pore size. The QDs-encapsulated micelles were called as QDMs. The lipidic micelles co-loading PTX and QDs were named as PTX-QDMs.
Conjugation of anti-EGFR antibodies to the PTX-QDMs: For coupling anti-EGFR antibodies to the surface of the PTX-QDMs, the primary amines of antibodies in HEPES-EDTA buffer (25 mM HEPES, 140 mM, NaCl, 2 mM EDTA, pH 8.0) were thiolated by Traut’s reagents (Thermo Scientific, Rockford, IL, USA) The thiolated antibodies were added to the PTX-QDMs-mal at the molar ratio of 0.2:1 (antibody:DSPE-PEG2000-mal) for 18 hr at 4℃. The anti-EGFR antibodies-conjugated PTX-QDMs were named as Immuno-PTX-QDMs.
Conjugation of anti-EGFR aptamers to the PTX-QDMs: To obtain the reduced form of protected aptamers which were crosslinked each other by disulfide bond, the equal volumes of 20 mM tris-(2-carboxyethyl)phosphine (TCEP, Invitrogen, Carlsbad, CA, USA) and 100 uM aptamers in HEPES buffer were mixed for 1 hr at room temperature. The aptamers were added to the PTX-QDMs-mal at the molar ratio of 0.2:1 (aptamer:DSPE-PEG2000-mal) for 18 hr at room temperature. The anti-EGFR aptamer-conjugated PTX-QDMs are named as Aptamo-PTX-QDMs.
LS174T-xenografted mouse model: All animal experiments were approved by the Institutional Animal Care and Use Committee (IACUC) of Yonsei University at Wonju (YWCI-201608-008-01) and conducted under protocols in accordance with the school guidelines and regulations. 6-week old female BALB/c nude mice (Orient Bio, Seongnam, Korea) were subcutaneously injected with 2×10⁶ cells of LS174T cells in the left low back of each mouse. Length and width of tumors were measured by caliper and tumor volumes (mm3) were estimated as (length×width2)/2.
In vivo fluorescence imaging: When the tumor volume reached at approximately 500-800 mm3, LS174T-xenografted mice were randomly divided into 3 groups (n = 3 per group). The mice in each group were intravenously injected with 800 pmole QDs/mouse of QDMs, Immuno-QDMs and Aptamo-QDMs, respectively. In vivo fluorescence images were obtained at 1, 4, 8, 24, 48, and 72 hr post-injection by using a Maestro 2 in vivo imaging system (λex: 550 nm, λemit: 620 nm, Caliper Life Sciences, Hopkinton, MA, USA).
In vivo therapeutic activities of Immuno-/Aptamo-PTX-QDMs: When the tumor volume reached at approximately 100 mm3, LS174T-xenografted mice were randomly divided into 5 groups. The mice in each group were intravenously injected
- 76 -
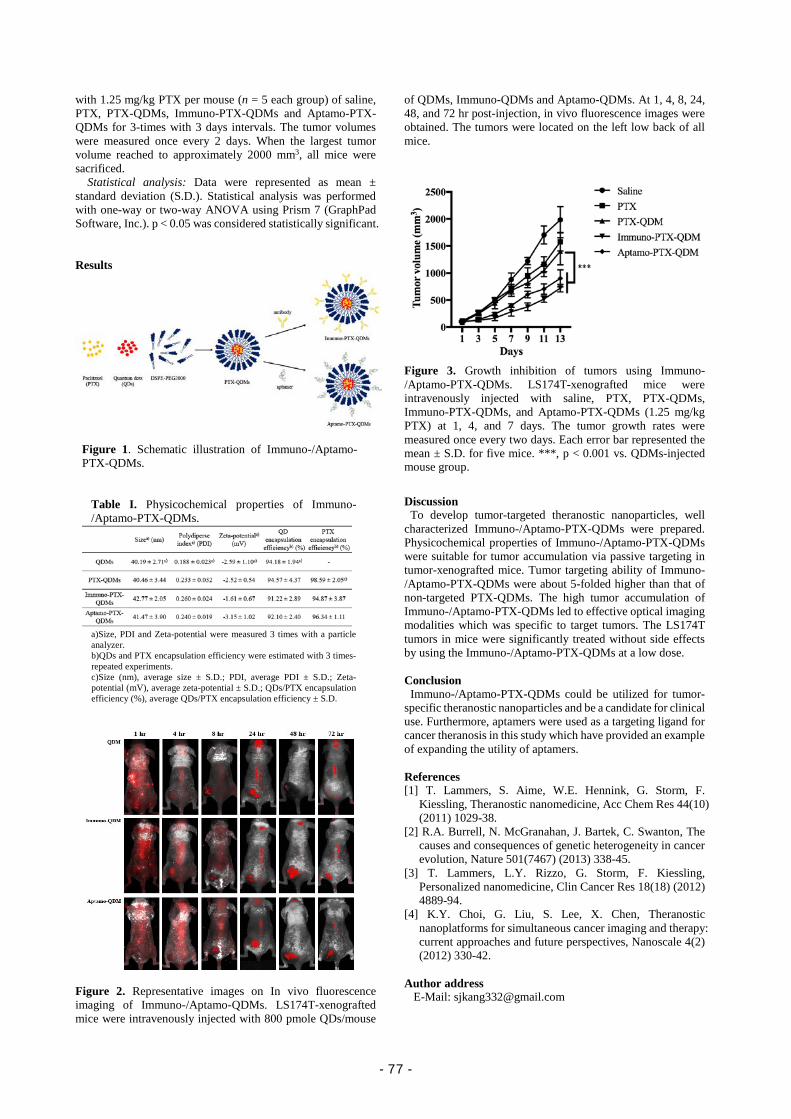
with 1.25 mg/kg PTX per mouse (n = 5 each group) of saline, PTX, PTX-QDMs, Immuno-PTX-QDMs and Aptamo-PTX-QDMs for 3-times with 3 days intervals. The tumor volumes were measured once every 2 days. When the largest tumor volume reached to approximately 2000 mm3, all mice were sacrificed.
Statistical analysis: Data were represented as mean ± standard deviation (S.D.). Statistical analysis was performed with one-way or two-way ANOVA using Prism 7 (GraphPad Software, Inc.). p < 0.05 was considered statistically significant. Results
Figure 2. Representative images on In vivo fluorescence imaging of Immuno-/Aptamo-QDMs. LS174T-xenografted mice were intravenously injected with 800 pmole QDs/mouse
of QDMs, Immuno-QDMs and Aptamo-QDMs. At 1, 4, 8, 24, 48, and 72 hr post-injection, in vivo fluorescence images were obtained. The tumors were located on the left low back of all mice.
Figure 3. Growth inhibition of tumors using Immuno-/Aptamo-PTX-QDMs. LS174T-xenografted mice were intravenously injected with saline, PTX, PTX-QDMs, Immuno-PTX-QDMs, and Aptamo-PTX-QDMs (1.25 mg/kg PTX) at 1, 4, and 7 days. The tumor growth rates were measured once every two days. Each error bar represented the mean ± S.D. for five mice. ***, p < 0.001 vs. QDMs-injected mouse group.
Discussion
To develop tumor-targeted theranostic nanoparticles, well characterized Immuno-/Aptamo-PTX-QDMs were prepared. Physicochemical properties of Immuno-/Aptamo-PTX-QDMs were suitable for tumor accumulation via passive targeting in tumor-xenografted mice. Tumor targeting ability of Immuno-/Aptamo-PTX-QDMs were about 5-folded higher than that of non-targeted PTX-QDMs. The high tumor accumulation of Immuno-/Aptamo-PTX-QDMs led to effective optical imaging modalities which was specific to target tumors. The LS174T tumors in mice were significantly treated without side effects by using the Immuno-/Aptamo-PTX-QDMs at a low dose. Conclusion Immuno-/Aptamo-PTX-QDMs could be utilized for tumor-specific theranostic nanoparticles and be a candidate for clinical use. Furthermore, aptamers were used as a targeting ligand for cancer theranosis in this study which have provided an example of expanding the utility of aptamers. References [1] T. Lammers, S. Aime, W.E. Hennink, G. Storm, F.
Kiessling, Theranostic nanomedicine, Acc Chem Res 44(10) (2011) 1029-38.
[2] R.A. Burrell, N. McGranahan, J. Bartek, C. Swanton, The causes and consequences of genetic heterogeneity in cancer evolution, Nature 501(7467) (2013) 338-45.
[3] T. Lammers, L.Y. Rizzo, G. Storm, F. Kiessling, Personalized nanomedicine, Clin Cancer Res 18(18) (2012) 4889-94.
[4] K.Y. Choi, G. Liu, S. Lee, X. Chen, Theranostic nanoplatforms for simultaneous cancer imaging and therapy: current approaches and future perspectives, Nanoscale 4(2) (2012) 330-42.
Author address
E-Mail: [email protected]
Figure 1. Schematic illustration of Immuno-/Aptamo-PTX-QDMs.
Table I. Physicochemical properties of Immuno-/Aptamo-PTX-QDMs.
a)Size, PDI and Zeta-potential were measured 3 times with a particle analyzer. b)QDs and PTX encapsulation efficiency were estimated with 3 times-repeated experiments. c)Size (nm), average size ± S.D.; PDI, average PDI ± S.D.; Zeta-potential (mV), average zeta-potential ± S.D.; QDs/PTX encapsulation efficiency (%), average QDs/PTX encapsulation efficiency ± S.D.
- 77 -
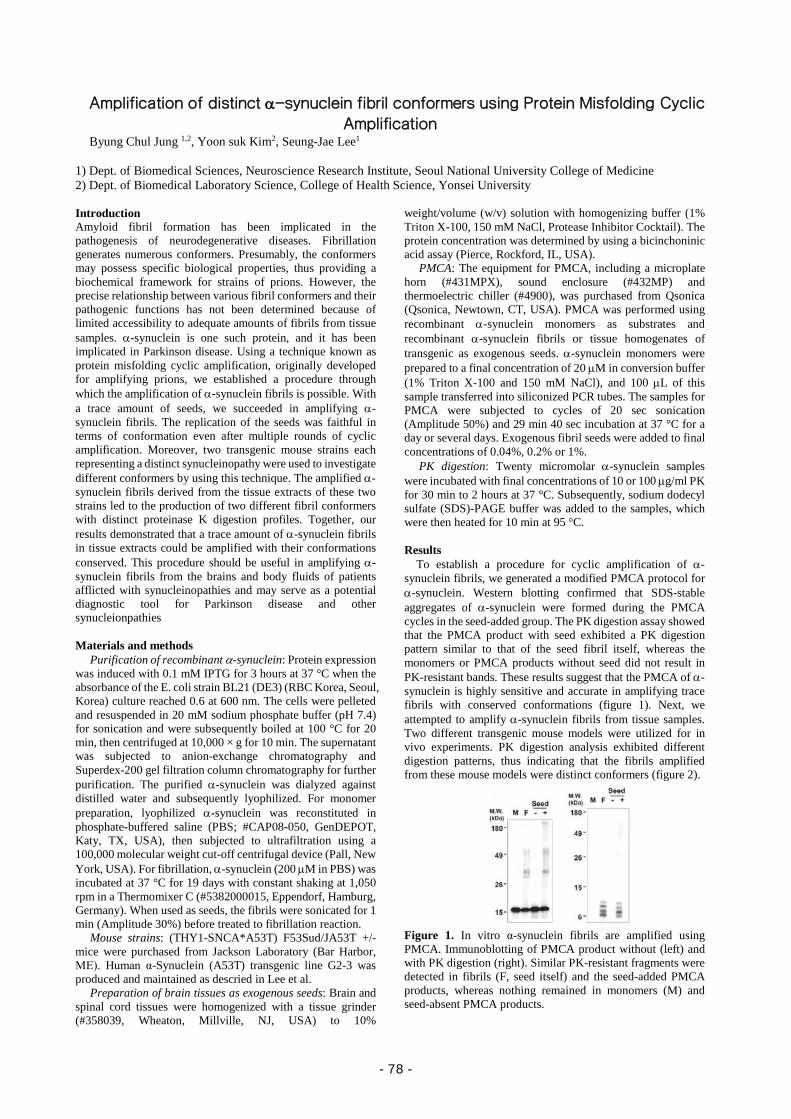
Amplification of distinct α-synuclein fibril conformers using Protein Misfolding Cyclic Amplification
Byung Chul Jung 1,2, Yoon suk Kim2, Seung-Jae Lee1
1) Dept. of Biomedical Sciences, Neuroscience Research Institute, Seoul National University College of Medicine 2) Dept. of Biomedical Laboratory Science, College of Health Science, Yonsei University Introduction Amyloid fibril formation has been implicated in the pathogenesis of neurodegenerative diseases. Fibrillation generates numerous conformers. Presumably, the conformers may possess specific biological properties, thus providing a biochemical framework for strains of prions. However, the precise relationship between various fibril conformers and their pathogenic functions has not been determined because of limited accessibility to adequate amounts of fibrils from tissue samples. α-synuclein is one such protein, and it has been implicated in Parkinson disease. Using a technique known as protein misfolding cyclic amplification, originally developed for amplifying prions, we established a procedure through which the amplification of α-synuclein fibrils is possible. With a trace amount of seeds, we succeeded in amplifying α-synuclein fibrils. The replication of the seeds was faithful in terms of conformation even after multiple rounds of cyclic amplification. Moreover, two transgenic mouse strains each representing a distinct synucleinopathy were used to investigate different conformers by using this technique. The amplified α-synuclein fibrils derived from the tissue extracts of these two strains led to the production of two different fibril conformers with distinct proteinase K digestion profiles. Together, our results demonstrated that a trace amount of α-synuclein fibrils in tissue extracts could be amplified with their conformations conserved. This procedure should be useful in amplifying α-synuclein fibrils from the brains and body fluids of patients afflicted with synucleinopathies and may serve as a potential diagnostic tool for Parkinson disease and other synucleionpathies Materials and methods Purification of recombinant α-synuclein: Protein expression was induced with 0.1 mM IPTG for 3 hours at 37 °C when the absorbance of the E. coli strain BL21 (DE3) (RBC Korea, Seoul, Korea) culture reached 0.6 at 600 nm. The cells were pelleted and resuspended in 20 mM sodium phosphate buffer (pH 7.4) for sonication and were subsequently boiled at 100 °C for 20 min, then centrifuged at 10,000 × g for 10 min. The supernatant was subjected to anion-exchange chromatography and Superdex-200 gel filtration column chromatography for further purification. The purified α-synuclein was dialyzed against distilled water and subsequently lyophilized. For monomer preparation, lyophilized α-synuclein was reconstituted in phosphate-buffered saline (PBS; #CAP08-050, GenDEPOT, Katy, TX, USA), then subjected to ultrafiltration using a 100,000 molecular weight cut-off centrifugal device (Pall, New York, USA). For fibrillation, α-synuclein (200 µM in PBS) was incubated at 37 °C for 19 days with constant shaking at 1,050 rpm in a Thermomixer C (#5382000015, Eppendorf, Hamburg, Germany). When used as seeds, the fibrils were sonicated for 1 min (Amplitude 30%) before treated to fibrillation reaction. Mouse strains: (THY1-SNCA*A53T) F53Sud/JA53T +/- mice were purchased from Jackson Laboratory (Bar Harbor, ME). Human α-Synuclein (A53T) transgenic line G2-3 was produced and maintained as descried in Lee et al. Preparation of brain tissues as exogenous seeds: Brain and spinal cord tissues were homogenized with a tissue grinder (#358039, Wheaton, Millville, NJ, USA) to 10%
weight/volume (w/v) solution with homogenizing buffer (1% Triton X-100, 150 mM NaCl, Protease Inhibitor Cocktail). The protein concentration was determined by using a bicinchoninic acid assay (Pierce, Rockford, IL, USA). PMCA: The equipment for PMCA, including a microplate horn (#431MPX), sound enclosure (#432MP) and thermoelectric chiller (#4900), was purchased from Qsonica (Qsonica, Newtown, CT, USA). PMCA was performed using recombinant α-synuclein monomers as substrates and recombinant α-synuclein fibrils or tissue homogenates of transgenic as exogenous seeds. α-synuclein monomers were prepared to a final concentration of 20 µM in conversion buffer (1% Triton X-100 and 150 mM NaCl), and 100 µL of this sample transferred into siliconized PCR tubes. The samples for PMCA were subjected to cycles of 20 sec sonication (Amplitude 50%) and 29 min 40 sec incubation at 37 °C for a day or several days. Exogenous fibril seeds were added to final concentrations of 0.04%, 0.2% or 1%. PK digestion: Twenty micromolar α-synuclein samples were incubated with final concentrations of 10 or 100 µg/ml PK for 30 min to 2 hours at 37 °C. Subsequently, sodium dodecyl sulfate (SDS)-PAGE buffer was added to the samples, which were then heated for 10 min at 95 °C. Results
To establish a procedure for cyclic amplification of α-synuclein fibrils, we generated a modified PMCA protocol for α-synuclein. Western blotting confirmed that SDS-stable aggregates of α-synuclein were formed during the PMCA cycles in the seed-added group. The PK digestion assay showed that the PMCA product with seed exhibited a PK digestion pattern similar to that of the seed fibril itself, whereas the monomers or PMCA products without seed did not result in PK-resistant bands. These results suggest that the PMCA of α-synuclein is highly sensitive and accurate in amplifying trace fibrils with conserved conformations (figure 1). Next, we attempted to amplify α-synuclein fibrils from tissue samples. Two different transgenic mouse models were utilized for in vivo experiments. PK digestion analysis exhibited different digestion patterns, thus indicating that the fibrils amplified from these mouse models were distinct conformers (figure 2).
Figure 1. In vitro α-synuclein fibrils are amplified using PMCA. Immunoblotting of PMCA product without (left) and with PK digestion (right). Similar PK-resistant fragments were detected in fibrils (F, seed itself) and the seed-added PMCA products, whereas nothing remained in monomers (M) and seed-absent PMCA products.
- 78 -
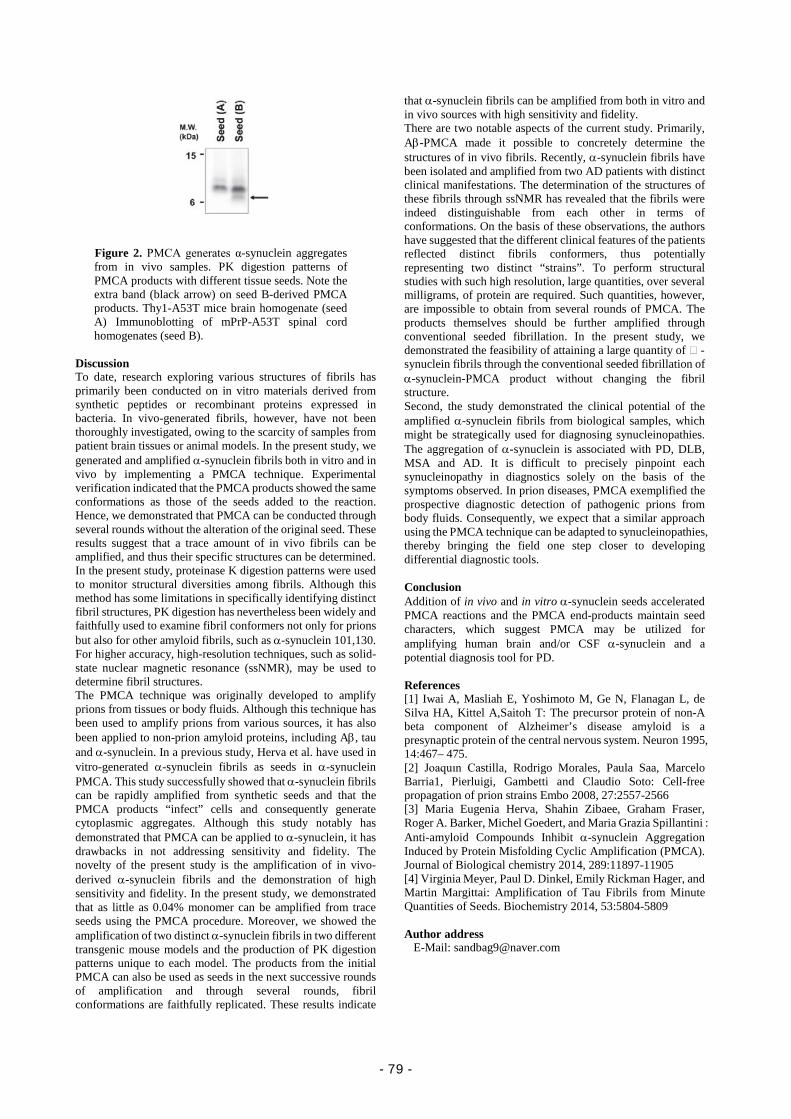
Figure 2. PMCA generates α-synuclein aggregates from in vivo samples. PK digestion patterns of PMCA products with different tissue seeds. Note the extra band (black arrow) on seed B-derived PMCA products. Thy1-A53T mice brain homogenate (seed A) Immunoblotting of mPrP-A53T spinal cord homogenates (seed B).
Discussion To date, research exploring various structures of fibrils has primarily been conducted on in vitro materials derived from synthetic peptides or recombinant proteins expressed in bacteria. In vivo-generated fibrils, however, have not been thoroughly investigated, owing to the scarcity of samples from patient brain tissues or animal models. In the present study, we generated and amplified α-synuclein fibrils both in vitro and in vivo by implementing a PMCA technique. Experimental verification indicated that the PMCA products showed the same conformations as those of the seeds added to the reaction. Hence, we demonstrated that PMCA can be conducted through several rounds without the alteration of the original seed. These results suggest that a trace amount of in vivo fibrils can be amplified, and thus their specific structures can be determined. In the present study, proteinase K digestion patterns were used to monitor structural diversities among fibrils. Although this method has some limitations in specifically identifying distinct fibril structures, PK digestion has nevertheless been widely and faithfully used to examine fibril conformers not only for prions but also for other amyloid fibrils, such as α-synuclein 101,130. For higher accuracy, high-resolution techniques, such as solid-state nuclear magnetic resonance (ssNMR), may be used to determine fibril structures. The PMCA technique was originally developed to amplify prions from tissues or body fluids. Although this technique has been used to amplify prions from various sources, it has also been applied to non-prion amyloid proteins, including Aβ, tau and α-synuclein. In a previous study, Herva et al. have used in vitro-generated α-synuclein fibrils as seeds in α-synuclein PMCA. This study successfully showed that α-synuclein fibrils can be rapidly amplified from synthetic seeds and that the PMCA products “infect” cells and consequently generate cytoplasmic aggregates. Although this study notably has demonstrated that PMCA can be applied to α-synuclein, it has drawbacks in not addressing sensitivity and fidelity. The novelty of the present study is the amplification of in vivo-derived α-synuclein fibrils and the demonstration of high sensitivity and fidelity. In the present study, we demonstrated that as little as 0.04% monomer can be amplified from trace seeds using the PMCA procedure. Moreover, we showed the amplification of two distinct α-synuclein fibrils in two different transgenic mouse models and the production of PK digestion patterns unique to each model. The products from the initial PMCA can also be used as seeds in the next successive rounds of amplification and through several rounds, fibril conformations are faithfully replicated. These results indicate
that α-synuclein fibrils can be amplified from both in vitro and in vivo sources with high sensitivity and fidelity. There are two notable aspects of the current study. Primarily, Aβ-PMCA made it possible to concretely determine the structures of in vivo fibrils. Recently, α-synuclein fibrils have been isolated and amplified from two AD patients with distinct clinical manifestations. The determination of the structures of these fibrils through ssNMR has revealed that the fibrils were indeed distinguishable from each other in terms of conformations. On the basis of these observations, the authors have suggested that the different clinical features of the patients reflected distinct fibrils conformers, thus potentially representing two distinct “strains”. To perform structural studies with such high resolution, large quantities, over several milligrams, of protein are required. Such quantities, however, are impossible to obtain from several rounds of PMCA. The products themselves should be further amplified through conventional seeded fibrillation. In the present study, we demonstrated the feasibility of attaining a large quantity of -synuclein fibrils through the conventional seeded fibrillation of α-synuclein-PMCA product without changing the fibril structure. Second, the study demonstrated the clinical potential of the amplified α-synuclein fibrils from biological samples, which might be strategically used for diagnosing synucleinopathies. The aggregation of α-synuclein is associated with PD, DLB, MSA and AD. It is difficult to precisely pinpoint each synucleinopathy in diagnostics solely on the basis of the symptoms observed. In prion diseases, PMCA exemplified the prospective diagnostic detection of pathogenic prions from body fluids. Consequently, we expect that a similar approach using the PMCA technique can be adapted to synucleinopathies, thereby bringing the field one step closer to developing differential diagnostic tools. Conclusion Addition of in vivo and in vitro α-synuclein seeds accelerated PMCA reactions and the PMCA end-products maintain seed characters, which suggest PMCA may be utilized for amplifying human brain and/or CSF α-synuclein and a potential diagnosis tool for PD. References [1] Iwai A, Masliah E, Yoshimoto M, Ge N, Flanagan L, de Silva HA, Kittel A,Saitoh T: The precursor protein of non-A beta component of Alzheimer’s disease amyloid is a presynaptic protein of the central nervous system. Neuron 1995, 14:467– 475. [2] Joaquın Castilla, Rodrigo Morales, Paula Saa, Marcelo Barria1, Pierluigi, Gambetti and Claudio Soto: Cell-free propagation of prion strains Embo 2008, 27:2557-2566 [3] Maria Eugenia Herva, Shahin Zibaee, Graham Fraser, Roger A. Barker, Michel Goedert, and Maria Grazia Spillantini : Anti-amyloid Compounds Inhibit α-synuclein Aggregation Induced by Protein Misfolding Cyclic Amplification (PMCA). Journal of Biological chemistry 2014, 289:11897-11905 [4] Virginia Meyer, Paul D. Dinkel, Emily Rickman Hager, and Martin Margittai: Amplification of Tau Fibrils from Minute Quantities of Seeds. Biochemistry 2014, 53:5804-5809 Author address
E-Mail: [email protected]
- 79 -

- 80 -

Abstract
Nursing
- 81 -

- 82 -

2017 Yonsei-Nagoya University
Joint Symposium on Department of Nursing
Date: 2017.11.02(Thursday) Jinri Hall #421
Moderator: Prof. Jihea CHOI
Session I (14:00~15:45)
14:00~14:15 Welcome Remark
Introduction of YUWCM Dept. of Nursing Prof. Ki Kyong KIM
14:15~14:30 Introduction of Nagoya University Prof. Yuki TAKAHASHI
14:30~14:45 Introduction of Nagoya University Hospital Megumi YOKOYAMA
14:45~15:00
Caregiver Burden In Accordance With Behavioral And
Psychological Symptoms Of Dementia(BPSD) In Alzheimer
Dementia Patients
Bo-kyoung KIM
15:00~15:15
The Association Of Japanese Mothers’ Perineal And
Physical Pain After Vaginal Birth With Parental Behavior In
Early Postpartum: A Literature Review
Akiko YAMADA
15:15~15:30
The Effects Of Communication Competency And Job
Embeddedness On Nursing Performance In Small And
Medium-Sized Hospital: Literature Review
In-sun CHEON
15:30~15:45 Coffee Break
Session II (15:45~17:00)
15:45~16:00 Association Of Early Skin-To-Skin Contact With Mother-
Infant Attachment For The First Month Prof. Yuki TAKAHASHI
16:00~16:15 Premenstrual Syndrome in Female Workers: A Literature
Review Ah-reum JEONG
16:15~16:30 Health-Related QOL In Japanese Patients With GERD And
The Role Of Nursing Aoi KONO
16:30~16:45 Literature Review On Self-Care Behavior Of Japanese
Pregnant Women Miki KAMIYA
16:45~17:00 Discussion Prof. Hee Young SONG
17:00~ Closing Remark & Group Photos Prof. Ki Kyong KIM
- 83 -
Caregiver Burden in Accordance with
Behavioral and Psychological Symptoms of Dementia(BPSD)
in Alzheimer Dementia Patients
BK. Kim
Department of Nursing, Wonju College of Medicine, Yonsei University, Wonju, Korea
Introduction
Along with increasing of the number of dementia
patients [1, 2] caregiver burden due to behavioral and
psychological symptoms of dementia (BPSD) in Alzheimer
dementia (AD) patients also considered as serious problems
[3, 4, 5].
The purpose of this study was to examine the BPSD in
AD as well as to verify the factors related with caregiver
burden.
Methods
Study Design: The path analysis study based on
situation relating theory was conducted.
Participants: Total 170 study participants, who visited
neurology in tertiary hospital located in Seoul area, were
recruited for this study.
Data Collection: The data were collected from January
2011 to February 2016 through the survey for the caregivers
and the electronic medical record of the patients.
Measurements: The measurement tool included Korean
Neuropsychiatric inventory (NPI), Korean version of Mini-
mental status examination (MMSE), Short form of Geriatric
Depression scale (GDpS), Clinical Dementia Rating (CDR),
Korean version of Bathel Activities of Daily Living Index
(ADL), and Seoul-Instrumental Activities of Daily Living
(IADL).
Data Analysis: For the data analysis, SPSS Win 22.0
and AMOS 22.0 were used.
Results 1) Patients’ BPSD score was 17.68±20.67 and the score
of caregivers’ burden was 9.65±11.12. The level of
caregivers’ burden was significantly different according to
family relationship, CDR, ADL, and IADL.
2) Based on the results by the factor analysis of BPSD,
the identified factors were Hyperactivity (Disinhibition,
Irritability/Lability, Agitation/ Aggression), Psychosis
(Hallucination, Anxiety, Elation/ Euphoria, Delusion,
Depression/Dysphoria), Physical behavior (Appetite and
eating disorders, Apathy/Indifference, Aberrant motor
behavior, Sleep and nighttime behavior disorders).
3) In terms of the level of patients’ symptoms by the
characteristics of caregivers and patients, patients’ education
level, drinking, CDR, GDpS, ADL, IADL were significant in
hyperactivity symptom cluster; CDR, IADL were significant
in psychosis symptom cluster; and family relationship,
patients’ age, MMSE, CDR, ADL, IADL were significant in
physical behavior symptom cluster.
4) Among the factors which affected caregiver burden,
CDR, IADL, hyperactivity, psychosis, physical behavior
showed positive relationship, and MMSE and ADL showed
negative rela- tionship.
5) Based on goodness of fit in modified model,
χ2=8.73(p=.189), χ2 /df(1.456), GFI(.985), AGFI(.932),
CFI(.996), NFI(.987), IFI(.996), SRMR(.034), RMSEA(.052)
was selected for final model.
6) Among the 22 paths in the model, 12 paths were
supported. Among the hyperactivity symptom, ADL and IADL
showed direct effect and total effect, and among the psychosis
symptom, CDR and IADL showed direct effect and total effect.
Finally, among the physical behavior symptom, CDR and ADL
showed direct effect and total effect. Among the caregiver
burden, hyperactivity symptom, psychotic symptom and
physical behavior symptom showed direct effect and total effect.
Conclusions and Suggestions
To sum, the behavior patterns of Alzheimer dementia
were categorized into hyperactivity, psychosis and physical
behavior. In accordance with the model, CDR, ADL, IADL
affected caregivers’ burden through hyperactivity, psychosis
and physical behavior. Hyperactivity, psychosis, and physical
behavior symptom had complete mediating effect.
Thus, in order to alleviate burden in caregivers, intensive
nursing interventions focusing on CDR, ADL, IADL should be
developed and practically applied. Base on the findings of this
study, by delaying and preventing BPSD in AD patients,
caregivers’ burden would be alleviated.
References
[1] World Health Organization. Dementia. 2016. Retrieved
from http://www.who.int/mediacentre/factsheets/fs362/en/
[2] Dementia Center. Annual Report of Dementia Center 2015.
2016. Retrieved from
http://www.edementia.or.kr/resource/resourceView?currentPa
ge=&searchKey=&searchValue=&boardClass=01&bid=137&
articleNo=137&seq=1&step=0
[3] Cerejeira, J., Lagarto, L., & Mukaetova-Ladinska, E. B.
Behavioral and psychological symptoms of dementia. Front
Neurol. 2012;3(73): 1-21. doi:10.3389/fneur.2012.00073
[4] Huang, S.-S., Lee, M.-C., Liao, Y.-C., Wang, W.-F., & Lai,
T.-J. Caregiver burden associated with behavioral and
psychological symptoms of dementia (BPSD) in Taiwanese
elderly. Archives of Gerontology and Geriatrics. 2012;55(1):
55-59. doi:10.1016 /j.archger.2011.04.009
[5] Song, JA., Park, JW., Kim, HJ. Impact of Behavioral and
Psychological Symptoms of Dementia on Caregiver Burden in
Nursing Homes. Journal of Korean Gerontological Nursing.
2013;15(1): 62-74.
Author address
E-Mail: [email protected]
- 84 -
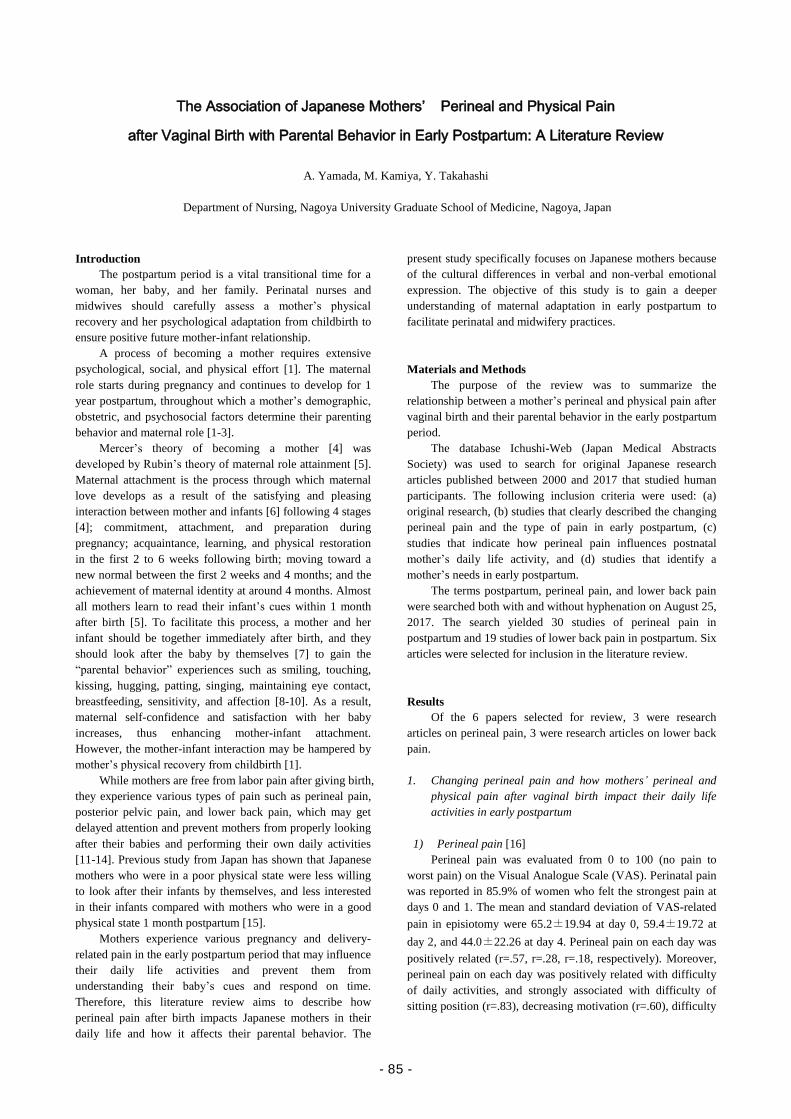
The Association of Japanese Mothers’ Perineal and Physical Pain
after Vaginal Birth with Parental Behavior in Early Postpartum: A Literature Review
A. Yamada, M. Kamiya, Y. Takahashi
Department of Nursing, Nagoya University Graduate School of Medicine, Nagoya, Japan
Introduction
The postpartum period is a vital transitional time for a
woman, her baby, and her family. Perinatal nurses and
midwives should carefully assess a mother’s physical
recovery and her psychological adaptation from childbirth to
ensure positive future mother-infant relationship.
A process of becoming a mother requires extensive
psychological, social, and physical effort [1]. The maternal
role starts during pregnancy and continues to develop for 1
year postpartum, throughout which a mother’s demographic,
obstetric, and psychosocial factors determine their parenting
behavior and maternal role [1-3].
Mercer’s theory of becoming a mother [4] was
developed by Rubin’s theory of maternal role attainment [5].
Maternal attachment is the process through which maternal
love develops as a result of the satisfying and pleasing
interaction between mother and infants [6] following 4 stages
[4]; commitment, attachment, and preparation during
pregnancy; acquaintance, learning, and physical restoration
in the first 2 to 6 weeks following birth; moving toward a
new normal between the first 2 weeks and 4 months; and the
achievement of maternal identity at around 4 months. Almost
all mothers learn to read their infant’s cues within 1 month
after birth [5]. To facilitate this process, a mother and her
infant should be together immediately after birth, and they
should look after the baby by themselves [7] to gain the
“parental behavior” experiences such as smiling, touching,
kissing, hugging, patting, singing, maintaining eye contact,
breastfeeding, sensitivity, and affection [8-10]. As a result,
maternal self-confidence and satisfaction with her baby
increases, thus enhancing mother-infant attachment.
However, the mother-infant interaction may be hampered by
mother’s physical recovery from childbirth [1].
While mothers are free from labor pain after giving birth,
they experience various types of pain such as perineal pain,
posterior pelvic pain, and lower back pain, which may get
delayed attention and prevent mothers from properly looking
after their babies and performing their own daily activities
[11-14]. Previous study from Japan has shown that Japanese
mothers who were in a poor physical state were less willing
to look after their infants by themselves, and less interested
in their infants compared with mothers who were in a good
physical state 1 month postpartum [15].
Mothers experience various pregnancy and delivery-
related pain in the early postpartum period that may influence
their daily life activities and prevent them from
understanding their baby’s cues and respond on time.
Therefore, this literature review aims to describe how
perineal pain after birth impacts Japanese mothers in their
daily life and how it affects their parental behavior. The
present study specifically focuses on Japanese mothers because
of the cultural differences in verbal and non-verbal emotional
expression. The objective of this study is to gain a deeper
understanding of maternal adaptation in early postpartum to
facilitate perinatal and midwifery practices.
Materials and Methods
The purpose of the review was to summarize the
relationship between a mother’s perineal and physical pain after
vaginal birth and their parental behavior in the early postpartum
period.
The database Ichushi-Web (Japan Medical Abstracts
Society) was used to search for original Japanese research
articles published between 2000 and 2017 that studied human
participants. The following inclusion criteria were used: (a)
original research, (b) studies that clearly described the changing
perineal pain and the type of pain in early postpartum, (c)
studies that indicate how perineal pain influences postnatal
mother’s daily life activity, and (d) studies that identify a
mother’s needs in early postpartum. The terms postpartum, perineal pain, and lower back pain
were searched both with and without hyphenation on August 25,
2017. The search yielded 30 studies of perineal pain in
postpartum and 19 studies of lower back pain in postpartum. Six
articles were selected for inclusion in the literature review.
Results
Of the 6 papers selected for review, 3 were research
articles on perineal pain, 3 were research articles on lower back
pain.
1. Changing perineal pain and how mothers’ perineal and
physical pain after vaginal birth impact their daily life
activities in early postpartum
1) Perineal pain [16]
Perineal pain was evaluated from 0 to 100 (no pain to
worst pain) on the Visual Analogue Scale (VAS). Perinatal pain
was reported in 85.9% of women who felt the strongest pain at
days 0 and 1. The mean and standard deviation of VAS-related
pain in episiotomy were 65.2±19.94 at day 0, 59.4±19.72 at
day 2, and 44.0±22.26 at day 4. Perineal pain on each day was
positively related (r=.57, r=.28, r=.18, respectively). Moreover,
perineal pain on each day was positively related with difficulty
of daily activities, and strongly associated with difficulty of
sitting position (r=.83), decreasing motivation (r=.60), difficulty
- 85 -
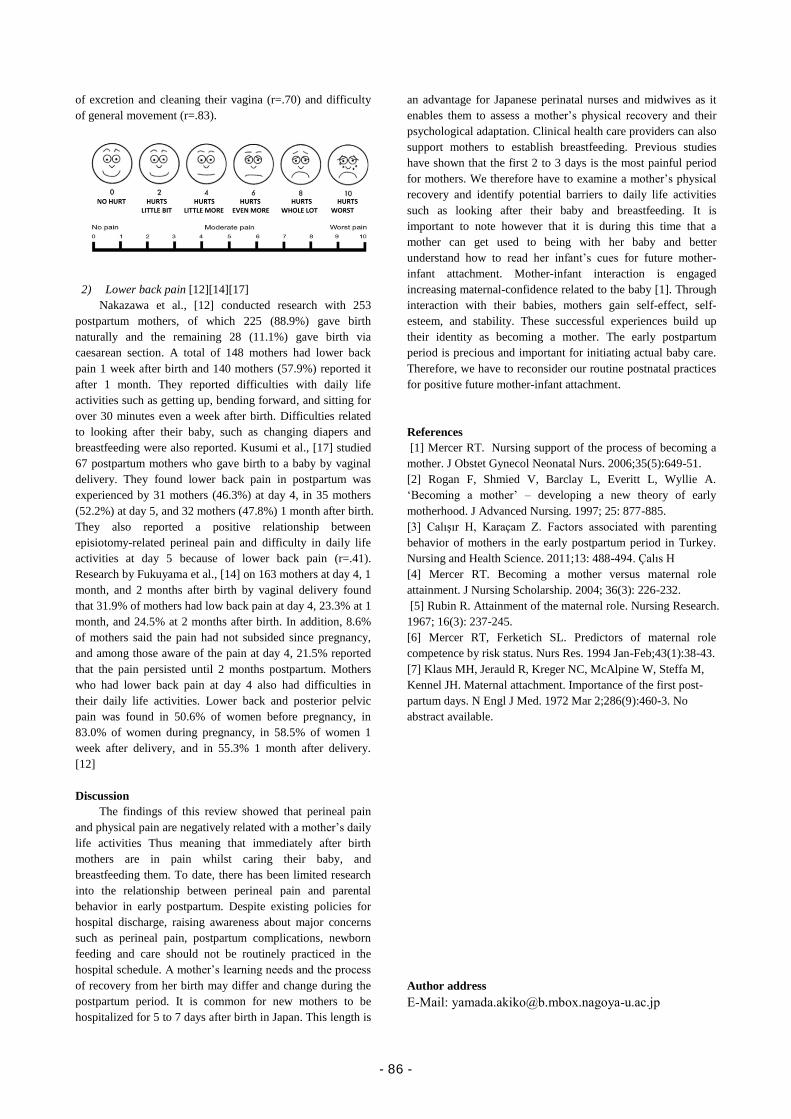
of excretion and cleaning their vagina (r=.70) and difficulty
of general movement (r=.83).
2) Lower back pain [12][14][17]
Nakazawa et al., [12] conducted research with 253
postpartum mothers, of which 225 (88.9%) gave birth
naturally and the remaining 28 (11.1%) gave birth via
caesarean section. A total of 148 mothers had lower back
pain 1 week after birth and 140 mothers (57.9%) reported it
after 1 month. They reported difficulties with daily life
activities such as getting up, bending forward, and sitting for
over 30 minutes even a week after birth. Difficulties related
to looking after their baby, such as changing diapers and
breastfeeding were also reported. Kusumi et al., [17] studied
67 postpartum mothers who gave birth to a baby by vaginal
delivery. They found lower back pain in postpartum was
experienced by 31 mothers (46.3%) at day 4, in 35 mothers
(52.2%) at day 5, and 32 mothers (47.8%) 1 month after birth.
They also reported a positive relationship between
episiotomy-related perineal pain and difficulty in daily life
activities at day 5 because of lower back pain (r=.41).
Research by Fukuyama et al., [14] on 163 mothers at day 4, 1
month, and 2 months after birth by vaginal delivery found
that 31.9% of mothers had low back pain at day 4, 23.3% at 1
month, and 24.5% at 2 months after birth. In addition, 8.6%
of mothers said the pain had not subsided since pregnancy,
and among those aware of the pain at day 4, 21.5% reported
that the pain persisted until 2 months postpartum. Mothers
who had lower back pain at day 4 also had difficulties in
their daily life activities. Lower back and posterior pelvic
pain was found in 50.6% of women before pregnancy, in
83.0% of women during pregnancy, in 58.5% of women 1
week after delivery, and in 55.3% 1 month after delivery.
[12]
Discussion
The findings of this review showed that perineal pain
and physical pain are negatively related with a mother’s daily
life activities Thus meaning that immediately after birth
mothers are in pain whilst caring their baby, and
breastfeeding them. To date, there has been limited research
into the relationship between perineal pain and parental
behavior in early postpartum. Despite existing policies for
hospital discharge, raising awareness about major concerns
such as perineal pain, postpartum complications, newborn
feeding and care should not be routinely practiced in the
hospital schedule. A mother’s learning needs and the process
of recovery from her birth may differ and change during the
postpartum period. It is common for new mothers to be
hospitalized for 5 to 7 days after birth in Japan. This length is
an advantage for Japanese perinatal nurses and midwives as it
enables them to assess a mother’s physical recovery and their
psychological adaptation. Clinical health care providers can also
support mothers to establish breastfeeding. Previous studies
have shown that the first 2 to 3 days is the most painful period
for mothers. We therefore have to examine a mother’s physical
recovery and identify potential barriers to daily life activities
such as looking after their baby and breastfeeding. It is
important to note however that it is during this time that a
mother can get used to being with her baby and better
understand how to read her infant’s cues for future mother-
infant attachment. Mother-infant interaction is engaged
increasing maternal-confidence related to the baby [1]. Through
interaction with their babies, mothers gain self-effect, self-
esteem, and stability. These successful experiences build up
their identity as becoming a mother. The early postpartum
period is precious and important for initiating actual baby care.
Therefore, we have to reconsider our routine postnatal practices
for positive future mother-infant attachment.
References
[1] Mercer RT. Nursing support of the process of becoming a
mother. J Obstet Gynecol Neonatal Nurs. 2006;35(5):649-51.
[2] Rogan F, Shmied V, Barclay L, Everitt L, Wyllie A.
‘Becoming a mother’ – developing a new theory of early
motherhood. J Advanced Nursing. 1997; 25: 877-885.
[3] Calışır H, Karaçam Z. Factors associated with parenting
behavior of mothers in the early postpartum period in Turkey.
Nursing and Health Science. 2011;13: 488-494. Çalıs H
[4] Mercer RT. Becoming a mother versus maternal role
attainment. J Nursing Scholarship. 2004; 36(3): 226-232.
[5] Rubin R. Attainment of the maternal role. Nursing Research.
1967; 16(3): 237-245.
[6] Mercer RT, Ferketich SL. Predictors of maternal role
competence by risk status. Nurs Res. 1994 Jan-Feb;43(1):38-43.
[7] Klaus MH, Jerauld R, Kreger NC, McAlpine W, Steffa M,
Kennel JH. Maternal attachment. Importance of the first post-
partum days. N Engl J Med. 1972 Mar 2;286(9):460-3. No
abstract available.
Author address
E-Mail: [email protected]
- 86 -
The Effects of Communication Competency and Job Embeddedness on Nursing
Performance in Small and Medium-sized Hospital: A Literature Review
I.S. Cheon
Department of Nursing, Wonju College of Medicine, Yonsei University, Wonju, Korea
Introduction Nursing performance shows how effective it is to
perform roles and responsibilities related to patient care. In
the hospital setting, patient care and nursing are top priority
tasks [1]. The nurses' workload and intensity of work were
increased as the demand for quality nursing services in-
creased, and high nursing work performance was also re-
quired through professional improvement to increase the
productivity of the hospital [2-3]. In this case, small and
medium hospitals often exceed their working hours due to
insufficient nursing staff compared to large hospitals, the
work environment is not good due to relatively low salaries
[3]. Due to the difficulty of securing nursing staff nursing
manpower management is also very difficult. Nursing work
performance is an important management factor because of
the low quality of nursing work and low interest in nursing
work performance [4]. The personal dimension that influ-
ences the performance of these nursing tasks is the job
embeddedness of the nurse to stay in the organization
without leaving the organization, the ability to communi-
cate, the self-efficacy of self- Leadership, nurse emotional
labor, emotional intelligence resilience, and self-efficacy.
[4, 7, 8-10,15-16,22]. Organizational dimension to improve
productivity and efficiency of hospital organization: nurs-
ing organization culture, nursing work environment, trans-
formational leadership of nursing manager, coaching be-
havior of nursing manager are reported [11-13].
Purpose The purpose of this study was to investigate the effect
of communication competency and job embeddedness of
nurses in small and medium hospitals on nursing perfor-
mance.
Methods As a key question in this research, firstly, whether the
communication ability of the nurse and the job embed-
dedness are related to the nursing performance. Second,
what is the size of the relationship and what are the factors
that affect it? The search database was composed of theses
and doctoral dissertations from 2008 to present (2017.8)
and articles published in journals (KoreaMed, PubMed,
RISS, National Assembly Library, Yonsei University Li-
brary). A review of selected literature references based on
selection criteria was included in the analysis of 22 studies
that met the selection criteria. The main keywords in
searching the database were 'Small hospital nurse', 'Job
embeddedness ', 'Communication ability', 'Nursing perfor-
mance', and 'Communication ability AND nursing work
performance', ' Job embeddedness 'and' nursing perfor-
mance '.
Results
The important factors influencing the performance of
nursing work through the searched literature are the results
of the variables related to the nurses’ communication abil-
ity and job embeddedness [1, 4, 8, 14-17, 19-20, 22-23].
Nursing performance is the degree to which nurses
perform their roles in a rational way to improve the quality
of nursing based on their expertise, and thus perform the
goals of the nursing organization efficiently [5]. Improving
the performance of nursing work leads to the improvement
of the quality of nursing service and nursing productivity
[6].
Communicative competence is the ability to use
communication in interpersonal relationships to the ability
to communicate in an organization refers to how well you
use communication in the course of performing tasks [23].
Nurses have difficulty communicating with patients, care-
givers, doctors, or fellow nurses. The difficulty of such
communication causes conflict, anxiety, stress, and eventu-
ally decides to leave. Competence nurses have difficulty
communicating with patients, caregivers, doctors or fellow
nurses. This difficulty of communication causes conflict,
anxiety, stress, and eventually it is an opportunity to decide
the turnover. Therefore, communication ability is very
important for nurses [14]. Communication skills reduce the
possibility of physical frictions among members in the
course of job performance and improve the professional
ability of nurses [15]. Communication ability has a positive
(+) correlation with communication ability and nursing
work performance. The higher the communication ability,
the higher the nursing work performance. On the other
hand, the lower the communication, Stress was increased
[1, 8, 15-16].
In relation to the factors influencing the performance
of nursing work, the job embeddedness is a new concept
that identifies the factors of organizational stay based on
individual and job relations, so that the individual can stay
in the organization without leaving the organization. It is a
web of individual complexity entangled with a new re-
search area that synthesizes psychological events or behav-
iors that shift and turnover [17,18]. It is an important varia-
ble that influences individuals' decision to stay in or leave
an organization. It is an intra-job factor that focuses on
"why do people stay in the organization?" It is composed
of fitness, linkage, and sacrifice as sub-factors [18]. The
higher the nurse's job embeddedness was, the lower the
intention to turnover [17, 19-20]. The job embeddedness
had a positive correlation with nursing work performance
[22]. In many medical institutions, it is important to in-
crease the job embeddedness and to reduce the turnover
rate of nurses. It is to increase the efficiency of the nursing
work by enhancing the efficiency of the work by having a
lot of competent nurses 7]. This job embeddedness has a
direct effect on job performance, and the more hospitals,
organizations, and jobs that nurses work with, the better the
individuals, the more active interaction with relevant de-
partments and colleagues in the hospital, And the higher
the perceived material and mental loss due to leaving the
- 87 -
hospital, the higher the performance of nursing work [7, 21,
22]. The hospital is the place to treat and nurse the patient,
and the best nursing performance is essential. It is im-
portant to understand the factors influencing
Conclusions
Literature review results, there are many researches on
nurse 's communication ability and nursing work perfor-
mance, but research on job embeddedness and nursing
work performance is on the one hand and most of them
have studied on job embeddedness as an influence factor
on turnover intention. It is necessary to study the effects of
communication ability and job embeddedness of nurses in
small and medium hospitals on the performance of nursing
work and to provide useful basic data for nursing work
improvement and nursing human resource management.
References
[1] Son YJ, Lee YA, Sim KN, Kong SS, Park YS. Influ-
ence of Communication Competence and Burnout on
Nursing Performance of Intensive Care Units Nurses.
Journal of the Korean Academy of Fundamentals of
Nursing, 2013;20(3): 278-288.
[2] Lee HS. Relationships among Communication Compe-
tence, Communication Types, Organizational Com-
mitment of Nurses. Dankook University. 2007. Chun
an, Korea.
[3] Kim JK, Kim MJ, Kim SY, Yu M, Lee KA. Effects of
general hospital nurses' work environment on job em-
beddedness and burnout. Journal of Korean Academy
of Nursing Administration, 2014;20(1):69-81.
[4] Lim MY. Effectsof Empowerment, Communication
Ability, and Job Stresson Nursing Service Performance
of Small and Medium-sized Hospital Nurses. Kongju
University. 2016. Choongnam. Korea.
[5] Ko YK, Lee TW, Lim JY. Development of a perfor-
mance measurement scale for hospital nurses. Journal
of Korean Academy of Nursing. 2007;37(3):286-294.
[6] Ha NS, Chol J. An Analysis of Nursing Competency
affecting on Job Satisfaction and Nursing Performance
among Clinical Nurses. Journal of Korean Academy of
Nursing Administration . 2010;16(3): 286-294.
[7] Lee HS. Yom HY. Role of Self-leadership and Social
Support in the Relationship between Job Embed-
dedness and Job Performance among General Hospital
Nurses, Journal of Korean Academy of Nursing Ad-
ministration. 2015;21(4):375-385.
[8] Kim YJ. The Effects of Emotional Intelligence and
Communication Competency on Nursing Performance
of Outpatient Nurses. Yonsei University. 2016. Seoul.
Korea.
[9] Lee EJ. University hospital nurse's feelings regarding
the impact on the business performance of nursing la-
bor research. Soonchunhyang University. 2013. Chu-
nan. Korea.
[10] Park SK. The impact of resilience on nursing outcome
of clinical nurses. Hanyang University. 2014. Seoul.
Korea.
[11] Lee YM. A study of correlation between leadership
styles of head nurses and nursing performance: the reg-
ulation effect of nursing organizational culture. Soon-
chun University. 2015. Jeonnam. Korea.
[12] Kim JK. Structural Model of Hospital Nurses' Turno-
ver Intention : Focusing on Organizational Characteris-
tics, Job Satisfaction, and Job Embeddedness. Journal
of Korean academy of nursing administration. 2016;22
(3):292-302.
[13] Ryu SY. The relationship between Coaching Behav-
iors of Nursing Managers, Empowerment and Job Per-
formance of Staff Nurses. Yonsei University,2009,
Seoul, Korea.
[14] Kim SH, Lee MA. Effects of Emotional Labor and
Communication Competence on Turnover Intention in
Nurses. Journal of Korean Academy of Nursing Ad-
ministration, 2014;20(3): 332-341.
[15] Bae JY. The relationships among the level of commu-
nication competence, the types of communication, and
the level of nursing performance. Kosin University.
2008. Busan. Korea.
[16] Choi JH. Relationship between nurse's emotional in-
telligence, communication competency and organiza-
tional commitment. Ajou University. 2010. Kyonggi-
do. Korea.
[17] Kim JH. The effects of job embeddedness on turnover
intention and organizational citizenship behavior in
hospital employees: Focusing on moderating effect of
personality traits. Kyungsung Universit. 2010. Busan.
[18] Mitchell TR, Holtom BC, Lee TW, Sablynski CJ, Erez
M. Why people stay: using job embeddedness to pre-
dict voluntary turnover. Academy of Management
Journal. 2001;44(6):1102-1121.
[19] Jeon JH, Yom YH. Roles of empowerment and emo-
tional intelligence in the relationship between job em-
beddedness and turnover intension among general hos-
pital nurses. Journaal of Korean Academy of Nursing
Administration. 2014;20(3):302-312.
[20] Kim YS. Rhu SA. Influence of Job Embeddedness
Factors on Turnover Intention of Nurses in Small and
Medium Sized General Hospitals. Journal of Korean
Academy of Nursing Administration. 2016;22(2):158-
166.
[21] Halbesleben JRB, Wheeler AR. The relative roles of
engagement and embeddedness in predicting job per-
formance and intention to leave. Work and Stress.
2008;22(3):242-256.
[22] Kwon SB, Pakk MJ, Song HM, Moon JS. Effects of
Job Embeddedness and Emotional Intelligence on Per-
formance of Nurses in Medium and Small sized Hospi-
tal. The Korean Journal of Health Service Management.
2017;11(1):55-66.
[23] Papa MJ. Communicator competence and employee performance with new technology. Southern Commu-
nication Journal, 1989;55(1):87-101.
Author address
E-Mail: [email protected]
- 88 -
Association of Early Skin-to-Skin Contact with Mother-Infant Attachment for the First Month
Y. Takahashi, A Yamada, M Kamiya, K. Tamakoshi
Department of Nursing, Nagoya University Graduate School of Medicine, Nagoya, Japan
Introduction
Mother who held their infant skin-to-skin contact (SSC)
after birth were more likely to breastfeed sooner, more
effectively, and for longer durations compared with mother
who did not have SSC [1-5]. After SSC, mother was more
care for their infant with more confidence and to recognize
and respond to their baby’s needs sooner [1, 5-7]. Infant who
had SSC during first hour after birth cried less [1,5,8,9],
stayed warmer [1,4,10,11], had more stable glucose levels
and cardiorespiratory function [5,6,12-14], had lower stress
hormone levels [14], were more likely to leave the hospital
having been exclusive breastfed at various intervals during
the first 6 months after birth [1,2]. Despite rich evidences of
SSC for mother and infant, they are often separated without
medical reasons [15]. Mother-infant attachment begins to
develop before a child is born [16] and also the attachment
for fetus is strongly correlated with postnatal attachment.
Klaus and Kennell have shown that a stronger impact of
early skin-to-skin contact on their attachement [17]. However
few studies have done in full-term mother-infant dyads
compared with preterm dyads.
Thus, the aim of this study is to explorer the relationship
between early SSC and mother-infant attachment for the first
month.
Materials and Methods
Subjects: This study was part of a larger study conducted
in Aichi, Japan, from January to October in 2009[14]. The
subjects were 75 healthy mothers selected according to the
criteria below. Maternal inclusion criteria were vaginal birth
of a singleton full-term healthy infant, uncomplicated
pregnancy. Maternal exclusion criteria were past mental
disease of the mothers, signs of fetal distress during labor,
and cesarean section. Infant exclusion criteria were any
congenital anomaly, and obvious birth asphyxia as assessed
by either 1 or 5 minute’s APGAR of seven or less. According
to the above-mentioned criteria, we distributed and collected
the questionnaires directly during hospitalization, whereas
one month after birth, the questionnaires were distributed by
mail. Finally, the current analysis was restricted to 56 healthy
dyads. This study protocol was approved by the Ethics
Review Committee of the Nagoya University School of
Medicine, Nagoya, Japan.
Measures: Demographic data were collected from
medical records during hospitalization.
Stein’s Maternity Blues Scale (MBS)[18], MBS is self-
rating scale with 13 items, evaluates maternity blues. We
used the Japanese version of the MBS validated by
Yamashita[19]. The sum of the score for each item with a
range of 0-26 was provided every day during hospitalization (4
or 5 days).
Edinburgh Postnatal Depression Scale (EPDS); a self-rating
scale with 10 items, has been used in screening for postpartum
depression[20]. The EPDS was translated into Japanese and
standardized[21,22]. The questionnaire contains 10 items, and
each item is scored on a four-point scale from 0~3, with the
minimum and maximum total scores being 0 and 30 points,
respectively, and the cut-off point was 8/9 in this study for the
assessment of postpartum depression. At one month after
delivery, the subjects received the EPDS by mail.
Maternal Attachment Inventory (MAI); MAI is a self-
reported questionnaire with 26 items, designed to measure
maternal affectionate attachment to infants[23]. The MAI was
translated into Japanese and was verified for concurrent
validity[24]. Each item is scored on a four-point scale from 1~4,
the minimum and maximum total scores being 26 and 104
points, respectively; a higher score indicates a stronger
attachment to the infant. We asked mothers to fill in at 3 days, 5
days, and 1 month after delivery.
Others; we directly asked some questions about feeling and
mood regarding pregnancy, childbirth, and their partner on the
first day after delivery. These questions were the original 8-item
rating scale, which was scored according to a five-step scale of
1: ‘strongly disagree’; 2: ‘somewhat disagree’; 3: ‘neutral’; 4:
‘somewhat agree’; and 5: ‘strongly agree. ’ Most respondents
were 5. Therefore, the 5: ‘strongly agree’ category was rescored
‘agree overall’ and other categories were combined. In the
analyses mentioned below, they were used as two categorical
data.
Data analysis: Descriptive statistics were used to
summarize the demographic factors. All continuous variables
are shown as mean ± standard deviation (SD), and categorical
data are presented based on frequency and percentage. The
correlation of MAI, MBS and EPDS with other study variables
is given by Pearson’s correlation coefficients or Spearman’s
rank-correlation coefficient. Multiple regression analysis by
forced entry method was performed to estimate the contribution
of study variables to MAI each 3, 5 days and 1 month
postpartum. Each MAI was the dependent variable and the
variables borderline significantly associated with MAI (a
probability value <0.1) were the independent variables. A
probability value <0.05 was considered significant. Data were
analyzed using SPSS version 23.0 for Windows. Differences
were considered significant when P<0.05 for the two tails.
- 89 -
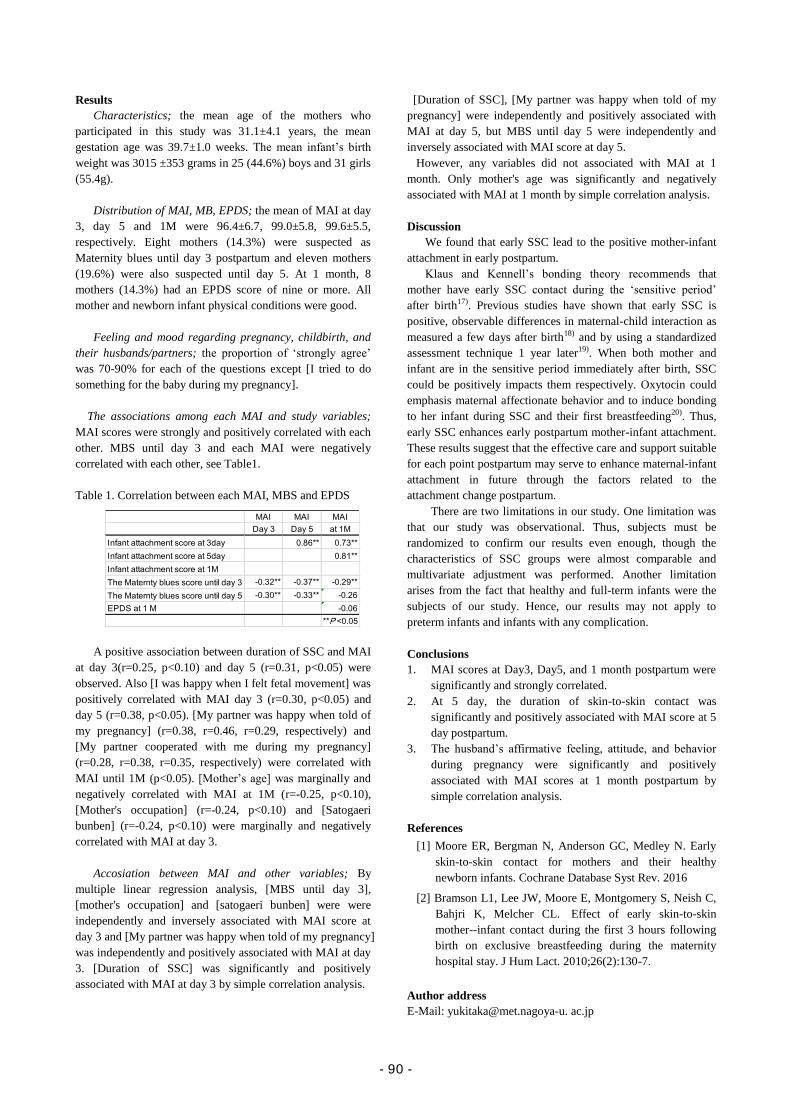
Results
Characteristics; the mean age of the mothers who
participated in this study was 31.1±4.1 years, the mean
gestation age was 39.7±1.0 weeks. The mean infant’s birth
weight was 3015 ±353 grams in 25 (44.6%) boys and 31 girls
(55.4g).
Distribution of MAI, MB, EPDS; the mean of MAI at day
3, day 5 and 1M were 96.4±6.7, 99.0±5.8, 99.6±5.5,
respectively. Eight mothers (14.3%) were suspected as
Maternity blues until day 3 postpartum and eleven mothers
(19.6%) were also suspected until day 5. At 1 month, 8
mothers (14.3%) had an EPDS score of nine or more. All
mother and newborn infant physical conditions were good.
Feeling and mood regarding pregnancy, childbirth, and
their husbands/partners; the proportion of ‘strongly agree’
was 70-90% for each of the questions except [I tried to do
something for the baby during my pregnancy].
The associations among each MAI and study variables;
MAI scores were strongly and positively correlated with each
other. MBS until day 3 and each MAI were negatively
correlated with each other, see Table1.
Table 1. Correlation between each MAI, MBS and EPDS
A positive association between duration of SSC and MAI
at day 3(r=0.25, p<0.10) and day 5 (r=0.31, p<0.05) were
observed. Also [I was happy when I felt fetal movement] was
positively correlated with MAI day 3 (r=0.30, p<0.05) and
day 5 (r=0.38, p<0.05). [My partner was happy when told of
my pregnancy] (r=0.38, r=0.46, r=0.29, respectively) and
[My partner cooperated with me during my pregnancy]
(r=0.28, r=0.38, r=0.35, respectively) were correlated with
MAI until 1M (p<0.05). [Mother’s age] was marginally and
negatively correlated with MAI at 1M (r=-0.25, p<0.10),
[Mother's occupation] (r=-0.24, p<0.10) and [Satogaeri
bunben] (r=-0.24, p<0.10) were marginally and negatively
correlated with MAI at day 3.
Accosiation between MAI and other variables; By
multiple linear regression analysis, [MBS until day 3],
[mother's occupation] and [satogaeri bunben] were were
independently and inversely associated with MAI score at
day 3 and [My partner was happy when told of my pregnancy]
was independently and positively associated with MAI at day
3. [Duration of SSC] was significantly and positively
associated with MAI at day 3 by simple correlation analysis.
[Duration of SSC], [My partner was happy when told of my
pregnancy] were independently and positively associated with
MAI at day 5, but MBS until day 5 were independently and
inversely associated with MAI score at day 5.
However, any variables did not associated with MAI at 1
month. Only mother's age was significantly and negatively
associated with MAI at 1 month by simple correlation analysis.
Discussion
We found that early SSC lead to the positive mother-infant
attachment in early postpartum.
Klaus and Kennell’s bonding theory recommends that
mother have early SSC contact during the ‘sensitive period’
after birth17). Previous studies have shown that early SSC is
positive, observable differences in maternal-child interaction as
measured a few days after birth18) and by using a standardized
assessment technique 1 year later19). When both mother and
infant are in the sensitive period immediately after birth, SSC
could be positively impacts them respectively. Oxytocin could
emphasis maternal affectionate behavior and to induce bonding
to her infant during SSC and their first breastfeeding20). Thus,
early SSC enhances early postpartum mother-infant attachment.
These results suggest that the effective care and support suitable
for each point postpartum may serve to enhance maternal-infant
attachment in future through the factors related to the
attachment change postpartum.
There are two limitations in our study. One limitation was
that our study was observational. Thus, subjects must be
randomized to confirm our results even enough, though the
characteristics of SSC groups were almost comparable and
multivariate adjustment was performed. Another limitation
arises from the fact that healthy and full-term infants were the
subjects of our study. Hence, our results may not apply to
preterm infants and infants with any complication.
Conclusions
1. MAI scores at Day3, Day5, and 1 month postpartum were
significantly and strongly correlated.
2. At 5 day, the duration of skin-to-skin contact was
significantly and positively associated with MAI score at 5
day postpartum.
3. The husband’s affirmative feeling, attitude, and behavior
during pregnancy were significantly and positively
associated with MAI scores at 1 month postpartum by
simple correlation analysis.
References
[1] Moore ER, Bergman N, Anderson GC, Medley N. Early
skin-to-skin contact for mothers and their healthy
newborn infants. Cochrane Database Syst Rev. 2016
[2] Bramson L1, Lee JW, Moore E, Montgomery S, Neish C,
Bahjri K, Melcher CL. Effect of early skin-to-skin
mother--infant contact during the first 3 hours following
birth on exclusive breastfeeding during the maternity
hospital stay. J Hum Lact. 2010;26(2):130-7.
Author address
E-Mail: [email protected]. ac.jp
MAI MAI MAI
Day 3 Day 5 at 1M
Infant attachment score at 3day 0.86** 0.73**
Infant attachment score at 5day 0.81**
Infant attachment score at 1M
The Maternty blues score until day 3 -0.32** -0.37** -0.29**
The Maternty blues score until day 5 -0.30** -0.33** -0.26
EPDS at 1 M -0.06
**P <0.05
- 90 -
Premenstrual Syndrome in Female Workers: A Literature Review
A.R. Jeong
Department of Nursing, Wonju College of Medicine, Yonsei University, Wonju, Korea
Introduction
Premenstrual syndrome (PMS) refers to physical
and emotional symptoms that occur in the one to two
weeks before a woman's period. Up to 80% of women
report having some symptoms prior to menstruation. It is
reported that main symptoms of female workers having
PMS is fatigue, lack of enthusiasm and emotional burnout
and PMS has relevance to their functional decline of
occupation. However, most women hardly ever consult the
health professionals. They primarily take a rest or take
medicine arbitrarily to relieve their symptoms.
Purpose The purpose of this study was to explore
epidemiology, causes, signs and symptoms and
management state of premenstrual syndrome for Korean
female workers.
Methods Data were extracted from 9 studies found to be
eligible. Nine research studies were reviewed in terms of
samples, outcome measurements.
Results Premenstrual syndrome(PMS) is a condition in
which some women experience unpleasant physical and
emotional feelings for a few days before their period.
PMS is known to have a great impact on daily life
activities and social functions, and might result in
significantly decreased quality of life. Prevalence rate of
PMS is measured differently depending on measurement
tool. However, almost every women experience at least
one symptom[9] and severity of symptoms is various in
accordance with the individual.
1. Causal factor
Causative factor of PMS would not be regarded as
being clearly unfounded. Many researches have been
conducted to find out factors to aggravate or alleviate
symptoms. It has been reported that, of the physical factor
to degenerate symptoms, it is hypermenorrhea[1] and age[6]
and so on. However, age and menstruation history is
misrelated PMS according to other stydy[1]. Also, stress
from various area is main psychological factor[2, 6, 9] and
some female worker who perform emotional labor their
duties are troubled with severe PMS. Perception femininity
is not related to PMS. In addition to that, low income,
caffeine intake, marriage is relating factor to have an effect
symptoms of PMS
2. Symptoms
Most frequent symptom is fatigue, physical
discomfort and water retention[3-6]. Those symptoms give
rise to anger-repression[8] and degrade their quality of life.
3.Treatment
To reduce their discomfort, half of women think
medical treatment but only 12.5% of women see a
doctor[3]. They usually take a break in their spare time or
take medicine without doctor’s prescription.
Conclusions Through a literature review, it has been found that
premenstrual syndrome is important issue for evaluation of
health state and management for female workers.
Individual exertions is required to assess their own signs
and symptoms of PMS and management for relief. Also
further research is need to understand factors associated
with Premenstrual syndrome in female workers.
References
[1]Kim TH, Park HS, Lee HH, Chung SH. Premenstrual
syndrome and dysmenorrhea in the career women at
bucheon city. Obstetrics & Gynecology Science,
2011;54(9): 523-528.
[2]Cho JH, Kim DI, Park KB. The correlation analysis of
factors related to PMS through survey. The Journal Of
Oriental Gynecology, 2006;19(4):174-204.
[3]Park HE, Jee BC, Ku SY, Suh CS, Kim SH, Choi YM,
Kime JG, Moon SY. A survey on premenstrual syndrome.
Obstetrics & Gynecology Science, 2005;48(2): 401-410.
[4]Park YH, Jeong BS, Kim CY, Lee C. Journal of Korean
Neuropsychiatric Association,, 2001;40(5):832-841.
[5]Kim BM, Song YM, Lee JG, You JH, Jeong JI.
Association of premenstrual syndrome with quality of
life in young women. Korean Journal of Family
Medicine, 2008;29(2):108-113.
[6]Kim SJ, Kim EH. Pre-menstruation discomforts
experienced by women. Korean journal of women health
nursing, 2001;7(4): 631-641.
[7]Kim KH, Kim EK, Seo SY, Lee SH, Choi TK, Kim MY,
Yook KY. Exploratory study of relationship between
self-perception to feminity and premenstrual symptoms-
In nurses who worked for some university hospitals-.
Cognitive Behavior Therapy in Korea, 2008;8(2),63-74.
[8]Seo SY, Kim MY, Lee SH. Anger and alexithymia in
women with Premenstrual Syndrome. Korean journal of
psychosomatic medicine, 2006;14(2):108-115.
[9]Lee SH, Song JA, Hur MH. Effect of emotional labor
and stress on premenstrual syndrome among hospital
nurses. Korean Journal of Women Health Nursing,
2016;22(1):61-70.
Author address
E-Mail: [email protected]
- 91 -
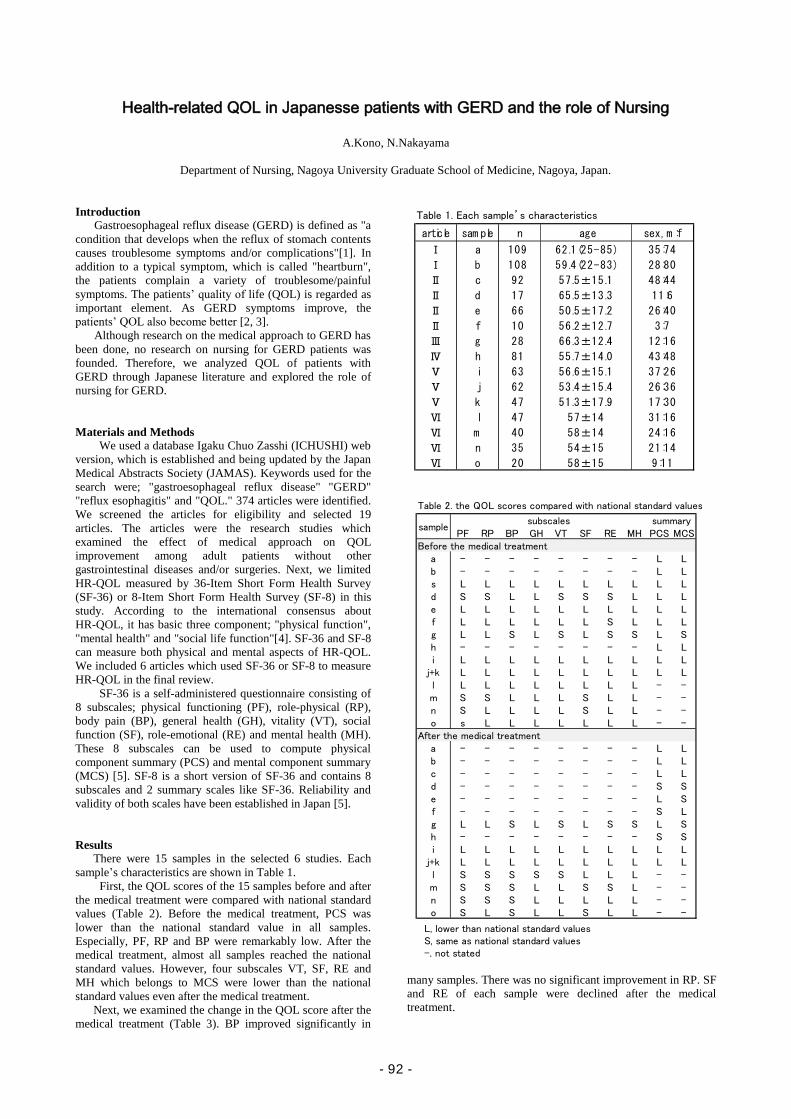
Health-related QOL in Japanesse patients with GERD and the role of Nursing
A.Kono, N.Nakayama
Department of Nursing, Nagoya University Graduate School of Medicine, Nagoya, Japan.
Introduction
Gastroesophageal reflux disease (GERD) is defined as "a
condition that develops when the reflux of stomach contents
causes troublesome symptoms and/or complications"[1]. In
addition to a typical symptom, which is called "heartburn",
the patients complain a variety of troublesome/painful
symptoms. The patients’ quality of life (QOL) is regarded as
important element. As GERD symptoms improve, the
patients’ QOL also become better [2, 3].
Although research on the medical approach to GERD has
been done, no research on nursing for GERD patients was
founded. Therefore, we analyzed QOL of patients with
GERD through Japanese literature and explored the role of
nursing for GERD.
Materials and Methods We used a database Igaku Chuo Zasshi (ICHUSHI) web
version, which is established and being updated by the Japan
Medical Abstracts Society (JAMAS). Keywords used for the
search were; "gastroesophageal reflux disease" "GERD"
"reflux esophagitis" and "QOL." 374 articles were identified.
We screened the articles for eligibility and selected 19
articles. The articles were the research studies which
examined the effect of medical approach on QOL
improvement among adult patients without other
gastrointestinal diseases and/or surgeries. Next, we limited
HR-QOL measured by 36-Item Short Form Health Survey
(SF-36) or 8-Item Short Form Health Survey (SF-8) in this
study. According to the international consensus about
HR-QOL, it has basic three component; "physical function",
"mental health" and "social life function"[4]. SF-36 and SF-8
can measure both physical and mental aspects of HR-QOL.
We included 6 articles which used SF-36 or SF-8 to measure
HR-QOL in the final review.
SF-36 is a self-administered questionnaire consisting of
8 subscales; physical functioning (PF), role-physical (RP),
body pain (BP), general health (GH), vitality (VT), social
function (SF), role-emotional (RE) and mental health (MH).
These 8 subscales can be used to compute physical
component summary (PCS) and mental component summary
(MCS) [5]. SF-8 is a short version of SF-36 and contains 8
subscales and 2 summary scales like SF-36. Reliability and
validity of both scales have been established in Japan [5].
Results There were 15 samples in the selected 6 studies. Each
sample’s characteristics are shown in Table 1.
First, the QOL scores of the 15 samples before and after
the medical treatment were compared with national standard
values (Table 2). Before the medical treatment, PCS was
lower than the national standard value in all samples.
Especially, PF, RP and BP were remarkably low. After the
medical treatment, almost all samples reached the national
standard values. However, four subscales VT, SF, RE and
MH which belongs to MCS were lower than the national
standard values even after the medical treatment.
Next, we examined the change in the QOL score after the
medical treatment (Table 3). BP improved significantly in
many samples. There was no significant improvement in RP. SF
and RE of each sample were declined after the medical
treatment.
Table 1. Each sample’s characteristics
article sam ple n age sex, m :f
Ⅰ a 109 62.1(25-85) 35:74
Ⅰ b 108 59.4(22-83) 28:80
Ⅱ c 92 57.5±15.1 48:44
Ⅱ d 17 65.5±13.3 11:6
Ⅱ e 66 50.5±17.2 26:40
Ⅱ f 10 56.2±12.7 3:7
Ⅲ g 28 66.3±12.4 12:16
Ⅳ h 81 55.7±14.0 43:48
Ⅴ i 63 56.6±15.1 37:26
Ⅴ j 62 53.4±15.4 26:36
Ⅴ k 47 51.3±17.9 17:30
Ⅵ l 47 57±14 31:16
Ⅵ m 40 58±14 24:16
Ⅵ n 35 54±15 21:14
Ⅵ o 20 58±15 9:11
Table 2. the QOL scores compared with national standard values
PF RP BP GH VT SF RE MH PCS MCSBefore the medical treatment
a - - - - - - - - L Lb - - - - - - - - L Ls L L L L L L L L L Ld S S L L S S S L L Le L L L L L L L L L Lf L L L L L L S L L Lg L L S L S L S S L Sh - - - - - - - - L Li L L L L L L L L L L
j+k L L L L L L L L L Ll L L L L L L L L - -m S S L L L S L L - -n S L L L L S L L - -o s L L L L L L L - -
After the medical treatmenta - - - - - - - - L Lb - - - - - - - - L Lc - - - - - - - - L Ld - - - - - - - - S Se - - - - - - - - L Sf - - - - - - - - S Lg L L S L S L S S L Sh - - - - - - - - S Si L L L L L L L L L L
j+k L L L L L L L L L Ll S S S S S L L L - -m S S S L L S S L - -n S S S L L L L L - -o S L S L L S L L - -
subscales summarysample
L, lower than national standard values S, same as national standard values -, not stated
- 92 -
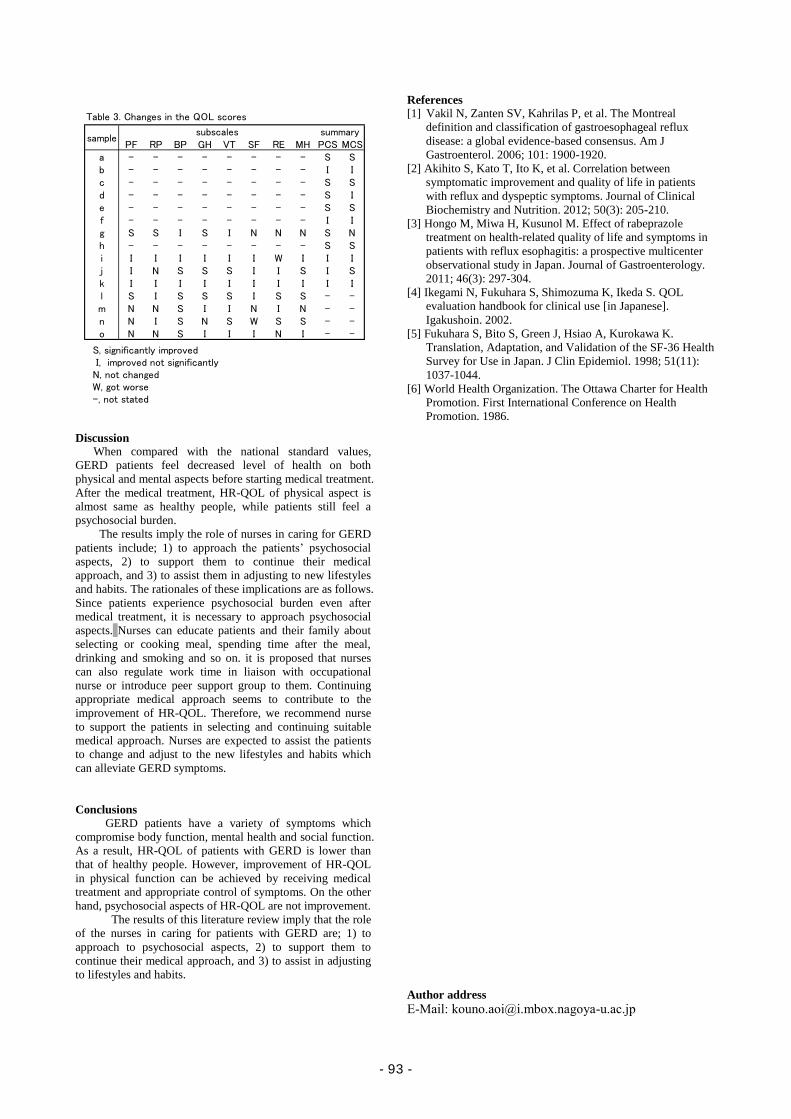
Discussion
When compared with the national standard values,
GERD patients feel decreased level of health on both
physical and mental aspects before starting medical treatment.
After the medical treatment, HR-QOL of physical aspect is
almost same as healthy people, while patients still feel a
psychosocial burden.
The results imply the role of nurses in caring for GERD
patients include; 1) to approach the patients’ psychosocial
aspects, 2) to support them to continue their medical
approach, and 3) to assist them in adjusting to new lifestyles
and habits. The rationales of these implications are as follows.
Since patients experience psychosocial burden even after
medical treatment, it is necessary to approach psychosocial
aspects. Nurses can educate patients and their family about
selecting or cooking meal, spending time after the meal,
drinking and smoking and so on. it is proposed that nurses
can also regulate work time in liaison with occupational
nurse or introduce peer support group to them. Continuing
appropriate medical approach seems to contribute to the
improvement of HR-QOL. Therefore, we recommend nurse
to support the patients in selecting and continuing suitable
medical approach. Nurses are expected to assist the patients
to change and adjust to the new lifestyles and habits which
can alleviate GERD symptoms.
Conclusions
GERD patients have a variety of symptoms which
compromise body function, mental health and social function.
As a result, HR-QOL of patients with GERD is lower than
that of healthy people. However, improvement of HR-QOL
in physical function can be achieved by receiving medical
treatment and appropriate control of symptoms. On the other
hand, psychosocial aspects of HR-QOL are not improvement.
The results of this literature review imply that the role
of the nurses in caring for patients with GERD are; 1) to
approach to psychosocial aspects, 2) to support them to
continue their medical approach, and 3) to assist in adjusting
to lifestyles and habits.
References
[1] Vakil N, Zanten SV, Kahrilas P, et al. The Montreal
definition and classification of gastroesophageal reflux
disease: a global evidence-based consensus. Am J
Gastroenterol. 2006; 101: 1900-1920.
[2] Akihito S, Kato T, Ito K, et al. Correlation between
symptomatic improvement and quality of life in patients
with reflux and dyspeptic symptoms. Journal of Clinical
Biochemistry and Nutrition. 2012; 50(3): 205-210.
[3] Hongo M, Miwa H, Kusunol M. Effect of rabeprazole
treatment on health-related quality of life and symptoms in
patients with reflux esophagitis: a prospective multicenter
observational study in Japan. Journal of Gastroenterology.
2011; 46(3): 297-304.
[4] Ikegami N, Fukuhara S, Shimozuma K, Ikeda S. QOL
evaluation handbook for clinical use [in Japanese].
Igakushoin. 2002.
[5] Fukuhara S, Bito S, Green J, Hsiao A, Kurokawa K.
Translation, Adaptation, and Validation of the SF-36 Health
Survey for Use in Japan. J Clin Epidemiol. 1998; 51(11):
1037-1044.
[6] World Health Organization. The Ottawa Charter for Health
Promotion. First International Conference on Health
Promotion. 1986.
Author address
E-Mail: [email protected]
Table 3. Changes in the QOL scores
PF RP BP GH VT SF RE MH PCS MCSa - - - - - - - - S Sb - - - - - - - - I Ic - - - - - - - - S Sd - - - - - - - - S Ie - - - - - - - - S Sf - - - - - - - - I Ig S S I S I N N N S Nh - - - - - - - - S Si I I I I I I W I I Ij I N S S S I I S I Sk I I I I I I I I I Il S I S S S I S S - -m N N S I I N I N - -n N I S N S W S S - -o N N S I I I N I - -
S, significantly improved I, improved not significantly N, not changed W, got worse -, not stated
samplesubscales summary
- 93 -
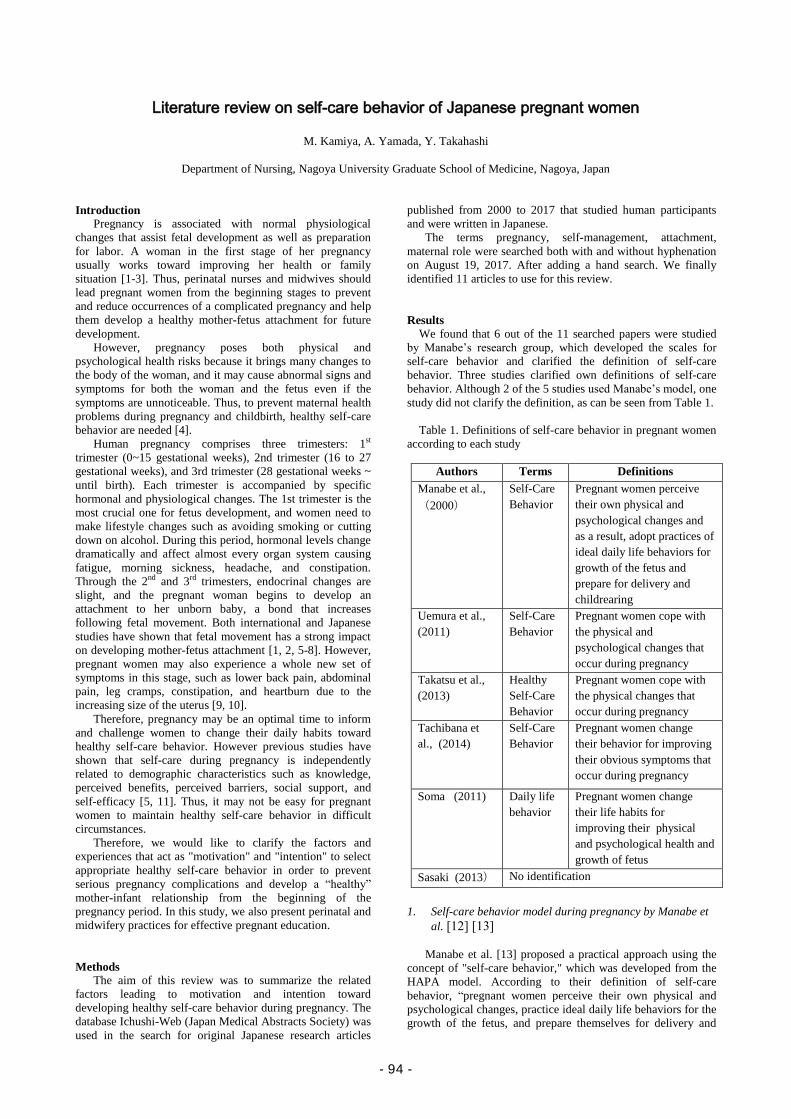
Literature review on self-care behavior of Japanese pregnant women
M. Kamiya, A. Yamada, Y. Takahashi
Department of Nursing, Nagoya University Graduate School of Medicine, Nagoya, Japan
Introduction
Pregnancy is associated with normal physiological
changes that assist fetal development as well as preparation
for labor. A woman in the first stage of her pregnancy
usually works toward improving her health or family
situation [1-3]. Thus, perinatal nurses and midwives should
lead pregnant women from the beginning stages to prevent
and reduce occurrences of a complicated pregnancy and help
them develop a healthy mother-fetus attachment for future
development.
However, pregnancy poses both physical and
psychological health risks because it brings many changes to
the body of the woman, and it may cause abnormal signs and
symptoms for both the woman and the fetus even if the
symptoms are unnoticeable. Thus, to prevent maternal health
problems during pregnancy and childbirth, healthy self-care
behavior are needed [4].
Human pregnancy comprises three trimesters: 1st
trimester (0~15 gestational weeks), 2nd trimester (16 to 27
gestational weeks), and 3rd trimester (28 gestational weeks ~
until birth). Each trimester is accompanied by specific
hormonal and physiological changes. The 1st trimester is the
most crucial one for fetus development, and women need to
make lifestyle changes such as avoiding smoking or cutting
down on alcohol. During this period, hormonal levels change
dramatically and affect almost every organ system causing
fatigue, morning sickness, headache, and constipation.
Through the 2nd and 3rd trimesters, endocrinal changes are
slight, and the pregnant woman begins to develop an
attachment to her unborn baby, a bond that increases
following fetal movement. Both international and Japanese
studies have shown that fetal movement has a strong impact
on developing mother-fetus attachment [1, 2, 5-8]. However,
pregnant women may also experience a whole new set of
symptoms in this stage, such as lower back pain, abdominal
pain, leg cramps, constipation, and heartburn due to the
increasing size of the uterus [9, 10].
Therefore, pregnancy may be an optimal time to inform
and challenge women to change their daily habits toward
healthy self-care behavior. However previous studies have
shown that self-care during pregnancy is independently
related to demographic characteristics such as knowledge,
perceived benefits, perceived barriers, social support, and
self-efficacy [5, 11]. Thus, it may not be easy for pregnant
women to maintain healthy self-care behavior in difficult
circumstances.
Therefore, we would like to clarify the factors and
experiences that act as "motivation" and "intention" to select
appropriate healthy self-care behavior in order to prevent
serious pregnancy complications and develop a “healthy”
mother-infant relationship from the beginning of the
pregnancy period. In this study, we also present perinatal and
midwifery practices for effective pregnant education.
Methods The aim of this review was to summarize the related
factors leading to motivation and intention toward
developing healthy self-care behavior during pregnancy. The
database Ichushi-Web (Japan Medical Abstracts Society) was
used in the search for original Japanese research articles
published from 2000 to 2017 that studied human participants
and were written in Japanese.
The terms pregnancy, self-management, attachment,
maternal role were searched both with and without hyphenation
on August 19, 2017. After adding a hand search. We finally
identified 11 articles to use for this review.
Results We found that 6 out of the 11 searched papers were studied
by Manabe’s research group, which developed the scales for
self-care behavior and clarified the definition of self-care
behavior. Three studies clarified own definitions of self-care
behavior. Although 2 of the 5 studies used Manabe’s model, one
study did not clarify the definition, as can be seen from Table 1.
Table 1. Definitions of self-care behavior in pregnant women
according to each study
1. Self-care behavior model during pregnancy by Manabe et
al. [12] [13]
Manabe et al. [13] proposed a practical approach using the
concept of "self-care behavior," which was developed from the
HAPA model. According to their definition of self-care
behavior, “pregnant women perceive their own physical and
psychological changes, practice ideal daily life behaviors for the
growth of the fetus, and prepare themselves for delivery and
Authors Terms Definitions
Manabe et al.,
(2000)
Self-Care
Behavior
Pregnant women perceive
their own physical and
psychological changes and
as a result, adopt practices of
ideal daily life behaviors for
growth of the fetus and
prepare for delivery and
childrearing
Uemura et al.,
(2011)
Self-Care
Behavior
Pregnant women cope with
the physical and
psychological changes that
occur during pregnancy
Takatsu et al.,
(2013)
Healthy
Self-Care
Behavior
Pregnant women cope with
the physical changes that
occur during pregnancy
Tachibana et
al., (2014)
Self-Care
Behavior
Pregnant women change
their behavior for improving
their obvious symptoms that
occur during pregnancy
Soma (2011) Daily life
behavior
Pregnant women change
their life habits for
improving their physical
and psychological health and
growth of fetus
Sasaki (2013) No identification
- 94 -
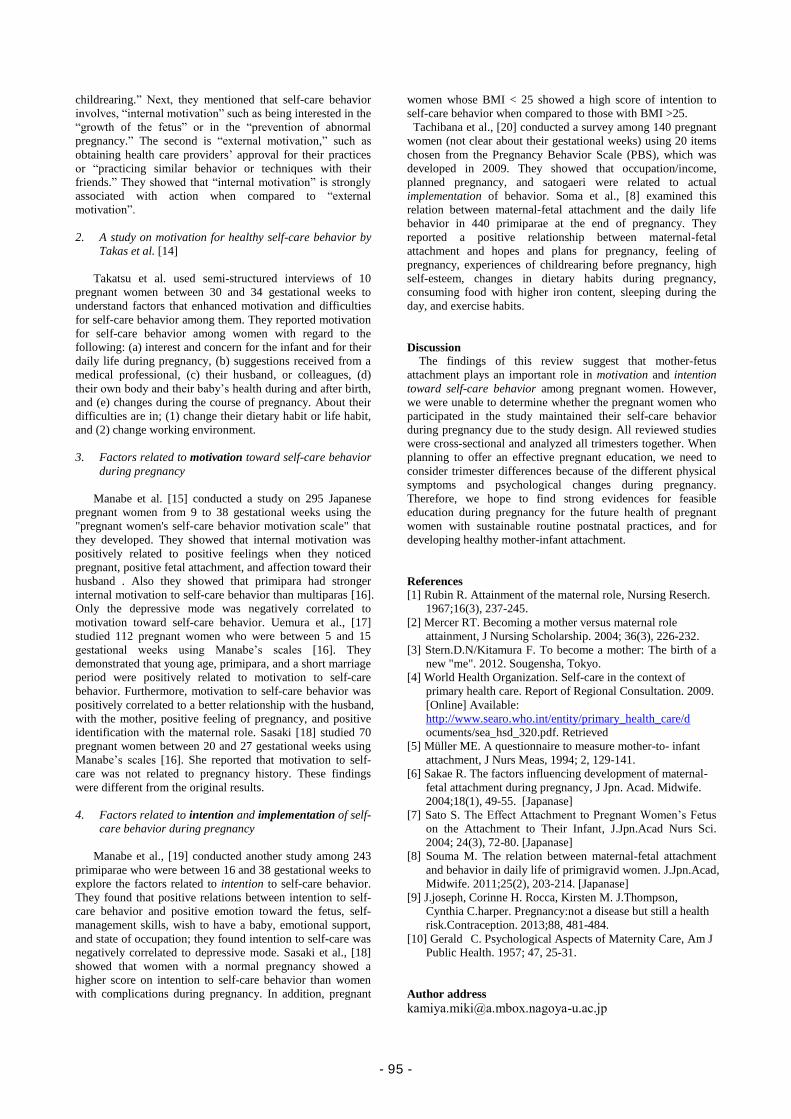
childrearing.” Next, they mentioned that self-care behavior
involves, “internal motivation” such as being interested in the
“growth of the fetus” or in the “prevention of abnormal
pregnancy.” The second is “external motivation,” such as
obtaining health care providers’ approval for their practices
or “practicing similar behavior or techniques with their
friends.” They showed that “internal motivation” is strongly
associated with action when compared to “external
motivation”.
2. A study on motivation for healthy self-care behavior by
Takas et al. [14]
Takatsu et al. used semi-structured interviews of 10
pregnant women between 30 and 34 gestational weeks to
understand factors that enhanced motivation and difficulties
for self-care behavior among them. They reported motivation
for self-care behavior among women with regard to the
following: (a) interest and concern for the infant and for their
daily life during pregnancy, (b) suggestions received from a
medical professional, (c) their husband, or colleagues, (d)
their own body and their baby’s health during and after birth,
and (e) changes during the course of pregnancy. About their
difficulties are in; (1) change their dietary habit or life habit,
and (2) change working environment.
3. Factors related to motivation toward self-care behavior
during pregnancy
Manabe et al. [15] conducted a study on 295 Japanese
pregnant women from 9 to 38 gestational weeks using the
"pregnant women's self-care behavior motivation scale" that
they developed. They showed that internal motivation was
positively related to positive feelings when they noticed
pregnant, positive fetal attachment, and affection toward their
husband . Also they showed that primipara had stronger
internal motivation to self-care behavior than multiparas [16].
Only the depressive mode was negatively correlated to
motivation toward self-care behavior. Uemura et al., [17]
studied 112 pregnant women who were between 5 and 15
gestational weeks using Manabe’s scales [16]. They
demonstrated that young age, primipara, and a short marriage
period were positively related to motivation to self-care
behavior. Furthermore, motivation to self-care behavior was
positively correlated to a better relationship with the husband,
with the mother, positive feeling of pregnancy, and positive
identification with the maternal role. Sasaki [18] studied 70
pregnant women between 20 and 27 gestational weeks using
Manabe’s scales [16]. She reported that motivation to self-
care was not related to pregnancy history. These findings
were different from the original results.
4. Factors related to intention and implementation of self-
care behavior during pregnancy
Manabe et al., [19] conducted another study among 243
primiparae who were between 16 and 38 gestational weeks to
explore the factors related to intention to self-care behavior.
They found that positive relations between intention to self-
care behavior and positive emotion toward the fetus, self-
management skills, wish to have a baby, emotional support,
and state of occupation; they found intention to self-care was
negatively correlated to depressive mode. Sasaki et al., [18]
showed that women with a normal pregnancy showed a
higher score on intention to self-care behavior than women
with complications during pregnancy. In addition, pregnant
women whose BMI < 25 showed a high score of intention to
self-care behavior when compared to those with BMI >25.
Tachibana et al., [20] conducted a survey among 140 pregnant
women (not clear about their gestational weeks) using 20 items
chosen from the Pregnancy Behavior Scale (PBS), which was
developed in 2009. They showed that occupation/income,
planned pregnancy, and satogaeri were related to actual
implementation of behavior. Soma et al., [8] examined this
relation between maternal-fetal attachment and the daily life
behavior in 440 primiparae at the end of pregnancy. They
reported a positive relationship between maternal-fetal
attachment and hopes and plans for pregnancy, feeling of
pregnancy, experiences of childrearing before pregnancy, high
self-esteem, changes in dietary habits during pregnancy,
consuming food with higher iron content, sleeping during the
day, and exercise habits.
Discussion
The findings of this review suggest that mother-fetus
attachment plays an important role in motivation and intention
toward self-care behavior among pregnant women. However,
we were unable to determine whether the pregnant women who
participated in the study maintained their self-care behavior
during pregnancy due to the study design. All reviewed studies
were cross-sectional and analyzed all trimesters together. When
planning to offer an effective pregnant education, we need to
consider trimester differences because of the different physical
symptoms and psychological changes during pregnancy.
Therefore, we hope to find strong evidences for feasible
education during pregnancy for the future health of pregnant
women with sustainable routine postnatal practices, and for
developing healthy mother-infant attachment.
References
[1] Rubin R. Attainment of the maternal role, Nursing Reserch.
1967;16(3), 237-245.
[2] Mercer RT. Becoming a mother versus maternal role
attainment, J Nursing Scholarship. 2004; 36(3), 226-232.
[3] Stern.D.N/Kitamura F. To become a mother: The birth of a
new "me". 2012. Sougensha, Tokyo.
[4] World Health Organization. Self-care in the context of
primary health care. Report of Regional Consultation. 2009.
[Online] Available:
http://www.searo.who.int/entity/primary_health_care/d
ocuments/sea_hsd_320.pdf. Retrieved
[5] Müller ME. A questionnaire to measure mother-to- infant
attachment, J Nurs Meas, 1994; 2, 129-141.
[6] Sakae R. The factors influencing development of maternal-
fetal attachment during pregnancy, J Jpn. Acad. Midwife.
2004;18(1), 49-55. [Japanase]
[7] Sato S. The Effect Attachment to Pregnant Women’s Fetus
on the Attachment to Their Infant, J.Jpn.Acad Nurs Sci.
2004; 24(3), 72-80. [Japanase]
[8] Souma M. The relation between maternal-fetal attachment
and behavior in daily life of primigravid women. J.Jpn.Acad,
Midwife. 2011;25(2), 203-214. [Japanase]
[9] J.joseph, Corinne H. Rocca, Kirsten M. J.Thompson,
Cynthia C.harper. Pregnancy:not a disease but still a health
risk.Contraception. 2013;88, 481-484.
[10] Gerald C. Psychological Aspects of Maternity Care, Am J
Public Health. 1957; 47, 25-31.
Author address
- 95 -
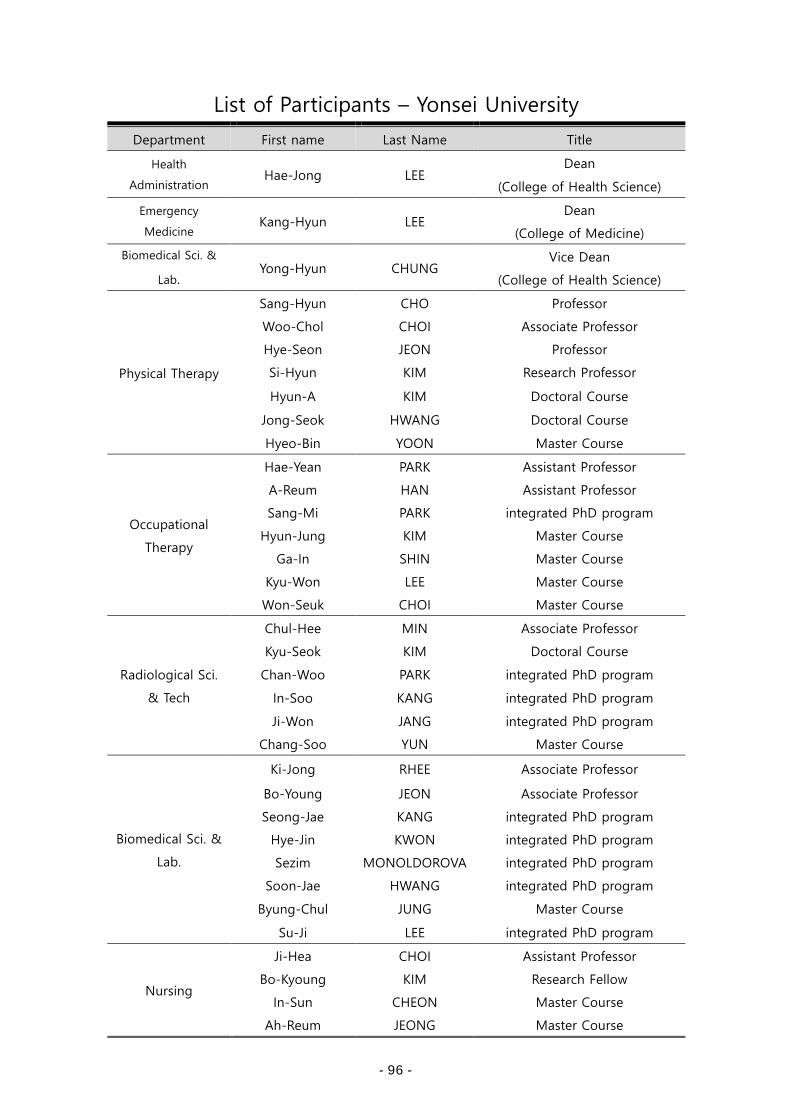
List of Participants – Yonsei University
Department First name Last Name Title
Health
Administration Hae-Jong LEE
Dean
(College of Health Science)
Emergency
Medicine Kang-Hyun LEE
Dean
(College of Medicine)
Biomedical Sci. &
Lab. Yong-Hyun CHUNG
Vice Dean
(College of Health Science)
Physical Therapy
Sang-Hyun CHO Professor
Woo-Chol CHOI Associate Professor
Hye-Seon JEON Professor
Si-Hyun KIM Research Professor
Hyun-A KIM Doctoral Course
Jong-Seok HWANG Doctoral Course
Hyeo-Bin YOON Master Course
Occupational
Therapy
Hae-Yean PARK Assistant Professor
A-Reum HAN Assistant Professor
Sang-Mi PARK integrated PhD program
Hyun-Jung KIM Master Course
Ga-In SHIN Master Course
Kyu-Won LEE Master Course
Won-Seuk CHOI Master Course
Radiological Sci.
& Tech
Chul-Hee MIN Associate Professor
Kyu-Seok KIM Doctoral Course
Chan-Woo PARK integrated PhD program
In-Soo KANG integrated PhD program
Ji-Won JANG integrated PhD program
Chang-Soo YUN Master Course
Biomedical Sci. &
Lab.
Ki-Jong RHEE Associate Professor
Bo-Young JEON Associate Professor
Seong-Jae KANG integrated PhD program
Hye-Jin KWON integrated PhD program
Sezim MONOLDOROVA integrated PhD program
Soon-Jae HWANG integrated PhD program
Byung-Chul JUNG Master Course
Su-Ji LEE integrated PhD program
Nursing
Ji-Hea CHOI Assistant Professor
Bo-Kyoung KIM Research Fellow
In-Sun CHEON Master Course
Ah-Reum JEONG Master Course
- 96 -
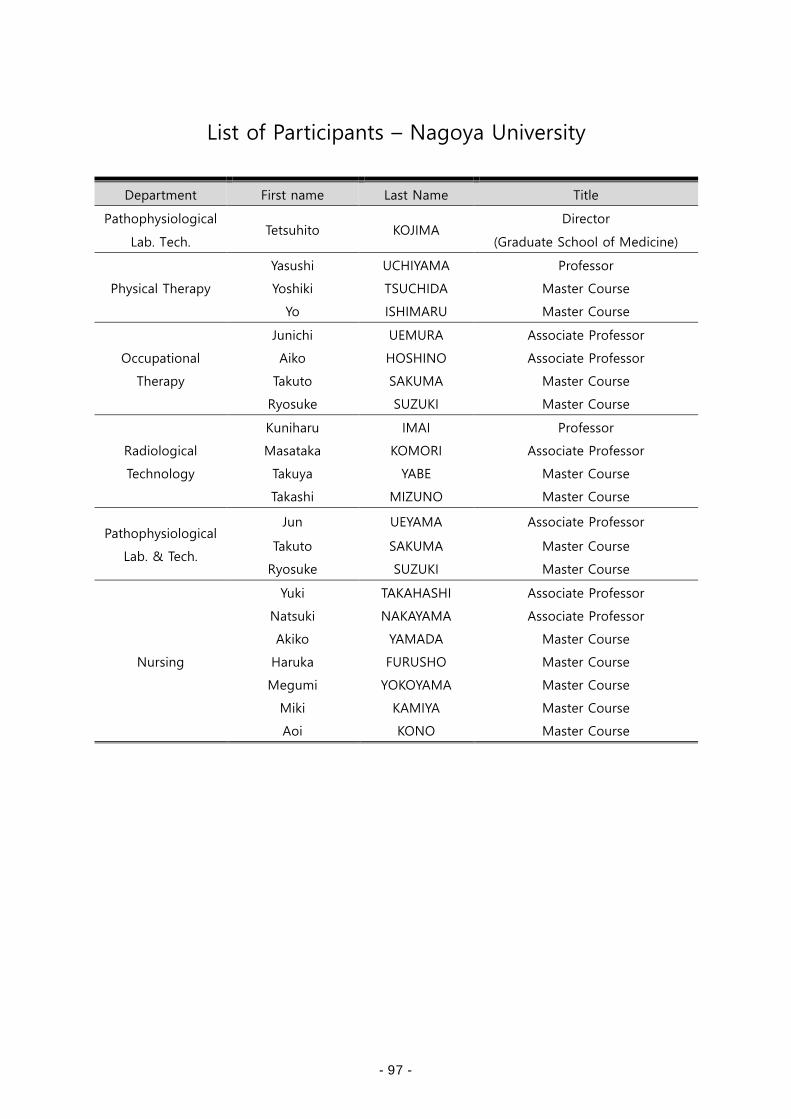
List of Participants – Nagoya University
Department First name Last Name Title
Pathophysiological
Lab. Tech. Tetsuhito KOJIMA
Director
(Graduate School of Medicine)
Physical Therapy
Yasushi UCHIYAMA Professor
Yoshiki TSUCHIDA Master Course
Yo ISHIMARU Master Course
Occupational
Therapy
Junichi UEMURA Associate Professor
Aiko HOSHINO Associate Professor
Takuto SAKUMA Master Course
Ryosuke SUZUKI Master Course
Radiological
Technology
Kuniharu IMAI Professor
Masataka KOMORI Associate Professor
Takuya YABE Master Course
Takashi MIZUNO Master Course
Pathophysiological
Lab. & Tech.
Jun UEYAMA Associate Professor
Takuto SAKUMA Master Course
Ryosuke SUZUKI Master Course
Nursing
Yuki TAKAHASHI Associate Professor
Natsuki NAKAYAMA Associate Professor
Akiko YAMADA Master Course
Haruka FURUSHO Master Course
Megumi YOKOYAMA Master Course
Miki KAMIYA Master Course
Aoi KONO Master Course
- 97 -