Embed Size (px)
Citation preview
June 5, 2012
Morgan Stanley does and seeks to do business with companies covered in Morgan Stanley Research. As a result, investors should be aware that the firm may have a conflict of interest that could affect the objectivity of Morgan Stanley Research. Investors should consider Morgan Stanley Research as only a single factor in making their investment decision.
For analyst certification and other important disclosures, refer to the Disclosure Section, located at the end of this report.
* = This Research Report has been partially prepared by analysts employed by non-U.S. affiliates of the member. Please see page 2 for the name of each non-U.S. affiliate contributing to this Research Report and the names of the analysts employed by each contributing affiliate.
+= Analysts employed by non-U.S. affiliates are not registered with FINRA, may not be associated persons of the member and may not be subject to NASD/NYSE restrictions on communications with a subject company, public appearances and trading securities held by a research analyst account.
M O R G A N S T A N L E Y B L U E P A P E R
Global Auto Scenarios 2022 Disruption and Opportunity Starts Now
Auto companies routinely think 10 years ahead, and so should investors. A decade is less than two product cycles and less than one engineering cycle for a powertrain. Most cars being developed today will still be on sale by 2022. Our global auto team has collaborated to measure how critical uncertainties (oil price, GDP, EM vs. DM growth, technology) will influence the future of the industry through scenario analysis, ranking the best-positioned and potentially challenged firms. The outcomes reveal some surprising differences in the value of the industry and who comes out on top.
If our conclusions prove right, VW and BMW offer an outstanding long-term investment opportunity as current valuations do not reflect their strong positioning. GM’s large lead over Ford surprised us, standing in sharp contrast to today’s investor perceptions. BorgWarner and Tesla ranked high in some scenarios yet far lower in others. Great Wall screens as the best of the EM, yet still ranks below the industry median. Toyota and Nissan make the top quintile with a substantial lead over Honda. Hyundai has a place among the leaders as does MOBIS and Halla. European volume players and non-J3 Japanese OEMs ranked low overall, suggesting high investment risk or strategic changes ahead.
Valuations today do not reflect what we see as the best way to play the long-term trends. We find large discrepancies—even negative correlations—between valuations and rankings, suggesting the market’s concentration on near-term issues leaves tremendous alpha-generating opportunities longer-term. Some of the best-positioned auto stocks happen to be the cheapest. Such anomalies won’t last.
M O R G A N S T A N L E Y R E S E A R C H
G l o b a l
Adam Jonas1
Ravi Shanker1
Stuart Pearson2
Laura Lembke2
Edoardo Spina2
Kate Zhu4
Binay Singh5
Sangkyoo Park3
Ryosuke Hoshino6
Shinji Kakiuchi6
Global Autos Team *See page 2 for all contributors to this report
1 Morgan Stanley & Co. LLC 2 Morgan Stanley & Co. International plc+ 3 Morgan Stanley & Co. International plc, Seoul Branch+ 4 Morgan Stanley Asia Limited+ 5 Morgan Stanley India Company Private Limited+ 6 Morgan Stanley MUFG Securities Co., Ltd.+
Morgan Stanley Blue Papers focus on critical investment themes that require coordinated perspectives across industry sectors, regions, or asset classes.
M O R G A N S T A N L E Y R E S E A R C H
June 5, 2012 Global Auto Scenarios 2022
Global Autos Team Contributors to this Report
North America
Adam Jonas1 +1 (212) 761-1726 [email protected] Ravi Shanker1 +1 (212) 761-6350 [email protected] Yejay Ying1 +1 (212) 761-7096 [email protected]
Europe
Stuart Pearson2 +44 (0)20 7425 6654 [email protected] Edoardo Spina2 +44 (0)20 7425 0664 [email protected] Laura Lembke2 +44 (0)20 7425 7944 [email protected]
Asia
China Kate Zhu5 +852 2848-6843 [email protected] Bin Hu5 +86 21 2033-6661 [email protected] Frank Xu5 +86 21 2033-6660 [email protected]
India Binay Singh6 +91 22 6118-2218 [email protected] Shreya Gaunekar6 +91 22 6118-2219 [email protected]
S. Korea Sangkyoo Park3 +82 2 399-4846 [email protected] Candice Kim3 +82 2 399-9920 [email protected]
Taiwan Lily Chen4 +886 2 2730-2871 [email protected]
Japan
Autos Ryosuke Hoshino7 +813-5424-5916 [email protected] Keita Suzuki7 +813-5424-5903 [email protected] Hikaru Ishikawa7 +813-5424-5378 [email protected]
Auto Parts Shinji Kakiuchi7 +813-5424-5914 [email protected] Kaori Morishita7 +813-5424-5924 [email protected] Naoko Hosaka7 +813-5424-5388 [email protected]
1 Morgan Stanley & Co. LLC 2 Morgan Stanley & Co. International plc+ 3 Morgan Stanley & Co. International plc, Seoul Branch+
4 Morgan Stanley Taiwan Limited+ 5 Morgan Stanley Asia Limited+ 6 Morgan Stanley India Company Private Limited+
7 Morgan Stanley MUFG Securities Co., Ltd.+
See page 36 for recent Blue Paper reports.
The image on the cover is property of General Motors. Morgan Stanley Research thanks the company for permission to use it.
2
M O R G A N S T A N L E Y R E S E A R C H
June 5, 2012 Global Auto Scenarios 2022
Table of Contents
The Auto Industry in 2022: Scenarios & Player Rankings ...................................................................................................... 4
Scenarios Sharpened Our Focus on 2022 ....................................................................................................................... 5
2022 Scenarios vs. 2013 PE Multiples............................................................................................................................. 8
10 Scenario A: Detroit Revolution ................................................................................................................................................
13 Scenario B: Electric Avenue....................................................................................................................................................
16 Scenario C: If You Can’t Beat EM, Join EM ............................................................................................................................
19 Scenario D: Walmart on Wheels .............................................................................................................................................
22 The Debates on Our Axes.......................................................................................................................................................
23 Our Scenario Process .............................................................................................................................................................
3
M O R G A N S T A N L E Y R E S E A R C H
June 5, 2012 Global Auto Scenarios 2022
M O R G A N S T A N L E Y B L U E P A P E R The Auto Industry in 2022: Scenarios & Player Rankings
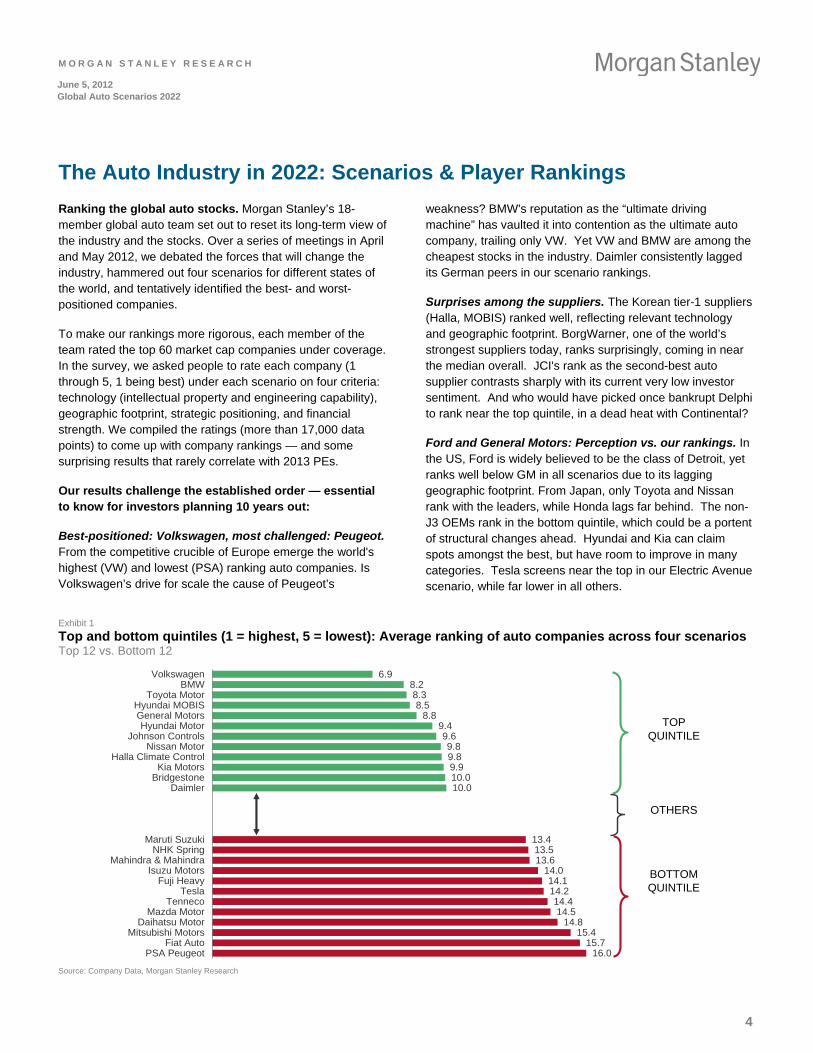
Ranking the global auto stocks. Morgan Stanley’s 18-member global auto team set out to reset its long-term view of the industry and the stocks. Over a series of meetings in April and May 2012, we debated the forces that will change the industry, hammered out four scenarios for different states of the world, and tentatively identified the best- and worst-positioned companies.
To make our rankings more rigorous, each member of the team rated the top 60 market cap companies under coverage. In the survey, we asked people to rate each company (1 through 5, 1 being best) under each scenario on four criteria: technology (intellectual property and engineering capability), geographic footprint, strategic positioning, and financial strength. We compiled the ratings (more than 17,000 data points) to come up with company rankings — and some surprising results that rarely correlate with 2013 PEs.
Our results challenge the established order — essential to know for investors planning 10 years out:
Best-positioned: Volkswagen, most challenged: Peugeot. From the competitive crucible of Europe emerge the world's highest (VW) and lowest (PSA) ranking auto companies. Is Volkswagen’s drive for scale the cause of Peugeot’s
weakness? BMW's reputation as the “ultimate driving machine” has vaulted it into contention as the ultimate auto company, trailing only VW. Yet VW and BMW are among the cheapest stocks in the industry. Daimler consistently lagged its German peers in our scenario rankings.
Surprises among the suppliers. The Korean tier-1 suppliers (Halla, MOBIS) ranked well, reflecting relevant technology and geographic footprint. BorgWarner, one of the world’s strongest suppliers today, ranks surprisingly, coming in near the median overall. JCI's rank as the second-best auto supplier contrasts sharply with its current very low investor sentiment. And who would have picked once bankrupt Delphi to rank near the top quintile, in a dead heat with Continental?
Ford and General Motors: Perception vs. our rankings. In the US, Ford is widely believed to be the class of Detroit, yet ranks well below GM in all scenarios due to its lagging geographic footprint. From Japan, only Toyota and Nissan rank with the leaders, while Honda lags far behind. The non-J3 OEMs rank in the bottom quintile, which could be a portent of structural changes ahead. Hyundai and Kia can claim spots amongst the best, but have room to improve in many categories. Tesla screens near the top in our Electric Avenue scenario, while far lower in all others.
Exhibit 1
Top and bottom quintiles (1 = highest, 5 = lowest): Average ranking of auto companies across four scenarios Top 12 vs. Bottom 12
6.98.28.38.5
8.89.49.69.89.89.910.010.0
13.413.513.6
14.014.114.214.414.5
14.815.4
15.716.0
VolkswagenBMW
Toyota MotorHyundai MOBISGeneral MotorsHyundai Motor
Johnson ControlsNissan Motor
Halla Climate ControlKia Motors
BridgestoneDaimler
Maruti SuzukiNHK Spring
Mahindra & MahindraIsuzu Motors
Fuji HeavyTesla
TennecoMazda Motor
Daihatsu MotorMitsubishi Motors
Fiat AutoPSA Peugeot
TOP QUINTILE
OTHERS
BOTTOM QUINTILE
Source: Company Data, Morgan Stanley Research
4
M O R G A N S T A N L E Y R E S E A R C H
June 5, 2012 Global Auto Scenarios 2022
Scenarios Sharpened Our Focus on 2022
We began with a framework from corporate strategy. After the 1967 war in the Middle East, executives at Shell realized that oil prices could spike. Their goal was to prepare for all plausible outcomes, not just the most probable one. They used hypothetical scenarios to “re-perceive” the future after an oil shock, including a low-growth oil industry, an OPEC takeover of the oilfields, and a range of other market-moving forces in the world. Events after the 1972 Arab-Israeli conflict proved them right, and their work spawned multiple scenario-building techniques over the following decades.
The key question: What will future demand for mobility look like and what technology and infrastructure can enable it?
We chose a matrix approach for the uncertainties facing auto companies over the next decade. This process works when multiple uncertainties are moving independently (“orthogonality”). Then only the forces with the highest impact matter. The 18 members of our global autos team first identified nearly 60 uncertainties, forces, and drivers of change. Winnowing this list down over several roundtable sessions produced two axes of uncertainty: technology – does it add or subtract value to the industry? And market leadership, i.e. who sets the pace for the industry, developed markets (DM) or emerging markets (EM)? These uncertainties are structural and unprecedented. They frame the key question for autos: What will future demand for mobility look like and what technology and infrastructure can enable it?
Best-Positioned and Challenged Companies Against Our Four Judgment Criteria
Technology: VW was the category winner, followed by Toyota, and Johnson Controls.
Global footprint: VW won this category, with a four-way tie for second between BMW, Toyota, GM and Hyundai MOBIS.
Financial strength: VW is the category leader, followed by BMW and Toyota.
Strategic focus. VW completed its sweep, winning this category as well, followed by Hyundai MOBIS and Nissan.
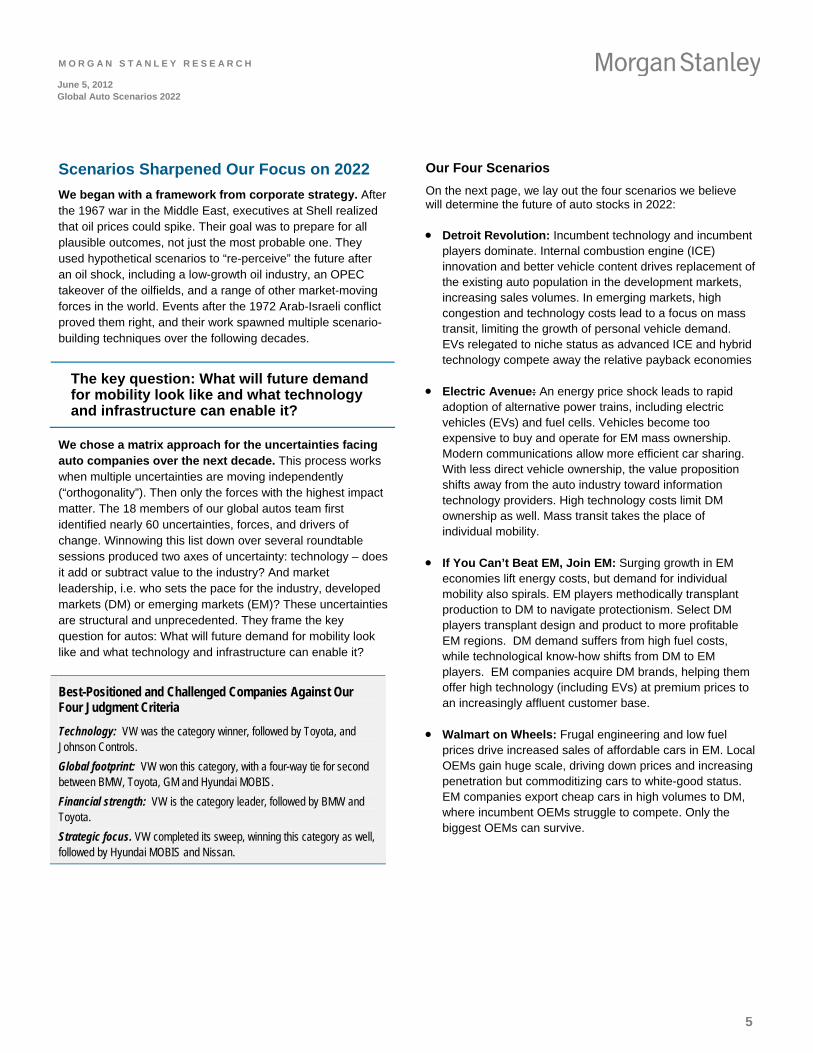
Our Four Scenarios
On the next page, we lay out the four scenarios we believe will determine the future of auto stocks in 2022:
Detroit Revolution: Incumbent technology and incumbent players dominate. Internal combustion engine (ICE) innovation and better vehicle content drives replacement of the existing auto population in the development markets, increasing sales volumes. In emerging markets, high congestion and technology costs lead to a focus on mass transit, limiting the growth of personal vehicle demand. EVs relegated to niche status as advanced ICE and hybrid technology compete away the relative payback economies
Electric Avenue: An energy price shock leads to rapid adoption of alternative power trains, including electric vehicles (EVs) and fuel cells. Vehicles become too expensive to buy and operate for EM mass ownership. Modern communications allow more efficient car sharing. With less direct vehicle ownership, the value proposition shifts away from the auto industry toward information technology providers. High technology costs limit DM ownership as well. Mass transit takes the place of individual mobility.
If You Can’t Beat EM, Join EM: Surging growth in EM economies lift energy costs, but demand for individual mobility also spirals. EM players methodically transplant production to DM to navigate protectionism. Select DM players transplant design and product to more profitable EM regions. DM demand suffers from high fuel costs, while technological know-how shifts from DM to EM players. EM companies acquire DM brands, helping them offer high technology (including EVs) at premium prices to an increasingly affluent customer base.
Walmart on Wheels: Frugal engineering and low fuel prices drive increased sales of affordable cars in EM. Local OEMs gain huge scale, driving down prices and increasing penetration but commoditizing cars to white-good status. EM companies export cheap cars in high volumes to DM, where incumbent OEMs struggle to compete. Only the biggest OEMs can survive.
5
M O R G A N S T A N L E Y R E S E A R C H
June 5, 2012 Global Auto Scenarios 2022
Exhibit 2
Global Autos 2022: Four Possible Futures
Oil shock destroys demand for traditional motors. Huge government support of expensive EVs; battery breakthrough. Most people priced out of the car market
Leadership: DM suppliers and new entrants
Volume and ownership: Much lower volumes, shared ownership. Car prices out of range for EM
Margins and mix: Massive investment in EV and R&D hurts incumbents’ margins. EM has overcapacity, destructive pricing, severe margin pressure
MPG: 100
Tech focus: Battery & infrastructure, fuel cells, lightweight materials
Government: High regulation. Governments drive innovation in propulsion, mass transit
Industry structure: OEMs become assemblers of others’ technology or buy battery companies. Lower miles driven destructive for tire companies & suppliers
Oil price: Spikes to $200 (war, natural disaster); $6-8/gal fuel
Booming EM economies dominate car demand, giving scale to local players. EM OEMs acquire DM brands & technology and transplant production to DM regions
Leadership: OEMs with large EM footprint, global suppliers that follow them
Volume and ownership: EM demand for individual mobility spirals. Volume higher, density increases
Margins and mix: Low margins. Barbell mix: fuel efficient — large/luxury
MPG: 50
Tech focus: Frugal engineering, fuel-efficient smaller cars, manufacturing process, platforms
Government: Limited regulation. EM pushes local presence in manufacturing and R&D
Industry structure: More global alliances. Market share game as pricing pressures increase. More players adopt EM low cost manufacturing
Oil price: Grinding higher; no shock
Low price trumps technology. Content shrinks and autos commoditized as oil prices remain subdued. EM players export to DMs while dominating local markets
Leadership: Large, EM OEMs, new entrants, battery manufacturers
Volume and ownership: World is flooded with smaller, cheaper cars. Volume and density up
Margins and mix: Low for OEMs, high for battery manufacturers. Mix is diverse
MPG: 40
Tech focus: Low cost manufacturing, ICE
Government: Subsidizes cars for masses, regulates safety mix; may impose size requirements
Industry structure: Need for scale drives consolidation. DM powerhouses become niche boutique brands. More M&A in components than OEMs
Oil price: Stays low with new discoveries, sluggish DM economic growth
Innovative ICE technology enables established DM players to thrive and keep their lead. EMs shift to luxury cars at the high end and mass transit for the people
Leadership: DM dominates as auto culture prevails
Volume and ownership: DM volume up modestly, density down. EM volume up, density up slowly
Margins and mix: Margins up. Barbell mix: small/high quality — large/multi-function / loaded
MPG: 60
Tech focus: Efficiency, safety, entertainment, communication. ICE dominates; EV a niche
Government: Limited in DM. Massive in EM: mass transit subsidies, car restrictions, congestion charging
Industry structure: Consolidation in supply base; OEMs pursue alliances
Oil price: Grinding higher; no shock
Source: Morgan Stanley Research
6
M O R G A N S T A N L E Y R E S E A R C H
7
June 5, 2012 Global Auto Scenarios 2022
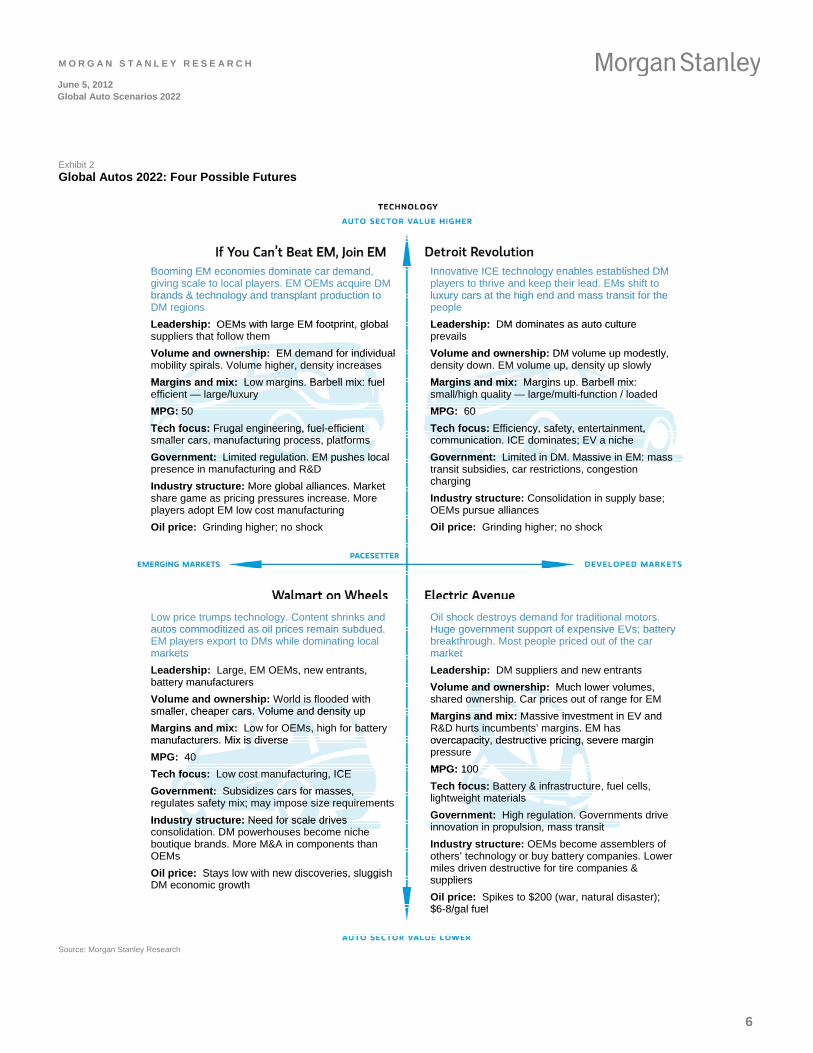
Exhibit 3
Global Autos 2022: Market Share Potential
EM Autos
DM Autos
New Entrants
NewEntrants
DM Autos
EM Autos
EM Autos
DM Autos
New Entrants
New Entrants DM Autos
EM Autos
150100
2012 2022
200
100
2012 2022
25
100
2012 2022
50100
2012 2022
Sector Value
Market Share 2022
Sector Value
Market Share 2022
Sector Value
Market Share 2022
Sector Value
Market Share 2022
EM Autos
DM Autos
New Entrants
NewEntrants
DM Autos
EM Autos
EM Autos
DM Autos
New Entrants
New Entrants DM Autos
EM Autos
150100
2012 2022
200
100
2012 2022
25
100
2012 2022
50100
2012 2022
Sector Value
Market Share 2022
Sector Value
Market Share 2022
Sector Value
Market Share 2022
Sector Value
Market Share 2022
Source: Morgan Stanley Research
M O R G A N S T A N L E Y R E S E A R C H
June 5, 2012 Global Auto Scenarios 2022
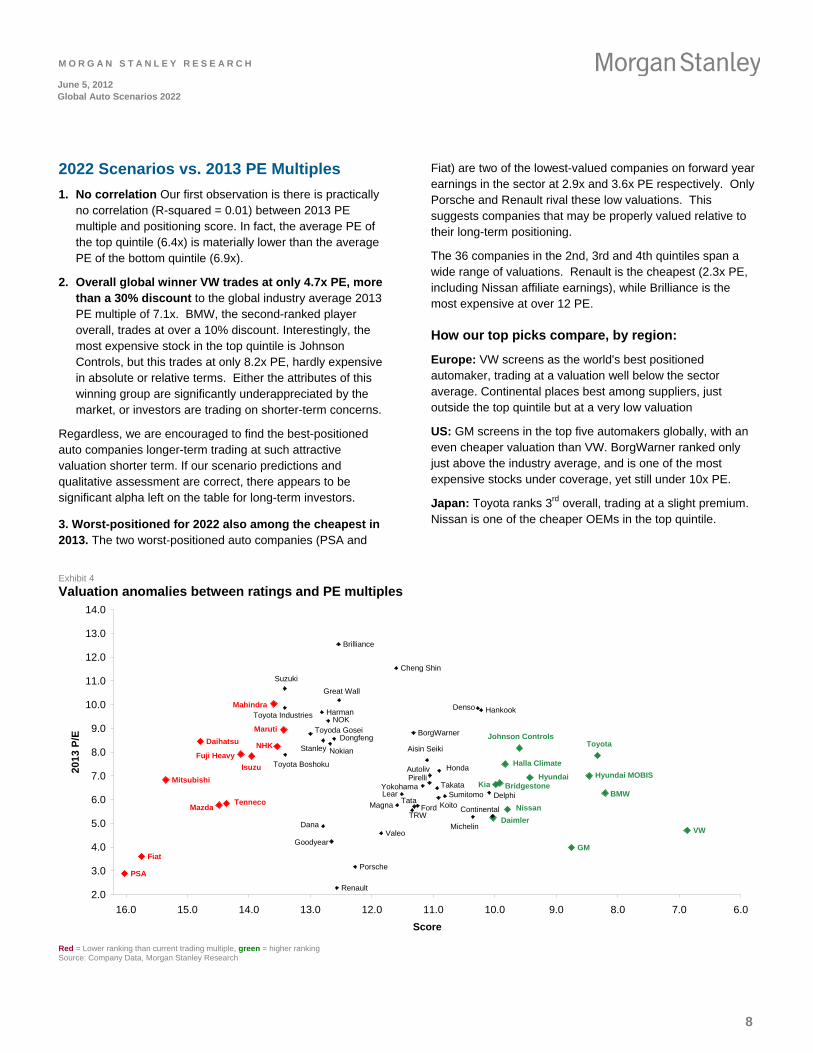
2022 Scenarios vs. 2013 PE Multiples
1. No correlation Our first observation is there is practically no correlation (R-squared = 0.01) between 2013 PE multiple and positioning score. In fact, the average PE of the top quintile (6.4x) is materially lower than the average PE of the bottom quintile (6.9x).
2. Overall global winner VW trades at only 4.7x PE, more than a 30% discount to the global industry average 2013 PE multiple of 7.1x. BMW, the second-ranked player overall, trades at over a 10% discount. Interestingly, the most expensive stock in the top quintile is Johnson Controls, but this trades at only 8.2x PE, hardly expensive in absolute or relative terms. Either the attributes of this winning group are significantly underappreciated by the market, or investors are trading on shorter-term concerns.
Regardless, we are encouraged to find the best-positioned auto companies longer-term trading at such attractive valuation shorter term. If our scenario predictions and qualitative assessment are correct, there appears to be significant alpha left on the table for long-term investors.
3. Worst-positioned for 2022 also among the cheapest in 2013. The two worst-positioned auto companies (PSA and
Fiat) are two of the lowest-valued companies on forward year earnings in the sector at 2.9x and 3.6x PE respectively. Only Porsche and Renault rival these low valuations. This suggests companies that may be properly valued relative to their long-term positioning.
The 36 companies in the 2nd, 3rd and 4th quintiles span a wide range of valuations. Renault is the cheapest (2.3x PE, including Nissan affiliate earnings), while Brilliance is the most expensive at over 12 PE.
How our top picks compare, by region:
Europe: VW screens as the world's best positioned automaker, trading at a valuation well below the sector average. Continental places best among suppliers, just outside the top quintile but at a very low valuation
US: GM screens in the top five automakers globally, with an even cheaper valuation than VW. BorgWarner ranked only just above the industry average, and is one of the most expensive stocks under coverage, yet still under 10x PE.
Japan: Toyota ranks 3rd overall, trading at a slight premium. Nissan is one of the cheaper OEMs in the top quintile.
Exhibit 4
Valuation anomalies between ratings and PE multiples
Yokohama
Valeo
TRW
Toyota Industries
Toyota Boshoku
Toyoda Gosei
Tenneco
NHK
PSA
Mitsubishi
Mazda
Maruti
Mahindra
Isuzu
Fuji Heavy
Fiat
Daihatsu
TakataSumitomo
Stanley
Pirelli
Nokian
NOK
Michelin
Magna
Lear
Koito
Johnson Controls
Hyundai MOBIS
Harman Hankook
Halla Climate
Goodyear
Denso
Delphi
Dana
Continental
Cheng Shin
Bridgestone
BorgWarner
Autoliv
Aisin Seiki
VW
Toyota
Tata
Suzuki
Renault
Porsche
Nissan
KiaHyundai
Honda
Great Wall
GM
Ford
Dongfeng
Daimler
Brilliance
BMW
2.0
3.0
4.0
5.0
6.0
7.0
8.0
9.0
10.0
11.0
12.0
13.0
14.0
6.07.08.09.010.011.012.013.014.015.016.0
Score
201
3 P
/E
Red = Lower ranking than current trading multiple, green = higher ranking Source: Company Data, Morgan Stanley Research
8
M O R G A N S T A N L E Y R E S E A R C H
June 5, 2012 Global Auto Scenarios 2022
South Korea: Kia, Hyundai MOBIS, and Hyundai Motor each made the top quintile with attractive valuations.
China: Great Wall ranks below average while trading at an above average PE.
Ten years may be a longer than typical investment horizon, but it’s a relatively short one in the auto industry. It is less than two automotive product cycles and possibly one engineering cycle for advanced propulsion and global platform development. Most cars being developed today will still be on sale by 2022. Companies must plot a course for the decade ahead, and investors need to evaluate corporates’ preparation and monitor their progress on the journey. We use the axes of technology and market leadership to create narratives about outcomes we view as plausible within a ten-year period.
We offer this framework as “open-source” for investors who may wish to assign their own probabilities and include other global developments and evidence that supports one quadrant vs. another. In theory, macro and industry events within the next 12 months could make any of the four quadrants seem the most likely outcome. Ultimately, we believe this framework can help:
Assess the key growth opportunities and risks for the industry.
Frame events in real time as clues to the industry’s long-term direction.
Consider a 10-year view when valuing companies on a trading multiple or DCF basis. How does current valuation align with a company’s positioning for the long term?
Perform due diligence: Hold companies to a higher standard. Does management get it?
We invite readers to challenge our assumptions, our conclusions, and our company rankings. We hope our long horizon provides a new basis for dialogue on companies’ positioning and valuation. We expect the value of this framework to become clearer as signposts emerge and we measure industry reaction – or better yet, anticipation. Dramatic macro events may make one of our scenarios more topical for discussion and deeper analysis. New evidence may emerge from “off the grid” that forces us to rethink our axes of uncertainty. We aim to follow the lead of experienced investors – maintaining a disciplined approach while keeping an open mind.
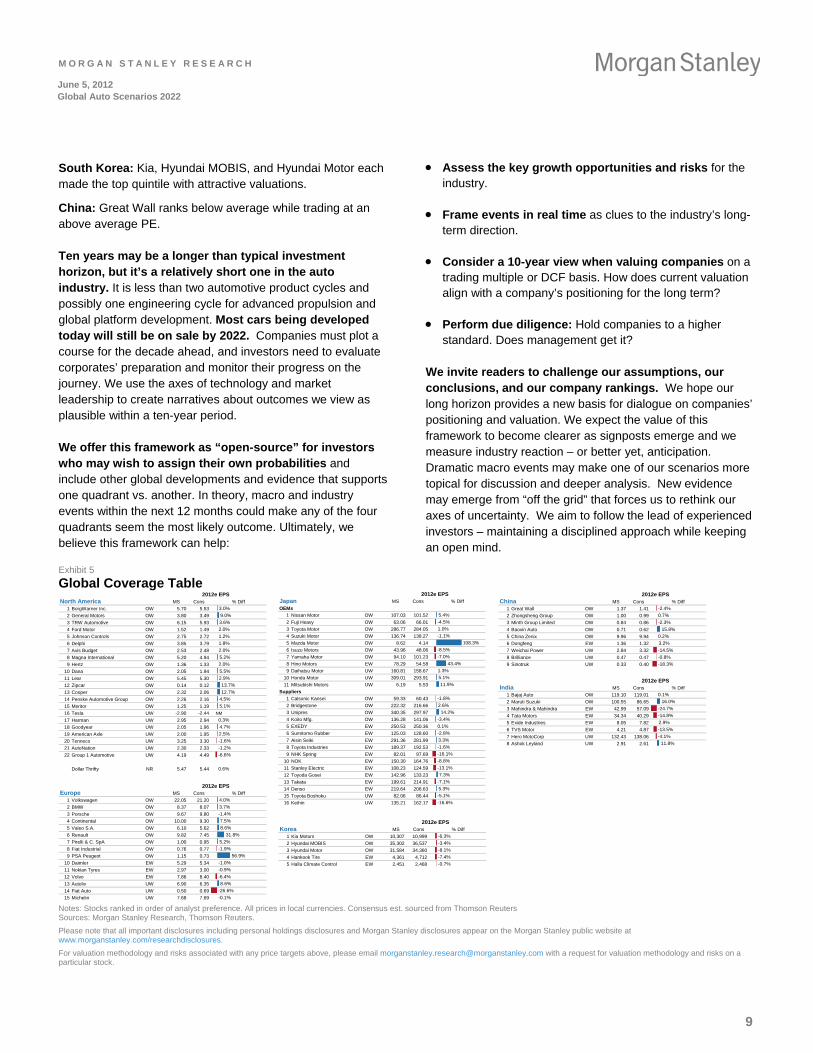
Exhibit 5
Global Coverage Table
2012e EPSMS Cons % Diff
1 Kia Motors OW 10,307 10,999 -6.3%
2 Hyundai MOBIS OW 35,302 36,537 -3.4%
3 Hyundai Motor OW 31,584 34,360 -8.1%
4 Hankook Tire EW 4,361 4,712 -7.4%
5 Halla Climate Control EW 2,451 2,468 -0.7%
Korea
2012e EPSMS Cons % Diff
1 Bajaj Auto OW 119.10 119.01 0.1%
2 Maruti Suzuki OW 100.55 86.65 16.0%
3 Mahindra & Mahindra EW 42.99 57.09 -24.7%
4 Tata Motors EW 34.34 40.29 -14.8%
5 Exide Industries EW 8.05 7.82 2.9%
6 TVS Motor EW 4.21 4.87 -13.5%
7 Hero MotoCorp UW 132.43 138.06 -4.1%
8 Ashok Leyland UW 2.91 2.61 11.8%
India
2012e EPSMS Cons % Diff
1 BorgWarner Inc. OW 5.70 5.53 3.0%
2 General Motors OW 3.80 3.49 9.0%
3 TRW Automotive OW 6.15 5.93 3.6%
4 Ford Motor OW 1.52 1.49 2.0%
5 Johnson Controls OW 2.75 2.72 1.2%
6 Delphi OW 3.85 3.79 1.8%
7 Avis Budget OW 2.53 2.48 2.0%
8 Magna International OW 5.20 4.94 5.2%
9 Hertz OW 1.36 1.33 2.0%
10 Dana OW 2.05 1.94 5.5%
11 Lear OW 5.45 5.30 2.9%
12 Zipcar OW 0.14 0.12 13.7%
13 Cooper OW 2.32 2.06 12.7%
14 Penske Automotive Group OW 2.26 2.16 4.5%
15 Meritor OW 1.25 1.19 5.1%
16 Tesla UW -2.90 -2.44 NM
17 Harman UW 2.95 2.94 0.3%
18 Goodyear UW 2.05 1.96 4.7%
19 American Axle UW 2.00 1.95 2.5%
20 Tenneco UW 3.25 3.30 -1.6%
21 AutoNation UW 2.30 2.33 -1.2%
22 Group 1 Automotive UW 4.19 4.49 -6.6%
Dollar Thrifty NR 5.47 5.44 0.6%
North America
2012e EPSMS Cons % Diff
1 Volkswagen OW 22.05 21.20 4.0%
2 BMW OW 8.37 8.07 3.7%
3 Porsche OW 9.67 9.80 -1.4%
4 Continental OW 10.00 9.30 7.5%
5 Valeo S.A. OW 6.10 5.62 8.6%
6 Renault OW 9.82 7.45 31.8%
7 Pirelli & C. SpA OW 1.00 0.95 5.2%
8 Fiat Industrial OW 0.76 0.77 -1.9%
9 PSA Peugeot OW 1.15 0.73 56.9%
10 Daimler EW 5.29 5.34 -1.0%
11 Nokian Tyres EW 2.97 3.00 -0.9%
12 Volvo EW 7.86 8.40 -6.4%
13 Autoliv UW 6.90 6.35 8.6%
14 Fiat Auto UW 0.50 0.69 -26.6%
15 Michelin UW 7.68 7.69 -0.1%
Europe
2012e EPSMS Cons % Diff
1 Great Wall OW 1.37 1.41 -2.4%
2 Zhongsheng Group OW 1.00 0.99 0.7%
3 Minth Group Limited OW 0.84 0.86 -2.3%
4 Baoxin Auto OW 0.71 0.62 15.8%
5 China Zenix OW 9.96 9.94 0.2%
6 Dongfeng EW 1.36 1.32 3.2%
7 Weichai Power UW 2.84 3.32 -14.5%
8 Brilliance UW 0.47 0.47 -0.8%
9 Sinotruk UW 0.33 0.40 -18.3%
China2012e EPS
MS Cons % Diff
OEMs
1 Nissan Motor OW 107.03 101.52 5.4%
2 Fuji Heavy OW 63.06 66.01 -4.5%
3 Toyota Motor OW 286.77 284.05 1.0%
4 Suzuki Motor OW 136.74 138.27 -1.1%
5 Mazda Motor OW 8.62 4.14 108.3%
6 Isuzu Motors OW 43.96 48.06 -8.5%
7 Yamaha Motor OW 94.10 101.23 -7.0%
8 Hino Motors EW 78.29 54.58 43.4%
9 Daihatsu Motor UW 160.81 158.67 1.3%
10 Honda Motor UW 309.01 293.91 5.1%
11 Mitsubishi Motors UW 6.19 5.53 11.9%
Suppliers
1 Calsonic Kansei OW 59.33 60.43 -1.8%
2 Bridgestone OW 222.32 216.66 2.6%
3 Unipres OW 340.35 297.97 14.2%
4 Koito Mfg. OW 136.28 141.06 -3.4%
5 EXEDY EW 250.53 250.36 0.1%
6 Sumitomo Rubber EW 125.03 128.60 -2.8%
7 Aisin Seiki EW 291.36 281.99 3.3%
8 Toyota Industries EW 189.37 192.53 -1.6%
9 NHK Spring EW 82.01 97.69 -16.1%
10 NOK EW 150.30 164.76 -8.8%
11 Stanley Electric EW 108.23 124.59 -13.1%
12 Toyoda Gosei EW 142.96 133.23 7.3%
13 Takata EW 199.61 214.91 -7.1%
14 Denso EW 219.64 208.63 5.3%
15 Toyota Boshoku UW 82.06 86.44 -5.1%
16 Keihin UW 135.21 162.17 -16.6%
Japan
Notes: Stocks ranked in order of analyst preference. All prices in local currencies. Consensus est. sourced from Thomson Reuters Sources: Morgan Stanley Research, Thomson Reuters.
Please note that all important disclosures including personal holdings disclosures and Morgan Stanley disclosures appear on the Morgan Stanley public website at www.morganstanley.com/researchdisclosures.
For valuation methodology and risks associated with any price targets above, please email [email protected] with a request for valuation methodology and risks on a particular stock.
9
M O R G A N S T A N L E Y R E S E A R C H
June 5, 2012 Global Auto Scenarios 2022
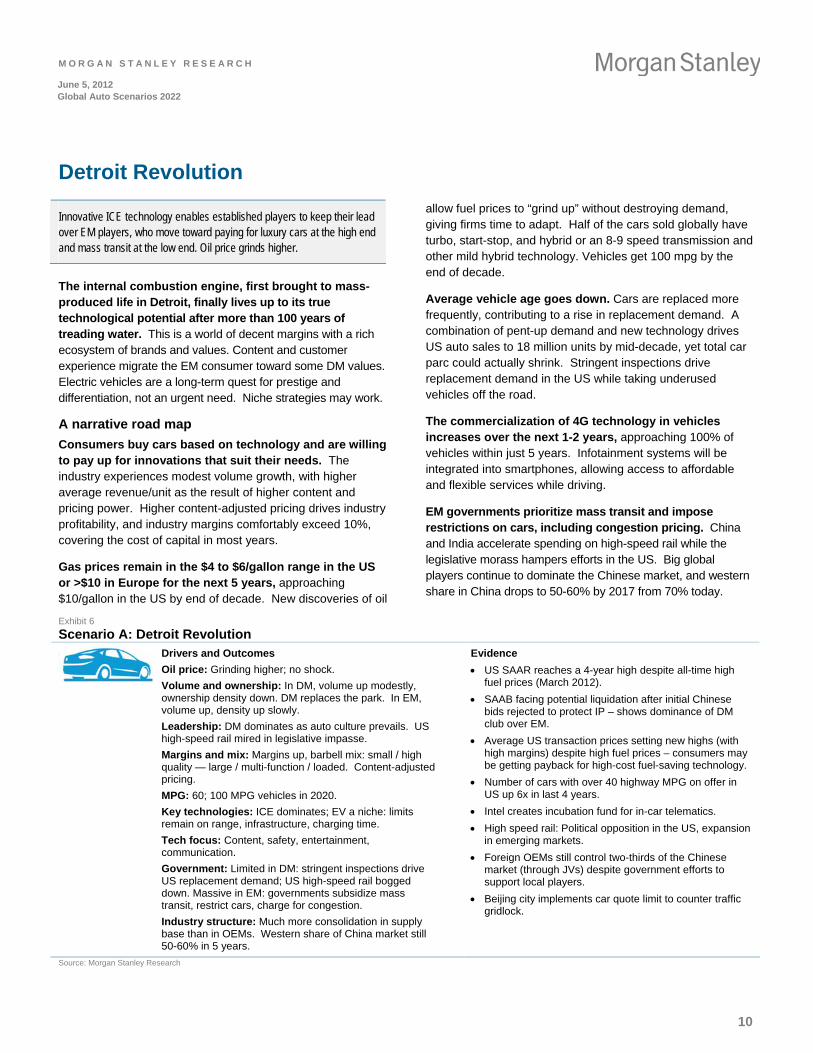
Detroit Revolution
Innovative ICE technology enables established players to keep their lead over EM players, who move toward paying for luxury cars at the high end and mass transit at the low end. Oil price grinds higher.
The internal combustion engine, first brought to mass-produced life in Detroit, finally lives up to its true technological potential after more than 100 years of treading water. This is a world of decent margins with a rich ecosystem of brands and values. Content and customer experience migrate the EM consumer toward some DM values. Electric vehicles are a long-term quest for prestige and differentiation, not an urgent need. Niche strategies may work.
A narrative road map
Consumers buy cars based on technology and are willing to pay up for innovations that suit their needs. The industry experiences modest volume growth, with higher average revenue/unit as the result of higher content and pricing power. Higher content-adjusted pricing drives industry profitability, and industry margins comfortably exceed 10%, covering the cost of capital in most years.
Gas prices remain in the $4 to $6/gallon range in the US or >$10 in Europe for the next 5 years, approaching $10/gallon in the US by end of decade. New discoveries of oil
allow fuel prices to “grind up” without destroying demand, giving firms time to adapt. Half of the cars sold globally have turbo, start-stop, and hybrid or an 8-9 speed transmission and other mild hybrid technology. Vehicles get 100 mpg by the end of decade.
Average vehicle age goes down. Cars are replaced more frequently, contributing to a rise in replacement demand. A combination of pent-up demand and new technology drives US auto sales to 18 million units by mid-decade, yet total car parc could actually shrink. Stringent inspections drive replacement demand in the US while taking underused vehicles off the road.
The commercialization of 4G technology in vehicles increases over the next 1-2 years, approaching 100% of vehicles within just 5 years. Infotainment systems will be integrated into smartphones, allowing access to affordable and flexible services while driving.
EM governments prioritize mass transit and impose restrictions on cars, including congestion pricing. China and India accelerate spending on high-speed rail while the legislative morass hampers efforts in the US. Big global players continue to dominate the Chinese market, and western share in China drops to 50-60% by 2017 from 70% today.
Exhibit 6
Scenario A: Detroit Revolution Drivers and Outcomes
Oil price: Grinding higher; no shock.
Volume and ownership: In DM, volume up modestly, ownership density down. DM replaces the park. In EM, volume up, density up slowly.
Leadership: DM dominates as auto culture prevails. US high-speed rail mired in legislative impasse.
Margins and mix: Margins up, barbell mix: small / high quality — large / multi-function / loaded. Content-adjusted pricing.
MPG: 60; 100 MPG vehicles in 2020.
Key technologies: ICE dominates; EV a niche: limits remain on range, infrastructure, charging time.
Tech focus: Content, safety, entertainment, communication.
Government: Limited in DM: stringent inspections drive US replacement demand; US high-speed rail bogged down. Massive in EM: governments subsidize mass transit, restrict cars, charge for congestion.
Industry structure: Much more consolidation in supply base than in OEMs. Western share of China market still 50-60% in 5 years.
Evidence
US SAAR reaches a 4-year high despite all-time high fuel prices (March 2012).
SAAB facing potential liquidation after initial Chinese bids rejected to protect IP – shows dominance of DM club over EM.
Average US transaction prices setting new highs (with high margins) despite high fuel prices – consumers may be getting payback for high-cost fuel-saving technology.
Number of cars with over 40 highway MPG on offer in US up 6x in last 4 years.
Intel creates incubation fund for in-car telematics.
High speed rail: Political opposition in the US, expansion in emerging markets.
Foreign OEMs still control two-thirds of the Chinese market (through JVs) despite government efforts to support local players.
Beijing city implements car quote limit to counter traffic gridlock.
Source: Morgan Stanley Research
10
M O R G A N S T A N L E Y R E S E A R C H
June 5, 2012 Global Auto Scenarios 2022
Scenario Surprises
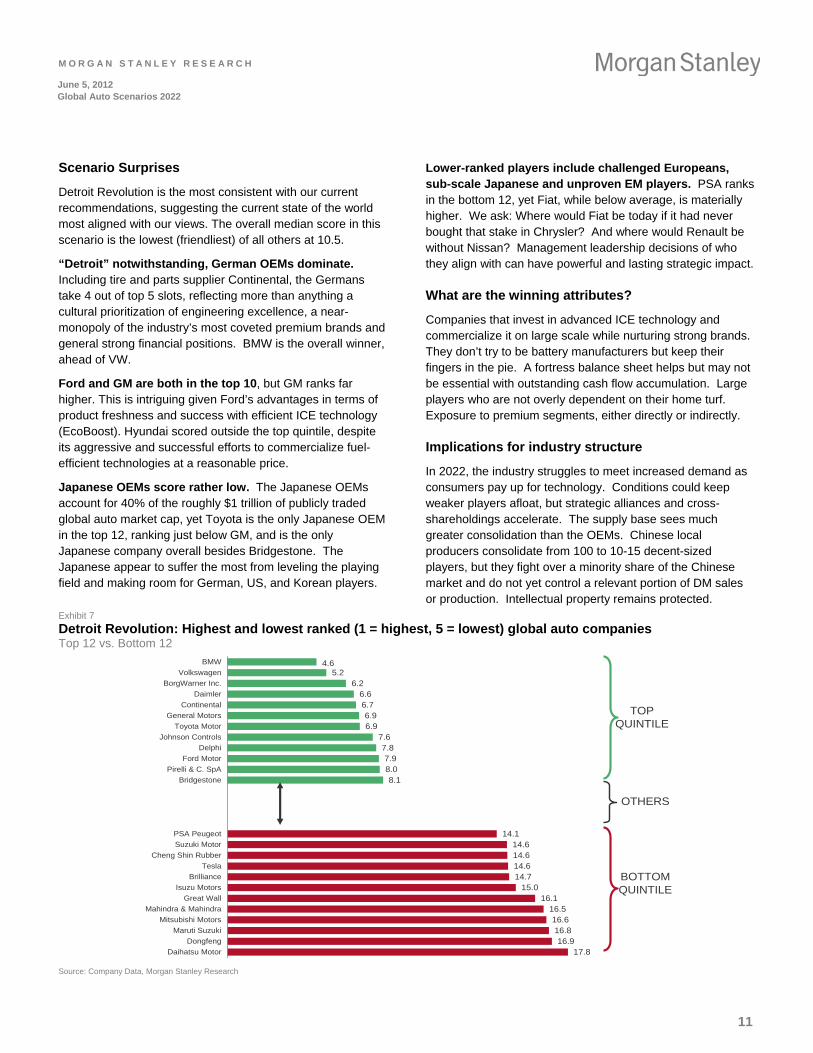
Detroit Revolution is the most consistent with our current recommendations, suggesting the current state of the world most aligned with our views. The overall median score in this scenario is the lowest (friendliest) of all others at 10.5.
“Detroit” notwithstanding, German OEMs dominate. Including tire and parts supplier Continental, the Germans take 4 out of top 5 slots, reflecting more than anything a cultural prioritization of engineering excellence, a near-monopoly of the industry’s most coveted premium brands and general strong financial positions. BMW is the overall winner, ahead of VW.
Ford and GM are both in the top 10, but GM ranks far higher. This is intriguing given Ford’s advantages in terms of product freshness and success with efficient ICE technology (EcoBoost). Hyundai scored outside the top quintile, despite its aggressive and successful efforts to commercialize fuel-efficient technologies at a reasonable price.
Japanese OEMs score rather low. The Japanese OEMs account for 40% of the roughly $1 trillion of publicly traded global auto market cap, yet Toyota is the only Japanese OEM in the top 12, ranking just below GM, and is the only Japanese company overall besides Bridgestone. The Japanese appear to suffer the most from leveling the playing field and making room for German, US, and Korean players.
Lower-ranked players include challenged Europeans, sub-scale Japanese and unproven EM players. PSA ranks in the bottom 12, yet Fiat, while below average, is materially higher. We ask: Where would Fiat be today if it had never bought that stake in Chrysler? And where would Renault be without Nissan? Management leadership decisions of who they align with can have powerful and lasting strategic impact.
What are the winning attributes?
Companies that invest in advanced ICE technology and commercialize it on large scale while nurturing strong brands. They don’t try to be battery manufacturers but keep their fingers in the pie. A fortress balance sheet helps but may not be essential with outstanding cash flow accumulation. Large players who are not overly dependent on their home turf. Exposure to premium segments, either directly or indirectly.
Implications for industry structure
In 2022, the industry struggles to meet increased demand as consumers pay up for technology. Conditions could keep weaker players afloat, but strategic alliances and cross-shareholdings accelerate. The supply base sees much greater consolidation than the OEMs. Chinese local producers consolidate from 100 to 10-15 decent-sized players, but they fight over a minority share of the Chinese market and do not yet control a relevant portion of DM sales or production. Intellectual property remains protected.
Exhibit 7
Detroit Revolution: Highest and lowest ranked (1 = highest, 5 = lowest) global auto companies Top 12 vs. Bottom 12
4.65.2
6.26.66.76.96.9
7.67.87.98.08.1
14.114.614.614.614.7
15.016.1
16.516.616.816.9
17.8
BMW
Volkswagen
BorgWarner Inc.
Daimler
Continental
General Motors
Toyota Motor
Johnson Controls
Delphi
Ford Motor
Pirelli & C. SpA
Bridgestone
PSA Peugeot
Suzuki Motor
Cheng Shin Rubber
Tesla
Brilliance
Isuzu Motors
Great Wall
Mahindra & Mahindra
Mitsubishi Motors
Maruti Suzuki
Dongfeng
Daihatsu Motor
TOP QUINTILE
OTHERS
BOTTOM QUINTILE
Source: Company Data, Morgan Stanley Research
11
M O R G A N S T A N L E Y R E S E A R C H
June 5, 2012 Global Auto Scenarios 2022
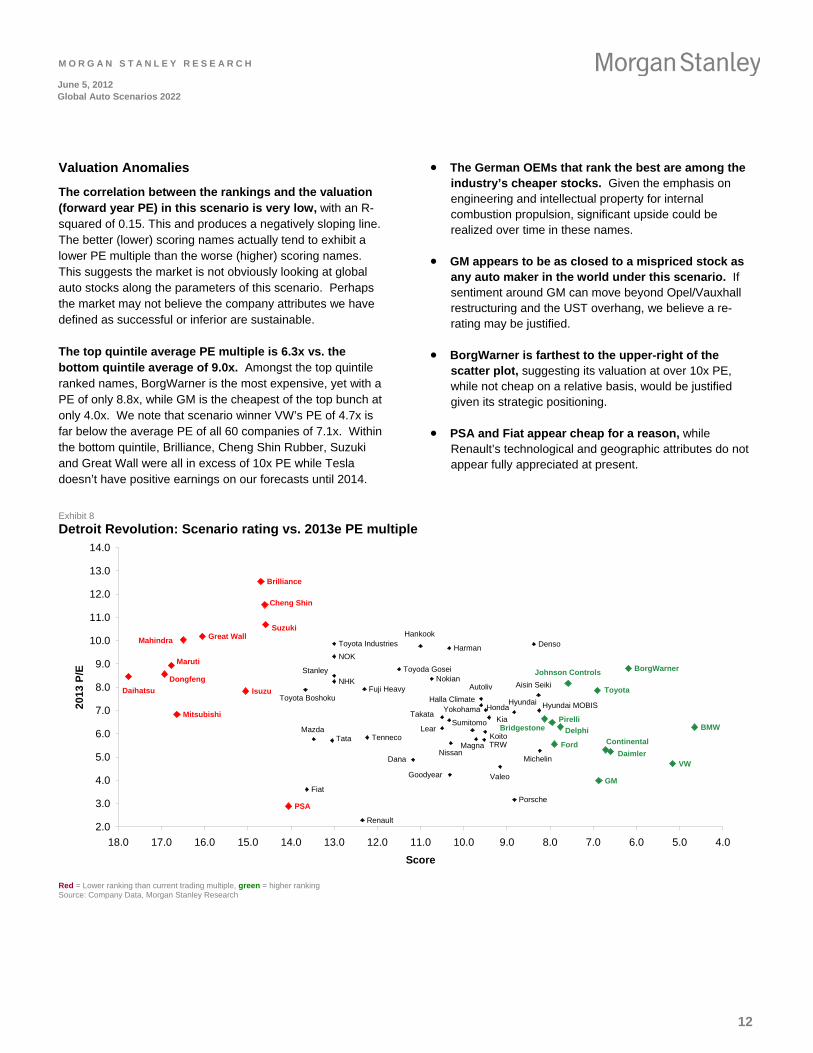
Valuation Anomalies
The correlation between the rankings and the valuation (forward year PE) in this scenario is very low, with an R-squared of 0.15. This and produces a negatively sloping line. The better (lower) scoring names actually tend to exhibit a lower PE multiple than the worse (higher) scoring names. This suggests the market is not obviously looking at global auto stocks along the parameters of this scenario. Perhaps the market may not believe the company attributes we have defined as successful or inferior are sustainable.
The top quintile average PE multiple is 6.3x vs. the bottom quintile average of 9.0x. Amongst the top quintile ranked names, BorgWarner is the most expensive, yet with a PE of only 8.8x, while GM is the cheapest of the top bunch at only 4.0x. We note that scenario winner VW’s PE of 4.7x is far below the average PE of all 60 companies of 7.1x. Within the bottom quintile, Brilliance, Cheng Shin Rubber, Suzuki and Great Wall were all in excess of 10x PE while Tesla doesn’t have positive earnings on our forecasts until 2014.
The German OEMs that rank the best are among the industry’s cheaper stocks. Given the emphasis on engineering and intellectual property for internal combustion propulsion, significant upside could be realized over time in these names.
GM appears to be as closed to a mispriced stock as any auto maker in the world under this scenario. If sentiment around GM can move beyond Opel/Vauxhall restructuring and the UST overhang, we believe a re-rating may be justified.
BorgWarner is farthest to the upper-right of the scatter plot, suggesting its valuation at over 10x PE, while not cheap on a relative basis, would be justified given its strategic positioning.
PSA and Fiat appear cheap for a reason, while Renault’s technological and geographic attributes do not appear fully appreciated at present.
Exhibit 8
Detroit Revolution: Scenario rating vs. 2013e PE multiple
BMW
Brilliance
Daihatsu
Dongfeng
Great Wall
Isuzu
Mahindra
Maruti
Mitsubishi
PSA
Suzuki
Cheng Shin
Daimler
Fiat
Ford
Fuji Heavy
GM
HondaHyundai
KiaMazda
Nissan
Porsche
Renault
Tata
Toyota
VW
Aisin SeikiAutoliv
BorgWarner
Bridgestone
Continental
Dana
Delphi
Denso
Goodyear
Halla Climate
Hankook
Harman
Hyundai MOBIS
Johnson Controls
KoitoLear
Magna
Michelin
NHK
NOK
Nokian
Pirelli
Stanley
SumitomoTakata
Tenneco
Toyoda Gosei
Toyota Boshoku
Toyota Industries
TRW
Valeo
Yokohama
2.0
3.0
4.0
5.0
6.0
7.0
8.0
9.0
10.0
11.0
12.0
13.0
14.0
4.05.06.07.08.09.010.011.012.013.014.015.016.017.018.0
Score
201
3 P
/E
Red = Lower ranking than current trading multiple, green = higher ranking Source: Company Data, Morgan Stanley Research
12
M O R G A N S T A N L E Y R E S E A R C H
June 5, 2012 Global Auto Scenarios 2022
Electric Avenue
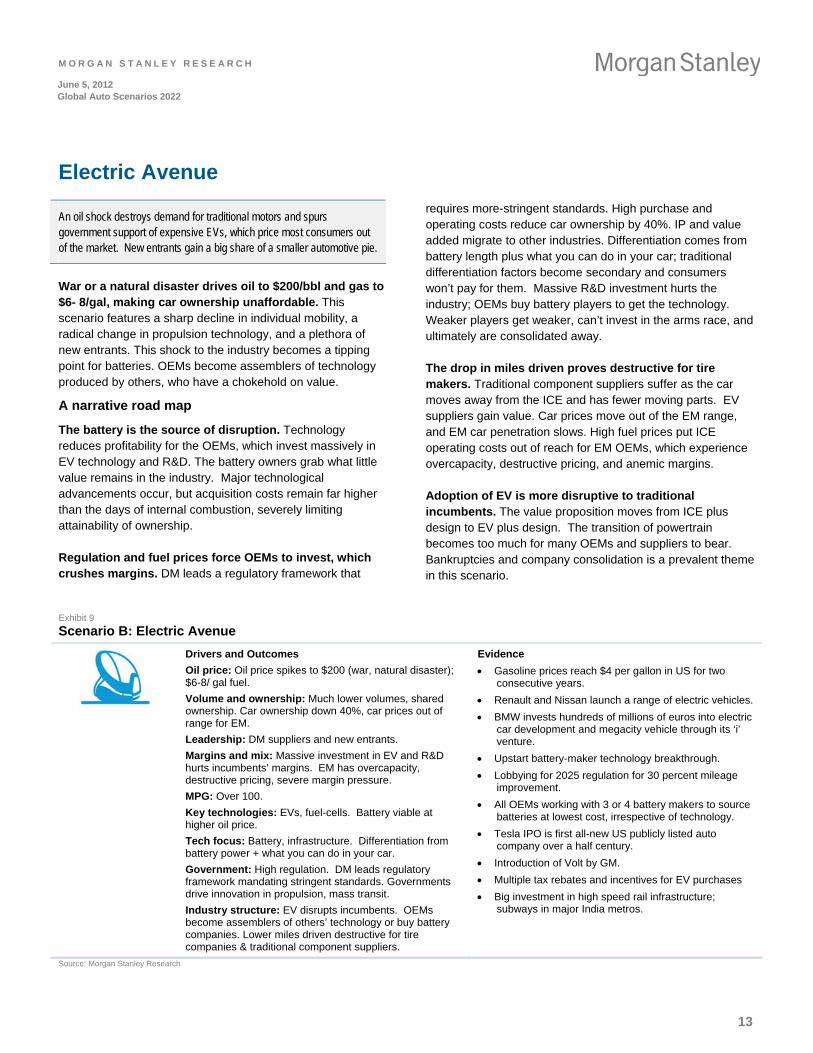
An oil shock destroys demand for traditional motors and spurs government support of expensive EVs, which price most consumers out of the market. New entrants gain a big share of a smaller automotive pie.
War or a natural disaster drives oil to $200/bbl and gas to $6- 8/gal, making car ownership unaffordable. This scenario features a sharp decline in individual mobility, a radical change in propulsion technology, and a plethora of new entrants. This shock to the industry becomes a tipping point for batteries. OEMs become assemblers of technology produced by others, who have a chokehold on value.
A narrative road map
The battery is the source of disruption. Technology reduces profitability for the OEMs, which invest massively in EV technology and R&D. The battery owners grab what little value remains in the industry. Major technological advancements occur, but acquisition costs remain far higher than the days of internal combustion, severely limiting attainability of ownership.
Regulation and fuel prices force OEMs to invest, which crushes margins. DM leads a regulatory framework that
requires more-stringent standards. High purchase and operating costs reduce car ownership by 40%. IP and value added migrate to other industries. Differentiation comes from battery length plus what you can do in your car; traditional differentiation factors become secondary and consumers won’t pay for them. Massive R&D investment hurts the industry; OEMs buy battery players to get the technology. Weaker players get weaker, can’t invest in the arms race, and ultimately are consolidated away.
The drop in miles driven proves destructive for tire makers. Traditional component suppliers suffer as the car moves away from the ICE and has fewer moving parts. EV suppliers gain value. Car prices move out of the EM range, and EM car penetration slows. High fuel prices put ICE operating costs out of reach for EM OEMs, which experience overcapacity, destructive pricing, and anemic margins.
Adoption of EV is more disruptive to traditional incumbents. The value proposition moves from ICE plus design to EV plus design. The transition of powertrain becomes too much for many OEMs and suppliers to bear. Bankruptcies and company consolidation is a prevalent theme in this scenario.
Exhibit 9
Scenario B: Electric Avenue
Drivers and Outcomes
Oil price: Oil price spikes to $200 (war, natural disaster); $6-8/ gal fuel.
Volume and ownership: Much lower volumes, shared ownership. Car ownership down 40%, car prices out of range for EM.
Leadership: DM suppliers and new entrants.
Margins and mix: Massive investment in EV and R&D hurts incumbents’ margins. EM has overcapacity, destructive pricing, severe margin pressure.
MPG: Over 100.
Key technologies: EVs, fuel-cells. Battery viable at higher oil price.
Tech focus: Battery, infrastructure. Differentiation from battery power + what you can do in your car.
Government: High regulation. DM leads regulatory framework mandating stringent standards. Governments drive innovation in propulsion, mass transit.
Industry structure: EV disrupts incumbents. OEMs become assemblers of others’ technology or buy battery companies. Lower miles driven destructive for tire companies & traditional component suppliers.
Evidence
Gasoline prices reach $4 per gallon in US for two consecutive years.
Renault and Nissan launch a range of electric vehicles.
BMW invests hundreds of millions of euros into electric car development and megacity vehicle through its ‘i’ venture.
Upstart battery-maker technology breakthrough.
Lobbying for 2025 regulation for 30 percent mileage improvement.
All OEMs working with 3 or 4 battery makers to source batteries at lowest cost, irrespective of technology.
Tesla IPO is first all-new US publicly listed auto company over a half century.
Introduction of Volt by GM.
Multiple tax rebates and incentives for EV purchases
Big investment in high speed rail infrastructure; subways in major India metros.
Source: Morgan Stanley Research
13
M O R G A N S T A N L E Y R E S E A R C H
June 5, 2012 Global Auto Scenarios 2022
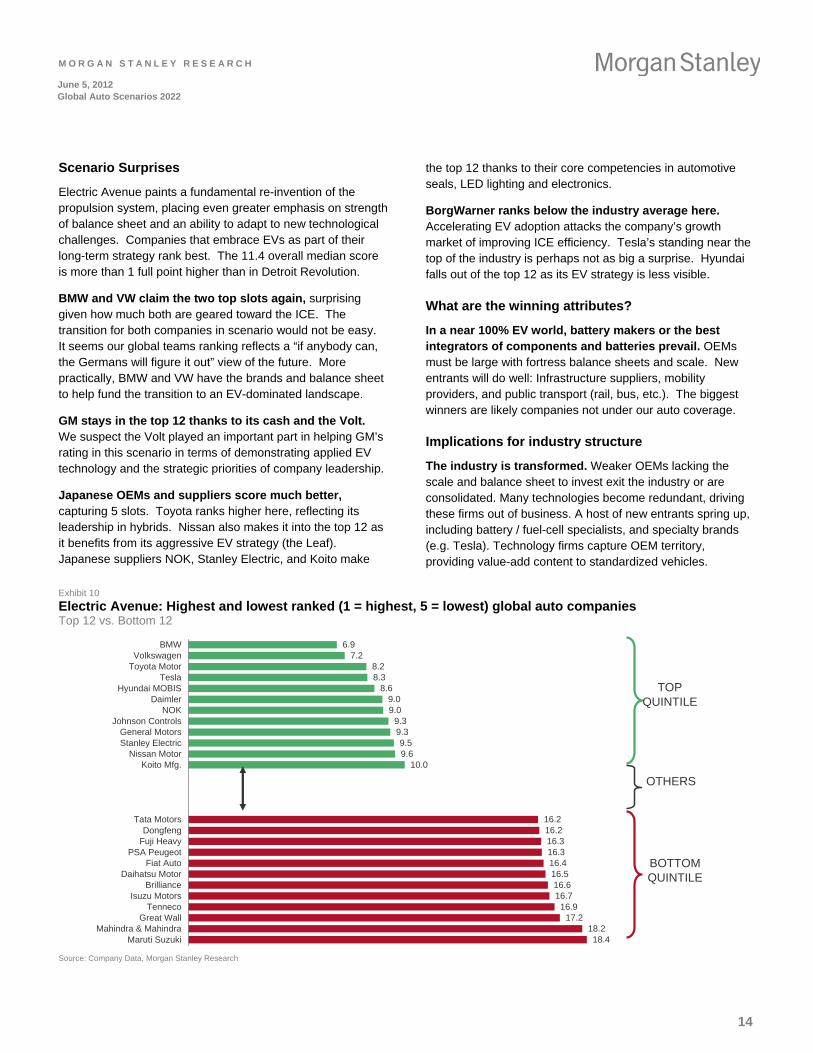
Scenario Surprises
Electric Avenue paints a fundamental re-invention of the propulsion system, placing even greater emphasis on strength of balance sheet and an ability to adapt to new technological challenges. Companies that embrace EVs as part of their long-term strategy rank best. The 11.4 overall median score is more than 1 full point higher than in Detroit Revolution.
BMW and VW claim the two top slots again, surprising given how much both are geared toward the ICE. The transition for both companies in scenario would not be easy. It seems our global teams ranking reflects a “if anybody can, the Germans will figure it out” view of the future. More practically, BMW and VW have the brands and balance sheet to help fund the transition to an EV-dominated landscape.
GM stays in the top 12 thanks to its cash and the Volt. We suspect the Volt played an important part in helping GM’s rating in this scenario in terms of demonstrating applied EV technology and the strategic priorities of company leadership.
Japanese OEMs and suppliers score much better, capturing 5 slots. Toyota ranks higher here, reflecting its leadership in hybrids. Nissan also makes it into the top 12 as it benefits from its aggressive EV strategy (the Leaf). Japanese suppliers NOK, Stanley Electric, and Koito make
the top 12 thanks to their core competencies in automotive seals, LED lighting and electronics.
BorgWarner ranks below the industry average here. Accelerating EV adoption attacks the company’s growth market of improving ICE efficiency. Tesla’s standing near the top of the industry is perhaps not as big a surprise. Hyundai falls out of the top 12 as its EV strategy is less visible.
What are the winning attributes?
In a near 100% EV world, battery makers or the best integrators of components and batteries prevail. OEMs must be large with fortress balance sheets and scale. New entrants will do well: Infrastructure suppliers, mobility providers, and public transport (rail, bus, etc.). The biggest winners are likely companies not under our auto coverage.
Implications for industry structure
The industry is transformed. Weaker OEMs lacking the scale and balance sheet to invest exit the industry or are consolidated. Many technologies become redundant, driving these firms out of business. A host of new entrants spring up, including battery / fuel-cell specialists, and specialty brands (e.g. Tesla). Technology firms capture OEM territory, providing value-add content to standardized vehicles.
Exhibit 10
Electric Avenue: Highest and lowest ranked (1 = highest, 5 = lowest) global auto companies Top 12 vs. Bottom 12
6.97.2
8.28.3
8.69.09.0
9.39.39.59.6
10.0
16.216.216.316.316.416.516.616.7
16.917.2
18.218.4
BMWVolkswagen
Toyota MotorTesla
Hyundai MOBISDaimler
NOKJohnson Controls
General MotorsStanley Electric
Nissan MotorKoito Mfg.
Tata MotorsDongfeng
Fuji HeavyPSA Peugeot
Fiat AutoDaihatsu Motor
BrillianceIsuzu Motors
TennecoGreat Wall
Mahindra & MahindraMaruti Suzuki
TOP QUINTILE
OTHERS
BOTTOM QUINTILE
Source: Company Data, Morgan Stanley Research
14
M O R G A N S T A N L E Y R E S E A R C H
June 5, 2012 Global Auto Scenarios 2022
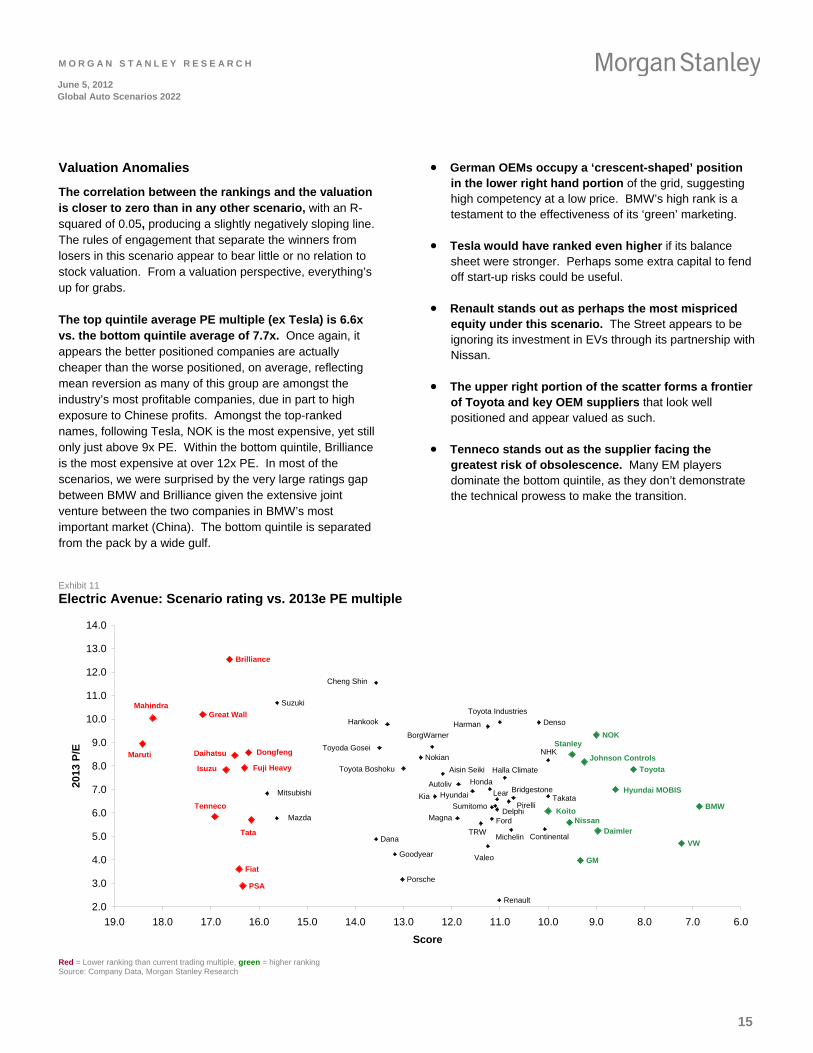
Valuation Anomalies
The correlation between the rankings and the valuation is closer to zero than in any other scenario, with an R-squared of 0.05, producing a slightly negatively sloping line. The rules of engagement that separate the winners from losers in this scenario appear to bear little or no relation to stock valuation. From a valuation perspective, everything’s up for grabs.
The top quintile average PE multiple (ex Tesla) is 6.6x vs. the bottom quintile average of 7.7x. Once again, it appears the better positioned companies are actually cheaper than the worse positioned, on average, reflecting mean reversion as many of this group are amongst the industry’s most profitable companies, due in part to high exposure to Chinese profits. Amongst the top-ranked names, following Tesla, NOK is the most expensive, yet still only just above 9x PE. Within the bottom quintile, Brilliance is the most expensive at over 12x PE. In most of the scenarios, we were surprised by the very large ratings gap between BMW and Brilliance given the extensive joint venture between the two companies in BMW’s most important market (China). The bottom quintile is separated from the pack by a wide gulf.
German OEMs occupy a ‘crescent-shaped’ position in the lower right hand portion of the grid, suggesting high competency at a low price. BMW’s high rank is a testament to the effectiveness of its ‘green’ marketing.
Tesla would have ranked even higher if its balance sheet were stronger. Perhaps some extra capital to fend off start-up risks could be useful.
Renault stands out as perhaps the most mispriced equity under this scenario. The Street appears to be ignoring its investment in EVs through its partnership with Nissan.
The upper right portion of the scatter forms a frontier of Toyota and key OEM suppliers that look well positioned and appear valued as such.
Tenneco stands out as the supplier facing the greatest risk of obsolescence. Many EM players dominate the bottom quintile, as they don’t demonstrate the technical prowess to make the transition.
Exhibit 11
Electric Avenue: Scenario rating vs. 2013e PE multiple
BMW
Brilliance
Daihatsu Dongfeng
Fiat
Fuji Heavy
Great Wall
Isuzu
Mahindra
Maruti
PSA
Tata
Tenneco
DaimlerFord
GM
Honda
HyundaiKia
Mazda
Mitsubishi
Nissan
Porsche
Renault
Suzuki
Toyota
VW
Aisin Seiki
Autoliv
BorgWarner
Bridgestone
Cheng Shin
ContinentalDana
Delphi
Denso
Goodyear
Halla Climate
Hankook Harman
Hyundai MOBIS
Johnson Controls
Koito
Lear
Magna
Michelin
NHK
NOK
Nokian
Pirelli
Stanley
SumitomoTakata
Toyoda Gosei
Toyota Boshoku
Toyota Industries
TRW
Valeo
2.0
3.0
4.0
5.0
6.0
7.0
8.0
9.0
10.0
11.0
12.0
13.0
14.0
6.07.08.09.010.011.012.013.014.015.016.017.018.019.0
Score
201
3 P
/E
Red = Lower ranking than current trading multiple, green = higher ranking Source: Company Data, Morgan Stanley Research
15
M O R G A N S T A N L E Y R E S E A R C H
June 5, 2012 Global Auto Scenarios 2022
If You Can’t Beat EM, Join EM
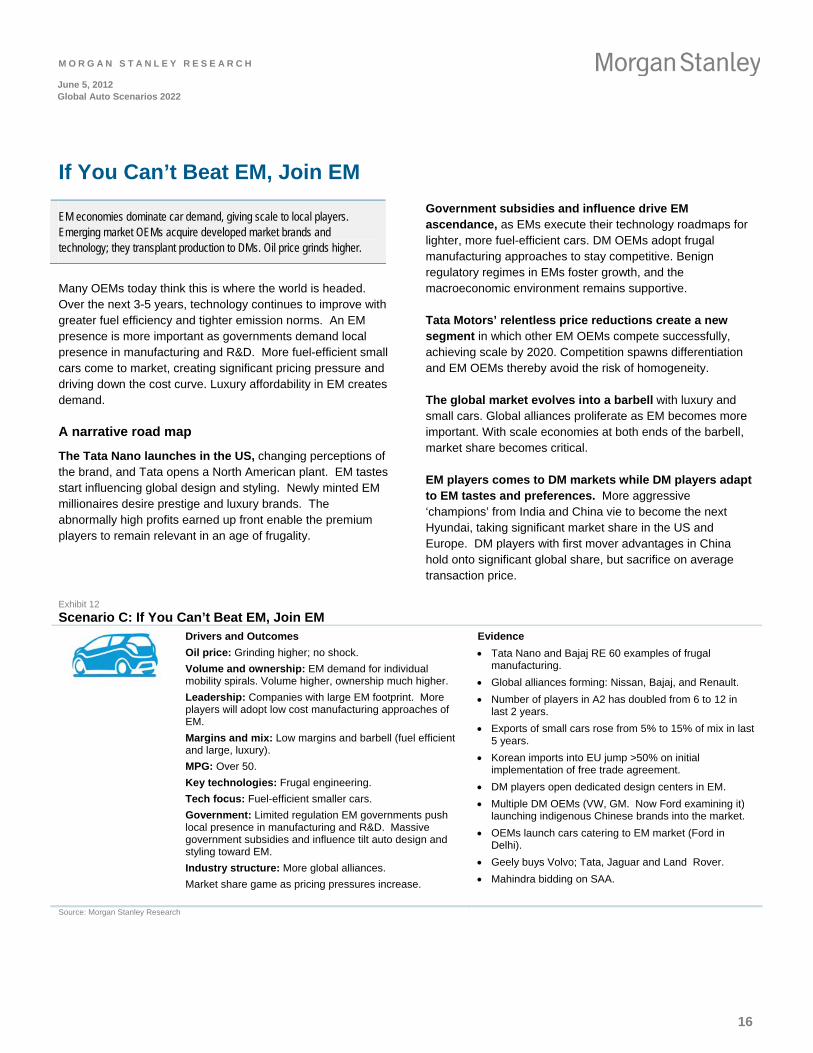
EM economies dominate car demand, giving scale to local players. Emerging market OEMs acquire developed market brands and technology; they transplant production to DMs. Oil price grinds higher.
Many OEMs today think this is where the world is headed. Over the next 3-5 years, technology continues to improve with greater fuel efficiency and tighter emission norms. An EM presence is more important as governments demand local presence in manufacturing and R&D. More fuel-efficient small cars come to market, creating significant pricing pressure and driving down the cost curve. Luxury affordability in EM creates demand.
A narrative road map
The Tata Nano launches in the US, changing perceptions of the brand, and Tata opens a North American plant. EM tastes start influencing global design and styling. Newly minted EM millionaires desire prestige and luxury brands. The abnormally high profits earned up front enable the premium players to remain relevant in an age of frugality.
Government subsidies and influence drive EM ascendance, as EMs execute their technology roadmaps for lighter, more fuel-efficient cars. DM OEMs adopt frugal manufacturing approaches to stay competitive. Benign regulatory regimes in EMs foster growth, and the macroeconomic environment remains supportive.
Tata Motors’ relentless price reductions create a new segment in which other EM OEMs compete successfully, achieving scale by 2020. Competition spawns differentiation and EM OEMs thereby avoid the risk of homogeneity.
The global market evolves into a barbell with luxury and small cars. Global alliances proliferate as EM becomes more important. With scale economies at both ends of the barbell, market share becomes critical.
EM players comes to DM markets while DM players adapt to EM tastes and preferences. More aggressive ‘champions’ from India and China vie to become the next Hyundai, taking significant market share in the US and Europe. DM players with first mover advantages in China hold onto significant global share, but sacrifice on average transaction price.
Exhibit 12
Scenario C: If You Can’t Beat EM, Join EM
Drivers and Outcomes
Oil price: Grinding higher; no shock.
Volume and ownership: EM demand for individual mobility spirals. Volume higher, ownership much higher.
Leadership: Companies with large EM footprint. More players will adopt low cost manufacturing approaches of EM.
Margins and mix: Low margins and barbell (fuel efficient and large, luxury).
MPG: Over 50.
Key technologies: Frugal engineering.
Tech focus: Fuel-efficient smaller cars.
Government: Limited regulation EM governments push local presence in manufacturing and R&D. Massive government subsidies and influence tilt auto design and styling toward EM.
Industry structure: More global alliances.
Market share game as pricing pressures increase.
Evidence
Tata Nano and Bajaj RE 60 examples of frugal manufacturing.
Global alliances forming: Nissan, Bajaj, and Renault.
Number of players in A2 has doubled from 6 to 12 in last 2 years.
Exports of small cars rose from 5% to 15% of mix in last 5 years.
Korean imports into EU jump >50% on initial implementation of free trade agreement.
DM players open dedicated design centers in EM.
Multiple DM OEMs (VW, GM. Now Ford examining it) launching indigenous Chinese brands into the market.
OEMs launch cars catering to EM market (Ford in Delhi).
Geely buys Volvo; Tata, Jaguar and Land Rover.
Mahindra bidding on SAA.
Source: Morgan Stanley Research
16
M O R G A N S T A N L E Y R E S E A R C H
June 5, 2012 Global Auto Scenarios 2022
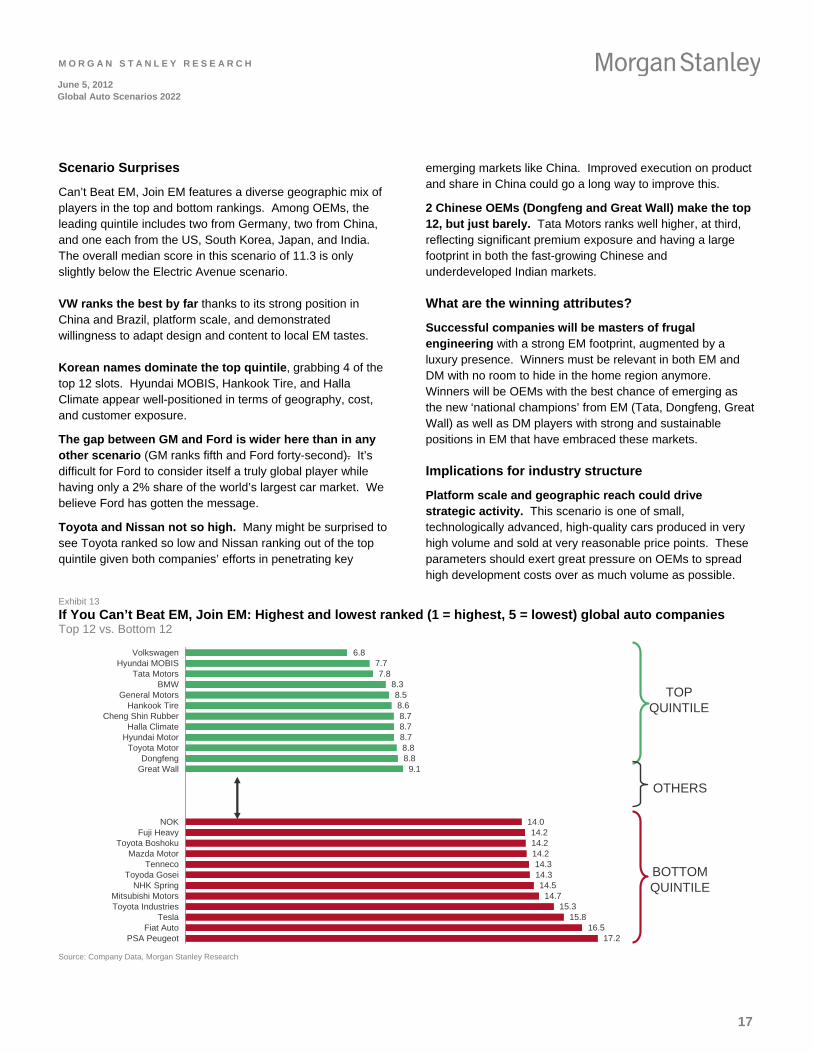
Scenario Surprises
Can’t Beat EM, Join EM features a diverse geographic mix of players in the top and bottom rankings. Among OEMs, the leading quintile includes two from Germany, two from China, and one each from the US, South Korea, Japan, and India. The overall median score in this scenario of 11.3 is only slightly below the Electric Avenue scenario.
VW ranks the best by far thanks to its strong position in China and Brazil, platform scale, and demonstrated willingness to adapt design and content to local EM tastes.
Korean names dominate the top quintile, grabbing 4 of the top 12 slots. Hyundai MOBIS, Hankook Tire, and Halla Climate appear well-positioned in terms of geography, cost, and customer exposure.
The gap between GM and Ford is wider here than in any other scenario (GM ranks fifth and Ford forty-second). It’s difficult for Ford to consider itself a truly global player while having only a 2% share of the world’s largest car market. We believe Ford has gotten the message.
Toyota and Nissan not so high. Many might be surprised to see Toyota ranked so low and Nissan ranking out of the top quintile given both companies’ efforts in penetrating key
emerging markets like China. Improved execution on product and share in China could go a long way to improve this.
2 Chinese OEMs (Dongfeng and Great Wall) make the top 12, but just barely. Tata Motors ranks well higher, at third, reflecting significant premium exposure and having a large footprint in both the fast-growing Chinese and underdeveloped Indian markets.
What are the winning attributes?
Successful companies will be masters of frugal engineering with a strong EM footprint, augmented by a luxury presence. Winners must be relevant in both EM and DM with no room to hide in the home region anymore. Winners will be OEMs with the best chance of emerging as the new ‘national champions’ from EM (Tata, Dongfeng, Great Wall) as well as DM players with strong and sustainable positions in EM that have embraced these markets.
Implications for industry structure
Platform scale and geographic reach could drive strategic activity. This scenario is one of small, technologically advanced, high-quality cars produced in very high volume and sold at very reasonable price points. These parameters should exert great pressure on OEMs to spread high development costs over as much volume as possible.
Exhibit 13
If You Can’t Beat EM, Join EM: Highest and lowest ranked (1 = highest, 5 = lowest) global auto companies Top 12 vs. Bottom 12
6.87.77.8
8.38.58.68.78.78.78.88.8
9.1
14.014.214.214.214.314.314.5
14.715.3
15.816.5
17.2
VolkswagenHyundai MOBIS
Tata MotorsBMW
General MotorsHankook Tire
Cheng Shin RubberHalla Climate
Hyundai MotorToyota Motor
DongfengGreat Wall
NOKFuji Heavy
Toyota BoshokuMazda Motor
TennecoToyoda Gosei
NHK SpringMitsubishi MotorsToyota Industries
TeslaFiat Auto
PSA Peugeot
TOP QUINTILE
OTHERS
BOTTOM QUINTILE
Source: Company Data, Morgan Stanley Research
17
M O R G A N S T A N L E Y R E S E A R C H
June 5, 2012 Global Auto Scenarios 2022
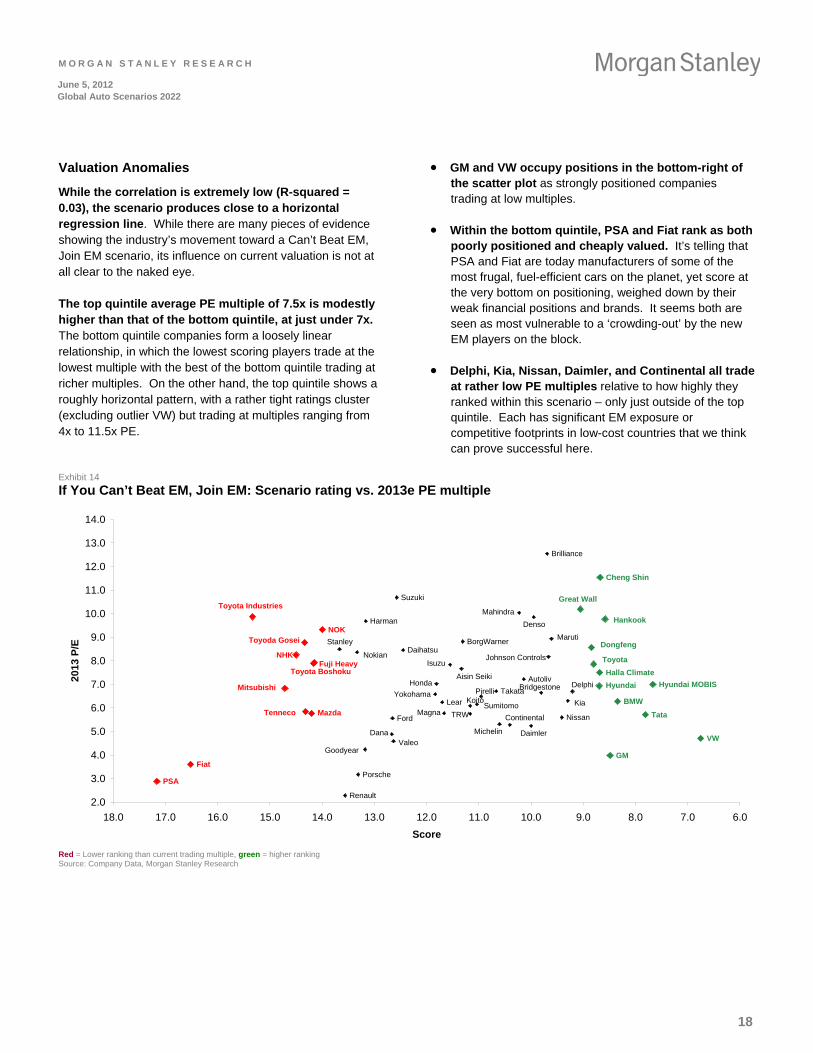
Valuation Anomalies
While the correlation is extremely low (R-squared = 0.03), the scenario produces close to a horizontal regression line. While there are many pieces of evidence showing the industry’s movement toward a Can’t Beat EM, Join EM scenario, its influence on current valuation is not at all clear to the naked eye.
The top quintile average PE multiple of 7.5x is modestly higher than that of the bottom quintile, at just under 7x. The bottom quintile companies form a loosely linear relationship, in which the lowest scoring players trade at the lowest multiple with the best of the bottom quintile trading at richer multiples. On the other hand, the top quintile shows a roughly horizontal pattern, with a rather tight ratings cluster (excluding outlier VW) but trading at multiples ranging from 4x to 11.5x PE.
GM and VW occupy positions in the bottom-right of the scatter plot as strongly positioned companies trading at low multiples.
Within the bottom quintile, PSA and Fiat rank as both poorly positioned and cheaply valued. It’s telling that PSA and Fiat are today manufacturers of some of the most frugal, fuel-efficient cars on the planet, yet score at the very bottom on positioning, weighed down by their weak financial positions and brands. It seems both are seen as most vulnerable to a ‘crowding-out’ by the new EM players on the block.
Delphi, Kia, Nissan, Daimler, and Continental all trade at rather low PE multiples relative to how highly they ranked within this scenario – only just outside of the top quintile. Each has significant EM exposure or competitive footprints in low-cost countries that we think can prove successful here.
Exhibit 14
If You Can’t Beat EM, Join EM: Scenario rating vs. 2013e PE multiple
BMW
Brilliance
Daihatsu
Daimler
Dongfeng
Fiat
Fuji Heavy
Mazda
Mitsubishi
PSA
NHK
NOK
Tenneco
Toyoda Gosei
Toyota Boshoku
Toyota Industries
Ford
GM
Great Wall
Honda Hyundai
Isuzu
Kia
Mahindra
Maruti
Nissan
Porsche
Renault
Suzuki
Tata
Toyota
VW
Aisin Seiki Autoliv
BorgWarner
Bridgestone
Cheng Shin
Continental
Dana
Delphi
Denso
Goodyear
Halla Climate
HankookHarman
Hyundai MOBIS
Johnson Controls
KoitoLearMagna
Michelin
Nokian
Pirelli
Stanley
Sumitomo
Takata
TRW
Valeo
Yokohama
2.0
3.0
4.0
5.0
6.0
7.0
8.0
9.0
10.0
11.0
12.0
13.0
14.0
6.07.08.09.010.011.012.013.014.015.016.017.018.0
Score
2013
P/E
Red = Lower ranking than current trading multiple, green = higher ranking Source: Company Data, Morgan Stanley Research
18
M O R G A N S T A N L E Y R E S E A R C H
June 5, 2012 Global Auto Scenarios 2022
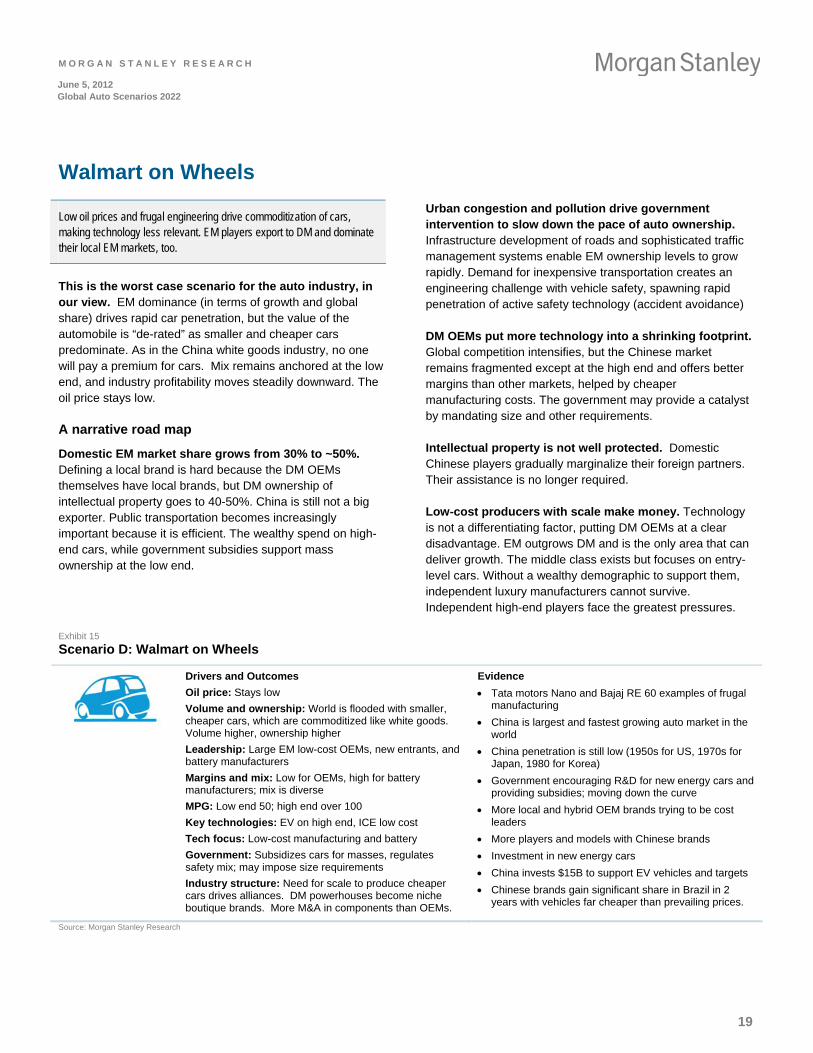
Walmart on Wheels
Low oil prices and frugal engineering drive commoditization of cars, making technology less relevant. EM players export to DM and dominate their local EM markets, too.
This is the worst case scenario for the auto industry, in our view. EM dominance (in terms of growth and global share) drives rapid car penetration, but the value of the automobile is “de-rated” as smaller and cheaper cars predominate. As in the China white goods industry, no one will pay a premium for cars. Mix remains anchored at the low end, and industry profitability moves steadily downward. The oil price stays low.
A narrative road map
Domestic EM market share grows from 30% to ~50%. Defining a local brand is hard because the DM OEMs themselves have local brands, but DM ownership of intellectual property goes to 40-50%. China is still not a big exporter. Public transportation becomes increasingly important because it is efficient. The wealthy spend on high-end cars, while government subsidies support mass ownership at the low end.
Urban congestion and pollution drive government intervention to slow down the pace of auto ownership. Infrastructure development of roads and sophisticated traffic management systems enable EM ownership levels to grow rapidly. Demand for inexpensive transportation creates an engineering challenge with vehicle safety, spawning rapid penetration of active safety technology (accident avoidance)
DM OEMs put more technology into a shrinking footprint. Global competition intensifies, but the Chinese market remains fragmented except at the high end and offers better margins than other markets, helped by cheaper manufacturing costs. The government may provide a catalyst by mandating size and other requirements.
Intellectual property is not well protected. Domestic Chinese players gradually marginalize their foreign partners. Their assistance is no longer required.
Low-cost producers with scale make money. Technology is not a differentiating factor, putting DM OEMs at a clear disadvantage. EM outgrows DM and is the only area that can deliver growth. The middle class exists but focuses on entry-level cars. Without a wealthy demographic to support them, independent luxury manufacturers cannot survive. Independent high-end players face the greatest pressures.
Exhibit 15
Scenario D: Walmart on Wheels
Drivers and Outcomes
Oil price: Stays low
Volume and ownership: World is flooded with smaller, cheaper cars, which are commoditized like white goods. Volume higher, ownership higher
Leadership: Large EM low-cost OEMs, new entrants, and battery manufacturers
Margins and mix: Low for OEMs, high for battery manufacturers; mix is diverse
MPG: Low end 50; high end over 100
Key technologies: EV on high end, ICE low cost
Tech focus: Low-cost manufacturing and battery
Government: Subsidizes cars for masses, regulates safety mix; may impose size requirements
Industry structure: Need for scale to produce cheaper cars drives alliances. DM powerhouses become niche boutique brands. More M&A in components than OEMs.
Evidence
Tata motors Nano and Bajaj RE 60 examples of frugal manufacturing
China is largest and fastest growing auto market in the world
China penetration is still low (1950s for US, 1970s for Japan, 1980 for Korea)
Government encouraging R&D for new energy cars and providing subsidies; moving down the curve
More local and hybrid OEM brands trying to be cost leaders
More players and models with Chinese brands
Investment in new energy cars
China invests $15B to support EV vehicles and targets
Chinese brands gain significant share in Brazil in 2 years with vehicles far cheaper than prevailing prices.
Source: Morgan Stanley Research
19
M O R G A N S T A N L E Y R E S E A R C H
June 5, 2012 Global Auto Scenarios 2022
Scenario Surprises
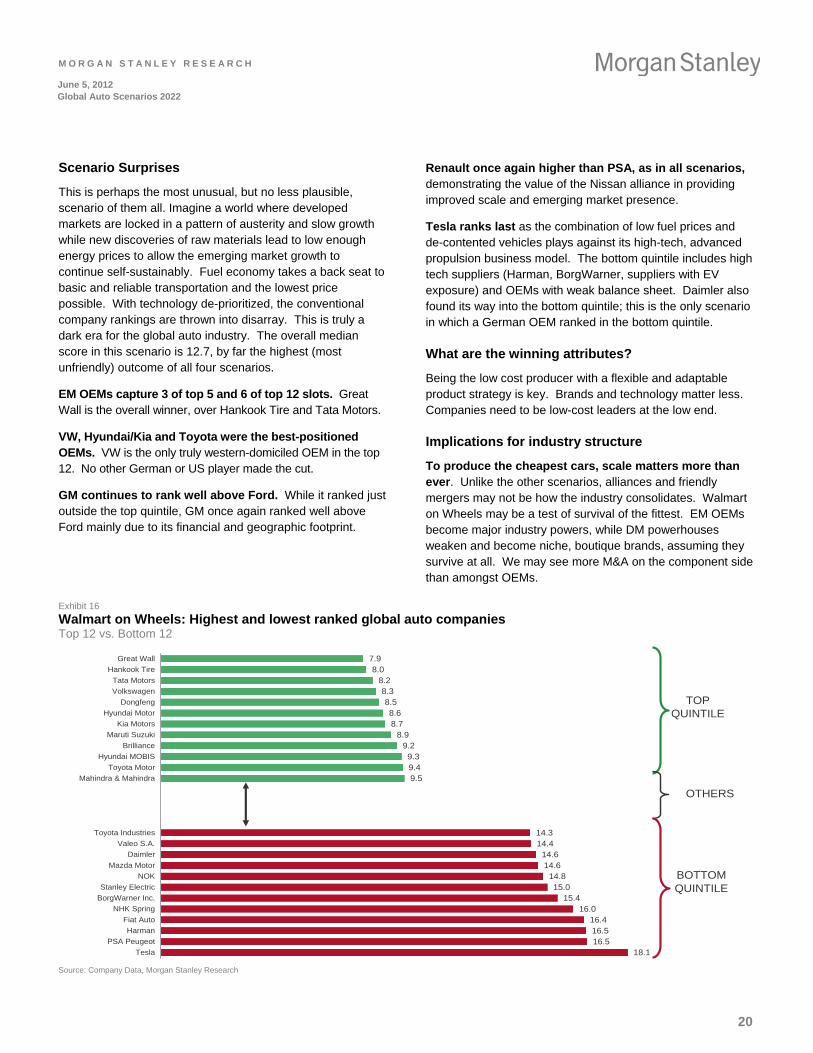
This is perhaps the most unusual, but no less plausible, scenario of them all. Imagine a world where developed markets are locked in a pattern of austerity and slow growth while new discoveries of raw materials lead to low enough energy prices to allow the emerging market growth to continue self-sustainably. Fuel economy takes a back seat to basic and reliable transportation and the lowest price possible. With technology de-prioritized, the conventional company rankings are thrown into disarray. This is truly a dark era for the global auto industry. The overall median score in this scenario is 12.7, by far the highest (most unfriendly) outcome of all four scenarios.
EM OEMs capture 3 of top 5 and 6 of top 12 slots. Great Wall is the overall winner, over Hankook Tire and Tata Motors.
VW, Hyundai/Kia and Toyota were the best-positioned OEMs. VW is the only truly western-domiciled OEM in the top 12. No other German or US player made the cut.
GM continues to rank well above Ford. While it ranked just outside the top quintile, GM once again ranked well above Ford mainly due to its financial and geographic footprint.
Renault once again higher than PSA, as in all scenarios, demonstrating the value of the Nissan alliance in providing improved scale and emerging market presence.
Tesla ranks last as the combination of low fuel prices and de-contented vehicles plays against its high-tech, advanced propulsion business model. The bottom quintile includes high tech suppliers (Harman, BorgWarner, suppliers with EV exposure) and OEMs with weak balance sheet. Daimler also found its way into the bottom quintile; this is the only scenario in which a German OEM ranked in the bottom quintile.
What are the winning attributes?
Being the low cost producer with a flexible and adaptable product strategy is key. Brands and technology matter less. Companies need to be low-cost leaders at the low end.
Implications for industry structure
To produce the cheapest cars, scale matters more than ever. Unlike the other scenarios, alliances and friendly mergers may not be how the industry consolidates. Walmart on Wheels may be a test of survival of the fittest. EM OEMs become major industry powers, while DM powerhouses weaken and become niche, boutique brands, assuming they survive at all. We may see more M&A on the component side than amongst OEMs.
Exhibit 16
Walmart on Wheels: Highest and lowest ranked global auto companies Top 12 vs. Bottom 12
7.98.0
8.28.38.58.68.7
8.99.29.39.49.5
14.314.4
14.614.6
14.815.0
15.416.0
16.416.516.5
18.1
Great Wall
Hankook Tire
Tata Motors
Volkswagen
Dongfeng
Hyundai Motor
Kia Motors
Maruti Suzuki
Brilliance
Hyundai MOBIS
Toyota Motor
Mahindra & Mahindra
Toyota Industries
Valeo S.A.
Daimler
Mazda Motor
NOK
Stanley Electric
BorgWarner Inc.
NHK Spring
Fiat Auto
Harman
PSA Peugeot
Tesla
TOP QUINTILE
OTHERS
BOTTOM QUINTILE
Source: Company Data, Morgan Stanley Research
20
M O R G A N S T A N L E Y R E S E A R C H
June 5, 2012 Global Auto Scenarios 2022
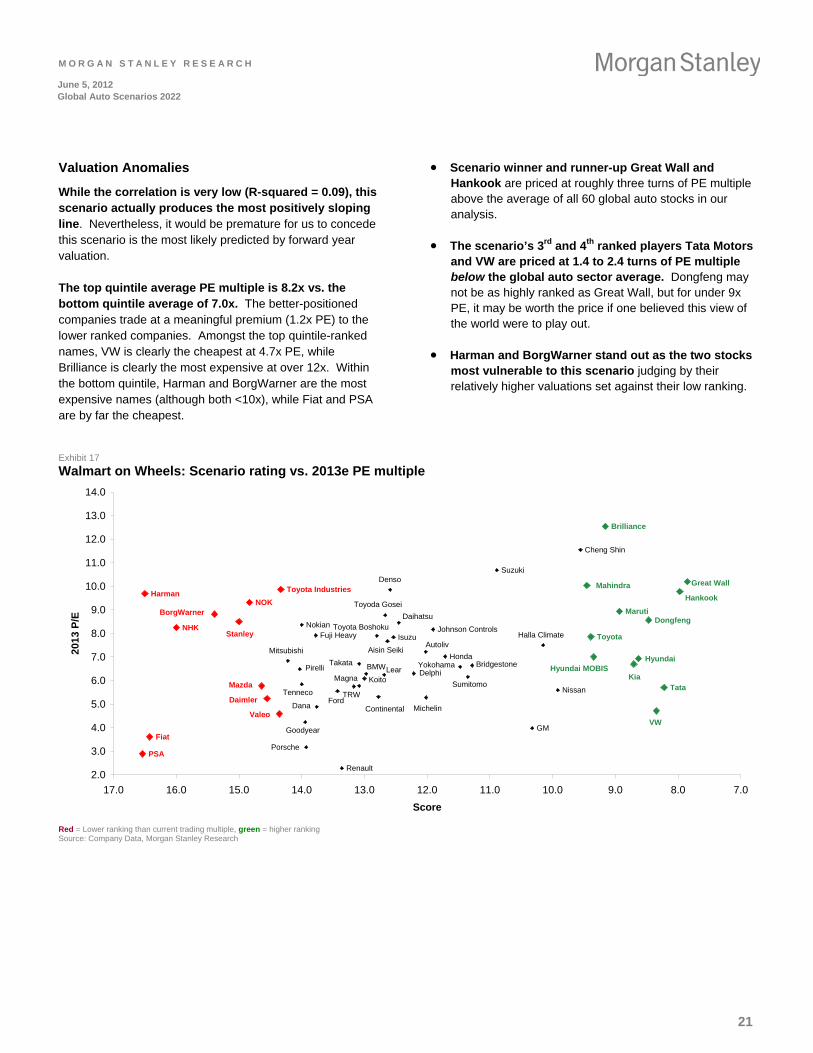
Valuation Anomalies
While the correlation is very low (R-squared = 0.09), this scenario actually produces the most positively sloping line. Nevertheless, it would be premature for us to concede this scenario is the most likely predicted by forward year valuation.
The top quintile average PE multiple is 8.2x vs. the bottom quintile average of 7.0x. The better-positioned companies trade at a meaningful premium (1.2x PE) to the lower ranked companies. Amongst the top quintile-ranked names, VW is clearly the cheapest at 4.7x PE, while Brilliance is clearly the most expensive at over 12x. Within the bottom quintile, Harman and BorgWarner are the most expensive names (although both <10x), while Fiat and PSA are by far the cheapest.
Scenario winner and runner-up Great Wall and Hankook are priced at roughly three turns of PE multiple above the average of all 60 global auto stocks in our analysis.
The scenario’s 3rd and 4th ranked players Tata Motors and VW are priced at 1.4 to 2.4 turns of PE multiple below the global auto sector average. Dongfeng may not be as highly ranked as Great Wall, but for under 9x PE, it may be worth the price if one believed this view of the world were to play out.
Harman and BorgWarner stand out as the two stocks most vulnerable to this scenario judging by their relatively higher valuations set against their low ranking.
Exhibit 17
Walmart on Wheels: Scenario rating vs. 2013e PE multiple
BMW
Brilliance
Daihatsu
Daimler
Fiat
Mazda
PSA
BorgWarner
Harman
NHK
NOK
Stanley
Toyota Industries
Valeo
Dongfeng
Ford
Fuji Heavy
GM
Great Wall
Honda Hyundai
Isuzu
Kia
Mahindra
Maruti
Mitsubishi
Nissan
Porsche
Renault
Suzuki
Tata
Toyota
VW
Aisin SeikiAutoliv
Bridgestone
Cheng Shin
ContinentalDana
Delphi
Denso
Goodyear
Halla Climate
Hankook
Hyundai MOBIS
Johnson Controls
KoitoLear
Magna
Michelin
Nokian
Pirelli
Sumitomo
Takata
Tenneco
Toyoda Gosei
Toyota Boshoku
TRW
Yokohama
2.0
3.0
4.0
5.0
6.0
7.0
8.0
9.0
10.0
11.0
12.0
13.0
14.0
7.08.09.010.011.012.013.014.015.016.017.0
Score
201
3 P
/E
Red = Lower ranking than current trading multiple, green = higher ranking Source: Company Data, Morgan Stanley Research
21
M O R G A N S T A N L E Y R E S E A R C H
June 5, 2012 Global Auto Scenarios 2022
The Debates on Our Axes
Our discussion of the changes facing the industry came down to two areas: technology and markets. We chose these as the axes for our quadrant analysis because they encompass multiple debates.
Vertical Axis: Technology
The overarching question is whether technology increases demand and improves the value proposition of vehicle ownership, driving top-line growth. Or does technology impair the value proposition and shift demand to alternative mobility? Our discussions explored three key areas:
Energy Efficiency. Do advanced internal combustion engines, advanced materials, and battery technology drive affordable solutions and stimulate demand? Or does technology increase the cost of vehicles, putting them out of reach for the masses and stunting demand?
Connectivity. Can technology manage congestion and save time, money, and lives? Will the car become a seamlessly connected domain of the Internet? Or does IT turn the car into a commoditized ‘pod’?
Alternatives to driving. Mass transit (high-speed rail, self-driving mega-city vehicles) can compete with autos for both long-distance travel and the last mile driven. Breakthroughs in alternatives may challenge traditional vehicle demand.
An oil price shock could drive major changes in regulatory response, technology deployment, and auto industry structure. Battery manufacturers, infrastructure providers, and mobility solutions may extract value from the industry. The more the debate hinges on new propulsion technologies, the more radical the outcomes. Our current definition of the “car industry” could become obsolete. On the other hand, a gradual rise in energy prices would allow existing players to adapt and add value through content and differentiation. Value-added may remain within the industry.
Horizontal Axis: Market Pacesetter
Will emerging or developed, mature markets set the pace in the auto industry over the next 10 years? Key questions we addressed:
Influence on demand. Are emerging markets merely an opportunity to target the incremental consumer? Or will their share of global demand mirror their population?
Impact on supply. Does EM remain a source of cheap supply for export, or will EM companies transplant aggressively to mature markets to target DM consumers?
Product mix and content. How would an EM-dominated world differ in terms of product/segment mix, brand values, and applied technology?
Regulation. How much will EM governments intervene? Will regulation support individual mobility or tilt the playing field toward mass transit and alternatives?
“Frugal Innovation” may rise in an EM-dominated world. We explored several avenues for this trend: compromises in car content at a much lower price point, different manufacturing techniques, or designs that target Asia’s emerging middle class. In a premium-driven DM-dominated world, intellectual property stays in companies that pursue engineering excellence and brand differentiation.
22
M O R G A N S T A N L E Y R E S E A R C H
June 5, 2012 Global Auto Scenarios 2022
Our Scenario Process
We mapped the future of the industry over the next 10 years through a series of steps. To start the process of developing scenarios, we asked each of the 18 members of the global auto team in North America, Europe, China, Japan, Korea, India, and Taiwan to answer this question:
What is the biggest change the auto industry will face over the next 10 years – and what should companies do today to prepare for that change?
We also asked the team to list the critical forces, uncertainties and drivers of change over the coming decade. After collating the results, the global team held three roundtable discussions over the course of several days, led by facilitators from outside the group.
The pasta was flying. This brainstorming process was like throwing dozens of plates of spaghetti at the wall and seeing what stuck. The team identified nearly 60 forces of industry change that we grouped into four clusters:
Demand (including demographics, consumer preferences and economics)
Macroeconomic factors and markets
Technology and manufacturing (including supply chain and industry economics)
Government and regulations
We winnowed the forces down to nine key factors:
1. Energy prices
2. Energy efficiency
3. Impact of the Internet
4. Future of the combustion engine
5. Technology solutions for mobility/infrastructure
6. Imbalances in demand for mobility (emerging v. developed markets; urbanization
7. Polarization of brands and products
8. Less demand for driving due to digitization
9. Impact of financing on car ownership
We distilled a second key question from these influences and trends to shape our ten-year views:
What will demand for road mobility look like, and what technology and infrastructure can enable it?
To develop plausible scenarios, we defined these uncertainties as two axes with polar outcomes: Technology adds or reduces value in the automobile and by extension, the industry; and either emerging or developed markets set the pace for demand over the next ten years
23
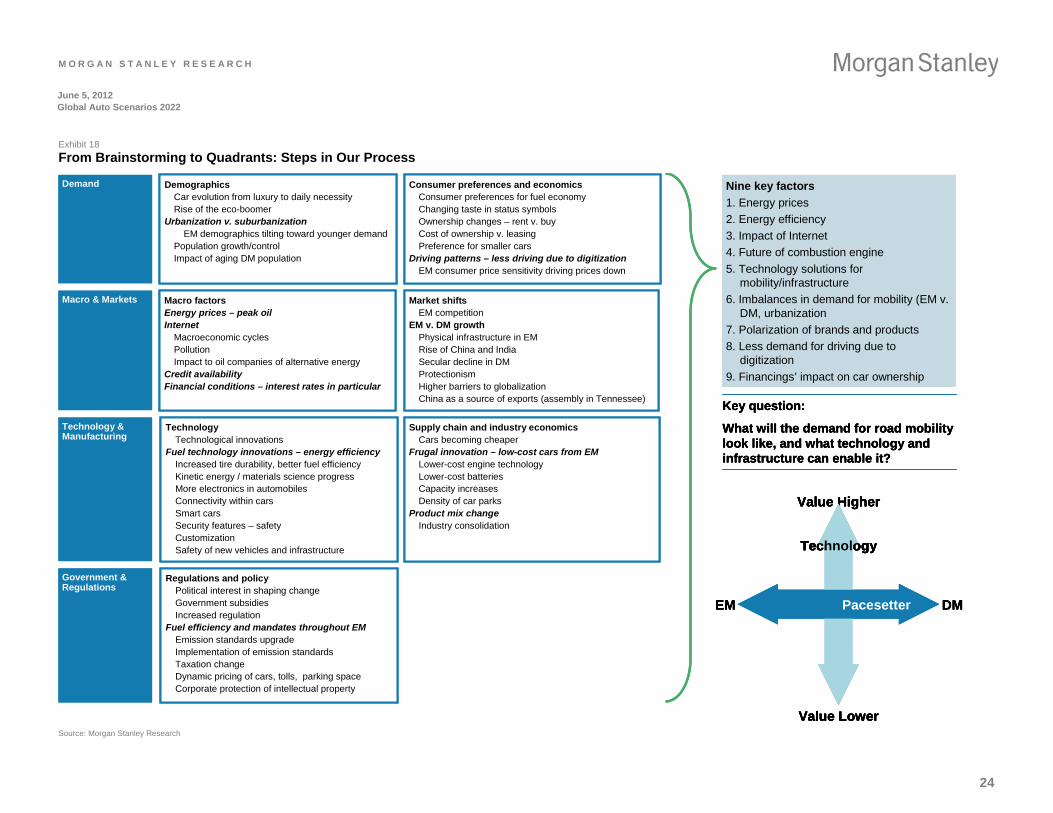
M O R G A N S T A N L E Y R E S E A R C H
June 5, 2012 Global Auto Scenarios 2022
Exhibit 18
From Brainstorming to Quadrants: Steps in Our Process
Nine key factors
1. Energy prices
2. Energy efficiency
3. Impact of Internet
4. Future of combustion engine
5. Technology solutions for mobility/infrastructure
6. Imbalances in demand for mobility (EM v. DM, urbanization
7. Polarization of brands and products
8. Less demand for driving due to digitization
9. Financings’ impact on car ownership
Key question:
What will the demand for road mobility look like, and what technology and infrastructure can enable it?
Value Higher
Value Lower
Technology
PacesetterEM DM
Demand DemographicsCar evolution from luxury to daily necessityRise of the eco-boomer
Urbanization v. suburbanizationEM demographics tilting toward younger demand
Population growth/controlImpact of aging DM population
Consumer preferences and economicsConsumer preferences for fuel economyChanging taste in status symbolsOwnership changes – rent v. buyCost of ownership v. leasingPreference for smaller cars
Driving patterns – less driving due to digitizationEM consumer price sensitivity driving prices down
Macro & Markets Macro factorsEnergy prices – peak oilInternet
Macroeconomic cyclesPollutionImpact to oil companies of alternative energy
Credit availabilityFinancial conditions – interest rates in particular
Market shiftsEM competition
EM v. DM growthPhysical infrastructure in EMRise of China and IndiaSecular decline in DMProtectionism Higher barriers to globalizationChina as a source of exports (assembly in Tennessee)
Technology & Manufacturing
TechnologyTechnological innovations
Fuel technology innovations – energy efficiencyIncreased tire durability, better fuel efficiencyKinetic energy / materials science progressMore electronics in automobilesConnectivity within carsSmart carsSecurity features – safetyCustomization Safety of new vehicles and infrastructure
Supply chain and industry economicsCars becoming cheaper
Frugal innovation – low-cost cars from EM Lower-cost engine technology Lower-cost batteriesCapacity increasesDensity of car parks
Product mix changeIndustry consolidation
Government & Regulations
Regulations and policyPolitical interest in shaping changeGovernment subsidiesIncreased regulation
Fuel efficiency and mandates throughout EMEmission standards upgradeImplementation of emission standards Taxation changeDynamic pricing of cars, tolls, parking spaceCorporate protection of intellectual property
Nine key factors
1. Energy prices
2. Energy efficiency
3. Impact of Internet
4. Future of combustion engine
5. Technology solutions for mobility/infrastructure
6. Imbalances in demand for mobility (EM v. DM, urbanization
7. Polarization of brands and products
8. Less demand for driving due to digitization
9. Financings’ impact on car ownership
Key question:
What will the demand for road mobility look like, and what technology and infrastructure can enable it?
Key question:
What will the demand for road mobility look like, and what technology and infrastructure can enable it?
Value Higher
Value Lower
Technology
PacesetterEM DM
Value Higher
Value Lower
Technology
Value Higher
Value Lower
TechnologyTechnology
PacesetterEM DM
Demand DemographicsCar evolution from luxury to daily necessityRise of the eco-boomer
Urbanization v. suburbanizationEM demographics tilting toward younger demand
Population growth/controlImpact of aging DM population
Consumer preferences and economicsConsumer preferences for fuel economyChanging taste in status symbolsOwnership changes – rent v. buyCost of ownership v. leasingPreference for smaller cars
Driving patterns – less driving due to digitizationEM consumer price sensitivity driving prices down
Macro & Markets Macro factorsEnergy prices – peak oilInternet
Macroeconomic cyclesPollutionImpact to oil companies of alternative energy
Credit availabilityFinancial conditions – interest rates in particular
Market shiftsEM competition
EM v. DM growthPhysical infrastructure in EMRise of China and IndiaSecular decline in DMProtectionism Higher barriers to globalizationChina as a source of exports (assembly in Tennessee)
Technology & Manufacturing
TechnologyTechnological innovations
Fuel technology innovations – energy efficiencyIncreased tire durability, better fuel efficiencyKinetic energy / materials science progressMore electronics in automobilesConnectivity within carsSmart carsSecurity features – safetyCustomization Safety of new vehicles and infrastructure
Supply chain and industry economicsCars becoming cheaper
Frugal innovation – low-cost cars from EM Lower-cost engine technology Lower-cost batteriesCapacity increasesDensity of car parks
Product mix changeIndustry consolidation
Government & Regulations
Regulations and policyPolitical interest in shaping changeGovernment subsidiesIncreased regulation
Fuel efficiency and mandates throughout EMEmission standards upgradeImplementation of emission standards Taxation changeDynamic pricing of cars, tolls, parking spaceCorporate protection of intellectual property
Source: Morgan Stanley Research
24
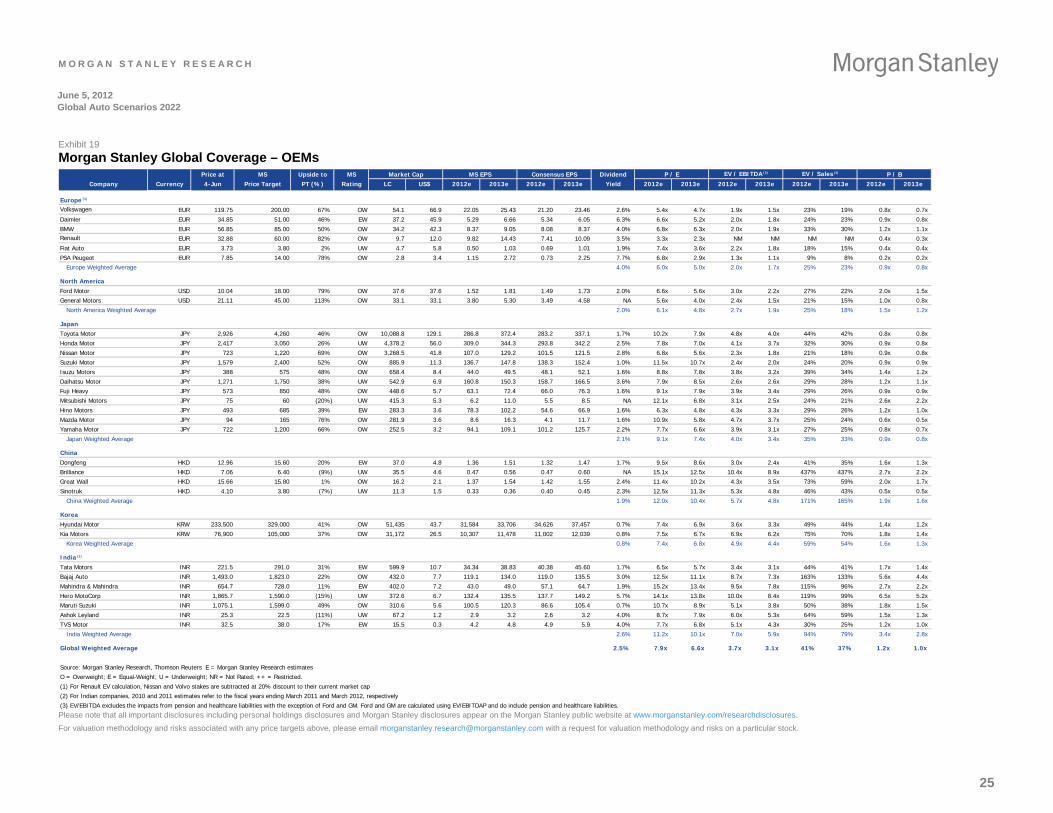
M O R G A N S T A N L E Y R E S E A R C H
June 5, 2012 Global Auto Scenarios 2022
Exhibit 19
Morgan Stanley Global Coverage – OEMs Price at MS Upside to MS Market Cap MS EPS Consensus EPS Dividend P / E EV / EBITDA (3) EV / Sales (3) P / B
Company Currency 4-Jun Price Target PT (%) Rating LC US$ 2012e 2013e 2012e 2013e Yield 2012e 2013e 2012e 2013e 2012e 2013e 2012e 2013e
Europe (1)
Volkswagen EUR 119.75 200.00 67% OW 54.1 66.9 22.05 25.43 21.20 23.46 2.6% 5.4x 4.7x 1.9x 1.5x 23% 19% 0.8x 0.7x
Daimler EUR 34.85 51.00 46% EW 37.2 45.9 5.29 6.66 5.34 6.05 6.3% 6.6x 5.2x 2.0x 1.8x 24% 23% 0.9x 0.8x
BMW EUR 56.85 85.00 50% OW 34.2 42.3 8.37 9.05 8.08 8.37 4.0% 6.8x 6.3x 2.0x 1.9x 33% 30% 1.2x 1.1x Renault EUR 32.88 60.00 82% OW 9.7 12.0 9.82 14.43 7.41 10.09 3.5% 3.3x 2.3x NM NM NM NM 0.4x 0.3x
Fiat Auto EUR 3.73 3.80 2% UW 4.7 5.8 0.50 1.03 0.69 1.01 1.9% 7.4x 3.6x 2.2x 1.8x 18% 15% 0.4x 0.4x
PSA Peugeot EUR 7.85 14.00 78% OW 2.8 3.4 1.15 2.72 0.73 2.25 7.7% 6.8x 2.9x 1.3x 1.1x 9% 8% 0.2x 0.2x
Europe Weighted Average 4.0% 6.0x 5.0x 2.0x 1.7x 25% 23% 0.9x 0.8x
North America
Ford Motor USD 10.04 18.00 79% OW 37.6 37.6 1.52 1.81 1.49 1.73 2.0% 6.6x 5.6x 3.0x 2.2x 27% 22% 2.0x 1.5x
General Motors USD 21.11 45.00 113% OW 33.1 33.1 3.80 5.30 3.49 4.58 NA 5.6x 4.0x 2.4x 1.5x 21% 15% 1.0x 0.8x
North America Weighted Average 2.0% 6.1x 4.8x 2.7x 1.9x 25% 18% 1.5x 1.2x
JapanToyota Motor JPY 2,926 4,260 46% OW 10,088.8 129.1 286.8 372.4 283.2 337.1 1.7% 10.2x 7.9x 4.8x 4.0x 44% 42% 0.8x 0.8x
Honda Motor JPY 2,417 3,050 26% UW 4,378.2 56.0 309.0 344.3 293.8 342.2 2.5% 7.8x 7.0x 4.1x 3.7x 32% 30% 0.9x 0.8x
Nissan Motor JPY 723 1,220 69% OW 3,268.5 41.8 107.0 129.2 101.5 121.5 2.8% 6.8x 5.6x 2.3x 1.8x 21% 18% 0.9x 0.8x
Suzuki Motor JPY 1,579 2,400 52% OW 885.9 11.3 136.7 147.8 138.3 152.4 1.0% 11.5x 10.7x 2.4x 2.0x 24% 20% 0.9x 0.9x
Isuzu Motors JPY 388 575 48% OW 658.4 8.4 44.0 49.5 48.1 52.1 1.6% 8.8x 7.8x 3.8x 3.2x 39% 34% 1.4x 1.2x
Daihatsu Motor JPY 1,271 1,750 38% UW 542.9 6.9 160.8 150.3 158.7 166.5 3.6% 7.9x 8.5x 2.6x 2.6x 29% 28% 1.2x 1.1x
Fuji Heavy JPY 573 850 48% OW 448.6 5.7 63.1 72.4 66.0 76.3 1.6% 9.1x 7.9x 3.9x 3.4x 29% 26% 0.9x 0.9x
Mitsubishi Motors JPY 75 60 (20%) UW 415.3 5.3 6.2 11.0 5.5 8.5 NA 12.1x 6.8x 3.1x 2.5x 24% 21% 2.6x 2.2x
Hino Motors JPY 493 685 39% EW 283.3 3.6 78.3 102.2 54.6 66.9 1.6% 6.3x 4.8x 4.3x 3.3x 29% 26% 1.2x 1.0x
Mazda Motor JPY 94 165 76% OW 281.9 3.6 8.6 16.3 4.1 11.7 1.6% 10.9x 5.8x 4.7x 3.7x 25% 24% 0.6x 0.5x
Yamaha Motor JPY 722 1,200 66% OW 252.5 3.2 94.1 109.1 101.2 125.7 2.2% 7.7x 6.6x 3.9x 3.1x 27% 25% 0.8x 0.7x
Japan Weighted Average 2.1% 9.1x 7.4x 4.0x 3.4x 35% 33% 0.9x 0.8x
China
Dongfeng HKD 12.96 15.60 20% EW 37.0 4.8 1.36 1.51 1.32 1.47 1.7% 9.5x 8.6x 3.0x 2.4x 41% 35% 1.6x 1.3x
Brilliance HKD 7.06 6.40 (9%) UW 35.5 4.6 0.47 0.56 0.47 0.60 NA 15.1x 12.5x 10.4x 8.9x 437% 437% 2.7x 2.2x
Great Wall HKD 15.66 15.80 1% OW 16.2 2.1 1.37 1.54 1.42 1.55 2.4% 11.4x 10.2x 4.3x 3.5x 73% 59% 2.0x 1.7x
Sinotruk HKD 4.10 3.80 (7%) UW 11.3 1.5 0.33 0.36 0.40 0.45 2.3% 12.5x 11.3x 5.3x 4.8x 46% 43% 0.5x 0.5x
China Weighted Average 1.9% 12.0x 10.4x 5.7x 4.8x 171% 165% 1.9x 1.6x
KoreaHyundai Motor KRW 233,500 329,000 41% OW 51,435 43.7 31,584 33,706 34,626 37,457 0.7% 7.4x 6.9x 3.6x 3.3x 49% 44% 1.4x 1.2x
Kia Motors KRW 76,900 105,000 37% OW 31,172 26.5 10,307 11,478 11,002 12,039 0.8% 7.5x 6.7x 6.9x 6.2x 75% 70% 1.8x 1.4x
Korea Weighted Average 0.8% 7.4x 6.8x 4.9x 4.4x 59% 54% 1.6x 1.3x
India (2)
Tata Motors INR 221.5 291.0 31% EW 599.9 10.7 34.34 38.83 40.38 45.60 1.7% 6.5x 5.7x 3.4x 3.1x 44% 41% 1.7x 1.4x
Bajaj Auto INR 1,493.0 1,823.0 22% OW 432.0 7.7 119.1 134.0 119.0 135.5 3.0% 12.5x 11.1x 8.7x 7.3x 163% 133% 5.6x 4.4x
Mahindra & Mahindra INR 654.7 728.0 11% EW 402.0 7.2 43.0 49.0 57.1 64.7 1.9% 15.2x 13.4x 9.5x 7.8x 115% 96% 2.7x 2.2x
Hero MotoCorp INR 1,865.7 1,590.0 (15%) UW 372.6 6.7 132.4 135.5 137.7 149.2 5.7% 14.1x 13.8x 10.0x 8.4x 119% 99% 6.5x 5.2x
Maruti Suzuki INR 1,075.1 1,599.0 49% OW 310.6 5.6 100.5 120.3 86.6 105.4 0.7% 10.7x 8.9x 5.1x 3.8x 50% 38% 1.8x 1.5x
Ashok Leyland INR 25.3 22.5 (11%) UW 67.2 1.2 2.9 3.2 2.6 3.2 4.0% 8.7x 7.9x 6.0x 5.3x 64% 59% 1.5x 1.3x
TVS Motor INR 32.5 38.0 17% EW 15.5 0.3 4.2 4.8 4.9 5.9 4.0% 7.7x 6.8x 5.1x 4.3x 30% 25% 1.2x 1.0x
India Weighted Average 2.6% 11.2x 10.1x 7.0x 5.9x 94% 79% 3.4x 2.8x
Global Weighted Average 2.5% 7.9x 6.6x 3.7x 3.1x 41% 37% 1.2x 1.0x
Source: Morgan Stanley Research, Thomson Reuters E = Morgan Stanley Research estimates
O = Overweight; E = Equal-Weight; U = Underweight; NR = Not Rated; ++ = Restricted.
(1) For Renault EV calculation, Nissan and Volvo stakes are subtracted at 20% discount to their current market cap
(2) For Indian companies, 2010 and 2011 estimates refer to the fiscal years ending March 2011 and March 2012, respectively
(3) EV/EBITDA excludes the impacts from pension and healthcare liabilities with the exception of Ford and GM. Ford and GM are calculated using EV/EBITDAP and do include pension and healthcare liabilities. Please note that all important disclosures including personal holdings disclosures and Morgan Stanley disclosures appear on the Morgan Stanley public website at www.morganstanley.com/researchdisclosures.
For valuation methodology and risks associated with any price targets above, please email [email protected] with a request for valuation methodology and risks on a particular stock.
25
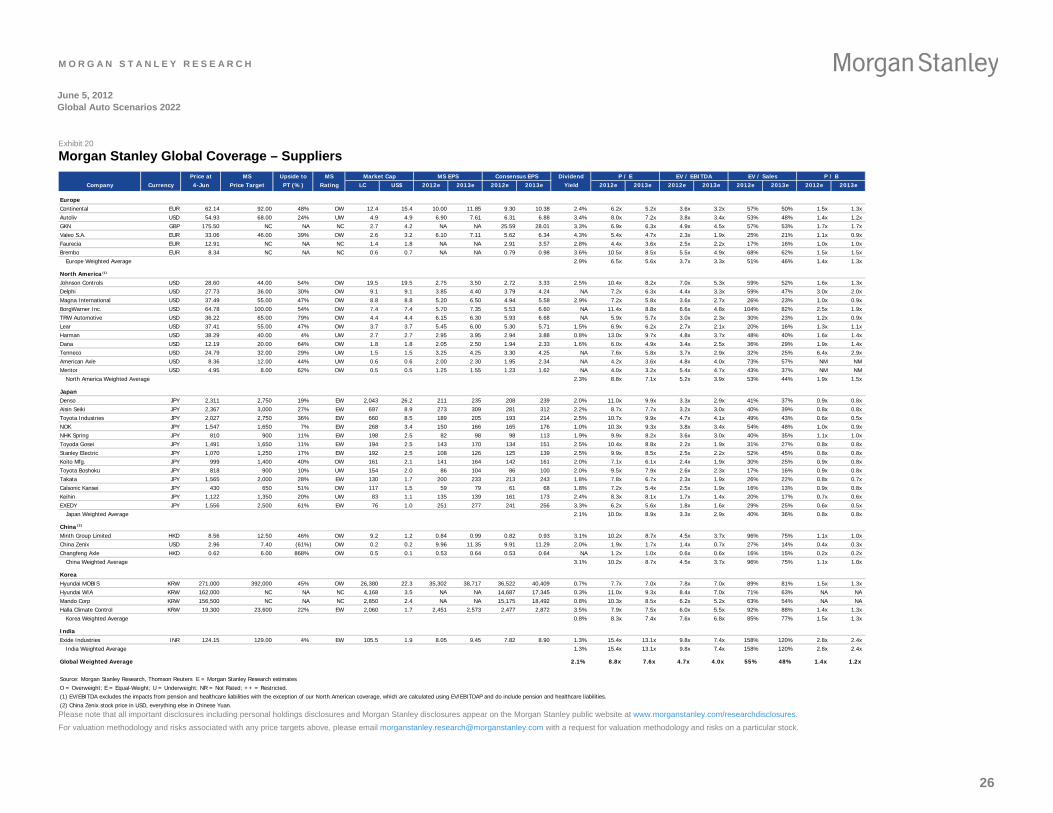
M O R G A N S T A N L E Y R E S E A R C H
June 5, 2012 Global Auto Scenarios 2022
Exhibit 20
Morgan Stanley Global Coverage – Suppliers Price at MS Upside to MS Market Cap MS EPS Consensus EPS Dividend P / E EV / EBITDA EV / Sales P / B
Company Currency 4-Jun Price Target PT (%) Rating LC US$ 2012e 2013e 2012e 2013e Yield 2012e 2013e 2012e 2013e 2012e 2013e 2012e 2013e
EuropeContinental EUR 62.14 92.00 48% OW 12.4 15.4 10.00 11.85 9.30 10.38 2.4% 6.2x 5.2x 3.6x 3.2x 57% 50% 1.5x 1.3x Autoliv USD 54.93 68.00 24% UW 4.9 4.9 6.90 7.61 6.31 6.88 3.4% 8.0x 7.2x 3.8x 3.4x 53% 48% 1.4x 1.2x GKN GBP 175.50 NC NA NC 2.7 4.2 NA NA 25.59 28.01 3.3% 6.9x 6.3x 4.9x 4.5x 57% 53% 1.7x 1.7x Valeo S.A. EUR 33.06 46.00 39% OW 2.6 3.2 6.10 7.11 5.62 6.34 4.3% 5.4x 4.7x 2.3x 1.9x 25% 21% 1.1x 0.9x Faurecia EUR 12.91 NC NA NC 1.4 1.8 NA NA 2.91 3.57 2.8% 4.4x 3.6x 2.5x 2.2x 17% 16% 1.0x 1.0x Brembo EUR 8.34 NC NA NC 0.6 0.7 NA NA 0.79 0.98 3.6% 10.5x 8.5x 5.5x 4.9x 68% 62% 1.5x 1.5x
Europe Weighted Average 2.9% 6.5x 5.6x 3.7x 3.3x 51% 46% 1.4x 1.3x
North America (1)
Johnson Controls USD 28.60 44.00 54% OW 19.5 19.5 2.75 3.50 2.72 3.33 2.5% 10.4x 8.2x 7.0x 5.3x 59% 52% 1.6x 1.3x Delphi USD 27.73 36.00 30% OW 9.1 9.1 3.85 4.40 3.79 4.24 NA 7.2x 6.3x 4.4x 3.3x 59% 47% 3.0x 2.0x Magna International USD 37.49 55.00 47% OW 8.8 8.8 5.20 6.50 4.94 5.58 2.9% 7.2x 5.8x 3.6x 2.7x 26% 23% 1.0x 0.9x BorgWarner Inc. USD 64.78 100.00 54% OW 7.4 7.4 5.70 7.35 5.53 6.60 NA 11.4x 8.8x 6.6x 4.8x 104% 82% 2.5x 1.9x TRW Automotive USD 36.22 65.00 79% OW 4.4 4.4 6.15 6.30 5.93 6.68 NA 5.9x 5.7x 3.0x 2.3x 30% 23% 1.2x 0.9x Lear USD 37.41 55.00 47% OW 3.7 3.7 5.45 6.00 5.30 5.71 1.5% 6.9x 6.2x 2.7x 2.1x 20% 16% 1.3x 1.1x Harman USD 38.29 40.00 4% UW 2.7 2.7 2.95 3.95 2.94 3.88 0.8% 13.0x 9.7x 4.8x 3.7x 48% 40% 1.6x 1.4x Dana USD 12.19 20.00 64% OW 1.8 1.8 2.05 2.50 1.94 2.33 1.6% 6.0x 4.9x 3.4x 2.5x 36% 29% 1.9x 1.4x Tenneco USD 24.79 32.00 29% UW 1.5 1.5 3.25 4.25 3.30 4.25 NA 7.6x 5.8x 3.7x 2.9x 32% 25% 6.4x 2.9x American Axle USD 8.36 12.00 44% UW 0.6 0.6 2.00 2.30 1.95 2.34 NA 4.2x 3.6x 4.8x 4.0x 73% 57% NM NMMeritor USD 4.95 8.00 62% OW 0.5 0.5 1.25 1.55 1.23 1.62 NA 4.0x 3.2x 5.4x 4.7x 43% 37% NM NM
North America Weighted Average 2.3% 8.8x 7.1x 5.2x 3.9x 53% 44% 1.9x 1.5x
JapanDenso JPY 2,311 2,750 19% EW 2,043 26.2 211 235 208 239 2.0% 11.0x 9.9x 3.3x 2.9x 41% 37% 0.9x 0.8x Aisin Seiki JPY 2,367 3,000 27% EW 697 8.9 273 309 281 312 2.2% 8.7x 7.7x 3.2x 3.0x 40% 39% 0.8x 0.8x Toyota Industries JPY 2,027 2,750 36% EW 660 8.5 189 205 193 214 2.5% 10.7x 9.9x 4.7x 4.1x 49% 43% 0.6x 0.5x NOK JPY 1,547 1,650 7% EW 268 3.4 150 166 165 176 1.0% 10.3x 9.3x 3.8x 3.4x 54% 48% 1.0x 0.9x NHK Spring JPY 810 900 11% EW 198 2.5 82 98 98 113 1.9% 9.9x 8.2x 3.6x 3.0x 40% 35% 1.1x 1.0x Toyoda Gosei JPY 1,491 1,650 11% EW 194 2.5 143 170 134 151 2.5% 10.4x 8.8x 2.2x 1.9x 31% 27% 0.8x 0.8x Stanley Electric JPY 1,070 1,250 17% EW 192 2.5 108 126 125 139 2.5% 9.9x 8.5x 2.5x 2.2x 52% 45% 0.8x 0.8x Koito Mfg. JPY 999 1,400 40% OW 161 2.1 141 164 142 161 2.0% 7.1x 6.1x 2.4x 1.9x 30% 25% 0.9x 0.8x Toyota Boshoku JPY 818 900 10% UW 154 2.0 86 104 86 100 2.0% 9.5x 7.9x 2.6x 2.3x 17% 16% 0.9x 0.8x Takata JPY 1,565 2,000 28% EW 130 1.7 200 233 213 243 1.8% 7.8x 6.7x 2.3x 1.9x 26% 22% 0.8x 0.7x Calsonic Kansei JPY 430 650 51% OW 117 1.5 59 79 61 68 1.8% 7.2x 5.4x 2.5x 1.9x 16% 13% 0.9x 0.8x Keihin JPY 1,122 1,350 20% UW 83 1.1 135 139 161 173 2.4% 8.3x 8.1x 1.7x 1.4x 20% 17% 0.7x 0.6x EXEDY JPY 1,556 2,500 61% EW 76 1.0 251 277 241 256 3.3% 6.2x 5.6x 1.8x 1.6x 29% 25% 0.6x 0.5x
Japan Weighted Average 2.1% 10.0x 8.9x 3.3x 2.9x 40% 36% 0.8x 0.8x
China (2)
Minth Group Limited HKD 8.56 12.50 46% OW 9.2 1.2 0.84 0.99 0.82 0.93 3.1% 10.2x 8.7x 4.5x 3.7x 96% 75% 1.1x 1.0x China Zenix USD 2.96 7.40 (61%) OW 0.2 0.2 9.96 11.35 9.91 11.29 2.0% 1.9x 1.7x 1.4x 0.7x 27% 14% 0.4x 0.3x Changfeng Axle HKD 0.62 6.00 868% OW 0.5 0.1 0.53 0.64 0.53 0.64 NA 1.2x 1.0x 0.6x 0.6x 16% 15% 0.2x 0.2x
China Weighted Average 3.1% 10.2x 8.7x 4.5x 3.7x 96% 75% 1.1x 1.0x
KoreaHyundai MOBIS KRW 271,000 392,000 45% OW 26,380 22.3 35,302 38,717 36,522 40,409 0.7% 7.7x 7.0x 7.8x 7.0x 89% 81% 1.5x 1.3x Hyundai WIA KRW 162,000 NC NA NC 4,168 3.5 NA NA 14,687 17,345 0.3% 11.0x 9.3x 8.4x 7.0x 71% 63% NA NAMando Corp KRW 156,500 NC NA NC 2,850 2.4 NA NA 15,175 18,492 0.8% 10.3x 8.5x 6.2x 5.2x 63% 54% NA NAHalla Climate Control KRW 19,300 23,600 22% EW 2,060 1.7 2,451 2,573 2,477 2,872 3.5% 7.9x 7.5x 6.0x 5.5x 92% 88% 1.4x 1.3x
Korea Weighted Average 0.8% 8.3x 7.4x 7.6x 6.8x 85% 77% 1.5x 1.3x
IndiaExide Industries INR 124.15 129.00 4% EW 105.5 1.9 8.05 9.45 7.82 8.90 1.3% 15.4x 13.1x 9.8x 7.4x 158% 120% 2.8x 2.4x
India Weighted Average 1.3% 15.4x 13.1x 9.8x 7.4x 158% 120% 2.8x 2.4x
Global Weighted Average 2.1% 8.8x 7.6x 4.7x 4.0x 55% 48% 1.4x 1.2x
Source: Morgan Stanley Research, Thomson Reuters E = Morgan Stanley Research estimatesO = Overweight; E = Equal-Weight; U = Underweight; NR = Not Rated; ++ = Restricted.(1) EV/EBITDA excludes the impacts from pension and healthcare liabilities with the exception of our North American coverage, which are calculated using EV/EBITDAP and do include pension and healthcare liabilities.(2) China Zenix stock price in USD, everything else in Chinese Yuan. Please note that all important disclosures including personal holdings disclosures and Morgan Stanley disclosures appear on the Morgan Stanley public website at www.morganstanley.com/researchdisclosures.
For valuation methodology and risks associated with any price targets above, please email [email protected] with a request for valuation methodology and risks on a particular stock.
26
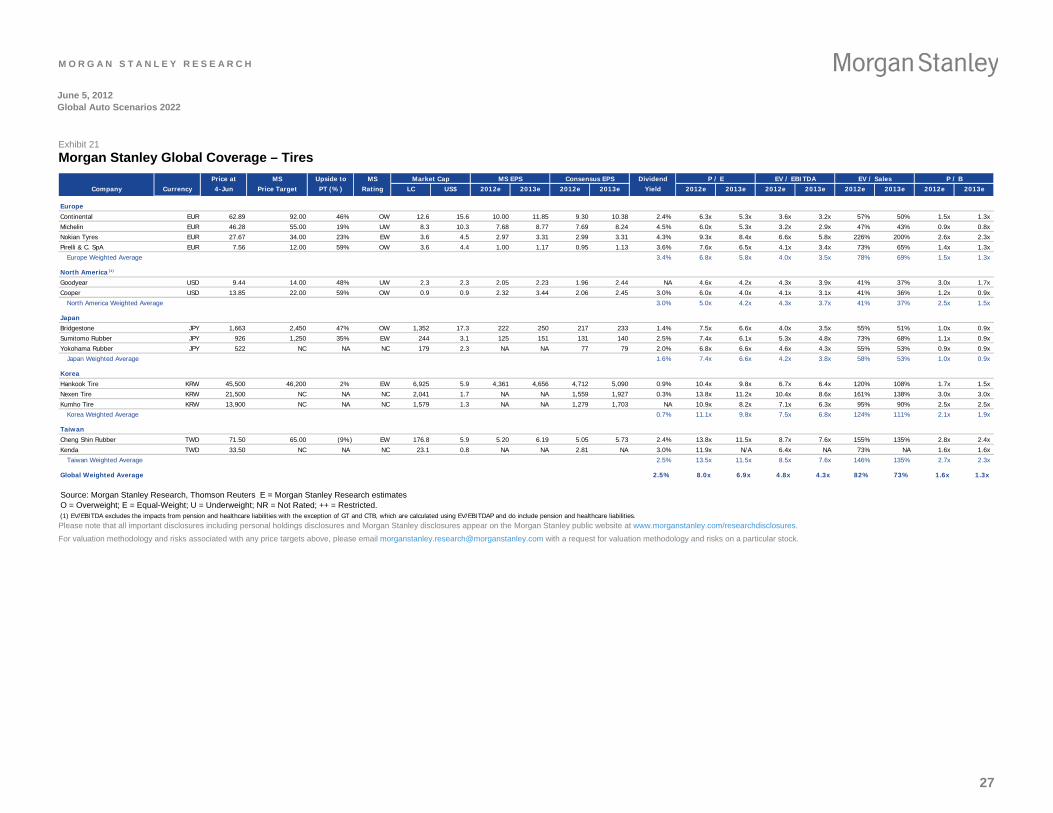
M O R G A N S T A N L E Y R E S E A R C H
June 5, 2012 Global Auto Scenarios 2022
Exhibit 21
Morgan Stanley Global Coverage – Tires
Price at MS Upside to MS Market Cap MS EPS Consensus EPS Dividend P / E EV / EBITDA EV / Sales P / BCompany Currency 4-Jun Price Target PT (%) Rating LC US$ 2012e 2013e 2012e 2013e Yield 2012e 2013e 2012e 2013e 2012e 2013e 2012e 2013e
Europe
Continental EUR 62.89 92.00 46% OW 12.6 15.6 10.00 11.85 9.30 10.38 2.4% 6.3x 5.3x 3.6x 3.2x 57% 50% 1.5x 1.3x
Michelin EUR 46.28 55.00 19% UW 8.3 10.3 7.68 8.77 7.69 8.24 4.5% 6.0x 5.3x 3.2x 2.9x 47% 43% 0.9x 0.8x
Nokian Tyres EUR 27.67 34.00 23% EW 3.6 4.5 2.97 3.31 2.99 3.31 4.3% 9.3x 8.4x 6.6x 5.8x 226% 200% 2.6x 2.3x
Pirelli & C. SpA EUR 7.56 12.00 59% OW 3.6 4.4 1.00 1.17 0.95 1.13 3.6% 7.6x 6.5x 4.1x 3.4x 73% 65% 1.4x 1.3x
Europe Weighted Average 3.4% 6.8x 5.8x 4.0x 3.5x 78% 69% 1.5x 1.3x
North America (1)
Goodyear USD 9.44 14.00 48% UW 2.3 2.3 2.05 2.23 1.96 2.44 NA 4.6x 4.2x 4.3x 3.9x 41% 37% 3.0x 1.7x
Cooper USD 13.85 22.00 59% OW 0.9 0.9 2.32 3.44 2.06 2.45 3.0% 6.0x 4.0x 4.1x 3.1x 41% 36% 1.2x 0.9x
North America Weighted Average 3.0% 5.0x 4.2x 4.3x 3.7x 41% 37% 2.5x 1.5x
JapanBridgestone JPY 1,663 2,450 47% OW 1,352 17.3 222 250 217 233 1.4% 7.5x 6.6x 4.0x 3.5x 55% 51% 1.0x 0.9x
Sumitomo Rubber JPY 926 1,250 35% EW 244 3.1 125 151 131 140 2.5% 7.4x 6.1x 5.3x 4.8x 73% 68% 1.1x 0.9x
Yokohama Rubber JPY 522 NC NA NC 179 2.3 NA NA 77 79 2.0% 6.8x 6.6x 4.6x 4.3x 55% 53% 0.9x 0.9x
Japan Weighted Average 1.6% 7.4x 6.6x 4.2x 3.8x 58% 53% 1.0x 0.9x
KoreaHankook Tire KRW 45,500 46,200 2% EW 6,925 5.9 4,361 4,656 4,712 5,090 0.9% 10.4x 9.8x 6.7x 6.4x 120% 108% 1.7x 1.5x
Nexen Tire KRW 21,500 NC NA NC 2,041 1.7 NA NA 1,559 1,927 0.3% 13.8x 11.2x 10.4x 8.6x 161% 138% 3.0x 3.0x
Kumho Tire KRW 13,900 NC NA NC 1,579 1.3 NA NA 1,279 1,703 NA 10.9x 8.2x 7.1x 6.3x 95% 90% 2.5x 2.5x
Korea Weighted Average 0.7% 11.1x 9.8x 7.5x 6.8x 124% 111% 2.1x 1.9x
Taiwan
Cheng Shin Rubber TWD 71.50 65.00 (9%) EW 176.8 5.9 5.20 6.19 5.05 5.73 2.4% 13.8x 11.5x 8.7x 7.6x 155% 135% 2.8x 2.4x
Kenda TWD 33.50 NC NA NC 23.1 0.8 NA NA 2.81 NA 3.0% 11.9x N/A 6.4x NA 73% NA 1.6x 1.6x
Taiwan Weighted Average 2.5% 13.5x 11.5x 8.5x 7.6x 146% 135% 2.7x 2.3x
Global Weighted Average 2.5% 8.0x 6.9x 4.8x 4.3x 82% 73% 1.6x 1.3x
Source: Morgan Stanley Research, Thomson Reuters E = Morgan Stanley Research estimatesO = Overweight; E = Equal-Weight; U = Underweight; NR = Not Rated; ++ = Restricted.(1) EV/EBITDA excludes the impacts from pension and healthcare liabilities with the exception of GT and CTB, which are calculated using EV/EBITDAP and do include pension and healthcare liabilities. Please note that all important disclosures including personal holdings disclosures and Morgan Stanley disclosures appear on the Morgan Stanley public website at www.morganstanley.com/researchdisclosures.
For valuation methodology and risks associated with any price targets above, please email [email protected] with a request for valuation methodology and risks on a particular stock.
27
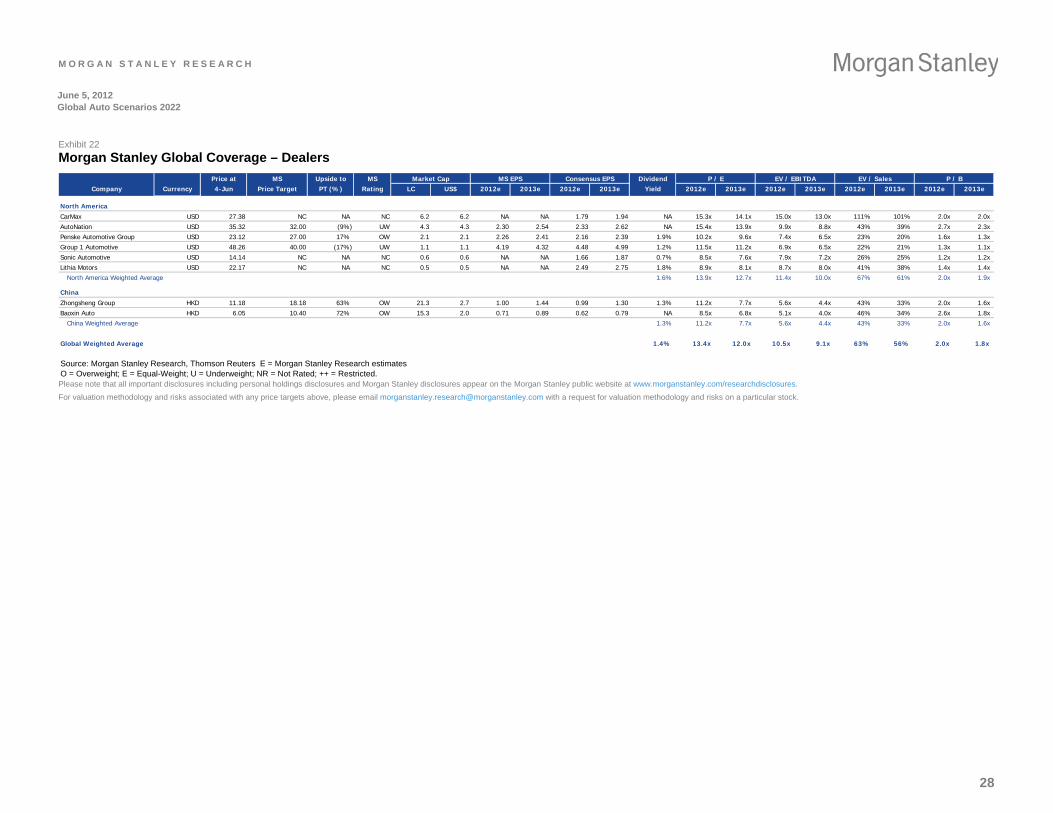
M O R G A N S T A N L E Y R E S E A R C H
June 5, 2012 Global Auto Scenarios 2022
Exhibit 22
Morgan Stanley Global Coverage – Dealers
Price at MS Upside to MS Market Cap MS EPS Consensus EPS Dividend P / E EV / EBITDA EV / Sales P / BCompany Currency 4-Jun Price Target PT (%) Rating LC US$ 2012e 2013e 2012e 2013e Yield 2012e 2013e 2012e 2013e 2012e 2013e 2012e 2013e
North America
CarMax USD 27.38 NC NA NC 6.2 6.2 NA NA 1.79 1.94 NA 15.3x 14.1x 15.0x 13.0x 111% 101% 2.0x 2.0x
AutoNation USD 35.32 32.00 (9%) UW 4.3 4.3 2.30 2.54 2.33 2.62 NA 15.4x 13.9x 9.9x 8.8x 43% 39% 2.7x 2.3x
Penske Automotive Group USD 23.12 27.00 17% OW 2.1 2.1 2.26 2.41 2.16 2.39 1.9% 10.2x 9.6x 7.4x 6.5x 23% 20% 1.6x 1.3x
Group 1 Automotive USD 48.26 40.00 (17%) UW 1.1 1.1 4.19 4.32 4.48 4.99 1.2% 11.5x 11.2x 6.9x 6.5x 22% 21% 1.3x 1.1x
Sonic Automotive USD 14.14 NC NA NC 0.6 0.6 NA NA 1.66 1.87 0.7% 8.5x 7.6x 7.9x 7.2x 26% 25% 1.2x 1.2x
Lithia Motors USD 22.17 NC NA NC 0.5 0.5 NA NA 2.49 2.75 1.8% 8.9x 8.1x 8.7x 8.0x 41% 38% 1.4x 1.4x
North America Weighted Average 1.6% 13.9x 12.7x 11.4x 10.0x 67% 61% 2.0x 1.9x
China
Zhongsheng Group HKD 11.18 18.18 63% OW 21.3 2.7 1.00 1.44 0.99 1.30 1.3% 11.2x 7.7x 5.6x 4.4x 43% 33% 2.0x 1.6x
Baoxin Auto HKD 6.05 10.40 72% OW 15.3 2.0 0.71 0.89 0.62 0.79 NA 8.5x 6.8x 5.1x 4.0x 46% 34% 2.6x 1.8x
China Weighted Average 1.3% 11.2x 7.7x 5.6x 4.4x 43% 33% 2.0x 1.6x
Global Weighted Average 1.4% 13.4x 12.0x 10.5x 9.1x 63% 56% 2.0x 1.8x
Source: Morgan Stanley Research, Thomson Reuters E = Morgan Stanley Research estimatesO = Overweight; E = Equal-Weight; U = Underweight; NR = Not Rated; ++ = Restricted. Please note that all important disclosures including personal holdings disclosures and Morgan Stanley disclosures appear on the Morgan Stanley public website at www.morganstanley.com/researchdisclosures.
For valuation methodology and risks associated with any price targets above, please email [email protected] with a request for valuation methodology and risks on a particular stock.
28
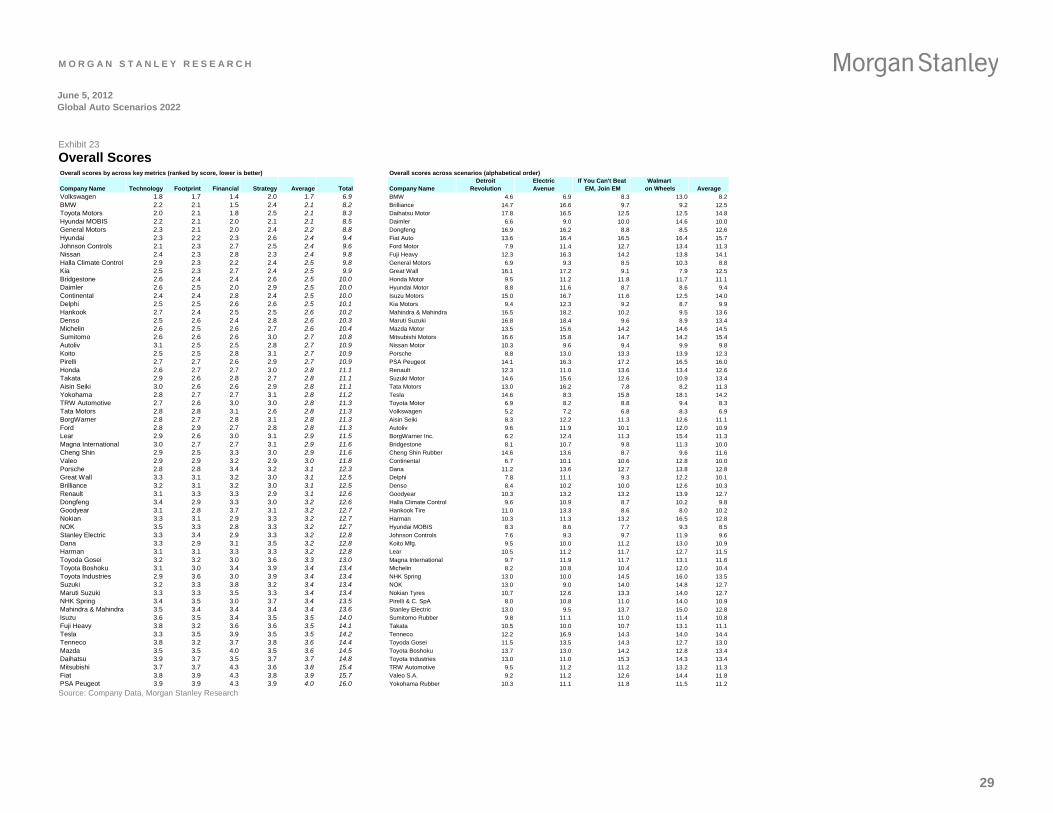
29
June 5, 2012 Global Auto Scenarios 2022
Overall scores by across key metrics (ranked by score, lower is better) Overall scores across scenarios (alphabetical order)Detroit Electric If You Can't Beat Walmart
Company Name Technology Footprint Financial Strategy Average Total Company Name Revolution Avenue EM, Join EM on Wheels AverageVolkswagen 1.8 1.7 1.4 2.0 1.7 6.9 BMW 4.6 6.9 8.3 13.0 8.2BMW 2.2 2.1 1.5 2.4 2.1 8.2 Brilliance 14.7 16.6 9.7 9.2 12.5Toyota Motors 2.0 2.1 1.8 2.5 2.1 8.3 Daihatsu Motor 17.8 16.5 12.5 12.5 14.8Hyundai MOBIS 2.2 2.1 2.0 2.1 2.1 8.5 Daimler 6.6 9.0 10.0 14.6 10.0General Motors 2.3 2.1 2.0 2.4 2.2 8.8 Dongfeng 16.9 16.2 8.8 8.5 12.6Hyundai 2.3 2.2 2.3 2.6 2.4 9.4 Fiat Auto 13.6 16.4 16.5 16.4 15.7Johnson Controls 2.1 2.3 2.7 2.5 2.4 9.6 Ford Motor 7.9 11.4 12.7 13.4 11.3Nissan 2.4 2.3 2.8 2.3 2.4 9.8 Fuji Heavy 12.3 16.3 14.2 13.8 14.1Halla Climate Control 2.9 2.3 2.2 2.4 2.5 9.8 General Motors 6.9 9.3 8.5 10.3 8.8Kia 2.5 2.3 2.7 2.4 2.5 9.9 Great Wall 16.1 17.2 9.1 7.9 12.5Bridgestone 2.6 2.4 2.4 2.6 2.5 10.0 Honda Motor 9.5 11.2 11.8 11.7 11.1Daimler 2.6 2.5 2.0 2.9 2.5 10.0 Hyundai Motor 8.8 11.6 8.7 8.6 9.4Continental 2.4 2.4 2.8 2.4 2.5 10.0 Isuzu Motors 15.0 16.7 11.6 12.5 14.0Delphi 2.5 2.5 2.6 2.6 2.5 10.1 Kia Motors 9.4 12.3 9.2 8.7 9.9Hankook 2.7 2.4 2.5 2.5 2.6 10.2 Mahindra & Mahindra 16.5 18.2 10.2 9.5 13.6Denso 2.5 2.6 2.4 2.8 2.6 10.3 Maruti Suzuki 16.8 18.4 9.6 8.9 13.4Michelin 2.6 2.5 2.6 2.7 2.6 10.4 Mazda Motor 13.5 15.6 14.2 14.6 14.5Sumitomo 2.6 2.6 2.6 3.0 2.7 10.8 Mitsubishi Motors 16.6 15.8 14.7 14.2 15.4Autoliv 3.1 2.5 2.5 2.8 2.7 10.9 Nissan Motor 10.3 9.6 9.4 9.9 9.8Koito 2.5 2.5 2.8 3.1 2.7 10.9 Porsche 8.8 13.0 13.3 13.9 12.3Pirelli 2.7 2.7 2.6 2.9 2.7 10.9 PSA Peugeot 14.1 16.3 17.2 16.5 16.0Honda 2.6 2.7 2.7 3.0 2.8 11.1 Renault 12.3 11.0 13.6 13.4 12.6Takata 2.9 2.6 2.8 2.7 2.8 11.1 Suzuki Motor 14.6 15.6 12.6 10.9 13.4Aisin Seiki 3.0 2.6 2.6 2.9 2.8 11.1 Tata Motors 13.0 16.2 7.8 8.2 11.3Yokohama 2.8 2.7 2.7 3.1 2.8 11.2 Tesla 14.6 8.3 15.8 18.1 14.2TRW Automotive 2.7 2.6 3.0 3.0 2.8 11.3 Toyota Motor 6.9 8.2 8.8 9.4 8.3Tata Motors 2.8 2.8 3.1 2.6 2.8 11.3 Volkswagen 5.2 7.2 6.8 8.3 6.9BorgWarner 2.8 2.7 2.8 3.1 2.8 11.3 Aisin Seiki 8.3 12.2 11.3 12.6 11.1Ford 2.8 2.9 2.7 2.8 2.8 11.3 Autoliv 9.6 11.9 10.1 12.0 10.9Lear 2.9 2.6 3.0 3.1 2.9 11.5 BorgWarner Inc. 6.2 12.4 11.3 15.4 11.3Magna International 3.0 2.7 2.7 3.1 2.9 11.6 Bridgestone 8.1 10.7 9.8 11.3 10.0Cheng Shin 2.9 2.5 3.3 3.0 2.9 11.6 Cheng Shin Rubber 14.6 13.6 8.7 9.6 11.6Valeo 2.9 2.9 3.2 2.9 3.0 11.8 Continental 6.7 10.1 10.6 12.8 10.0Porsche 2.8 2.8 3.4 3.2 3.1 12.3 Dana 11.2 13.6 12.7 13.8 12.8Great Wall 3.3 3.1 3.2 3.0 3.1 12.5 Delphi 7.8 11.1 9.3 12.2 10.1Brilliance 3.2 3.1 3.2 3.0 3.1 12.5 Denso 8.4 10.2 10.0 12.6 10.3Renault 3.1 3.3 3.3 2.9 3.1 12.6 Goodyear 10.3 13.2 13.2 13.9 12.7Dongfeng 3.4 2.9 3.3 3.0 3.2 12.6 Halla Climate Control 9.6 10.9 8.7 10.2 9.8Goodyear 3.1 2.8 3.7 3.1 3.2 12.7 Hankook Tire 11.0 13.3 8.6 8.0 10.2Nokian 3.3 3.1 2.9 3.3 3.2 12.7 Harman 10.3 11.3 13.2 16.5 12.8NOK 3.5 3.3 2.8 3.3 3.2 12.7 Hyundai MOBIS 8.3 8.6 7.7 9.3 8.5Stanley Electric 3.3 3.4 2.9 3.3 3.2 12.8 Johnson Controls 7.6 9.3 9.7 11.9 9.6Dana 3.3 2.9 3.1 3.5 3.2 12.8 Koito Mfg. 9.5 10.0 11.2 13.0 10.9Harman 3.1 3.1 3.3 3.3 3.2 12.8 Lear 10.5 11.2 11.7 12.7 11.5Toyoda Gosei 3.2 3.2 3.0 3.6 3.3 13.0 Magna International 9.7 11.9 11.7 13.1 11.6Toyota Boshoku 3.1 3.0 3.4 3.9 3.4 13.4 Michelin 8.2 10.8 10.4 12.0 10.4Toyota Industries 2.9 3.6 3.0 3.9 3.4 13.4 NHK Spring 13.0 10.0 14.5 16.0 13.5Suzuki 3.2 3.3 3.8 3.2 3.4 13.4 NOK 13.0 9.0 14.0 14.8 12.7Maruti Suzuki 3.3 3.3 3.5 3.3 3.4 13.4 Nokian Tyres 10.7 12.6 13.3 14.0 12.7NHK Spring 3.4 3.5 3.0 3.7 3.4 13.5 Pirelli & C. SpA 8.0 10.8 11.0 14.0 10.9Mahindra & Mahindra 3.5 3.4 3.4 3.4 3.4 13.6 Stanley Electric 13.0 9.5 13.7 15.0 12.8Isuzu 3.6 3.5 3.4 3.5 3.5 14.0 Sumitomo Rubber 9.8 11.1 11.0 11.4 10.8Fuji Heavy 3.8 3.2 3.6 3.6 3.5 14.1 Takata 10.5 10.0 10.7 13.1 11.1Tesla 3.3 3.5 3.9 3.5 3.5 14.2 Tenneco 12.2 16.9 14.3 14.0 14.4Tenneco 3.8 3.2 3.7 3.8 3.6 14.4 Toyoda Gosei 11.5 13.5 14.3 12.7 13.0Mazda 3.5 3.5 4.0 3.5 3.6 14.5 Toyota Boshoku 13.7 13.0 14.2 12.8 13.4Daihatsu 3.9 3.7 3.5 3.7 3.7 14.8 Toyota Industries 13.0 11.0 15.3 14.3 13.4Mitsubishi 3.7 3.7 4.3 3.6 3.8 15.4 TRW Automotive 9.5 11.2 11.2 13.2 11.3Fiat 3.8 3.9 4.3 3.8 3.9 15.7 Valeo S.A. 9.2 11.2 12.6 14.4 11.8PSA Peugeot 3.9 3.9 4.3 3.9 4.0 16.0 Yokohama Rubber 10.3 11.1 11.8 11.5 11.2
M O R G A N S T A N L E Y R E S E A R C H
Source: Company Data, Morgan Stanley Research
Exhibit 23
Overall Scores
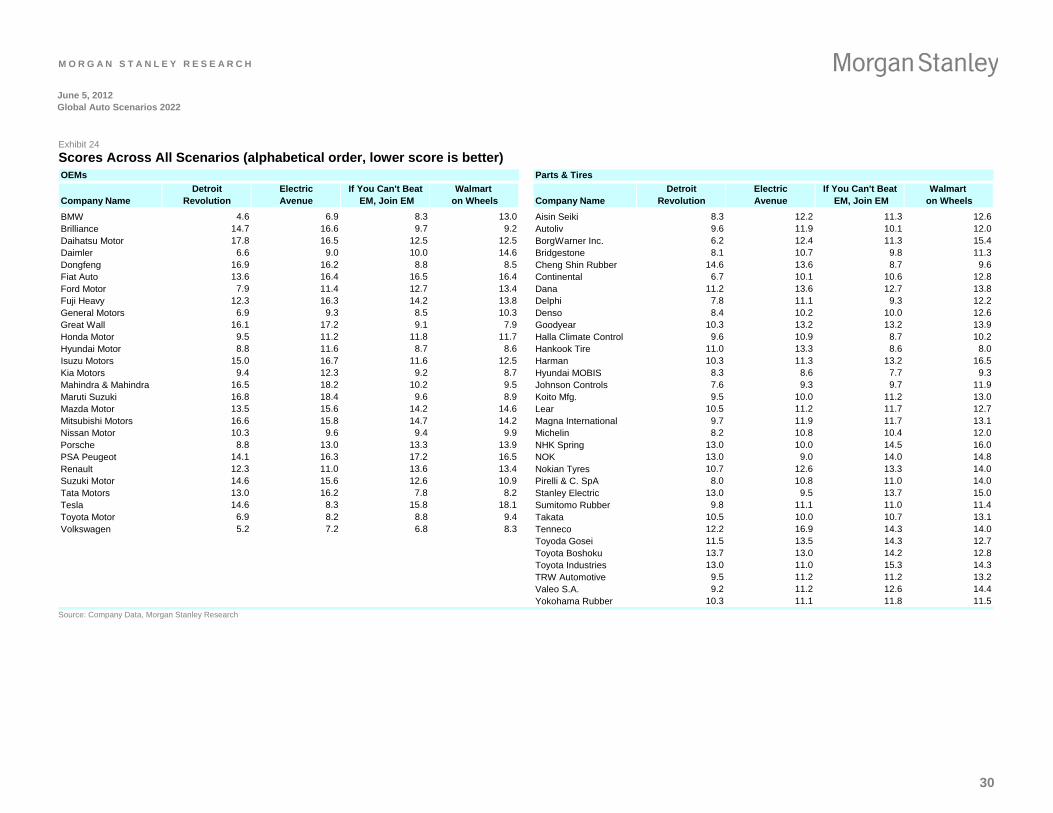
M O R G A N S T A N L E Y R E S E A R C H
June 5, 2012 Global Auto Scenarios 2022
Exhibit 24
Scores Across All Scenarios (alphabetical order, lower score is better)
M O R G A N S T A N L E Y B L U E P A P E R OEMs Parts & Tires
Detroit Electric If You Can't Beat Walmart Detroit Electric If You Can't Beat Walmart Company Name Revolution Avenue EM, Join EM on Wheels Company Name Revolution Avenue EM, Join EM on Wheels
BMW 4.6 6.9 8.3 13.0 Aisin Seiki 8.3 12.2 11.3 12.6Brilliance 14.7 16.6 9.7 9.2 Autoliv 9.6 11.9 10.1 12.0Daihatsu Motor 17.8 16.5 12.5 12.5 BorgWarner Inc. 6.2 12.4 11.3 15.4Daimler 6.6 9.0 10.0 14.6 Bridgestone 8.1 10.7 9.8 11.3Dongfeng 16.9 16.2 8.8 8.5 Cheng Shin Rubber 14.6 13.6 8.7 9.6Fiat Auto 13.6 16.4 16.5 16.4 Continental 6.7 10.1 10.6 12.8Ford Motor 7.9 11.4 12.7 13.4 Dana 11.2 13.6 12.7 13.8Fuji Heavy 12.3 16.3 14.2 13.8 Delphi 7.8 11.1 9.3 12.2General Motors 6.9 9.3 8.5 10.3 Denso 8.4 10.2 10.0 12.6Great Wall 16.1 17.2 9.1 7.9 Goodyear 10.3 13.2 13.2 13.9Honda Motor 9.5 11.2 11.8 11.7 Halla Climate Control 9.6 10.9 8.7 10.2Hyundai Motor 8.8 11.6 8.7 8.6 Hankook Tire 11.0 13.3 8.6 8.0Isuzu Motors 15.0 16.7 11.6 12.5 Harman 10.3 11.3 13.2 16.5Kia Motors 9.4 12.3 9.2 8.7 Hyundai MOBIS 8.3 8.6 7.7 9.3Mahindra & Mahindra 16.5 18.2 10.2 9.5 Johnson Controls 7.6 9.3 9.7 11.9Maruti Suzuki 16.8 18.4 9.6 8.9 Koito Mfg. 9.5 10.0 11.2 13.0Mazda Motor 13.5 15.6 14.2 14.6 Lear 10.5 11.2 11.7 12.7Mitsubishi Motors 16.6 15.8 14.7 14.2 Magna International 9.7 11.9 11.7 13.1Nissan Motor 10.3 9.6 9.4 9.9 Michelin 8.2 10.8 10.4 12.0Porsche 8.8 13.0 13.3 13.9 NHK Spring 13.0 10.0 14.5 16.0PSA Peugeot 14.1 16.3 17.2 16.5 NOK 13.0 9.0 14.0 14.8Renault 12.3 11.0 13.6 13.4 Nokian Tyres 10.7 12.6 13.3 14.0Suzuki Motor 14.6 15.6 12.6 10.9 Pirelli & C. SpA 8.0 10.8 11.0 14.0Tata Motors 13.0 16.2 7.8 8.2 Stanley Electric 13.0 9.5 13.7 15.0Tesla 14.6 8.3 15.8 18.1 Sumitomo Rubber 9.8 11.1 11.0 11.4Toyota Motor 6.9 8.2 8.8 9.4 Takata 10.5 10.0 10.7 13.1Volkswagen 5.2 7.2 6.8 8.3 Tenneco 12.2 16.9 14.3 14.0
Toyoda Gosei 11.5 13.5 14.3 12.7Toyota Boshoku 13.7 13.0 14.2 12.8Toyota Industries 13.0 11.0 15.3 14.3TRW Automotive 9.5 11.2 11.2 13.2Valeo S.A. 9.2 11.2 12.6 14.4Yokohama Rubber 10.3 11.1 11.8 11.5
Source: Company Data, Morgan Stanley Research
30
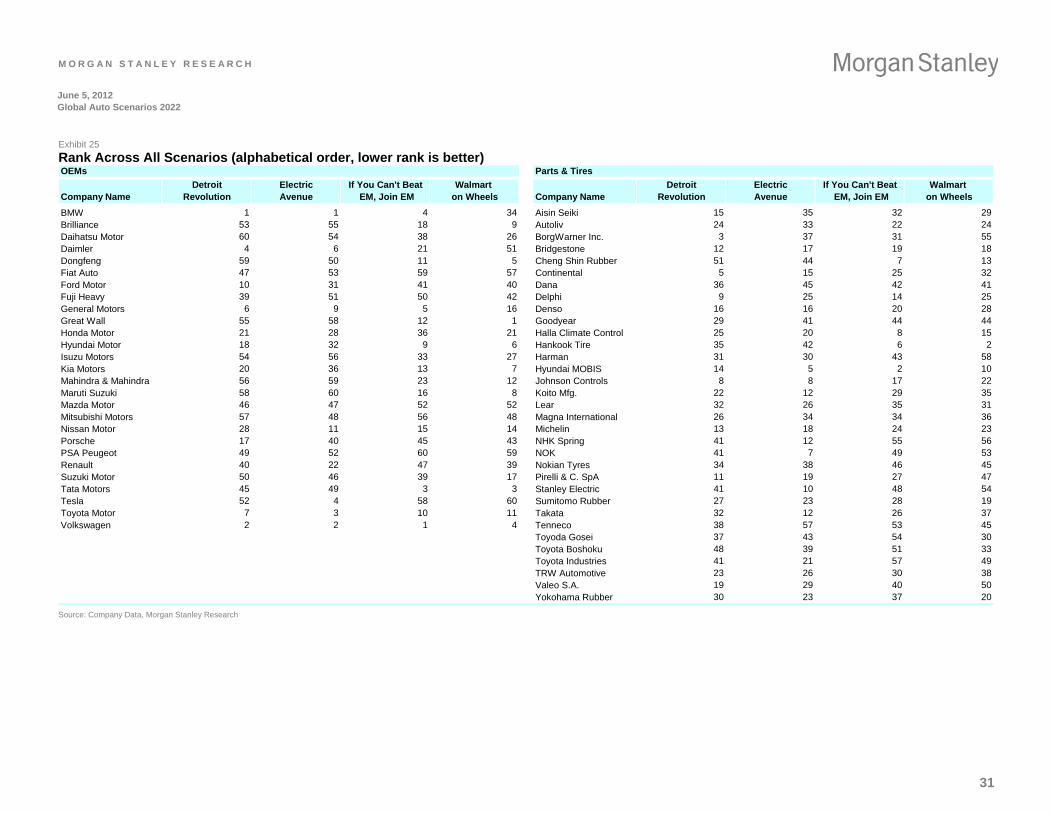
M O R G A N S T A N L E Y R E S E A R C H
31
June 5, 2012 Global Auto Scenarios 2022
M O R G A N S T A N L E Y B L U E P A P E R
Exhibit 25
Rank Across All Scenarios (alphabetical order, lower rank is better) OEMs Parts & Tires
Detroit Electric If You Can't Beat Walmart Detroit Electric If You Can't Beat Walmart Company Name Revolution Avenue EM, Join EM on Wheels Company Name Revolution Avenue EM, Join EM on Wheels
BMW 1 1 4 34 Aisin Seiki 15 35 32 29Brilliance 53 55 18 9 Autoliv 24 33 22 24Daihatsu Motor 60 54 38 26 BorgWarner Inc. 3 37 31 55Daimler 4 6 21 51 Bridgestone 12 17 19 18Dongfeng 59 50 11 5 Cheng Shin Rubber 51 44 7 13Fiat Auto 47 53 59 57 Continental 5 15 25 32Ford Motor 10 31 41 40 Dana 36 45 42 41Fuji Heavy 39 51 50 42 Delphi 9 25 14 25General Motors 6 9 5 16 Denso 16 16 20 28Great Wall 55 58 12 1 Goodyear 29 41 44 44Honda Motor 21 28 36 21 Halla Climate Control 25 20 8 15Hyundai Motor 18 32 9 6 Hankook Tire 35 42 6 2Isuzu Motors 54 56 33 27 Harman 31 30 43 58Kia Motors 20 36 13 7 Hyundai MOBIS 14 5 2 10Mahindra & Mahindra 56 59 23 12 Johnson Controls 8 8 17 22Maruti Suzuki 58 60 16 8 Koito Mfg. 22 12 29 35Mazda Motor 46 47 52 52 Lear 32 26 35 31Mitsubishi Motors 57 48 56 48 Magna International 26 34 34 36Nissan Motor 28 11 15 14 Michelin 13 18 24 23Porsche 17 40 45 43 NHK Spring 41 12 55 56PSA Peugeot 49 52 60 59 NOK 41 7 49 53Renault 40 22 47 39 Nokian Tyres 34 38 46 45Suzuki Motor 50 46 39 17 Pirelli & C. SpA 11 19 27 47Tata Motors 45 49 3 3 Stanley Electric 41 10 48 54Tesla 52 4 58 60 Sumitomo Rubber 27 23 28 19Toyota Motor 7 3 10 11 Takata 32 12 26 37Volkswagen 2 2 1 4 Tenneco 38 57 53 45
Toyoda Gosei 37 43 54 30Toyota Boshoku 48 39 51 33Toyota Industries 41 21 57 49TRW Automotive 23 26 30 38Valeo S.A. 19 29 40 50Yokohama Rubber 30 23 37 20
Source: Company Data, Morgan Stanley Research
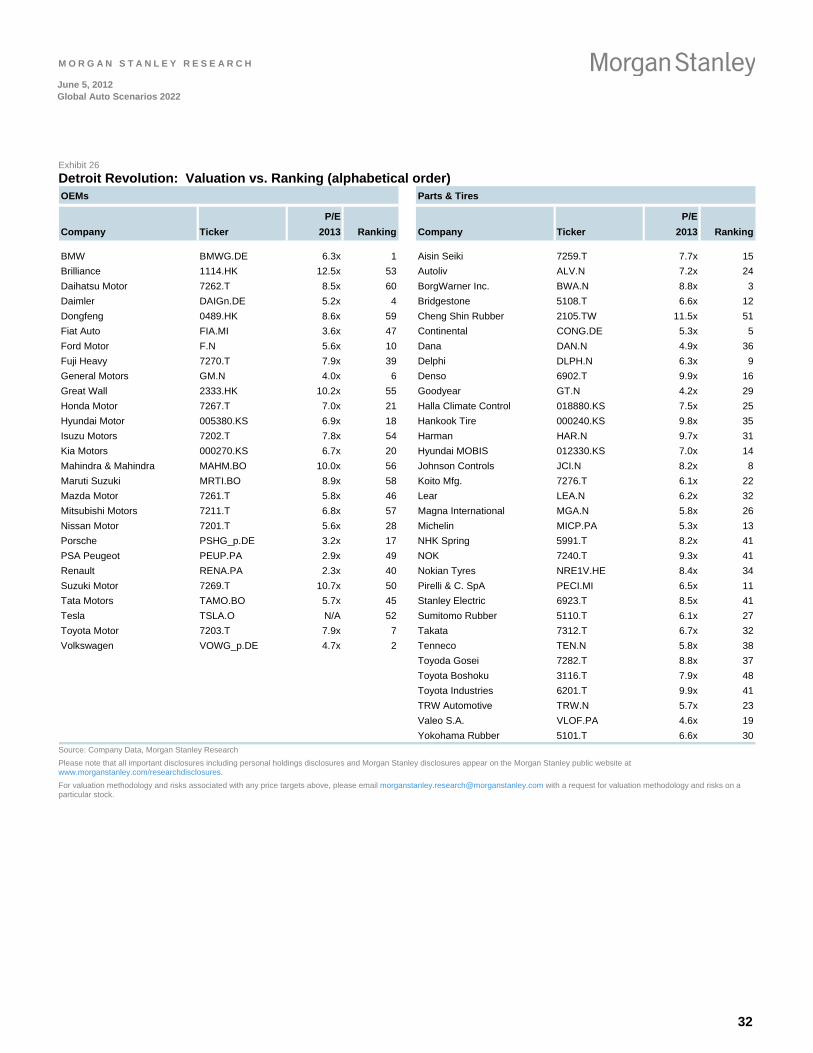
M O R G A N S T A N L E Y R E S E A R C H
June 5, 2012 Global Auto Scenarios 2022
M O R G A N S T A N L E Y B L U E P A P E R Detroit Revolution: Valuation vs. Ranking (alphabetical order) Exhibit 26
OEMs Parts & Tires
P/E P/E
Company Ticker 2013 Ranking Company Ticker 2013 Ranking
BMW BMWG.DE 6.3x 1 Aisin Seiki 7259.T 7.7x 15
Brilliance 1114.HK 12.5x 53 Autoliv ALV.N 7.2x 24
Daihatsu Motor 7262.T 8.5x 60 BorgWarner Inc. BWA.N 8.8x 3
Daimler DAIGn.DE 5.2x 4 Bridgestone 5108.T 6.6x 12
Dongfeng 0489.HK 8.6x 59 Cheng Shin Rubber 2105.TW 11.5x 51
Fiat Auto FIA.MI 3.6x 47 Continental CONG.DE 5.3x 5
Ford Motor F.N 5.6x 10 Dana DAN.N 4.9x 36
Fuji Heavy 7270.T 7.9x 39 Delphi DLPH.N 6.3x 9
General Motors GM.N 4.0x 6 Denso 6902.T 9.9x 16
Great Wall 2333.HK 10.2x 55 Goodyear GT.N 4.2x 29
Honda Motor 7267.T 7.0x 21 Halla Climate Control 018880.KS 7.5x 25
Hyundai Motor 005380.KS 6.9x 18 Hankook Tire 000240.KS 9.8x 35
Isuzu Motors 7202.T 7.8x 54 Harman HAR.N 9.7x 31
Kia Motors 000270.KS 6.7x 20 Hyundai MOBIS 012330.KS 7.0x 14
Mahindra & Mahindra MAHM.BO 10.0x 56 Johnson Controls JCI.N 8.2x 8
Maruti Suzuki MRTI.BO 8.9x 58 Koito Mfg. 7276.T 6.1x 22
Mazda Motor 7261.T 5.8x 46 Lear LEA.N 6.2x 32
Mitsubishi Motors 7211.T 6.8x 57 Magna International MGA.N 5.8x 26
Nissan Motor 7201.T 5.6x 28 Michelin MICP.PA 5.3x 13
Porsche PSHG_p.DE 3.2x 17 NHK Spring 5991.T 8.2x 41
PSA Peugeot PEUP.PA 2.9x 49 NOK 7240.T 9.3x 41
Renault RENA.PA 2.3x 40 Nokian Tyres NRE1V.HE 8.4x 34
Suzuki Motor 7269.T 10.7x 50 Pirelli & C. SpA PECI.MI 6.5x 11
Tata Motors TAMO.BO 5.7x 45 Stanley Electric 6923.T 8.5x 41
Tesla TSLA.O N/A 52 Sumitomo Rubber 5110.T 6.1x 27
Toyota Motor 7203.T 7.9x 7 Takata 7312.T 6.7x 32
Volkswagen VOWG_p.DE 4.7x 2 Tenneco TEN.N 5.8x 38
Toyoda Gosei 7282.T 8.8x 37
Toyota Boshoku 3116.T 7.9x 48
Toyota Industries 6201.T 9.9x 41
TRW Automotive TRW.N 5.7x 23
Valeo S.A. VLOF.PA 4.6x 19
Yokohama Rubber 5101.T 6.6x 30 Source: Company Data, Morgan Stanley Research
Please note that all important disclosures including personal holdings disclosures and Morgan Stanley disclosures appear on the Morgan Stanley public website at www.morganstanley.com/researchdisclosures.
For valuation methodology and risks associated with any price targets above, please email [email protected] with a request for valuation methodology and risks on a particular stock.
32

M O R G A N S T A N L E Y R E S E A R C H
June 5, 2012 Global Auto Scenarios 2022
Exhibit 27
Electric Avenue: Valuation vs. Ranking (alphabetical order) OEMs Parts & Tires
P/E P/E
Company Ticker 2013 Ranking Company Ticker 2013 Ranking
BMW BMWG.DE 6.3x 1 Aisin Seiki 7259.T 7.7x 35
Brilliance 1114.HK 12.5x 55 Autoliv ALV.N 7.2x 33
Daihatsu Motor 7262.T 8.5x 54 BorgWarner Inc. BWA.N 8.8x 37
Daimler DAIGn.DE 5.2x 6 Bridgestone 5108.T 6.6x 17
Dongfeng 0489.HK 8.6x 50 Cheng Shin Rubber 2105.TW 11.5x 44
Fiat Auto FIA.MI 3.6x 53 Continental CONG.DE 5.3x 15
Ford Motor F.N 5.6x 31 Dana DAN.N 4.9x 45
Fuji Heavy 7270.T 7.9x 51 Delphi DLPH.N 6.3x 25
General Motors GM.N 4.0x 9 Denso 6902.T 9.9x 16
Great Wall 2333.HK 10.2x 58 Goodyear GT.N 4.2x 41
Honda Motor 7267.T 7.0x 28 Halla Climate Control 018880.KS 7.5x 20
Hyundai Motor 005380.KS 6.9x 32 Hankook Tire 000240.KS 9.8x 42
Isuzu Motors 7202.T 7.8x 56 Harman HAR.N 9.7x 30
Kia Motors 000270.KS 6.7x 36 Hyundai MOBIS 012330.KS 7.0x 5
Mahindra & Mahindra MAHM.BO 10.0x 59 Johnson Controls JCI.N 8.2x 8
Maruti Suzuki MRTI.BO 8.9x 60 Koito Mfg. 7276.T 6.1x 12
Mazda Motor 7261.T 5.8x 47 Lear LEA.N 6.2x 26
Mitsubishi Motors 7211.T 6.8x 48 Magna International MGA.N 5.8x 34
Nissan Motor 7201.T 5.6x 11 Michelin MICP.PA 5.3x 18
Porsche PSHG_p.DE 3.2x 40 NHK Spring 5991.T 8.2x 12
PSA Peugeot PEUP.PA 2.9x 52 NOK 7240.T 9.3x 7
Renault RENA.PA 2.3x 22 Nokian Tyres NRE1V.HE 8.4x 38
Suzuki Motor 7269.T 10.7x 46 Pirelli & C. SpA PECI.MI 6.5x 19
Tata Motors TAMO.BO 5.7x 49 Stanley Electric 6923.T 8.5x 10
Tesla TSLA.O N/A 4 Sumitomo Rubber 5110.T 6.1x 23
Toyota Motor 7203.T 7.9x 3 Takata 7312.T 6.7x 12
Volkswagen VOWG_p.DE 4.7x 2 Tenneco TEN.N 5.8x 57
Toyoda Gosei 7282.T 8.8x 43
Toyota Boshoku 3116.T 7.9x 39
Toyota Industries 6201.T 9.9x 21
TRW Automotive TRW.N 5.7x 26
Valeo S.A. VLOF.PA 4.6x 29
Yokohama Rubber 5101.T 6.6x 23 Source: Company Data, Morgan Stanley Research
Please note that all important disclosures including personal holdings disclosures and Morgan Stanley disclosures appear on the Morgan Stanley public website at www.morganstanley.com/researchdisclosures.
For valuation methodology and risks associated with any price targets above, please email [email protected] with a request for valuation methodology and risks on a particular stock.
33
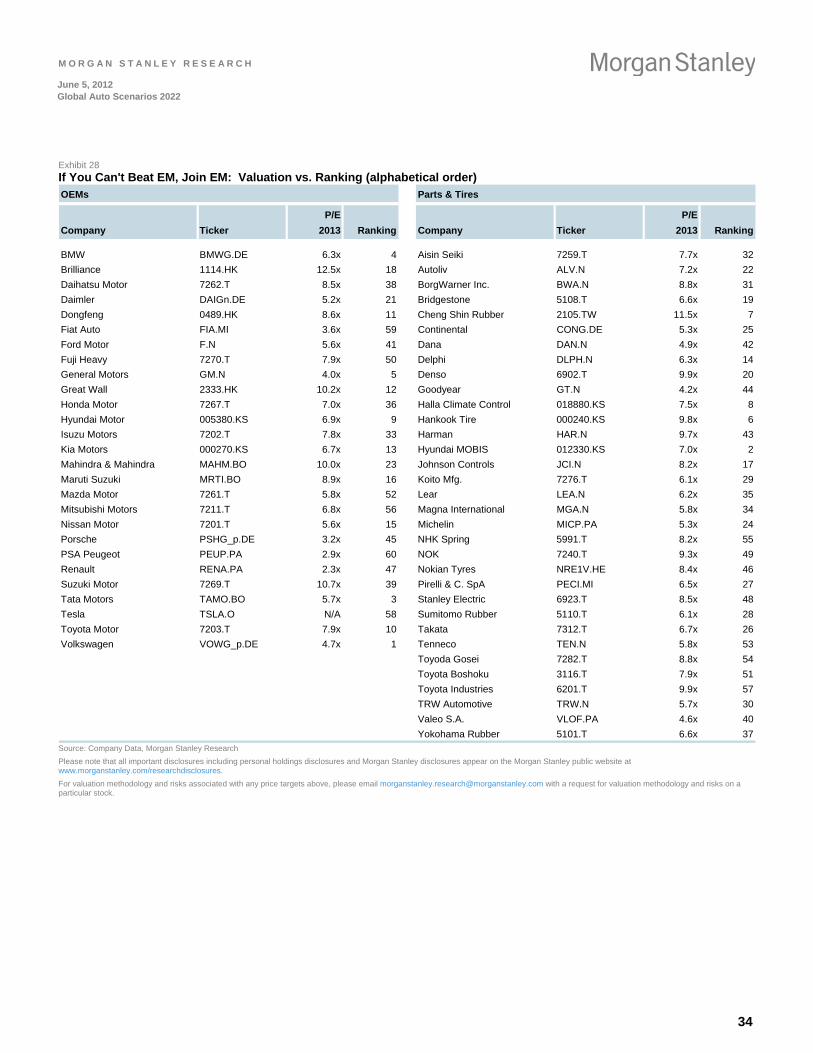
M O R G A N S T A N L E Y R E S E A R C H
June 5, 2012 Global Auto Scenarios 2022
Exhibit 28
If You Can't Beat EM, Join EM: Valuation vs. Ranking (alphabetical order) OEMs Parts & Tires
P/E P/E
Company Ticker 2013 Ranking Company Ticker 2013 Ranking
BMW BMWG.DE 6.3x 4 Aisin Seiki 7259.T 7.7x 32
Brilliance 1114.HK 12.5x 18 Autoliv ALV.N 7.2x 22
Daihatsu Motor 7262.T 8.5x 38 BorgWarner Inc. BWA.N 8.8x 31
Daimler DAIGn.DE 5.2x 21 Bridgestone 5108.T 6.6x 19
Dongfeng 0489.HK 8.6x 11 Cheng Shin Rubber 2105.TW 11.5x 7
Fiat Auto FIA.MI 3.6x 59 Continental CONG.DE 5.3x 25
Ford Motor F.N 5.6x 41 Dana DAN.N 4.9x 42
Fuji Heavy 7270.T 7.9x 50 Delphi DLPH.N 6.3x 14
General Motors GM.N 4.0x 5 Denso 6902.T 9.9x 20
Great Wall 2333.HK 10.2x 12 Goodyear GT.N 4.2x 44
Honda Motor 7267.T 7.0x 36 Halla Climate Control 018880.KS 7.5x 8
Hyundai Motor 005380.KS 6.9x 9 Hankook Tire 000240.KS 9.8x 6
Isuzu Motors 7202.T 7.8x 33 Harman HAR.N 9.7x 43
Kia Motors 000270.KS 6.7x 13 Hyundai MOBIS 012330.KS 7.0x 2
Mahindra & Mahindra MAHM.BO 10.0x 23 Johnson Controls JCI.N 8.2x 17
Maruti Suzuki MRTI.BO 8.9x 16 Koito Mfg. 7276.T 6.1x 29
Mazda Motor 7261.T 5.8x 52 Lear LEA.N 6.2x 35
Mitsubishi Motors 7211.T 6.8x 56 Magna International MGA.N 5.8x 34
Nissan Motor 7201.T 5.6x 15 Michelin MICP.PA 5.3x 24
Porsche PSHG_p.DE 3.2x 45 NHK Spring 5991.T 8.2x 55
PSA Peugeot PEUP.PA 2.9x 60 NOK 7240.T 9.3x 49
Renault RENA.PA 2.3x 47 Nokian Tyres NRE1V.HE 8.4x 46
Suzuki Motor 7269.T 10.7x 39 Pirelli & C. SpA PECI.MI 6.5x 27
Tata Motors TAMO.BO 5.7x 3 Stanley Electric 6923.T 8.5x 48
Tesla TSLA.O N/A 58 Sumitomo Rubber 5110.T 6.1x 28
Toyota Motor 7203.T 7.9x 10 Takata 7312.T 6.7x 26
Volkswagen VOWG_p.DE 4.7x 1 Tenneco TEN.N 5.8x 53
Toyoda Gosei 7282.T 8.8x 54
Toyota Boshoku 3116.T 7.9x 51
Toyota Industries 6201.T 9.9x 57
TRW Automotive TRW.N 5.7x 30
Valeo S.A. VLOF.PA 4.6x 40
Yokohama Rubber 5101.T 6.6x 37 Source: Company Data, Morgan Stanley Research
Please note that all important disclosures including personal holdings disclosures and Morgan Stanley disclosures appear on the Morgan Stanley public website at www.morganstanley.com/researchdisclosures.
For valuation methodology and risks associated with any price targets above, please email [email protected] with a request for valuation methodology and risks on a particular stock.
34
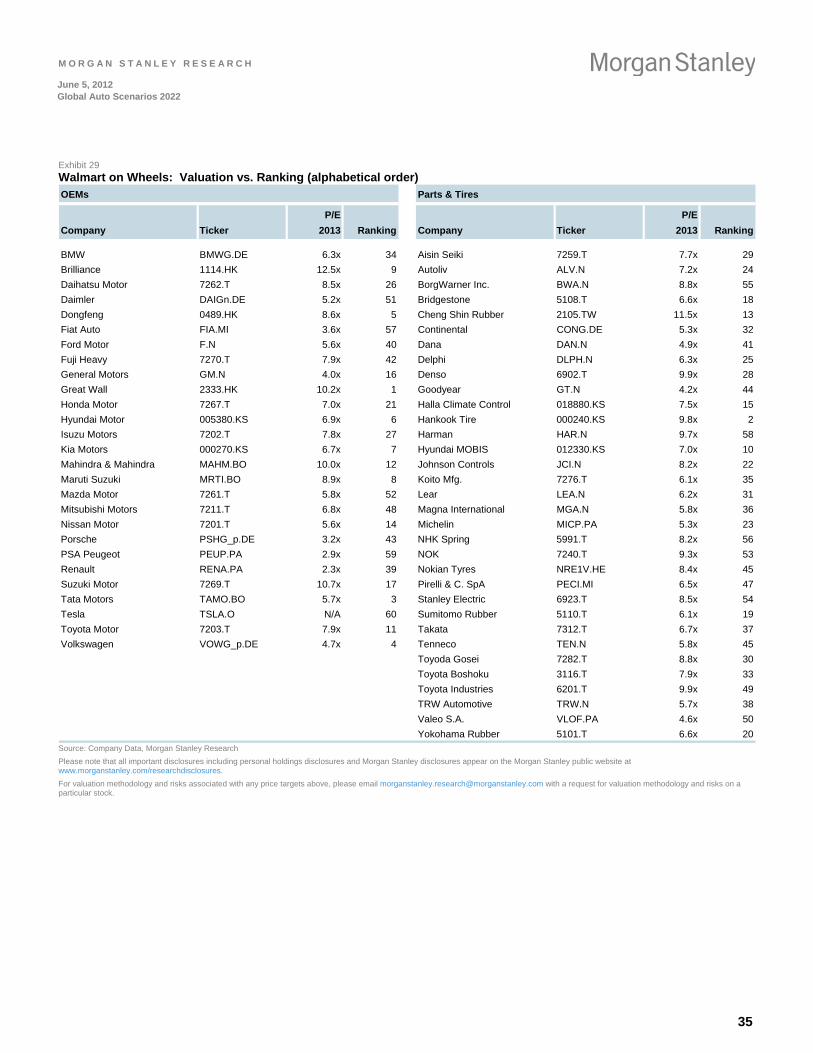
M O R G A N S T A N L E Y R E S E A R C H
June 5, 2012 Global Auto Scenarios 2022
Exhibit 29
Walmart on Wheels: Valuation vs. Ranking (alphabetical order) OEMs Parts & Tires
P/E P/E
Company Ticker 2013 Ranking Company Ticker 2013 Ranking
BMW BMWG.DE 6.3x 34 Aisin Seiki 7259.T 7.7x 29
Brilliance 1114.HK 12.5x 9 Autoliv ALV.N 7.2x 24
Daihatsu Motor 7262.T 8.5x 26 BorgWarner Inc. BWA.N 8.8x 55
Daimler DAIGn.DE 5.2x 51 Bridgestone 5108.T 6.6x 18
Dongfeng 0489.HK 8.6x 5 Cheng Shin Rubber 2105.TW 11.5x 13
Fiat Auto FIA.MI 3.6x 57 Continental CONG.DE 5.3x 32
Ford Motor F.N 5.6x 40 Dana DAN.N 4.9x 41
Fuji Heavy 7270.T 7.9x 42 Delphi DLPH.N 6.3x 25
General Motors GM.N 4.0x 16 Denso 6902.T 9.9x 28
Great Wall 2333.HK 10.2x 1 Goodyear GT.N 4.2x 44
Honda Motor 7267.T 7.0x 21 Halla Climate Control 018880.KS 7.5x 15
Hyundai Motor 005380.KS 6.9x 6 Hankook Tire 000240.KS 9.8x 2
Isuzu Motors 7202.T 7.8x 27 Harman HAR.N 9.7x 58
Kia Motors 000270.KS 6.7x 7 Hyundai MOBIS 012330.KS 7.0x 10
Mahindra & Mahindra MAHM.BO 10.0x 12 Johnson Controls JCI.N 8.2x 22
Maruti Suzuki MRTI.BO 8.9x 8 Koito Mfg. 7276.T 6.1x 35
Mazda Motor 7261.T 5.8x 52 Lear LEA.N 6.2x 31
Mitsubishi Motors 7211.T 6.8x 48 Magna International MGA.N 5.8x 36
Nissan Motor 7201.T 5.6x 14 Michelin MICP.PA 5.3x 23
Porsche PSHG_p.DE 3.2x 43 NHK Spring 5991.T 8.2x 56
PSA Peugeot PEUP.PA 2.9x 59 NOK 7240.T 9.3x 53
Renault RENA.PA 2.3x 39 Nokian Tyres NRE1V.HE 8.4x 45
Suzuki Motor 7269.T 10.7x 17 Pirelli & C. SpA PECI.MI 6.5x 47
Tata Motors TAMO.BO 5.7x 3 Stanley Electric 6923.T 8.5x 54
Tesla TSLA.O N/A 60 Sumitomo Rubber 5110.T 6.1x 19
Toyota Motor 7203.T 7.9x 11 Takata 7312.T 6.7x 37
Volkswagen VOWG_p.DE 4.7x 4 Tenneco TEN.N 5.8x 45
Toyoda Gosei 7282.T 8.8x 30
Toyota Boshoku 3116.T 7.9x 33
Toyota Industries 6201.T 9.9x 49
TRW Automotive TRW.N 5.7x 38
Valeo S.A. VLOF.PA 4.6x 50
Yokohama Rubber 5101.T 6.6x 20 Source: Company Data, Morgan Stanley Research
Please note that all important disclosures including personal holdings disclosures and Morgan Stanley disclosures appear on the Morgan Stanley public website at www.morganstanley.com/researchdisclosures.
For valuation methodology and risks associated with any price targets above, please email [email protected] with a request for valuation methodology and risks on a particular stock.
35
M O R G A N S T A N L E Y R E S E A R C H
June 5, 2012 Global Auto Scenarios 2022
M O R G A N S T A N L E Y B L U E P A P E R Morgan Stanley Blue Papers address long-term, structural business changes that are reshaping the fundamentals of entire economies and industries around the globe. Analysts, economists, and strategists in our global research network collaborate in the Blue Papers to address critical themes that require a coordinated perspective across regions, sectors, or asset classes.
Morgan Stanley Blue Papers
Recently Published Blue Papers
Tablet Landscape Evolution Window(s) of Opportunity May 31, 2012
The US Healthcare Formula Cost Control and True Innovation June 16, 2011
Financials: CRE Funding Shift EU Shakes, US Selectively Takes May 25, 2012
Cloud Computing Takes Off Market Set to Boom as Migration Accelerates May 23, 2011
The China Files The Logistics Journey Is Just Beginning April 24, 2012
China High-Speed Rail On the Economic Fast Track May 15, 2011
Solvency The Long and Winding Road March 23, 2012
Asian Inflation Consumers Adjust As Inflation Worsens March 31, 2011
Wholesale & Investment Banking Outlook Decision Time for Wholesale Banks March 23, 2012
Wholesale & Investment Banking Reshaping the Model March 23, 2011
Banks Deleveraging and Real Estate Implication of a €400-700bn Financing Gap March 15, 2012
Global Gas A Decade of Two Halves March 14, 2011
The China Files China’s Appetite for Protein Turns Global October 25, 2011
Tablet Demand and Disruption Mobile Users Come of Age February 14, 2011
36
M O R G A N S T A N L E Y R E S E A R C H
37
June 5, 2012 Global Auto Scenarios 2022
M O R G A N S T A N L E Y B L U E P A P E R
The China Files Chinese Economy through 2020 November 8, 2010
The China Files Asian Corporates & China’s Megatransition November 8, 2010
The China Files European Corporates & China’s Megatransition October 29, 2010
Petrochemicals Preparing for a Supercycle October 18, 2010
Solvency 2 Quantitative & Strategic Impact, The Tide is Going Out September 22, 2010
The China Files US Corporates and China’s Megatransition September 20, 2010
Brazil Infrastructure
Paving the Way May 5, 2010
To find downloadable versions of these publications and information on Other Morgan Stanley reports, visit www.morganstanley.com
M O R G A N S T A N L E Y R E S E A R C H
June 5, 2012 Global Auto Scenarios 2022
M O R G A N S T A N L E Y B L U E P A P E R Morgan Stanley Bank AG is currently acting as financial advisor to the family shareholders of Porsche Holding SE in connection with the potential combination of Porsche Automobil Holding SE and Volkswagen AG.
This report and the information herein are not intended to serve as an endorsement of the proposed transaction.
This report was prepared solely upon information generally available to the public. No representation is made that it is accurate and complete. This report is not a recommendation or an offer to buy or sell the securities mentioned. Please refer to the notes at the end of this report.
Morgan Stanley is acting as financial advisor to General Motors Co. ("GM") in connection with the offer to provide select GM U.S salaried retirees a lump-sum payment and other retirees with a continued monthly payment securely administered and paid by The Prudential Insurance Company of America, a Prudential Financial Inc. company, as announced June 1, 2012.
The transactions are subject to regulatory review. GM has agreed to pay fees to Morgan Stanley for its financial services. Please refer to the notes at the end of the report.
Morgan Stanley is acting as sole financial adviser to PSA Peugeot Citroen SA ("Peugeot") in relation to their strategic alliance with General Motors Co., as announced on February 29, 2012. The proposed acquisition is subject to requisite regulatory approvals and other customary closing conditions. Peugeot has agreed to pay fees to Morgan Stanley for its financial services that are contingent upon the consummation of the proposed transaction. Please refer to the notes at the end of the report.
38
M O R G A N S T A N L E Y R E S E A R C H
June 5, 2012 Global Auto Scenarios 2022
Disclosure Section M O R G A N S T A N L E Y B L U E P A P E R The information and opinions in Morgan Stanley Research were prepared by Morgan Stanley & Co. LLC, and/or Morgan Stanley C.T.V.M. S.A., and/or Morgan Stanley Mexico, Casa de Bolsa, S.A. de C.V. As used in this disclosure section, "Morgan Stanley" includes Morgan Stanley & Co. LLC, Morgan Stanley C.T.V.M. S.A., Morgan Stanley Mexico, Casa de Bolsa, S.A. de C.V. and their affiliates as necessary. For important disclosures, stock price charts and equity rating histories regarding companies that are the subject of this report, please see the Morgan Stanley Research Disclosure Website at www.morganstanley.com/researchdisclosures, or contact your investment representative or Morgan Stanley Research at 1585 Broadway, (Attention: Research Management), New York, NY, 10036 USA. For valuation methodology and risks associated with any price targets referenced in this research report, please email [email protected] with a request for valuation methodology and risks on a particular stock or contact your investment representative or Morgan Stanley Research at 1585 Broadway, (Attention: Research Management), New York, NY 10036 USA.
Analyst Certification The following analysts hereby certify that their views about the companies and their securities discussed in this report are accurately expressed and that they have not received and will not receive direct or indirect compensation in exchange for expressing specific recommendations or views in this report: Lily Chen, Ryosuke Hoshino, Hikaru Ishikawa, Adam Jonas, Shinji Kakiuchi, Laura Lembke, Sangkyoo Park, Stuart Pearson, Ravi Shanker, Binay Singh, Edoardo Spina, Kate Zhu. Unless otherwise stated, the individuals listed on the cover page of this report are research analysts.
Global Research Conflict Management Policy Morgan Stanley Research has been published in accordance with our conflict management policy, which is available at www.morganstanley.com/institutional/research/conflictpolicies.
Important US Regulatory Disclosures on Subject Companies As of May 31, 2012, Morgan Stanley beneficially owned 1% or more of a class of common equity securities of the following companies covered in Morgan Stanley Research: BMW, Continental, Daimler, FIAT, Great Wall Motor Company Limited, Halla Climate Control, Hyundai Motor, PSA Peugeot-Citroen, Renault, Suzuki Motor, Tata Motors. Within the last 12 months, Morgan Stanley managed or co-managed a public offering (or 144A offering) of securities of BMW, Delphi Automotive PLC, Denso, Ford Motor Company, General Motors Company, Hyundai MOBIS, Kia Motors, PSA Peugeot-Citroen, Tata Motors, Toyota Industries, Toyota Motor, Volkswagen. Within the last 12 months, Morgan Stanley has received compensation for investment banking services from Autoliv, BMW, BorgWarner Inc., Continental, Daimler, Delphi Automotive PLC, Denso, FIAT, Ford Motor Company, General Motors Company, Goodyear Tire & Rubber Company, Hyundai MOBIS, Hyundai Motor, Kia Motors, Michelin, NHK Spring, Porsche, PSA Peugeot-Citroen, Renault, Sumitomo Rubber, Tata Motors, Tenneco Inc., Tesla Motors Inc., Toyota Industries, Toyota Motor, TRW Automotive Holdings Corp., Valeo S.A., Volkswagen. In the next 3 months, Morgan Stanley expects to receive or intends to seek compensation for investment banking services from Aisin Seiki, Autoliv, BMW, BorgWarner Inc., Bridgestone, Brilliance China Automotive, Cheng Shin Rubber, Continental, Daihatsu Motor, Daimler, Delphi Automotive PLC, Denso, FIAT, Ford Motor Company, Fuji Heavy Industries, General Motors Company, Goodyear Tire & Rubber Company, Great Wall Motor Company Limited, Honda Motor, Hyundai MOBIS, Hyundai Motor, Isuzu Motors, Johnson Controls, Inc., Kia Motors, Koito Mfg., Mahindra & Mahindra, Mazda Motor, Michelin, Mitsubishi Motors, NHK Spring, Nissan Motor, NOK, Pirelli & C. SpA, Porsche, PSA Peugeot-Citroen, Renault, Stanley Electric, Sumitomo Rubber, Suzuki Motor, Takata, Tata Motors, Tenneco Inc., Tesla Motors Inc., Toyoda Gosei, Toyota Boshoku, Toyota Industries, Toyota Motor, Valeo S.A., Volkswagen, Yokohama Rubber. Within the last 12 months, Morgan Stanley has received compensation for products and services other than investment banking services from Aisin Seiki, Autoliv, BMW, BorgWarner Inc., Continental, Dana Holding Corp., Delphi Automotive PLC, Denso, FIAT, Ford Motor Company, General Motors Company, Goodyear Tire & Rubber Company, Hyundai MOBIS, Hyundai Motor, Lear Corporation, Mitsubishi Motors, NHK Spring, Nissan Motor, Porsche, Renault, Sumitomo Rubber, Tata Motors, Tenneco Inc., Toyota Motor, Volkswagen, Yulon Motor. Within the last 12 months, Morgan Stanley has provided or is providing investment banking services to, or has an investment banking client relationship with, the following company: Autoliv, BMW, BorgWarner Inc., Bridgestone, Brilliance China Automotive, Cheng Shin Rubber, Continental, Daimler, Delphi Automotive PLC, Denso, FIAT, Ford Motor Company, General Motors Company, Goodyear Tire & Rubber Company, Great Wall Motor Company Limited, Honda Motor, Hyundai MOBIS, Hyundai Motor, Johnson Controls, Inc., Kia Motors, Mahindra & Mahindra, Mazda Motor, Michelin, Mitsubishi Motors, Nissan Motor, Pirelli & C. SpA, Porsche, PSA Peugeot-Citroen, Renault, Suzuki Motor, Tata Motors, Tenneco Inc., Tesla Motors Inc., Toyota Motor, TRW Automotive Holdings Corp., Valeo S.A., Volkswagen. Within the last 12 months, Morgan Stanley has either provided or is providing non-investment banking, securities-related services to and/or in the past has entered into an agreement to provide services or has a client relationship with the following company: Aisin Seiki, Autoliv, BMW, BorgWarner Inc., Continental, Daimler, Dana Holding Corp., Delphi Automotive PLC, Denso, FIAT, Ford Motor Company, Fuji Heavy Industries, General Motors Company, Goodyear Tire & Rubber Company, Honda Motor, Hyundai MOBIS, Hyundai Motor, Johnson Controls, Inc., Koito Mfg., Lear Corporation, Mitsubishi Motors, NHK Spring, Nissan Motor, Porsche, PSA Peugeot-Citroen, Renault, Sumitomo Rubber, Suzuki Motor, Tata Motors, Tenneco Inc., Toyota Motor, Valeo S.A., Volkswagen, Yulon Motor. Morgan Stanley & Co. LLC makes a market in the securities of Autoliv, BMW, BorgWarner Inc., Daimler, Dana Holding Corp., Delphi Automotive PLC, FIAT, Ford Motor Company, General Motors Company, Goodyear Tire & Rubber Company, Harman International Industries Inc., Honda Motor, Hyundai Motor, Johnson Controls, Inc., Lear Corporation, Magna International Inc., Tata Motors, Tenneco Inc., Tesla Motors Inc., Toyota Motor, TRW Automotive Holdings Corp.. The equity research analysts or strategists principally responsible for the preparation of Morgan Stanley Research have received compensation based upon various factors, including quality of research, investor client feedback, stock picking, competitive factors, firm revenues and overall investment banking revenues. Morgan Stanley and its affiliates do business that relates to companies/instruments covered in Morgan Stanley Research, including market making, providing liquidity and specialized trading, risk arbitrage and other proprietary trading, fund management, commercial banking, extension of credit, investment services and investment banking. Morgan Stanley sells to and buys from customers the securities/instruments of companies covered in Morgan Stanley Research on a principal basis. Morgan Stanley may have a position in the debt of the Company or instruments discussed in this report. Certain disclosures listed above are also for compliance with applicable regulations in non-US jurisdictions.
STOCK RATINGS Morgan Stanley uses a relative rating system using terms such as Overweight, Equal-weight, Not-Rated or Underweight (see definitions below). Morgan Stanley does not assign ratings of Buy, Hold or Sell to the stocks we cover. Overweight, Equal-weight, Not-Rated and Underweight are not the equivalent of buy, hold and sell. Investors should carefully read the definitions of all ratings used in Morgan Stanley Research. In addition, since Morgan Stanley Research contains more complete information concerning the analyst's views, investors should carefully read Morgan Stanley Research, in its entirety, and not infer the contents from the rating alone. In any case, ratings (or research) should not be used or relied upon as investment advice. An investor's decision to buy or sell a stock should depend on individual circumstances (such as the investor's existing holdings) and other considerations.
39
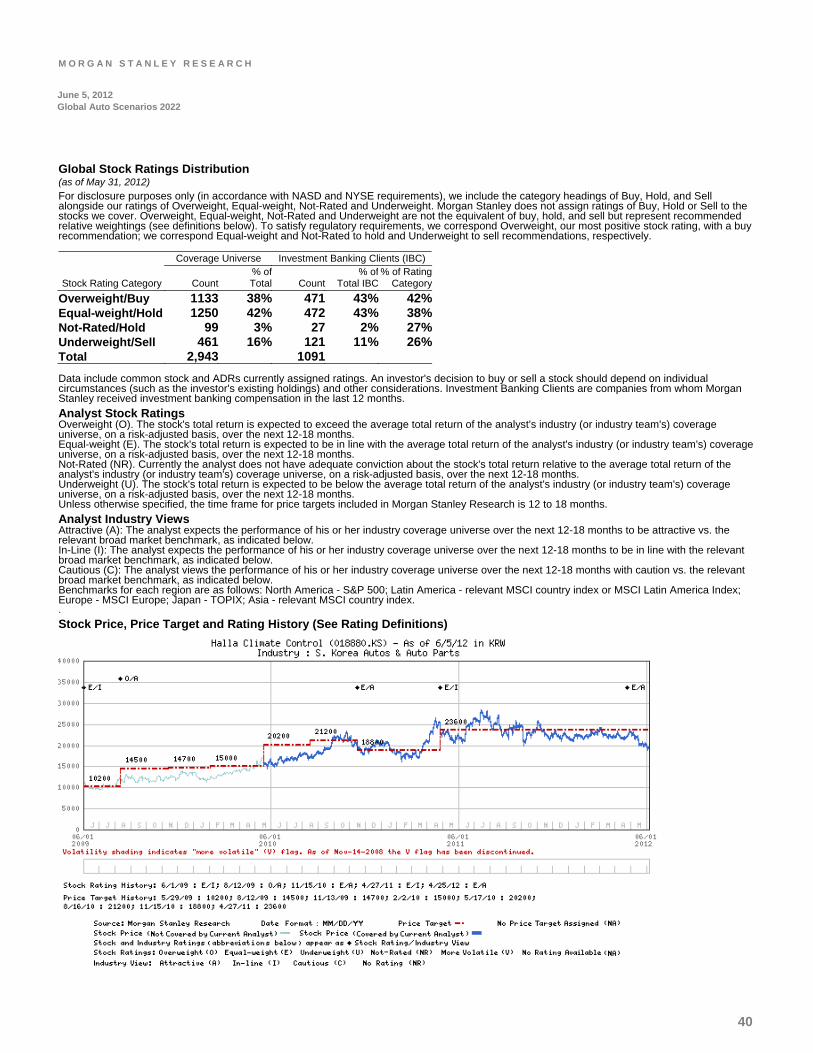
M O R G A N S T A N L E Y R E S E A R C H
June 5, 2012 Global Auto Scenarios 2022
M L E Y B L U E P A P E R O R G A N S T A N(as of May 31, 2012) Global Stock Ratings Distribution
For disclosure purposes only (in accordance with NASD and NYSE requirements), we include the category headings of Buy, Hold, and Sell alongside our ratings of Overweight, Equal-weight, Not-Rated and Underweight. Morgan Stanley does not assign ratings of Buy, Hold or Sell to the stocks we cover. Overweight, Equal-weight, Not-Rated and Underweight are not the equivalent of buy, hold, and sell but represent recommended relative weightings (see definitions below). To satisfy regulatory requirements, we correspond Overweight, our most positive stock rating, with a buy recommendation; we correspond Equal-weight and Not-Rated to hold and Underweight to sell recommendations, respectively. Coverage Universe Investment Banking Clients (IBC)
Stock Rating Category Count % of Total Count
% of Total IBC
% of Rating Category
Overweight/Buy 1133 38% 471 43% 42%Equal-weight/Hold 1250 42% 472 43% 38%Not-Rated/Hold 99 3% 27 2% 27%Underweight/Sell 461 16% 121 11% 26%Total 2,943 1091 Data include common stock and ADRs currently assigned ratings. An investor's decision to buy or sell a stock should depend on individual circumstances (such as the investor's existing holdings) and other considerations. Investment Banking Clients are companies from whom Morgan Stanley received investment banking compensation in the last 12 months.
Analyst Stock Ratings Overweight (O). The stock's total return is expected to exceed the average total return of the analyst's industry (or industry team's) coverage universe, on a risk-adjusted basis, over the next 12-18 months. Equal-weight (E). The stock's total return is expected to be in line with the average total return of the analyst's industry (or industry team's) coverage universe, on a risk-adjusted basis, over the next 12-18 months. Not-Rated (NR). Currently the analyst does not have adequate conviction about the stock's total return relative to the average total return of the analyst's industry (or industry team's) coverage universe, on a risk-adjusted basis, over the next 12-18 months. Underweight (U). The stock's total return is expected to be below the average total return of the analyst's industry (or industry team's) coverage universe, on a risk-adjusted basis, over the next 12-18 months. Unless otherwise specified, the time frame for price targets included in Morgan Stanley Research is 12 to 18 months.
Analyst Industry Views Attractive (A): The analyst expects the performance of his or her industry coverage universe over the next 12-18 months to be attractive vs. the relevant broad market benchmark, as indicated below. In-Line (I): The analyst expects the performance of his or her industry coverage universe over the next 12-18 months to be in line with the relevant broad market benchmark, as indicated below. Cautious (C): The analyst views the performance of his or her industry coverage universe over the next 12-18 months with caution vs. the relevant broad market benchmark, as indicated below. Benchmarks for each region are as follows: North America - S&P 500; Latin America - relevant MSCI country index or MSCI Latin America Index; Europe - MSCI Europe; Japan - TOPIX; Asia - relevant MSCI country index. .
Stock Price, Price Target and Rating History (See Rating Definitions)
40
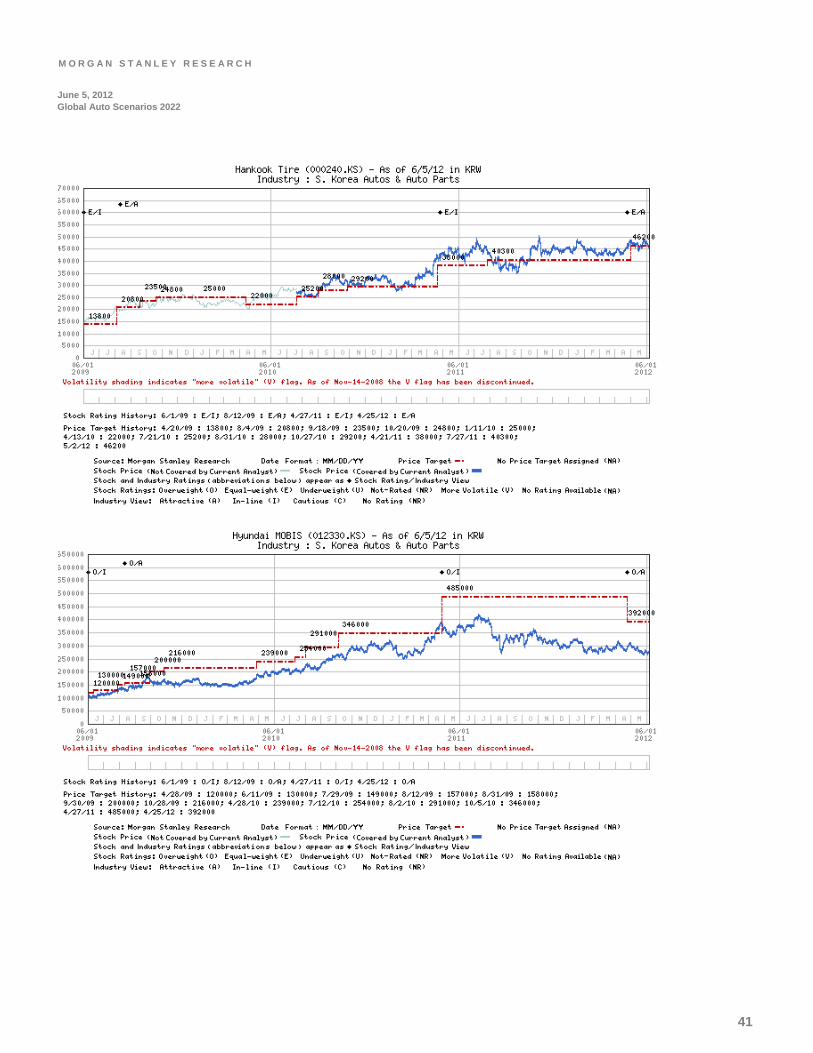
M O R G A N S T A N L E Y R E S E A R C H
June 5, 2012 Global Auto Scenarios 2022
M O R G A N S T A N L E Y B L U E P A P E R
41
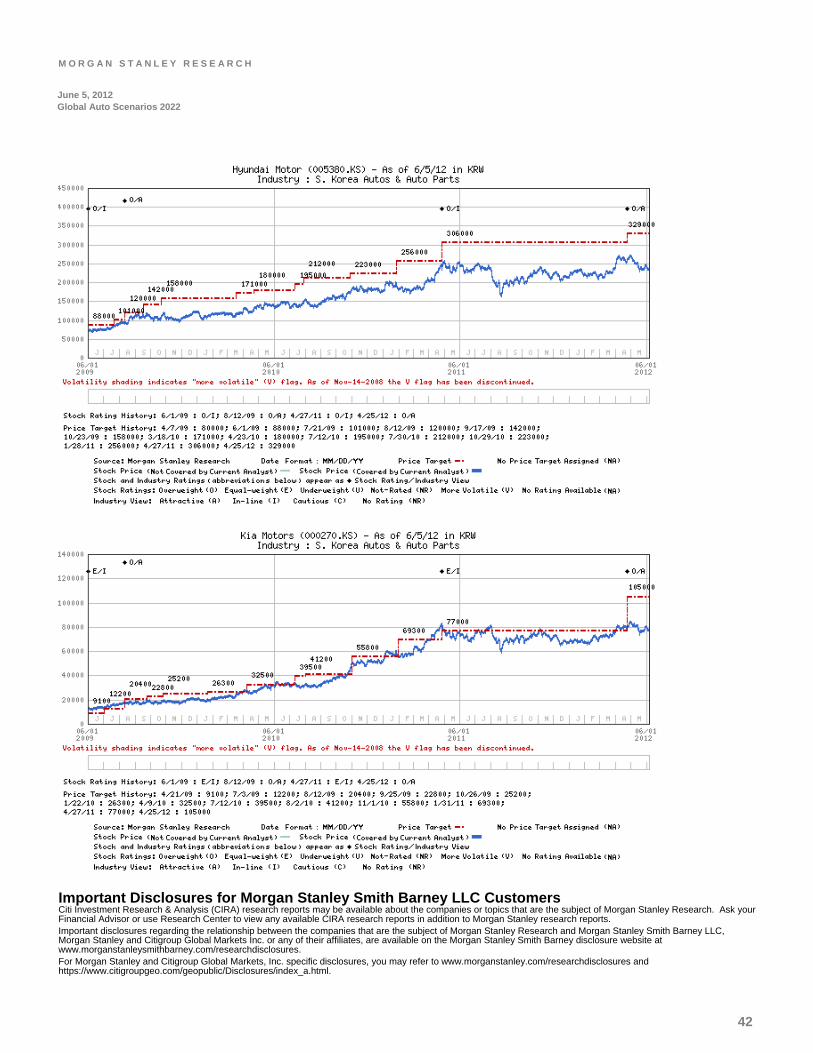
M O R G A N S T A N L E Y R E S E A R C H
June 5, 2012 Global Auto Scenarios 2022
M O R G A N S T A N L E Y B L U E P A P E R
Important Disclosures for Morgan Stanley Smith Barney LLC Customers Citi Investment Research & Analysis (CIRA) research reports may be available about the companies or topics that are the subject of Morgan Stanley Research. Ask your Financial Advisor or use Research Center to view any available CIRA research reports in addition to Morgan Stanley research reports. Important disclosures regarding the relationship between the companies that are the subject of Morgan Stanley Research and Morgan Stanley Smith Barney LLC, Morgan Stanley and Citigroup Global Markets Inc. or any of their affiliates, are available on the Morgan Stanley Smith Barney disclosure website at www.morganstanleysmithbarney.com/researchdisclosures. For Morgan Stanley and Citigroup Global Markets, Inc. specific disclosures, you may refer to www.morganstanley.com/researchdisclosures and https://www.citigroupgeo.com/geopublic/Disclosures/index_a.html.
42
M O R G A N S T A N L E Y R E S E A R C H
June 5, 2012 Global Auto Scenarios 2022
M O R G A N S T A N L E Y B L U E P AOther Important Disclosures
P E R Each Morgan Stanley Equity Research report is reviewed and approved on behalf of Morgan Stanley Smith Barney LLC. This review and approval is conducted by the same person who reviews the Equity Research report on behalf of Morgan Stanley. This could create a conflict of interest.
Morgan Stanley & Co. International PLC and its affiliates have a significant financial interest in the debt securities of Aisin Seiki, Autoliv, BMW, BorgWarner Inc., Bridgestone, Continental, Daimler, FIAT, Ford Motor Company, Fuji Heavy Industries, General Motors Company, Goodyear Tire & Rubber Company, Hyundai Motor, Johnson Controls, Inc., Kia Motors, Lear Corporation, Magna International Inc., Mazda Motor, Michelin, Nissan Motor, Pirelli & C. SpA, Porsche, PSA Peugeot-Citroen, Renault, Sumitomo Rubber, Suzuki Motor, Tata Motors, Tenneco Inc., Toyota Industries, Toyota Motor, Valeo S.A., Volkswagen. Morgan Stanley is not acting as a municipal advisor and the opinions or views contained herein are not intended to be, and do not constitute, advice within the meaning of Section 975 of the Dodd-Frank Wall Street Reform and Consumer Protection Act. Morgan Stanley produces an equity research product called a "Tactical Idea." Views contained in a "Tactical Idea" on a particular stock may be contrary to the recommendations or views expressed in research on the same stock. This may be the result of differing time horizons, methodologies, market events, or other factors. For all research available on a particular stock, please contact your sales representative or go to Client Link at www.morganstanley.com. Morgan Stanley Research does not provide individually tailored investment advice. Morgan Stanley Research has been prepared without regard to the circumstances and objectives of those who receive it. Morgan Stanley recommends that investors independently evaluate particular investments and strategies, and encourages investors to seek the advice of a financial adviser. The appropriateness of an investment or strategy will depend on an investor's circumstances and objectives. The securities, instruments, or strategies discussed in Morgan Stanley Research may not be suitable for all investors, and certain investors may not be eligible to purchase or participate in some or all of them. Morgan Stanley Research is not an offer to buy or sell any security/instrument or to participate in any trading strategy. The value of and income from your investments may vary because of changes in interest rates, foreign exchange rates, default rates, prepayment rates, securities/instruments prices, market indexes, operational or financial conditions of companies or other factors. There may be time limitations on the exercise of options or other rights in securities/instruments transactions. Past performance is not necessarily a guide to future performance. Estimates of future performance are based on assumptions that may not be realized. If provided, and unless otherwise stated, the closing price on the cover page is that of the primary exchange for the subject company's securities/instruments. The fixed income research analysts, strategists or economists principally responsible for the preparation of Morgan Stanley Research have received compensation based upon various factors, including quality, accuracy and value of research, firm profitability or revenues (which include fixed income trading and capital markets profitability or revenues), client feedback and competitive factors. Fixed Income Research analysts', strategists' or economists' compensation is not linked to investment banking or capital markets transactions performed by Morgan Stanley or the profitability or revenues of particular trading desks. Morgan Stanley Research is not an offer to buy or sell or the solicitation of an offer to buy or sell any security/instrument or to participate in any particular trading strategy. The "Important US Regulatory Disclosures on Subject Companies" section in Morgan Stanley Research lists all companies mentioned where Morgan Stanley owns 1% or more of a class of common equity securities of the companies. For all other companies mentioned in Morgan Stanley Research, Morgan Stanley may have an investment of less than 1% in securities/instruments or derivatives of securities/instruments of companies and may trade them in ways different from those discussed in Morgan Stanley Research. Employees of Morgan Stanley not involved in the preparation of Morgan Stanley Research may have investments in securities/instruments or derivatives of securities/instruments of companies mentioned and may trade them in ways different from those discussed in Morgan Stanley Research. Derivatives may be issued by Morgan Stanley or associated persons. With the exception of information regarding Morgan Stanley, Morgan Stanley Research is based on public information. Morgan Stanley makes every effort to use reliable, comprehensive information, but we make no representation that it is accurate or complete. We have no obligation to tell you when opinions or information in Morgan Stanley Research change apart from when we intend to discontinue equity research coverage of a subject company. Facts and views presented in Morgan Stanley Research have not been reviewed by, and may not reflect information known to, professionals in other Morgan Stanley business areas, including investment banking personnel. Morgan Stanley Research personnel may participate in company events such as site visits and are generally prohibited from accepting payment by the company of associated expenses unless pre-approved by authorized members of Research management. Morgan Stanley may make investment decisions or take proprietary positions that are inconsistent with the recommendations or views in this report. To our readers in Taiwan: Information on securities/instruments that trade in Taiwan is distributed by Morgan Stanley Taiwan Limited ("MSTL"). Such information is for your reference only. Information on any securities/instruments issued by a company owned by the government of or incorporated in the PRC and listed in on the Stock Exchange of Hong Kong ("SEHK"), namely the H-shares, including the component company stocks of the Stock Exchange of Hong Kong ("SEHK")'s Hang Seng China Enterprise Index is distributed only to Taiwan Securities Investment Trust Enterprises ("SITE"). The reader should independently evaluate the investment risks and is solely responsible for their investment decisions. Morgan Stanley Research may not be distributed to the public media or quoted or used by the public media without the express written consent of Morgan Stanley. To our readers in Hong Kong: Information is distributed in Hong Kong by and on behalf of, and is attributable to, Morgan Stanley Asia Limited as part of its regulated activities in Hong Kong. If you have any queries concerning Morgan Stanley Research, please contact our Hong Kong sales representatives. Information on securities/instruments that do not trade in Taiwan is for informational purposes only and is not to be construed as a recommendation or a solicitation to trade in such securities/instruments. MSTL may not execute transactions for clients in these securities/instruments. Morgan Stanley is not incorporated under PRC law and the research in relation to this report is conducted outside the PRC. Morgan Stanley Research does not constitute an offer to sell or the solicitation of an offer to buy any securities in the PRC. PRC investors shall have the relevant qualifications to invest in such securities and shall be responsible for obtaining all relevant approvals, licenses, verifications and/or registrations from the relevant governmental authorities themselves. Morgan Stanley Research is disseminated in Brazil by Morgan Stanley C.T.V.M. S.A.; in Japan by Morgan Stanley MUFG Securities Co., Ltd. and, for Commodities related research reports only, Morgan Stanley Capital Group Japan Co., Ltd; in Hong Kong by Morgan Stanley Asia Limited (which accepts responsibility for its contents); in Singapore by Morgan Stanley Asia (Singapore) Pte. (Registration number 199206298Z) and/or Morgan Stanley Asia (Singapore) Securities Pte Ltd (Registration number 200008434H), regulated by the Monetary Authority of Singapore (which accepts legal responsibility for its contents and should be contacted with respect to any matters arising from, or in connection with, Morgan Stanley Research); in Australia to "wholesale clients" within the meaning of the Australian Corporations Act by Morgan Stanley Australia Limited A.B.N. 67 003 734 576, holder of Australian financial services license No. 233742, which accepts responsibility for its contents; in Australia to "wholesale clients" and "retail clients" within the meaning of the Australian Corporations Act by Morgan Stanley Smith Barney Australia Pty Ltd (A.B.N. 19 009 145 555, holder of Australian financial services license No. 240813, which accepts responsibility for its contents; in Korea by Morgan Stanley & Co International plc, Seoul Branch; in India by Morgan Stanley India Company Private Limited; in Canada by Morgan Stanley Canada Limited, which has approved of and takes responsibility for its contents in Canada; in Germany by Morgan Stanley Bank AG, Frankfurt am Main and Morgan Stanley Private Wealth Management Limited, Niederlassung Deutschland, regulated by Bundesanstalt fuer Finanzdienstleistungsaufsicht (BaFin); in Spain by Morgan Stanley, S.V., S.A., a Morgan Stanley group company, which is supervised by the Spanish Securities Markets Commission (CNMV) and states that Morgan Stanley Research has been written and distributed in accordance with the rules of conduct applicable to financial research as established under Spanish regulations; in the US by Morgan Stanley & Co. LLC, which accepts responsibility for its contents. Morgan Stanley & Co. International plc, authorized and regulated by the Financial Services Authority, disseminates in the UK research that it has prepared, and approves solely for the purposes of section 21 of the Financial Services and Markets Act 2000, research which has been prepared by any of its affiliates. Morgan Stanley Private Wealth Management Limited, authorized and regulated by the Financial Services Authority, also disseminates Morgan Stanley Research in the UK. Private UK investors should obtain the advice of their Morgan Stanley & Co. International plc or Morgan Stanley Private Wealth Management representative about the investments concerned. RMB Morgan Stanley (Proprietary) Limited is a member of the JSE Limited and regulated by the Financial Services Board in South Africa. RMB Morgan Stanley (Proprietary) Limited is a joint venture owned equally by Morgan Stanley International Holdings Inc. and RMB Investment Advisory (Proprietary) Limited, which is wholly owned by FirstRand Limited. The information in Morgan Stanley Research is being communicated by Morgan Stanley & Co. International plc (DIFC Branch), regulated by the Dubai Financial Services Authority (the DFSA), and is directed at Professional Clients only, as defined by the DFSA. The financial products or financial services to which this research relates will only be made available to a customer who we are satisfied meets the regulatory criteria to be a Professional Client. The information in Morgan Stanley Research is being communicated by Morgan Stanley & Co. International plc (QFC Branch), regulated by the Qatar Financial Centre Regulatory Authority (the QFCRA), and is directed at business customers and market counterparties only and is not intended for Retail Customers as defined by the QFCRA. As required by the Capital Markets Board of Turkey, investment information, comments and recommendations stated here, are not within the scope of investment advisory activity. Investment advisory service is provided in accordance with a contract of engagement on investment advisory concluded between brokerage houses, portfolio management companies, non-deposit banks and clients. Comments and recommendations stated here rely on the individual opinions of the ones providing
43
M O R G A N S T A N L E Y R E S E A R C H
44
June 5, 2012 Global Auto Scenarios 2022
M O R G A N S T A N L E Y B L U E P A P E R The trademarks and service marks contained in Morgan Stanley Research are the property of their respective owners. Third-party data providers make no warranties or representations relating to the accuracy, completeness, or timeliness of the data they provide and shall not have liability for any damages relating to such data. The Global Industry Classification Standard (GICS) was developed by and is the exclusive property of MSCI and S&P. Morgan Stanley bases projections, opinions, forecasts and trading strategies regarding the MSCI Country Index Series solely on public information. MSCI has not reviewed, approved or endorsed these projections, opinions, forecasts and trading strategies. Morgan Stanley has no influence on or control over MSCI's index compilation decisions. Morgan Stanley Research or portions of it may not be reprinted, sold or redistributed without the written consent of Morgan Stanley. Morgan Stanley research is disseminated and available primarily electronically, and, in some cases, in printed form. Additional information on recommended securities/instruments is available on request.
these comments and recommendations. These opinions may not fit to your financial status, risk and return preferences. For this reason, to make an investment decision by relying solely to this information stated here may not bring about outcomes that fit your expectations.
Morgan Stanley Research, or any portion thereof may not be reprinted, sold or redistributed without the written consent of Morgan Stanley. Morgan Stanley Research is disseminated and available primarily electronically, and, in some cases, in printed form.
Additional information on recommended securities/instruments is available on request.
M O R G A N S T A N L E Y R E S E A R C H
The Americas 1585 Broadway New York, NY 10036-8293 United States Tel: +1 (1)212 761 4000
Europe 20 Bank Street, Canary Wharf London E14 4AD United Kingdom Tel: +44 (0)20 7425 8000
Japan 4-20-3 Ebisu, Shibuya-ku Tokyo 150-6008 Japan Tel: +81 (0)3 5424 5000
Asia/Pacific 1 Austin Road West Kowloon Hong Kong Tel: +852 2848 5200
© 2012 Morgan Stanley
M O R G A N S T A N L E Y B L U E P A P E R
Ticker Company Name
Close Price
(as of 06/04/2012)
7259.T Aisin Seiki JPY 2367.00
ALV.N Autoliv USD 54.93
BMWG.DE BMW EUR 56.85
BWA.N BorgWarner Inc. USD 64.78
5108.T Bridgestone JPY1663.00
1114.HK Brilliance China Automotive HKD 7.06
2105.TW Cheng Shin Rubber TWD 71.50
CONG.DE Continental EUR 62.89
7262.T Daihatsu Motor JPY1271.00
DAIGn.DE Daimler EUR 34.85
DAN.N Dana Holding Corp. USD 12.19
DLPH.N Delphi Automotive PLC USD 27.73
6902.T Denso JPY2311.00
0489.HK Dongfeng Motor Group HKD 12.96
FIA.MI FIAT EUR 3.73
F.N Ford Motor Company USD 10.04
7270.T Fuji Heavy Industries JPY 573.00
GM.N General Motors Company USD 21.11
GT.N Goodyear Tire & Rubber Company USD 9.44
2333.HK Great Wall Motor Company Limited HKD 15.66
018880.KS Halla Climate Control KRW 19300.00
000240.KS Hankook Tire KRW 45500.00
HAR.N Harman International Industries Inc. USD 38.29
7267.T Honda Motor JPY 2417.00
2207.TW Hotai Motor TWD 191.00
012330.KS Hyundai MOBIS KRW 271000.00
005380.KS Hyundai Motor KRW 233500.00
7202.T Isuzu Motors JPY 388.00
JCI.N Johnson Controls, Inc. USD 28.60
000270.KS Kia Motors KRW 76900.00
7276.T Koito Mfg. JPY 999.00
6301.T Komatsu JPY 1802.00
Ticker Company Name
Close Price
(as of 06/04/2012)
LEA.N Lear Corporation USD 37.41
MGA.N Magna International Inc. USD 37.49
MAHM.BO Mahindra & Mahindra INR 649.10
MRTI.BO Maruti Suzuki India Limited INR1068.00
7261.T Mazda Motor JPY 94.00
MICP.PA Michelin EUR 46.28
7211.T Mitsubishi Motors JPY 75.00
5991.T NHK Spring JPY 810.00
7201.T Nissan Motor JPY 723.00
7240.T NOK JPY 1547.00
NRE1V.HE Nokian Tyres EUR 27.67
PECI.MI Pirelli & C. SpA EUR 7.57
PSHG_p.DE Porsche EUR 39.39
PEUP.PA PSA Peugeot-Citroen EUR 7.85
RENA.PA Renault EUR 32.89
6923.T Stanley Electric JPY 1070.00
5110.T Sumitomo Rubber JPY 926.00
7269.T Suzuki Motor JPY 1579.00
7312.T Takata JPY 1565.00
TAMO.BO Tata Motors INR 228.75
TEN.N Tenneco Inc. USD 24.79
TSLA.O Tesla Motors Inc. USD 27.88
7282.T Toyoda Gosei JPY 1491.00
3116.T Toyota Boshoku JPY 818.00
6201.T Toyota Industries JPY 2027.00
7203.T Toyota Motor JPY 2926.00
TRW.N TRW Automotive Holdings Corp. USD 36.22
VLOF.PA Valeo S.A. EUR 32.58
VOWG_p.DE Volkswagen EUR 119.75
5101.T Yokohama Rubber JPY 522.00
2201.TW Yulon Motor TWD 50.40