Embed Size (px)
Citation preview
Display Sparkle Measurement and Human Response Jacques Gollier1, Garrett A. Piech1, Shandon D. Hart1, James A. West1,
Howard Hovagimian1, Ellen M. Kosik Williams1, Alicia Stillwell2, James Ferwerda2 1 Corning Incorporated, Corning NY
2 Munsell Color Science Laboratory, Center for Visual Science, Rochester Institute of Technology, Rochester NY
Abstract A new method for quantifying “sparkle” uses a simple measurement which includes a pixelated source, a test sample, and an eye simulator. The degree of sparkle is calculated from the standard deviation of the pixel powers across a portion of the display. Measurements show excellent correlation to human response studies.
Author Keywords Sparkle; Display Metrology; Human Response; Perception.
1. Objective and Background Display “sparkle” or “dazzle” is a generally undesirable side effect that can occur when introducing antiglare or light scattering surfaces into a flat panel display (FPD) system such as, for example, a liquid crystal display (LCD), an organic light emitting diode (OLED), touch screens, or the like. Sparkle is associated with a very fine grainy appearance of the display. To an observer, this grainy pattern appears to shift with changing viewing angle. This sparkle effect is observed when combining pixelated displays such as that of a LCD with antiglare (AG) or other textured surfaces and differs distinctly in type and origin from the more commonly known “speckle” effect that is observed and characterized in projection or laser systems. The physical origins of sparkle have not been previously well understood, and there has been substantial confusion in the related art between the different types of sparkle or speckle that can be visually observed in projection, laser, or pixelated flat-panel displays. In part due to the lack of basic understanding of the root cause of pixelated FPD sparkle, there have not previously existed any quantitative methods for measuring FPD sparkle that have been shown to correlate well to visual human observations.
We demonstrate a system for measuring sparkle which is sensitive to very low levels of sparkle and is linear in response to increasing levels of sparkle. The measurement apparatus consists of an image capture system designed to simulate the response of the human eye. It obtains a high-resolution image of a standardized LCD in which only one color of sub-pixel is illuminated and over which a textured test sample is placed. Within each captured image, a computer algorithm is used to integrate the power within each display pixel and to remove any background light level. The value of sparkle severity is calculated by taking the normalized standard deviation of the pixel powers, which we have termed pixel power deviation (PPD). In this paper, we will discuss the measurement apparatus and image processing algorithm and show the correlation between measured PPD and perceived level of sparkle.
2. Results Numerous pixel geometries and pitches are available in today’s emissive display technology. The level of sparkle a given textured sample will exhibit is dependent on the pixel geometry and texture to pixel distance of the specific display on which it is used.
To provide a quantitative measure of the sparkle inherent to a given textured sample, we choose a single display with square pixels on a 180 µm pitch to use as our emissive source (Lenovo U110 notebook computer display). We removed the polymer protective cover present in this device in order to place our test samples directly adjacent to the front polarizer film of the display. The test images used for the measurements consist of only green sub-pixels. When positioning test samples, spacers are used to ensure the textured surface is set at a fixed distance (typically 0.5mm) from the surface of the display.
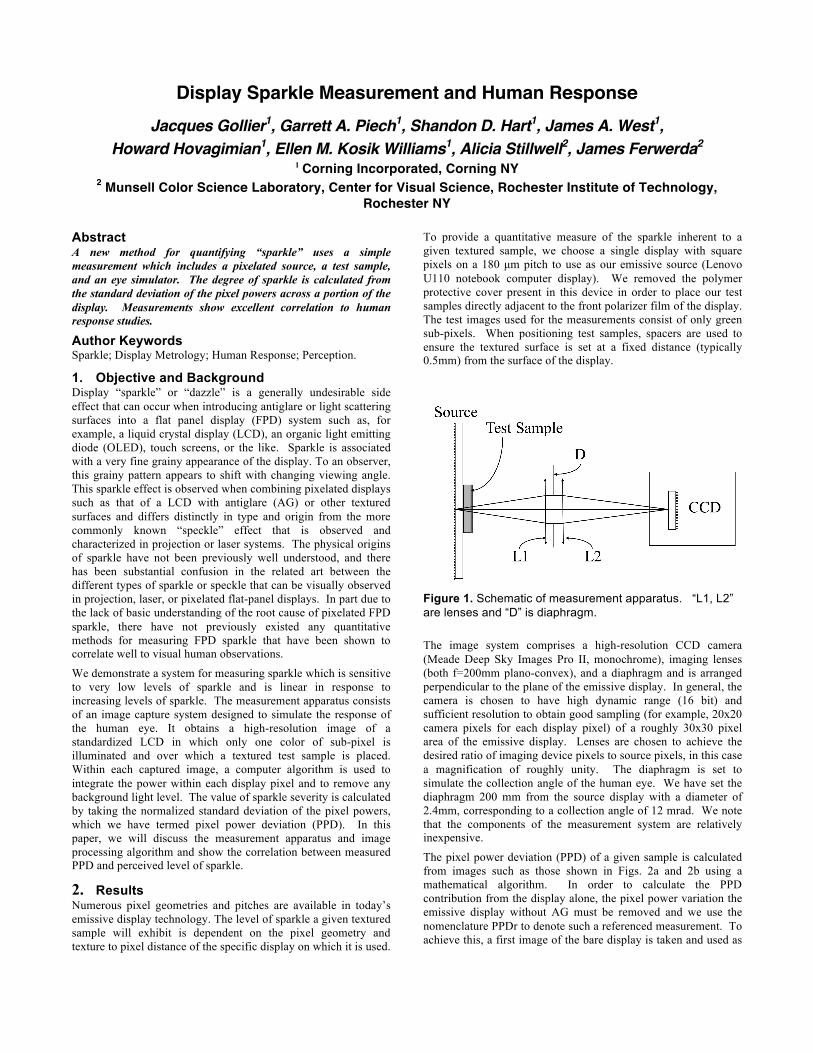
Figure 1. Schematic of measurement apparatus. “L1, L2” are lenses and “D” is diaphragm. The image system comprises a high-resolution CCD camera (Meade Deep Sky Images Pro II, monochrome), imaging lenses (both f=200mm plano-convex), and a diaphragm and is arranged perpendicular to the plane of the emissive display. In general, the camera is chosen to have high dynamic range (16 bit) and sufficient resolution to obtain good sampling (for example, 20x20 camera pixels for each display pixel) of a roughly 30x30 pixel area of the emissive display. Lenses are chosen to achieve the desired ratio of imaging device pixels to source pixels, in this case a magnification of roughly unity. The diaphragm is set to simulate the collection angle of the human eye. We have set the diaphragm 200 mm from the source display with a diameter of 2.4mm, corresponding to a collection angle of 12 mrad. We note that the components of the measurement system are relatively inexpensive.
The pixel power deviation (PPD) of a given sample is calculated from images such as those shown in Figs. 2a and 2b using a mathematical algorithm. In order to calculate the PPD contribution from the display alone, the pixel power variation the emissive display without AG must be removed and we use the nomenclature PPDr to denote such a referenced measurement. To achieve this, a first image of the bare display is taken and used as
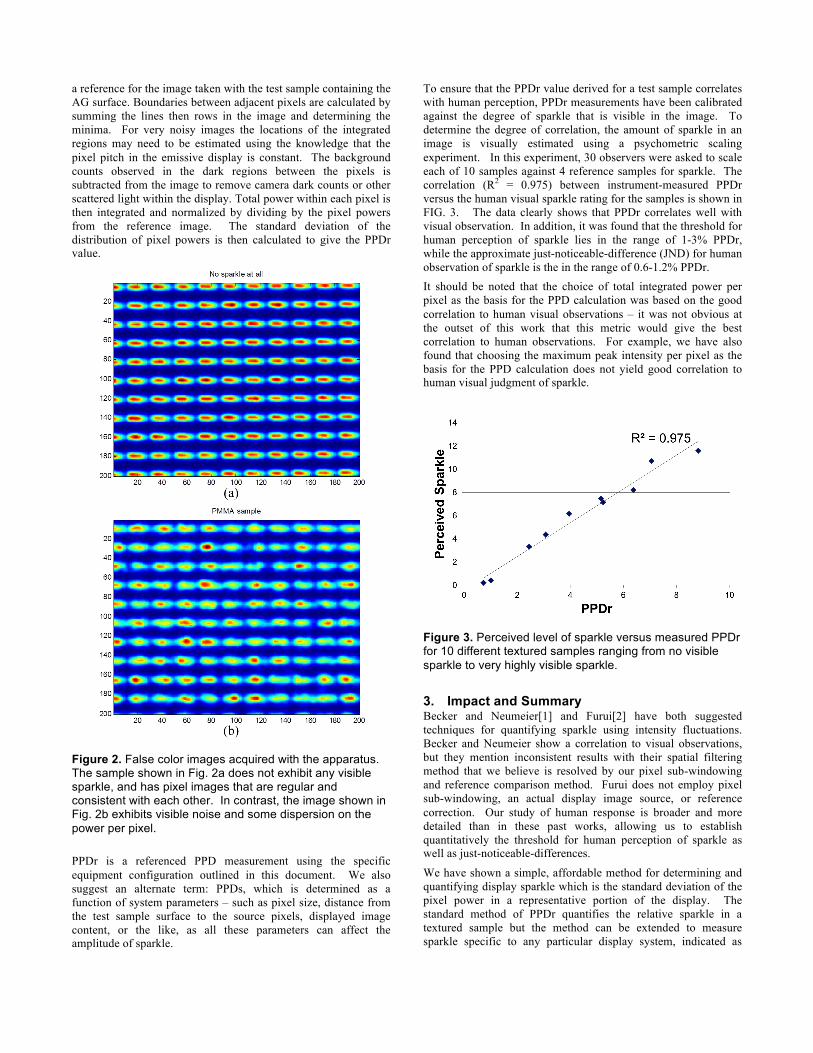
a reference for the image taken with the test sample containing the AG surface. Boundaries between adjacent pixels are calculated by summing the lines then rows in the image and determining the minima. For very noisy images the locations of the integrated regions may need to be estimated using the knowledge that the pixel pitch in the emissive display is constant. The background counts observed in the dark regions between the pixels is subtracted from the image to remove camera dark counts or other scattered light within the display. Total power within each pixel is then integrated and normalized by dividing by the pixel powers from the reference image. The standard deviation of the distribution of pixel powers is then calculated to give the PPDr value.
Figure 2. False color images acquired with the apparatus. The sample shown in Fig. 2a does not exhibit any visible sparkle, and has pixel images that are regular and consistent with each other. In contrast, the image shown in Fig. 2b exhibits visible noise and some dispersion on the power per pixel. PPDr is a referenced PPD measurement using the specific equipment configuration outlined in this document. We also suggest an alternate term: PPDs, which is determined as a function of system parameters – such as pixel size, distance from the test sample surface to the source pixels, displayed image content, or the like, as all these parameters can affect the amplitude of sparkle.
To ensure that the PPDr value derived for a test sample correlates with human perception, PPDr measurements have been calibrated against the degree of sparkle that is visible in the image. To determine the degree of correlation, the amount of sparkle in an image is visually estimated using a psychometric scaling experiment. In this experiment, 30 observers were asked to scale each of 10 samples against 4 reference samples for sparkle. The correlation (R2 = 0.975) between instrument-measured PPDr versus the human visual sparkle rating for the samples is shown in FIG. 3. The data clearly shows that PPDr correlates well with visual observation. In addition, it was found that the threshold for human perception of sparkle lies in the range of 1-3% PPDr, while the approximate just-noticeable-difference (JND) for human observation of sparkle is the in the range of 0.6-1.2% PPDr. It should be noted that the choice of total integrated power per pixel as the basis for the PPD calculation was based on the good correlation to human visual observations – it was not obvious at the outset of this work that this metric would give the best correlation to human observations. For example, we have also found that choosing the maximum peak intensity per pixel as the basis for the PPD calculation does not yield good correlation to human visual judgment of sparkle.
Figure 3. Perceived level of sparkle versus measured PPDr for 10 different textured samples ranging from no visible sparkle to very highly visible sparkle.
3. Impact and Summary Becker and Neumeier[1] and Furui[2] have both suggested techniques for quantifying sparkle using intensity fluctuations. Becker and Neumeier show a correlation to visual observations, but they mention inconsistent results with their spatial filtering method that we believe is resolved by our pixel sub-windowing and reference comparison method. Furui does not employ pixel sub-windowing, an actual display image source, or reference correction. Our study of human response is broader and more detailed than in these past works, allowing us to establish quantitatively the threshold for human perception of sparkle as well as just-noticeable-differences.
We have shown a simple, affordable method for determining and quantifying display sparkle which is the standard deviation of the pixel power in a representative portion of the display. The standard method of PPDr quantifies the relative sparkle in a textured sample but the method can be extended to measure sparkle specific to any particular display system, indicated as

PPDs. The measurement apparatus has been designed with an image capture system which mimics the response of the human eye and as such, PPDr has been shown to correlate well with visual observations of sparkle severity.
4. References [1] M. E. Becker and J. Neumeier, “70.4: Optical
Characterization of Scattering Anti-Glare Layers,” SID 11 Digest, 1038 (2011).
[2] G. Furui, “METHOD AND APPARATUS FOR QUANTITATIVELY EVALUATING SCINTILLATION, ANTIGLARE FILM AND METHOD OF PRODUCING THE SAME,” US patent no. US6697515B2 (2003).