Embed Size (px)
Citation preview
energies
Article
Dispersive Optical Systems for Highly-ConcentratedSolar Spectrum Splitting: Concept, Design, andPerformance Analyses
Si Kuan Thio 1 and Sung-Yong Park 2,*1 Department of Mechanical Engineering, National University of Singapore, Singapore 117575, Singapore;
[email protected] Department of Mechanical Engineering, San Diego State University, San Diego, CA 92182-1323, USA* Correspondence: [email protected]; Tel.: +1-619-594-6067
Received: 16 November 2019; Accepted: 9 December 2019; Published: 11 December 2019 �����������������
Abstract: We present a concept design of a solar spectrum splitting system that enableshighly-concentrated solar energy harvesting over the entire AM1.5 spectral range. After passingthrough an array of the dispersive optical system (DOS) module composed of a grating structure anddispersive prisms below a concentrating lens, incident sunlight can be separated into two wavelengthbands of visible (VIS) and infrared (IR) ranges, which can then be focused onto corresponding solarreceivers. Based on the spectral response of typical crystalline silicon solar cells, the VIS wavelengthband is selected from 0.4 µm to 1.2 µm to contribute to photovoltaic (PV) conversion to generateelectricity. Meanwhile, the IR band in longer wavelength ranges (1.2 µm ≤ λ ≤ 2.5 µm), which doesnot contribute to PV conversion, can be simultaneously used for solar thermal applications such aswater heating and thermoelectricity. In this paper, various design parameters (e.g., focal length of aconcentrating lens, groove density of a grating, geometry of dispersive prisms, material combinationof optical components, etc.) have been investigated to determine an optimum set of systemconfigurations, using optical design software (Zemax OpticStudio 14.2). Our simulation studiesvalidate that the DOS is able to split incident AM1.5 solar irradiance into the two wavelength bandsof the VIS and IR ranges and focus each wavelength band with concentration factors as high as 798×and 755× on the same focal plane, respectively. Such high concentration factors for both wavelengthbands can be actualized due to the additional optical components used—a grating structure anddispersive prisms, which allow to minimize optical aberrations through both diffraction and refraction.The proposed DOS, designed with commercially available optical components, has the potential towiden the use of the sun’s spectrum by allowing effective PV conversion of solar cells under highconcentration with tolerable optical system losses and concurrently converting the remaining solarirradiation into useful energy for a broad range of thermal applications.
Keywords: solar spectrum splitting; sunlight separation; photovoltaic
1. Introduction
Due to limited supply of fossil energy sources and climate change, solar energy has been foreseenas one of the promising sustainable energy solutions. When sunlight reaches the earth in the formof electromagnetic radiation, its optical path length through the earth’s atmosphere is defined as theair mass (AM) coefficient relative to the vertical path length. The AM1.5 solar spectrum, which ismainly confined between 0.3 µm ≤ λ ≤ 2.5 µm, has been universally used to characterize the solarspectrum [1,2]. Solar irradiance from the AM1.5 can be typically converted into useful electrical andthermal energy forms using a wide range of solar power technologies such as photovoltaics [3–5],solar thermo-chemical reaction [6,7], and concentrated solar power (CSP) [8–12].
Energies 2019, 12, 4719; doi:10.3390/en12244719 www.mdpi.com/journal/energies
Energies 2019, 12, 4719 2 of 18
Among these solar power technologies, photovoltaic (PV) methods have been conveniently usedbecause radiative solar energy can be directly converted to electricity with solar cells. Incident sunlightis absorbed by the semiconducting materials of a solar cell and excites electrons to a higher energy stateto generate electricity [13]. This PV process indicates that the energy bandgap of the semiconductingmaterials used in a solar cell inherently limits their spectral response [14,15]. For example, a crystallinesilicon (c-Si) solar cell, which is most popularly used in PV markets [16–19], has the energy bandgaparound 1.12 eV that typically corresponds to the narrow solar spectral response within 0.4 µm ≤λ < 1.2 µm [15]. This indicates that photons in lower energy states are not able to contribute toforming electron-hole pairs and generating electricity [20,21]. In order to cover a wide range of solarspectrum, multi-junction solar cells have been developed by stacking several different semiconductingmaterials in a series connection [22]. Each of the semiconducting materials responds to different energybandgaps and allows the absorption of wide solar spectrum, resulting in the increase of the solarcell’s efficiency [22,23]. Although the simultaneous use of multiple junctions in a solar cell is ableto utilize a broader range of the solar spectrum [24], several issues are raised in stacking differentsemiconducting materials together. Due to the issue of spectral and lattice matching between adjacentjunctions, the choice of semiconducting materials is limited to cost-ineffective ones such as galliumarsenide (GaAs) and germanium (Ge) [25,26]. This also leads to complex and expensive fabricationprocesses, e.g. wafer bonding and metal organic chemical vapor deposition (MOCVD) [19,27,28].
In recent years, solar spectrum splitting technologies have been alternatively proposed toharvest wide-spectral solar energy [29–42]. Using spectral splitting dichroic filters, a portion ofthe infrared radiation is separated from a wide solar spectrum and the sunlight in the only visiblerange is then directed to solar cells for PV conversion [29–36]. Not only can excessive heating beremoved from solar cells to improve their PV performance, but also the filtered solar spectrum inthe infrared range is simultaneously used for other solar thermal applications such as water heatingand thermoelectricity [26,30,43]. However, the filters used for such hybrid photovoltaic/thermalsystems typically make the incoming sunlight spatially redirected to achieve solar slitting, before it isfocused onto each of solar receivers (e.g., PV cells and thermal absorbers). As a result, hybrid systemssignificantly lose solar concentration performance, to as small as 8.7× [24,25,43]. To provide higherconcentration, more complicated systems have been investigated using solar towers illuminated byheliostats, leading to large system sizes as well as increased cost [37–42].
In this study, we present conceptual demonstrations of a dispersive optical system (DOS) thatenables highly-concentrated spectral splitting to effectively harvest wide-spectrum solar energyfor potential photovoltaic/thermal applications. The DOS module is designed to be compact withcommercially-available optical components such as a diffractive grating and dispersive prisms thatare placed below a low-cost Fresnel lens. While incoming sunlight in a wide spectral range passesthrough an array of the DOS module, it undergoes both light diffraction and refraction such thatoptical aberrations are minimized. As a result, two wavelength bands split into the visible (VIS) andinfrared (IR) ranges can be effectively focused onto corresponding solar receivers positioned on thesame focal plane without spatial redirection that has been typically observed for previous solar spittingtechnologies. Our simulation studies validate that the VIS range of the sunlight can be focused onto asolar cell with a concentration factor as high as 798× for effective PV energy harvesting. Concurrently,the separated IR irradiation, which does not contribute to PV conversion, can also be used for possiblesolar thermal applications such as water heating and thermoelectricity under a concentration factor of755×. Concept and design issues of the DOS module were discussed in this paper. Using the opticaldesign software (OpticStudio 14.2, Zemax LLC, Kirkland, WA, USA), the optical performance wasalso investigated with varying the focal length of an external Fresnel and various DOS parameters(e.g., prism materials and geometry, a grating component, etc.) to understand their effects on spectrumsplitting and solar concentration. The proposed DOS optical system is conveniently scalable in size anddesigned with commercially-available optical components for cost effectiveness. Our solar splittingtechnology offers the potential to widen the use of the sun’s spectrum to allow effective PV conversion
Energies 2019, 12, 4719 3 of 18
and concurrently converting the remaining solar irradiation into useful thermal applications underhigh concentration.
2. Overview of Sunlight Separation System
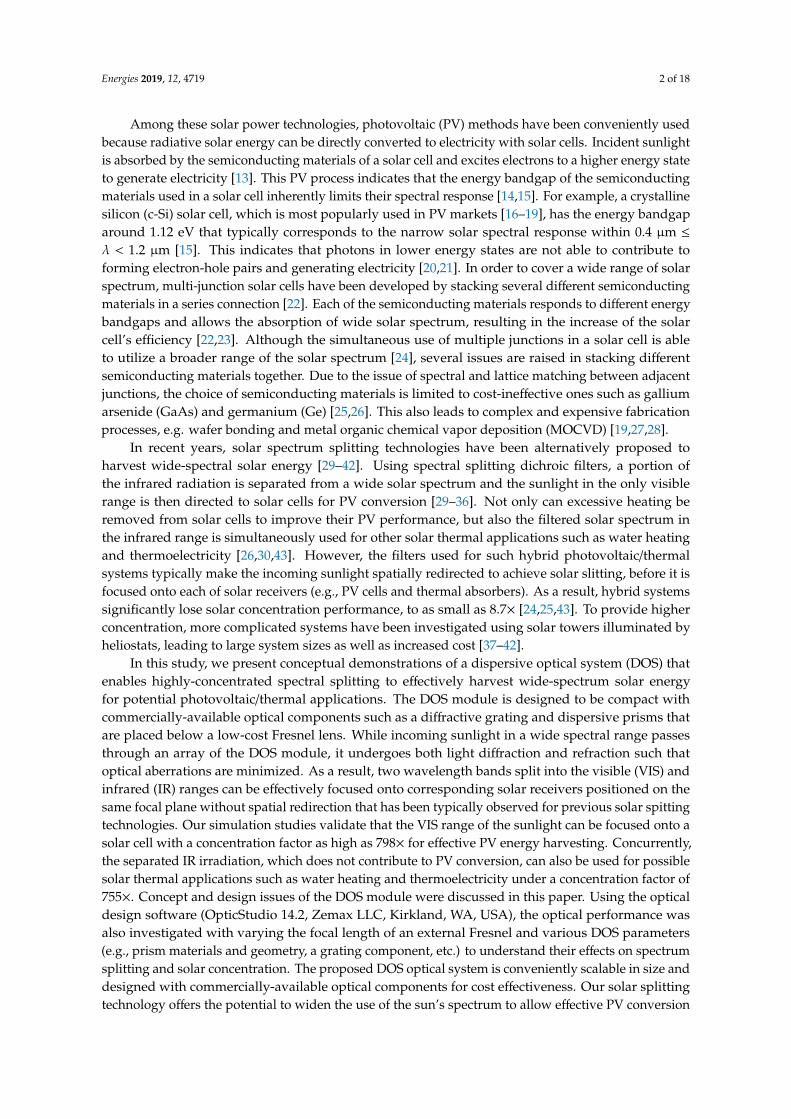
Figure 1 shows a schematic of the DOS array placed underneath a Fresnel lens to achievehighly-concentrated solar spectrum splitting. The DOS module mainly consists of threecommercially-available optical components in the design (Figure 1a): a layer of diffraction grating,followed by compound prisms of a low-dispersion Littrow prism and another triangular high-dispersionprism, similar to the concept of an Amici prism [44,45].
Energies 2019, 12, x FOR PEER REVIEW 3 of 17
for cost effectiveness. Our solar splitting technology offers the potential to widen the use of the sun’s spectrum to allow effective PV conversion and concurrently converting the remaining solar irradiation into useful thermal applications under high concentration.
2. Overview of Sunlight Separation System
Figure 1 shows a schematic of the DOS array placed underneath a Fresnel lens to achieve highly-concentrated solar spectrum splitting. The DOS module mainly consists of three commercially-available optical components in the design (Figure 1a): a layer of diffraction grating, followed by compound prisms of a low-dispersion Littrow prism and another triangular high-dispersion prism, similar to the concept of an Amici prism [44,45].
Figure 1. A schematic of the dispersive optical system (DOS) enabling both solar spectrum splitting and high concentration with the minimum optical aberration and its potential applications to harvest a wide range of solar spectrum. (a) The DOS module is composed of three compact optical components placed below a low-cost Fresnel lens: a diffraction grating layer, and compound prisms made of a low-dispersion Littrow prism and a high-dispersion triangular prism. (b) Incoming sunlight is being focused by the external concentrator, split into two wavelength bands of visible (VIS) and infrared (IR) light via an array of the DOS module, before reaching corresponding solar receivers such as solar cells and thermal absorbers positioned on the same focal plane. The only VIS range of the sunlight can be focused onto solar cells with a concentration factor of 798× to enhance its photovoltaic (PV) conversion. At the same time, the separated IR irradiation can be also used for possible solar thermal applications such as water heating and thermoelectricity with the concentration factor as high as 755×. Such high concentration performance for both wavelength bands can be achieved by using the additional optical components - a diffraction grating structure and dispersive prisms, which allow to minimize optical aberrations through both diffraction and refraction and result in highly-concentrated sunlight separation. Additionally, a regular solar tracker can be externally integrated to ensure an optimum position of the whole system for daily and seasonal operations. The proposed low-cost solar splitting technology is not only able to achieve the high solar concentration to minimize the footprint size of solar receivers for both VIS and IR wavelength bands, but also lessen thermal degradation of solar cells by rejecting IR radiation, while using commercially-available Fresnel lens and DOS components.
As illustrated in Figure 1, sunlight is focused by the Fresnel lens before entering the interface of the DOS, where it undergoes dispersion through diffraction by a grating layer, followed by refraction in the two layers of arrayed dispersive compound prisms. In this study, the solar spectrum separated by the DOS array is based on the spectral response of the crystalline silicon (c-Si) solar cell that is the most commonly used one in PV markets [16–19]. Here, we classified the solar spectrum into two
Figure 1. A schematic of the dispersive optical system (DOS) enabling both solar spectrum splittingand high concentration with the minimum optical aberration and its potential applications to harvest awide range of solar spectrum. (a) The DOS module is composed of three compact optical componentsplaced below a low-cost Fresnel lens: a diffraction grating layer, and compound prisms made of alow-dispersion Littrow prism and a high-dispersion triangular prism. (b) Incoming sunlight is beingfocused by the external concentrator, split into two wavelength bands of visible (VIS) and infrared(IR) light via an array of the DOS module, before reaching corresponding solar receivers such as solarcells and thermal absorbers positioned on the same focal plane. The only VIS range of the sunlightcan be focused onto solar cells with a concentration factor of 798× to enhance its photovoltaic (PV)conversion. At the same time, the separated IR irradiation can be also used for possible solar thermalapplications such as water heating and thermoelectricity with the concentration factor as high as755×. Such high concentration performance for both wavelength bands can be achieved by using theadditional optical components - a diffraction grating structure and dispersive prisms, which allow tominimize optical aberrations through both diffraction and refraction and result in highly-concentratedsunlight separation. Additionally, a regular solar tracker can be externally integrated to ensure anoptimum position of the whole system for daily and seasonal operations. The proposed low-cost solarsplitting technology is not only able to achieve the high solar concentration to minimize the footprintsize of solar receivers for both VIS and IR wavelength bands, but also lessen thermal degradation of solarcells by rejecting IR radiation, while using commercially-available Fresnel lens and DOS components.
As illustrated in Figure 1, sunlight is focused by the Fresnel lens before entering the interface ofthe DOS, where it undergoes dispersion through diffraction by a grating layer, followed by refractionin the two layers of arrayed dispersive compound prisms. In this study, the solar spectrum separatedby the DOS array is based on the spectral response of the crystalline silicon (c-Si) solar cell that isthe most commonly used one in PV markets [16–19]. Here, we classified the solar spectrum into two
Energies 2019, 12, 4719 4 of 18
wavelength bands. The first wavelength band selected is the VIS range of 0.4 µm ≤ λ < 1.2 µm, mainlycontributing to PV conversion of the c-Si solar cells. Thereon, the other wavelength band is chosen asthe IR range of 1.2 µm ≤ λ ≤ 2.5 µm, forming the majority portion of the AM1.5 solar spectrum notabsorbed by the c-Si cells for PV conversion [46].
It is also important to note that the focal length of the external Fresnel lens, as its feature of theoptical distance where light rays converge, has a key influence on the optical performance achieved bythe DOS. Typically, the focal length of a commercial optical lens is defined at a specific wavelengthdesigned by manufacturers, although not all the rays converge to a single point at the defined focallength due to optical aberrations. Moreover, the function of the DOS is to spilt sunlight into twowavelength bands on the given focal plane. Therefore, our study defines the focal plane horizontallydrawn at the focal point of the rays at λ = 1.2 µm in order to have a clear distinction between thetwo wavelength bands that are separated at λ = 1.2 µm. Hence, the minimum footprint size of therespective solar receivers is determined on the given focal plane. The concentration performance ofeach VIS and IR wavelength band achieved by the DOS can be estimated by the area reduction ratiobetween solar input and focused output as:
Concentration factor =An area of input light
An area of focused output light. (1)
In the following subsections, we will describe how each of the DOS components works forachieving solar spectrum separation with high concentration.
2.1. A diffraction Grating
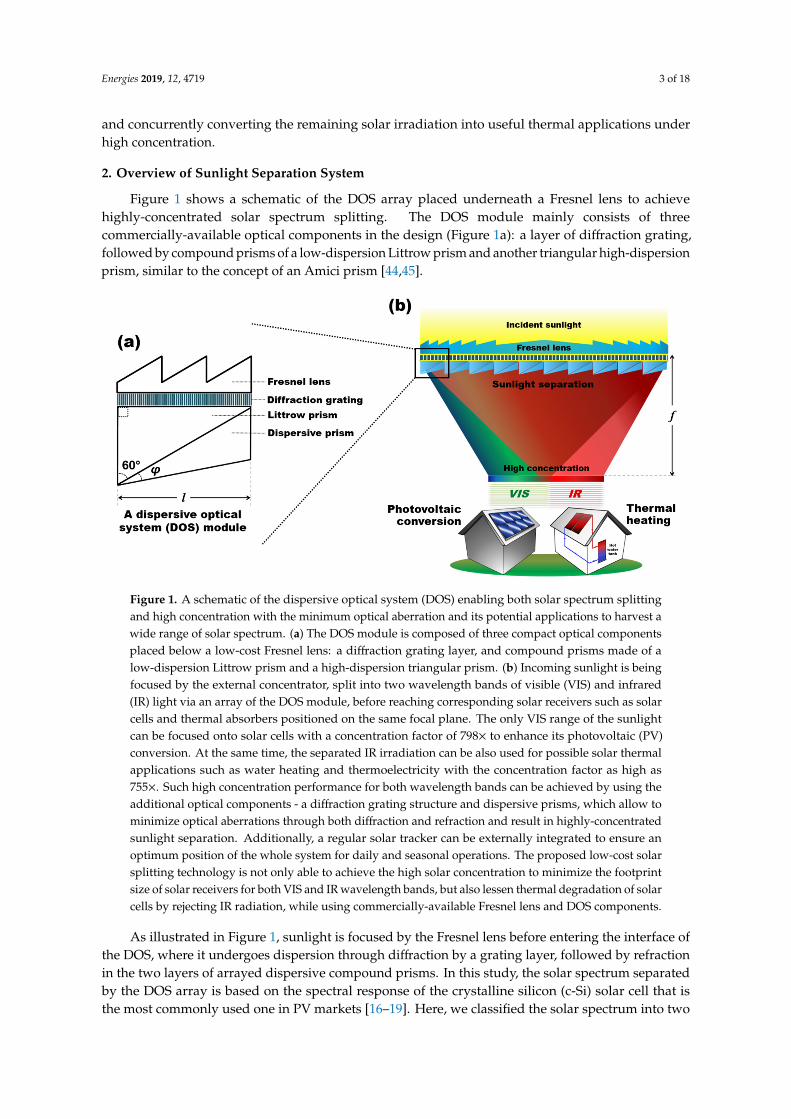
Figure 2 illustrates a transmissive diffraction grating which is used as the first optical element todiffract sunlight into its individual wavelengths. When light emits from the grating, it is dispersed intofringes on the opposite side of the grating at a fixed diffracted angle, based on the grating’s diffractionorder. The diffraction angle of a light beam can be determined by the well-known transmissivediffraction grating equation as [47]:
2d(sinθm + sinθi) = mλ, (2)
where θi and θm are the angles of the incident and diffracted beam, m is an integer representing thediffraction order (i.e., m = 0, ±1, ±2 . . . ), λ is the wavelength of light, and d is the distance betweenthe grating grooves, which can be characterized by the density of the grooves (dg), i.e., the numberof grooves per unit length (grooves/mm). Equation (2) ensures that light beams entering the gratingstructure are diffracted into its constituent wavelength components (where λ1 > λ2 > λ3 . . . ) with therespective diffraction angle of θm at each individual order of m.
Energies 2019, 12, x FOR PEER REVIEW 4 of 17
wavelength bands. The first wavelength band selected is the VIS range of 0.4 μm ≤ λ < 1.2 μm, mainly contributing to PV conversion of the c-Si solar cells. Thereon, the other wavelength band is chosen as the IR range of 1.2 μm ≤ λ ≤ 2.5 μm, forming the majority portion of the AM1.5 solar spectrum not absorbed by the c-Si cells for PV conversion [46].
It is also important to note that the focal length of the external Fresnel lens, as its feature of the optical distance where light rays converge, has a key influence on the optical performance achieved by the DOS. Typically, the focal length of a commercial optical lens is defined at a specific wavelength designed by manufacturers, although not all the rays converge to a single point at the defined focal length due to optical aberrations. Moreover, the function of the DOS is to spilt sunlight into two wavelength bands on the given focal plane. Therefore, our study defines the focal plane horizontally drawn at the focal point of the rays at λ = 1.2 μm in order to have a clear distinction between the two wavelength bands that are separated at λ = 1.2 μm. Hence, the minimum footprint size of the respective solar receivers is determined on the given focal plane. The concentration performance of each VIS and IR wavelength band achieved by the DOS can be estimated by the area reduction ratio between solar input and focused output as:
An area of input lightConcentration factor = An area of focused output light
. (1)
In the following subsections, we will describe how each of the DOS components works for achieving solar spectrum separation with high concentration.
2.1. A diffraction Grating
Figure 2 illustrates a transmissive diffraction grating which is used as the first optical element to diffract sunlight into its individual wavelengths. When light emits from the grating, it is dispersed into fringes on the opposite side of the grating at a fixed diffracted angle, based on the grating’s diffraction order. The diffraction angle of a light beam can be determined by the well-known transmissive diffraction grating equation as [47]:
i2 (sin sin )md mθ θ λ+ = , (2)
where θi and θm are the angles of the incident and diffracted beam, m is an integer representing the diffraction order (i.e., m = 0, ±1, ±2 …), λ is the wavelength of light, and d is the distance between the grating grooves, which can be characterized by the density of the grooves (dg), i.e., the number of grooves per unit length (grooves/mm). Equation (2) ensures that light beams entering the grating structure are diffracted into its constituent wavelength components (where λ1 > λ2 > λ3 …) with the respective diffraction angle of θm at each individual order of m.
Figure 2. A schematic illustration of a transmissive diffraction grating structure. With the grating groove’s distance (d) apart, incident light impinges on the grating and emerges separated for each wavelength λ, where λ1 > λ2 > λ3. When light undergoes diffraction through the grating structure to form a light spectrum, longer wavelengths of light (e.g., λ1) will diffract more than shorter wavelengths of light (e.g., λ3). As a result, a ray at λ1 has a larger diffraction angle θm than the one at λ3.
Figure 2. A schematic illustration of a transmissive diffraction grating structure. With the gratinggroove’s distance (d) apart, incident light impinges on the grating and emerges separated for eachwavelength λ, where λ1 > λ2 > λ3. When light undergoes diffraction through the grating structure toform a light spectrum, longer wavelengths of light (e.g., λ1) will diffract more than shorter wavelengthsof light (e.g., λ3). As a result, a ray at λ1 has a larger diffraction angle θm than the one at λ3.
Energies 2019, 12, 4719 5 of 18
As shown in Figure 2, when light undergoes diffraction through the grating to form a lightspectrum, the ray at the diffraction order of m = 0 does not experience diffraction. For m = ±1, however,the ray at a longer wavelength (e.g., λ1) diffracts more than a shorter wavelength (e.g., λ3) and resultsin having a larger diffraction angle [48]. Similarly, high diffraction orders for |m| ≥ 2 are also formedinto fringes, but they typically possess very little optical power (<3%) [49].
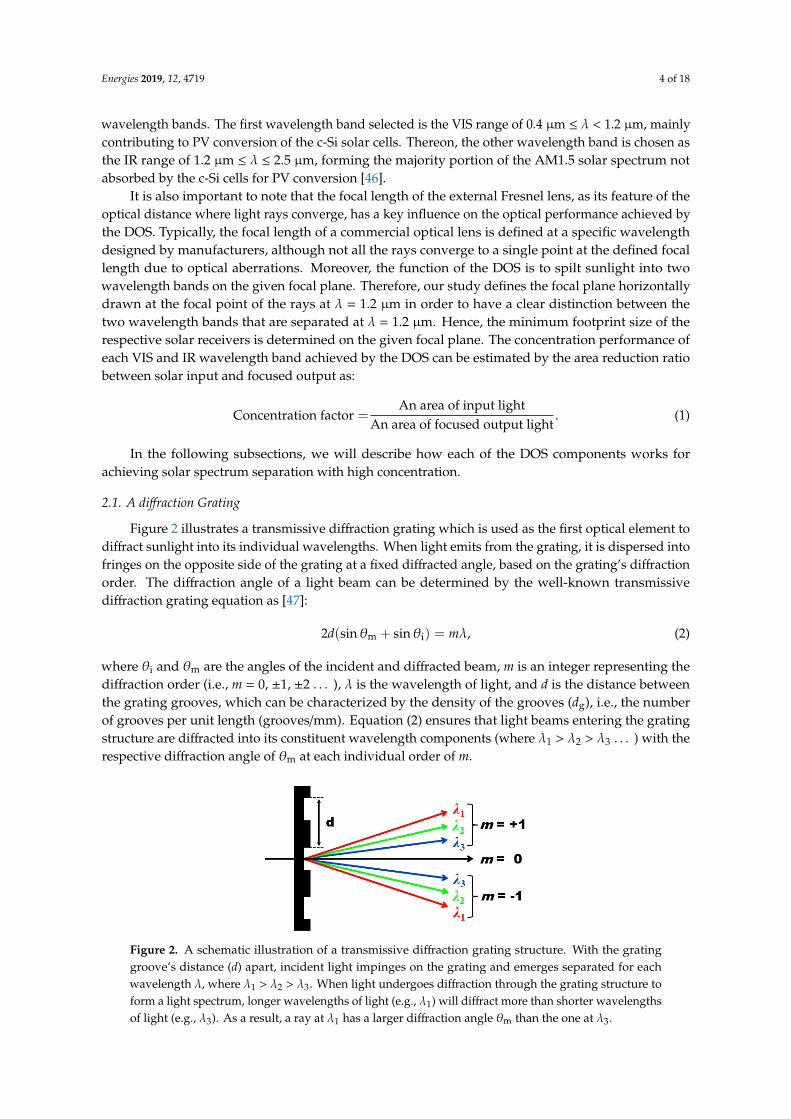
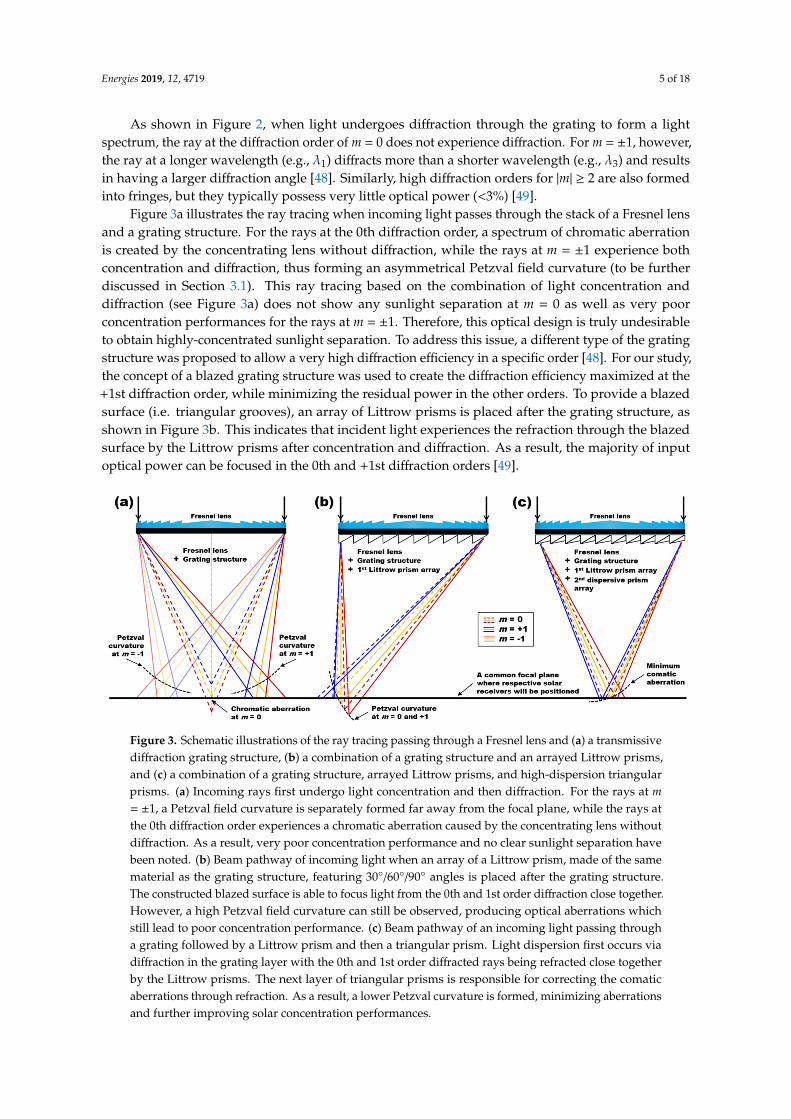
Figure 3a illustrates the ray tracing when incoming light passes through the stack of a Fresnel lensand a grating structure. For the rays at the 0th diffraction order, a spectrum of chromatic aberrationis created by the concentrating lens without diffraction, while the rays at m = ±1 experience bothconcentration and diffraction, thus forming an asymmetrical Petzval field curvature (to be furtherdiscussed in Section 3.1). This ray tracing based on the combination of light concentration anddiffraction (see Figure 3a) does not show any sunlight separation at m = 0 as well as very poorconcentration performances for the rays at m = ±1. Therefore, this optical design is truly undesirableto obtain highly-concentrated sunlight separation. To address this issue, a different type of the gratingstructure was proposed to allow a very high diffraction efficiency in a specific order [48]. For our study,the concept of a blazed grating structure was used to create the diffraction efficiency maximized at the+1st diffraction order, while minimizing the residual power in the other orders. To provide a blazedsurface (i.e. triangular grooves), an array of Littrow prisms is placed after the grating structure, asshown in Figure 3b. This indicates that incident light experiences the refraction through the blazedsurface by the Littrow prisms after concentration and diffraction. As a result, the majority of inputoptical power can be focused in the 0th and +1st diffraction orders [49].
Energies 2019, 12, x FOR PEER REVIEW 6 of 17
at the angles relative to the materials’ Abbe numbers such that the light dispersion eventuates to an optical spectrum. Selecting materials with a similar refractive index between two prisms can also be beneficial to minimize geometric optical losses and compensate beam deviation while maintaining chromatic dispersion, i.e., minimizing comatic aberration along the Petzval field curvature [50,51]. The dispersive compound prisms make use of Snell’s law of refraction to disperse the white light chromatically in accordance to their wavelengths derived from the Fermat’s principle [52]. A shorter wavelength of light will deviate more from its original path than the one with a longer wavelength.
Figure 3. Schematic illustrations of the ray tracing passing through a Fresnel lens and (a) a transmissive diffraction grating structure, (b) a combination of a grating structure and an arrayed Littrow prisms, and (c) a combination of a grating structure, arrayed Littrow prisms, and high-dispersion triangular prisms. (a) Incoming rays first undergo light concentration and then diffraction. For the rays at m = ±1, a Petzval field curvature is separately formed far away from the focal plane, while the rays at the 0th diffraction order experiences a chromatic aberration caused by the concentrating lens without diffraction. As a result, very poor concentration performance and no clear sunlight separation have been noted. (b) Beam pathway of incoming light when an array of a Littrow prism, made of the same material as the grating structure, featuring 30°/60°/90° angles is placed after the grating structure. The constructed blazed surface is able to focus light from the 0th and 1st order diffraction close together. However, a high Petzval field curvature can still be observed, producing optical aberrations which still lead to poor concentration performance. (c) Beam pathway of an incoming light passing through a grating followed by a Littrow prism and then a triangular prism. Light dispersion first occurs via diffraction in the grating layer with the 0th and 1st order diffracted rays being refracted close together by the Littrow prisms. The next layer of triangular prisms is responsible for correcting the comatic aberrations through refraction. As a result, a lower Petzval curvature is formed, minimizing aberrations and further improving solar concentration performances.
Although both diffraction grating and prism components in the DOS module serve to disperse sunlight, they operate on very different mechanisms, i.e. one makes diffraction and another induces refraction. When light undergo diffraction through the grating structure to form a light spectrum, a ray at a longer wavelength (e.g., λ1) will diffract more than that of a shorter wavelength (e.g., λ3) and have a larger diffraction angle θm, as presented in Figure 2. However, when light undergoes dispersion through refractive optical media, shorter wavelengths of light will refract more than longer wavelengths of light. Hence, each wavelength of light in a diffraction spectrum is said to be in transposition to its corresponding wavelength of light in a refractive spectrum. Such phenomenon can greatly enhance the optical performances of the DOS by adding the second layer of high-dispersion triangular prisms. When sunlight undergoes separation through the DOS, the combination of the diffraction grating component and Littrow prisms allows high diffraction efficiency in the 0th and 1st orders, but it still causes optical aberrations as shown in Figure 3b. By adding the second layer of high-dispersion prisms, the aberrations can be corrected through refraction. Figure 3c illustrates how the DOS array can undergo effective sunlight separation and, at
Figure 3. Schematic illustrations of the ray tracing passing through a Fresnel lens and (a) a transmissivediffraction grating structure, (b) a combination of a grating structure and an arrayed Littrow prisms,and (c) a combination of a grating structure, arrayed Littrow prisms, and high-dispersion triangularprisms. (a) Incoming rays first undergo light concentration and then diffraction. For the rays at m= ±1, a Petzval field curvature is separately formed far away from the focal plane, while the rays atthe 0th diffraction order experiences a chromatic aberration caused by the concentrating lens withoutdiffraction. As a result, very poor concentration performance and no clear sunlight separation havebeen noted. (b) Beam pathway of incoming light when an array of a Littrow prism, made of the samematerial as the grating structure, featuring 30◦/60◦/90◦ angles is placed after the grating structure.The constructed blazed surface is able to focus light from the 0th and 1st order diffraction close together.However, a high Petzval field curvature can still be observed, producing optical aberrations whichstill lead to poor concentration performance. (c) Beam pathway of an incoming light passing througha grating followed by a Littrow prism and then a triangular prism. Light dispersion first occurs viadiffraction in the grating layer with the 0th and 1st order diffracted rays being refracted close togetherby the Littrow prisms. The next layer of triangular prisms is responsible for correcting the comaticaberrations through refraction. As a result, a lower Petzval curvature is formed, minimizing aberrationsand further improving solar concentration performances.
Energies 2019, 12, 4719 6 of 18
2.2. Dispersive Compound Prisms
The secondary dispersion mechanism is based on an array of compound prisms. When lightpasses through a prism, it will be dispersed into its constituent wavelengths with each wavelengthof light having its individual refractive index [48]. Therefore, a dispersed light ray of any specificwavelength can be traced by determining its refraction angle, which can be expressed using Snell’s lawof refraction as:
θr = sin−1[n1
n2sinθi
], (3)
where θi represents the incident angle of incoming light ray, θr is its refracted angle as it emerges outof the prism, n1 and n2 indicate the refractive indices of the two media that the light passes through.As discussed in the previous section, the first layer of prisms has been selected as a Littrow prism thatis able to provide a blazed surface to focus the majority of the input light closer together via refraction(Figure 3b). While it is possible to use prisms with intricate angles, commercially available Littrowprisms with fixed prism angles of 30◦/60◦/90◦ have been chosen as they can be easily manufactured,which will also help us to keep overall system cost as low as possible. In addition, it is also suggestedthat the Littrow prism is made of the same low-dispersion material as the grating structure to reducepossible reflection losses.
Compared to the situation of Figure 3a, the optical performance can be much improved by usinga layer of Littrow prisms after a grating (Figure 3b). However, due to optical aberrations caused bythe grating structure and the array of Littrow prisms, a Petzval field curvature is almost verticallyformed and solar concentration performance remained poor. To further improve it, the second layer ofhigh-dispersion prisms with the prism angle of ϕwas implemented (refer to Figure 1a), where incidentlight undergoes effective dispersion. Figure 3c illustrates the combination of both two layers of theprisms in contact, resembling the concept of an Amici prism [44,45]. The material of the second prismshas been selected such that they have a similar refractive index as the first Littrow prisms at theFraunhofer “D” line of 589.3 nm (i.e., n1 ≈ n2 where 1 and 2 denote the first Littrow prism and thesecond triangular prism), but different Abbe numbers (VD1 , VD2) such that the center wavelength oflight can emerge from the compound prisms as nearly parallel to the entrance light beam as possible,i.e., the minimum ray deviation. The rays at the remaining wavelengths are consequently refractedat the angles relative to the materials’ Abbe numbers such that the light dispersion eventuates to anoptical spectrum. Selecting materials with a similar refractive index between two prisms can also bebeneficial to minimize geometric optical losses and compensate beam deviation while maintainingchromatic dispersion, i.e., minimizing comatic aberration along the Petzval field curvature [50,51].The dispersive compound prisms make use of Snell’s law of refraction to disperse the white lightchromatically in accordance to their wavelengths derived from the Fermat’s principle [52]. A shorterwavelength of light will deviate more from its original path than the one with a longer wavelength.
Although both diffraction grating and prism components in the DOS module serve to dispersesunlight, they operate on very different mechanisms, i.e. one makes diffraction and another inducesrefraction. When light undergo diffraction through the grating structure to form a light spectrum,a ray at a longer wavelength (e.g., λ1) will diffract more than that of a shorter wavelength (e.g., λ3)and have a larger diffraction angle θm, as presented in Figure 2. However, when light undergoesdispersion through refractive optical media, shorter wavelengths of light will refract more than longerwavelengths of light. Hence, each wavelength of light in a diffraction spectrum is said to be intransposition to its corresponding wavelength of light in a refractive spectrum. Such phenomenon cangreatly enhance the optical performances of the DOS by adding the second layer of high-dispersiontriangular prisms. When sunlight undergoes separation through the DOS, the combination of thediffraction grating component and Littrow prisms allows high diffraction efficiency in the 0th and1st orders, but it still causes optical aberrations as shown in Figure 3b. By adding the second layerof high-dispersion prisms, the aberrations can be corrected through refraction. Figure 3c illustrateshow the DOS array can undergo effective sunlight separation and, at the same time, minimize comatic
Energies 2019, 12, 4719 7 of 18
aberrations to achieve high solar concentrations. The illustrated beam pathways discussed in Figure 3are supported by ZEMAX simulation results presented in a supplement document.
3. Performance Analyses
The DOS enables highly-concentrated solar spectrum splitting into two wavelength bands. The VISwavelength band of 0.4 µm ≤ λ < 1.2 µm mainly contributes to PV conversion of the c-Si solar cells,while the IR band of 1.2 µm ≤ λ ≤ 2.5 µm is simultaneously used for alternative thermal heatingapplications. Solar performance achieved by the DOS relies on various parametric combinations (e.g.,a focal length of the external concentrator, prism materials and geometry, a grating component, and soon). In this section, we used optical design software (OpticStudio 14.2, ZEMAX) to investigate how eachparameter can be varied to meet the design criteria of the DOS—to realize separation of sunlight intoVIS and IR wavelength bands while achieving high solar concentration for both wavelength bands byensuring the minimum footprint sizes of the solar receivers, respectively. To simulate solar irradiance,the input light source was assumed to provide collimated light covering the AM1.5 spectrum rangingfrom 0.4 µm to 2.5 µm. For the simulation simplification, this solar input was chosen as a total of10,000 rays with an aperture size of 50 × 1 mm2. This couples the solar input with a linear array of 50DOS modules and a cylindrical Fresnel lens, so that light rays can cover every spot along one axis.Parametric studies with varying inputs are discussed in the following subsections.
3.1. Effect of the Focal Length
The effect of the focal length (f ) given by an external Fresnel lens has been first studied. To evaluatethe concentration performance (i.e., the minimum footprint size of respective solar receivers), we selecta common focal plane horizontally drawn at the focal point of the rays at λ = 1.2 µm, where the twowavelength bands can be clearly separated. Therefore, their concentration factors can be subsequentlyestimated on the given focal plane by using Equation (1). For this study, the external lens’s focal lengthwas varied from 50 mm to 200 mm, while other control parameters were set to be the grating densityas dg = 12 grooves/mm and the apex angle of the second prism as ϕ = 19◦. The length of each prisms(refer to Figure 1a) was set as l = 1 mm, while their materials were selected as low-dispersion BK7 (VD2
= 64.17) for the Littrow prism and high-dispersion F2 (VD2 = 36.37) for the second triangular prism(justifications for choice of materials are discussed in Section 3.3).
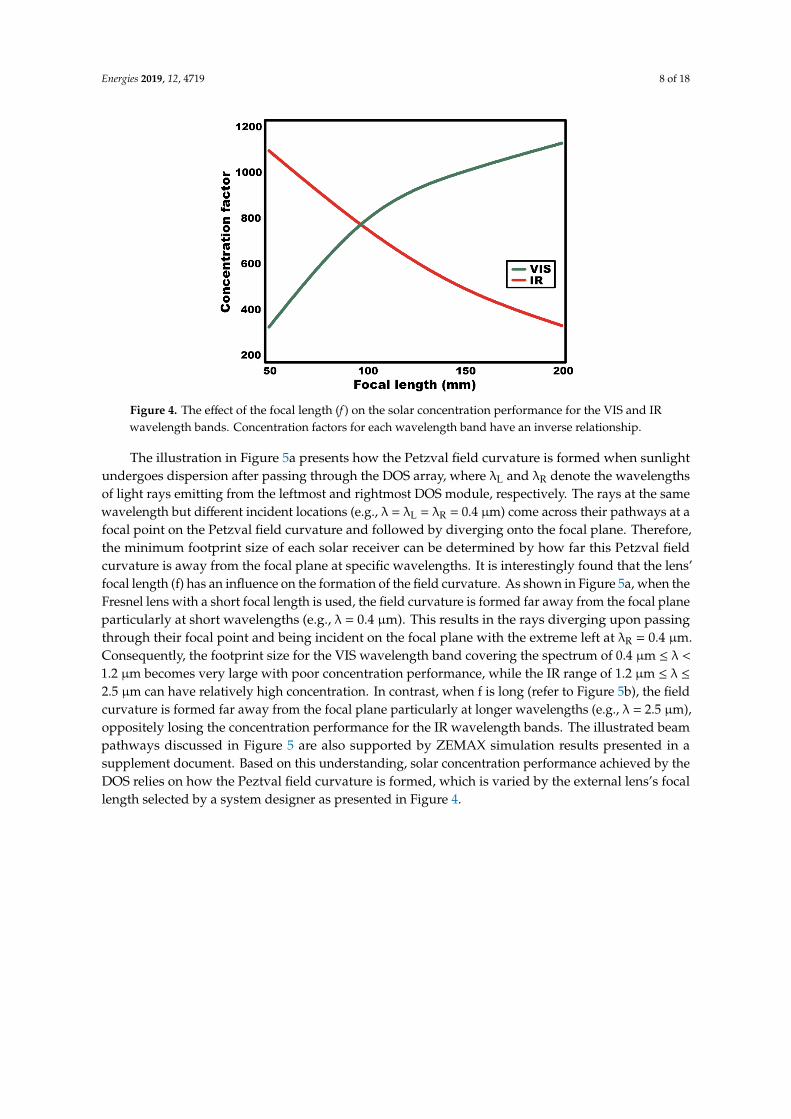
Figure 4 shows simulation results of the concentration factor for both VIS and IR wavelengthbands. An opposite trend is observed for each wavelength band; one increases but another decreases asthe increase of the lens’s focal length. To help understand such simulation results in solar concentrationperformance varied by the focal length, a concept of the Petzval field curvature is introduced [50].Due to optical aberrations, each wavelength of light cannot be brought into focus on a commonflat plane. Typically, rays at shorter wavelengths (e.g., λ = 0.4 µm) have much shorter focal pointsthan the ones at longer wavelengths (e.g., λ = 2.5 µm). Such a curve collecting these focal pointsvaried by the rays’ wavelengths is called the Petzval field curvature, where every focal point isasymmetrically distributed.
Energies 2019, 12, 4719 8 of 18
Energies 2019, 12, x FOR PEER REVIEW 8 of 17
Figure 4. The effect of the focal length (f) on the solar concentration performance for the VIS and IR wavelength bands. Concentration factors for each wavelength band have an inverse relationship.
The illustration in Figure 5a presents how the Petzval field curvature is formed when sunlight undergoes dispersion after passing through the DOS array, where λL and λR denote the wavelengths of light rays emitting from the leftmost and rightmost DOS module, respectively. The rays at the same wavelength but different incident locations (e.g., λ = λL = λR = 0.4 μm) come across their pathways at a focal point on the Petzval field curvature and followed by diverging onto the focal plane. Therefore, the minimum footprint size of each solar receiver can be determined by how far this Petzval field curvature is away from the focal plane at specific wavelengths. It is interestingly found that the lens’ focal length (f) has an influence on the formation of the field curvature. As shown in Figure 5a, when the Fresnel lens with a short focal length is used, the field curvature is formed far away from the focal plane particularly at short wavelengths (e.g., λ = 0.4 μm). This results in the rays diverging upon passing through their focal point and being incident on the focal plane with the extreme left at λR = 0.4 μm. Consequently, the footprint size for the VIS wavelength band covering the spectrum of 0.4 μm ≤ λ < 1.2 μm becomes very large with poor concentration performance, while the IR range of 1.2
μm ≤ λ ≤ 2.5 μm can have relatively high concentration. In contrast, when f is long (refer to Figure 5b), the field curvature is formed far away from the focal plane particularly at longer wavelengths (e.g., λ = 2.5 μm), oppositely losing the concentration performance for the IR wavelength bands. The illustrated beam pathways discussed in Figure 5 are also supported by ZEMAX simulation results presented in a supplement document. Based on this understanding, solar concentration performance achieved by the DOS relies on how the Peztval field curvature is formed, which is varied by the external lens’s focal length selected by a system designer as presented in Figure 4.
Figure 4. The effect of the focal length (f ) on the solar concentration performance for the VIS and IRwavelength bands. Concentration factors for each wavelength band have an inverse relationship.
The illustration in Figure 5a presents how the Petzval field curvature is formed when sunlightundergoes dispersion after passing through the DOS array, where λL and λR denote the wavelengthsof light rays emitting from the leftmost and rightmost DOS module, respectively. The rays at the samewavelength but different incident locations (e.g., λ = λL = λR = 0.4 µm) come across their pathways at afocal point on the Petzval field curvature and followed by diverging onto the focal plane. Therefore,the minimum footprint size of each solar receiver can be determined by how far this Petzval fieldcurvature is away from the focal plane at specific wavelengths. It is interestingly found that the lens’focal length (f) has an influence on the formation of the field curvature. As shown in Figure 5a, when theFresnel lens with a short focal length is used, the field curvature is formed far away from the focal planeparticularly at short wavelengths (e.g., λ = 0.4 µm). This results in the rays diverging upon passingthrough their focal point and being incident on the focal plane with the extreme left at λR = 0.4 µm.Consequently, the footprint size for the VIS wavelength band covering the spectrum of 0.4 µm ≤ λ <
1.2 µm becomes very large with poor concentration performance, while the IR range of 1.2 µm ≤ λ ≤
2.5 µm can have relatively high concentration. In contrast, when f is long (refer to Figure 5b), the fieldcurvature is formed far away from the focal plane particularly at longer wavelengths (e.g., λ = 2.5 µm),oppositely losing the concentration performance for the IR wavelength bands. The illustrated beampathways discussed in Figure 5 are also supported by ZEMAX simulation results presented in asupplement document. Based on this understanding, solar concentration performance achieved by theDOS relies on how the Peztval field curvature is formed, which is varied by the external lens’s focallength selected by a system designer as presented in Figure 4.
Energies 2019, 12, 4719 9 of 18
Energies 2019, 12, x FOR PEER REVIEW 9 of 17
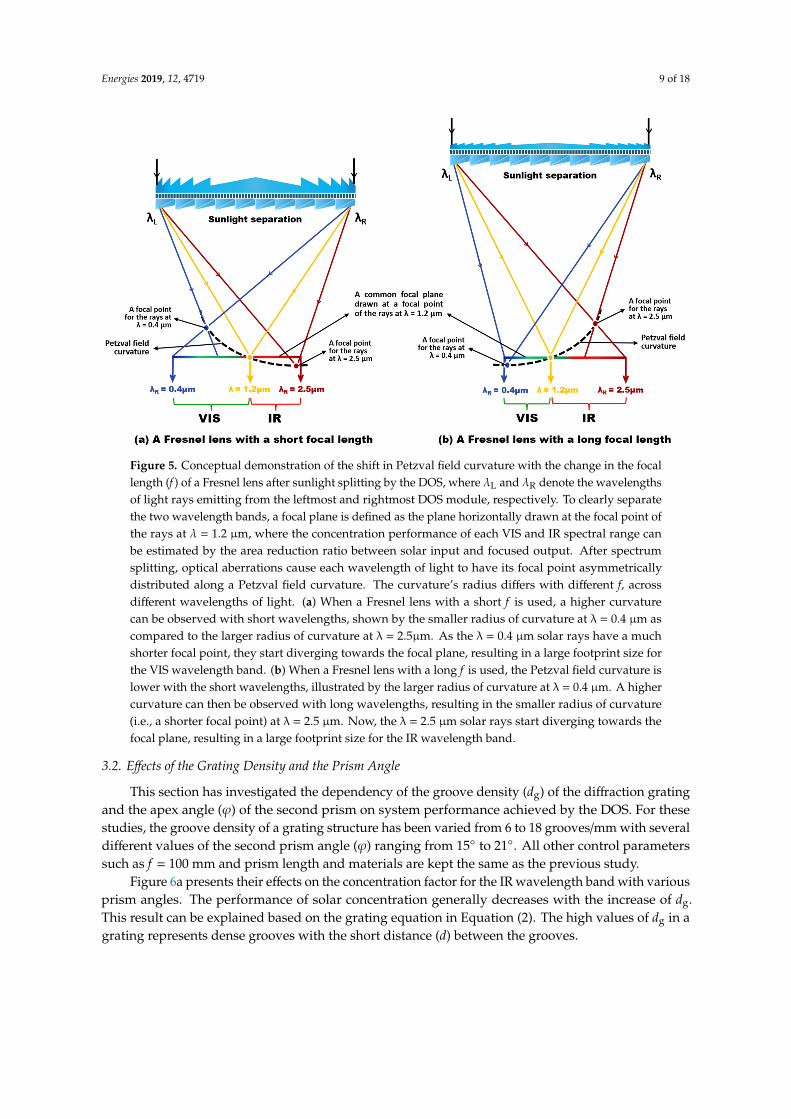
Figure 5. Conceptual demonstration of the shift in Petzval field curvature with the change in the focal length (f) of a Fresnel lens after sunlight splitting by the DOS, where λL and λR denote the wavelengths of light rays emitting from the leftmost and rightmost DOS module, respectively. To clearly separate the two wavelength bands, a focal plane is defined as the plane horizontally drawn at the focal point of the rays at λ = 1.2 μm, where the concentration performance of each VIS and IR spectral range can be estimated by the area reduction ratio between solar input and focused output. After spectrum splitting, optical aberrations cause each wavelength of light to have its focal point asymmetrically distributed along a Petzval field curvature. The curvature’s radius differs with different f, across different wavelengths of light. (a) When a Fresnel lens with a short f is used, a higher curvature can be observed with short wavelengths, shown by the smaller radius of curvature at λ = 0.4 μm as compared to the larger radius of curvature at λ = 2.5μm. As the λ = 0.4 μm solar rays have a much shorter focal point, they start diverging towards the focal plane, resulting in a large footprint size for the VIS wavelength band. (b) When a Fresnel lens with a long f is used, the Petzval field curvature is lower with the short wavelengths, illustrated by the larger radius of curvature at λ = 0.4 μm. A higher curvature can then be observed with long wavelengths, resulting in the smaller radius of curvature (i.e., a shorter focal point) at λ = 2.5 μm. Now, the λ = 2.5 μm solar rays start diverging towards the focal plane, resulting in a large footprint size for the IR wavelength band.
3.2. Effects of the Grating Density and the Prism Angle
This section has investigated the dependency of the groove density (dg) of the diffraction grating and the apex angle (φ) of the second prism on system performance achieved by the DOS. For these studies, the groove density of a grating structure has been varied from 6 to 18 grooves/mm with several different values of the second prism angle (φ) ranging from 15° to 21°. All other control parameters such as f = 100 mm and prism length and materials are kept the same as the previous study.
Figure 6a presents their effects on the concentration factor for the IR wavelength band with various prism angles. The performance of solar concentration generally decreases with the increase of dg. This result can be explained based on the grating equation in Equation (2). The high values of dg in a grating represents dense grooves with the short distance (d) between the grooves.
As indicated in Figure 2, for low values of d with a given θi, Equation (2) expresses large beam diffraction in IR ranges (i.e., large θm), where the Petzval field curvature is formed far away from the focal plane for longer wavelengths of light and leads to a loss in concentration effect. It is also observed from Figure 6a that the solar concentration increases with higher prism angles (φ). As light emerges from the last interface of the second prism, a larger 𝜑 causes a wider angle of refraction, in
Figure 5. Conceptual demonstration of the shift in Petzval field curvature with the change in the focallength (f ) of a Fresnel lens after sunlight splitting by the DOS, where λL and λR denote the wavelengthsof light rays emitting from the leftmost and rightmost DOS module, respectively. To clearly separatethe two wavelength bands, a focal plane is defined as the plane horizontally drawn at the focal point ofthe rays at λ = 1.2 µm, where the concentration performance of each VIS and IR spectral range canbe estimated by the area reduction ratio between solar input and focused output. After spectrumsplitting, optical aberrations cause each wavelength of light to have its focal point asymmetricallydistributed along a Petzval field curvature. The curvature’s radius differs with different f, acrossdifferent wavelengths of light. (a) When a Fresnel lens with a short f is used, a higher curvaturecan be observed with short wavelengths, shown by the smaller radius of curvature at λ = 0.4 µm ascompared to the larger radius of curvature at λ = 2.5µm. As the λ = 0.4 µm solar rays have a muchshorter focal point, they start diverging towards the focal plane, resulting in a large footprint size forthe VIS wavelength band. (b) When a Fresnel lens with a long f is used, the Petzval field curvature islower with the short wavelengths, illustrated by the larger radius of curvature at λ = 0.4 µm. A highercurvature can then be observed with long wavelengths, resulting in the smaller radius of curvature(i.e., a shorter focal point) at λ = 2.5 µm. Now, the λ = 2.5 µm solar rays start diverging towards thefocal plane, resulting in a large footprint size for the IR wavelength band.
3.2. Effects of the Grating Density and the Prism Angle
This section has investigated the dependency of the groove density (dg) of the diffraction gratingand the apex angle (ϕ) of the second prism on system performance achieved by the DOS. For thesestudies, the groove density of a grating structure has been varied from 6 to 18 grooves/mm with severaldifferent values of the second prism angle (ϕ) ranging from 15◦ to 21◦. All other control parameterssuch as f = 100 mm and prism length and materials are kept the same as the previous study.
Figure 6a presents their effects on the concentration factor for the IR wavelength band with variousprism angles. The performance of solar concentration generally decreases with the increase of dg.This result can be explained based on the grating equation in Equation (2). The high values of dg in agrating represents dense grooves with the short distance (d) between the grooves.
Energies 2019, 12, 4719 10 of 18
Energies 2019, 12, x FOR PEER REVIEW 10 of 17
accordance to Snell’s law. As light at shorter wavelengths refracts more when compared to longer wavelengths within the IR wavelength band, every wavelength’s focal point within the wavelength band becomes closer together along the Petzval field curvature, resulting in a smaller footprint and thus a higher concentration factor.
On the contrary to the IR wavelength band, Figure 6b shows that the concentration factor for the VIS band at shorter wavelengths is less reliant on the groove density (dg). This observation has also been discussed in Figure 2. The VIS concentration is more dominantly influenced by the apex angle of the second prism. The same reasoning used in the performance of IR concentration can be applicable to explain this similar observation for VIS. A wider refraction angle causes light at shorter wavelengths to converge onto the longer wavelengths within each respective wavelength bands, resulting in a smaller footprint and thus a higher concentration factor. One interesting point in Figure 6b, however, is the peak in concentration performance in the VIS wavelength band at dg = 13.5 grooves/mm when the prism is at 𝜑 = 21°. This is because the focal points of the light in the VIS range are found to be close to one another along the Petzval field curvature. Comatic aberration in the VIS ranges is said to be lowest at the given parameters, resulting in a very small VIS footprint and hence, such high concentration factor.
However, while certain groove densities at specific prism angles provide high solar concentrations in either VIS or IR, not every set of parameters can be taken into consideration. This is because a fraction of the VIS wavelength band at notably short wavelengths (e.g., λL = 0.4 μm) is overlapped into the IR wavelength band at various grating densities and prism angles, as referred to the inset image of Figure 6c. Overlapping of these rays occurs when the field curvature becomes severe at the short wavelength ranges. As a result, the rays at λL = 0.4 μm continue to diverge after passing through their focal point and a fraction of these rays will eventually overlap with the footprint of the IR wavelength band on the common plane. This overlapping phenomenon is undesirable as a portion of the VIS wavelength band cannot contribute to PV conversion process. Figure 6c shows the percentage of the overlapped outmost λL = 0.4 μm ray in the IR wavelength band with respect to the footprint size of the IR band of the particular configuration. Positive values in Figure 6c signify that a portion of the VIS wavelength band is overlapped with the IR, as shown in an inset image of Figure 6c, while negative values signify that two wavelength bands are completely separated at the focal point of the rays at λ = 1.2 μm, as shown in the illustrations of Figure 5.
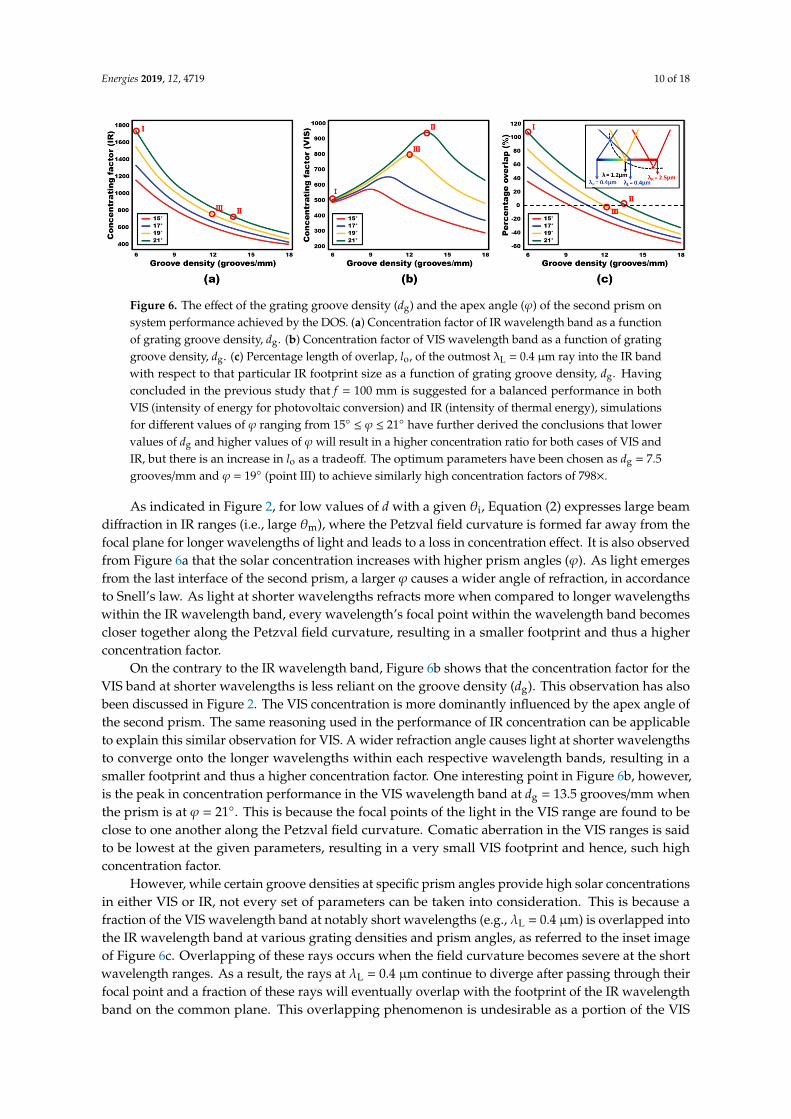
Figure 6. The effect of the grating groove density (dg) and the apex angle (φ) of the second prism on system performance achieved by the DOS. (a) Concentration factor of IR wavelength band as a function of grating groove density, dg. (b) Concentration factor of VIS wavelength band as a function of grating groove density, dg. (c) Percentage length of overlap, lo, of the outmost λL = 0.4 μm ray into the IR band with respect to that particular IR footprint size as a function of grating groove density, dg. Having concluded in the previous study that f = 100 mm is suggested for a balanced performance in both VIS (intensity of energy for photovoltaic conversion) and IR (intensity of thermal energy), simulations for different values of φ ranging from 15° ≤ φ ≤ 21° have further derived the conclusions that lower values of dg and higher values of φ will result in a higher concentration ratio for both cases of VIS and IR, but there is an increase in lo as a tradeoff. The optimum parameters have been chosen as dg = 7.5 grooves/mm and φ = 19° (point III) to achieve similarly high concentration factors of 798×
Figure 6. The effect of the grating groove density (dg) and the apex angle (ϕ) of the second prism onsystem performance achieved by the DOS. (a) Concentration factor of IR wavelength band as a functionof grating groove density, dg. (b) Concentration factor of VIS wavelength band as a function of gratinggroove density, dg. (c) Percentage length of overlap, lo, of the outmost λL = 0.4 µm ray into the IR bandwith respect to that particular IR footprint size as a function of grating groove density, dg. Havingconcluded in the previous study that f = 100 mm is suggested for a balanced performance in bothVIS (intensity of energy for photovoltaic conversion) and IR (intensity of thermal energy), simulationsfor different values of ϕ ranging from 15◦ ≤ ϕ ≤ 21◦ have further derived the conclusions that lowervalues of dg and higher values of ϕ will result in a higher concentration ratio for both cases of VIS andIR, but there is an increase in lo as a tradeoff. The optimum parameters have been chosen as dg = 7.5grooves/mm and ϕ = 19◦ (point III) to achieve similarly high concentration factors of 798×.
As indicated in Figure 2, for low values of d with a given θi, Equation (2) expresses large beamdiffraction in IR ranges (i.e., large θm), where the Petzval field curvature is formed far away from thefocal plane for longer wavelengths of light and leads to a loss in concentration effect. It is also observedfrom Figure 6a that the solar concentration increases with higher prism angles (ϕ). As light emergesfrom the last interface of the second prism, a larger ϕ causes a wider angle of refraction, in accordanceto Snell’s law. As light at shorter wavelengths refracts more when compared to longer wavelengthswithin the IR wavelength band, every wavelength’s focal point within the wavelength band becomescloser together along the Petzval field curvature, resulting in a smaller footprint and thus a higherconcentration factor.
On the contrary to the IR wavelength band, Figure 6b shows that the concentration factor for theVIS band at shorter wavelengths is less reliant on the groove density (dg). This observation has alsobeen discussed in Figure 2. The VIS concentration is more dominantly influenced by the apex angle ofthe second prism. The same reasoning used in the performance of IR concentration can be applicableto explain this similar observation for VIS. A wider refraction angle causes light at shorter wavelengthsto converge onto the longer wavelengths within each respective wavelength bands, resulting in asmaller footprint and thus a higher concentration factor. One interesting point in Figure 6b, however,is the peak in concentration performance in the VIS wavelength band at dg = 13.5 grooves/mm whenthe prism is at ϕ = 21◦. This is because the focal points of the light in the VIS range are found to beclose to one another along the Petzval field curvature. Comatic aberration in the VIS ranges is saidto be lowest at the given parameters, resulting in a very small VIS footprint and hence, such highconcentration factor.
However, while certain groove densities at specific prism angles provide high solar concentrationsin either VIS or IR, not every set of parameters can be taken into consideration. This is because afraction of the VIS wavelength band at notably short wavelengths (e.g., λL = 0.4 µm) is overlapped intothe IR wavelength band at various grating densities and prism angles, as referred to the inset imageof Figure 6c. Overlapping of these rays occurs when the field curvature becomes severe at the shortwavelength ranges. As a result, the rays at λL = 0.4 µm continue to diverge after passing through theirfocal point and a fraction of these rays will eventually overlap with the footprint of the IR wavelengthband on the common plane. This overlapping phenomenon is undesirable as a portion of the VIS
Energies 2019, 12, 4719 11 of 18
wavelength band cannot contribute to PV conversion process. Figure 6c shows the percentage of theoverlapped outmost λL = 0.4 µm ray in the IR wavelength band with respect to the footprint size of theIR band of the particular configuration. Positive values in Figure 6c signify that a portion of the VISwavelength band is overlapped with the IR, as shown in an inset image of Figure 6c, while negativevalues signify that two wavelength bands are completely separated at the focal point of the rays at λ =
1.2 µm, as shown in the illustrations of Figure 5.The marked data points (I, II, and III) in Figure 6 can be used to analyze the design choice of
groove density and prism angle. Firstly, the point I (dg = 6 grooves/mm and ϕ = 21◦) in the graphs ofFigure 6 indicates a high concentration factor at above 1700× for the IR band. However, a much lowerconcentration factor of 500× is observed in the VIS band. Furthermore, this set of parameters causes thelargest overlap between two wavelength bands at 110% as presented in Figure 6c. Secondly, the point II(dg = 13.5 grooves/mm, ϕ = 21◦) reflects the highest VIS concentration factor of 940× in Figure 6b, whileFigure 6a highlighted a slightly lower concentration factor of 738× for IR wavelength band. However,Figure 6c also shows a positive value of 4%, verifying an overlap between the two wavelength bands.Lastly, the point III (dg = 12 grooves/mm, ϕ = 19◦) demonstrates similarly high concentration factors of798× and 755× for VIS and IR wavelength bands, respectively. A negative value of −0.1% in Figure 6chas indicated no overlapping between the two wavelength bands. Therefore, while this study hasshown that low groove densities and large prism angles can achieve high solar concentrations of eitherVIS or IR, the tradeoff comes with an increase in the overlapped percentage between two wavelengthbands. Finally, a point III shows balanced concentration performances for both VIS and IR bandswithout the overlapping.
3.3. Effect of Prism Material
As the wide-spectrum sunlight passes through the DOS, it undergoes dispersion with the longerwavelengths travelling through the prism faster than the shorter wavelengths, resulting in chromaticdispersion. The Abbe number (VD) indicates the level of the prism materials for optical dispersion,according to the variation of its refractive index with respect to the wavelength. Low dispersivematerials have the high value of VD, while the low VD indicates the materials with high dispersion.To understand the effect of the prism materials on system performance, we define the ratio (Vr) of theAbbe number between the two prism materials as:
Vr = VD1/VD2, (4)
where VD1 and VD2 are the Abbe numbers for the first Littrow prism and the second dispersive prism,respectively. Based on such a definition, it is noted that a higher value of Vr signifies more dispersionof the rays. For this study, several prism materials are selected based on their similarities in refractiveindices but differences in the Abbe number. The material for the first layer (i.e., a Littrow prism) isidentified as BK7, which is also the same material used for the Fresnel lens and grating structure toreduce possible optical losses at their interface. The material of BK7 also offers a high Abbe number ofVD1 = 64.17 to minimize the ray deviation, hence the less effect of comatic aberration to achieve highsolar concentration [50,51]. With the given first material, the Vr value was varied from 0.70 to 1.76 bypossibly selecting several materials for the second dispersive prism as N-FK58 (VD2 = 90.90), N-PK51(VD2 = 76.97), BK7 (VD2 = 64.17), KZFS4 (VD2 = 44.49), and F2 (VD2 = 36.37). These materials werechosen based on the proximity of their refractive indices as compared to the one for BK7 to minimizethe ray deviation due to comatic aberrations. In this study, other control parameters were set to be as f= 100 mm, l = 1 mm, ϕ = 19◦, and dg = 12 grooves/mm.
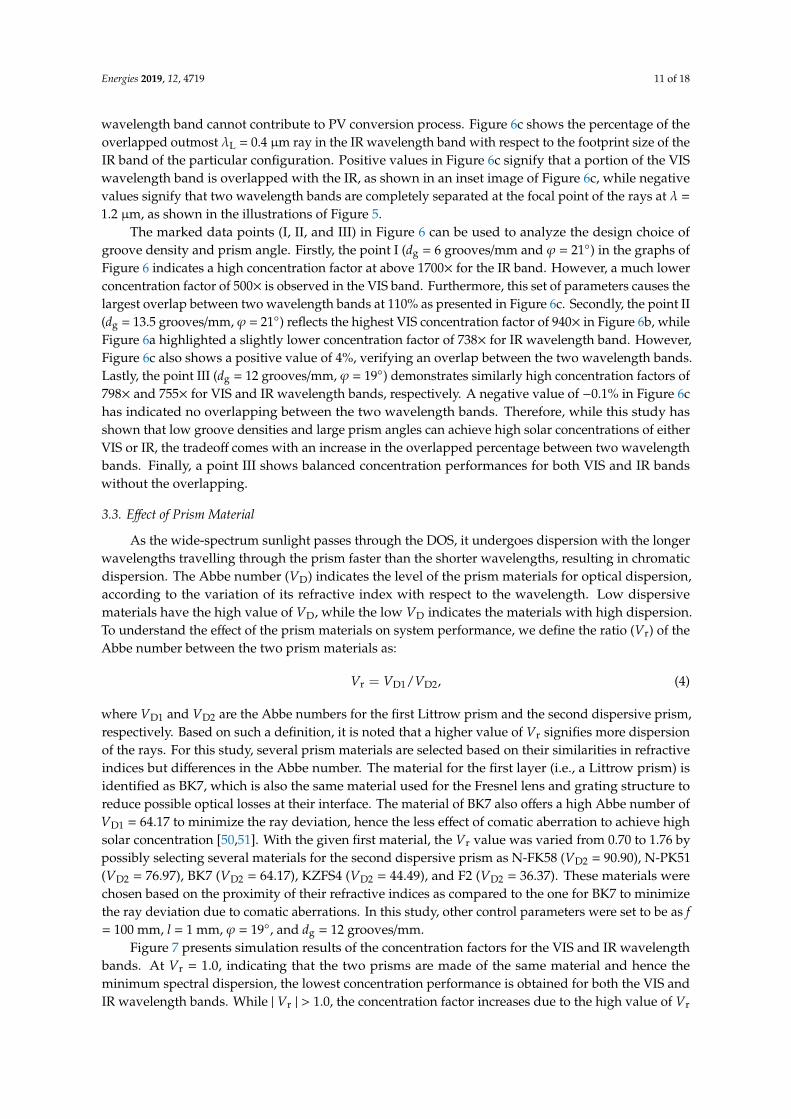
Figure 7 presents simulation results of the concentration factors for the VIS and IR wavelengthbands. At Vr = 1.0, indicating that the two prisms are made of the same material and hence theminimum spectral dispersion, the lowest concentration performance is obtained for both the VIS andIR wavelength bands. While | Vr | > 1.0, the concentration factor increases due to the high value of Vr
Energies 2019, 12, 4719 12 of 18
dominantly refracting incoming rays. The study in Figure 7 notes us that it is beneficial to have a largeVr for material combination. With the Littrow prism assumed to be made of a low-dispersion materialof BK7, the second dispersive prism is recommended to be made of a high-dispersion material (i.e.,low VD2). Based on the study indicated in Figure 7, the DOS is able to split the wide solar spectruminto the two wavelength bands to achieve the concentration factors as high as 798× and 755× for bothVIS and IR bands at Vr = 1.76.Energies 2019, 12, x FOR PEER REVIEW 12 of 17
Figure 7. The effect of the prism mateirals on the solar concentration performance for the VIS and IR wavelength bands by varying the Abbe number ratio (Vr = VD1/VD2) of the compound prism materials.
3.4. Reflection Loss
Fundamentally, reflection loss, which occurs when light is incident onto the interface shared by two different media of different refractive indices, is one of the performance metrics to be concerned [53,54]. A reflection loss could be accumulated at the interfaces across the 3 optical components of the DOS, which is dependable on incident angles of incoming light as well as the refractive index ratio between the two media. After the Fresnel lens, the rays are focused with various incident angles along the grating structure, before reaching the two layers of prisms. Maximum reflection loss occurs for the rays being incident at the extreme ends of the DOS, where incident angles of incoming concentrated light are highest.
For this study, a ray tracing software (Zemax OpticStudio 14.2) was used to measure the total optical power before and after the interfaces of the DOS for both VIS and IR wavelength bands. High solar concentrations can be achieved by placing the DOS underneath a Fresnel lens, which has been widely used in regular concentrating solar applications such as concentrated photovoltaics (CPV) and concentrated solar power (CSP). Optical losses by reflection occurring in the Fresnel lens are inevitable for any optical system (i.e., DOS, CPV/CSP systems). By using only the Fresnel lens (f = 100 mm) without any dispersion mechanism attached for comparison, a typical CPV/CSP system is simulated to have a solar concentration only 38× (Zemax simulation results presented in a supplement document), due to chromatic aberrations over the whole sunlight spectrum. However, by additionally attaching the DOS underneath the concentrating lens, solar spectrum separation with higher solar concentration factors can be achieved for both VIS (798×) and IR (755×) wavelength bands with only an additional 5.8% in overall reflection losses of the system. Moreover, reflection losses can be further reduced around 2.7% by applying a thin film of a matching refractive index based on the principle of Rayleigh’s film [48] between the two layers of dispersive arrayed prisms.
4. Optimum System Configuration for Balanced Performance
Based on the parametric studies discussed in the previous sections, different permutations of parameters can be chosen to fulfill the established design requirements of the DOS system. System performance is entirely up to one’s discretion. In this paper, we determined an optimized system to have similar weightages in concentration performances for VIS and IR wavelength bands. As the VIS wavelength band ranging, 0.4 μm ≤ λ < 1.2 μm, is designated to PV conversion of c-Si solar cells, having a high concentration offers advantages such as cost reduction in material and higher conversion cell efficiency [55]. On the other hand, IR wavelength band covering 1.2 μm ≤ λ ≤ 2.5 μm is being converted for solar thermal applications, where high concentration factors are critically
Figure 7. The effect of the prism mateirals on the solar concentration performance for the VIS and IRwavelength bands by varying the Abbe number ratio (Vr = VD1/VD2) of the compound prism materials.
3.4. Reflection Loss
Fundamentally, reflection loss, which occurs when light is incident onto the interface shared by twodifferent media of different refractive indices, is one of the performance metrics to be concerned [53,54].A reflection loss could be accumulated at the interfaces across the 3 optical components of the DOS,which is dependable on incident angles of incoming light as well as the refractive index ratio betweenthe two media. After the Fresnel lens, the rays are focused with various incident angles along thegrating structure, before reaching the two layers of prisms. Maximum reflection loss occurs for therays being incident at the extreme ends of the DOS, where incident angles of incoming concentratedlight are highest.
For this study, a ray tracing software (Zemax OpticStudio 14.2) was used to measure the totaloptical power before and after the interfaces of the DOS for both VIS and IR wavelength bands.High solar concentrations can be achieved by placing the DOS underneath a Fresnel lens, which hasbeen widely used in regular concentrating solar applications such as concentrated photovoltaics(CPV) and concentrated solar power (CSP). Optical losses by reflection occurring in the Fresnel lensare inevitable for any optical system (i.e., DOS, CPV/CSP systems). By using only the Fresnel lens(f = 100 mm) without any dispersion mechanism attached for comparison, a typical CPV/CSP system issimulated to have a solar concentration only 38× (Zemax simulation results presented in a supplementdocument), due to chromatic aberrations over the whole sunlight spectrum. However, by additionallyattaching the DOS underneath the concentrating lens, solar spectrum separation with higher solarconcentration factors can be achieved for both VIS (798×) and IR (755×) wavelength bands with onlyan additional 5.8% in overall reflection losses of the system. Moreover, reflection losses can be furtherreduced around 2.7% by applying a thin film of a matching refractive index based on the principle ofRayleigh’s film [48] between the two layers of dispersive arrayed prisms.
Energies 2019, 12, 4719 13 of 18
4. Optimum System Configuration for Balanced Performance
Based on the parametric studies discussed in the previous sections, different permutations ofparameters can be chosen to fulfill the established design requirements of the DOS system. Systemperformance is entirely up to one’s discretion. In this paper, we determined an optimized system tohave similar weightages in concentration performances for VIS and IR wavelength bands. As the VISwavelength band ranging, 0.4 µm ≤ λ < 1.2 µm, is designated to PV conversion of c-Si solar cells,having a high concentration offers advantages such as cost reduction in material and higher conversioncell efficiency [55]. On the other hand, IR wavelength band covering 1.2 µm ≤ λ ≤ 2.5 µm is beingconverted for solar thermal applications, where high concentration factors are critically required foreffective thermal energy harvesting. Therefore, we optimized the DOS for both VIS and IR to haveequally high concentration performances.
By referring to Figure 4, we recognized that the increase of the lens’ focal length results in anincrease in the DOS’ performance of solar concentration in the VIS wavelength band, but at the expenseof a decrease in performance of solar concentration in the IR wavelength band. In order for bothVIS and IR wavelength bands to have similar weightages in solar concentration, keeping in view ofthe optical components’ commercial availability for low-cost systems, an external Fresnel lens witha focal length of f = 100 mm has been suggested. Additionally, from Figure 6, we observed thathaving small dg and large ϕ is necessary to achieve high VIS and IR concentration factors required foreffective energy harvesting. However, a small dg and a large ϕ will have an undesirable overlappingbetween two wavelength bands, as the case of the point I indicated in Figure 6. Moreover, Figure 6b,cdemonstrated extremely high VIS concentration factor without the overlapping of two wavelengthbands when dg = 13.5 grooves/mm and ϕ = 21◦ (as the case of the point II indicated in Figure 6).However, the concentration factor of the IR range is found to be significantly lower, which did notsatisfy the design criterion with similar weights in concentration performance for both wavelengthbands. Consequently, the DOS module has been established to have a diffraction grating layer of groovedensity, dg = 12 grooves/mm, followed by the dispersive compound prism geometrics of 30◦/60◦/90◦
prism angles for the first Littrow prism and ϕ = 19◦ the second triangular dispersive prism, as the caseof point III in Figure 6. Finally, based on the results presented in Figure 7, it was understood that alarge value of Vr is preferred to achieve high solar concentration. As such, the dispersive compoundprism in each DOS module with a material combination as high as Vr = 1.76 is preferred, where theLittrow prism is made of BK7 while the second triangular dispersive prism is made of F2.
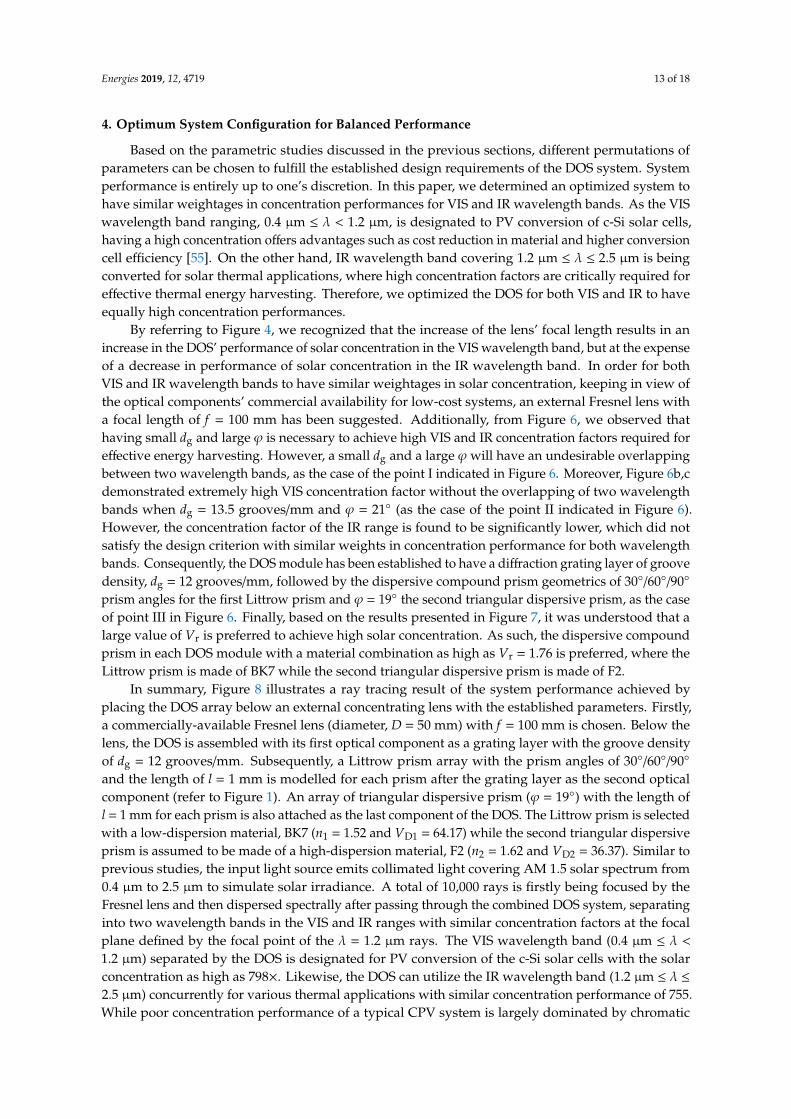
In summary, Figure 8 illustrates a ray tracing result of the system performance achieved byplacing the DOS array below an external concentrating lens with the established parameters. Firstly,a commercially-available Fresnel lens (diameter, D = 50 mm) with f = 100 mm is chosen. Below thelens, the DOS is assembled with its first optical component as a grating layer with the groove densityof dg = 12 grooves/mm. Subsequently, a Littrow prism array with the prism angles of 30◦/60◦/90◦
and the length of l = 1 mm is modelled for each prism after the grating layer as the second opticalcomponent (refer to Figure 1). An array of triangular dispersive prism (ϕ = 19◦) with the length ofl = 1 mm for each prism is also attached as the last component of the DOS. The Littrow prism is selectedwith a low-dispersion material, BK7 (n1 = 1.52 and VD1 = 64.17) while the second triangular dispersiveprism is assumed to be made of a high-dispersion material, F2 (n2 = 1.62 and VD2 = 36.37). Similar toprevious studies, the input light source emits collimated light covering AM 1.5 solar spectrum from0.4 µm to 2.5 µm to simulate solar irradiance. A total of 10,000 rays is firstly being focused by theFresnel lens and then dispersed spectrally after passing through the combined DOS system, separatinginto two wavelength bands in the VIS and IR ranges with similar concentration factors at the focalplane defined by the focal point of the λ = 1.2 µm rays. The VIS wavelength band (0.4 µm ≤ λ <
1.2 µm) separated by the DOS is designated for PV conversion of the c-Si solar cells with the solarconcentration as high as 798×. Likewise, the DOS can utilize the IR wavelength band (1.2 µm ≤ λ ≤2.5 µm) concurrently for various thermal applications with similar concentration performance of 755.While poor concentration performance of a typical CPV system is largely dominated by chromatic
Energies 2019, 12, 4719 14 of 18
aberration, high solar performances are achievable by adding the DOS array because sunlight is beingfocused and then subsequently separated into two highly concentrated wavelength bands (VIS or IR)with minimum optical aberrations.Energies 2019, 12, x FOR PEER REVIEW 14 of 17
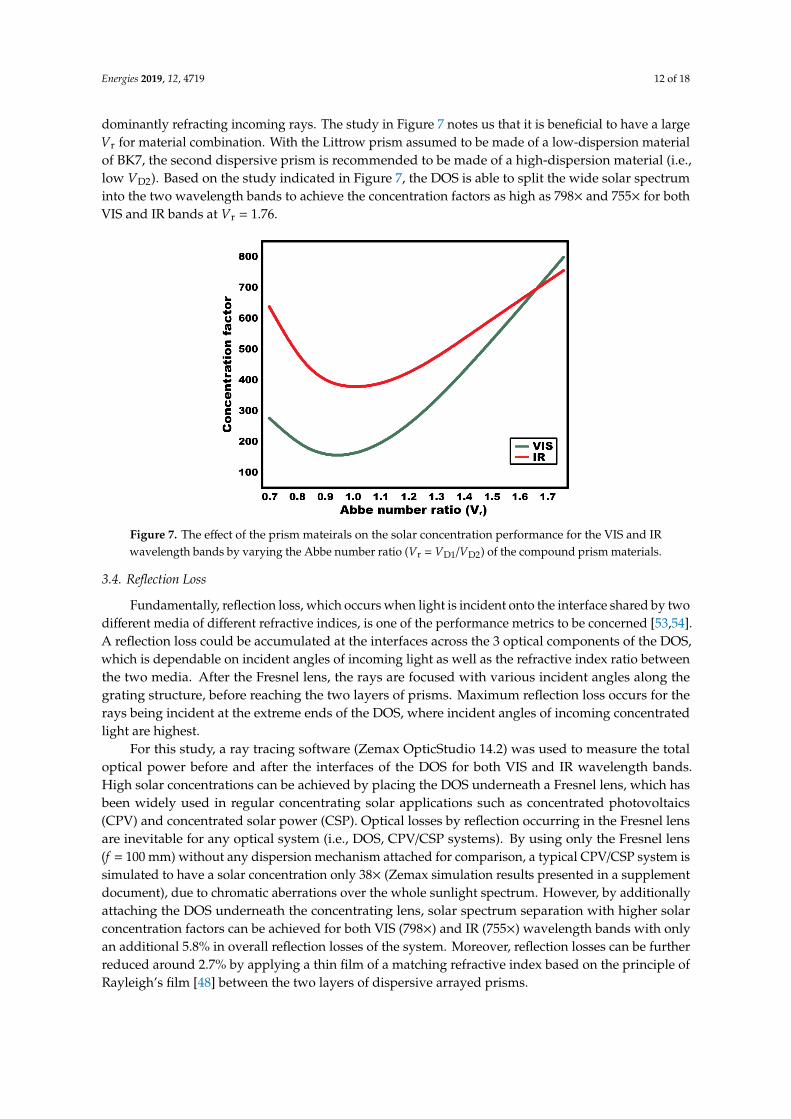
Figure 8. Simulation results show effective solar splitting as well as high concentration up to 798× for VIS wavelength band and 755 factor for IR wavelength band on the focal plane, 𝑓 = 100 mm, given by an external Fresnel lens. Simulation results based on the following DOS parameters: a diffraction grating with the groove density of dg = 12 grooves/mm, the 1-mm height of each compound prism module. The first layer of Littrow prism has an apex angle of φ = 30° and is made of a low dispersion material BK7 (n = 1.52, VD = 64.17), while the second layer is a triangular prism with a corresponding apex angle of φ = 19° and made of a high dispersion material F2 (n = 1.62, VD = 36.37).
An additional comparative study has been also conducted to determine the concentration performances for an ordinary system comprising of only a single Fresnel lens with an identical focal length (f = 100 mm) without the DOS array, presented in a supplement document. First, an input light source was set to be incident onto the only Fresnel lens using only wavelengths in VIS range (0.4 μm ≤ λ < 1.2 μm) and a following study was conducted with only wavelengths in the IR range (1.2 μm ≤ λ ≤ 2.5 μm). The ray tracing results estimated concentration factors of just 38× and 65× for VIS and IR ranges respectively, validating the poor concentration performances due to chromatic aberrations caused by using the only Fresnel lens. Clearly, by additionally placing the DOS array composed of a diffraction grating and dispersive prisms below the lens, we can realize much higher concentrations of 798× and 755× for both VIS and IR respectively, as much as 21.0 folds (VIS band) and 11.6 folds (IR band) higher than what are achieved in ordinary systems with a single Fresnel lens.
5. Conclusions
We present a novel dispersive optical system (DOS) that enables highly-concentrated spectral splitting to effectively harvest solar energy over the entire AM1.5 spectrum. By separating sunlight into two wavelength bands, VIS and IR, the concept of the DOS can help widen the usage of the whole sunlight spectrum, for photovoltaic conversion of solar cells, while at the same time harvesting energy from the rest of the sunlight spectrum for other thermal applications. A reasonably low reflection loss caused by the optical components in the DOS is estimated with only an additional loss about 2.7% by using a Rayleigh’s film as compared to regular single concentrating lens solar applications.
By attaching to an external Fresnel lens (f = 100 mm), the DOS system used a grating structure (dg = 12 grooves/mm), followed by a layer of 30°/60°/90° Littrow prisms of the same material, which served as a blazed surface to focus light from the 0th and 1st diffraction orders close together with minimum reflection losses. Thereafter, another layer of high-dispersion prisms with an apex angle of φ = 19° is recommended to minimize comatic aberration and the Petzval field curvature through refraction, and achieve high but similar concentrations for both VIS and IR wavelength bands. In fact, the combination of a grating structure and prisms is able to achieve concentration performance at
Figure 8. Simulation results show effective solar splitting as well as high concentration up to 798× forVIS wavelength band and 755 factor for IR wavelength band on the focal plane, f = 100 mm, givenby an external Fresnel lens. Simulation results based on the following DOS parameters: a diffractiongrating with the groove density of dg = 12 grooves/mm, the 1-mm height of each compound prismmodule. The first layer of Littrow prism has an apex angle of ϕ = 30◦ and is made of a low dispersionmaterial BK7 (n = 1.52, VD = 64.17), while the second layer is a triangular prism with a correspondingapex angle of ϕ = 19◦ and made of a high dispersion material F2 (n = 1.62, VD = 36.37).
An additional comparative study has been also conducted to determine the concentrationperformances for an ordinary system comprising of only a single Fresnel lens with an identical focallength (f = 100 mm) without the DOS array, presented in a supplement document. First, an input lightsource was set to be incident onto the only Fresnel lens using only wavelengths in VIS range (0.4 µm ≤λ < 1.2 µm) and a following study was conducted with only wavelengths in the IR range (1.2 µm ≤λ ≤ 2.5 µm). The ray tracing results estimated concentration factors of just 38× and 65× for VIS andIR ranges respectively, validating the poor concentration performances due to chromatic aberrationscaused by using the only Fresnel lens. Clearly, by additionally placing the DOS array composed of adiffraction grating and dispersive prisms below the lens, we can realize much higher concentrations of798× and 755× for both VIS and IR respectively, as much as 21.0 folds (VIS band) and 11.6 folds (IRband) higher than what are achieved in ordinary systems with a single Fresnel lens.
5. Conclusions
We present a novel dispersive optical system (DOS) that enables highly-concentrated spectralsplitting to effectively harvest solar energy over the entire AM1.5 spectrum. By separating sunlightinto two wavelength bands, VIS and IR, the concept of the DOS can help widen the usage of the wholesunlight spectrum, for photovoltaic conversion of solar cells, while at the same time harvesting energyfrom the rest of the sunlight spectrum for other thermal applications. A reasonably low reflection losscaused by the optical components in the DOS is estimated with only an additional loss about 2.7% byusing a Rayleigh’s film as compared to regular single concentrating lens solar applications.
By attaching to an external Fresnel lens (f = 100 mm), the DOS system used a grating structure(dg = 12 grooves/mm), followed by a layer of 30◦/60◦/90◦ Littrow prisms of the same material,which served as a blazed surface to focus light from the 0th and 1st diffraction orders close together
Energies 2019, 12, 4719 15 of 18
with minimum reflection losses. Thereafter, another layer of high-dispersion prisms with an apexangle of ϕ = 19◦ is recommended to minimize comatic aberration and the Petzval field curvaturethrough refraction, and achieve high but similar concentrations for both VIS and IR wavelengthbands. In fact, the combination of a grating structure and prisms is able to achieve concentrationperformance at least 20-fold (VIS band) and 11-fold (IR band) higher than regular concentrated solarapplications that typically make use of a single concentrating lens. In addition, the materials usedfor the arrayed compound prisms should have a large difference in their Abbe numbers with therecommended selection to be BK7 for Littrow prisms and F2 for the second layer of triangular prisms.These chosen parameters are able to achieve very high solar concentration factor of 798× and 755×for both VIS and IR wavelength bands. The optical components in the DOS are designed based ontheir commercial availability to propose a low-cost optical system, and can be conveniently scalablein size. Upon successful implementation, the DOS has the potential to harvest solar energy underhigh concentrations over the entire AM1.5 spectrum with c-Si solar cells converting 0.4 µm ≤ λ <
1.2 µm of light into electricity, while the rest of the solar radiation (1.2 µm ≤ λ ≤ 2.5 µm) can beconverted into useful energy for a wide variety of thermal applications such as water heating andthermoelectricity. This system can be economically viable, sustainable and practical for both industrialand domestic usage.
Supplementary Materials: The following are available online at http://www.mdpi.com/1996-1073/12/24/4719/s1,Figure S1: ZEMAX simulations of the beam pathways illustrated in Figure 3 for an improved solar performance,Figure S2: ZEMAX simulations on the conceptual demonstrations of the shift in Petzval curvature presented inFigure 5, Figure S3: ZEMAX simulations of only a Fresnel lens with f = 100 mm.
Author Contributions: S.K.T. worked on performance analysis and simulation-based concept demonstration.S.-Y.P. guided study concept and revised the manuscript.
Funding: This work is gratefully supported by the start-up funding from the San Diego State University, USAand the research grants from the Ministry of Education (R-265-000-588-114, R-265-000-597-112), Singapore.
Conflicts of Interest: The authors declare no conflict of interest.
References
1. Gueymard, C.; Myers, D.; Emery, K. Proposed reference irradiance spectra for solar energy systems testing.Sol. Energy 2002, 73, 443–467. [CrossRef]
2. Gueymard, C.A. The sun’s total and spectral irradiance for solar energy applications and solar radiationmodels. Sol. Energy 2004, 76, 423–453. [CrossRef]
3. Schmidt-Mende, L.; Fechtenkötter, A.; Müllen, K.; Moons, E.; Friend, R.H.; MacKenzie, J.D. Self-organizeddiscotic liquid crystals for high-efficiency organic photovoltaics. Science 2001, 293, 1119–1122. [CrossRef][PubMed]
4. Baran, D.; Ashraf, R.S.; Hanifi, D.A.; Abdelsamie, M.; Gasparini, N.; Röhr, J.A.; Holliday, S.; Wadsworth, A.;Lockett, S.; Neophytou, M.; et al. Reducing the efficiency–stability–cost gap of organic photovoltaics withhighly efficient and stable small molecule acceptor ternary solar cells. Nat. Mater. 2016, 16, 363. [CrossRef][PubMed]
5. Cheng, J.; Park, S.-Y.; Chen, C.-L. Optofluidic solar concentrators using electrowetting tracking: Concept,design, and characterization. Sol. Energy 2013, 89, 152–167. [CrossRef]
6. Pasamontes, M.; Álvarez, J.; Guzman, J.; Berenguel, M.; Camacho, E. Hybrid modeling of a solar-thermalheating facility. Sol. Energy 2013, 97, 577–590. [CrossRef]
7. Maurer, C.; Baumann, T.; Hermann, M.; Di Lauro, P.; Pavan, S.; Michel, L.; Kuhn, T.E. Heating andcooling in high-rise buildings using facade-integrated transparent solar thermal collector systems. J. Build.Perform. Simul. 2013, 6, 449–457. [CrossRef]
8. Barlev, D.; Vidu, R.; Stroeve, P. Innovation in concentrated solar power. Sol. Energy Mater. Sol. Cells 2011, 95,2703–2725. [CrossRef]
9. Slocum, A.H.; Codd, D.S.; Buongiorno, J.; Forsberg, C.; McKrell, T.; Nave, J.-C.; Papanicolas, C.N.; Ghobeity, A.;Noone, C.J.; Passerini, S. Concentrated solar power on demand. Sol. Energy 2011, 85, 1519–1529. [CrossRef]
Energies 2019, 12, 4719 16 of 18
10. Guerrero-Lemus, R.; Martínez-Duart, J.M. Concentrated solar power. In Renewable Energies and CO2; Springer:Berlin/Heidelberg, Germany, 2013; pp. 135–151.
11. Vignarooban, K.; Xu, X.; Arvay, A.; Hsu, K.; Kannan, A. Heat transfer fluids for concentrating solar powersystems—A review. Appl. Energy 2015, 146, 383–396. [CrossRef]
12. Narasimhan, V.; Jiang, D.; Park, S.-Y. Design and optical analyses of an arrayed microfluidic tunable prismpanel for enhancing solar energy collection. Appl. Energy 2016, 162, 450–459. [CrossRef]
13. Pearson, G. Conversion of solar to electrical energy. Am. J. Phys. 1957, 25, 591–598. [CrossRef]14. Dirnberger, D.; Blackburn, G.; Müller, B.; Reise, C. On the impact of solar spectral irradiance on the yield of
different pv technologies. Sol. Energy Mater. Sol. Cells 2015, 132, 431–442. [CrossRef]15. Santbergen, R.; van Zolingen, R.C. The absorption factor of crystalline silicon pv cells: A numerical and
experimental study. Sol. Energy Mater. Sol. Cells 2008, 92, 432–444. [CrossRef]16. Treble, F. Milestones in the development of crystalline silicon solar cells. Renew. Energy 1998, 15, 473–478.
[CrossRef]17. Ba, B.; Kane, M. Spectral response of a polycrystalline silicon solar cell. NASA STI/Recon Tech. Rep. N 1994,
95, 1–12.18. Mickelsen, R.A.; Chen, W.S.; Hsiao, Y.R.; Lowe, V.E. Polycrystalline thin-film cuinse 2/cdzns solar cells.
IEEE Trans. Electron Devices 1984, 31, 542–546. [CrossRef]19. Roman, J.M. State-of-the-art of iii-v solar cell fabrication technologies, device designs and applications.
Adv. Photovolt. Cell Des. 2004, 4, 1–8.20. Karp, J.H.; Ford, J.E. Multiband Solar Concentrator Using Transmissive Dichroic Beamsplitting.
In Proceedings of the SPIE—The International Society for Optical Engineering, San Diego, CA, USA,11–12 August 2008; p. 7043. [CrossRef]
21. Shockley, W.; Queisser, H.J. Detailed balance limit of efficiency of p-n junction solar cells. J. Appl. Phys. 1961,32, 510. [CrossRef]
22. Fraas, L.M.; Avery, J.E.; Martin, J.; Sundaram, V.S.; Girard, G.; Dinh, V.T.; Davenport, T.M.; Yerkes, J.;O’neil, M. Over 35-percent efficient gaas/gasb tandem solar cells. IEEE Trans. Electron Devices 1990, 37,443–449. [CrossRef]
23. Luque, A.; Hegedus, S. Handbook of Photovoltaic Science and Engineering; John Wiley & Sons: Hoboken, NJ,USA, 2010.
24. Imenes, A.; Mills, D. Spectral beam splitting technology for increased conversion efficiency in solarconcentrating systems: A review. Sol. Energy Mater. Sol. Cells 2004, 84, 19–69. [CrossRef]
25. Barnett, A.; Kirkpatrick, D.; Honsberg, C.; Moore, D.; Wanlass, M.; Emery, K.; Schwartz, R.; Carlson, D.;Bowden, S.; Aiken, D.; et al. Very high efficiency solar cell modules. Prog. Photovolt. Res. Appl. 2009, 17,75–83. [CrossRef]
26. Mojiri, A.; Taylor, R.; Thomsen, E.; Rosengarten, G. Spectral beam splitting for efficient conversion of solarenergy—A review. Renew. Sustain. Energy Rev. 2013, 28, 654–663. [CrossRef]
27. Stefancich, M.; Zayan, A.; Chiesa, M.; Rampino, S.; Roncati, D.; Kimerling, L.; Michel, J. Single elementspectral splitting solar concentrator for multiple cells cpv system. Opt. Express 2012, 20, 9004–9018. [CrossRef][PubMed]
28. Arimochi, M.; Watanabe, T.; Yoshida, H.; Tange, T.; Nomachi, I.; Ikeda, M.; Dai, P.; He, W.; Ji, L.; Lu, S.Iii–v compound semiconductor multi-junction solar cells fabricated by room-temperature wafer-bondingtechnique. Jpn. J. Appl. Phys. 2015, 54, 056601. [CrossRef]
29. Otanicar, T.P.; Chowdhury, I.; Prasher, R.; Phelan, P.E. Band-gap tuned direct absorption for a hybridconcentrating solar photovoltaic/thermal system. J. Sol. Energy Eng. 2011, 133, 041014. [CrossRef]
30. Zhao, J.; Luo, Z.; Zhang, Y.; Shou, C.; Ni, M. Optimal design and performance analysis of a low concentratingphotovoltaic/thermal system using the direct absorption collection concept. In Proceedings of the 2010Asia-Pacific Power and Energy Engineering Conference (APPEEC), Chengdu, China, 28–31 March 2010;IEEE: Piscataway, NJ, USA, 2010; pp. 1–6.
31. Crisostomo, F.; Becker, J.; Mesgari, S.; Hjerrild, N.; Taylor, R.A. Desing and on-sun testing of a hybrid pvtprototype using a nanofluid-based selective absorption filter. In Proceedings of the 2015 12th InternationalConference on the European Energy Market (EEM), Lisbon, Portugal, 19–22 May 2015; IEEE: Piscataway, NJ,USA, 2015; pp. 1–5.
Energies 2019, 12, 4719 17 of 18
32. Looser, R.; Vivar, M.; Everett, V. Spectral characterisation and long-term performance analysis of variouscommercial heat transfer fluids (htf) as direct-absorption filters for cpv-t beam-splitting applications.Appl. Energy 2014, 113, 1496–1511. [CrossRef]
33. Taylor, R.A.; Otanicar, T.; Rosengarten, G. Nanofluid-based optical filter optimization for pv/t systems.Light Sci. Appl. 2012, 1, e34. [CrossRef]
34. Sabry, M.; Gottschalg, R.; Betts, T.R.; Shaltout, M.; Hassan, A.; El-Nicklawy, M.; Infield, D. Optical filteringof solar radiation to increase performance of concentrator systems. In Proceedings of the 2002 ConferenceRecord of the Twenty-Ninth IEEE Photovoltaic Specialists Conference, New Orleans, LA, USA, 19–24 May2002; IEEE: Piscataway, NJ, USA, 2003; pp. 1588–1591.
35. Jiang, S.-L.; Hu, P.; Mo, S.-P.; Chen, Z.-S. Modeling for two-stage dish concentrating spectral beam splittingphotovoltaic/thermal system. In Proceedings of the 2009 Asia-Pacific Power and Energy EngineeringConference, Wuhan, China, 27–31 March 2009; IEEE: Piscataway, NJ, USA, 2009; pp. 1–4.
36. Crisostomo, F.; Taylor, R.A.; Zhang, T.; Perez-Wurfl, I.; Rosengarten, G.; Everett, V.; Hawkes, E.R. Experimentaltesting of sinx/sio2 thin film filters for a concentrating solar hybrid pv/t collector. Renew. Energy 2014, 72,79–87. [CrossRef]
37. Segal, A.; Epstein, M.; Yogev, A. Hybrid concentrated photovoltaic and thermal power conversion at differentspectral bands. Sol. Energy 2004, 76, 591–601. [CrossRef]
38. Imenes, A.G.; Buie, D.; Mills, D.R.; Schramek, P.; Bosi, S.G. A new strategy for improved spectral performancein solar power plants. Sol. Energy 2006, 80, 1263–1269. [CrossRef]
39. Imenes, A.; Buie, D.; McKenzie, D. The design of broadband, wide-angle interference filters for solarconcentrating systems. Sol. Energy Mater. Sol. Cells 2006, 90, 1579–1606. [CrossRef]
40. Imenes, A.; Mills, D. Electricity replacement benefits of various receiver combinations in a multi tower solararray distributed chp plant. In Proceedings of the ISES Solar World Congress—Solar Energy for a SustainableFuture, Gothenburg, Sweden, 14–19 June 2003.
41. Yogev, A.; Krupkin, V.; Epstein, M. Solar Energy Plant; Google Patents: Washington, DC, USA, 1996.42. Zamfirescu, C.; Dincer, I. Assessment of a new integrated solar energy system for hydrogen production.
Sol. Energy 2014, 107, 700–713. [CrossRef]43. Ju, X.; Xu, C.; Han, X.; Du, X.; Wei, G.; Yang, Y. A review of the concentrated photovoltaic/thermal (cpvt)
hybrid solar systems based on the spectral beam splitting technology. Appl. Energy 2017, 187, 534–563.[CrossRef]
44. Hagen, N.; Tkaczyk, T.S. Compound prism design principles, i. Appl. Opt. 2011, 50, 4998–5011. [CrossRef]45. Duarte, F. Tunable laser optics: Applications to optics and quantum optics. Prog. Quantum Electron. 2013, 37,
326–347. [CrossRef]46. Gouvêa, E.C.; Sobrinho, P.M.; Souza, T.M. Spectral response of polycrystalline silicon photovoltaic cells
under real-use conditions. Energies 2017, 10, 1178. [CrossRef]47. Gaylord, T.K.; Moharam, M. Analysis and applications of optical diffraction by gratings. Proc. IEEE 1985, 73,
894–937. [CrossRef]48. Hecht, E. Optics, 5th ed.; Pearson Education, Incorporated: San Francisco, CA, USA, 2016.49. Languy, F. Achromatization of Nonimaging Fresnel Lenses for Photovoltaic Solar Concentration Using Refractive and
Diffractive Patterns; Université de Liège: Liège, Belgique, 2012.50. Riedl, M.J. Optical Design Fundamentals for Infrared Systems; SPIE Press: Bellingham, WA, USA, 2001;
Volume 48.51. Russo, J.M.; Zhang, D.; Gordon, M.; Vorndran, S.D.; Wu, Y.; Kostuk, R.K. Grating-Over-Lens Concentrating
Photovoltaic Spectrum Splitting Systems with Volume Holographic Optical Elements. In Proceedings of theSPIE—The International Society for Optical Engineering, San Diego, CA, USA, 27 August 2013; p. 882106.
52. Katz, M.G.; Schaps, D.M.; Shnider, S. Almost equal: The method of adequality from diophantus to fermatand beyond. Perspect. Sci. 2013, 21, 283–324. [CrossRef]
53. Remillard, J.; Everson, M.; Weber, W. Loss mechanisms in optical light pipes. Appl. Opt. 1992, 31, 7232–7241.[CrossRef] [PubMed]

Energies 2019, 12, 4719 18 of 18
54. Rubin, M. Optical properties of soda lime silica glasses. Sol. Energy Mater. 1985, 12, 275–288. [CrossRef]55. Garboushian, V.; Yoon, S.; Turner, G.; Gunn, A.; Fair, D. A novel high-concentration pv technology for
cost competitive utility bulk power generation. In Proceedings of the 1994 IEEE 1st World Conference onPhotovoltaic Energy Conversion—WCPEC (A Joint Conference of PVSC, PVSEC and PSEC), Waikoloa, HI,USA, 5–9 December 1994; IEEE: Piscataway, NJ, USA, 2002; pp. 1060–1063.
© 2019 by the authors. Licensee MDPI, Basel, Switzerland. This article is an open accessarticle distributed under the terms and conditions of the Creative Commons Attribution(CC BY) license (http://creativecommons.org/licenses/by/4.0/).