Embed Size (px)
Citation preview
Disparity in the Criminal Justice SystemPresented by the Commission on Racial and Ethnic Disparity in the Criminal Justice SystemAugust 20, 2010
2
Background on the Commission
Created by the CT state legislature in 2000 (P.A. 00-154)
Purpose of the Act:
“To establish a commission dedicated to eliminating racial and ethnic disparity in the criminal justice system.”
3
Background on the Commission
The Commission’s many responsibilities are set forth in state law (C.G.S. section 51-10c)
The far-reaching charge requires the Commission to examine every aspect of the criminal and juvenile justice systems
4
Background on the Commission
Commission is chaired by Appellate Court Judge Lubbie Harper, Jr.
Consists of 20 members Meets every other month Meetings are held in Hartford and are
open to the public
5
Background on the Commission
Commission’s website can be accessed from the state homepage
http://www.ct.gov/redcjs/site/default.asp Meeting notices and agendas are also
posted on the Judicial Branch website (www.jud.ct.gov) under Committees and Commissions
6
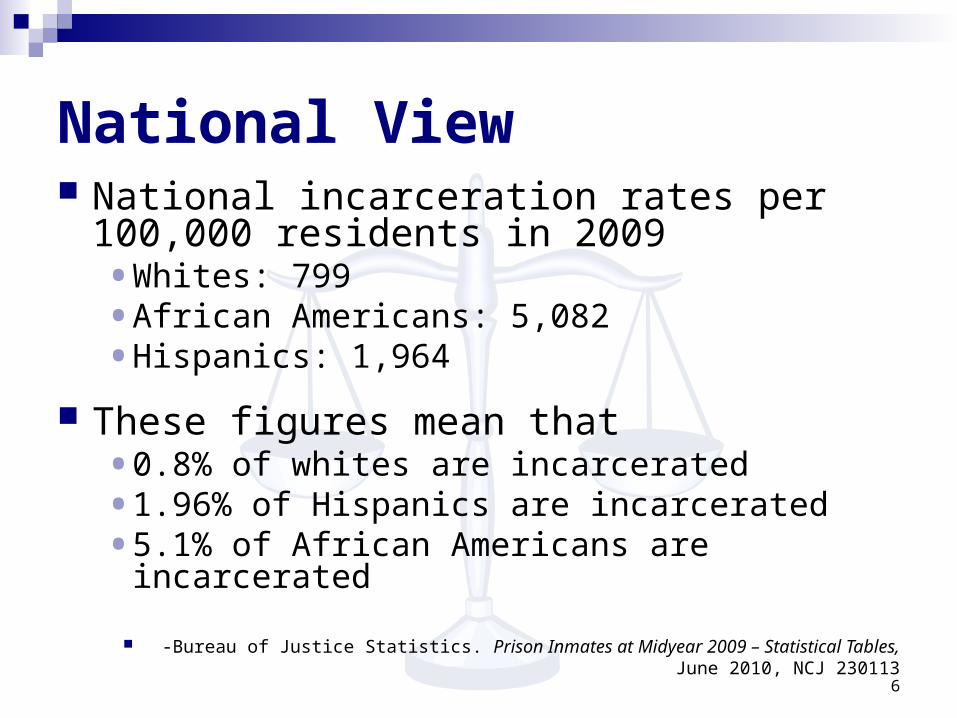
National View National incarceration rates per 100,000
residents in 2009• Whites: 799• African Americans: 5,082 • Hispanics: 1,964
These figures mean that• 0.8% of whites are incarcerated• 1.96% of Hispanics are incarcerated• 5.1% of African Americans are incarcerated
-Bureau of Justice Statistics. Prison Inmates at Midyear 2009 – Statistical Tables,June 2010, NCJ 230113
7
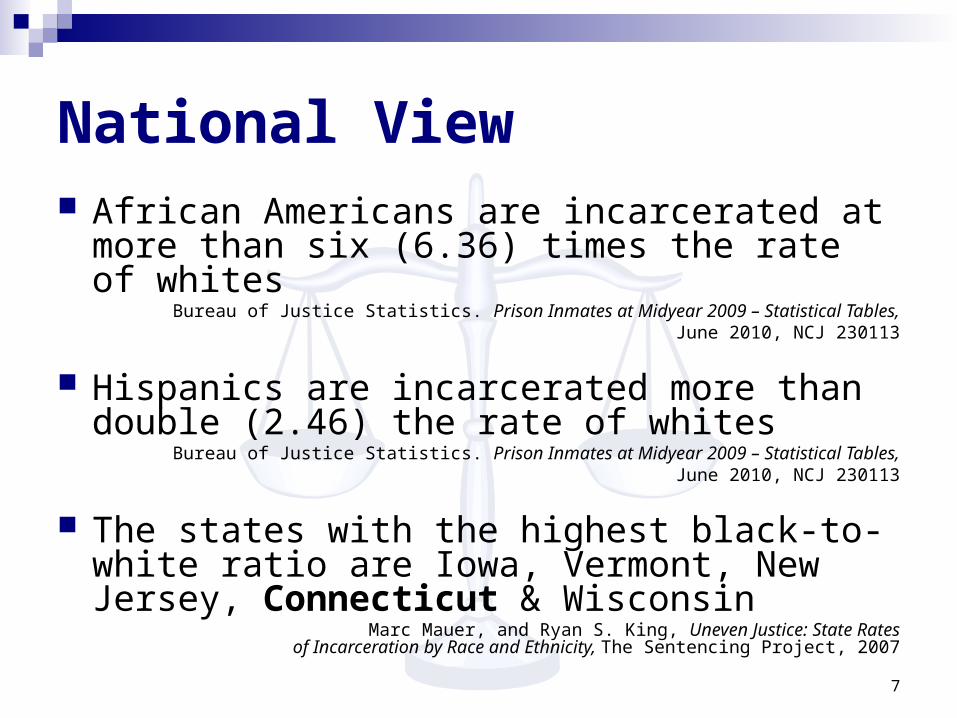
National View African Americans are incarcerated at more than
six (6.36) times the rate of whitesBureau of Justice Statistics. Prison Inmates at Midyear 2009 – Statistical Tables,
June 2010, NCJ 230113
Hispanics are incarcerated more than double (2.46) the rate of whites
Bureau of Justice Statistics. Prison Inmates at Midyear 2009 – Statistical Tables,June 2010, NCJ 230113
The states with the highest black-to-white ratio are Iowa, Vermont, New Jersey, Connecticut & Wisconsin
Marc Mauer, and Ryan S. King, Uneven Justice: State Rates of Incarceration by Race and Ethnicity, The Sentencing Project, 2007
8
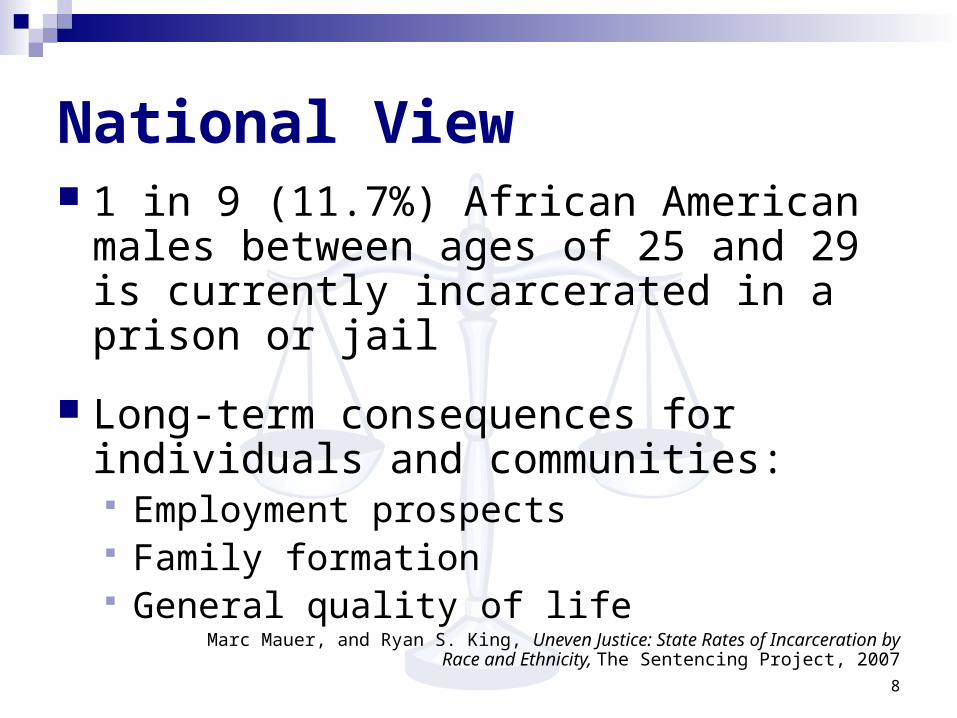
National View 1 in 9 (11.7%) African American males
between ages of 25 and 29 is currently incarcerated in a prison or jail
Long-term consequences for individuals and communities: Employment prospects Family formation General quality of life
Marc Mauer, and Ryan S. King, Uneven Justice: State Rates of Incarceration by Race and Ethnicity, The Sentencing Project, 2007
9
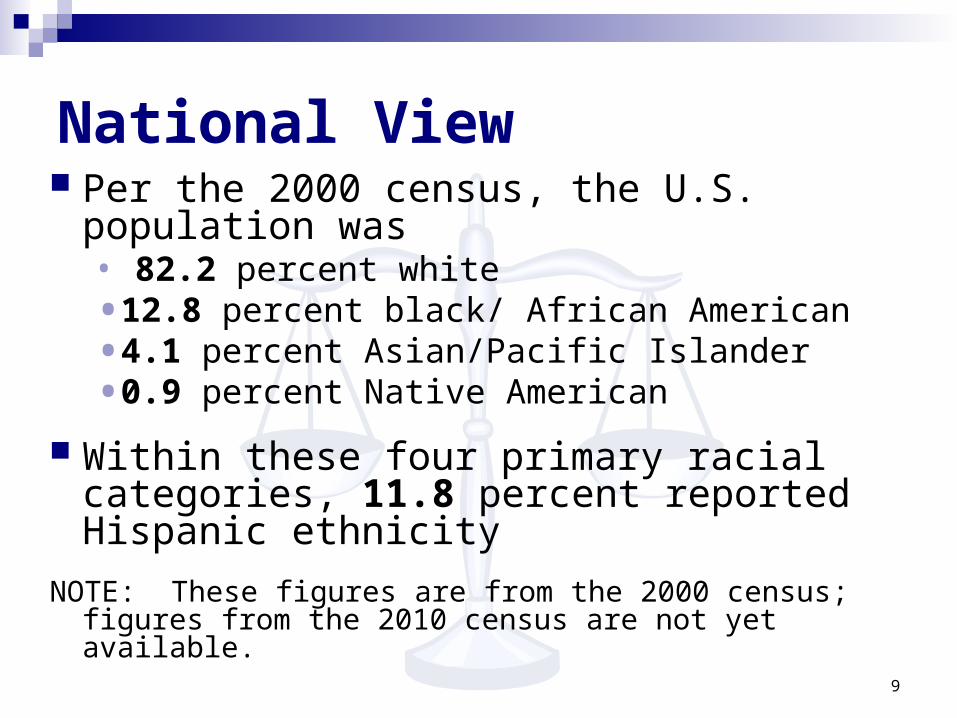
National View Per the 2000 census, the U.S. population
was• 82.2 percent white• 12.8 percent black/ African American• 4.1 percent Asian/Pacific Islander• 0.9 percent Native American
Within these four primary racial categories, 11.8 percent reported Hispanic ethnicity
NOTE: These figures are from the 2000 census; figures from the 2010 census are not yet available.
10
Connecticut View
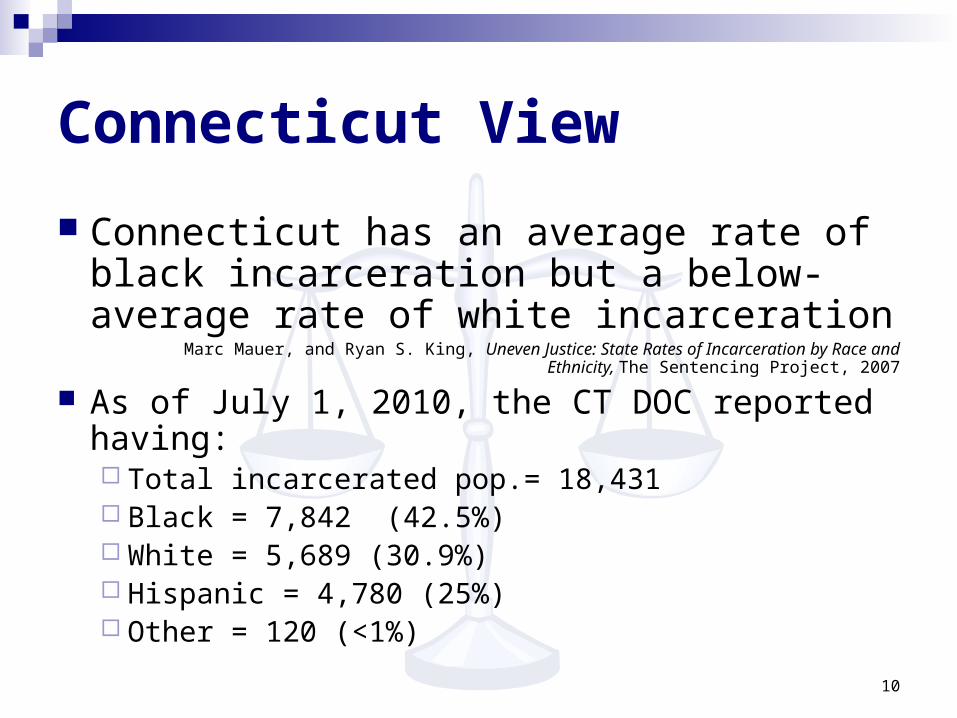
Connecticut has an average rate of black incarceration but a below-average rate of white incarceration
Marc Mauer, and Ryan S. King, Uneven Justice: State Rates of Incarceration by Race and Ethnicity, The Sentencing Project, 2007
As of July 1, 2010, the CT DOC reported having: Total incarcerated pop.= 18,431 Black = 7,842 (42.5%) White = 5,689 (30.9%) Hispanic = 4,780 (25%) Other = 120 (<1%)
11
Definition of Race and Ethnicity
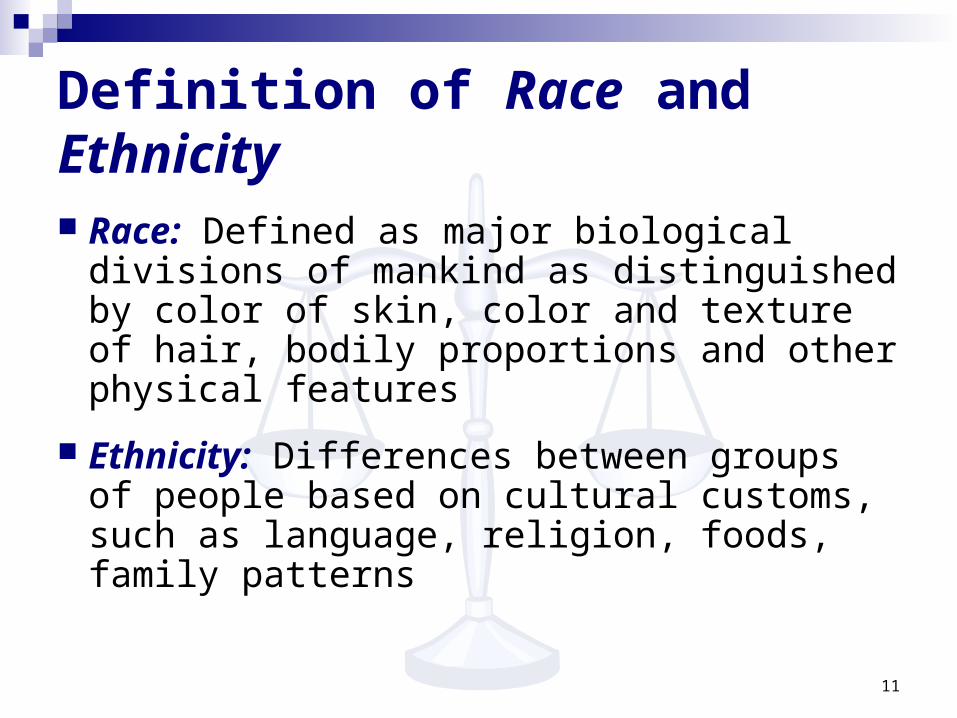
Race: Defined as major biological divisions of mankind as distinguished by color of skin, color and texture of hair, bodily proportions and other physical features
Ethnicity: Differences between groups of people based on cultural customs, such as language, religion, foods, family patterns

12
Disparity vs. Discrimination
Disparity refers to a difference but one that does not necessarily involve discrimination
Discrimination is a difference based on differential treatment of groups without reference to an individual’s behavior or qualifications

13
Types of Discrimination
Systematic discrimination - discrimination occurs at all stages of the criminal justice system, in all places, and at all times
Institutionalized discrimination - disparities in outcomes result from established (institutionalized) policies
Contextual discrimination - discrimination in certain situations or contexts
Individual acts of discrimination - carried out by particular justice officials

14
Why so much Disparity in CT’s Criminal Justice System?
Some important factors that contribute to disparity in Connecticut are:
1. Economic Inequality
2. Residential Segregation
3. War on Drugs
4. Urban vs. Suburban Contact with the Criminal Justice System
5. Pretrial Release Decisions

15
Economic Inequality
Nature and extent of inequality in the U.S.: A large gap between rich and poor, without
regard to race or ethnicity
A large economic gap between white Americans and racial minorities
The growth of the very poor—a group some analysts call an underclass—over the past 30 years
16
Economic Inequality
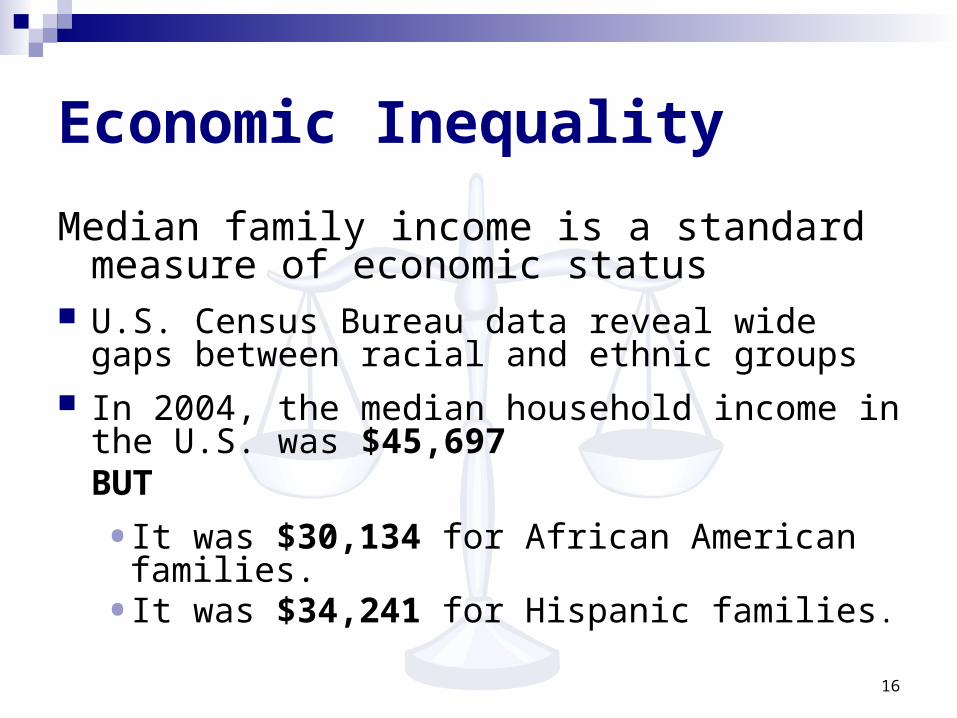
Median family income is a standard measure of economic status
U.S. Census Bureau data reveal wide gaps between racial and ethnic groups
In 2004, the median household income in the U.S. was $45,697BUT
• It was $30,134 for African American families.• It was $34,241 for Hispanic families.
17
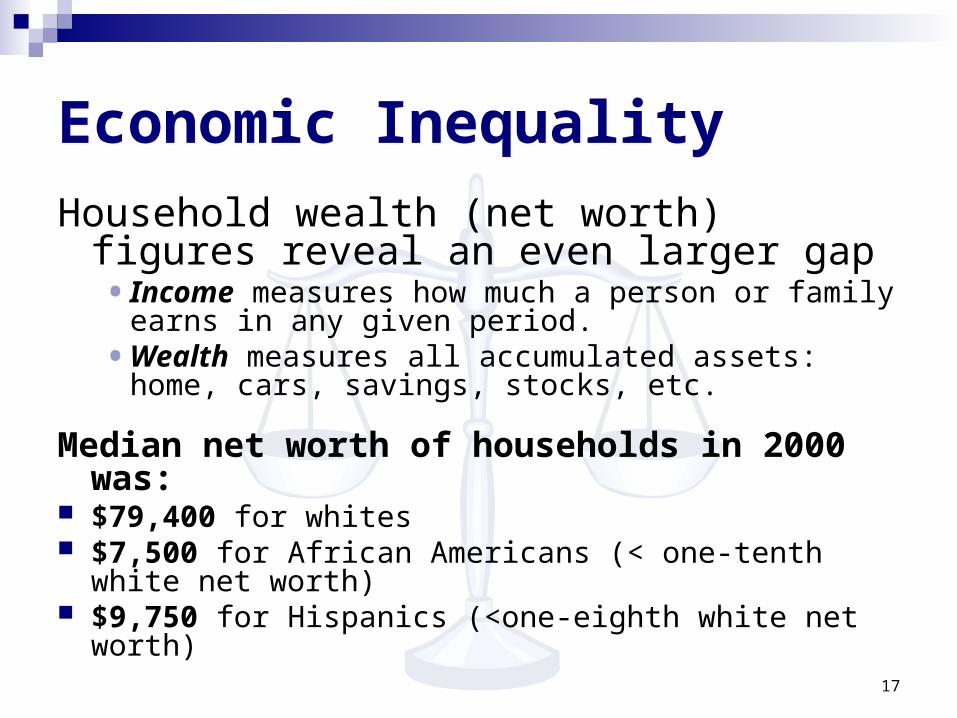
Economic Inequality
Household wealth (net worth) figures reveal an even larger gap• Income measures how much a person or family
earns in any given period.• Wealth measures all accumulated assets: home,
cars, savings, stocks, etc.
Median net worth of households in 2000 was: $79,400 for whites $7,500 for African Americans (< one-tenth white net
worth) $9,750 for Hispanics (<one-eighth white net worth)
18
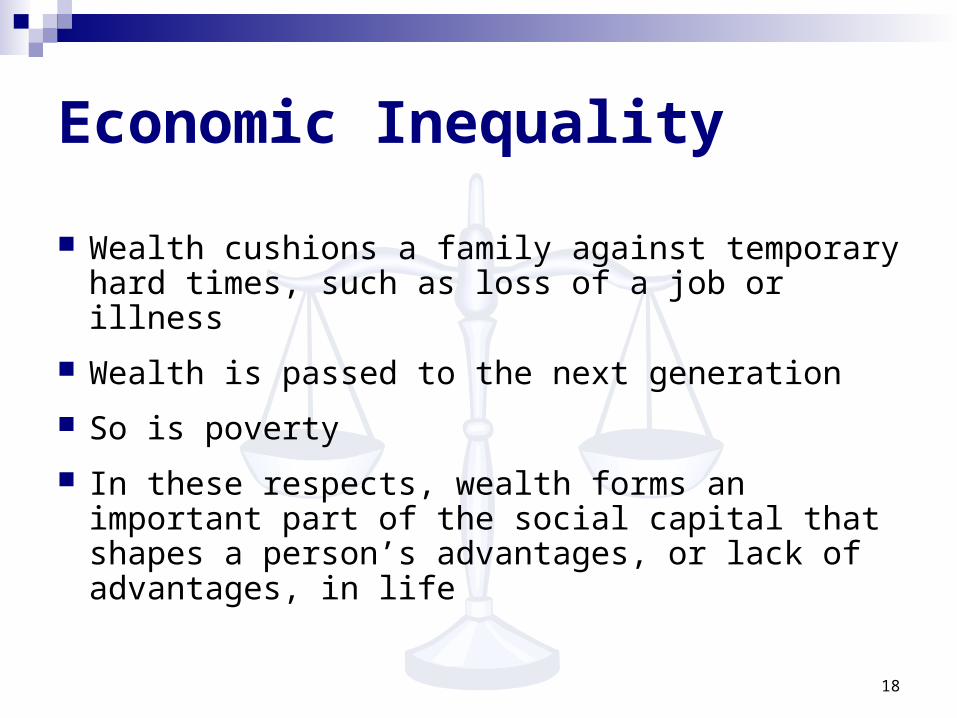
Economic Inequality
Wealth cushions a family against temporary hard times, such as loss of a job or illness
Wealth is passed to the next generation
So is poverty
In these respects, wealth forms an important part of the social capital that shapes a person’s advantages, or lack of advantages, in life
19
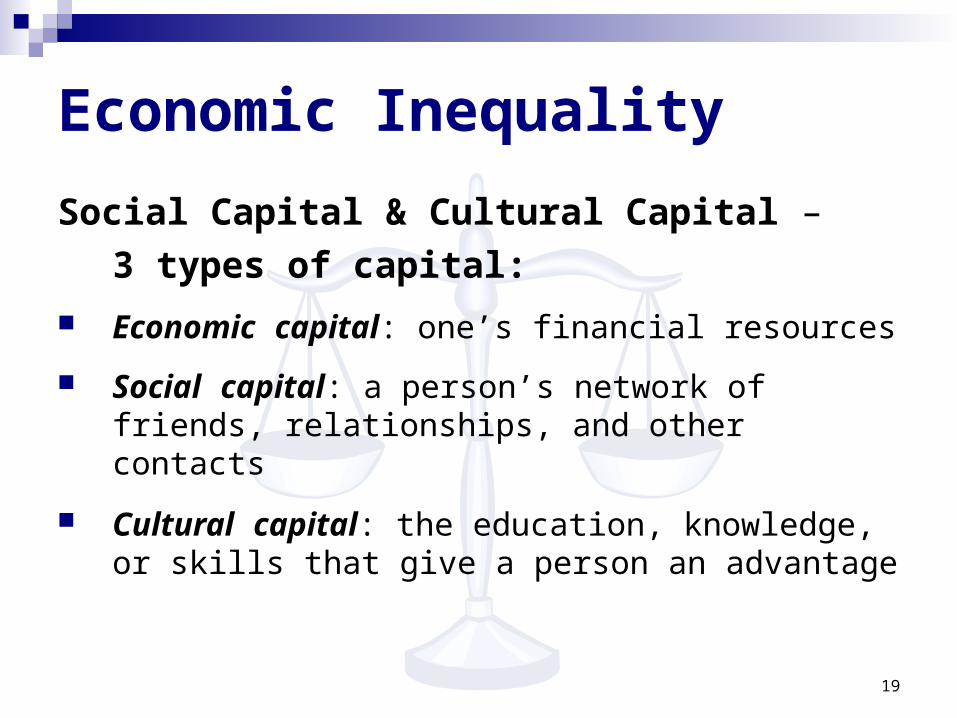
Economic Inequality
Social Capital & Cultural Capital –
3 types of capital:
Economic capital: one’s financial resources
Social capital: a person’s network of friends, relationships, and other contacts
Cultural capital: the education, knowledge, or skills that give a person an advantage
20
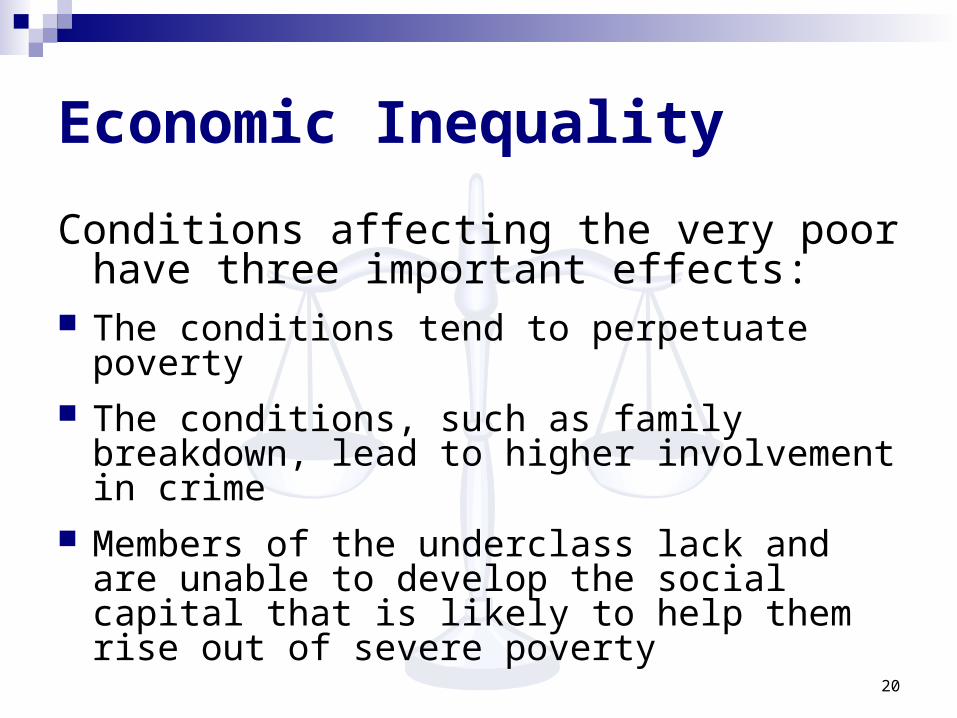
Economic Inequality
Conditions affecting the very poor have three important effects:
The conditions tend to perpetuate poverty The conditions, such as family breakdown, lead
to higher involvement in crime Members of the underclass lack and are unable
to develop the social capital that is likely to help them rise out of severe poverty
21
Residential Segregation
2 significant consequences of concentrating offenders in certain areas:
Law-abiding residents of those areas suffer high rates of predatory crimes
Individuals living in those areas have an increased propensity to engage in criminal activity
22
Residential Segregation
Connecticut’s metropolitan communities are characterized by residential segregation
Residential segregation has a direct impact on crime because it concentrates high-rate offenders in one area
23
Residential Segregation
Teenagers in these areas are subject to disproportionate contact with people involved in criminal activity, and comparatively less contact with law-abiding peers
The sheer weight of this peer influence can overwhelm positive parental influence and, in the worst situations, coerces teens into joining crime-involved gangs
24
Residential SegregationImpact of Crime on Neighborhoods: Direct economic loss and physical harm to
residents Damaged quality of life Out-flight by employed and law-abiding residents Intensified concentration of unemployed and
high-rate offenders Damage to businesses
25
The War on Drugs
The War on Drugs began in the 1980s
It is has been a major contributing factor to the historic rise in the prison population during this period
From a figure of about 40,000 people incarcerated in prison or jail for a drug offense in 1980, there has since been an 1100% increase -to a total of 500,000 today
The Changing Dynamics of the War on Drugs, Mark Mauer,The Sentencing Project, April 2009
26
The War on Drugs
Increase in incarceration for drug offenses fueled by:
• Sharply escalated law enforcement targeting drug law violations
• Enhanced penalties for drug offenses, including mandatory minimums
The Changing Dynamics of the War on Drugs, Mark Mauer,
The Sentencing Project, April 2009
27
The War on Drugs The dramatic escalation of incarceration for drug
offenses has been accompanied by profound racial/ethnic disparities
There is ample evidence that the War on Drugs is being fought primarily in African American and Hispanic communities
Overall, two-thirds of persons incarcerated for a drug offense in state prison are African American or Latino• These figures are far out of proportion to the degree
that these groups use or sell drugs
28
The War on Drugs Arrest records consistently reflect that African
Americans and Hispanics experience higher arrest rates than do whites for drug offenses
These data are inconsistent with national drug use data showing whites are more likely than either African Americans or Hispanics to report using drugs
29
The War on Drugs
Research demonstrates that much of this disparity is fueled by disparate law enforcement practices
Crime in low-income communities of color tends to be street crime
Street crime is an easy target Substance abuse in communities with
substantial resources is more likely to be addressed as a family or public health problem
30
The War on Drugs
The tide may be beginning to turn Insignificant increase in number of people
incarcerated in state prisons for a drug offense from 1999-2005 (<1%)
Significant shift in racial composition of people incarcerated for a drug offense over the same period
31
The War on Drugs
0
20000
40000
60000
80000
100000
120000
140000
160000
1999 2001 2003 2005
White
Black
Hispanic
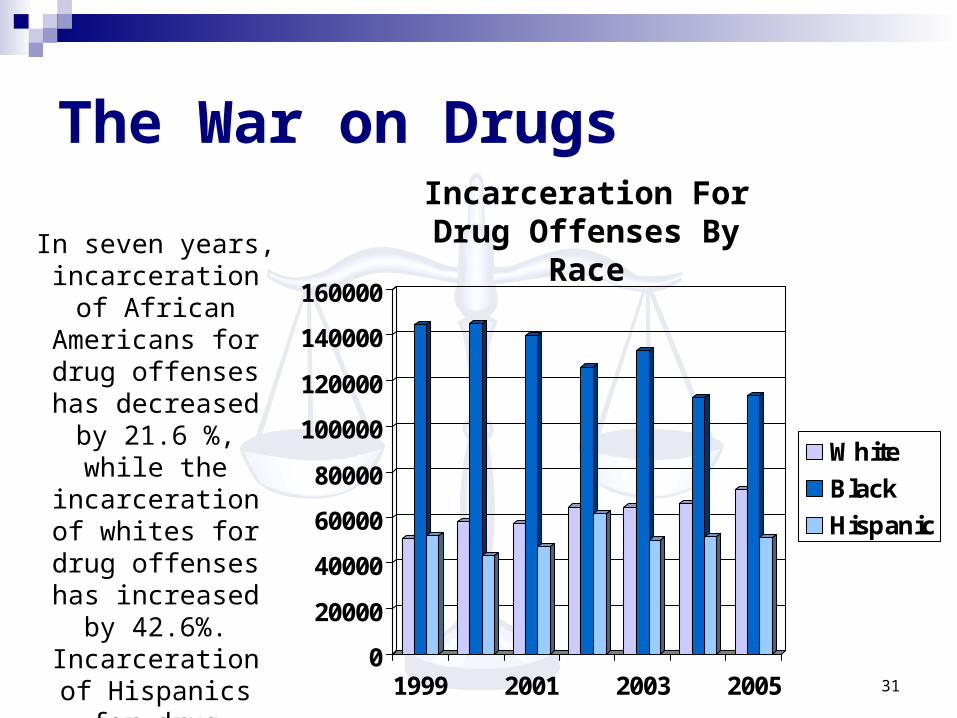
Incarceration For Drug Offenses By RaceIn seven years,
incarceration of African Americans for drug offenses has decreased by 21.6 %, while the incarceration of whites for drug offenses has
increased by 42.6%. Incarceration of
Hispanics for drug offenses has
decreased by 1.9 %.
32
Urban vs. Suburban Commission’s research showed that the most
important predictor of whether a defendant is incarcerated is not race or ethnicity, but criminal record
This has a disproportionate impact on the minority community because, as research has shown, its members have tended to accumulate more extensive criminal records than non-minorities
This is due to a variety of factors, including socio-economic conditions as well as the differences between urban and suburban police departments
33
Urban vs. Suburban
To begin to address these issues, in 2007 Commission members made a decision to focus on initiatives to prevent youth and young adults from entering the juvenile and criminal justice systems
34
Urban vs. SuburbanAlternatives to Arrest
Alternatives to arrest are available in a number of cities and towns for juveniles who are first-time offenders
However, they are not available for young adults – 17 and over – who are first-time offenders
Often the behavior that resulted in police intervention can be adequately addressed by community-based resources
35
Urban vs. Suburban
New Haven Pilot ProgramPurpose: To provide alternatives to arrest for
young adults who are stopped by the police for minor crimes• Still in the beginning planning phase• Decisions still need to be made about:
• What crimes will fall under the program• Who will fall under the program
• Funding commences April 2011
36
Pretrial ReleaseNational studies examining the effect of
race on bail decisions have yielded contradictory findings
Some researchers conclude that judges’ bail decisions are based seriousness of the offense & the defendant’s prior criminal record; race has no effect once these factors are taken into consideration
37
Pretrial Release
Other researchers contend that the defendant’s economic status, not race, determines the likelihood of pretrial release
A number of studies document direct racial discrimination in bail decisions
There also is evidence that defendant race interacts with other variables related to bail severity, such as prior records or employment status
38
Pretrial Release Pretrial Release decisions are very
important because they may have an influence on case outcomes
Bail decision making has been shown to have a “spillover” effect
• BJS study has shown that those detained before trial were disproportionately convicted
• Pretrial status was also shown to have affected the likelihood of incarceration upon conviction (versus a probationary or other non-jail sentence)
39
Pretrial Release
A 2003 study conducted for the Commission found the following:
Seriousness of charge (A felony, B felony, etc.) was the single most powerful predictor of bail commissioner involvement It was six times more powerful than the next
significant indicator, which was number of cases
40
Pretrial Release
However: Race/ethnicity was the third most powerful
predictor of bail commissioner involvement out of the six available predictors for analysis
Bail commissioners were more likely to see African Americans and Latino/Hispanic defendants, even when charge severity, number of cases, gender, age, and number of charges were held constant
41
Pretrial Release
And: When all charges (felonies and misdemeanors)
were considered, Caucasians were approximately twice as likely as African Americans or Latinos/Hispanics to be released with a written or conditional promise to appear
When severity of charge was considered, the difference was less apparent

42
Pretrial Release
And: While the severity of the most serious charge at
arrest was the most powerful predictor of a promise to appear
Multivariate analysis showed that race/ethnicity was also a statistically significant predictor It was the fifth strongest predictor of the eight
variables available for analysis of release decisions
43
Pretrial Release
The following steps were taken to address this issue:
In 2003 the Judicial Branch initiated a multi-year project to develop a more systematic and consistent bail determination process
3 significant outcomes of this project:1. 2003 Validation of the Case Data Record
2. 2005 Bail Decision Aid
3. 2008 Financial Bond Guideline
44
Pretrial Release
1. Validation of Case Data Record
• In 2003, based on a study by CCSU, the weighted release criteria used by Bail staff in making recommendations for release was modified• Some criteria were eliminated
• Some were weighted differently
45
Pretrial Release
The pilot of the revised weighted release criteria showed that Bail staff were more likely to order or recommend non-financial releases (66% vs. 52%) under the revised weighted release criteria
The revised weighted release criteria was implemented statewide in 2004
46
Pretrial Release
2. Bail Decision Aid
• In 2005 CCSU was engaged to review the pretrial release decision-making process and develop a system whereby more non-financial release recommendations would be made
• The project resulted in the creation of the Bail Decision Aid
47
Pretrial Release
The Bail Decision Aid assists bail staff in obtaining additional information in the following areas:• Personal Needs (substance use, education,
employment)
• Compliance Needs (support and structure, prior compliance)
• Safety Risk (prior record)
48
Pretrial Release
A Decision Aid Pilot study showed:
• Greater likelihood of recommending a non-financial condition of release (56% vs. 20%)
• Greater likelihood of recommending a condition (64% vs. 21%)
• Higher percentage of recommendations that matched the judges’ order (65% vs. 49%)
In 2005 the Bail Decision Aid was implemented statewide
49
Pretrial Release3. Guidelines for Financial Bond
Recommendation In 2008 over 50,000 financial bond records from
2006-2007 were analyzed• Based on analysis, a Financial Bond Guideline was
developed to guide bail staff• The Financial Bond Guideline considers the offense
characteristics, mitigating or aggravating case factors and client risk
In September 2009 the Financial Bond Guideline was implemented statewide
50
Implicit Bias
Numerous studies have shown that everyone has implicit biases
We all have preconceived notions, regardless of our background or skin color, that can play into decision-making
Awareness of these biases allows them to be addressed
51
Implicit BiasProf. Kang, an expert on Implicit Bias,
states, “We naturally assign people into various social categories divided by salient and chronically accessible traits such as age, gender, race and role … [this comes] from our experiences with other people, some of them direct (i.e., real-world encounters) but most of them are vicarious (i.e., relayed to us through stories, books, movies, media and culture).”
52
Implicit Bias
It is important for decision-makers to be aware that they have implicit biases
“Given the critical importance of exercising fairness and equality in the court system, lawyers, judges, jurors and staff should be particularly concerned about identifying such possibilities.” (Kang)
53
Looking Ahead
There are no problems we cannot solve together, and very few we can solve by ourselves.
Lyndon B. Johnson