Embed Size (px)
Citation preview
Disentangling Diverse Measures: A Survey of Financial Stress Indexes
Kevin L. Kliesen, Michael T. Owyang, and E. Katarina Vermann
The recent financial crisis helped emphasize the need for measures of financial conditions. In the wakeof the crisis, several researchers and institutions—both private sector and central bank—developedmeasures of financial stress. These measures are intended to capture, among other things, the liquidityin financial markets and potentially forecast changes in real economic conditions. Unfortunately, thereis no agreement about which variables should be included in a measure of stress. The authors survey anumber of financial stress indexes, comparing the datasets from which they are constructed. In principle,each of the indexes measures the same thing; thus, they should be highly correlated. The authors findthat in practice, however, the correlations are high but not as high as might be expected. They also eval-uate the ability of the indexes to predict future economic activity in a simple vector autoregressive fore-casting model. (JEL E44, E66)
Federal Reserve Bank of St. Louis Review, September/October 2012, 94(5), pp. 369-97.
E conomists recognize that adverse shocks to the financial sector can have significanteffects on the real economy. The chance that financial instability will lead to macroeco-nomic instability is often termed “systemic risk.” For example, in 2008, policymakers
learned that financial market turmoil resulting from the bankruptcy of Lehman Brothers andthe near-failure of American International Group (AIG) had far-reaching effects on the macro -economy through asset prices and other key financial market indicators.1
The recent financial crisis and subsequent recession provide another example of these effects.If financial crises could be predicted ahead of time, policymakers might have an opportunity tomitigate the damages—or perhaps avoid them altogether. Historically, though, policymakershave been unable to predict such crises, in part because they have lacked proper indicators offinancial instability.
One of the key “take-away” messages for policymakers from the 2007-08 experience is thatpredicting financial crises ex ante remains extraordinarily difficult. This task is perhaps mademore difficult because financial crises often take different forms and are triggered by qualita-tively different shocks.2
Kevin L. Kliesen and Michael T. Owyang are research officers and economists and E. Katarina Vermann is a research associate at the FederalReserve Bank of St. Louis. The authors thank Linpeng Zheng for research assistance.
© 2012, The Federal Reserve Bank of St. Louis. The views expressed in this article are those of the author(s) and do not necessarily reflect theviews of the Federal Reserve System, the Board of Governors, or the regional Federal Reserve Banks. Articles may be reprinted, reproduced,published, distributed, displayed, and transmitted in their entirety if copyright notice, author name(s), and full citation are included. Abstracts,synopses, and other derivative works may be made only with prior written permission of the Federal Reserve Bank of St. Louis.
Federal Reserve Bank of St. Louis REVIEW September/October 2012 369
In their efforts to address this shortcoming, economists have developed an array of statisticalindicators designed to measure financial instability (see the boxed insert). These indexes areoften termed “financial stress indexes” (FSIs) or “financial conditions indexes” (FCIs) depend-ing on the variables used to construct them. In reality, though, financial stress cannot be meas-ured like other economic indicators (e.g., gross domestic product [GDP] or employment),which count tangible objects such as workers, jobs, or the value of production. Instead, theseindexes measure latent conditions and are constructed from other economic and/or financialdata using sophisticated statistical techniques long in use by economists and statisticians.
Economic policymakers also have a vested interest in measuring financial instability. In theUnited States, measuring financial stress to help identify emerging systematic risks has beenenshrined in the Dodd-Frank Wall Street Reform and Consumer Protection Act of 2009. Amonga myriad of other provisions, this act established the Financial Stability Oversight Council (FSOC)and the Office of Financial Research (OFR). Since the FSOC consists of the heads of the nation’skey regulatory agencies (e.g., the Federal Reserve, the Federal Deposit Insurance Corporation,and the Securities and Exchange Commission), its mandate is to prevent financial stresses frompropagating into systemic threats, thereby negatively affecting economic growth and materialwelfare (Lo Duca and Peltonen, 2011). Together the FSOC and the OFR can be viewed as a keypart of the nation’s real-time early warning system for policymakers.
As intimated above, measuring financial conditions and identifying emerging threats tofinancial stability is difficult. Because no single consensus definition, let alone measure, of finan-cial stress exists, one goal of this paper is to describe how financial instability has been measuredin the literature. Admittedly, the literature is becoming increasingly populated with articles thatsurvey the available indicators and attempt to assess their reliability. These include papers byHatzius et al. (2010), Hollo et al. (2012), and Oet et al. (2011, the Federal Reserve Bank ofCleveland’s FSI [CFSI]). Although this paper is in the spirit of the preceding survey articles, weaim to provide a perspective that is more readily accessible to a nonacademic audience. Analyzing
Kliesen, Owyang, Vermann
370 September/October 2012 Federal Reserve Bank of St. Louis REVIEW
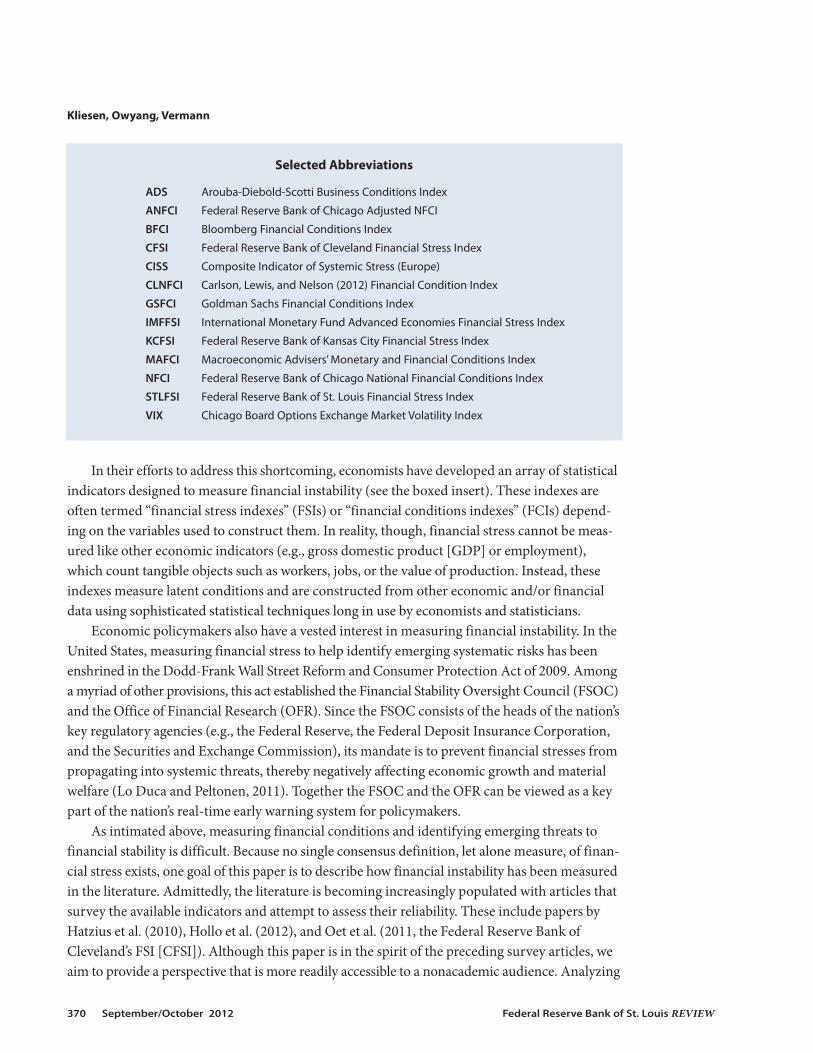
Selected Abbreviations
ADS Arouba-Diebold-Scotti Business Conditions Index
ANFCI Federal Reserve Bank of Chicago Adjusted NFCI
BFCI Bloomberg Financial Conditions Index
CFSI Federal Reserve Bank of Cleveland Financial Stress Index
CISS Composite Indicator of Systemic Stress (Europe)
CLNFCI Carlson, Lewis, and Nelson (2012) Financial Condition Index
GSFCI Goldman Sachs Financial Conditions Index
IMFFSI International Monetary Fund Advanced Economies Financial Stress Index
KCFSI Federal Reserve Bank of Kansas City Financial Stress Index
MAFCI Macroeconomic Advisers’ Monetary and Financial Conditions Index
NFCI Federal Reserve Bank of Chicago National Financial Conditions Index
STLFSI Federal Reserve Bank of St. Louis Financial Stress Index
VIX Chicago Board Options Exchange Market Volatility Index
the construction of various FSIs allows us to assess whether they are useful real-time indicatorsof the state of the economy.
We consider a number of U.S. and international financial indexes. A second goal of ourpaper is to empirically assess both the correlation of these indexes—for example, whether thereis significant co-movement across the indexes—and their predictive power. Regarding the latterpoint, we seek to determine whether these indexes can accurately predict economic and financialactivity, as measured by the growth of industrial production, real GDP, and U.S. equity prices asmeasured by the Wilshire 5000.
The rest of the paper is outlined as follows. The following section discusses the definition offinancial stress and how it is measured. In this section, we also clarify the relationship amongfinancial stress, FSIs, and FCIs. Next we review a number of international FSIs. The followingsection compares the different indexes and considers how well they predict macroeconomicvariables. The last section provides our conclusions.
FINANCIAL STRESS INDEXES VERSUS FINANCIAL CONDITIONSINDEXES
Financial markets are inherently forward-looking. Economic shocks that cause financialmarket participants to revise their expectations of future returns are quickly embedded in cur-rent asset prices and then transmitted into the rest of the financial sector and the real economy.Financial stress may increase if conditions change because of one of these shocks. While financialstress is universally viewed as negative, the term itself is subject to various definitions and inter-pretations (Table 1). To economists and those active in financial markets, financial stress mightbe thought of as an increase in the probability of default on a security, such as a corporate bond.
For bonds, stress is reflected in interest rates on debt securities with different default risksor in an increase in volatility measures constructed with options prices. One common measureof stress is an interest rate spread, such as that between the interest rate on so-called risk-free debt(U.S. Treasury securities) and interest rates on so-called risky securities, such as a compositeyield on corporate investment- or speculative-grade bonds. For stocks, expectations of lowerearnings or smaller dividends are reflected in their prices.3
Measures of aggregate financial stress would summarize sets of these probabilities for broadcategories of products or markets. Following Abdymomunov (2012), we define market-levelfinancial stress as a mix of conditions, in which “market participants experience increased uncer-tainty or change their expectations about future financial losses, fundamental value of assets,and economic activity” (p. 2). This definition implies that financial stress is a multidimensionalproblem: It involves a number of (simultaneous or temporally proximate) exogenous shocks tofactors from banks and financial markets. Rather than measuring these factors/shocks directly,an FSI looks for evidence of these shocks. Thus, the level of the FSI indicates the interaction offinancial vulnerabilities and the size of shocks (Grimaldi, 2010, 2011); extreme values occur intimes of panic/crashes/crises.
In general, FSIs try to monitor financial instability by creating a time series of values inwhich increases indicate the increased likelihood of a crisis. The data that comprise these indexestend to contain information on spreads, correlations, and interest rates, some of which havebeen aggregated first into subindexes and then into the final FSI measure. FCIs, on the other
Kliesen, Owyang, Vermann
Federal Reserve Bank of St. Louis REVIEW September/October 2012 371
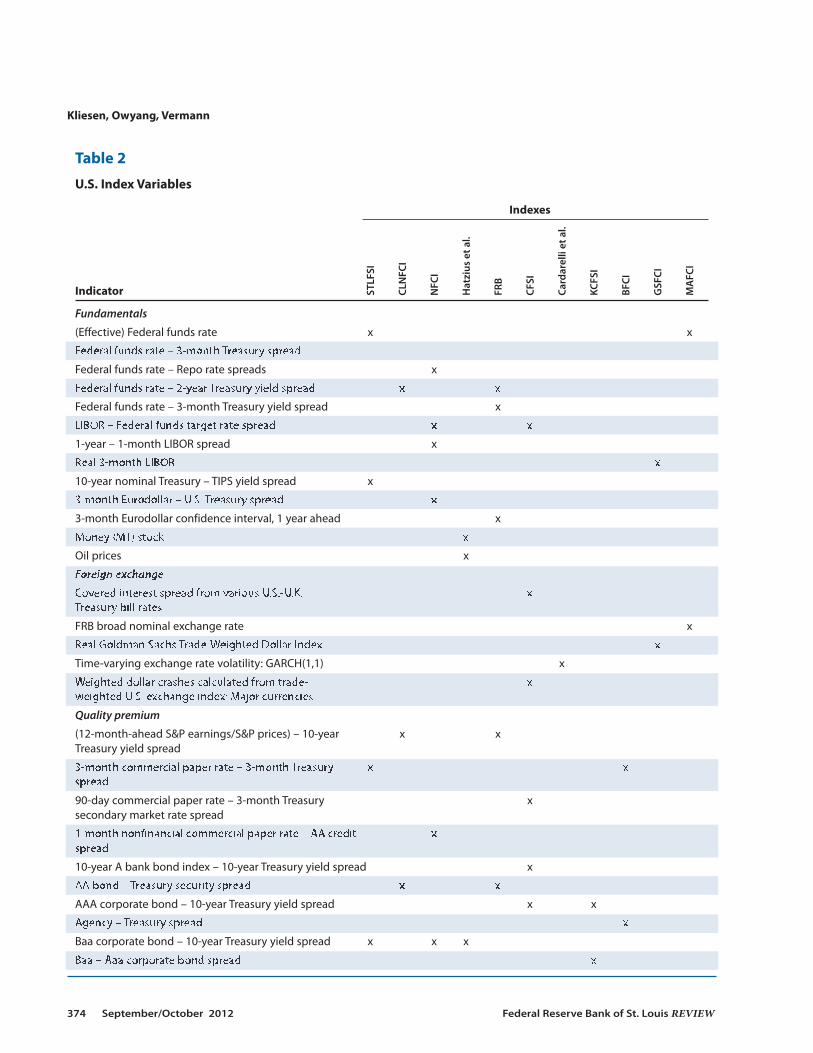
hand, tend to use other types of financial and nonfinancial variables to measure financial insta-bility. Although Table 2 indicates considerable overlap between FCIs and FSIs, the primary dif-ference is that the former tend to contain quantities, prices, and economic indicators, whereasthe latter generally use only prices. For example, Hatzius et al. (2010) use measures of bank credit,debt, asset-backed securities, and surveys of consumers and small businesses. In addition, someFCIs—such as the Macroeconomic Advisers (2003) Monetary and Financial Conditions Index(MAFCI)—are designed to map directly into changes in real GDP (e.g., an X-percent change infinancial conditions corresponds to a Y-percentage-point change in future real GDP). Thus, FCIstend to encompass a larger universe of financial variables. In some cases, they are described interms of deviations from long-term trends.
Kliesen, Owyang, Vermann
372 September/October 2012 Federal Reserve Bank of St. Louis REVIEW
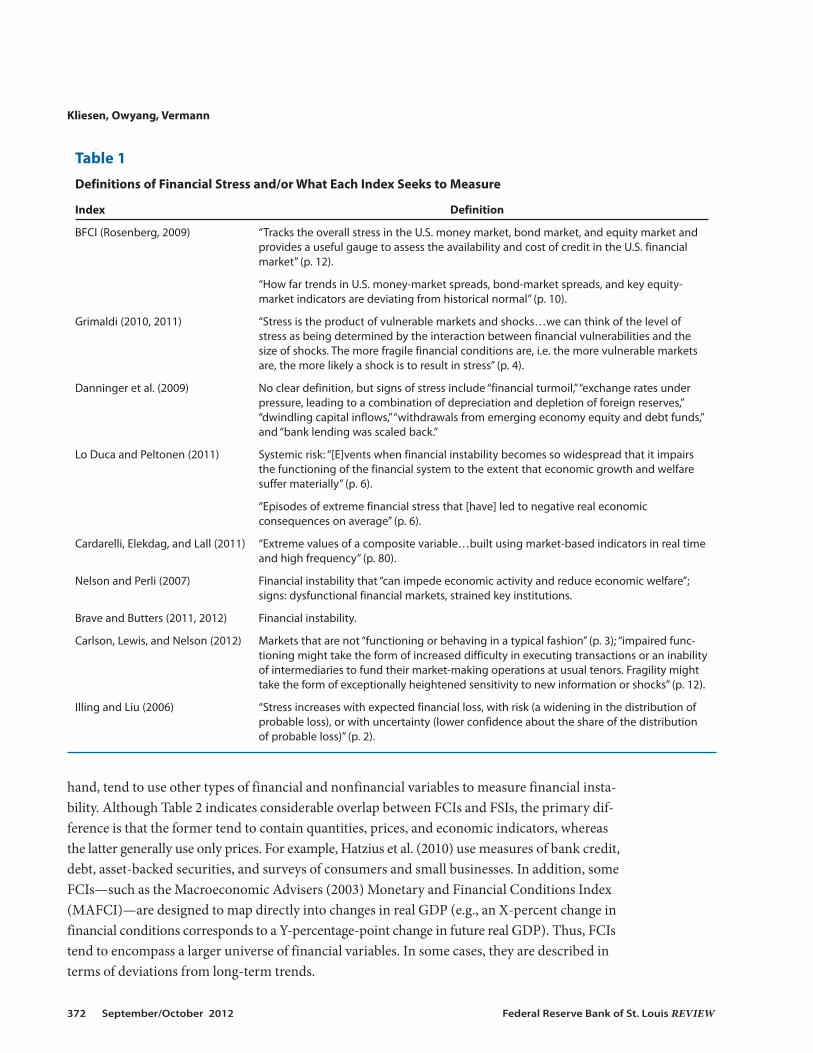
Table 1
Definitions of Financial Stress and/or What Each Index Seeks to Measure
Index Definition
BFCI (Rosenberg, 2009) “Tracks the overall stress in the U.S. money market, bond market, and equity market and provides a useful gauge to assess the availability and cost of credit in the U.S. financial market” (p. 12).
“How far trends in U.S. money-market spreads, bond-market spreads, and key equity-market indicators are deviating from historical normal” (p. 10).
Grimaldi (2010, 2011) “Stress is the product of vulnerable markets and shocks…we can think of the level of stress as being determined by the interaction between financial vulnerabilities and the size of shocks. The more fragile financial conditions are, i.e. the more vulnerable markets are, the more likely a shock is to result in stress” (p. 4).
Danninger et al. (2009) No clear definition, but signs of stress include “financial turmoil,” “exchange rates under pressure, leading to a combination of depreciation and depletion of foreign reserves,” “dwindling capital inflows,” “withdrawals from emerging economy equity and debt funds,” and “bank lending was scaled back.”
Lo Duca and Peltonen (2011) Systemic risk: “[E]vents when financial instability becomes so widespread that it impairs the functioning of the financial system to the extent that economic growth and welfare suffer materially” (p. 6).
“Episodes of extreme financial stress that [have] led to negative real economic consequences on average” (p. 6).
Cardarelli, Elekdag, and Lall (2011) “Extreme values of a composite variable…built using market-based indicators in real time and high frequency” (p. 80).
Nelson and Perli (2007) Financial instability that “can impede economic activity and reduce economic welfare”; signs: dysfunctional financial markets, strained key institutions.
Brave and Butters (2011, 2012) Financial instability.
Carlson, Lewis, and Nelson (2012) Markets that are not “functioning or behaving in a typical fashion” (p. 3); “impaired func-tioning might take the form of increased difficulty in executing transactions or an inabilityof intermediaries to fund their market-making operations at usual tenors. Fragility might take the form of exceptionally heightened sensitivity to new information or shocks” (p. 12).
Illing and Liu (2006) “Stress increases with expected financial loss, with risk (a widening in the distribution of probable loss), or with uncertainty (lower confidence about the share of the distribution of probable loss)” (p. 2).
Kliesen, Owyang, Vermann
An FCI can also be used to predict changes in economic business cycles. As such, an FSIcan be considered a snapshot of the level of fragility in the financial market and an FCI a map-ping of financial conditions onto macroeconomic conditions (Carlson, Lewis, and Nelson,2012; CLNFCI). In this sense, FSIs have “no natural observable counterpart in the real world”(Louzis and Vouldis, 2011, p. 3) and can only be measured relative to themselves, while FCIsassume a relationship between the financial sector and an element of the macroeconomy. Giventheir design, then, these types of FCIs might be expected to be better predictors of real economicactivity.
The first step in gauging the cyclical properties of each type of index, as well as their co-movement (if any), is to plot an FSI and an FCI. Figure 1 plots two measures: the Federal ReserveBank of St. Louis Financial Stress Index (STLFSI; Kliesen and Smith, 2010) and the FederalReserve Bank of Chicago National Financial Conditions Index (NFCI; Brave and Butters, 2011).The two measures moved rather closely together before 2000 and from 2007 to the present, but
Federal Reserve Bank of St. Louis REVIEW September/October 2012 373
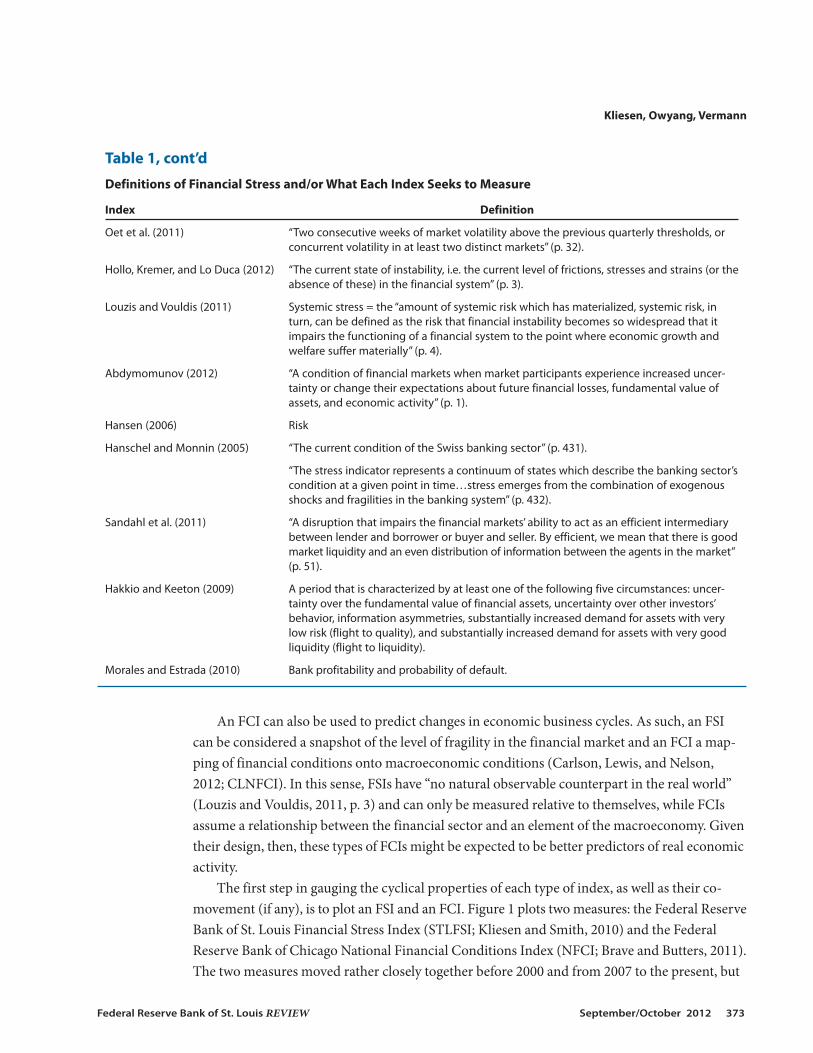
Table 1, cont’d
Definitions of Financial Stress and/or What Each Index Seeks to Measure
Index Definition
Oet et al. (2011) “Two consecutive weeks of market volatility above the previous quarterly thresholds, or concurrent volatility in at least two distinct markets” (p. 32).
Hollo, Kremer, and Lo Duca (2012) “The current state of instability, i.e. the current level of frictions, stresses and strains (or theabsence of these) in the financial system” (p. 3).
Louzis and Vouldis (2011) Systemic stress = the “amount of systemic risk which has materialized, systemic risk, in turn, can be defined as the risk that financial instability becomes so widespread that it impairs the functioning of a financial system to the point where economic growth and welfare suffer materially” (p. 4).
Abdymomunov (2012) “A condition of financial markets when market participants experience increased uncer-tainty or change their expectations about future financial losses, fundamental value of assets, and economic activity” (p. 1).
Hansen (2006) Risk
Hanschel and Monnin (2005) “The current condition of the Swiss banking sector” (p. 431).
“The stress indicator represents a continuum of states which describe the banking sector’scondition at a given point in time…stress emerges from the combination of exogenous shocks and fragilities in the banking system” (p. 432).
Sandahl et al. (2011) “A disruption that impairs the financial markets’ ability to act as an efficient intermediary between lender and borrower or buyer and seller. By efficient, we mean that there is goodmarket liquidity and an even distribution of information between the agents in the market” (p. 51).
Hakkio and Keeton (2009) A period that is characterized by at least one of the following five circumstances: uncer-tainty over the fundamental value of financial assets, uncertainty over other investors’ behavior, information asymmetries, substantially increased demand for assets with very low risk (flight to quality), and substantially increased demand for assets with very good liquidity (flight to liquidity).
Morales and Estrada (2010) Bank profitability and probability of default.
Kliesen, Owyang, Vermann
374 September/October 2012 Federal Reserve Bank of St. Louis REVIEW
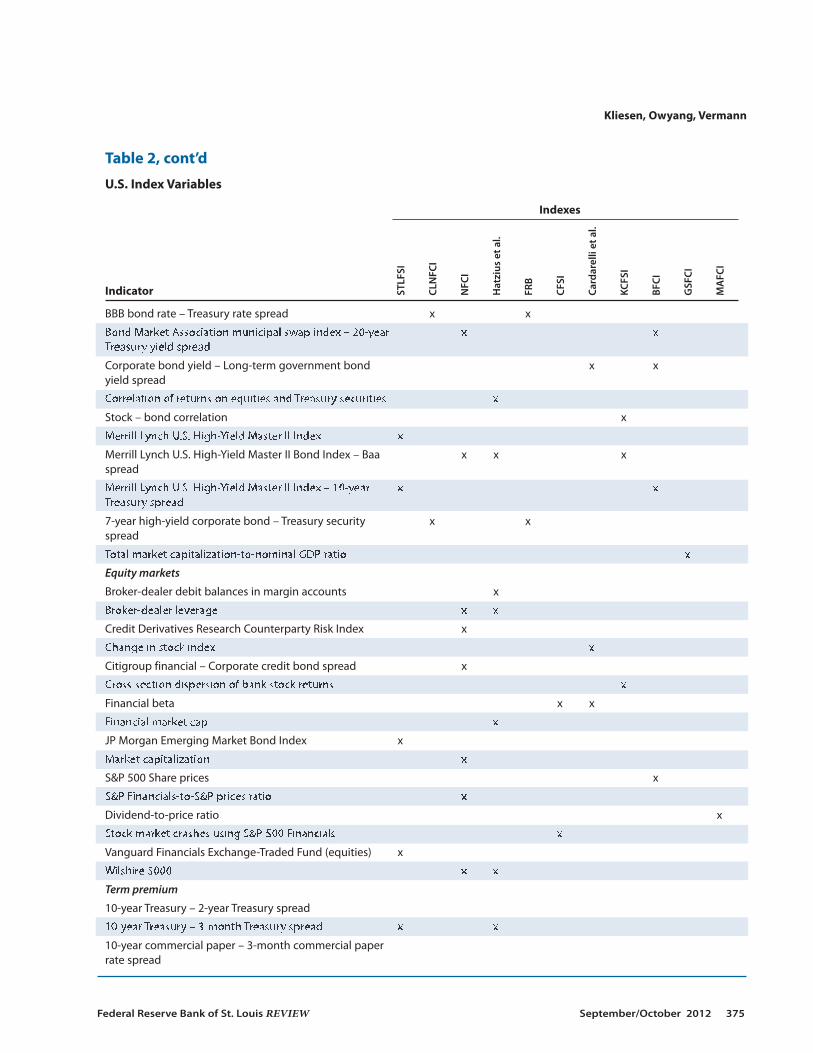
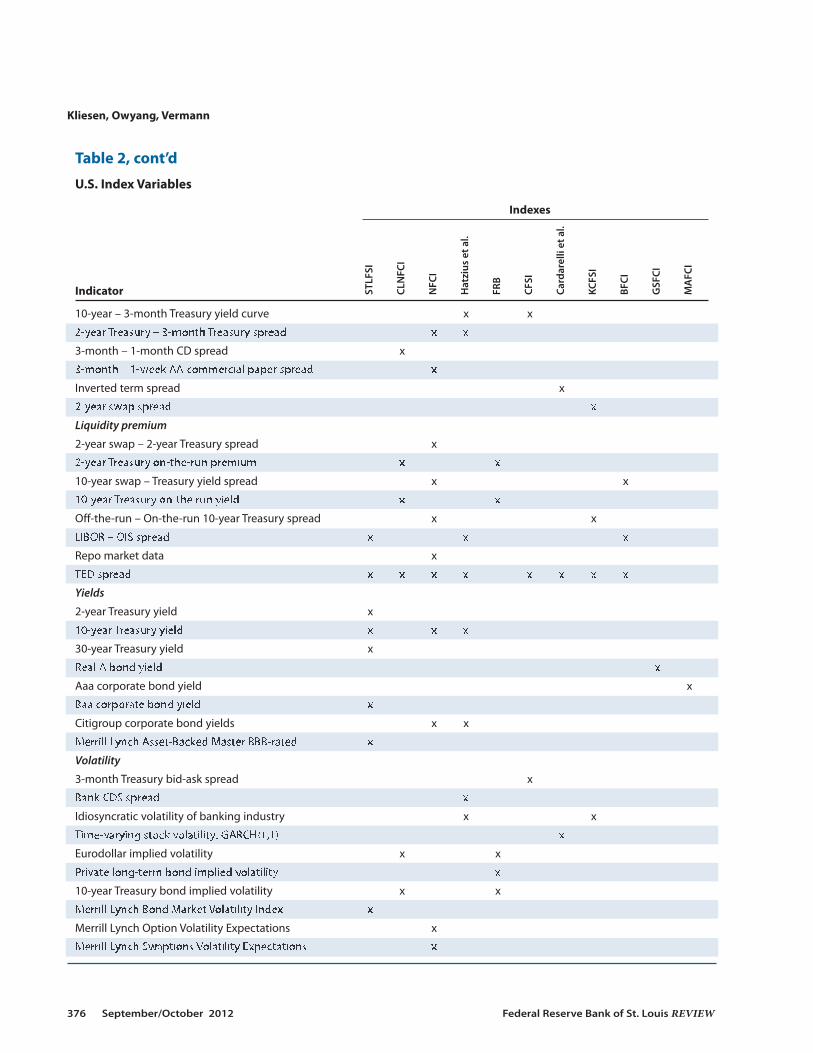
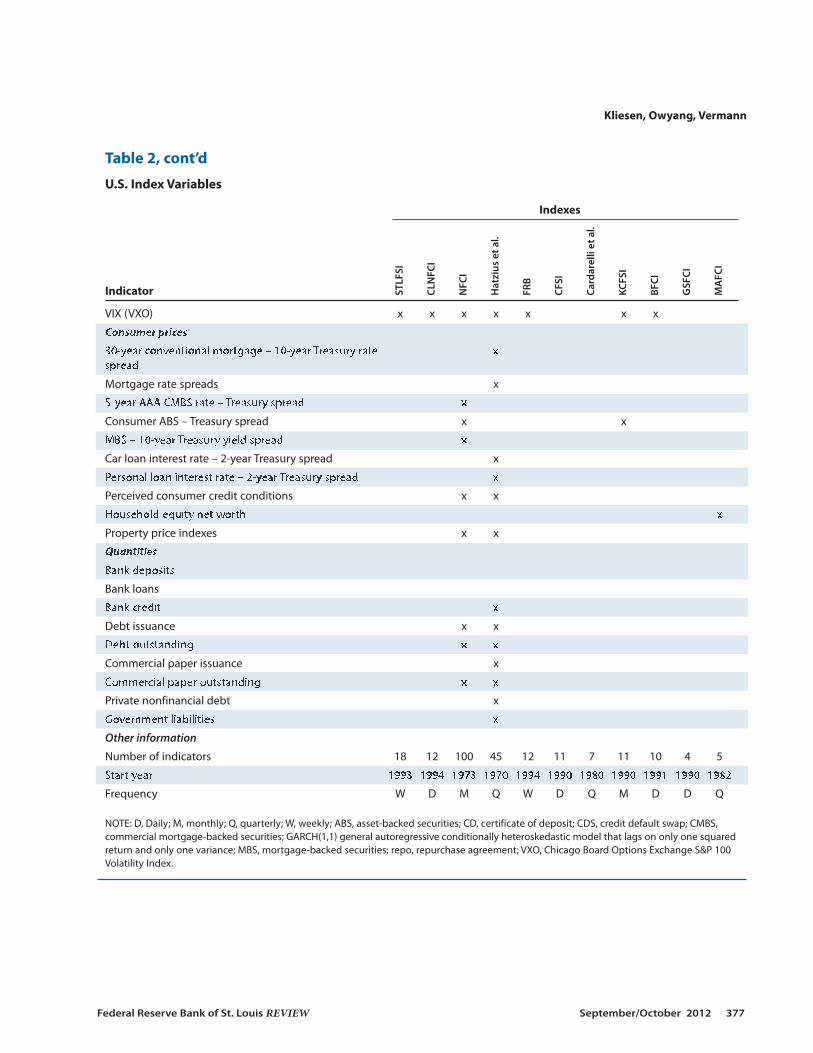
Table 2
U.S. Index Variables
Indexes
Indicator
Fundamentals
(Effective) Federal funds rate x x
Federal funds rate – 3-month Treasury spread
Federal funds rate – Repo rate spreads x
Federal funds rate – 2-year Treasury yield spread x x
Federal funds rate – 3-month Treasury yield spread x
LIBOR – Federal funds target rate spread x x
1-year – 1-month LIBOR spread x
Real 3-month LIBOR x
10-year nominal Treasury – TIPS yield spread x
3-month Eurodollar – U.S. Treasury spread x
3-month Eurodollar confidence interval, 1 year ahead x
Money (M1) stock x
Oil prices x
Foreign exchange
Covered interest spread from various U.S.-U.K. xTreasury bill rates
FRB broad nominal exchange rate x
Real Goldman Sachs Trade-Weighted Dollar Index x
Time-varying exchange rate volatility: GARCH(1,1) x
Weighted dollar crashes calculated from trade- xweighted U.S. exchange index: Major currencies
Quality premium
(12-month-ahead S&P earnings/S&P prices) – 10-year x xTreasury yield spread
3-month commercial paper rate – 3-month Treasury x xspread
90-day commercial paper rate – 3-month Treasury xsecondary market rate spread
1-month nonfinancial commercial paper rate – AA credit xspread
10-year A bank bond index – 10-year Treasury yield spread x
AA bond – Treasury security spread x x
AAA corporate bond – 10-year Treasury yield spread x x
Agency – Treasury spread x
Baa corporate bond – 10-year Treasury yield spread x x x
Baa – Aaa corporate bond spread x
STLFSI
CLNFC
I
NFC
I
Hatzius et a
l.
FRB
CFSI
Cardarelli et al.
KCFSI
BFCI
GSFCI
MAFC
I
Kliesen, Owyang, Vermann
Federal Reserve Bank of St. Louis REVIEW September/October 2012 375
Table 2, cont’d
U.S. Index Variables
Indexes
Indicator
BBB bond rate – Treasury rate spread x x
Bond Market Association municipal swap index – 20-year x xTreasury yield spread
Corporate bond yield – Long-term government bond x xyield spread
Correlation of returns on equities and Treasury securities x
Stock – bond correlation x
Merrill Lynch U.S. High-Yield Master II Index x
Merrill Lynch U.S. High-Yield Master II Bond Index – Baa x x xspread
Merrill Lynch U.S. High-Yield Master II Index – 10-year x xTreasury spread
7-year high-yield corporate bond – Treasury security x xspread
Total market capitalization-to-nominal GDP ratio x
Equity markets
Broker-dealer debit balances in margin accounts x
Broker-dealer leverage x x
Credit Derivatives Research Counterparty Risk Index x
Change in stock index x
Citigroup financial – Corporate credit bond spread x
Cross-section dispersion of bank stock returns x
Financial beta x x
Financial market cap x
JP Morgan Emerging Market Bond Index x
Market capitalization x
S&P 500 Share prices x
S&P Financials-to-S&P prices ratio x
Dividend-to-price ratio x
Stock market crashes using S&P 500 Financials x
Vanguard Financials Exchange-Traded Fund (equities) x
Wilshire 5000 x x
Term premium
10-year Treasury – 2-year Treasury spread
10-year Treasury – 3-month Treasury spread x x
10-year commercial paper – 3-month commercial paper rate spread
STLFSI
CLNFC
I
NFC
I
Hatzius et a
l.
FRB
CFSI
Cardarelli et al.
KCFSI
BFCI
GSFCI
MAFC
I
Kliesen, Owyang, Vermann
376 September/October 2012 Federal Reserve Bank of St. Louis REVIEW
Table 2, cont’d
U.S. Index Variables
Indexes
Indicator
10-year – 3-month Treasury yield curve x x
2-year Treasury – 3-month Treasury spread x x
3-month – 1-month CD spread x
3-month – 1-week AA commercial paper spread x
Inverted term spread x
2-year swap spread x
Liquidity premium
2-year swap – 2-year Treasury spread x
2-year Treasury on-the-run premium x x
10-year swap – Treasury yield spread x x
10-year Treasury on-the run yield x x
Off-the-run – On-the-run 10-year Treasury spread x x
LIBOR – OIS spread x x x
Repo market data x
TED spread x x x x x x x x
Yields
2-year Treasury yield x
10-year Treasury yield x x x
30-year Treasury yield x
Real A bond yield x
Aaa corporate bond yield x
Baa corporate bond yield x
Citigroup corporate bond yields x x
Merrill Lynch Asset-Backed Master BBB-rated x
Volatility
3-month Treasury bid-ask spread x
Bank CDS spread x
Idiosyncratic volatility of banking industry x x
Time-varying stock volatility: GARCH(1,1) x
Eurodollar implied volatility x x
Private long-term bond implied volatility x
10-year Treasury bond implied volatility x x
Merrill Lynch Bond Market Volatility Index x
Merrill Lynch Option Volatility Expectations x
Merrill Lynch Swaptions Volatility Expectations x
STLFSI
CLNFC
I
NFC
I
Hatzius et a
l.
FRB
CFSI
Cardarelli et al.
KCFSI
BFCI
GSFCI
MAFC
I
Kliesen, Owyang, Vermann
Federal Reserve Bank of St. Louis REVIEW September/October 2012 377
Table 2, cont’d
U.S. Index Variables
Indexes
Indicator
VIX (VXO) x x x x x x x
Consumer prices
30-year conventional mortgage – 10-year Treasury rate xspread
Mortgage rate spreads x
5-year AAA CMBS rate – Treasury spread x
Consumer ABS – Treasury spread x x
MBS – 10-year Treasury yield spread x
Car loan interest rate – 2-year Treasury spread x
Personal loan interest rate – 2-year Treasury spread x
Perceived consumer credit conditions x x
Household equity net worth x
Property price indexes x x
Quantities
Bank deposits
Bank loans
Bank credit x
Debt issuance x x
Debt outstanding x x
Commercial paper issuance x
Commercial paper outstanding x x
Private nonfinancial debt x
Government liabilities x
Other information
Number of indicators 18 12 100 45 12 11 7 11 10 4 5
Start year 1993 1994 1973 1970 1994 1990 1980 1990 1991 1990 1982
Frequency W D M Q W D Q M D D Q
NOTE: D, Daily; M, monthly; Q, quarterly; W, weekly; ABS, asset-backed securities; CD, certificate of deposit; CDS, credit default swap; CMBS,commercial mortgage-backed securities; GARCH(1,1) general autoregressive conditionally heteroskedastic model that lags on only one squaredreturn and only one variance; MBS, mortgage-backed securities; repo, repurchase agreement; VXO, Chicago Board Options Exchange S&P 100Volatility Index.
STLFSI
CLNFC
I
NFC
I
Hatzius et a
l.
FRB
CFSI
Cardarelli et al.
KCFSI
BFCI
GSFCI
MAFC
I
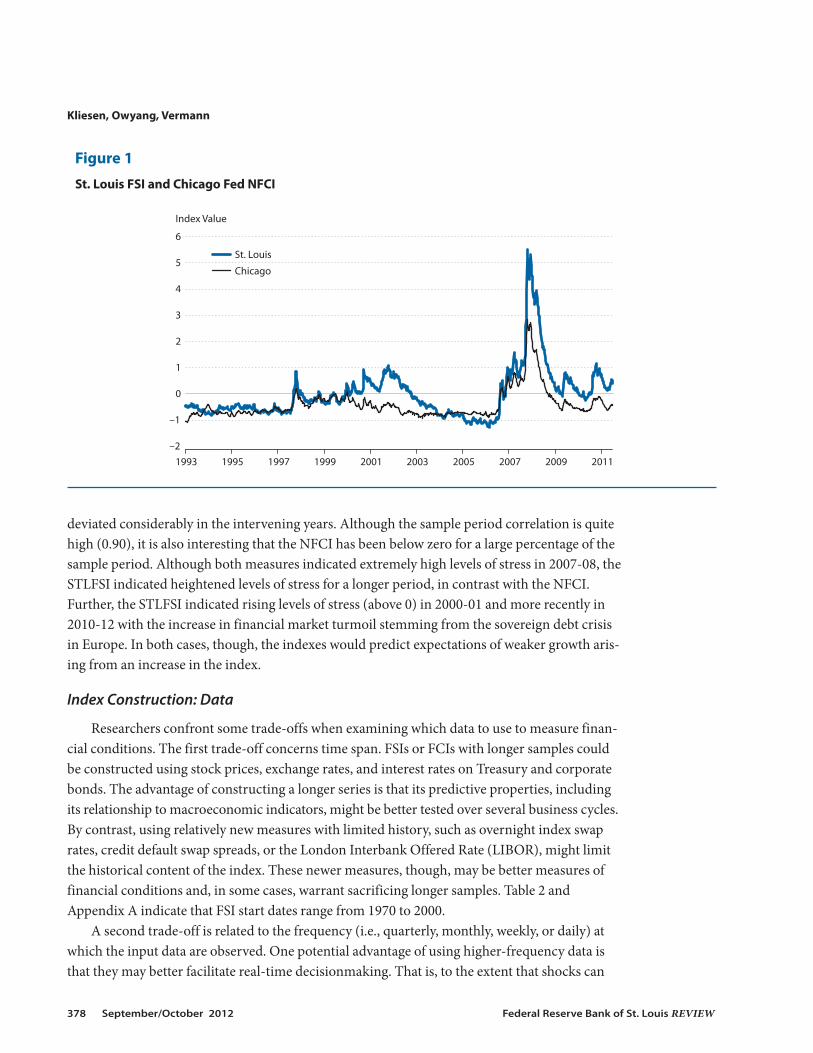
deviated considerably in the intervening years. Although the sample period correlation is quitehigh (0.90), it is also interesting that the NFCI has been below zero for a large percentage of thesample period. Although both measures indicated extremely high levels of stress in 2007-08, theSTLFSI indicated heightened levels of stress for a longer period, in contrast with the NFCI.Further, the STLFSI indicated rising levels of stress (above 0) in 2000-01 and more recently in2010-12 with the increase in financial market turmoil stemming from the sovereign debt crisisin Europe. In both cases, though, the indexes would predict expectations of weaker growth aris-ing from an increase in the index.
Index Construction: Data
Researchers confront some trade-offs when examining which data to use to measure finan-cial conditions. The first trade-off concerns time span. FSIs or FCIs with longer samples couldbe constructed using stock prices, exchange rates, and interest rates on Treasury and corporatebonds. The advantage of constructing a longer series is that its predictive properties, includingits relationship to macroeconomic indicators, might be better tested over several business cycles.By contrast, using relatively new measures with limited history, such as overnight index swaprates, credit default swap spreads, or the London Interbank Offered Rate (LIBOR), might limitthe historical content of the index. These newer measures, though, may be better measures offinancial conditions and, in some cases, warrant sacrificing longer samples. Table 2 andAppendix A indicate that FSI start dates range from 1970 to 2000.
A second trade-off is related to the frequency (i.e., quarterly, monthly, weekly, or daily) atwhich the input data are observed. One potential advantage of using higher-frequency data isthat they may better facilitate real-time decisionmaking. That is, to the extent that shocks can
Kliesen, Owyang, Vermann
378 September/October 2012 Federal Reserve Bank of St. Louis REVIEW
–2
–1
0
1
2
3
4
5
6
1993 1995 1997 1999 2001 2003 2005 2007 2009 2011
St. Louis
Chicago
Index Value
Figure 1
St. Louis FSI and Chicago Fed NFCI
be more quickly identified with weekly data than monthly data, policymakers may be able toassess rapidly evolving economic conditions—such as in the fall of 2008—in a more timely man-ner. In general, the decision to use higher-frequency data (for example, weekly observationsrather than monthly observations) means shorter samples (see Table 2). High-frequency dataalso tend to be more volatile and may yield false signals.4
In an attempt to mitigate the problems associated with the lack of ideal data, the number ofvariables used to construct an FSI or FCI ranges from 5 (MAFCI) to 100 (NFCI). Indexes withmore variables (e.g., the NFCI; Hatzius et al., 2010), however, tend to classify themselves as FCIsand tend to contain a larger number of additional price and consumer finance variables. Further,indexes with more variables tend to incorporate data observed at multiple frequencies or multi-ple principal components (PCs), in addition to taking advantage of an unbalanced panel(Hatzius et al., 2010).5
Different researchers choose data that they believe reflect important aspects of the financialmarket to construct measures of financial stress. Although the categories are somewhat subjec-tively chosen, these include economic fundamentals, yields, interest rate spreads that measurerisk premiums, interest rate spreads that measure the term premium, interest rate spreads thatmeasure the liquidity premium, stock market indicators, volatility indicators, foreign exchangeindicators, spreads with consumer lending rates, and quantities.
Table 2 also contains a (noncomprehensive) list of the indicators that fall into each of thesecategories. The overlap across the various stress indexes is substantial, as expected. The eco-nomic fundamentals include the federal funds rate and interest rate spreads, such as the 1-year –1-month LIBOR spread and the 10-year nominal Treasury – 10-year Treasury Inflation-ProtectedSecuri ties (TIPS) yield spread. These variables are intended to capture inflation expectationsand uncertainty due to monetary policy. Other yields are added to examine individual financialvariables, such as yields on Treasury securities and commercial paper rates of various maturities.
Credit spreads, which are a measure of risk premiums, are another popular indicator. Forexample, the interest rate spread between two different types of financial instruments with thesame term length is viewed as a measure of investors’ appetite for risk relative to the variation ininstrument quality. Generally, the spreads in this category are those between yields on invest-ment- or non-investment-grade corporate bonds and Treasury securities. A rise in this spreadmight also be viewed as an increase in default risk associated with certain bonds, such as “junkbonds.” This spread could also change if financial turmoil in global markets leads to a flight toquality, which tends to lower yields on Treasury securities. This phenomenon occurred in 2011and 2012 during the European sovereign debt crisis. Another type of risk premium measuresthe yield spread between the same financial instruments but with different term lengths. Thistype of spread is known as a term premium. The best-known term premium is the differencebetween the yield on 3-month Treasury securities and 10- or 30-year Treasury securities.
Another type of risk is liquidity risk. Liquidity risk captures the relative ease (or difficulty)of converting financial assets into cash or its equivalent. One popular type of liquidity premiumuses on-the-run and off-the-run Treasury spreads, the Treasury bill – eurodollar (TED) spread,and/or the LIBOR – Overnight Indexed Swap (OIS) spread.6 The liquidity premium data indicateperceived credit risk and, thus, perceived risk of interbank loan defaults. In addition to usinggovernment-backed securities, many FSIs consider equity markets by incorporating composite
Kliesen, Owyang, Vermann
Federal Reserve Bank of St. Louis REVIEW September/October 2012 379
equity prices measures, such as the financial beta, the financial market cap, bank stock returns,and indexes of investment grades. These variables generally reflect expectations surroundingcompany profitability and overall market profitability.
Similarly, the set of market volatility indicators helps FSIs capture investor uncertainty. TheChicago Board Options Exchange Market Volatility Index (VIX), the idiosyncratic volatility(IVOL) of bank stock prices, Merrill Lynch Option Volatility Expectations, Merill Lynch SwaptionVolatility Expectations, and 3-month Treasury bill bid-ask spread measure the contribution ofinvestor uncertainty to financial stress.7
A few FSIs also use foreign exchange measures that evaluate the strength of the U.S. dollaruse measures of (i) a broad trade-weighted real exchange rate, (ii) time-varying exchange ratevolatility, (iii) U.S.-U.K. covered interest rate differentials, or (iv) real exchange rate growth.These indicators help measure the interconnectedness of international financial markets andthe overall strength of the U.S. (or home) economy relative to the global economy. Flight-to-quality effects during global financial turmoil also tend to be reflected in exchange rates.
The final two types of indicators—consumer interest rate spreads and quantities—are usu-ally found only in FCIs. The consumer rate spreads take into account interest rate spreads onmortgages, car loans, personal loans, mortgage-backed securities, and asset-backed securities,as well as perceptions of credit conditions from consumer surveys. The quantity index takesinto account stock quantities of loans, commercial paper issuance, and debt outstanding.
From this large list of indicators, the most often used variable categories are quality, term,and liquidity premium indicators: Every article studied here uses at least one of the variables ineach of those categories. Overall, the most frequently used variable is the TED spread, which isused in eight indexes: Cardarelli, Elekdag, and Lall (2011); Hatzius et al. (2010); the Kansas CityFed’s FSI (KCFSI, Hakkio and Keeton, 2009); Bloomberg FCI (BFCI; Rosenberg, 2009); CFSI;CLNFCI; STLFSI; and NFCI. The second most-used indicator is the VIX, which is used in sixindexes: Nelson and Perli (2007), KCFSI, CLNFCI, STLFSI, NFCI, and BFCI. The third most-used indicator is the 10-year Treasury – 3-month Treasury spread, which is used in four of theindexes: Hatzius et al. (2011), KCFSI, CFSI, and STLFSI.
Table 2 also shows that, within the same index, a single FSI may use a number of variablesfrom the same data category. This redundancy provides a more detailed picture of an extremelycomplex financial market. On the other hand, adding more redundant indicators may notimprove the index (Lo Duca and Peltonen, 2011). Furthermore, according to Grimaldi (2010,2011), too many variables could lead to more false “high stress episodes.” In other words, toomany similar variables may oversignal/overestimate the level of financial stress by overweight-ing a particular aspect of financial stress.
Data Aggregation
Once the data for an FSI are collected, they must be aggregated into one measure. Economistsoften summarize the information in several series with a single index (e.g., the indexes of coin-cident, leading, and lagging indicators). Indexes may better capture the co-movement of a broadarray of economically important series across the business cycle or they may simply be easier todigest.
In order to construct the FSIs and FCIs, the data are generally converted to a common unit.The most common conversion is standardizing each variable; this is usually done by subtract-
Kliesen, Owyang, Vermann
380 September/October 2012 Federal Reserve Bank of St. Louis REVIEW
ing its historical (sample) mean and dividing by its standard deviation (Nelson & Perli, 2007;Cardarelli, Elekdag, and Lall, 2011; CLNFCI; STLFSI; KCFSI). With this approach, fluctuationsacross variables are on the same scale. Other methods of standardization include studying thedifference in a variable’s level relative to an average from a reference period (the Goldman SachsFinancial Conditions Index [GSFCI], Dudley and Hatzius, 2000) or standardizing based oneach indicator’s cumulative density function (CDF; CFSI). More complicated methods includepassing data through various filters (NFCI) or eliminating variability that can be explained byhistorical real activity of inflation (Hatzius et al., 2010).
In the process of constructing the indexes, data may also be grouped into subindexes.Grouping the data in this manner highlights the fluctuations in similar variables and is especiallyuseful when multiple variables from the same subcategory are used. Four of the 11 U.S. FSIs weexamined group the data into thematic subindexes and aggregate them within these sub indexes.Two of these 4 indexes—the BFCI and Cardarelli, Elekdag, and Lall (2011)—aggregate the fac-tors in each subindex using equal weighting.
The CLNFCI and Nelson and Perli (2007), on the other hand, use a different method. Theycreate subindexes that measure 3 different traits (level, volatility, and co-movement) of 12 vari-ables. The level subindex standardizes the variables based on their long-run averages, and thevolatility subindex equally weights the sums of the squared 8-week rolling window changes inthe data. In the CLNFCI, the comovement subindex uses PCs for a 26-week window. Thecomovement subindex in Nelson and Perli (2007) tracks the percentage of total variation of theindividual variables that is defined by a single common factor.
The simplest method of aggregating indicators (or subindexes) into a final index is equalweighting (Cardarelli, Elekdag, and Lall, 2011, and BFCI). In this method, the indicators (sub -indexes) are averaged together to produce a final measure.
More complicated aggregation methods include regression-based, PCs, or credit-basedweighting. Regression-based weights can be constructed by regressing the financial indicatorson a measure of output growth (GSFCI). In following this method, additional meaning can beattributed to a rise in financial stress since a change in the level of each indicator directly corre-lates with a change in GDP growth. Regression-based weights can also be constructed using alogistic regression of known periods of financial stress (Nelson and Perli, 2007, and CLNFCI).
The indexes that do not use a regression-based method (Hatzius et al., 2010; STLFSI; KCFSI;NFCI) determine weights using PC analysis (PCA).8 In layman’s terms, PCA assumes that eachof the variables used to construct the FSI (see Table 1) captures some aspect of financial stress.As a result, as the level of financial stress in the economy changes, the variables used to constructthe FSI are likely to move together. In the case of the STLFSI, it is assumed that financial stress isthe most important factor in explaining the comovement of the 18 variables used to constructthe index. This factor, which is the first PC, becomes the FSI. PCA is a relatively inexpensivemethod of extracting a common component among many variables.
The CFSI uses credit weights for its final stress measure. Rather than using weights deter-mined by PCA, Oet et al. (2011) calculate weights using data from the Federal Reserve Board’sflow of funds statistical release. In their methodology, the flow of funds data are separated intofour sectors: bank loans, foreign exchange credit, equity, and debt. Then they calculate a
Kliesen, Owyang, Vermann
Federal Reserve Bank of St. Louis REVIEW September/October 2012 381
z-proportion of the flow of funds through each of those sectors. After classifying their indica-tors into those sectors, Oet et al. average the z-proportion across the number of indicators in thesector.9
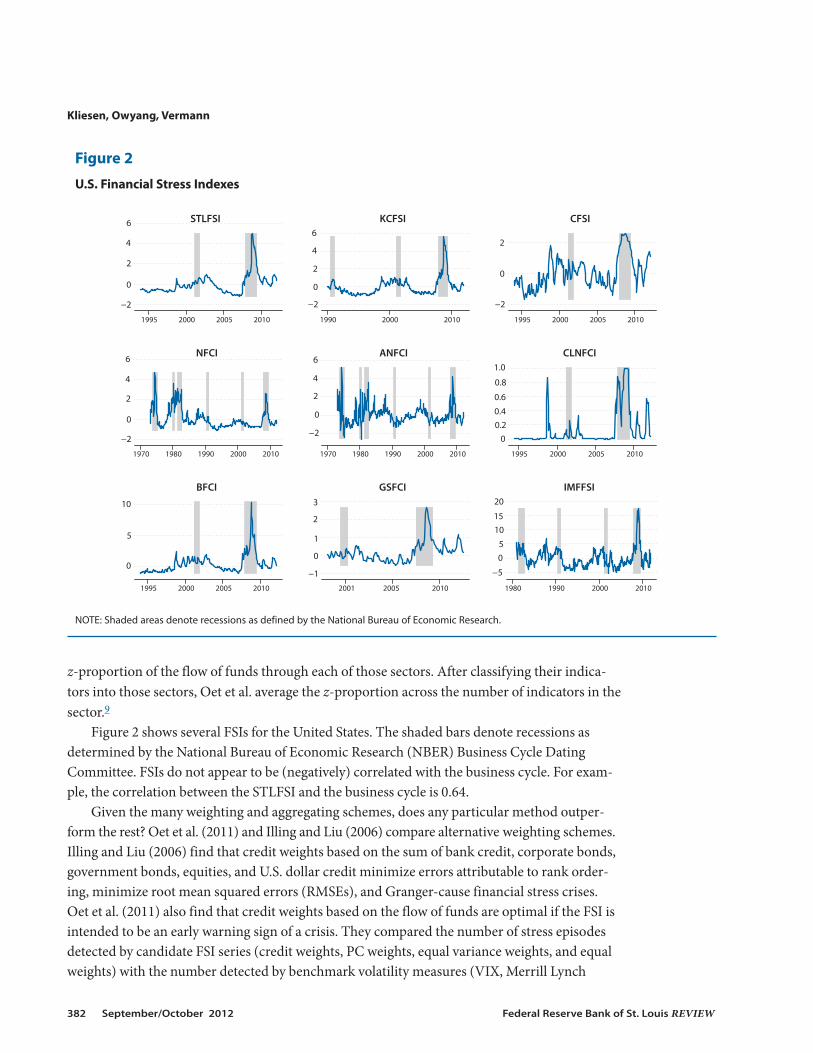
Figure 2 shows several FSIs for the United States. The shaded bars denote recessions asdetermined by the National Bureau of Economic Research (NBER) Business Cycle DatingCommittee. FSIs do not appear to be (negatively) correlated with the business cycle. For exam-ple, the correlation between the STLFSI and the business cycle is 0.64.
Given the many weighting and aggregating schemes, does any particular method outper-form the rest? Oet et al. (2011) and Illing and Liu (2006) compare alternative weighting schemes.Illing and Liu (2006) find that credit weights based on the sum of bank credit, corporate bonds,government bonds, equities, and U.S. dollar credit minimize errors attributable to rank order-ing, minimize root mean squared errors (RMSEs), and Granger-cause financial stress crises.Oet et al. (2011) also find that credit weights based on the flow of funds are optimal if the FSI isintended to be an early warning sign of a crisis. They compared the number of stress episodesdetected by candidate FSI series (credit weights, PC weights, equal variance weights, and equalweights) with the number detected by benchmark volatility measures (VIX, Merrill Lynch
Kliesen, Owyang, Vermann
382 September/October 2012 Federal Reserve Bank of St. Louis REVIEW
−2
0
2
4
6
1995 2000 2005 2010
STLFSI
−2
0
2
4
6
1990 2000 2010
KCFSI
−2
0
2
1995 2000 2005 2010
CFSI
−2
0
2
4
6
1970 1980 1990 2000 2010
NFCI
1970 1980 1990 2000 2010
ANFCI
00.20.4
0.6
0.8
1.0
1995 2000 2005 2010
CLNFCI
0
5
10
1995 2000 2005 2010
BFCI
−1
0
1
2
3
2001 2005 2010
GSFCI
−5
05
1015
20
1980 1990 2000 2010
IMFFSI
−2
0
2
4
6
Figure 2
U.S. Financial Stress Indexes
NOTE: Shaded areas denote recessions as defined by the National Bureau of Economic Research.
Option Volatility Estimate Index, the implied volatility of the Deutscher Aktien Index, LehmanBrothers Swaptions Volatility Index, and Barclays Swaptions Volatility index).
FSIs FROM AROUND THE WORLDHow do the financial stress measures using U.S. data compare with those using interna-
tional data? In this section, we discuss the general trends in variables and construction of FSIsfrom Greece (Louzis and Vouldis, 2011), Sweden (Sandhal et al., 2011), Canada (Illing and Liu,2006), Denmark (Hansen, 2006), Switzerland (Hanschel and Monnin, 2005), Colombia (Moralesand Estrada, 2010), and Hong Kong (Yiu, Ho, and Lin, 2010). We also discuss indexes that usedata from multiple countries such as the euro area (Grimaldi, 2010, 2011; Hollo, Kremer, andLo Duca, 2012); the International Monetary Fund (IMF, Cardarelli, Elekdag, and Lall, 2011;Danninger et al., 2009); and Lo Duca and Peltonen (2011).
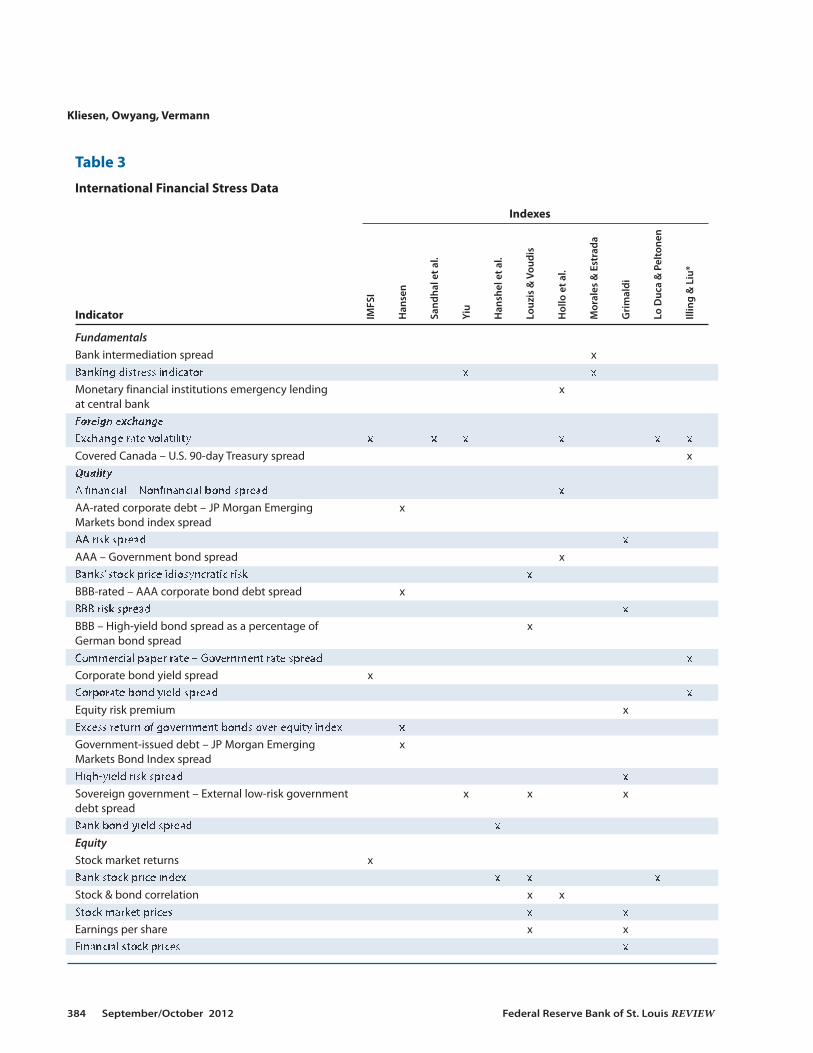
Data
Of the international FSIs we examined (Table 3), the types of data used show considerableoverlap with those used in U.S. measures of financial stress, reflecting the global nature offinancial markets. The international FSIs all use data that assess the quality premium, term pre-mium, liquidity premium, equity market, market volatility, and foreign exchange market. To doso, these indexes include bond quality spreads (i.e., AA corporate bond – government bondspreads), interbank rate spreads, stock price indexes, and volatility indexes. However, Moralesand Estrada (2010) and Hanschel and Monnin (2005) almost exclusively use bank-specific data.
Aggregation of Index Components
Unlike the U.S. financial stress measures, most of the international FSIs we studied firstaggregate their components into thematic subindexes and then aggregate those subindexes intothe final composite financial stress measure. This strategy is used by the IMF (Danninger et al.,2009); Greece (Louzis and Vouldis, 2011); Hong Kong (Yiu, Ho, and Jin, 2010); Grimaldi (2010,2011); and Hollo, Kremer, and Lo Duca (2011). With the exception of Grimaldi (2010, 2011),who creates subindexes based on Nelson and Perli (2007), these measures contain thematicsubindexes. To aggregate the factors in the subindexes, authors use PCs (Louzis and Vouldis,2011), equal weights (Danninger et al., 2009; Yiu, Ho, and Jin, 2010), and CDFs (Hollo, Kremer,and Lo Duca, 2011).
To aggregate indicators (or subindexes), authors use equal weights (Danninger et al., 2009;Lo Duca and Peltonen, 2011; Hansen, 2006; Sandhal et al., 2011; Yiu, Ho, and Jin, 2010;Hanschel and Monnin, 2005), credit weights (Illing and Liu, 2006), or regression-based meth-ods (Grimaldi, 2010, 2011; Louzis and Vouldis, 2011; Hollo, Kremer, and Lo Duca, 2011). Themost novel method—the portfolio-theory-based method used by Hollo, Kremer, and Lo Duca(2011) and Louzis and Vouldis (2011)—involves weights based on the number of markets inwhich financial stress is prevalent. In other words, the weights are dynamic and based on whatthe data show in each given situation. This method limits the likelihood of false stress incidents.
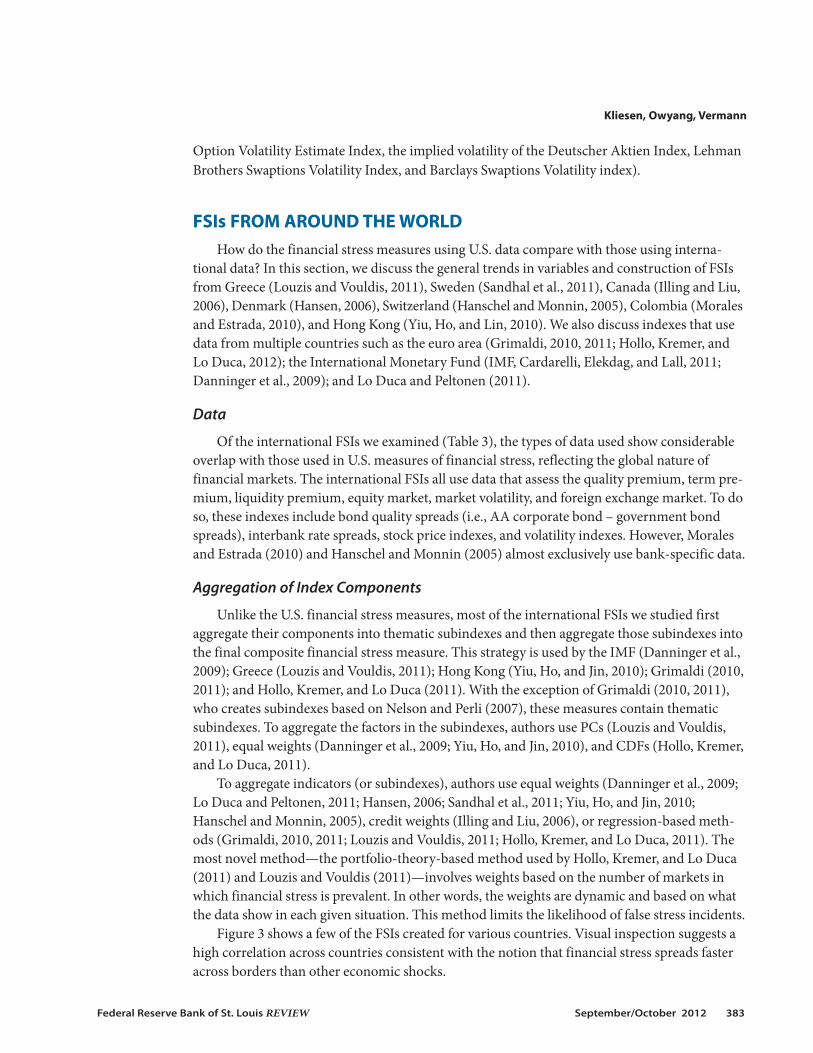
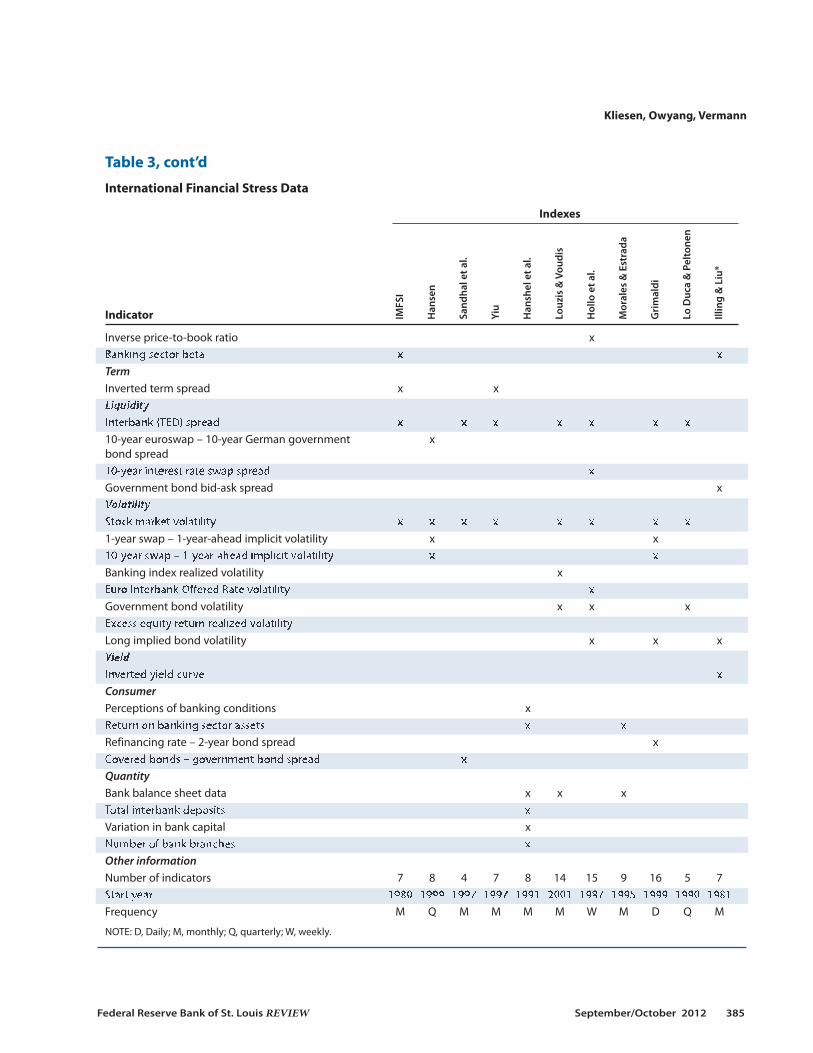
Figure 3 shows a few of the FSIs created for various countries. Visual inspection suggests ahigh correlation across countries consistent with the notion that financial stress spreads fasteracross borders than other economic shocks.
Kliesen, Owyang, Vermann
Federal Reserve Bank of St. Louis REVIEW September/October 2012 383
Kliesen, Owyang, Vermann
384 September/October 2012 Federal Reserve Bank of St. Louis REVIEW
Table 3
International Financial Stress Data
Indexes
Indicator
FundamentalsBank intermediation spread xBanking distress indicator x xMonetary financial institutions emergency lending xat central bankForeign exchangeExchange rate volatility x x x x x xCovered Canada – U.S. 90-day Treasury spread xQualityA financial – Nonfinancial bond spread xAA-rated corporate debt – JP Morgan Emerging xMarkets bond index spreadAA risk spread xAAA – Government bond spread xBanks’ stock price idiosyncratic risk xBBB-rated – AAA corporate bond debt spread xBBB risk spread xBBB – High-yield bond spread as a percentage of xGerman bond spreadCommercial paper rate – Government rate spread xCorporate bond yield spread xCorporate bond yield spread xEquity risk premium xExcess return of government bonds over equity index xGovernment-issued debt – JP Morgan Emerging xMarkets Bond Index spreadHigh-yield risk spread xSovereign government – External low-risk government x x xdebt spreadBank bond yield spread xEquityStock market returns xBank stock price index x x xStock & bond correlation x xStock market prices x xEarnings per share x xFinancial stock prices x
IMFSI
Han
sen
Sand
hal et a
l.
Yiu
Han
shel et a
l.
Louzis & Vou
dis
Hollo et a
l.
Morales & Estrada
Grimaldi
Lo Duca & Peltone
n
Illing & Liu*
Kliesen, Owyang, Vermann
Federal Reserve Bank of St. Louis REVIEW September/October 2012 385
Table 3, cont’d
International Financial Stress Data
Indexes
Indicator
Inverse price-to-book ratio xBanking sector beta x xTermInverted term spread x xLiquidityInterbank (TED) spread x x x x x x x10-year euroswap – 10-year German government xbond spread10-year interest rate swap spread xGovernment bond bid-ask spread xVolatilityStock market volatility x x x x x x x x1-year swap – 1-year-ahead implicit volatility x x10-year swap – 1-year-ahead implicit volatility x xBanking index realized volatility xEuro Interbank Offered Rate volatility xGovernment bond volatility x x xExcess equity return realized volatilityLong implied bond volatility x x xYieldInverted yield curve xConsumerPerceptions of banking conditions xReturn on banking sector assets x xRefinancing rate – 2-year bond spread xCovered bonds – government bond spread xQuantityBank balance sheet data x x xTotal interbank deposits xVariation in bank capital xNumber of bank branches xOther informationNumber of indicators 7 8 4 7 8 14 15 9 16 5 7Start year 1980 1999 1997 1997 1991 2001 1987 1995 1999 1990 1981Frequency M Q M M M M W M D Q M
NOTE: D, Daily; M, monthly; Q, quarterly; W, weekly.
IMFSI
Han
sen
Sand
hal et a
l.
Yiu
Han
shel et a
l.
Louzis & Vou
dis
Hollo et a
l.
Morales & Estrada
Grimaldi
Lo Duca & Peltone
n
Illing & Liu*
EMPIRICAL ANALYSISIn general, the usefulness of an indicator lies in its ability to measure what it was designed
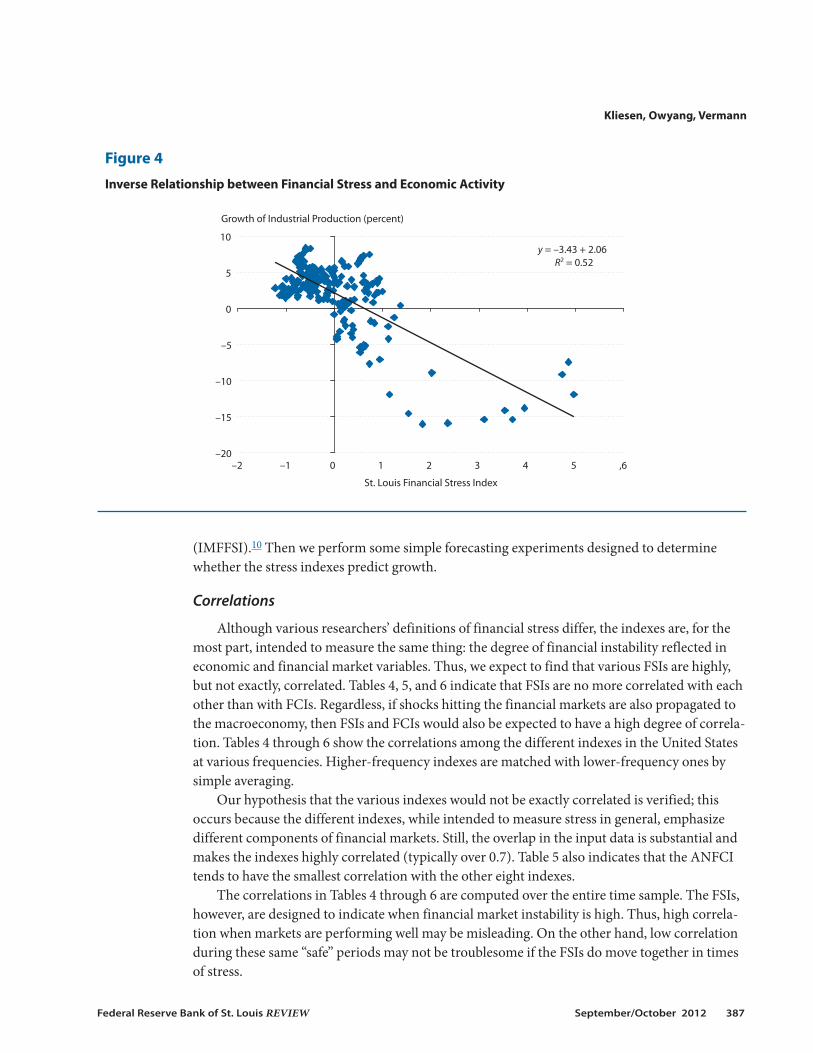
to measure. By and large, FSIs are designed to measure increases in financial instability, asdepicted in measures such as rising risk premiums, falling asset prices, or increased volatility.Rising levels of financial stress (instability) tend to increase uncertainty and weaken the realeconomy by a variety of transmission mechanisms. These include reduced wealth, a reductionin bank lending, and balance sheet effects that reduce the value of a firm’s collateral. Figure 4depicts this inverse relationship between financial stress and economic activity by plotting themonthly average of the STLFSI and the year-to-year growth of industrial production. The rela-tively high R-squared value (0.52) indicates that, consistent with our prior belief, relatively highlevels of financial stress are associated with weak or negative growth of industrial production.
But does such a relationship exist with other measures of financial stress and other meas-ures of economic activity? We consider this question in the remainder of this section in twoways. First, we compute the correlations among the measures of U.S. financial stress: the CFSI,the BFCI, the CLNFCI, the GSFSI, the NFCI, the Chicago Fed’s Adjusted NFCI (ANFCI; Braveand Butters, 2011), the STLFSI, the KCFSI, and the IMF’s Advanced Economies FSI for the U.S.
Kliesen, Owyang, Vermann
386 September/October 2012 Federal Reserve Bank of St. Louis REVIEW
0
0.2
0.4
0.6
1980 1990 2000 2010
Euro Area CISS
−4−3−2−101
1980 1990 2000 2010
Bloomberg EU FCI
−1–0.5
00.51
1980 1990 2000 2010
Bank of Canada FCI
−5
0
5
10
1980 1990 2000 2010
Canada IMF FSI
−4−20246
1980 1990 2000 2010
Germany IMF FSI
0.20.40.60.81
1980 1990 2000 2010
Greece FSI
−5
0
5
10
1980 1990 2000 2010
France IMF FSI
1980 1990 2000 2010
UK IMF FSI
1980 1990 2000 2010
Italy IMF FSI
−5051015
1980 1990 2000 2010
Korea IMF FSI
−4−20246
1980 1990 2000 2010
Japan IMF FSI
1980 1990 2000 2010
Sweden IMF FSI
80
100
120
140
1980 1990 2000 2010
Sweden FCI
−4−20246
−5
0
5
10
−4−20246
Figure 3
International Financial Indexes
(IMFFSI).10 Then we perform some simple forecasting experiments designed to determinewhether the stress indexes predict growth.
Correlations
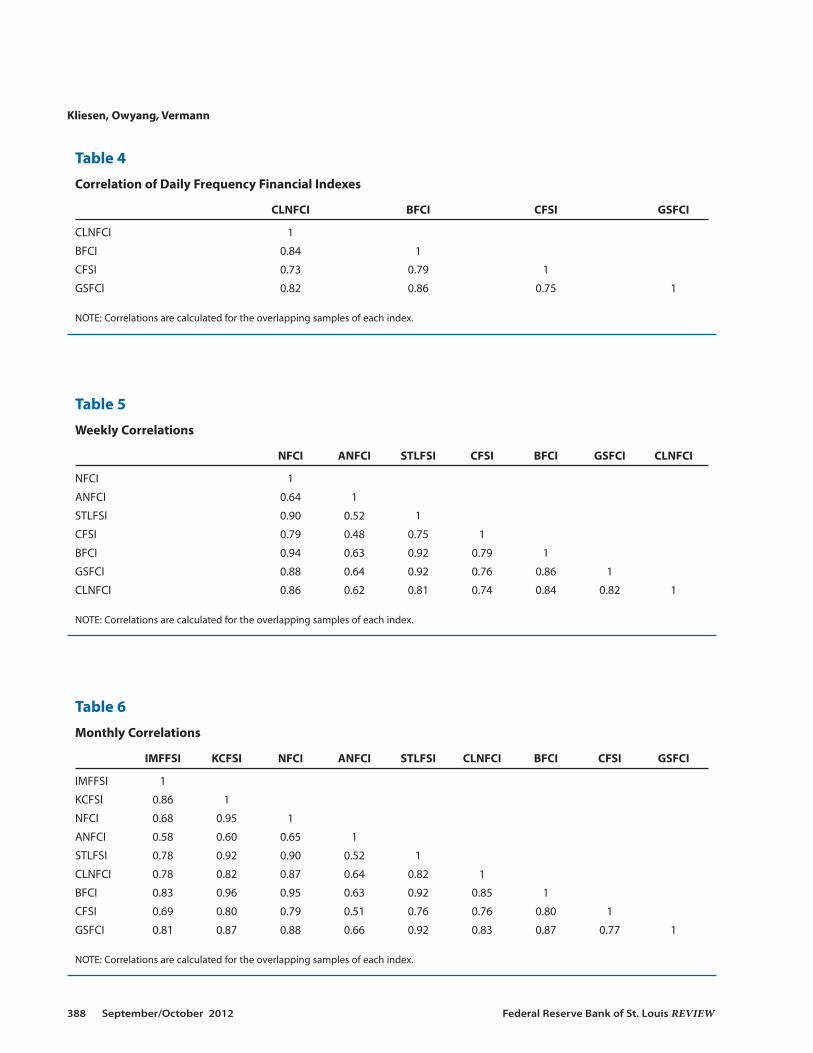
Although various researchers’ definitions of financial stress differ, the indexes are, for themost part, intended to measure the same thing: the degree of financial instability reflected ineconomic and financial market variables. Thus, we expect to find that various FSIs are highly,but not exactly, correlated. Tables 4, 5, and 6 indicate that FSIs are no more correlated with eachother than with FCIs. Regardless, if shocks hitting the financial markets are also propagated tothe macroeconomy, then FSIs and FCIs would also be expected to have a high degree of correla-tion. Tables 4 through 6 show the correlations among the different indexes in the United Statesat various frequencies. Higher-frequency indexes are matched with lower-frequency ones bysimple averaging.
Our hypothesis that the various indexes would not be exactly correlated is verified; thisoccurs because the different indexes, while intended to measure stress in general, emphasizedifferent components of financial markets. Still, the overlap in the input data is substantial andmakes the indexes highly correlated (typically over 0.7). Table 5 also indicates that the ANFCItends to have the smallest correlation with the other eight indexes.
The correlations in Tables 4 through 6 are computed over the entire time sample. The FSIs,however, are designed to indicate when financial market instability is high. Thus, high correla-tion when markets are performing well may be misleading. On the other hand, low correlationduring these same “safe” periods may not be troublesome if the FSIs do move together in timesof stress.
Kliesen, Owyang, Vermann
Federal Reserve Bank of St. Louis REVIEW September/October 2012 387
y = –3.43 + 2.06R2 = 0.52
–20
–15
–10
–5
0
5
10
–2 –1 0 1 2 3 4 5 ,6
Growth of Industrial Production (percent)
St. Louis Financial Stress Index
Figure 4
Inverse Relationship between Financial Stress and Economic Activity
Kliesen, Owyang, Vermann
388 September/October 2012 Federal Reserve Bank of St. Louis REVIEW
Table 4
Correlation of Daily Frequency Financial Indexes
CLNFCI BFCI CFSI GSFCI
CLNFCI 1
BFCI 0.84 1
CFSI 0.73 0.79 1
GSFCI 0.82 0.86 0.75 1
NOTE: Correlations are calculated for the overlapping samples of each index.
Table 5
Weekly Correlations
NFCI ANFCI STLFSI CFSI BFCI GSFCI CLNFCI
NFCI 1
ANFCI 0.64 1
STLFSI 0.90 0.52 1
CFSI 0.79 0.48 0.75 1
BFCI 0.94 0.63 0.92 0.79 1
GSFCI 0.88 0.64 0.92 0.76 0.86 1
CLNFCI 0.86 0.62 0.81 0.74 0.84 0.82 1
NOTE: Correlations are calculated for the overlapping samples of each index.
Table 6
Monthly Correlations
IMFFSI KCFSI NFCI ANFCI STLFSI CLNFCI BFCI CFSI GSFCI
IMFFSI 1
KCFSI 0.86 1
NFCI 0.68 0.95 1
ANFCI 0.58 0.60 0.65 1
STLFSI 0.78 0.92 0.90 0.52 1
CLNFCI 0.78 0.82 0.87 0.64 0.82 1
BFCI 0.83 0.96 0.95 0.63 0.92 0.85 1
CFSI 0.69 0.80 0.79 0.51 0.76 0.76 0.80 1
GSFCI 0.81 0.87 0.88 0.66 0.92 0.83 0.87 0.77 1
NOTE: Correlations are calculated for the overlapping samples of each index.
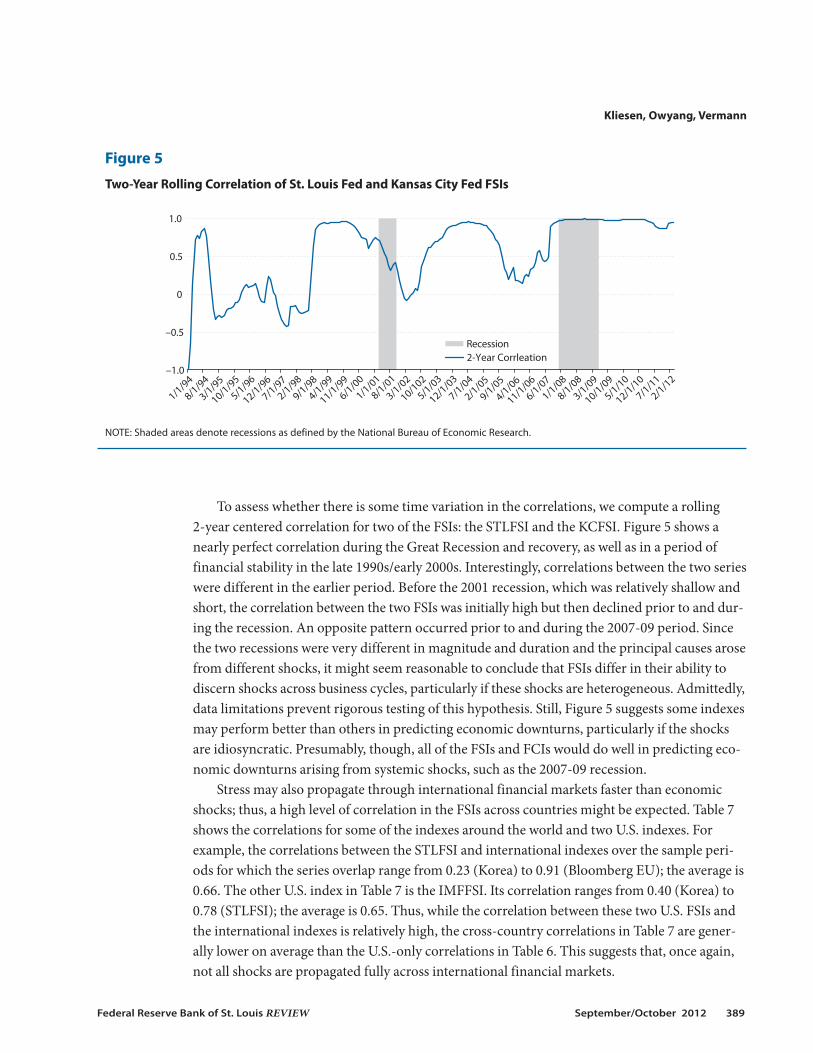
To assess whether there is some time variation in the correlations, we compute a rolling 2-year centered correlation for two of the FSIs: the STLFSI and the KCFSI. Figure 5 shows anearly perfect correlation during the Great Recession and recovery, as well as in a period offinancial stability in the late 1990s/early 2000s. Interestingly, correlations between the two serieswere different in the earlier period. Before the 2001 recession, which was relatively shallow andshort, the correlation between the two FSIs was initially high but then declined prior to and dur-ing the recession. An opposite pattern occurred prior to and during the 2007-09 period. Sincethe two recessions were very different in magnitude and duration and the principal causes arosefrom different shocks, it might seem reasonable to conclude that FSIs differ in their ability todiscern shocks across business cycles, particularly if these shocks are heterogeneous. Admit tedly,data limitations prevent rigorous testing of this hypothesis. Still, Figure 5 suggests some indexesmay perform better than others in predicting economic downturns, particularly if the shocksare idiosyncratic. Presumably, though, all of the FSIs and FCIs would do well in predicting eco-nomic downturns arising from systemic shocks, such as the 2007-09 recession.
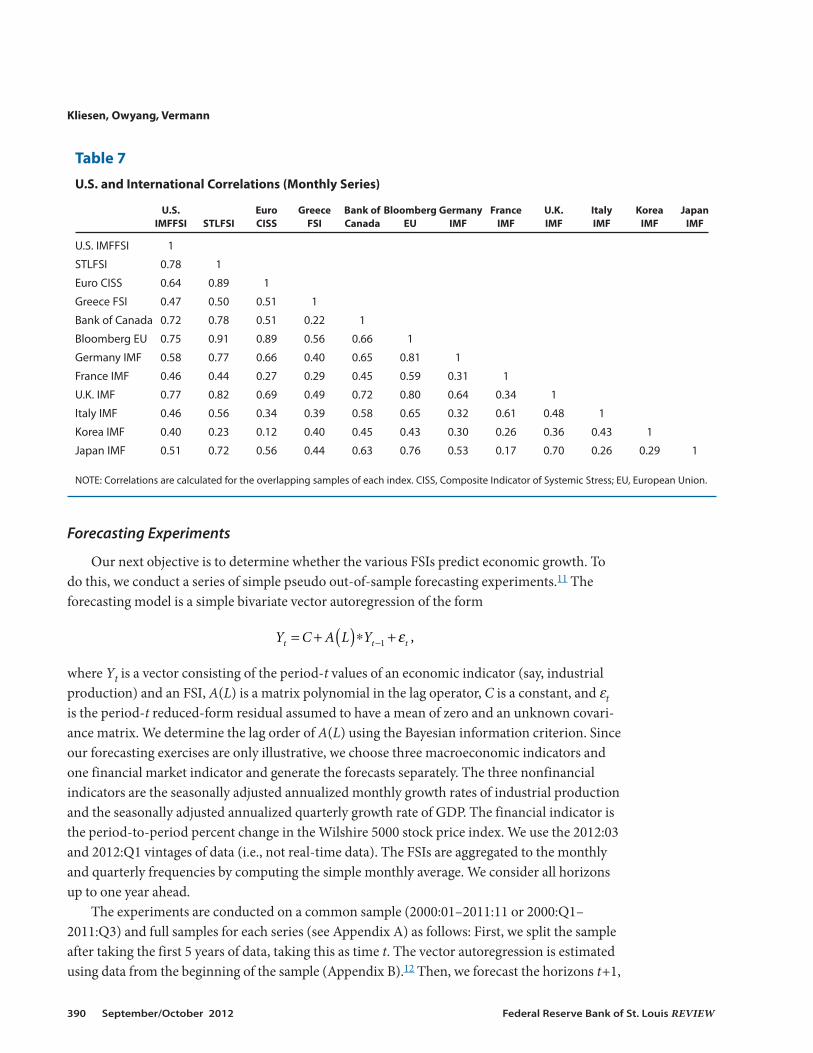
Stress may also propagate through international financial markets faster than economicshocks; thus, a high level of correlation in the FSIs across countries might be expected. Table 7shows the correlations for some of the indexes around the world and two U.S. indexes. Forexample, the correlations between the STLFSI and international indexes over the sample peri-ods for which the series overlap range from 0.23 (Korea) to 0.91 (Bloomberg EU); the average is0.66. The other U.S. index in Table 7 is the IMFFSI. Its correlation ranges from 0.40 (Korea) to0.78 (STLFSI); the average is 0.65. Thus, while the correlation between these two U.S. FSIs andthe international indexes is relatively high, the cross-country correlations in Table 7 are gener-ally lower on average than the U.S.-only correlations in Table 6. This suggests that, once again,not all shocks are propagated fully across international financial markets.
Kliesen, Owyang, Vermann
Federal Reserve Bank of St. Louis REVIEW September/October 2012 389
–1.0
–0.5
0
0.5
1.0
1/1/9
4
8/1/9
4
3/1/9
5
10/1/9
5
5/1/9
6
12/1/9
6
7/1/9
7
2/1/9
8
9/1/9
8
4/1/9
9
11/1/9
9
6/1/0
0
1/1/0
1
8/1/0
1
3/1/0
2
10/102
5/1/0
3
12/1/0
3
7/1/0
4
2/1/0
5
9/1/0
5
4/1/0
6
11/1/0
6
6/1/0
7
1/1/0
8
8/1/0
8
3/1/0
9
10/1/0
9
5/1/1
0
12/1/1
0
7/1/1
1
2/1/1
2
Recession2-Year Corrleation
Figure 5
Two-Year Rolling Correlation of St. Louis Fed and Kansas City Fed FSIs
NOTE: Shaded areas denote recessions as defined by the National Bureau of Economic Research.
Forecasting Experiments
Our next objective is to determine whether the various FSIs predict economic growth. Todo this, we conduct a series of simple pseudo out-of-sample forecasting experiments.11 Theforecasting model is a simple bivariate vector autoregression of the form
where Yt is a vector consisting of the period-t values of an economic indicator (say, industrialproduction) and an FSI, A(L) is a matrix polynomial in the lag operator, C is a constant, and εtis the period-t reduced-form residual assumed to have a mean of zero and an unknown covari-ance matrix. We determine the lag order of A(L) using the Bayesian information criterion. Sinceour forecasting exercises are only illustrative, we choose three macroeconomic indicators andone financial market indicator and generate the forecasts separately. The three nonfinancialindicators are the seasonally adjusted annualized monthly growth rates of industrial productionand the seasonally adjusted annualized quarterly growth rate of GDP. The financial indicator isthe period-to-period percent change in the Wilshire 5000 stock price index. We use the 2012:03and 2012:Q1 vintages of data (i.e., not real-time data). The FSIs are aggregated to the monthlyand quarterly frequencies by computing the simple monthly average. We consider all horizonsup to one year ahead.
The experiments are conducted on a common sample (2000:01–2011:11 or 2000:Q1–2011:Q3) and full samples for each series (see Appendix A) as follows: First, we split the sampleafter taking the first 5 years of data, taking this as time t. The vector autoregression is estimatedusing data from the beginning of the sample (Appendix B).12 Then, we forecast the horizons t+1,
Y C A L Yt t t= + ( )∗ +−1 ε ,
Kliesen, Owyang, Vermann
390 September/October 2012 Federal Reserve Bank of St. Louis REVIEW
Table 7
U.S. and International Correlations (Monthly Series)
U.S. Euro Greece Bank of Bloomberg Germany France U.K. Italy Korea Japan IMFFSI STLFSI CISS FSI Canada EU IMF IMF IMF IMF IMF IMF
U.S. IMFFSI 1
STLFSI 0.78 1
Euro CISS 0.64 0.89 1
Greece FSI 0.47 0.50 0.51 1
Bank of Canada 0.72 0.78 0.51 0.22 1
Bloomberg EU 0.75 0.91 0.89 0.56 0.66 1
Germany IMF 0.58 0.77 0.66 0.40 0.65 0.81 1
France IMF 0.46 0.44 0.27 0.29 0.45 0.59 0.31 1
U.K. IMF 0.77 0.82 0.69 0.49 0.72 0.80 0.64 0.34 1
Italy IMF 0.46 0.56 0.34 0.39 0.58 0.65 0.32 0.61 0.48 1
Korea IMF 0.40 0.23 0.12 0.40 0.45 0.43 0.30 0.26 0.36 0.43 1
Japan IMF 0.51 0.72 0.56 0.44 0.63 0.76 0.53 0.17 0.70 0.26 0.29 1
NOTE: Correlations are calculated for the overlapping samples of each index. CISS, Composite Indicator of Systemic Stress; EU, European Union.
t+2, …, t+12 for monthly industrial production and the Wilshire 5000 and the horizons t+1,t+2, …, t+4 for quarterly GDP. Then, we add the next observation of both the economic indica-tor and the FSI, repeating the estimation and the forecast. Finally, we compute the forecasterrors by comparing the forecasts at the different horizons with the realized values.
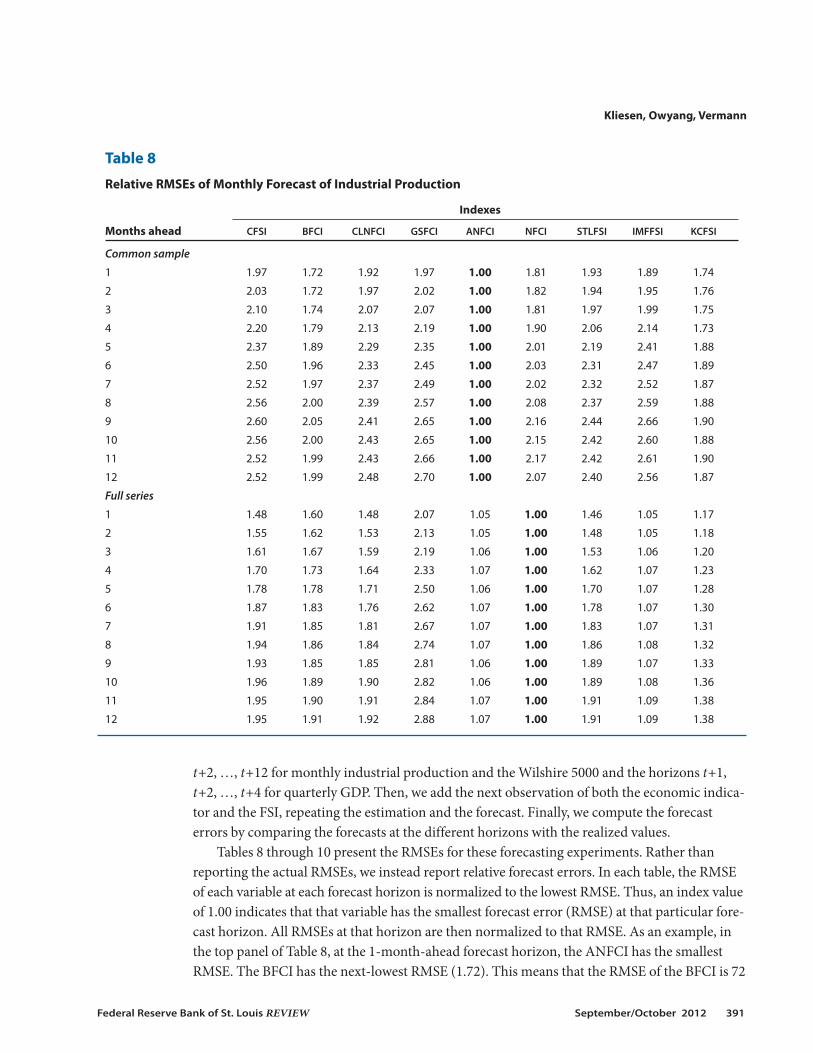
Tables 8 through 10 present the RMSEs for these forecasting experiments. Rather thanreporting the actual RMSEs, we instead report relative forecast errors. In each table, the RMSEof each variable at each forecast horizon is normalized to the lowest RMSE. Thus, an index valueof 1.00 indicates that that variable has the smallest forecast error (RMSE) at that particular fore-cast horizon. All RMSEs at that horizon are then normalized to that RMSE. As an example, inthe top panel of Table 8, at the 1-month-ahead forecast horizon, the ANFCI has the smallestRMSE. The BFCI has the next-lowest RMSE (1.72). This means that the RMSE of the BFCI is 72
Kliesen, Owyang, Vermann
Federal Reserve Bank of St. Louis REVIEW September/October 2012 391
Table 8
Relative RMSEs of Monthly Forecast of Industrial Production
Indexes
Months ahead CFSI BFCI CLNFCI GSFCI ANFCI NFCI STLFSI IMFFSI KCFSI
Common sample
1 1.97 1.72 1.92 1.97 1.00 1.81 1.93 1.89 1.74
2 2.03 1.72 1.97 2.02 1.00 1.82 1.94 1.95 1.76
3 2.10 1.74 2.07 2.07 1.00 1.81 1.97 1.99 1.75
4 2.20 1.79 2.13 2.19 1.00 1.90 2.06 2.14 1.73
5 2.37 1.89 2.29 2.35 1.00 2.01 2.19 2.41 1.88
6 2.50 1.96 2.33 2.45 1.00 2.03 2.31 2.47 1.89
7 2.52 1.97 2.37 2.49 1.00 2.02 2.32 2.52 1.87
8 2.56 2.00 2.39 2.57 1.00 2.08 2.37 2.59 1.88
9 2.60 2.05 2.41 2.65 1.00 2.16 2.44 2.66 1.90
10 2.56 2.00 2.43 2.65 1.00 2.15 2.42 2.60 1.88
11 2.52 1.99 2.43 2.66 1.00 2.17 2.42 2.61 1.90
12 2.52 1.99 2.48 2.70 1.00 2.07 2.40 2.56 1.87
Full series
1 1.48 1.60 1.48 2.07 1.05 1.00 1.46 1.05 1.17
2 1.55 1.62 1.53 2.13 1.05 1.00 1.48 1.05 1.18
3 1.61 1.67 1.59 2.19 1.06 1.00 1.53 1.06 1.20
4 1.70 1.73 1.64 2.33 1.07 1.00 1.62 1.07 1.23
5 1.78 1.78 1.71 2.50 1.06 1.00 1.70 1.07 1.28
6 1.87 1.83 1.76 2.62 1.07 1.00 1.78 1.07 1.30
7 1.91 1.85 1.81 2.67 1.07 1.00 1.83 1.07 1.31
8 1.94 1.86 1.84 2.74 1.07 1.00 1.86 1.08 1.32
9 1.93 1.85 1.85 2.81 1.06 1.00 1.89 1.07 1.33
10 1.96 1.89 1.90 2.82 1.06 1.00 1.89 1.08 1.36
11 1.95 1.90 1.91 2.84 1.07 1.00 1.91 1.09 1.38
12 1.95 1.91 1.92 2.88 1.07 1.00 1.91 1.09 1.38
percent larger than the AFFCI at this horizon.13 Thus, if the actual RMSE of the ANFCI were1.5 percent, then the forecast error of the BFCI would be 2.6 percent.
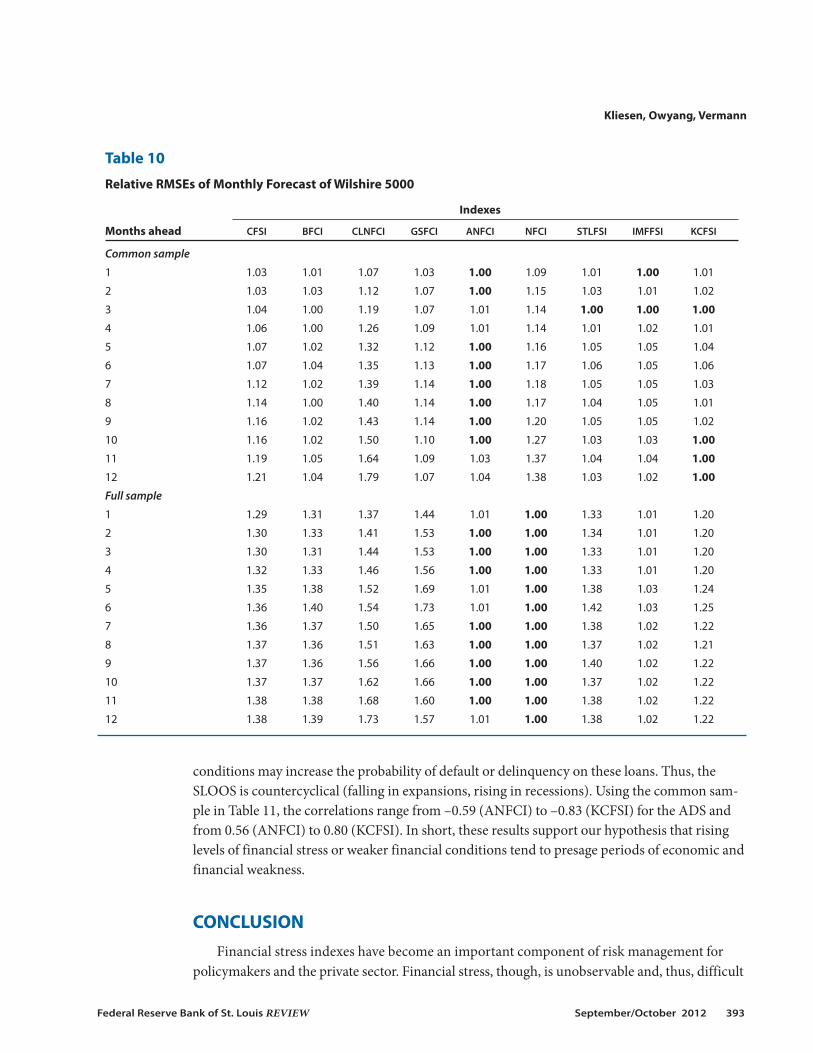
In general, there is little variation in the forecasting ability of the different indexes. As mightbe expected, the FCIs forecast the macroeconomic indicators better than the FSIs. This could bebecause the FCIs have a longer sample period than the FSIs and, moreover, have a broader cov-erage of data designed to predict macro fluctuations, whereas the FSIs are aimed primarily atpredicting financial outcomes. Over the common sample, however, the FSIs and FCIs appear toforecast GDP growth equally well. When examining forecasts of changes in the Wilshire 5000,the NFCI, ANFCI, and IMFFSI have the smallest errors (though the NFCI and ANFCI containthe Wilshire 5000) for the full sample. Over the common sample, though, the STLFSI performswell. Regardless of the length of each forecast sample, the FSIs tend to outperform the FCIs inthese forecasts.
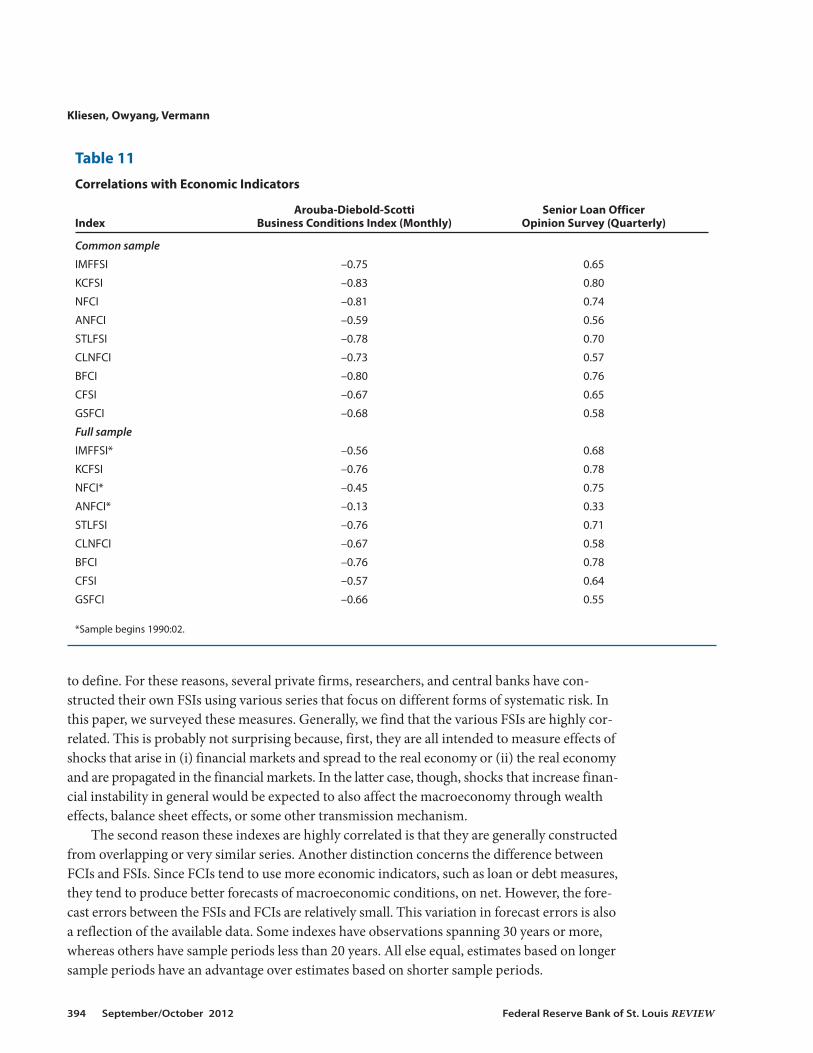
As a final robustness check, we compute correlations among the FSIs and FCIs in Table 2with two additional variables (Table 11). The first variable is the Arouba-Diebold-Scotti BusinessConditions Index (ADS). The ADS is a mixed-frequency index intended to measure the state ofthe economy relative to its trend, or steady-state, growth. The second variable is the Senior LoanOfficer Opinion Survey (SLOOS) of terms and conditions on commercial and industrial (C&I)loans at all commercial banks. The SLOOS is intended to measure how shocks affect the willing-ness of banks to extend C&I loans. A rise in the SLOOS index thus indicates that banks aretightening the terms and conditions on C&I loans to firms. The banks’ willingness to lend isreflected in the price of the loan (interest rate) and the terms of the loan (for example, maturityand collateral requirements). Both measures are widely used indicators of macroeconomic andfinancial conditions.
Table 11 indicates that the FSIs and FCIs tend to be highly correlated with the ADS andSLOOS and are of the expected sign. Thus, when an FSI rises, the ADS tends to fall (weakergrowth relative to trend) and banks tend to tighten terms and conditions on C&I loans. Thelatter is often taken as a sign that banks perceive that emerging macroeconomic and financial
Kliesen, Owyang, Vermann
392 September/October 2012 Federal Reserve Bank of St. Louis REVIEW
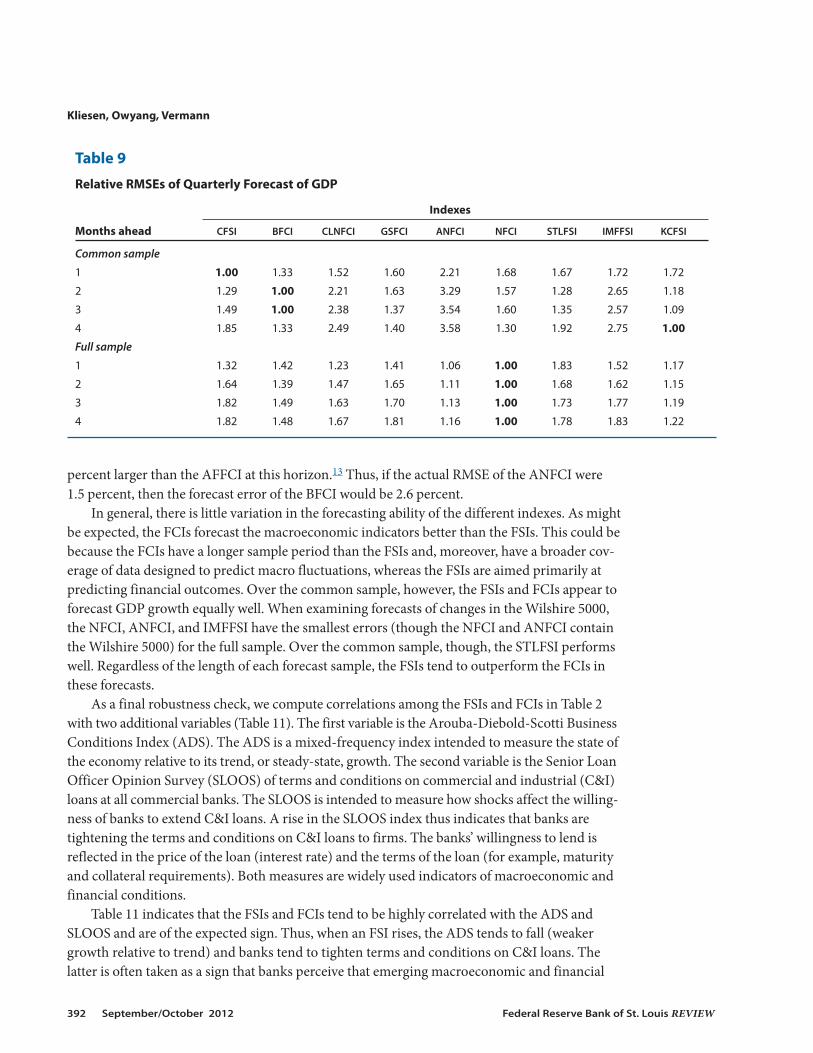
Table 9
Relative RMSEs of Quarterly Forecast of GDP
Indexes
Months ahead CFSI BFCI CLNFCI GSFCI ANFCI NFCI STLFSI IMFFSI KCFSI
Common sample
1 1.00 1.33 1.52 1.60 2.21 1.68 1.67 1.72 1.72
2 1.29 1.00 2.21 1.63 3.29 1.57 1.28 2.65 1.18
3 1.49 1.00 2.38 1.37 3.54 1.60 1.35 2.57 1.09
4 1.85 1.33 2.49 1.40 3.58 1.30 1.92 2.75 1.00
Full sample
1 1.32 1.42 1.23 1.41 1.06 1.00 1.83 1.52 1.17
2 1.64 1.39 1.47 1.65 1.11 1.00 1.68 1.62 1.15
3 1.82 1.49 1.63 1.70 1.13 1.00 1.73 1.77 1.19
4 1.82 1.48 1.67 1.81 1.16 1.00 1.78 1.83 1.22
conditions may increase the probability of default or delinquency on these loans. Thus, theSLOOS is countercyclical (falling in expansions, rising in recessions). Using the common sam-ple in Table 11, the correlations range from –0.59 (ANFCI) to –0.83 (KCFSI) for the ADS andfrom 0.56 (ANFCI) to 0.80 (KCFSI). In short, these results support our hypothesis that risinglevels of financial stress or weaker financial conditions tend to presage periods of economic andfinancial weakness.
CONCLUSIONFinancial stress indexes have become an important component of risk management for
policymakers and the private sector. Financial stress, though, is unobservable and, thus, difficult
Kliesen, Owyang, Vermann
Federal Reserve Bank of St. Louis REVIEW September/October 2012 393
Table 10
Relative RMSEs of Monthly Forecast of Wilshire 5000
Indexes
Months ahead CFSI BFCI CLNFCI GSFCI ANFCI NFCI STLFSI IMFFSI KCFSI
Common sample
1 1.03 1.01 1.07 1.03 1.00 1.09 1.01 1.00 1.01
2 1.03 1.03 1.12 1.07 1.00 1.15 1.03 1.01 1.02
3 1.04 1.00 1.19 1.07 1.01 1.14 1.00 1.00 1.00
4 1.06 1.00 1.26 1.09 1.01 1.14 1.01 1.02 1.01
5 1.07 1.02 1.32 1.12 1.00 1.16 1.05 1.05 1.04
6 1.07 1.04 1.35 1.13 1.00 1.17 1.06 1.05 1.06
7 1.12 1.02 1.39 1.14 1.00 1.18 1.05 1.05 1.03
8 1.14 1.00 1.40 1.14 1.00 1.17 1.04 1.05 1.01
9 1.16 1.02 1.43 1.14 1.00 1.20 1.05 1.05 1.02
10 1.16 1.02 1.50 1.10 1.00 1.27 1.03 1.03 1.00
11 1.19 1.05 1.64 1.09 1.03 1.37 1.04 1.04 1.00
12 1.21 1.04 1.79 1.07 1.04 1.38 1.03 1.02 1.00
Full sample
1 1.29 1.31 1.37 1.44 1.01 1.00 1.33 1.01 1.20
2 1.30 1.33 1.41 1.53 1.00 1.00 1.34 1.01 1.20
3 1.30 1.31 1.44 1.53 1.00 1.00 1.33 1.01 1.20
4 1.32 1.33 1.46 1.56 1.00 1.00 1.33 1.01 1.20
5 1.35 1.38 1.52 1.69 1.01 1.00 1.38 1.03 1.24
6 1.36 1.40 1.54 1.73 1.01 1.00 1.42 1.03 1.25
7 1.36 1.37 1.50 1.65 1.00 1.00 1.38 1.02 1.22
8 1.37 1.36 1.51 1.63 1.00 1.00 1.37 1.02 1.21
9 1.37 1.36 1.56 1.66 1.00 1.00 1.40 1.02 1.22
10 1.37 1.37 1.62 1.66 1.00 1.00 1.37 1.02 1.22
11 1.38 1.38 1.68 1.60 1.00 1.00 1.38 1.02 1.22
12 1.38 1.39 1.73 1.57 1.01 1.00 1.38 1.02 1.22
to define. For these reasons, several private firms, researchers, and central banks have con-structed their own FSIs using various series that focus on different forms of systematic risk. Inthis paper, we surveyed these measures. Generally, we find that the various FSIs are highly cor-related. This is probably not surprising because, first, they are all intended to measure effects ofshocks that arise in (i) financial markets and spread to the real economy or (ii) the real economyand are propagated in the financial markets. In the latter case, though, shocks that increase finan-cial instability in general would be expected to also affect the macroeconomy through wealtheffects, balance sheet effects, or some other transmission mechanism.
The second reason these indexes are highly correlated is that they are generally constructedfrom overlapping or very similar series. Another distinction concerns the difference betweenFCIs and FSIs. Since FCIs tend to use more economic indicators, such as loan or debt measures,they tend to produce better forecasts of macroeconomic conditions, on net. However, the fore-cast errors between the FSIs and FCIs are relatively small. This variation in forecast errors is alsoa reflection of the available data. Some indexes have observations spanning 30 years or more,whereas others have sample periods less than 20 years. All else equal, estimates based on longersample periods have an advantage over estimates based on shorter sample periods.
Kliesen, Owyang, Vermann
394 September/October 2012 Federal Reserve Bank of St. Louis REVIEW
Table 11
Correlations with Economic Indicators
Arouba-Diebold-Scotti Senior Loan Officer Index Business Conditions Index (Monthly) Opinion Survey (Quarterly)
Common sample
IMFFSI –0.75 0.65
KCFSI –0.83 0.80
NFCI –0.81 0.74
ANFCI –0.59 0.56
STLFSI –0.78 0.70
CLNFCI –0.73 0.57
BFCI –0.80 0.76
CFSI –0.67 0.65
GSFCI –0.68 0.58
Full sample
IMFFSI* –0.56 0.68
KCFSI –0.76 0.78
NFCI* –0.45 0.75
ANFCI* –0.13 0.33
STLFSI –0.76 0.71
CLNFCI –0.67 0.58
BFCI –0.76 0.78
CFSI –0.57 0.64
GSFCI –0.66 0.55
*Sample begins 1990:02.
NOTES1 Several other events around this period also contributed to the rise of financial market instability. For example, seethe Federal Reserve Bank of St. Louis Financial Crisis Timeline (http://timeline.stlouisfed.org/).
2 See Kindleberger and Aliber (2005) or Reinhart and Rogoff (2008).
3 One can view this through the lens of the dividend discount model, which posits that the current stock pricedepends on the current dividend and the assumed growth rate of future dividends relative to the investor’s requiredreturn on equities.
4 Some indicators use sophisticated statistical techniques to derive an indicator from mixed-frequency data (for exam-ple, combining weekly and monthly data).
5 As described later, principal component analysis (PCA) strives to find a common factor that statistically links—forlack of a better term—each of the series used to construct the FSI or FCI. Some FSIs, such as the STLFSI, use the firstPC as the index. Unbalanced panels are datasets that begin and/or end on different dates.
6 An on-the-run Treasury security is the most recently issued security traded in the secondary market. A securitybecomes off-the-run if it is replaced with a newly issued security of the same initial maturity. Most FSIs use yields ofon-the-run Treasury securities to calculate credit risk and term premiums.
7 Swaptions are options granting their owners the right but not the obligation to enter into an underlying swap.
8 PCA uses an orthogonal transformation to convert a set of observations of potentially correlated variables into a setof values of uncorrelated variables. In other words, the PCs that are constructed (there are more than one) areassumed to be uncorrelated (orthogonal). For each PC, the analysis determines a (weighted) linear combination ofthe variables that maximizes the percentage of the total variance of each series. The first PC explains the largest per-centage of the variance, the second PC the next most, and so on.
9 Technically, they construct CDFs for each of the 11 series used to construct the FSI. The flow of funds sector shares(weights) are then used to aggregate the 11 CDFs.
10 The NFCI assumes that economic and financial conditions are correlated. The difference between the NFCI and theANFCI is that the latter is an isolated measure of financial conditions that are assumed to be uncorrelated with eco-nomic conditions. The BFCI values were multiplied by –1 for clearer comparisons with the other indexes examined.Without this change, negative values would indicate periods of high stress.
11 A pseudo out-of-sample forecast uses the sample period that includes the actual data. By contrast, a normal out-of-sample forecast predicts data for variables beyond the actual sample period.
12 For full-sample estimates, this date is the first date that the FSI examined is available. For the common sample, thisdate is 2000:01 or 2000:Q1.
13 We do not test whether these differences are statistically significant.
REFERENCESAbdymomunov, Azamat. “Regime-Switching Measure of Systemic Financial Stress.” Annals of Finance, Online First,March 20, 2012; www.springerlink.com/content/r2n161581366mg54/fulltext.pdf.
Brave, Scott and Butters, R. Andrew. “Monitoring Financial Stability: A Financial Conditions Approach.” Federal ReserveBank of Chicago Economic Perspectives, First Quarter 2011, 35(1), pp. 22-43;http://qa.chicagofed.org/digital_assets/publications/economic_perspectives/2011/1qtr2011_part2_brave_butters.pdf.
Brave, Scott and Butters, R. Andrew. “Diagnosing the Financial System: Financial Conditions and Financial Stress.”International Journal of Central Banking, June 2012, pp. 191-239.
Cardarelli, Roberto; Elekdag, Selim and Subir, Lall. “Financial Stress and Economic Contractions.” Journal of FinancialStability, June 2011, 7(2), pp. 78-97.
Carlson, Mark; Lewis, Kurt and Nelson, William. “Using Policy Intervention to Identify Financial Stress.” Finance andEconomics Discussion Series No. 2012-02, Board of Governors of the Federal Reserve System, 2012; www.federalreserve.gov/pubs/feds/2012/201202/201202pap.pdf.
Kliesen, Owyang, Vermann
Federal Reserve Bank of St. Louis REVIEW September/October 2012 395
Danninger, Stephan; Balakrishnan, Ravi; Elekdag, Selim and Tytell, Irina. “How Linkages Fuel the Fire: The Transmissionof Financial Stress from Advanced to Emerging Economies,” in World Economic Outlook: Crisis and Recovery. Chap. 4.Washington, DC: International Monetary Fund, 2009, pp. 139-75;www.imf.org/external/pubs/ft/weo/2009/01/pdf/c4.pdf.
Dudley, William and Hatzius, Jan. “The Goldman Sachs Financial Conditions Index: The Right Tool for a New MonetaryPolicy Regime.” Goldman Sachs Global Economics Paper No. 44, 2000.
Grimaldi, Marianna B. “Detecting and Interpreting Financial Stress in the Euro Area.” ECB Working Paper Series No.1214, European Central Bank, June 2010; www.ecb.europa.eu/pub/pdf/scpwps/ecbwp1214.pdf.
Grimaldi, Marianna B. “Up for Count? Central Bank Words and Financial Stress.” Sveriges Riksbank Working Paper Series252, April 2011, www.riksbank.se/upload/Dokument_riksbank/Kat_publicerat/WorkingPapers/2011/wp252.pdf.
Hakkio, Craig S. and Keeton, William R. “Financial Stress: What Is It, How Can It Be Measured, and Why Does It Matter?”Federal Reserve Bank of Kansas City Economic Review, Second Quarter 2009, 94(2), pp. 5-50;www.kansascityfed.org/PUBLICAT/ECONREV/pdf/09q2hakkio_keeton.pdf.
Hanschel, Elke and Monnin, Pierre. “Measuring and Forecasting Stress in the Banking Sector: Evidence fromSwitzerland.” BIS Paper No. 22, Bank for International Settlements, April 1, 2005; www.bis.org/publ/bppdf/bispap22a.pdf.
Hansen, Jakob L. “A Risk Index for Euro-Denominated Assets.” National Bank of Denmark Working Paper No. 36/2006,May 2006;www.nationalbanken.dk/C1256BE9004F6416/side/B9B35A3789FC790BC125716800455576/$file/WP_36_2006.pdf.
Hatzius, Jan; Hooper, Peter; Mishkin, Frederic; Schoenholtz, Kermit L. and Watson, Mark W. “Financial ConditionsIndexes: A Fresh Look after the Financial Crisis.” Presented at the U.S. Monetary Policy Forum, New York, February 26,2010; http://research.chicagobooth.edu/igm/events/docs/2010usmpfreport.pdf.
Hollo, Daniel; Kremer, Manfred and Lo Duca, Marco. “CISS—A Composite Indicator of Systemic Stress in the FinancialSystem.” ECB Working Paper Series No. 1426, March 2012; www.ecb.int/pub/pdf/scpwps/ecbwp1426.pdf.
Illing, Mark and Liu, Ying. “Measuring Financial Stress in a Developed Country: An Application to Canada.” Journal ofFinancial Stability, October 2006, 2(3), pp. 243-65.
Kindleberger, Charles P. and Aliber, Robert. Manias, Panics, and Crashes: A History of Financial Crises. Fifth Edition.Hoboken, NJ: John Wiley & Sons, 2005.
Kliesen, Kevin L. and Smith, Douglas C. “Measuring Financial Market Stress.” Federal Reserve Bank of St. Louis NationalEconomic Trends, January 2010; http://research.stlouisfed.org/publications/net/20100101/cover.pdf.
Lo Duca, Marco and Peltonen, Tuomas A. “Macro-Financial Vulnerabilities and Future Financial Stress: AssessingSystemic Risks and Predicting Systemic Events.” ECB Working Paper Series No. 1311, European Central Bank, March2011; www.ecb.int/pub/pdf/scpwps/ecbwp1311.pdf.
Louzis, Dimitrios P. and Vouldis, Angelos T. “A Financial Systemic Stress Index for Greece.” Presented at the FirstConference of the Macro-prudential Research (MaRs) network of the European System of Central Banks in Frankfurtam Main, October 2011;www.ecb.int/events/conferences/shared/pdf/net_mar/Session5_Paper1_Louzis_Vouldis.pdf?0a69933005a20424128db8ebdf6310c7.
Macroeconomic Advisers. “A Combined Monetary, Financial, and Fiscal Conditions Index.” Technical Notes, December 4,2003; www.macroadvisers.com/content/Monetary,%20Financial,%20and%20Fiscal%20Conditions%20Index.pdf.
Morales, Miguel and Estrada, Dairo. “A Financial Stability Index for Colombia.” Annals of Finance, October 2010, 6(4),pp. 555-81.
Nelson, William R. and Perli, Roberto. “Selected Indicators of Financial Stability,” in Risk Management and Systemic Risk.Frankfurt, Germany: European Central Bank, 2007, pp. 343-72; www.ecb.int/pub/pdf/other/riskmeasurementandsystemicrisk200704en.pdf.
Oet, Mikhail V.; Eiben, Ryan; Bianco, Timothy; Gramlich, Dieter and Ong, Stephen J. “The Financial Stress Index:Identification of System Risk Conditions.” Working Paper No. 1130, Federal Reserve Bank of Cleveland, November2011, www.clevelandfed.org/research/workpaper/2011/wp1130.pdf.
Kliesen, Owyang, Vermann
396 September/October 2012 Federal Reserve Bank of St. Louis REVIEW
Reinhart, Carmen and Rogoff, Kenneth. This Time Is Different: Eight Centuries of Financial Folly. Princeton, NJ: PrincetonUniversity Press, 2009.
Rosenberg, Michael. Financial Conditions Watch, Global Financial Market Trends and Policy. Bloomberg LLP, September 11,2009. www.ssc.wisc.edu/~mchinn/fcw_sep112009.pdf.
Sandahl, Johannes F.; Holmfeldt, Mia; Rydén, Anders and Strömqvist, Maria. “An Index of Financial Stress for Sweden.”Sveriges Riksbank Economic Review, July 10, 2011, 2011(2), pp. 49-67;www.riksbank.se/Upload/Rapporter/2011/POV_2/er_2011_2_forsssandahl_holmfeldt_ryden_stromqvist.pdf.
Yiu, Matthew S.; Ho, Wai.-Yip Alex and Jin, Lu. “A Measure of Financial Stress in Hong Kong Financial Market: TheFinancial Stress Index.” Hong Kong Monetary Authority Research Note No. 02/2010, March 3, 2010;www.hkma.gov.hk/media/eng/publication-and-research/research/research-notes/RN-02-2010.pdf.
Kliesen, Owyang, Vermann
Federal Reserve Bank of St. Louis REVIEW September/October 2012 397
APPENDIX A
Start Dates for Full Series
Index Start Date (Month/Year)
CFSI 1/1994
BFCI 1/1994
CLNFCI 6/1994
GSFCI 1/2000
ANFCI 1/1979
NFCI 1/1979
STLFSI 12/1993
IMFFSI 12/1980
KCFSI 2/1990
APPENDIX B
Lag Lengths for Forecasts*
Dependent variable
Index IP GDP Wilshire
CFSI 2 2 1
BFCI 2 2 1
CLNFCI 1 2 1
GSFCI 2 2 2
ANFCI 3 2 1
NFCI 3 2 2
STLFSI 2 2 1
IMFFSI 3 3 1
KCFSI 4 2 1
*Industrial production (IP) and Wilshire lag lengths are months;GDP lag lengths are quarters.

398 September/October 2012 Federal Reserve Bank of St. Louis REVIEW

Close
Research FocusMichael Owyang’s main areas of research are in Bayesian econometrics, time-series econometrics, and forecasting.
Michael T. OwyangResearch officer and economist, Federal Reserve Bank of St. Louis
http://research.stlouisfed.org/econ/owyang/
E. Katarina VermannResearch associate, Federal Reserve Bank of St. Louis
Research FocusE. Katarina Vermann currently assists economists Michael Owyang and Subhayu Bandyopadhyay with theirresearch. Her research interests also include labor, health, and urban economics with a focus on public policy.
Research FocusKevin Kliesen’s research focuses on the analysis of macroeconomic conditions, the effects of energy prices onthe economy, labor productivity, and fiscal policy; he also provides reports on economic and business conditionsto assist the Bank president and Board of Directors.
Kevin L. KliesenResearch officer and economist, Federal Reserve Bank of St. Louis
http://research.stlouisfed.org/econ/kliesen/