Embed Size (px)
Citation preview
2nd National Koala Conference
June, 2017
Disease mediated mortality cycles in a free-ranging koala
population.
Steve Phillips
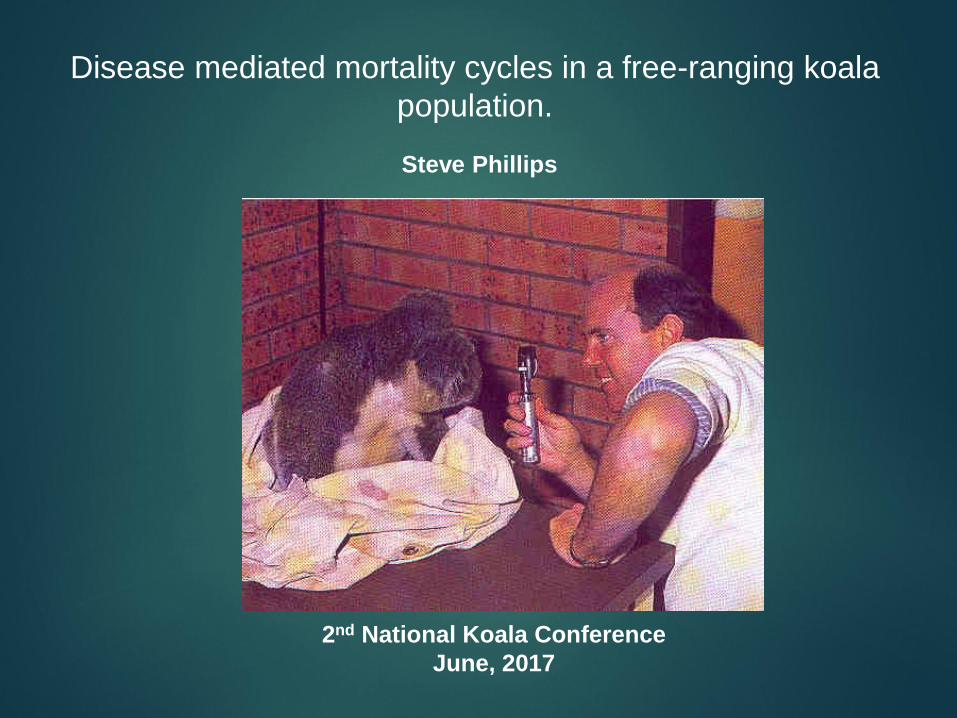
“Diseases in the form of Chlamydiosis and/or KoRV
collectively present one of the greatest threats to the
continued survival and viability of free-ranging koala
populations in Australia”
True or False?
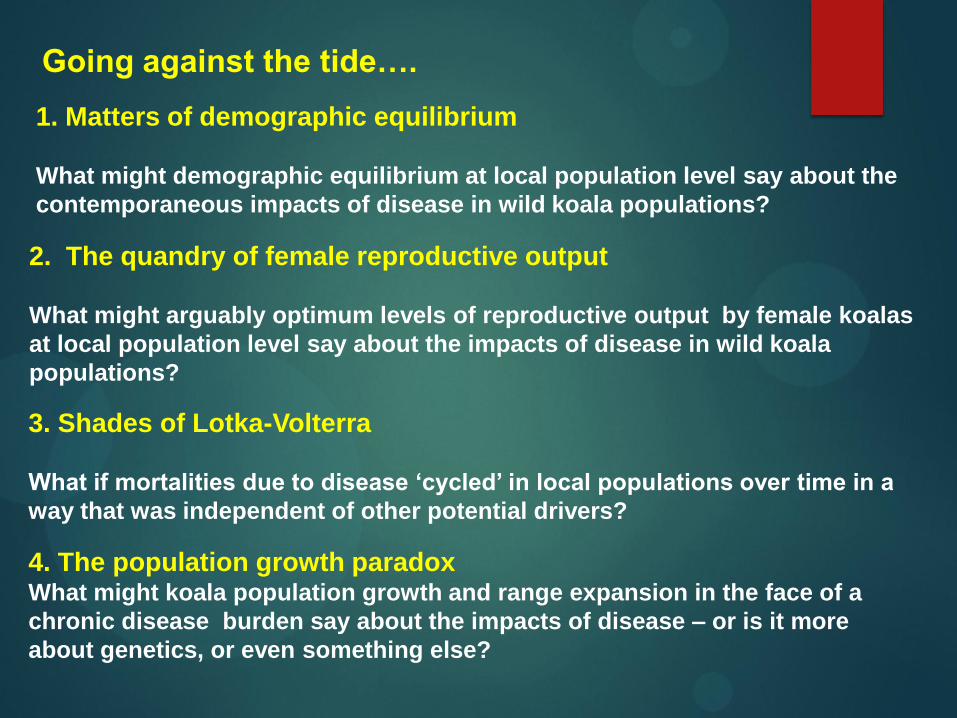
1. Matters of demographic equilibrium
What might demographic equilibrium at local population level say about the
contemporaneous impacts of disease in wild koala populations?
2. The quandry of female reproductive output
What might arguably optimum levels of reproductive output by female koalas
at local population level say about the impacts of disease in wild koala
populations?
3. Shades of Lotka-Volterra
What if mortalities due to disease ‘cycled’ in local populations over time in a
way that was independent of other potential drivers?
4. The population growth paradox What might koala population growth and range expansion in the face of a
chronic disease burden say about the impacts of disease – or is it more
about genetics, or even something else?
Going against the tide….

What is the local population?
One or more aggregations of koalas,
the majority of which comprise
individuals with established home
range areas to which long-term fidelity
is maintained.
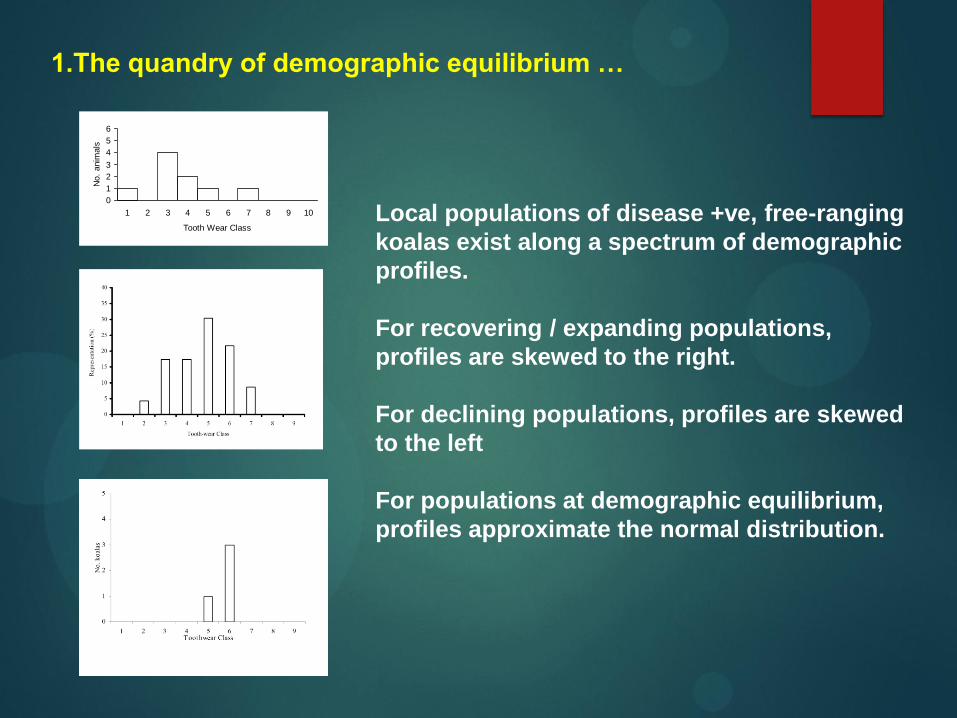
1.The quandry of demographic equilibrium …
0
1
2
3
4
5
6
1 2 3 4 5 6 7 8 9 10
Tooth Wear Class
No.
anim
als
Local populations of disease +ve, free-ranging
koalas exist along a spectrum of demographic
profiles.
For recovering / expanding populations,
profiles are skewed to the right.
For declining populations, profiles are skewed
to the left
For populations at demographic equilibrium,
profiles approximate the normal distribution.
0
5
10
15
20
2 3 4 5 6 7
n
Tooth-wear class
0
2
4
6
8
10
2 3 4 5 6 7
n
Tooth-wear class
0
5
10
15
2 3 4 5 6
n
Tooth-wear class
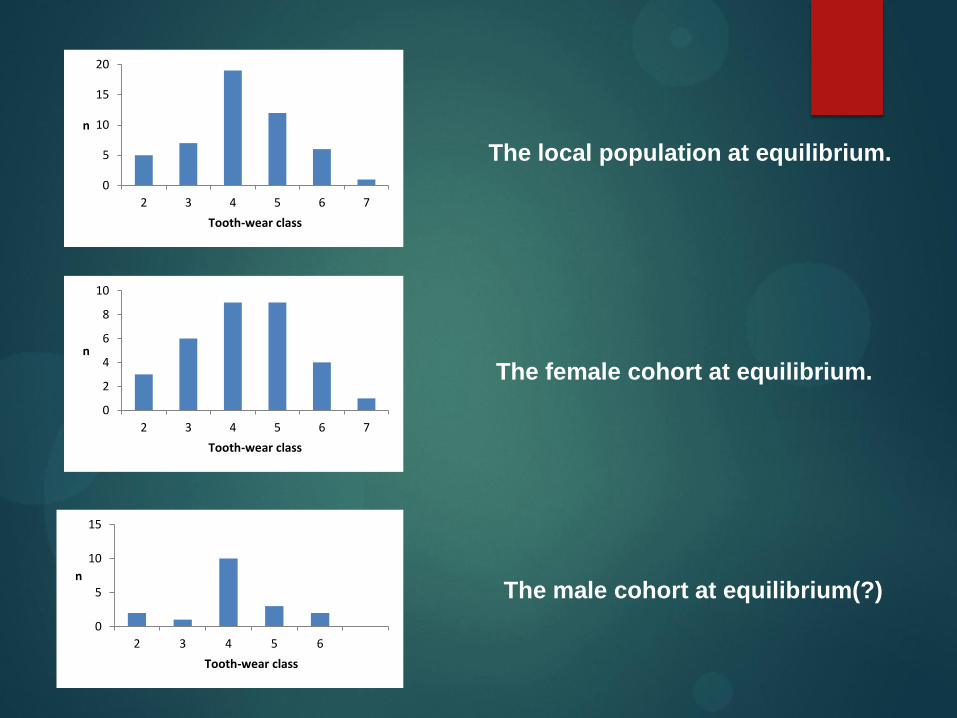
The local population at equilibrium.
The male cohort at equilibrium(?)
The female cohort at equilibrium.
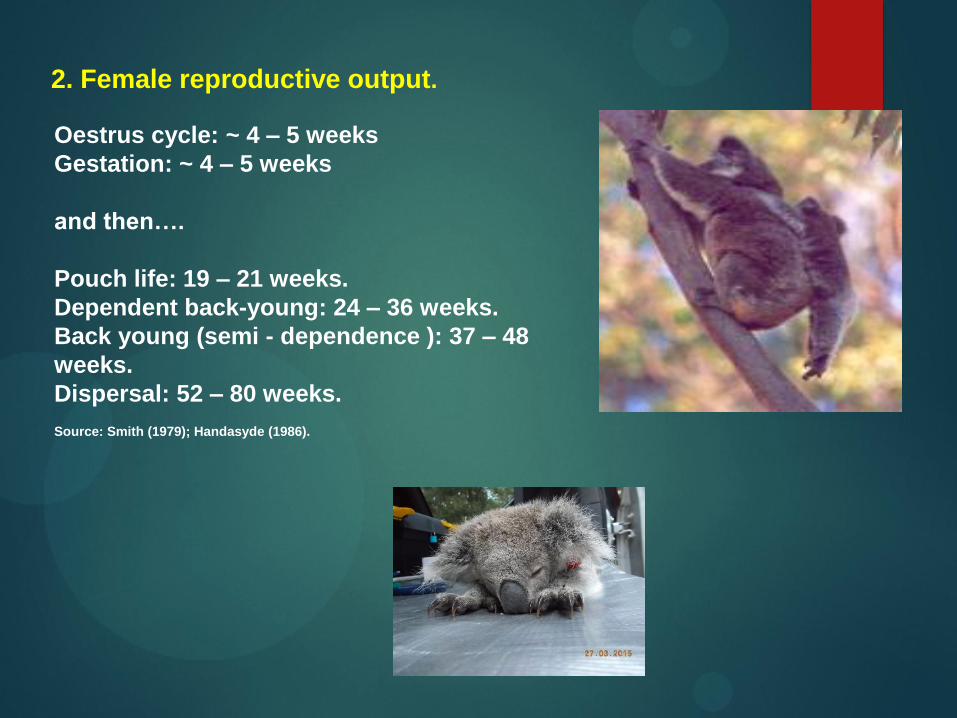
2. Female reproductive output.
Oestrus cycle: ~ 4 – 5 weeks
Gestation: ~ 4 – 5 weeks
and then….
Pouch life: 19 – 21 weeks.
Dependent back-young: 24 – 36 weeks.
Back young (semi - dependence ): 37 – 48
weeks.
Dispersal: 52 – 80 weeks.
Source: Smith (1979); Handasyde (1986).
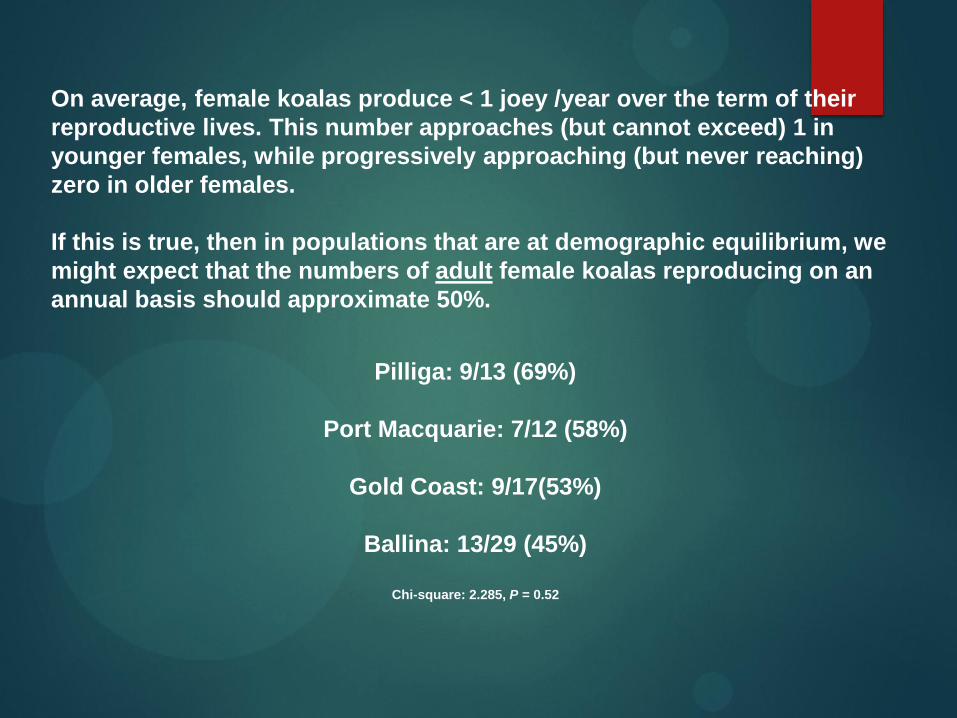
If this is true, then in populations that are at demographic equilibrium, we
might expect that the numbers of adult female koalas reproducing on an
annual basis should approximate 50%.
Pilliga: 9/13 (69%)
Port Macquarie: 7/12 (58%)
Gold Coast: 9/17(53%)
Ballina: 13/29 (45%)
Chi-square: 2.285, P = 0.52
On average, female koalas produce < 1 joey /year over the term of their
reproductive lives. This number approaches (but cannot exceed) 1 in
younger females, while progressively approaching (but never reaching)
zero in older females.
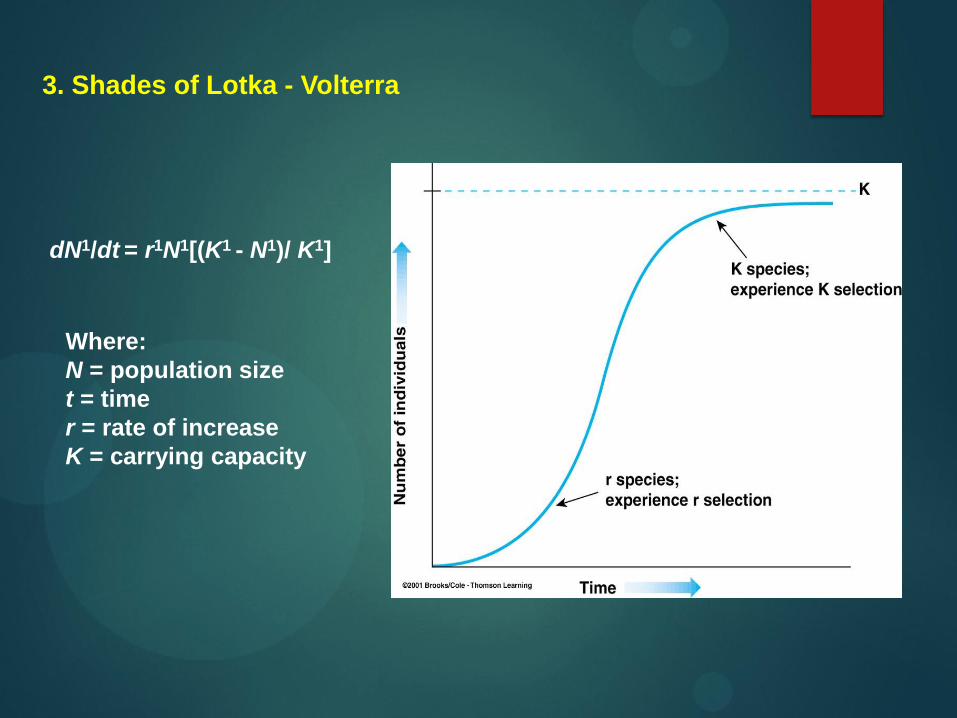
3. Shades of Lotka - Volterra
dN1/dt = r1N1[(K1 - N1)/ K1]
Where:
N = population size
t = time
r = rate of increase
K = carrying capacity
0
1
2
3
4
5
6
1989 1994 1999 2004 2009 2014
No
. kn
ow
n m
ort
alit
ies/
ann
um
du
e t
o
dis
eas
e
Year
0
1
2
3
4
5
1989 1994 1999 2004 2009 2014No
. re
po
rte
d r
oad
-ki
lls
Year
0
1000
2000
3000
198919941999200420092014ann
ual
rai
nfa
ll (m
m)
Year
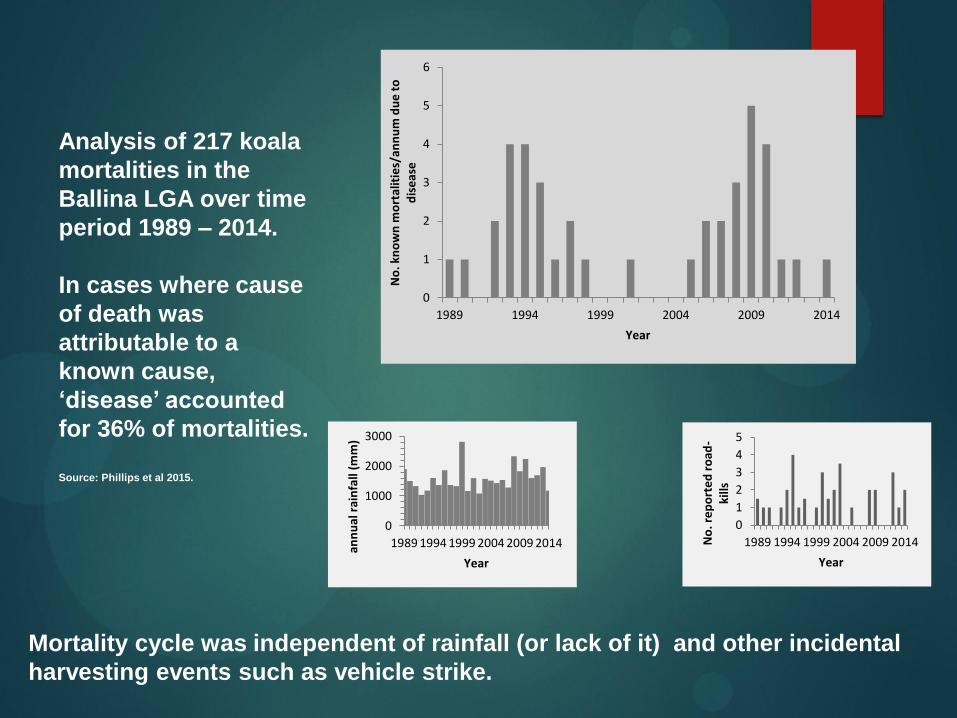
Analysis of 217 koala
mortalities in the
Ballina LGA over time
period 1989 – 2014.
In cases where cause
of death was
attributable to a
known cause,
‘disease’ accounted
for 36% of mortalities.
Source: Phillips et al 2015.
Mortality cycle was independent of rainfall (or lack of it) and other incidental
harvesting events such as vehicle strike.
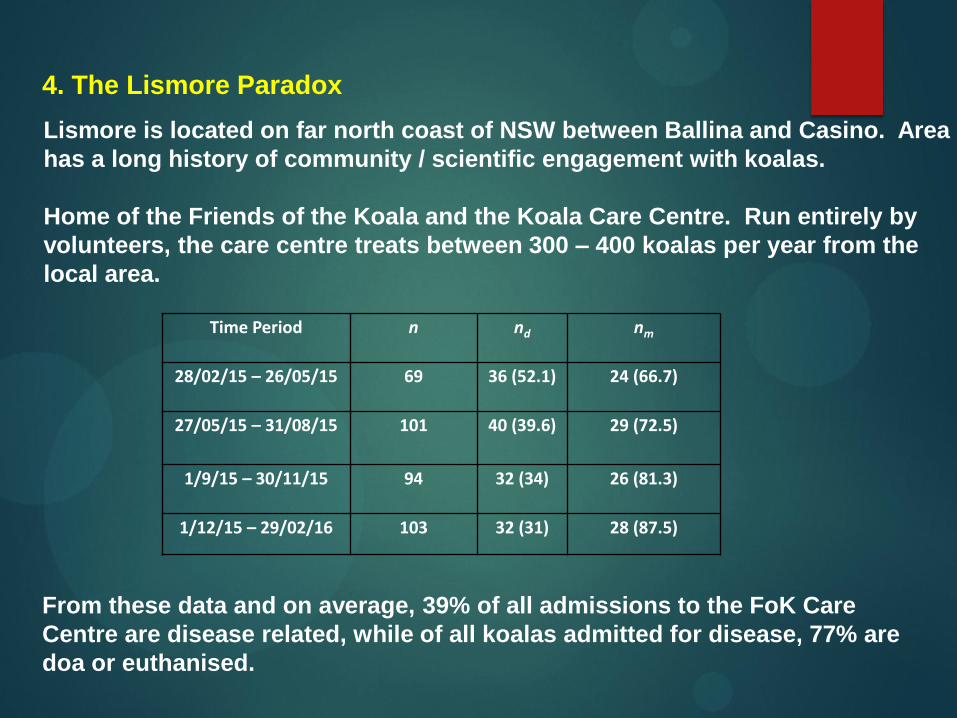
4. The Lismore Paradox
Lismore is located on far north coast of NSW between Ballina and Casino. Area
has a long history of community / scientific engagement with koalas.
Home of the Friends of the Koala and the Koala Care Centre. Run entirely by
volunteers, the care centre treats between 300 – 400 koalas per year from the
local area.
Time Period n nd nm
28/02/15 – 26/05/15 69 36 (52.1) 24 (66.7)
27/05/15 – 31/08/15 101 40 (39.6) 29 (72.5)
1/9/15 – 30/11/15 94 32 (34) 26 (81.3)
1/12/15 – 29/02/16 103 32 (31) 28 (87.5)
From these data and on average, 39% of all admissions to the FoK Care
Centre are disease related, while of all koalas admitted for disease, 77% are
doa or euthanised.
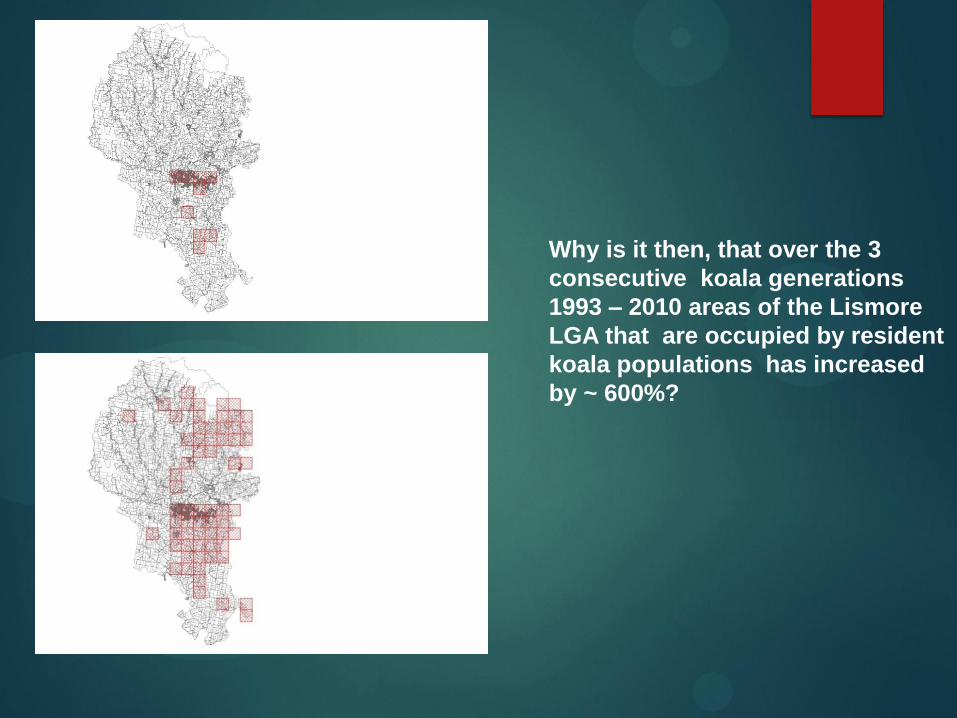
Why is it then, that over the 3
consecutive koala generations
1993 – 2010 areas of the Lismore
LGA that are occupied by resident
koala populations has increased
by ~ 600%?
What does it all this mean?
Some alternative hypotheses….
There is an inherent capacity for koalas to maintain optimum population
parameters in the presence of disease.
Koala populations are capable of growth and/or recovery in the face of
chronic disease burdens.
I think it means that there is more to the koala disease equation than what
might be perceived by the average academic eye.
A way forward (perhaps)
Further research on disease requires big picture thinking that includes a
review of current paradigms, as well as a more integrated approach amongst
the various scientific disciples that are working on koala conservation and
management.
Understanding the disease equation as a fundamental aspect of koala
ecology is paramount to better conservation and management of the species
generally.
Balancing the disease equation is straight forward – yes it’s out there, it is
complex and we do need to understand and manage it, but as a symptom not a
cause.
There is little justification for working to improve koala reproductive output in
the interests of assisting recovery if we haven't addressed the real factors
driving decline in the first instance.
Human activity is the catalyst, disturbance is the key variable ….. .

Acknowledgments:
NSW Roads & Maritime Services, Friends of the Koala, John Callaghan,
Maria Matthes & Grant Brearley.
Thankyou