Embed Size (px)
Citation preview

Discussions – Optional I. Wednesday 3:30-4:20 p.m. Noland 342
II. Friday 1:20-2:10 p.m. Noland 539

Examples: Adaptation or not?
• After high altitude training athletes have increased number of red blood cells (RBC)
• Tibetans and Sherpas have higher RBC than lowland (<2000 m) people (Yi et al. 2010, Science 329:75-78)

Examples: Adaptation or not?
• Weeds from a cornfield have been found to grow taller than those from soybean fields when both populations are reared in common-garden conditions
• Taller weeds from the cornfields survive at a greater rate and leave more offspring

EPIGENETICS

WHAT IS EPIGENETICS?
• Epigenetics – gene regulation changes that does not involve a change in DNA sequence
• Epigenetic changes can be INHERITED!!
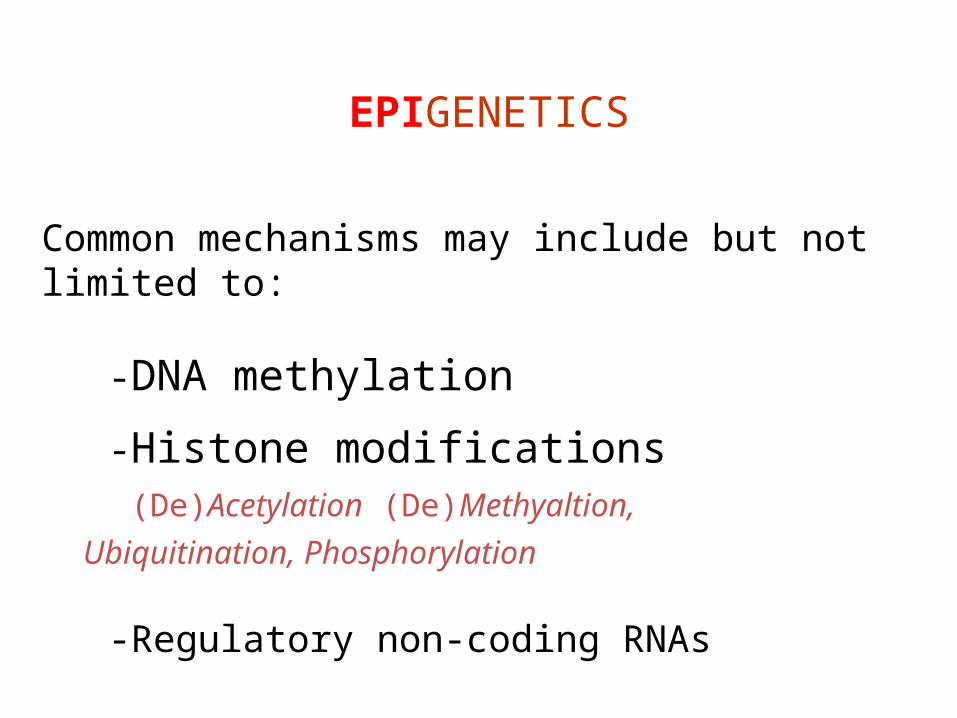
Common mechanisms may include but not limited to:
-DNA methylation
-Histone modifications (De)Acetylation (De)Methyaltion,
Ubiquitination, Phosphorylation
-Regulatory non-coding RNAs
EPIGENETICS
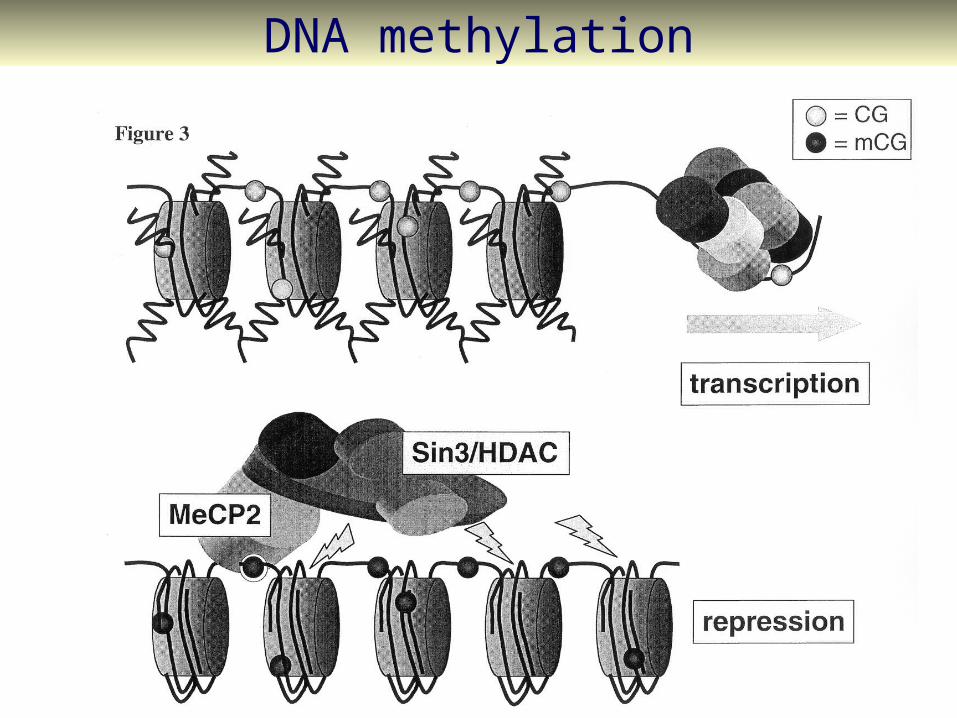
DNA methylation
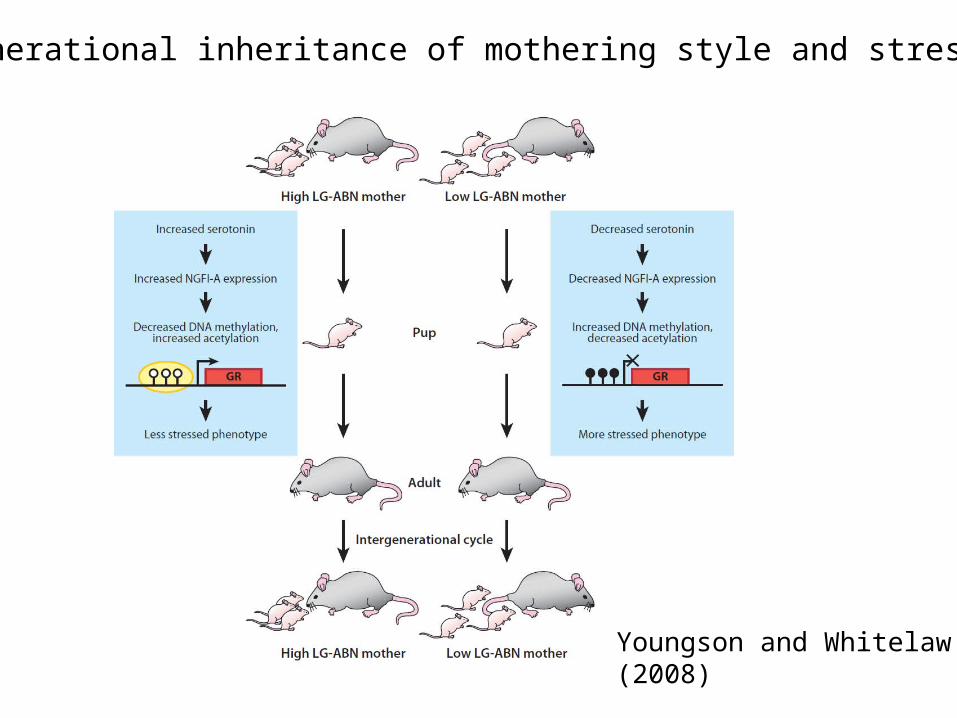
Transgenerational inheritance of mothering style and stress in rat
Youngson and Whitelaw(2008)

Need Genetic variation upon which selection could act
This variation could occur at many hierarchical levels: At different structural levels
And at different steps leading to protein expression
Mechanisms of Adaptation
OUTLINE
• The origin of genetic variation
• Examples of structural and regulatory change by mutations
• Detection of selection (adaptation)
The origin of genetic variation
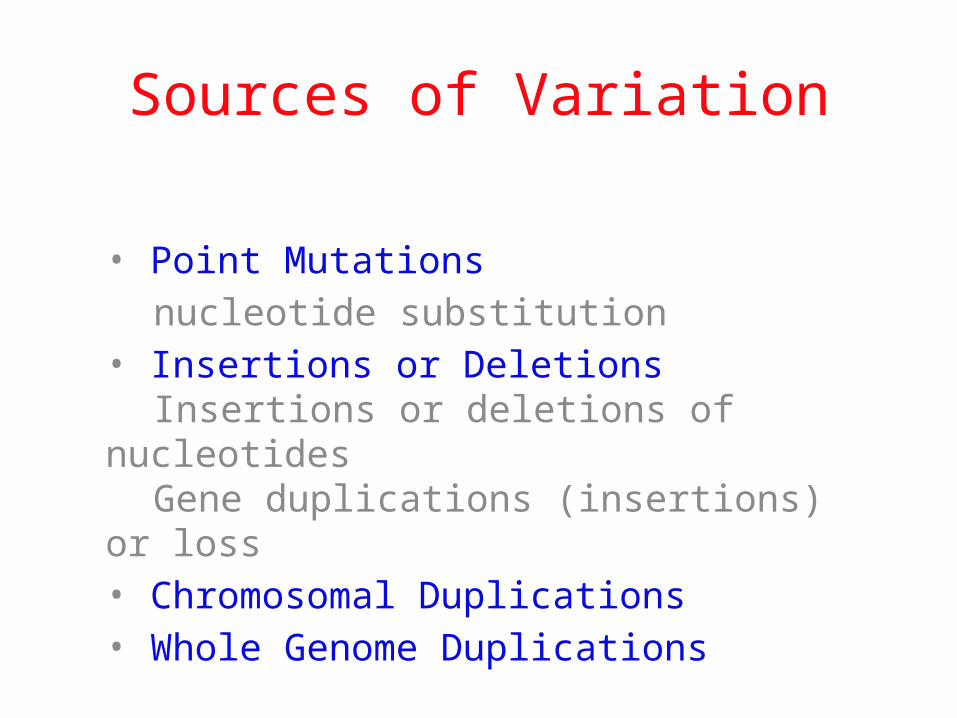
Sources of Variation
• Point Mutations nucleotide substitution
• Insertions or DeletionsInsertions or deletions of nucleotides Gene duplications (insertions) or loss
• Chromosomal Duplications• Whole Genome Duplications
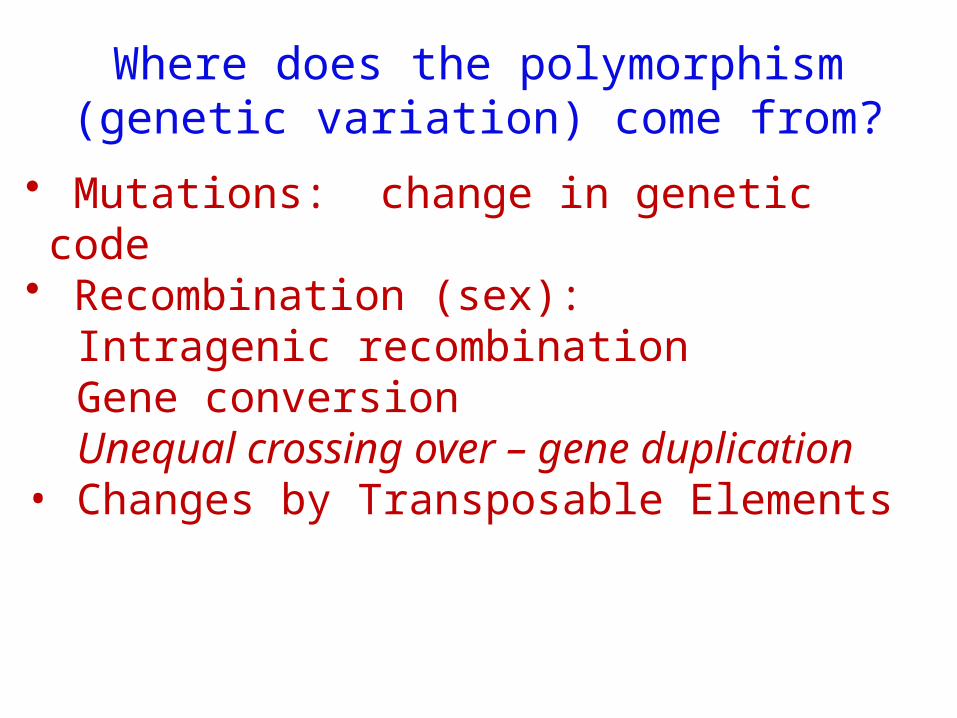
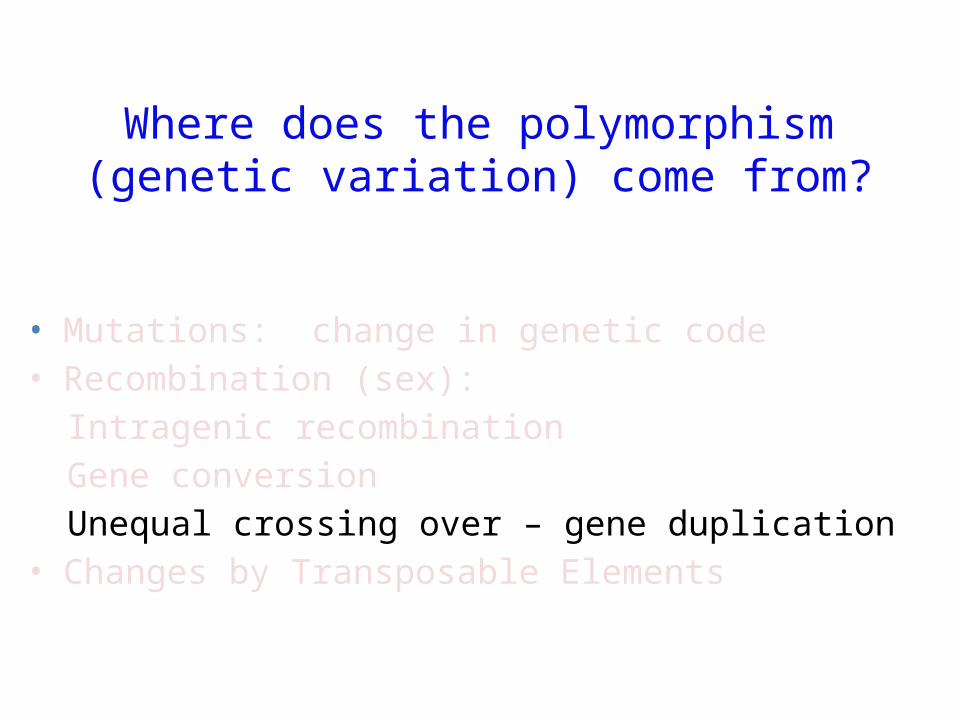
Where does the polymorphism (genetic variation) come from?
• Mutations: change in genetic code• Recombination (sex): Intragenic recombination Gene conversion Unequal crossing over – gene duplication• Changes by Transposable Elements

Mutations
Any change in the genetic code, including errors in DNA replication or errors in DNA
repair
Mutations
Mutations that matter, in an evolutionary sense, are that get passed on to the next generation:i.e., those that occur in the cells that produce gametes (the “germ line”)

Point Mutations
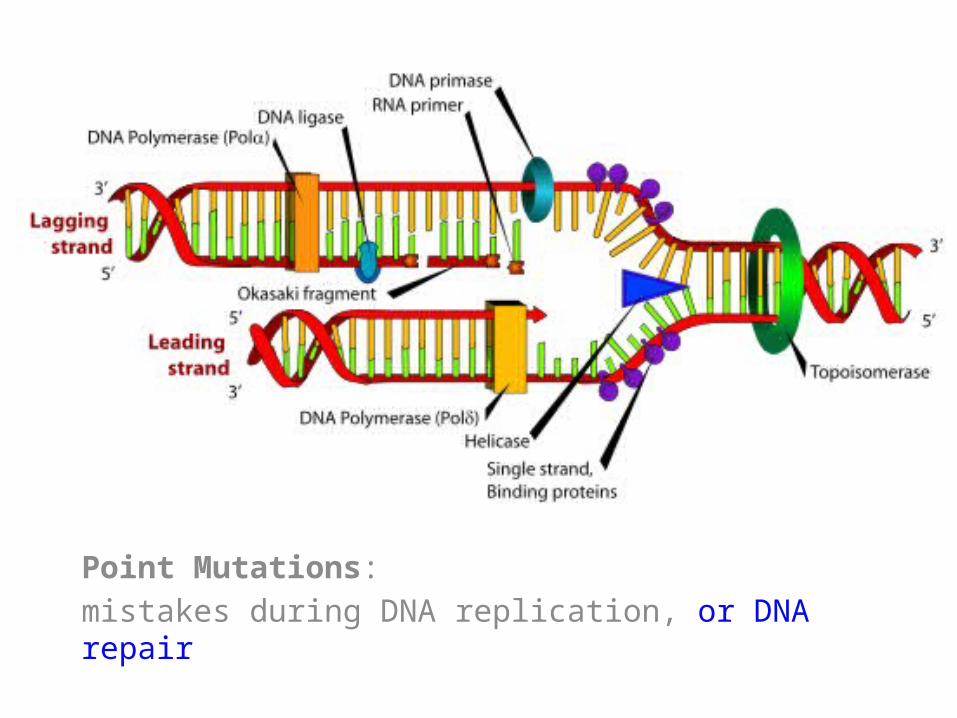
Point Mutations: mistakes during DNA replication, or DNA repair
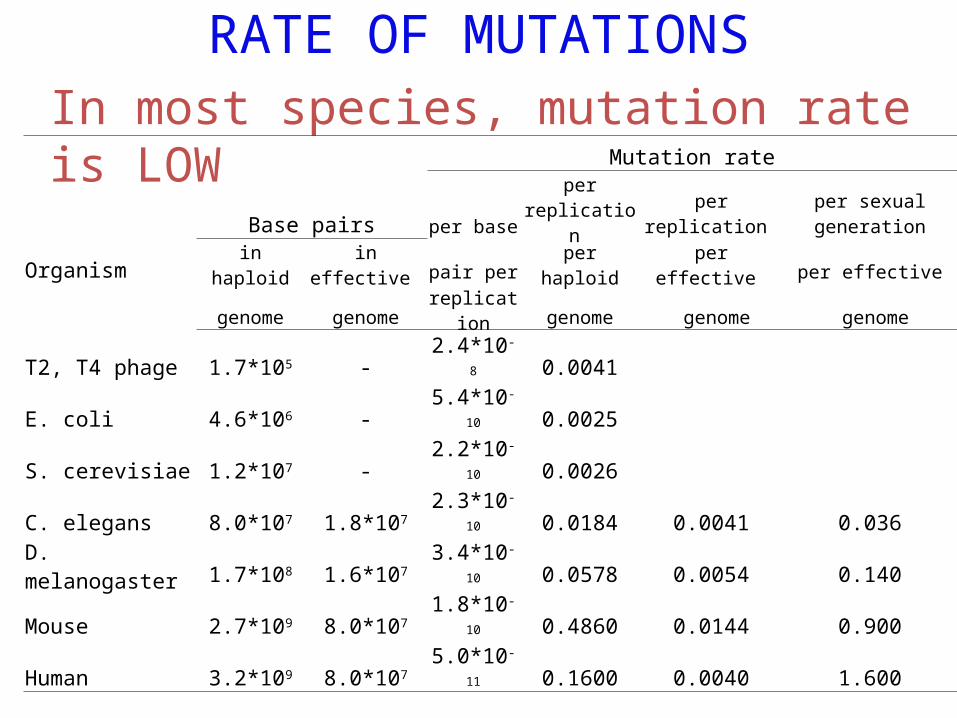
RATE OF MUTATIONSIn most species, mutation rate is LOW
Mutation rateBase pairs per base per replication per replication per sexual generation
Organism in haploid in effective pair per per haploid per effective per effectivegenome genome replication genome genome genome
T2, T4 phage 1.7*105 - 2.4*10-8 0.0041
E. coli 4.6*106 - 5.4*10-10 0.0025
S. cerevisiae 1.2*107 - 2.2*10-10 0.0026
C. elegans 8.0*107 1.8*107 2.3*10-10 0.0184 0.0041 0.036
D. melanogaster 1.7*108 1.6*107 3.4*10-10 0.0578 0.0054 0.140
Mouse 2.7*109 8.0*107 1.8*10-10 0.4860 0.0144 0.900
Human 3.2*109 8.0*107 5.0*10-11 0.1600 0.0040 1.600

Mutations: Double-Edged Sword
Most mutations are ‘neutral’ with no effect on fitness
Most mutations that arise within functional genes are harmful
Mildly deleterious mutations persist longer in a population because it takes longer to select them out
Recessive mutations remain longer because they are eliminated when homozygous, not when heterozygous
Selection for favorable mutations leads to adaptation.
Where does the polymorphism (genetic variation) come from?
• Mutations: change in genetic code• Recombination (sex): Intragenic recombination Gene conversion Unequal crossing over – gene duplication• Changes by Transposable Elements

Gene Duplications

Gene Duplications
Duplication of genes due to DNA replication
error or recombination error (unequal crossing
over)
Lynch and Connery 2000
• 0.01 duplications per gene per million years
• Half life for a gene is 3-8 million years Crossing over
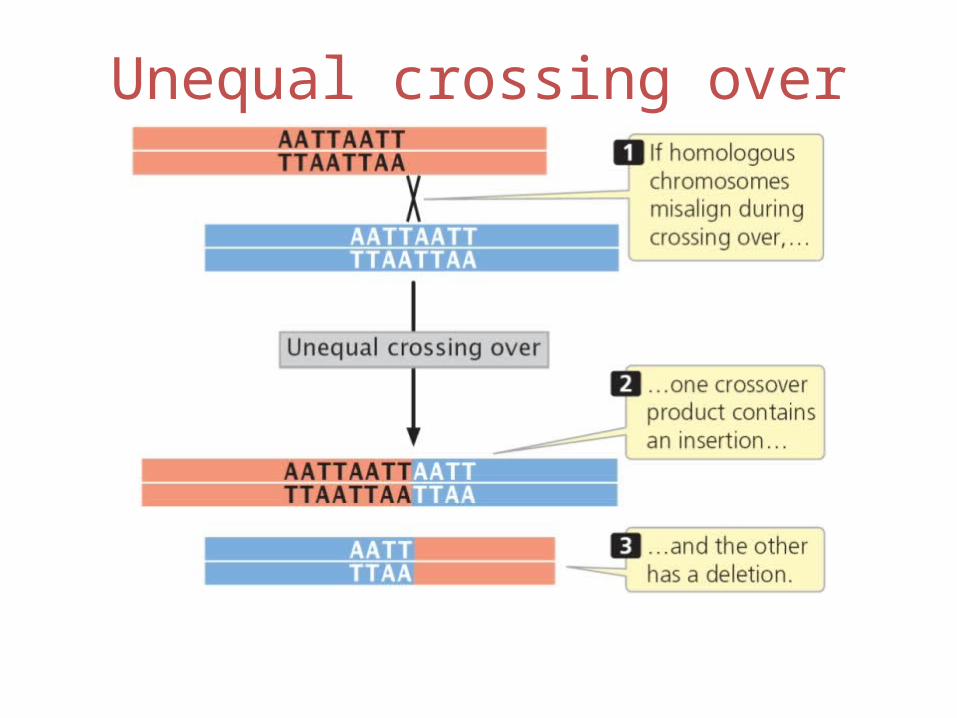
Unequal crossing over

Gene Duplications
• Duplicate genes in Eukaryotes are continuously created, tested, and discarded
• Duplicated genes either degenerate into pseudogenes (no function), become new genes, or subfunctionalize with an existing gene
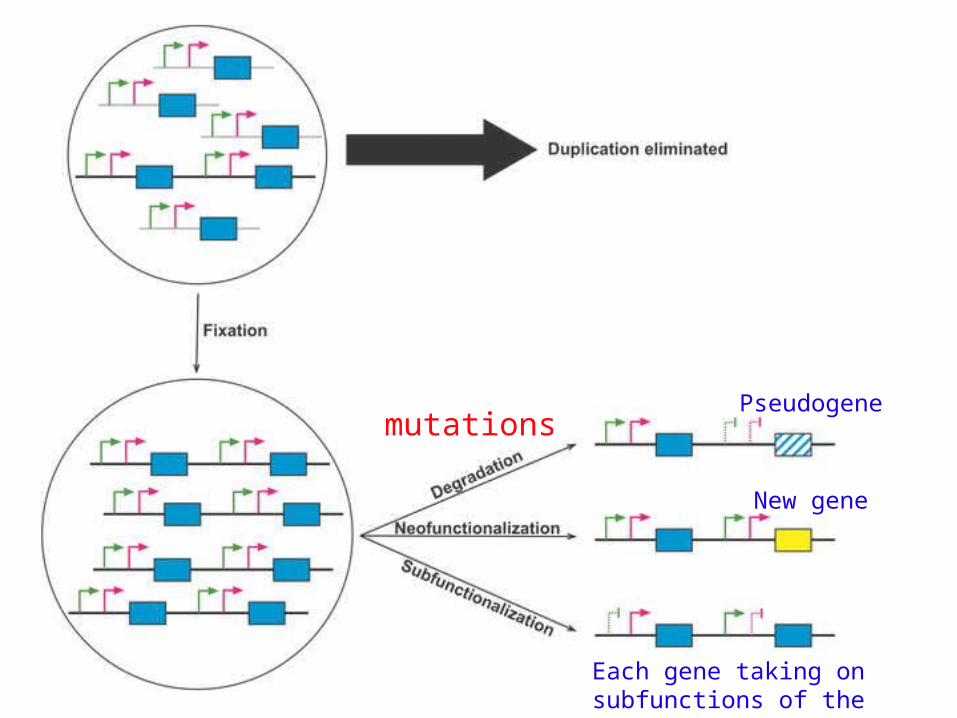
Pseudogene
New gene
Each gene taking on subfunctions of the original gene
mutations

Examples: Gene Families resulting from gene duplications
• Olfactory receptors • Steroid hormone receptors• Heat shock proteins• Ion uptake enzymes• Hemoglobins• Opsins• Melanins• Detoxification enzymes (cytochrome P450s)• Hox genes
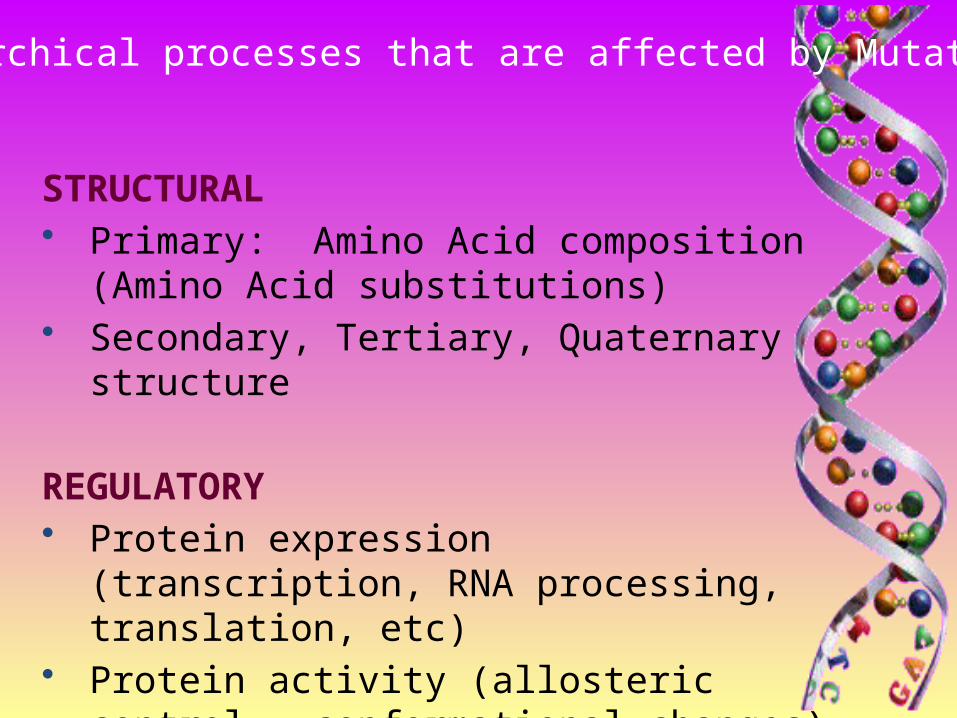
STRUCTURAL• Primary: Amino Acid composition (Amino
Acid substitutions)• Secondary, Tertiary, Quaternary structure
REGULATORY• Protein expression (transcription, RNA
processing, translation, etc)• Protein activity (allosteric control,
conformational changes)
Hierarchical processes that are affected by Mutations
Diagram of eukaryotic gene

REGULATORY
Protein expression• Transcription: Mutations at promoters, enhancers, (CIS)
transcription factors (TRANS), etc
• RNA Processing: Mutations at splice sites, sites of polyadenylation, sites controlling RNA export
• Translation: Mutations in ribosomes, regulatory regions, etc
Protein activity (allosteric control, conformational changes)
Hierarchical processes that are affected by Mutations

Once these mutations have occurred creating genetic variation, selection could act on genes, gene expression, and on genetic architecture (allelic and gene interactions)
OUTLINE
• The origin of genetic variation
• Examples of structural and regulatory changes by mutations
• Detection of selection (adaptation)
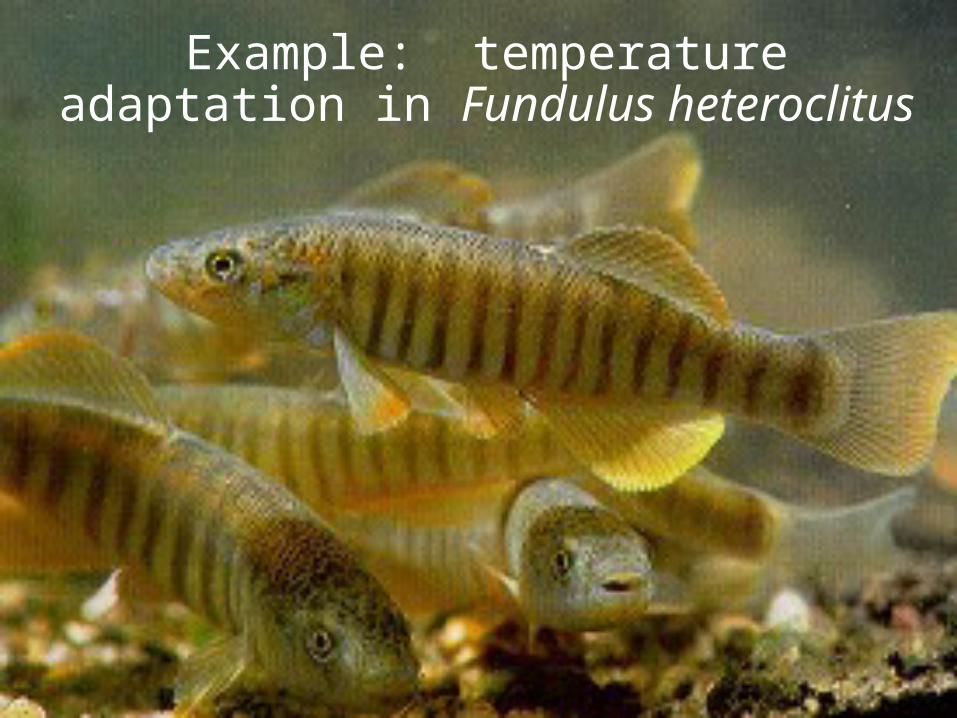
Example: temperature adaptation in Fundulus heteroclitus
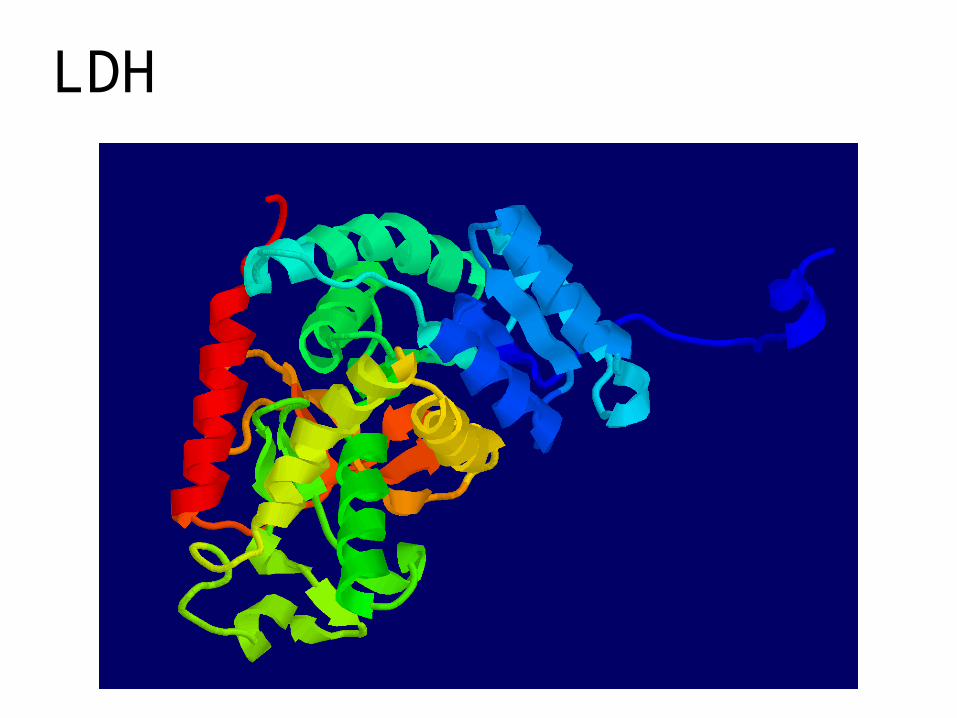
LDH
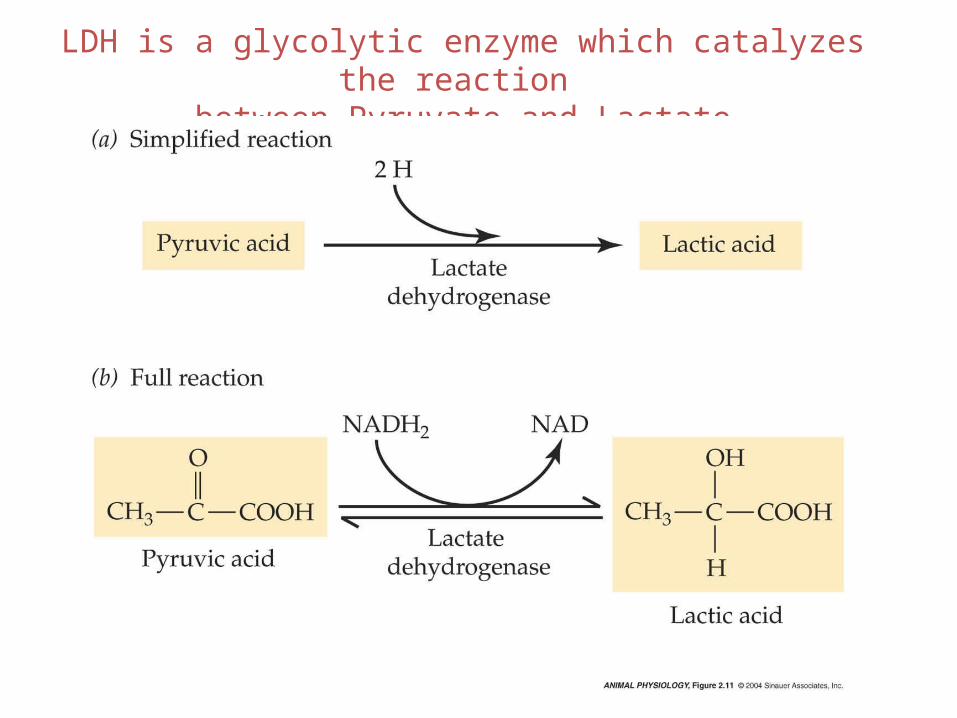
LDH is a glycolytic enzyme which catalyzes the reaction between Pyruvate and Lactate

Protein function
STRUCTURE• Amino acid composition (AA substitutions)• Secondary, Tertiary, Quaternary structure
REGULATORY• Protein expression (transcription, translation, etc)• Protein activity (allosteric control, conformational
changes, receptors)
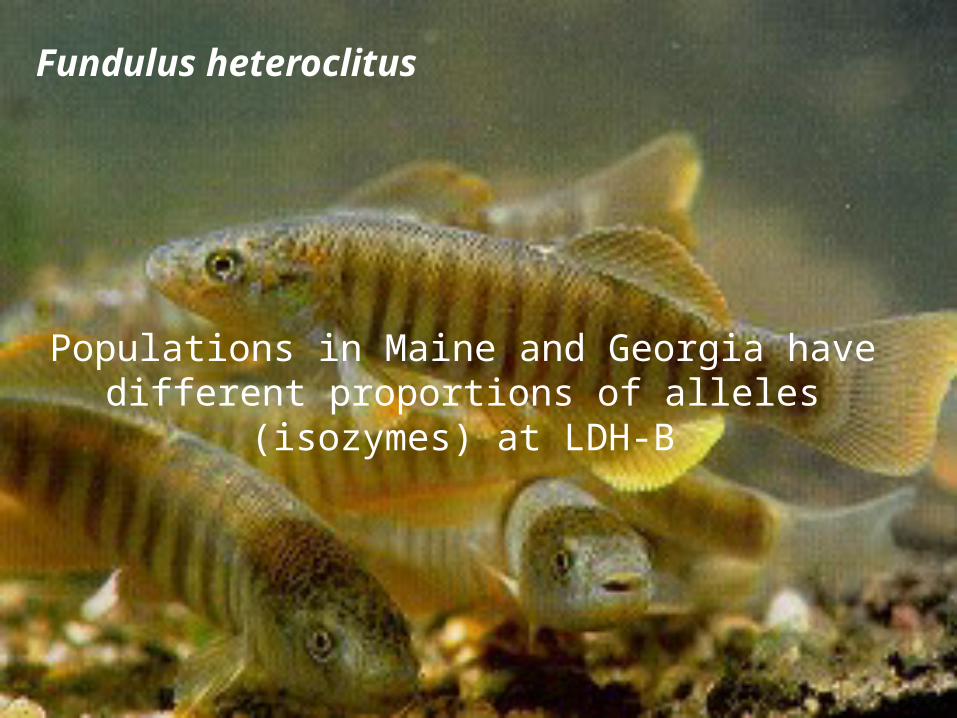
Fundulus heteroclitus
Populations in Maine and Georgia have different proportions of alleles (isozymes) at LDH-B

Difference in alleles (isozymes) in North vs South
North: LDH-B b allele (cold-adapted)South: LDH-B a allele (warm-adapted)
The two alleles have a difference of 2 amino acids

Place and Powers, PNAS 1979
1° latitude change = 1°C change in mean water temperature
Place and Powers, PNAS 1979

Place and Powers, 1979
b allele homozygote
a allele homozygote
Catalytic efficiency (kcat/km) is higher for the b allele at low
temperature, and higher for the a allele at higher temperature

Place and Powers, 1979
• The two allele products (the enzymes) show genetic differences in catalytic efficiency (adaptive differences)
• They also show genotype by environment interaction: they differ in the their optimal environments (differences in plasticity)
Catalytic efficiency (kcat/km) is higher for the b allele at low
temperature, and higher for the a allele at higher temperature

Protein function
STRUCTURAL• Amino acid composition (AA substitutions)• Secondary, Tertiary, Quaternary structure
REGULATORY• Protein expression (transcription, translation, etc)• Protein activity (allosteric control, conformational
changes, receptors)

Common Garden Experiment:The Northern isozyme has BOTH higher activity and higher level of expression in fish at constant lab conditions (20°C temperature)
Crawford and Powers, 1989 activity
protein
mRNA
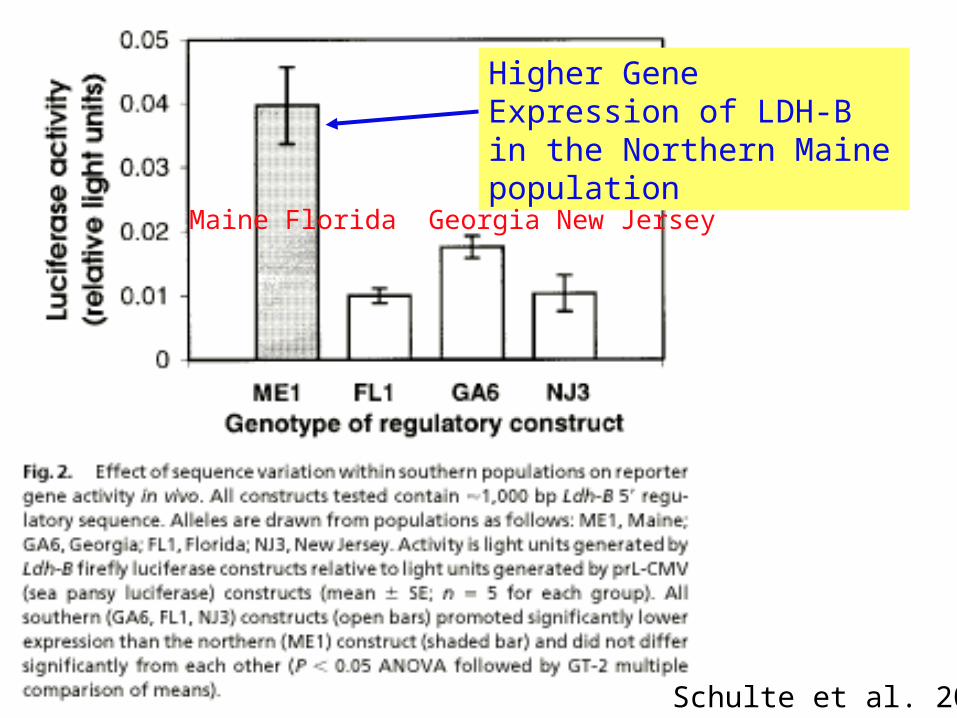
Higher Gene Expression of LDH-B in the Northern Maine population
Schulte et al. 2000
Maine Florida Georgia New Jersey
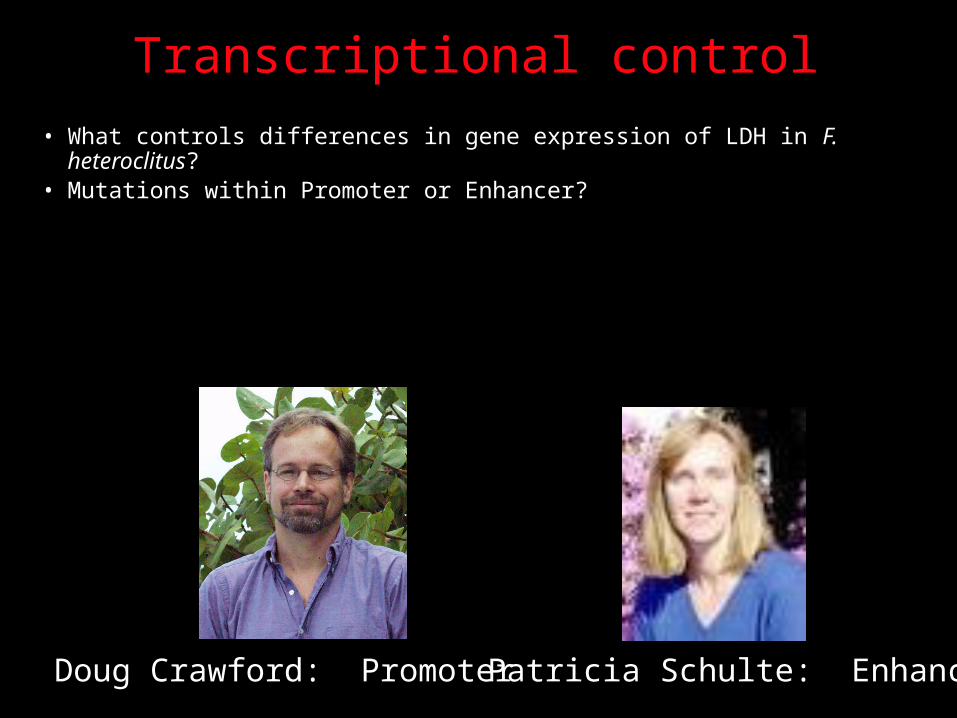
Transcriptional control• What controls differences in gene expression of LDH in F. heteroclitus?• Mutations within Promoter or Enhancer?
QuickTime™ and aPhoto - JPEG decompressor
are needed to see this picture.
Doug Crawford: Promoter Patricia Schulte: Enhancer
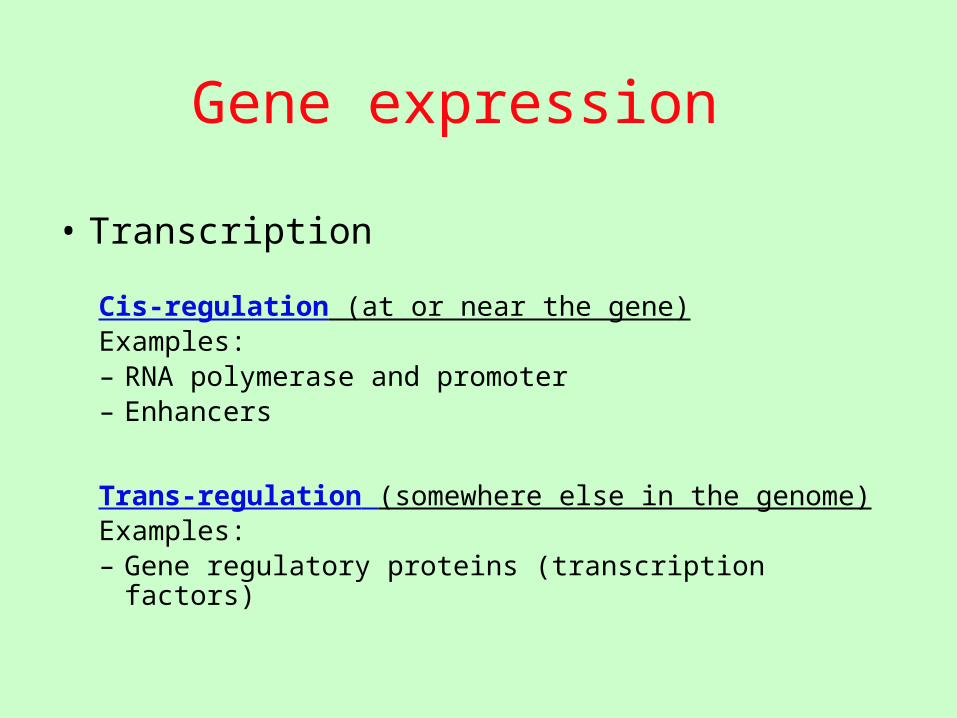
Gene expression
• Transcription
Cis-regulation (at or near the gene)Examples:– RNA polymerase and promoter– Enhancers
Trans-regulation (somewhere else in the genome)Examples:– Gene regulatory proteins (transcription factors)

TEMPERATURE ADAPTATIONin F. heteroclitus
• Cis-acting sequence ~ 500 bp upstream of the start site of transcription of LDH-B
• S-population - a 7-bp site identical to a mouse mammary tumor virus glucocorticoid responsive element (MTV-GRE) repressor
• N-population - this site differs from S population sequence by 1 bp and does not repress expression of LDH gene
• MTV-GRE repressor inhibits transcription in the absence of stress hormones.
• When stress hormone levels are high, the repression is removed and transcription increases
• The putative element within the F. heteroclitus LDH-B gene might behave in a similar way.
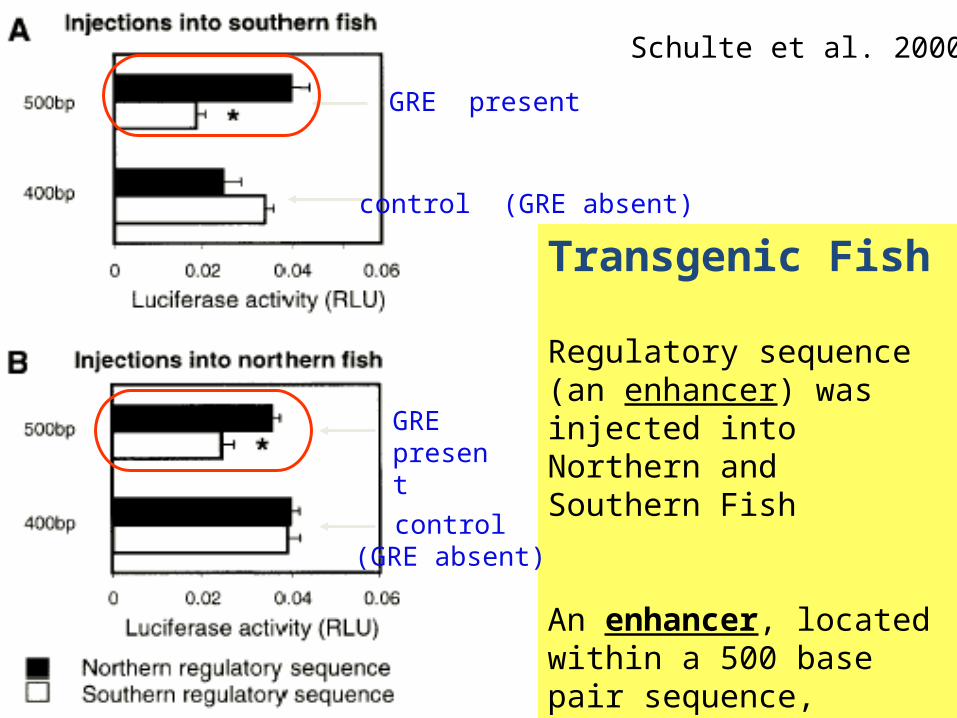
Transgenic Fish
Regulatory sequence (an enhancer) was injected into Northern and Southern Fish
An enhancer, located within a 500 base pair sequence, significantly increased gene expression of LDH
control (GRE absent)
GRE present
control(GRE absent)
GRE present
Schulte et al. 2000

Protein function
STRUCTURE• Amino acid composition (AA substitutions)• Secondary, Tertiary, Quaternary structure
REGULATORY• Protein expression (transcription, translation, etc)• Protein activity (allosteric control, conformational
changes)
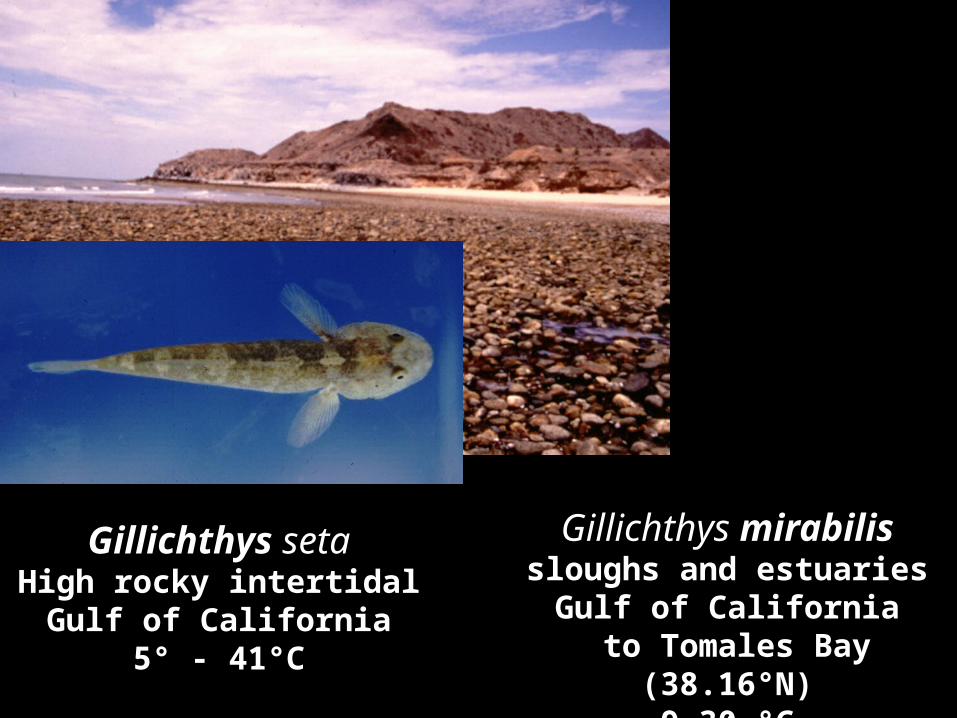
Gillichthys setaHigh rocky intertidal
Gulf of California5° - 41°C
Gillichthys mirabilissloughs and estuaries
Gulf of California to Tomales Bay (38.16°N)
9–30 °C
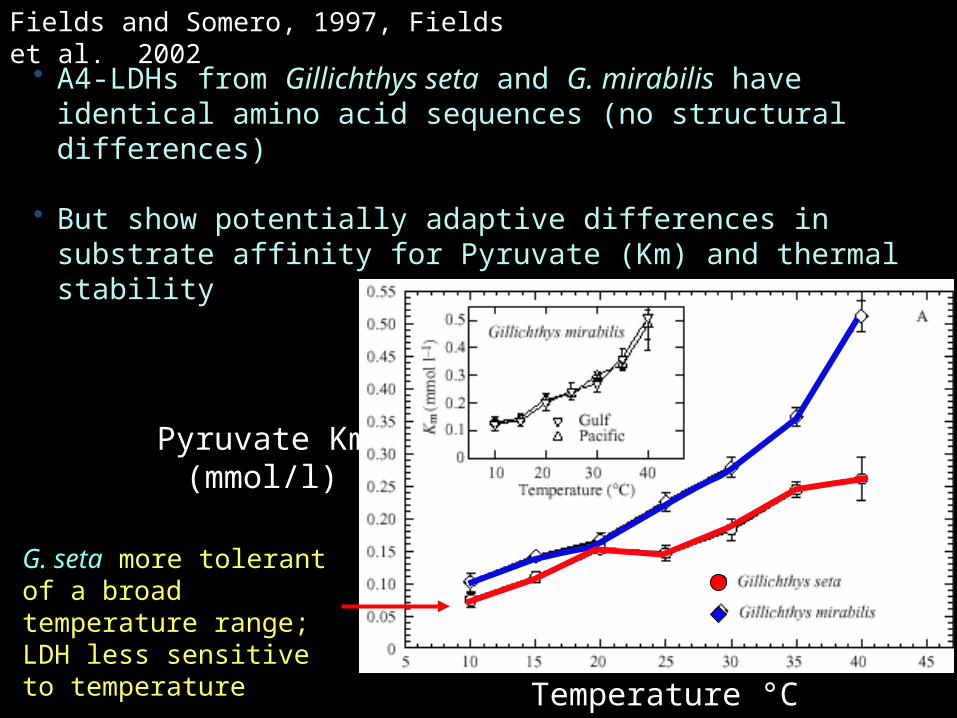
Fields and Somero, 1997, Fields et al. 2002
• A4-LDHs from Gillichthys seta and G. mirabilis have identical amino acid sequences (no structural differences)
• But show potentially adaptive differences in substrate affinity for Pyruvate (Km) and thermal stability
Pyruvate Km (mmol/l)
Temperature °C
G. seta more tolerant of a broad temperature range; LDH less sensitive to temperature
OUTLINE• The origin of genetic variation
• Examples of structural and regulatory change by mutations
• Detection of selection (adaptation)
Detection of Selection
How does one detect genetic signatures of Natural Selection?
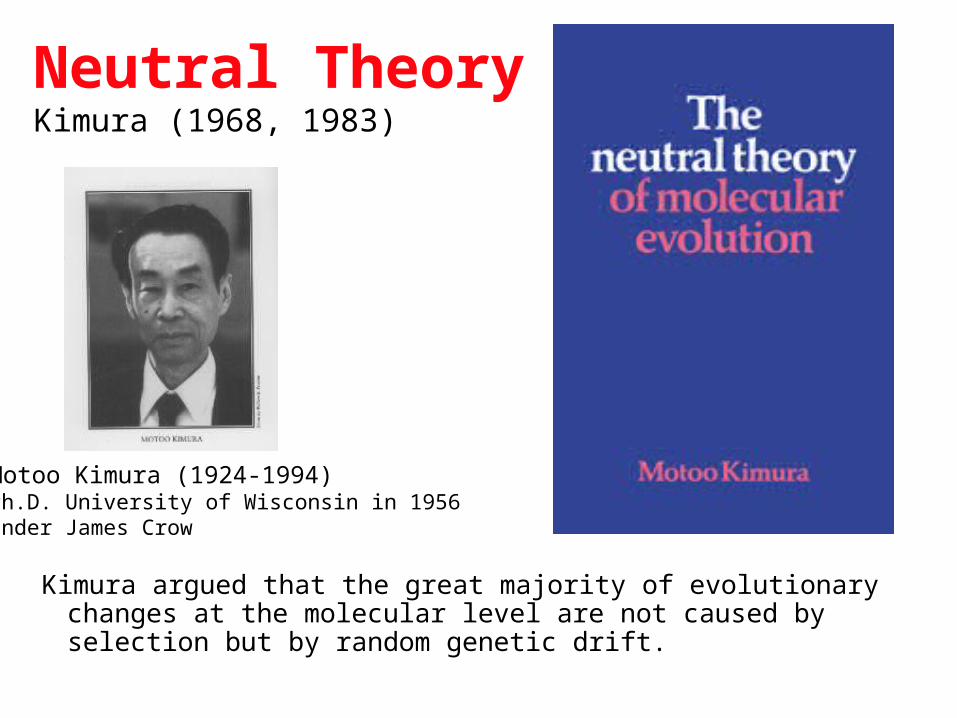
Neutral TheoryKimura (1968, 1983)
Kimura argued that the great majority of evolutionary changes at the molecular level are not caused by selection but by random genetic drift.
Motoo Kimura (1924-1994)Ph.D. University of Wisconsin in 1956Under James Crow
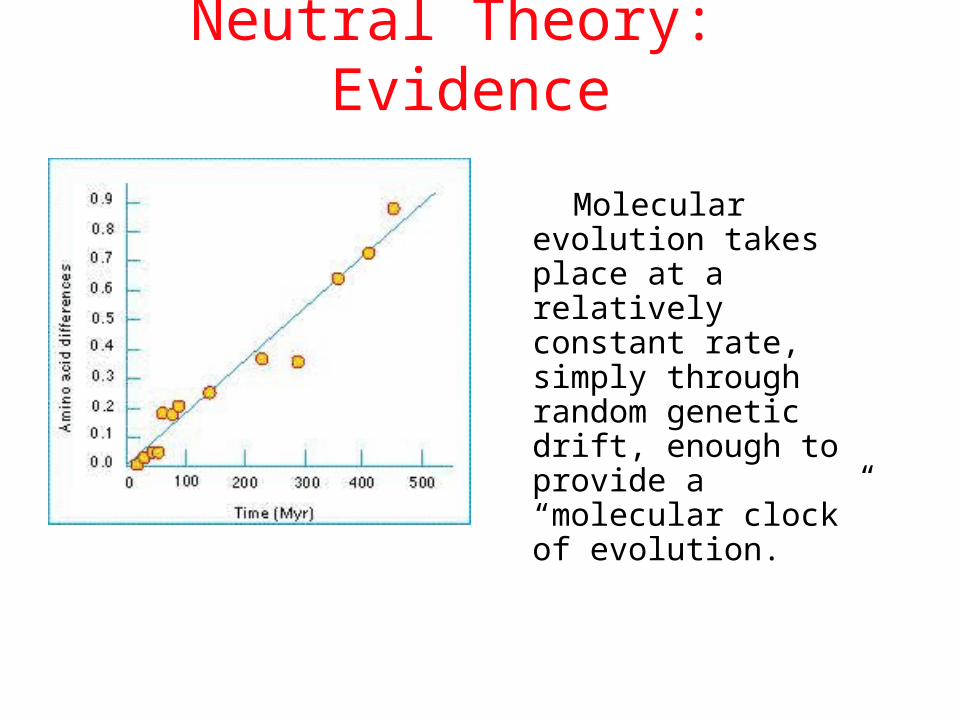
Neutral Theory: Evidence
Molecular evolution takes place at a relatively constant rate, simply through random genetic drift, enough to provide a “molecular clock” of evolution.

Selection-Neutral Debate
• Kimura’s work spawned a heated debate on the relative importance of neutral evolution (genetic drift) versus genetic variation that is a result of natural selection.
• Probability of fixation of neutral mutation:
eN2
1

Neutral Theory
• Now considered the “null model” against which evidence for selection should be tested
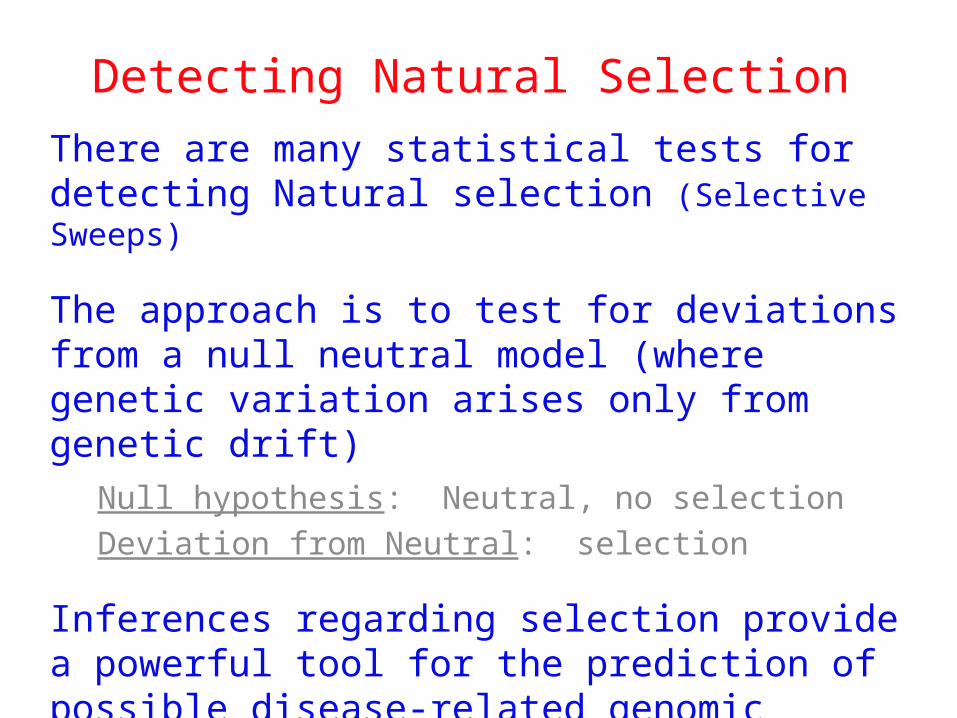
Detecting Natural SelectionThere are many statistical tests for detecting Natural selection (Selective Sweeps)
The approach is to test for deviations from a null neutral model (where genetic variation arises only from genetic drift)
Null hypothesis: Neutral, no selectionDeviation from Neutral: selection
Inferences regarding selection provide a powerful tool for the prediction of possible disease-related genomic regions

Methods for Detecting Selection:
A. MacDonald-Kreitman Type Tests
B. Site Frequency Spectrum Approaches
C. Linkage Disequilibrium (LD) and Haplotype Structure
D. Population Differentiation: Lewontin-Krakauer Methods
These tests could be applied to single genes, or across the whole genome.

Codon Bias in Amino Acid Substitutions
QuickTime™ and aPhoto - JPEG decompressor
are needed to see this picture.
• Synonymous substitutions: Mutations that do not cause amino acid change (usually 3rd position)“silent substitutions”
• Nonsynonymous substitutions: Mutations that cause amino acid change (1st, 2nd position)“replacement substitutions”
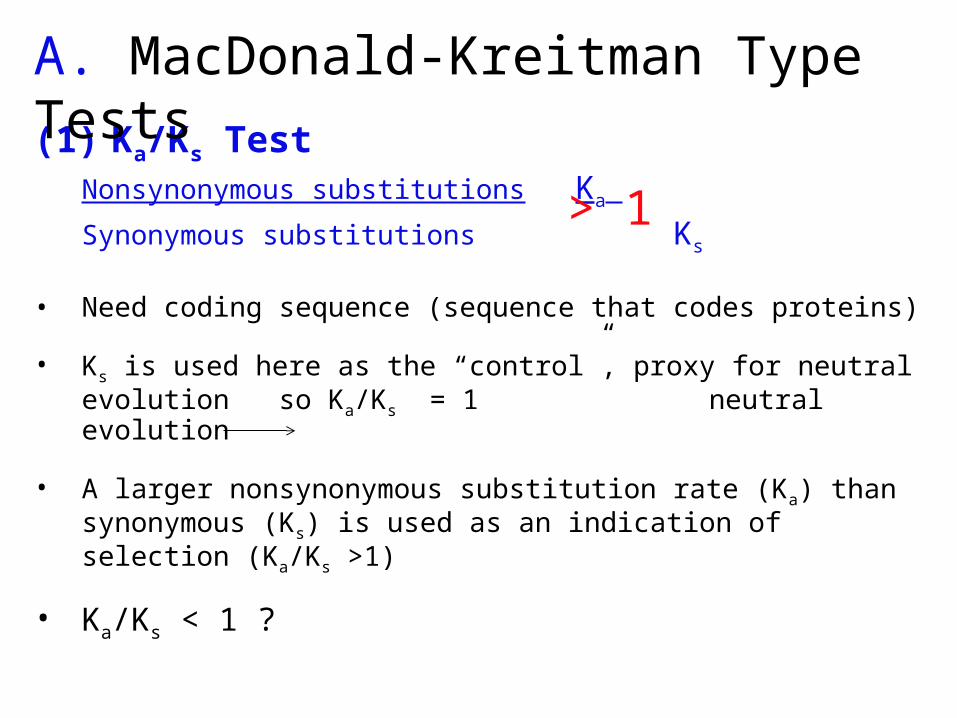
(1) Ka/Ks TestNonsynonymous substitutions Ka
Synonymous substitutions Ks
• Need coding sequence (sequence that codes proteins)
• Ks is used here as the “control”, proxy for neutral evolution so Ka/Ks = 1 neutral evolution
• A larger nonsynonymous substitution rate (Ka) than synonymous (Ks) is used as an indication of selection (Ka/Ks >1)
• Ka/Ks < 1 ?
> 1
A. MacDonald-Kreitman Type Tests

(2) MacDonald-Kreitman Test
Need coding sequenceNeed two species to determine divergence (D)Under neutral scenario we would expect:
Dn (nonsynonymous substitutions) = Pn (nonsynonymous polymorphism)
Ds (synonymous substitutions) Ps (synonymous polymorphism)
•Dn/Ds > Pn/Ps indicates adaptive substitutions

MK test at the ADH locus in 3 Drosophila species
Fixed difference Polymorphic
Nonsynonymous 7 2
Synonymous 17 42
41.0177
s
nF
F 05.0422
PP
sn
s
n
s
nP
PF
F
68 sites of ADH locus in total compared
p<0.01
McDonald and Kreitman, 1991. Nature, 351:652-654
Fn
Fs

B. Site Frequency Spectrum
• Selection affects the distribution of alleles within populations, typically reducing allele frequency
• Method examines site frequency spectrum and compares to neutral expectations
• Could be applied to a single locus. Now used often for genomic scans for selective sweeps
• Lactose gene in humans, disease alleles• Domestication alleles (corn, rice)
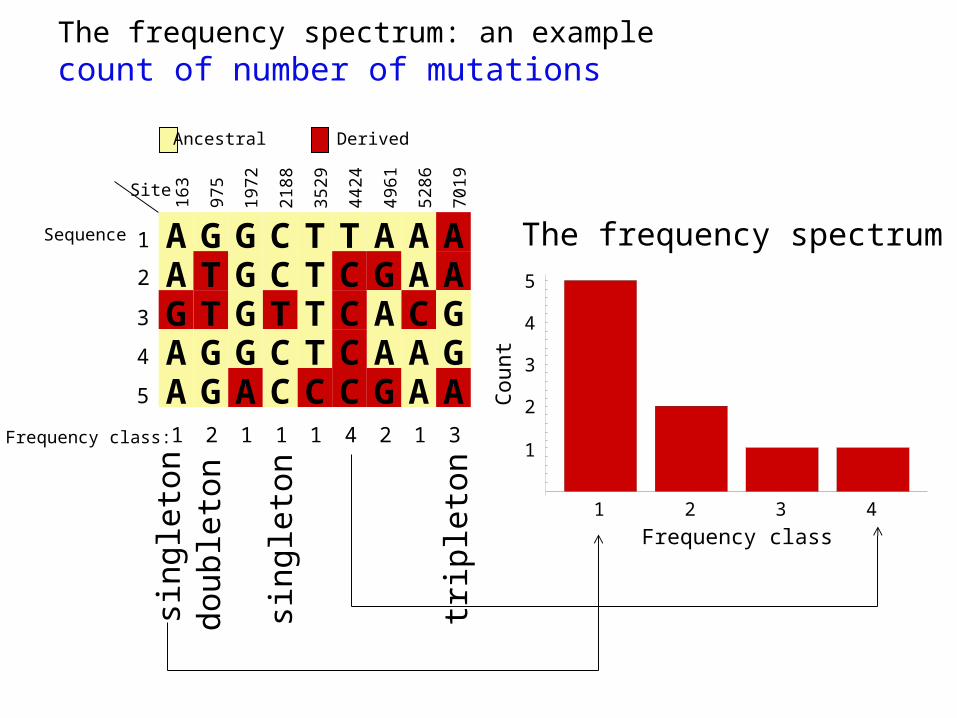
The frequency spectrum: an examplecount of number of mutations
Site
Sequence
Frequency class:
A G G C T T A A AA T G C T C G A AG T G T T C A C GA G G C T C A A GA G A C C C G A A
163
975
1972
2188
3529
4424
4961
5286
7019
1
2
3
4
5
1 2 1 1 1 4 2 1 3
Ancestral Derived
1 2 3 4
1
2
3
4
5
Frequency class
Cou
nt
The frequency spectrum
sing
leto
ndo
uble
ton
sing
leto
n
trip
leto
n

Site Frequency Spectrumcount of number of mutations
Tests:
Tajima’s D
Fu’s Fs
Fay and Wu’s H
selective sweep
positive selection (2Ns=5)
negative selection (2NS=-5)
neutral(no selection, constant population size, no subdivision)
0
0.1
0.2
0.3
0.4
0.5
0.6
Number of copies of derived allele
Frequency
1 3 5 7 9 11 13 15 17 19
Excess of rare
alleles
Excess ofcommonalleles

C. Linkage Disequilibrium (LD)• The nonrandom association of alleles from
different loci, where they are found more or less frequently together than expected
• Selection increases levels of linkage disequilibrium during the process of selection

D. Population Differentiation: Lewontin-Krakauer Methods
• Selection would often increase the degree of genetic distance between populations
• Compute pairwise genetic distances (FST) for many loci between populations
• When a locus shows extraordinary levels of genetic distance relative to other loci, this locus is a candidate for positive selection

Estimates of adaptive evolution
% substitutions fixed by selection:• ~50% in Drosophila• ~56% E. coli, Salmonella• ~75% env gene in HIV in a patient• ~85% hemagluttin gene in human influenza virus• But only 0.08-6% in Humans
• Species with large effective population size (smaller organisms) evolve faster
-More mutations arise in the population because there are more individuals generating more mutations… more opportunity on which selection could act-faster generation time

Examples
• Human Lactase gene: frequency spectrum, LD
• Corn from Teosinte: frequency spectrum

Evolution of the gene encoding lactase (LCT) in humans (Tishkoff et al. 2007)
• Mutations in LCT is associated with the ability to digest milk in adults
• This ability is prevalent in North Africa and Europe, and is largely absent throughout the world
• The mutant C/T-13910 confers lactase persistence in Europeans. A study of 470 Tanzanians, Kenyans, and Sudanese found three mutants associated with lactase persistence (G/C-14010, T/G-13915, C/G-13907)

The mutant C/T-13910 confers lactase persistence in Europeans. A study of 470 Tanzanians, Kenyans, and Sudanese found three mutants associated with lactase persistence (G/C-14010, T/G-13915, C/G-13907)

Evidence for Selection
• Evidence of a selective sweep; high frequency of C-14010 allele
• Extensive LD on chromosomes with the C-14010 allele, with haplotype homozygosity extending > 2 kilobases

Signatures of Selection in Corn (Maize)

Yum Kaax: Mayan god of cornJohn Doebley http://www.wisc.edu/teosinte/index.htm
Evolution of Corn from Teosinte
Domesticated about 7000 yrs ago in Southern Mexico
Selection for changes in a few developmental genes
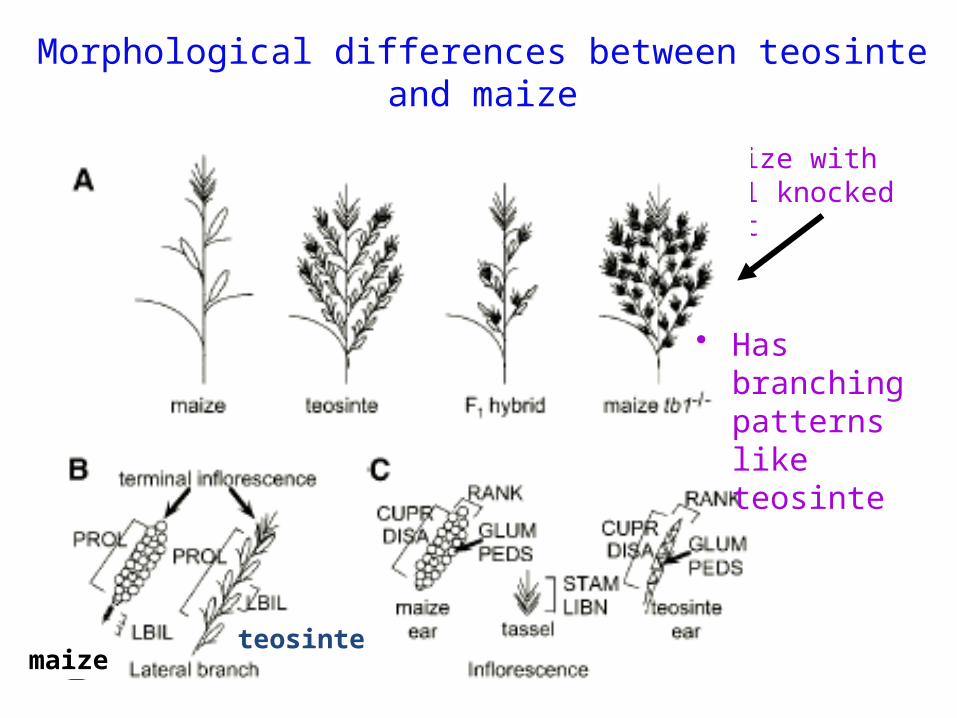
Morphological differences between teosinte and maize
• Maize with tb1 knocked out
maizeteosinte
• Has branching patterns like teosinte

Major morphological differences are due to directional selection on 5 genes
Genes: • Teosinte branched1 (tb1): single mutation affects branching and inflorescence• Regulator of tb1• tga glume (outer coating) reduction on chromosome X• teosinte – ~8-12 kernels F1 hybrid 8 rows, corn 20+rows
Evidence for selection in 2-4% of genes, ~1200 genes
Teosinte
Corn
F1 Hybrid
Genes selected for in Corn

• tb1 has greater allelic variation in teosinte than in corn
• Reduction in genetic diversity in domesticated corn
Evidence –Teosinte and corn