Embed Size (px)
Citation preview
Discussion Paper 05: Aviation Noise
July 2013
An independent commission appointed by Government

Airports Commission 6th Floor Sanctuary Buildings 20 Great Smith Street London SW1P 3BT
Web: www.gov.uk/government/organisations/airports-commission Email: [email protected]
© Crown copyright 2013, except where otherwise stated
Copyright in the typographical arrangement rests with the Crown.
You may re-use this information (not including logos or third-party material) free of charge in any format or medium, under the terms of the Open Government Licence. To view this licence, visit www.nationalarchives.gov.uk/doc/open-government-licence/ or write to the Information Policy Team, The National Archives, Kew, London TW9 4DU, or e-mail: [email protected].
Where we have identified any third-party copyright information you will need to obtain permission from the copyright holders concerned.

3
Contents
Contents
1. Introduction 4
2. How does noise affect people? 7What is noise? 7
How many people are affected by transport noise? 7
How many people are affected by aviation noise? 8
What are the effects of noise? 9
Amenity/quality of life effects 10
Health effects 13
Productivity and learning effects 14
Areas of tranquillity 15
Conclusion 16
3. Measuring aviation noise 17The science of sound 17
Quantifying the noise from a single aircraft event 18
Longer period noise exposure 20
Choosing between long term noise exposure metrics 26
Conclusion 28
4. Quantifying noise effects 30How noise is assessed 30
Monetising noise impacts 35
Conclusion 38
5. Mitigation 40The Noise Mitigation Framework – The International Civil Aviation Organisation’s (ICAO) ‘Balanced Approach’ 41
Reduction of noise at source through technological improvements 41
Mitigation through land use planning 43
Mitigation through operational procedures 43
Mitigation through operational restrictions 46
Compensation 49
Conclusion 50
6. Conclusion 52How to respond 53
7. References 54
Annex A: Noise contours for Paris 2004 59
Annex B: LDEN and Freq 70 maps for Brussels airport 60
Annex C: Historical noise contours for Heathrow, 57LAeq 66

4
Aviation Noise
1. Introduction
1.1 Since the middle of the twentieth century, growth of affordable mass air travel has resulted in increasing numbers of people being affected by aircraft noise. For communities adjacent to airports, and people living or working under flight paths, aircraft noise is an issue of significant concern, and this has presented a major issue for airport developments in the past. If anything, these concerns appear to have deepened even as aircraft have become progressively quieter, probably due to the increasing frequency of flights at the UK’s busiest airports.
1.2 Noise will be a central issue for the Airports Commission, both in its assessment of options to make better use of existing airport capacity and in considering proposals for new infrastructure, should the Commission identify a need to expand capacity in the longer term.
1.3 The Commission will carry out its work in the context of the Government’s recent Aviation Policy Framework (APF), which sets out the Government’s high-level objectives on aircraft noise. The APF stated that:
●● the Government’s primary objective is to limit and where possible reduce the number of people significantly affected by aircraft noise;
●● the Government wants to strike a fair balance between the negative
impacts of noise and the positive economic impacts of flights; and
●● as a general principle, any benefits from future improvements in aircraft noise performance should be shared between the aviation industry and local communities.
1.4 Recognising that there is still no firm consensus on how to approach issues around aircraft noise, the APF also identified certain areas, including noise assessment, compensation schemes, and the concept of noise envelopes, where the Government wishes to see further work undertaken.
1.5 The timing of the Commission’s work on noise assessments therefore presents an opportunity to contribute to the further work envisaged by the Government, as well as to wider debates on the measurement, assessment, and abatement of aircraft noise. For example, whilst the Commission’s assessment of options to increase UK airport capacity will need to incorporate the approach to noise mapping outlined by the APF, it could also provide opportunities to test additional approaches that might better reflect how aircraft noise is experienced.
1.6 This paper aims to provide a review of existing research and literature on aircraft noise, and to open up a number of key issues for debate.

5
Introduction
1.7 As Chapter 2 sets out, recent research has led to a better understanding of the impacts of noise pollution from various sources. A number of causal links between noise exposure and health impacts, such as hypertension, have been established. Studies have also shown noise to lead to cognitive impairment in children, and reduced productivity. These impacts can result from noise in workplaces and schools, sleep disturbance, or as a secondary effect of health impacts. More difficult to define and quantify is the annoyance that people feel when noise intrudes on their daily lives, for example during conversations or while resting. Annoyance is subjective and survey data suggests that attitudes to noise may be liable to change over time.
1.8 Chapter 3 examines some noise measurement methodologies that are currently in use. This includes ways of measuring noise from single aircraft events, as well as methodologies for measuring longer period noise exposure, such as the Equivalent Continuous Sound Level (Leq) and ‘Number Above’, or ‘Frequency’, contours. Historically, UK policy has been to use the Leq
measure, over a 16 hour period from 0700-2300, at the 57 decibel level, to mark the approximate onset of significant community annoyance. This value has influenced the production of annual noise contour maps at many airports, although certain airports must also map contours using the LDEN metric, which averages noise over 24 hours, in line with the requirements of the EU’s Environmental Noise Directive.
1.9 Whilst the Commission’s noise assessments will need to include the current 57LAeq16h mapping approach, they will also provide opportunities to trial alternative measures that might
better reflect how aircraft noise is experienced. To this end, the Commission is interested in submissions on alternative long-term noise exposure metrics.
1.10 Chapter 4 considers how the impact of noise can be assessed. This requires, firstly, measuring the extent of exposure to noise and, secondly, making some judgement around what constitutes an acceptable level of noise. Our understanding of people’s exposure to aircraft noise has improved since the first major study was undertaken around Heathrow in the early 1960s. One conclusion from more recent surveys is that the proportion of people annoyed by a given level of aircraft noise has increased over time, most likely due to the increasing frequency of flights since the original survey data were collected.
1.11 There is also an evolving body of research on night noise, with recent studies involving monitoring of brain wave activity, blood pressure, and stress levels, as well as awakenings. Increasingly policy makers have tried to monetise these impacts within cost-benefit analysis. Potential approaches include ascertaining people’s willingness to pay for noise abatement, adopting property values as a proxy for noise impact, and costing impacts in terms of Quality Adjusted Life Years (QALY) and Disability Adjusted Life Years (DALY). However, there is no consensus on the most appropriate method for monetising noise impacts, or more generally on whether monetisation is the most appropriate approach to noise assessment.
1.12 Chapter 5 discusses approaches to noise mitigation, in the context of the International Civil Aviation Organisation (ICAO)’s ‘Balanced Approach to Noise
6
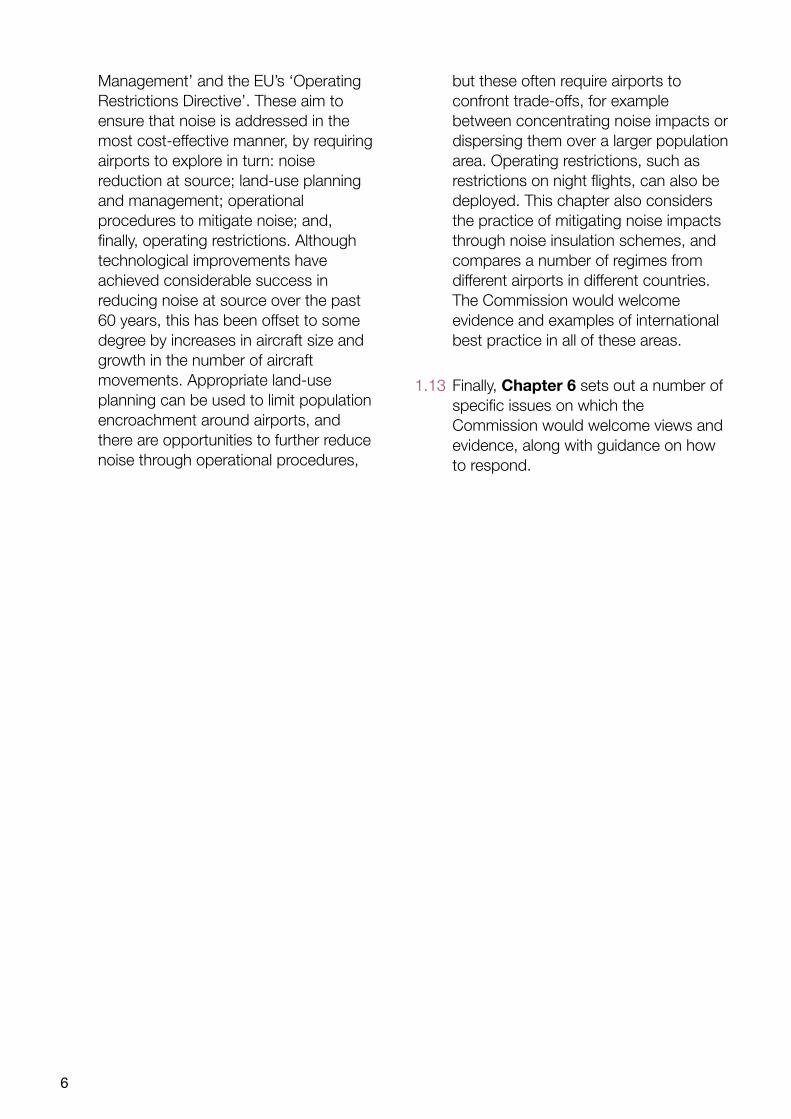
Management’ and the EU’s ‘Operating Restrictions Directive’. These aim to ensure that noise is addressed in the most cost-effective manner, by requiring airports to explore in turn: noise reduction at source; land-use planning and management; operational procedures to mitigate noise; and, finally, operating restrictions. Although technological improvements have achieved considerable success in reducing noise at source over the past 60 years, this has been offset to some degree by increases in aircraft size and growth in the number of aircraft movements. Appropriate land-use planning can be used to limit population encroachment around airports, and there are opportunities to further reduce noise through operational procedures,
but these often require airports to confront trade-offs, for example between concentrating noise impacts or dispersing them over a larger population area. Operating restrictions, such as restrictions on night flights, can also be deployed. This chapter also considers the practice of mitigating noise impacts through noise insulation schemes, and compares a number of regimes from different airports in different countries. The Commission would welcome evidence and examples of international best practice in all of these areas.
1.13 Finally, Chapter 6 sets out a number of specific issues on which the Commission would welcome views and evidence, along with guidance on how to respond.

7
How does noise affect people?
2. How does noise affect people?
What is noise?
2.1 Noise is defined by the World Health Organization (WHO) as unwanted sound. Physically, there is no difference between sound and noise. The difference is one of human perception and is subject to individual variability.
2.2 In the modern world, particularly in urban environments, noise pollution is an everyday occurrence. This isn’t to say we should, or do, resign ourselves to its presence. In the majority of cases noise is an annoyance and inconvenience affecting people’s quality of life, but it can have some direct and indirect health effects, such as damage to hearing and increased hypertension.1 This chapter will explore these potential effects.
How many people are affected by transport noise?
2.3 The most widespread form of noise is that which arises from transportation sources, i.e road traffic, railways and aviation. From a survey carried out in 1999/2000, over 80% of the UK population hear road traffic noise, of which over 20% are moderately, very or extremely bothered by it. The corresponding figures for railways were nearly 40% and 2%, and for aviation,
including aircraft noise, just over 70% and around 7%.2
2.4 Most transport noise impacts are quite localised, affecting those closest to its source but causing much less of an impact on those further away. This is because the level of noise decays as distance from the source increases. However, the way noise decays is influenced by a large number of factors, such as obstructions and ground cover, which can be particularly effective at decaying noise from road and rail sources. With noise from elevated sources, such as aircraft noise, these features generally provide no benefit. Weather conditions can also affect how noise travels. There is more noise downwind from a source than the equivalent location upwind (everything else being equal), and different levels of temperature can also affect noise propagation.
2.5 Figure 2.1 shows noise maps from road, rail and air transport sources in the Cheadle and Stockport areas of Manchester. As can be seen, noise from road and rail is very intense around source and is quickly dissipated by buildings and other obstructions surrounding it. On the other hand aircraft noise disperses more slowly, for the reasons mentioned above.
1 Hypertension is a term used to describe high blood pressure.
2 Noise Attitude Survey 1999/2000. The 2012 National Noise Attitude Survey will be published later this year, where these figures will be updated.

8
Figure 2.1: Maps of Manchester (Cheadle and Stockport), showing noise effects from road, rail and aviationRoad
Source: DEFRA
Rail
Source: DEFRA
Aviation
Source: DEFRA
2.6 The number of people deemed to be affected by transport noise will depend on the noise metric used, an issue which we discuss in more detail in Chapter 3. However, to give a sense of the relative numbers affected from each mode, the strategic noise mapping that took place in England in 2006 estimated that 4.2 million people are exposed to road traffic noise of 65 decibels (dB) (LDEN)3 or more, and found that the corresponding figures for railways and aviation are 0.2m people and 0.07m people, respectively.4
How many people are affected by aviation noise?
2.7 Table 2.1 lists in order the UK airports whose noise footprints affect the largest number of people.5 Table 2.2 does the same, but compares the noise footprints of large European airports.6 These tables place in context the noise situation experienced at the UK’s airports.
3 LDEN is a 24 hour metric (Day-Evening-Night level). For further information on and discussion of noise metrics such as LDEN please see chapter 3.
4 Noise Action Plans, 2006. The strategic mapping did not cover every transportation source in the country, so this may be an underestimate.
5 All numbers taken from CAA data, 2006.
6 European Environment Agency, Noise Observation and Information Service for Europe (NOISE). Note that the two tables establish noise footprints using different metrics. This is why the Heathrow figure is different between the two tables. We discuss noise metrics and their utilisation in detail in Chapter 3.

9
How does noise affect people?
Table 2.1: Size of population affected by 57LAeq16h contour for largest UK airports
AirportPopulation within the 57LAeq 16h contour
London Heathrow 258,500
Manchester 35,200
Birmingham 18,900
Glasgow 14,650
London City 6,700
Aberdeen 6,150
Southampton 4,000
London Gatwick 3,700
Edinburgh 3,100
Liverpool 2,400
London Luton 2,400
Leeds Bradford 2,000
London Stansted 1,900
Newcastle 1,800
East Midlands 1,200
Bristol 1,100
Bournemouth 900
Blackpool 400
Source: See footnotes 5 and 6.
Table 2.2: Size of population affected by 55Lden contour for largest European airports
AirportPopulation within the 55Lden contour
London Heathrow 725,500
Frankfurt 238,700
Paris Charles de Gaulle
170,000
Paris Orly 110,000
Brussels 49,700
Amsterdam 43,700
Madrid 43,300
Rome 34,400
Munich 7,800
What are the effects of noise?
2.8 In recent years the effects of noise pollution have become better recognised and understood. Large scale European studies such as ANASE7, RANCH8 and HYENA9 have researched how the population as a whole, and individuals in particular, can be affected by noise. The rest of this chapter focuses on some of these adverse effects and how they manifest themselves.
2.9 For the purposes of this paper it is helpful to conceptualise the effects of noise by considering them in three groups: health effects, amenity effects and productivity and learning effects, as summarised in Figure 2.2.
7 ANASE: Attitudes to Noise from Aviation Sources in England.
8 RANCH: Road Traffic and Aircraft Noise and Children’s Cognitive Health.
9 HYENA: Hypertension and Exposure to Noise near Airports.

10
Amenity/quality of life effects
Annoyance
2.10 Annoyance is the most commonly used outcome to evaluate the effect of noise on communities.10 It is a complicated psychological concept, commonly measured using an ISO defined questionnaire.11 Annoyance tends to increase as noise exposure increases, and changes in noise pitch, intermittency or other such features can also increase annoyance. Annoyance manifests itself when the noise disturbs a person’s daily life, for example interrupting a conversation or simply being a distraction while resting. Many see noise as an intrusion on their
10 Clark et al. 2007 “The effect of transportation noise on health and cognitive development: a review of recent evidence".
11 It is now standard practice to use ISO 15666 defined questionnaire. This uses as an 11 point numerical scale with end point ‘not annoyed’ up to ‘extremely annoyed’.
personal privacy, with their sense of annoyance compounded when they are unable to control the intrusion.
2.11 A number of studies have been undertaken to better understand the relationship between the level of noise and the effect it has on communities. However, it is not always possible to predict how any particular person might react to a particular level of noise. We have summarised some key studies below, with further details and discussion following in Chapter 4.
2.12 Social surveys are one means of trying to determine the extent of annoyance caused by a certain noise source, and these have been commissioned periodically for aircraft noise since the 1960s. In 1977 the first ‘dose-response’ relationship was presented, showing a relationship between the level of noise
Figure 2.2 Summary of sleep disturbance impacts
Productivity and learning impacts
Health effects Amenity/quality of life effects
Noise exposure
Hearing loss Hypertension Stress
Annoyance
Sleepdisturbance
ProductivityCognitive impairment
in children
Mental health
Source: Airports Commission adapted using WHO (2011) and Moorhouse (2009)
11
How does noise affect people?
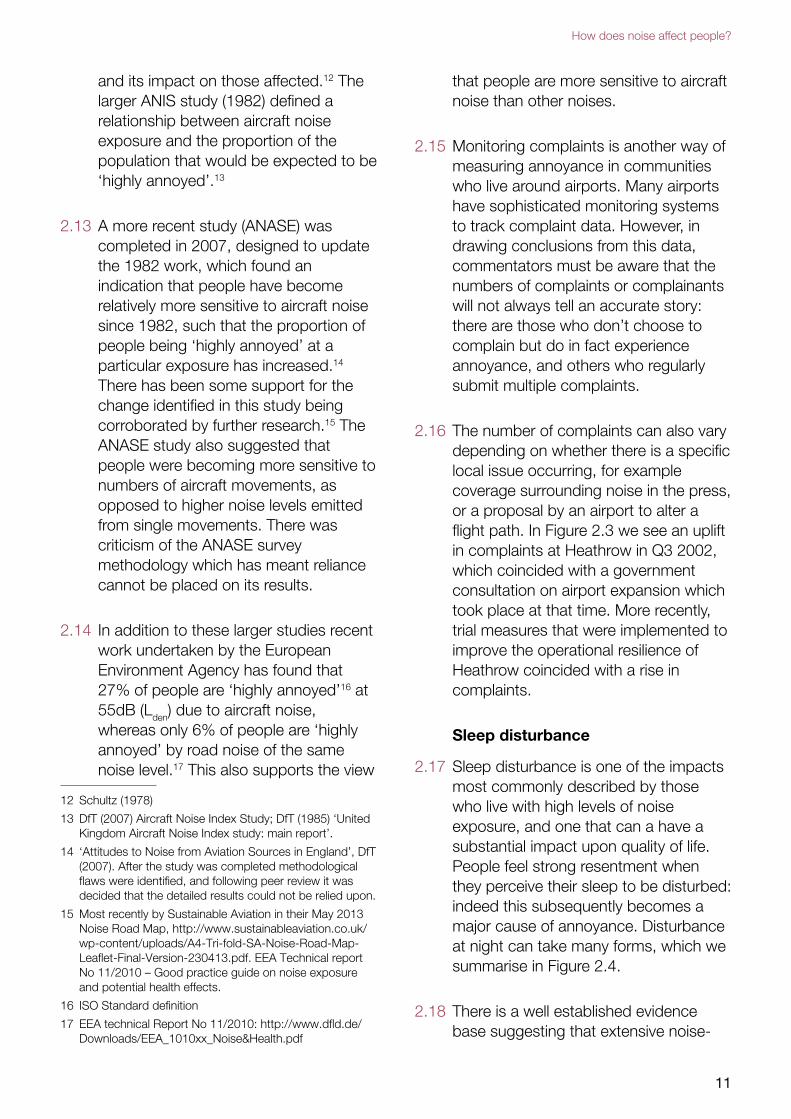
and its impact on those affected.12 The larger ANIS study (1982) defined a relationship between aircraft noise exposure and the proportion of the population that would be expected to be ‘highly annoyed’.13
2.13 A more recent study (ANASE) was completed in 2007, designed to update the 1982 work, which found an indication that people have become relatively more sensitive to aircraft noise since 1982, such that the proportion of people being ‘highly annoyed’ at a particular exposure has increased.14 There has been some support for the change identified in this study being corroborated by further research.15 The ANASE study also suggested that people were becoming more sensitive to numbers of aircraft movements, as opposed to higher noise levels emitted from single movements. There was criticism of the ANASE survey methodology which has meant reliance cannot be placed on its results.
2.14 In addition to these larger studies recent work undertaken by the European Environment Agency has found that 27% of people are ‘highly annoyed’16 at 55dB (Lden) due to aircraft noise, whereas only 6% of people are ‘highly annoyed’ by road noise of the same noise level.17 This also supports the view
12 Schultz (1978)
13 DfT (2007) Aircraft Noise Index Study; DfT (1985) ‘United Kingdom Aircraft Noise Index study: main report’.
14 ‘Attitudes to Noise from Aviation Sources in England’, DfT (2007). After the study was completed methodological flaws were identified, and following peer review it was decided that the detailed results could not be relied upon.
15 Most recently by Sustainable Aviation in their May 2013 Noise Road Map, http://www.sustainableaviation.co.uk/wp-content/uploads/A4-Tri-fold-SA-Noise-Road-Map-Leaflet-Final-Version-230413.pdf. EEA Technical report No 11/2010 – Good practice guide on noise exposure and potential health effects.
16 ISO Standard definition
17 EEA technical Report No 11/2010: http://www.dfld.de/Downloads/EEA_1010xx_Noise&Health.pdf
that people are more sensitive to aircraft noise than other noises.
2.15 Monitoring complaints is another way of measuring annoyance in communities who live around airports. Many airports have sophisticated monitoring systems to track complaint data. However, in drawing conclusions from this data, commentators must be aware that the numbers of complaints or complainants will not always tell an accurate story: there are those who don’t choose to complain but do in fact experience annoyance, and others who regularly submit multiple complaints.
2.16 The number of complaints can also vary depending on whether there is a specific local issue occurring, for example coverage surrounding noise in the press, or a proposal by an airport to alter a flight path. In Figure 2.3 we see an uplift in complaints at Heathrow in Q3 2002, which coincided with a government consultation on airport expansion which took place at that time. More recently, trial measures that were implemented to improve the operational resilience of Heathrow coincided with a rise in complaints.
Sleep disturbance
2.17 Sleep disturbance is one of the impacts most commonly described by those who live with high levels of noise exposure, and one that can a have a substantial impact upon quality of life. People feel strong resentment when they perceive their sleep to be disturbed: indeed this subsequently becomes a major cause of annoyance. Disturbance at night can take many forms, which we summarise in Figure 2.4.
2.18 There is a well established evidence base suggesting that extensive noise-

12
induced awakenings have adverse effects. However, it is less clear to what extent and at what level noise can cause harmful loss of sleep, and equally whether lesser reactions to noise, which do not involve awakening, can affect general well-being in similar ways.
2.19 Some studies find that individual night time aircraft noise intrusions are not
dramatic on a per-event basis, and that the link between outdoor noise exposure and sleep disturbance is unsubstantiated. The Health Council of the Netherlands has found that sleep disturbance is more likely to occur following a non-aircraft indoor noise, such as a baby crying, than outdoor aircraft noise.18
Figure 2.4: Summary of sleep disturbance effects
Noise event
Arousal response
Sleep stage changes
Awakenings
Body movements
Prevention from
falling asleep
Daytime performance
loss
Sleepiness
Cognitive function
deterioration
Chronic sleep
disturbance
Insomnia
Health impacts
Immediate effects
After effects
Long-term effects
Source: Airports Commission adapted using WHO (2011) and Moorhouse (2009)
18 Michaud et al. (2011) ‘Review of field studies of aircraft noise-induced sleep disturbance’.
Figure 2.3: Varia
0
1000
2000
3000
4000
5000
6000
7000
8000
9000
10000
2003
2002
Q4
2002
Q3
2002
Q2
2002
Q1
Hea
thro
w –
num
ber
of c
ompl
aint
sbility in number of complaints over time at Heathrow airport
2013
Q1
2012
Q4
2012
Q3
2012
Q2
2012
Q1
2011
Q4
2011
Q3
2011
Q2
2011
Q1
2010
Q4
2010
Q3
2010
Q2
2010
Q1
2009
Q4
2009
Q3
2009
Q2
2009
Q1
2008
Q4
2008
Q3
2008
Q2
2008
Q1
2007
Q4
2007
Q3
2007
Q2
2007
Q1
2006
Q4
2006
Q3
2006
Q2
2006
Q1
2005
Q4
2005
Q3
2005
Q2
2005
Q1
2004
Q4
2004
Q3
2004
Q2
2004
Q1
2003
Q4
2003
Q3
2003
Q2
Q1
Source: CAA

13
How does noise affect people?
2.20 The impact of noise disturbance also appears to be dependent on the age of those disturbed. For example, adults have been found to be more likely to be awakened or suffer from disturbed sleep patterns than children. The same Health Council study of the Netherlands has found that children are less likely to be awakened by a noise event than adults, but also observed that cardiovascular responses are more pronounced in children than adults.19
2.21 Finally, some evidence suggests that air traffic is less likely to cause sleep disturbance than road traffic. This may be because at night time road traffic noise is more changeable, and less predictable. Living less than 20 metres from a busy road has been linked to the onset of insomnia; no such linkage, as far as we are aware, has been proven for aircraft noise.20
2.22 We consider the question of night noise impacts further in Chapter 4.
Health effects
Hypertension
2.23 The link between noise and hypertension is fairly well established through evidence collected from a number of longitudinal and cross sectional observation studies. The most common hypothesis from medical studies is that noise events can place the body under stress, even when a person displays no conscious reaction to the noise. When stressed the body releases hormones which increase a person’s heart rate and blood pressure, though the resultant impact will vary from person to person. It is then well
19 The Health Council of the Netherlands (2004) ‘The influence of night-time noise on sleep and health’.
20 London Health Commission (2003) ‘Noise & health: making the link’.
understood that high blood pressure can lead to cardiovascular diseases, stroke, chronic renal failure and myocardial infarction (heart attack).
2.24 Relative to other risk factors, such as smoking and lack of exercise, noise has a relatively small impact on hypertension.21 For example, the estimated relative risk of developing coronary heart disease when regularly exposed to environmental noise above 65-70dB(A) is 1.1-1.5; for a regular smoker this risk is estimated to be between 2-3.8; and for someone who is physically inactive or obese the risk is estimated to lie between 2.1 and 3.4.22
2.25 Some of the earliest studies to investigate hypertension, around Schiphol airport in Amsterdam, found that medical treatment for hypertension and cardiovascular trouble was correlated with aircraft noise.23 The European HYENA study, which focused on a number of major European airports, corroborated this conclusion, finding that night time aircraft noise and day time road traffic noise were associated with increased hypertension after adjusting for other factors.24 Using the HYENA study data other researchers have found that aircraft noise events are associated with an elevation of blood pressure25, and that there is an increased use of antihypertensive
21 Moorhouse (2009) ‘Environmental noise and health in the UK’
22 Noise: Babish, 2006; Smoking: Prescott et al. (1998); and lack of exercise: Hu et al. (2005) and Li et al. (2006). Relative risk numbers vary in the literature; the quoted figures were found to be broadly representative of the available range.
23 Knipschild (1977) ‘Medical effects of Aircraft Noise: community cardiovascular survey’
24 Jarup et al., (2008) “Hypertension and exposure to noise near airports – the HYENA study”
25 Haralabridis et al (2008) “Acute effects of night noise exposure on blood pressure in populations living near airports”

14
medication in areas experiencing aircraft noise.26
2.26 Whilst the general association between noise and hypertension is well evidenced, further work is needed to better understand this relationship.
Hearing loss
2.27 WHO guidance suggests that hearing impairment is not expected to occur at or below a noise level of 75dBLAeq, even for prolonged occupational noise exposure. This figure refers to noise experienced at the ear. Such high levels of noise exposure are largely confined to people within aerodrome boundaries, who must wear protective aural equipment. The risk of aircraft noise causing hearing damage to wider communities is not, therefore, seen as a significant cause for concern.
Mental health
2.28 As already mentioned, noise can cause significant annoyance. As a consequence, some have hypothesised that this could lead to mental health issues. Studies suggest most psychological symptoms caused by noise relate to anxiety and depression, rather than any clinically diagnosable psychiatric disorder.27 One study in Japan has found that people exposed to noise levels above 70dB(A)Ldn
28 have higher rates of mental instability and depressiveness.29 Another study, which took a clinical approach, found that those living closer to airports showed a
26 Floud, S. et al. (2008) Medication use in relation to noise from aircraft and road traffic in six European countries: results of the HYENA study.
27 Stansfeld, et al. (1993). Road traffic noise, noise sensitivity and psychological disorder.
28 Another metric we discuss in Chapter 3.
29 Hiramatsu, K., et al. (1997). A survey on health effects due to aircraft noise on residents living around Kadena airport in the Ryukyus’.
higher frequency of ‘generalised anxiety disorder’ and ‘anxiety disorder not otherwise specified’.30 However, the link is by no means clear cut: a longitudinal study surrounding Schiphol airport found no link between noise exposure and mental health following the opening of a fifth runway.31
2.29 Experts in this area have suggested that there is insufficient research, especially surrounding longitudinal studies, to draw firm conclusions around this topic.32
Productivity and learning effects
Cognitive impairment in children
2.30 The evidence surrounding cognitive impairment in children exposed to noise is somewhat clearer than that surrounding other noise impacts on children. Over 20 studies, both epidemiological and experimental, have shown negative effects of noise on reading ability and memory development in children.33 Several links between chronic noise exposure and children’s cognition have been suggested, including teacher and pupil frustration, learned helplessness, impaired attention, increased arousal, indiscriminate filtering out of noise during cognitive activities resulting in loss of attention, noise annoyance, and sleep disturbance. These impacts are magnified when learning activities are undertaken outdoors. Noise has been commonly shown to affect children’s central processing and language skills, reading
30 Hardoy, M.C., et al. (2005). Exposure to aircraft noise and risk of psychiatric disorders.
31 van Kamp, I., et al. (2007). Environmental noise and mental health: Evidence from the Schiphol monitoring program. In Internoise 2007.
32 Clark, C & Stansfeld, S. A. (2007) The Effect of Transportation Noise on Health and Cognitive Development: A Review of Recent Evidence.
33 Evans, G. W. & Hygge, S. (2007) ‘Noise and performance in children and adults’.

15
How does noise affect people?
comprehension, memory and attention ability. These effects could seemingly impair long term educational attainment, though this aspect is less well evidenced.34
2.31 When considering cognitive impairment, the source of noise has also been found to be an important factor. The European RANCH study found that road traffic noise had no observed effect on children’s reading or memory (in fact episodic memory showed better performance in higher road traffic areas).35 With aircraft noise, however, the study showed that students suffered impaired reading comprehension and recognition memory. This is likely to be because of the transient nature of aircraft movements, with short term peaks in noise affecting concentration and providing distraction. On the other hand, it is more likely that children will habituate to road noise during school hours, as it is generally experienced at a more constant level.36
2.32 The effects of noise on primary school children have been well evidenced, and are found to be particularly acute. The effects of noise on secondary school children have been found to be less acute, suggesting that the detrimental effects of noise exposure could diminish with age.
Productivity
2.33 The productivity effects of noise are mostly secondary and feed through from the effects mentioned previously in this
34 Clark et al. (2006) ‘Exposure – effect relations between aircraft and road traffic noise exposure at school and reading comprehension: the RANCH project’.
35 Stansfeld, S. A., et al (2005) ‘Aircraft and road traffic noise and children’s cognition and health: a cross-national study’.
36 Clark et al. (2006) ‘Exposure-effective relations between aircraft and road traffic noise exposure at school and reading comprehension: the RANCH project’.
chapter. The main ways in which noise is linked with productivity are:
●● sleep disturbance impacting upon next day productivity;
●● productivity impact from the health effects of noise;
●● links between academic performance and noise; and
●● environmental noise and workplace distraction.
2.34 Some very recent work undertaken by the Government’s Interdepartmental Group on Costs and Benefits (IGCB) attempts to summarise the latest thinking on this, by considering how each of these pathways feeds through to productivity losses. Figures 2.5 and 2.6 summarise these pathways. We return to this topic in Chapter 4.
Areas of tranquillity
2.35 Most of what has been discussed so far relates to the negative effects of noise, rather than the benefits associated with the absence of noise. Tranquillity is seen by many as a valuable resource, which can increase feelings of calm and well-being and have positive effects on a person’s quality of life. The National Planning Policy Framework also recognises the value of tranquility.37
2.36 There is also evidence that quiet areas are of value to people, for example, 91% of respondents to a survey stated that quiet areas (such as country parks, woodland and open spaces in urban areas) need protecting, with almost one third of respondents visiting quiet areas
37 http://www.cpre.org.uk/what-we-do/countryside/tranquil-places/in-depth/item/1688-how-we-mapped

16
on a regular basis.38 The Environmental Noise Directive (2002/49/EC) and National Noise Policy Framework both recognise the value of these areas, and the former requires Member States to preserve environmental noise quality where it is already regarded as ‘good’.
Conclusion
2.37 Recent research has led to a better understanding of the impacts of noise pollution from various sources, though further research in some areas is still needed. A number of causal links between noise exposure and health effects, such as hypertension, have been fairly well established. Studies have
38 ICM (2009), www.soundscope-cost.org/documents/Brighton_2011Cost_Brighton_areas_policies_Grimwood.pdf
also shown noise to lead to cognitive impairment in children, and reduced productivity. These impacts can result from noise in workplaces and schools, and sleep disturbance.
2.38 The Commission is interested in views on these issues. In particular we would like to invite submissions which shed light on any other relevant evidence or research that the Commission should be aware of. Chapter 4 considers further the techniques which can be used to quantify the impacts mentioned in this chapter.
Figure 2.5: Pathways linking noise experienced during work hours to productivity
Noise disturbance at
work
Loss of concentration
Disruption to communication
Stress and pressure
Errors or inefficiency
Loss of focus
Short term health impacts
Accidents or personal injury
Short/long term
absence Lost
productivity
Source: Airports Commission (adapted using Muirhead et al. (2011))
Figure 2.6: Pathways linking noise experienced outside working hours to productivity
Noise disturbance
outside of work
Stress and pressure
Sleep disturbance
Loss of quiet/tranquil areas
Errors or inefficiency
Accidents or personal injury
Tiredness/loss of
concentration
Short/long term
absence
Lost productivity
Source: Airports Commission (adapted using Muirhead et al. (2011))

17
Measuring aviation noise
3. Measuring aviation noise
3.1 Whereas the previous chapter considered noise from a range of sources, including noise from other surface transport such as road and rail, from this point forwards this discussion paper will consider aviation noise exclusively.
3.2 This chapter examines some of the various noise measurement methodologies that are in use today, and explores how assessments of the prevalence of noise are sensitive to the way in which noise is described and displayed.
3.3 To begin, the chapter explores the scales upon which noise can be measured, before considering in turn how to measure single noise events and long term noise exposure. With regard to this last topic, we focus upon five potential methods of assessing long term noise exposure, identifying along the way where and how these methods are used in various UK, European and international contexts.
3.4 The chapter then moves to a consideration of the noise context established by the Aviation Policy Framework (APF), before ending with a series of questions on how the Commission should assess noise impacts when considering proposals for making better use of existing capacity, or for new airport infrastructure in the longer term.
The science of sound
3.5 Sound is energy passing through the air in the form of small fluctuations in air pressure. These fluctuations are detected by the ear or the microphone on a noise monitor. The rate at which these fluctuations occur is the ‘frequency’ of the sound.
3.6 The human ear responds to sound over a wide range of frequencies but with different sensitivities (for example, very high pitched noises are often not picked up by the human ear). A variety of frequency weightings have been developed to align with the way the human ear hears. The most commonly used is the A-weighted sound level, which is widely used to quantify sound from all modes of transport. Sound is usually expressed in terms of decibels (dB); A-weighted decibels are expressed dB(A).39
3.7 Table 3.1 shows approximate sound pressure levels for different activities or situations.
39 All future references to noise levels in this paper are given in dB(A). To save space when considering longer period noise exposure metrics, we will not state dB(A) alongside the number of decibels. To avoid confusion, within the paper we use frequency to mean sound waves, rather than the number of times something occurs.

18
Table 3.1: Approximate sound pressure level (LpA) for different activities or situations
Situation
Sound Pressure Level LpA dB(A)
Threshold of pain 130
Threshold of discomfort 120
Chainsaw, 1m distance 110
Disco, 1m from speaker 100
Diesel truck pass-by, 10m away 90
Kerbside of busy road, 5m away 80
Vacuum cleaner, distance 1m 70
Conversational speech, 1m 60
Quiet office 50
Room in quiet, suburban area 40
Quiet library 30
Background in TV studio 20
Rustling leaves in the distance 10
Hearing threshold 0
Source: Airports Commission, based substantially on http://www.sengpielaudio.com/TableOfSoundPressureLevels.htm
3.8 As the vagueness in some of the table’s descriptors makes clear, it is difficult to accurately calibrate sound levels with sound, or noise, events.
3.9 To explain this further: how people perceive noise depends on at least three physical characteristics – the magnitude of the noise, the frequency of the noise, and its duration. The descriptors or indicators used to describe noise are designed to bring together these features in a way that reflects how they impact on people in combination.
3.10 However, whilst each of these characteristics can be measured discretely, the effect of the noise is
subjective, varies between individuals and is, therefore, not easy to quantify. Ascertaining the effect of a noise on an individual is a little like judging the difficulty of a workout involving different weights and exercises. Whilst simple conclusions can be drawn relating to one characteristic of a workout (a heavy weight is harder to lift than a lighter weight), it becomes harder to make these judgements the more variables come in to play (was it harder for someone to lift the heavy weight for five seconds or the lighter weight for ten seconds?).
3.11 The assessment of noise, therefore, is inherently complex. And one further complexity to consider, before we begin our discussion of individual noise metrics, is the question of what to assess noise against. One approach is to consider noise relative to pre-existing background sound levels. Broadly speaking, the logic here is that someone will not notice a new noise unless it exceeds the background noise. The alternative approach is to consider the absolute levels of noise.
Quantifying the noise from a single aircraft event
3.12 Having considered the scale used to capture noise, a decision must be made as to what feature of the noise you are seeking to capture. For instance, a measurement could capture all of the noise in a noise event, all of the noise in a noise event above a certain level, or a measure of the duration of the events.

19
Measuring aviation noise
Maximum sound pressure level – LAmax
3.13 The simplest measure of a noise event such as the over-flight of an aircraft is the maximum sound level that occurred during the event, measured in dB(A). As the name implies, it is the highest sound level that occurred during the over-flight. The greater the value, the greater the risk of disturbance or intrusion.
Sound Exposure Level – SEL
3.14 The Sound Exposure Level (SEL) of a noise event is the sound level, in dB(A), of a one second burst of steady noise that contains the same total sound energy as the whole event. In other
40 Most of the sound energy recorded from an aircraft is concentrated in the highest sound levels. This is why the size of the SEL bar in the diagram does not correspond to the size of the sound pressure level of the entire event history.
words, it is the value that would be measured if the energy of the entire event were compressed into a constant sound level lasting for one second. This measure combines information about the maximum level and the duration of the event. Figure 3.1 gives an illustration of the time history of an aircraft flyover showing the LAmax and the SEL value.
3.15 For aircraft flyovers, the value of an SEL of an event is always higher than the corresponding LAmax. As a rule of thumb, the numerical difference between SEL and LAmax for aircraft on departure is 10dB(A); and on arrival is 8dB(A).
Figure 3.1: Aircraft time history, showing maximum level LAmax and associated Sound Exposure Level (SEL)41
50
60
70
80
90
100
Time (seconds)
Sou
nd P
ress
ure
Leve
l (dB
A)
a/c SEL:92.4dBA
a/c Lmax:82.5dBA
Source: CAA data

20
3.16 Recording the levels of individual aircraft noise events is useful for many purposes (including aircraft certification). However, in order to assess the full impact of environmental noise exposure, it is necessary to take into account the combined impact of many events over longer periods – hours, days, months, years – on those affected by aircraft noise.
Longer period noise exposure
3.17 Over a period of time, noise events will differ in magnitude, will occur at different times of day, and will occur more or less often in different hours of the day. This leads to a need for an indicator that can balance noise magnitude, noise frequency, noise duration and the number of noise events over a given period.
3.18 We consider five such indicators that are in use around the globe. Table 3.2 summarises these indicators.
Table 3.2: Summary of various longer period noise exposure indicators
Indicator nameIndicator symbol
Equivalent Continuous Sound Level Leq, or LAeq.
Number Above contours, sometimes called Frequency contours.
N
Person Events Index or Average Individual Exposure
PEI, AIE
Airport Noise Efficiency None
Various location specific measurements
None
Source: CAA
1. Equivalent Continuous Sound Level
3.19 Since 1975, the measure used to describe longer period noise exposure (used beyond aviation to measure most environmental noise exposure) has been
Equivalent Continuous Sound Level (Leq). This measure continues to take account of the Sound Exposure Level of individual noise events, but also captures the number of times these events occur. Leq is most commonly used with the A weighted scale, expressed as LAeq.
3.20 When considering LAeq, it is always necessary to quote the time period over which the LAeq applies. In general terms it is expressed as LAeq,T where ‘T’ is the relevant time period. Thus for aircraft noise LAeq is normally displayed as shown in Table 3.3, depending on whether it averages noise during the day, the night, or over 24 hours (but with specific weightings for certain times of day).
Source: Airports Commission, based on table in Draft Aviation Policy Framework (2012)
3.21 For many years, UK airports have produced noise impact information in contours showing locations of equal noise exposure in terms of LAeq16h. An
Table 3.3: Common LAeq indicators
Most common uses (in Europe)
LAeq16h
The A-weighted average sound level over the 16 hour period of 0700 -2300, on an average summer day.
LAeq8h
The A-weighted average sound level over the 8 hour period of 2300 -0700, on an average summer night.
Lden
Lden is a composite of the Lday (LAeq
0700-1900 hours) Levening (LAeq 1900 -2300 hours) and Lnight (LAeq 2300-0700 hours) levels but with a five dB(A) weighting being added to the Levening
value and 10 dB(A) weighting being added to the Lnight value, on an annual average day.
Other uses
LDNL
An LAeq with a 10dB penalty added to night operations, used predominantly in America.

21
Measuring aviation noise
example of noise contours in terms of the LAeq16h is shown in Figure 3.2 for Birmingham Airport. In effect, these contours are presenting the average sound level experienced within these areas between the hours of 0700-2300. Also shown, in Table 3.4, are the
number of homes and the number of people living within the various contour areas. All these values provide a description of the aircraft noise impact of the airport. Further examples of LAeq16h contour mapping for UK airports can be found on their websites.
Figure 3.2: Noise contours at Birmingham Airport in terms of LAeq16h
Source: 2006 Strategic Noise Mapping, Defra

22
Table 3.4: Estimated total number of people and dwellings above various noise levels around Birmingham Airport, LAeq16h
Noise level (dB(A))
Number of dwellings
Number of people
54 16,750 37,400
57 8,350 18,900
60 3,350 7,500
63 950 2,000
66 50 100
69 0 0
Source: 2006 Strategic Noise Mapping, Defra
3.22 The Environmental Noise Directive requires certain airports (civil airports, designated by Member States, which have more than 50,000 aircraft movements a year) to map their noise impacts every five years using LDEN
(day-evening-night level), an LAeq measure which incorporates penalties or weightings for certain hours of the day designed to reflect people’s greater sensitivity to noise within these periods (see Table 3.3). To compare the noise effects of UK airports with European airports it is necessary to use LDEN contours. Examples of LDEN contour mapping at Paris Charles de Gaulle and Brussels Airport are provided at Annexes A and B respectively (note, Brussels does not display the same contour lines in every map).
3.23 LDEN has been criticised in the past for the lack of scientific evidence that supports the additional decibel weightings it places on evening and night noise. Also, because it maps noise over the full 24 hours, it is not sensitive to changes in airports’ operations, particularly at night (which tend to make up a far lower proportion of an airport’s total traffic movements than day flights). The relative pros and cons of different
LAeq measures have been long debated, not least in the recent draft APF, Annex D.41 We return to this topic at the end of this chapter.
2. Number Above (N), or Frequency, contours
3.24 Whilst LAeq provides a good measure of the overall noise impact of an airport, it cannot on its own provide sufficient detail to understand what it is really like to experience a certain noise exposure. This is because a value of, say, 65LAeq16h can be made up of 45 events at 96 dB(A) SEL or 450 events at 86 dB(A) SEL. Furthermore, the measure is not easy for a non-technical audience to interpret. For this reason, when consulting on the construction of Sydney’s third runway in 1995, the Australian Department of Infrastructure and Transport devised a metric based on the number of noise events (aircraft movements) that reach or exceed a certain dB(A) threshold within a given time period. This measure, called Number Above or N contours (or, in Europe, Frequency contours), may be more easily understood by the public than LAeq.
3.25 Typically these contours are produced showing N70 values (the number of events that have a maximum external level of 70dB(A) or more), but any other dB(A) level can be selected for plotting.42 Typically, contours ranging from 10 events to 500 events over 70 dB(A) Lmax are plotted. An example of N70 contours at Canberra Airport is shown at
41 http://assets.dft.gov.uk/consultations/dft-2012-35/draft-aviation-policy-framework.pdf.
42 The level of 70 dB(A) Lmax was selected because it corresponded to an internal noise level that was considered to be likely to interfere with conversation or listening to the radio or television (the 70 dB(A) figure allows for about 10 dB(A) attenuation through the fabric of a house with its windows open – in effect plotting, therefore, a 60 dB(A) contour for those indoors).

23
Measuring aviation noise
Figure 3.3. Examples of N70 contours at Brussels Airport can be seen at Annex B, where they can be compared alongside LAeq contours.
Figure 3.3: N70 contours for Canberra Airport
10-20 events per day
20-50 events per day
50-100 events per day
100-150 events per day
150-200 events per day
200+ events per day
20 - 50 Events per day10 - 20 Events per day
50 - 100 Events per day
100 - 150 Events per day
200+ Events per day
150 - 200 Events per day
Source: The Australian Department of Infrastructure and Transport http://www.infrastructure.gov.au/aviation/environmental/transparent_noise/guidance/part2.aspx#12
3.26 By showing numbers of noise events, N70 contours may be used to address the common criticism that LAeq contours do not show clearly how often aircraft flyovers occur. For example, when displaying noise with N70 contours, increases in the number of movements that breach a marked threshold are more readily displayed than changes to LAeq contours, which alter their shape according to a logarithmic, non-intuitive scale.
3.27 Equally, it may be argued that N contours more accurately portray the
reality of living under a flight path. The layman may find it easier to relate to the thought ‘within this area, I am likely to hear noise exceeding x limit more than 100 times a day’, than ‘within this area, I am likely to be subject to x level of noise, averaged out over y hours’.
3.28 However, N70 contours do not differentiate between the level of noise above a certain threshold, or the duration of noise events. So an event of 10 second duration with a maximum level of 71 dB(A) counts exactly the same as an event of 40 second duration with a maximum level of 91 dB(A).
3.29 In Australia, N70 metrics do not replace the Australian ANEF (their version of LAeq) system, which remains the metric for use in Australian policy making. The Australian position is that N70 contours are a supplementary method to LAeq; this is also the position of the CAA in the UK.
3.30 Both LAeq contours and N70 contours can be produced for short, defined timeframes, and are therefore able to provide information on the noise impacts that occur when an airport operates in a certain mode or at a certain time of day.
3. Person Events Index and Average Exposure Indicator
3.31 As part of the same consultation on Sydney Airport’s third runway, the Australian Department of Infrastructure and Transport coined two additional means of assessing an airport’s noise effect, both of which build on N contours.
3.32 As we have seen, N contours provide a measure of the number of events above a specified level at a given location. The Person Events Index (PEI) turns this measure from a consideration of impact

24
on a location to impact on a population, by estimating how many houses, and therefore how many residents, are exposed to certain noise levels. This figure can then be summed to give a measure of the total noise ‘load’ that the airport imposes on a surrounding population. Minimising PEI is similar, therefore, to minimising the LAeq or LDEN noise contour area.
3.33 The Average Individual Exposure (AIE) is simply the total PEI divided by the number of residents exposed above the threshold level, thereby giving a measure of the average number of events per person within a defined area.
3.34 The PEI and AIE metrics are useful when considering how noise is shared around a local population. They allow decision makers (within the limitations of N contour method, summarised above) to understand the extent to which noise is impacting upon a population area, and the extent to which noise is impacting individuals within that population. For example, measures such as distributing aircraft noise over a greater number of flight paths will increase the total PEI, yet decrease AIE. This topic is discussed further in the Sydney Airport case study in Chapter 5.
4. Relevant ‘noise efficiency’ of airports
3.35 Noise contours, be they N contours or LAeq contours, can be and are used to compare the noise impact of different airports. We saw this in Chapter 2, Table 2.1, which ranked airports in relation to the number of people living within their 57LAeq16h contours.
3.36 This type of comparison does not take account of the productivity of the airport, which is typically expressed in terms of
either a) the annual number of Air Transport Movements (ATM), or b) the annual number of passengers using the airport. It is possible to design longer period noise exposure metrics which take this into account.
3.37 Table 3.5 compares the same airports as were listed in Table 2.1, but does so in terms of the two indicators named above that pertain to the productivity of the airport:
●● the population within the 57LAeq16h contour per annual ATMs;
●● the population within the 57LAeq16h contour per annual passengers that use the airport.43
In effect, the new metrics are attempts to describe the noise efficiency of the airports.
3.38 This analysis throws up some interesting discussion points. Of the UK’s larger airports, all of Luton, Gatwick, Stansted and Manchester position better under the revised metrics than they do under a simple population survey comparison. It could be argued, therefore, that these airports are relatively more noise efficient than other UK airports.
3.39 The Commission is interested in exploring the idea of noise efficiency further, and would be interested to hear stakeholders’ views on the suitability of these metrics for assessing and comparing airport noise impact.
5. Location specific measurement3.40 Having discussed a range of noise
metrics that are typically used to assess noise impacts over a wide area, we turn finally to a consideration of how to show
43 All numbers quoted for passengers and aircraft movements are taken from CAA data, 2006.

25
Measuring aviation noise
argest airports, as per
assengers
mber of
given time period. Portraying this information in a single indicator is an inevitable compromise. No single indicator can fully describe the noise exposure at a given location.
Table 3.5: Size of population affected by aircraft noise at the UK’s lproductivity of airport
Original ranking Movements P
Airport ranking as per population within 57LAeq16hr contour (see table 2.1)
Movements (2006)
Number of aircraft movements per person affected within
57LAeq16hcontour
Revised Ranking
Terminal and Transit Passengers (2006)
Nupassengers per person affected within
57LAeq16hcontour
Revised Ranking
Blackpool 65,990 165.0 Blackpool 23,687,013 12467London Stansted
Bournemouth 206,693 108.8London Stansted
34,163,579 9233London Gatwick
Bristol 75,505 83.9 Bournemouth 5,757,963 5235 Bristol
East Midlands 84,583 76.9 Bristol 4,727,996 3940 East Midlands
Newcastle 88,592 73.8 East Midlands 9,425,908 3927 London Luton
London Stansted 263,363 71.2London Gatwick
5,431,976 3018 Newcastle
Leeds Bradford 116,131 48.4 London Luton 8,611,345 2778 Edinburgh
Liverpool 81,655 45.4 Newcastle 4,963,776 2068 Liverpool
London Luton 126,914 40.9 Edinburgh 2,792,686 1396 Leeds Bradford
Edinburgh 91,263 38.0 Liverpool 552,724 1382 Blackpool
London Gatwick 66,921 33.5Leeds Bradford
964,442 1072 Bournemouth
Southampton 116,971 19.0 Aberdeen 22,442,855 638 Manchester
Aberdeen 55,786 13.9 Southampton 8,848,755 604 Glasgow
London City 79,436 11.9 London City 3,164,042 514 Aberdeen
Glasgow 110,034 7.5 Glasgow 9,147,384 484 Birmingham
Birmingham 229,729 6.5 Manchester 1,912,979 478 Southampton
Manchester 119,490 6.3 Birmingham 2,358,184 352 London City
London Heathrow
477,048 1.8London Heathrow
67,527,923 261London Heathrow
Source: Airports Commission
the distribution of single event noise levels at individual locations.
3.41 As discussed earlier, aircraft noise can vary in terms of its magnitude, frequency and duration for each noise event, and also for how many events occur in a

26
3.42 However, attempts have been made to show multiple characteristics of single noise events at individual locations. Figure 3.4, taken from Stansted’s Generation One planning application (2006), is one example: the diagram shows, for an average day, the range of maximum noise levels (x axis) and the numbers of flights that would feature in this range (y axis), in one specific location, under a range of different planning applications.44
3.43 The CAA is currently considering the possibility of providing noise information for individual, postcode specific locations, which may look a little like the information in Figure 3.4 (the CAA is currently consulting on whether to use its Information Powers to develop the required data framework to provide such information). Theoretically, it would
44 In the key ‘mppa’ stands for millions of passengers per annum. The different coloured lines, therefore, correspond to increasing passenger limits at Stansted.
be possible to break the distribution shown in Figure 3.4 down into different time periods. The Commission is interested in the possible uses and merits of capturing and displaying data along these lines.
Choosing between long term noise exposure metrics
3.44 As noted previously, in the UK LAeq16h is the main metric used to determine the long-term noise impact of an airport.
3.45 In recent years, the question of which LAeq16hr noise contours should be used to describe noise around airports has been a contentious one. Historically, UK policy has been to use 57LAeq16h as the level of daytime noise marking the approximate onset of significant community annoyance. This value has influenced the production of annual contour maps at many airports, and has previously had significance in planning terms. (Certain
Figure 3.4: Histogram of LAmax noise exposure levels for a given location
Source: Stansted Generation One planning application, 2006, from CAA records

27
Measuring aviation noise
e questions can be link.46
airports must also map contours to 55LDEN, in line with the requirements of the Environmental Noise Directive.)
3.46 However, many groups argue that focussing on those affected within the 57LAeq16h contour does not adequately represent the adverse effects of noise felt by communities around airports. This is firstly because the average contour does not accurately reflect the day to day experience of people that hear aviation noise (in short bursts of intense noise, rather than as a constant sound), and secondly because adverse impacts are also felt outside of the 57LAeq16h contour.
3.47 The Department for Transport’s Draft Aviation Policy Framework (APF) (2012) addressed both of these objections, acknowledging that ‘the balance of probability is that people are now relatively more sensitive to aircraft noise than in the past‘, and that ‘an average noise figure may not be meaningful for individuals’: ‘knowing that an area lies within the 57-60 dB LAeq16h average daytime noise contour will not necessarily help a person considering buying a house near an airport to understand the typical noise that would be experienced’.45
3.48 Accordingly the Draft APF invited views from consultees on this topic, asking the questions Do you agree that the Government should retain the 57 dB LAeq, 16h contour as the average level of daytime aircraft noise marking the approximate onset of significant community annoyance? and Do you think that the Government should map noise exposure around the noise designated airports to a lower level than 57dBA? The Government’s Summary of
45 Draft Aviation Policy Framework, Annex D.
Responses to thesfound at the below
3.49 The Government’s response to consultation on the APF decided against using a lower contour value to mark the approximate onset of significant community annoyance. But the APF noted that ‘This does not preclude airports from producing results to a lower level or using other indicators to describe the noise impact of their operations, as appropriate’ and went on to ‘recommend that average noise contours should not be the only measure used when airports seek to explain how locations under flight paths are affected by aircraft noise […] the Government encourages airport operators to use alternative measures which better reflect how aircraft noise is experienced in different localities.’ The APF did state that ‘to improve monitoring of the specific impact of night noise, we will also ensure that separate night noise contours for the eight-hour night period (23:00-07:00) are produced for the designated airports’ (i.e. LAeq8h contours for Heathrow, Gatwick and Stansted).
3.50 The Airports Commission has an opportunity to contribute meaningfully to the debate on long term noise exposure metrics that played out in the formulation of the APF. In assessing options to increase UK airport capacity, the Commission will undertake a series of noise assessments. Whilst these assessments will include using the 57LAeq16h
the APF, they will also provide opportunities to trial and, perhaps, establish or receive endorsement for additional ‘alternative measures […] to
mapping approach outlined by
46 https://www.gov.uk/government/uploads/system/uploads/attachment_data/file/154561/consultation-responses.pdf

28
better reflect how aircraft noise is experienced’. We believe we have outlined some options for this within this chapter.
3.51 In addition to considering ‘alternative measures’, one option for noise assessment is to produce noise contour maps to a level of LAeq16h lower than 57dB. The APF and its consultation documents give explanations of the various options for altering the level of daytime noise marking the approximate onset of significant community annoyance, and the arguments for or against these changes. The Airports Commission is interested in hearing submissions on this topic, especially if they bring new evidence or arguments to the debate.
3.52 Perhaps of greater interest is the option of exploring a long term noise exposure metric that is a departure from, or which builds upon, the LAeq averaging model. To this end, the Commission is interested in submissions on alternative longer period noise exposure metrics.
3.53 Finally, any new airport capacity that the Airports Commission considers necessary to introduce could come either from a brand new airport at a location previously unaffected by aircraft noise, or from the expansion of an existing airport. This observation returns us to the consideration, in paragraph 3.11, of the difference between assessing noise as an absolute level, versus the assessment of noise against already existing background levels, and the question of how best to characterise the existing noise environment currently unaffected by aircraft noise. We would welcome views on which measures we should use to help us compare these different types of proposal. Any measures would need to enable a
robust comparison of the noise impacts to be made, but also be able to describe to those potentially affected what it would be like to live with the new capacity.
Conclusion
3.54 This chapter has examined some of the noise measurement methodologies that are currently in use, including ways of measuring noise from single aircraft events, as well as methodologies for measuring longer period noise exposure. Whilst any further noise assessments undertaken by the Commission will need to include the current 57LAeq mapping approach, they will also provide opportunities to trial alternative measures that might better reflect how aircraft noise is, or some aspects of aircraft noise are, experienced.
3.55 In responding to the issues raised in this chapter, submissions may wish to consider the following questions:
●● What is the most appropriate methodology to assess and compare different airport noise footprints? For example:
– What metrics or assessment methods would an appropriate ‘scorecard’ be based on?
– To what extent is it appropriate to use multiple metrics, and would there be any issues of contradiction if this were to occur?
– Are there additional relevant metrics to those discussed in this chapter which the Commission should be aware of?
– What baseline should any noise assessment be based on? Should an assessment be based on absolute noise levels, or on

29
Measuring aviation noise
changes relative to the existing noise environment?
– How should we characterise a noise environment currently unaffected by aircraft noise?

30
4. Quantifying noise effects
4.1 Having outlined a range of methodologies for measuring noise levels, Chapter 4 considers how we assess the effects of noise on communities and individuals, and how these can be monetised for the purpose of cost-benefit analysis. Defining links between noise levels and their effects on individuals, which differ from person to person, presents particular challenges which make this an area of significant debate.
4.2 Over recent decades, a number of techniques have been developed to measure the human response to noise. This chapter will discuss how these techniques have evolved and the options for quantifying noise effects today, paying particular attention to day time and night time noise. It concludes by considering a number of potential methodologies for monetising noise impacts.
How noise is assessed
4.3 There are two key elements in any assessment of noise. The first is a measurement of the extent of exposure to noise, for example the size of the population that is affected by noise at a certain level. The second is a judgement as to the extent to which that exposure is having an adverse effect. The second of these factors is particularly challenging and a number of studies have tried to tackle it. To better understand the adverse effects, studies have commonly used one of two approaches:
●● a simple noise and social survey, asking respondents to comment on levels of noise or noise exposure and make subjective judgements regarding their reaction to it (now commonly undertaken using an internationally standardised questionnaire); and
●● laboratory study, where a person is exposed to a particular level of noise under laboratory conditions, and their responses are captured and measured.
4.4 In either case, with a sufficient number of respondents or subjects, it is possible to derive a ‘dose-response’ relationship – that is, an articulation of the change brought about in a subject under a set level of exposure. Once such a relationship has been derived, it is possible to predict the likely response of a population to a particular level of noise exposure.47
Day time noise: early studies
The Wilson Committee and the Noise and Number Index
4.5 In 1961, the Wilson Committee, which was set up to examine ‘the problem of noise’, completed a social survey to examine the extent of disturbance and annoyance caused by aircraft noise around Heathrow. It was the first study of its kind. The survey was
47 Moorhouse (2009), ‘Environmental noise and health in the UK’.

31
Quantifying noise effects
complemented by a programme monitoring aircraft movements and their associated noise levels.
4.6 The study found a strong correlation between the degree of annoyance felt and the number of complaints made, concluding that community annoyance could be considered an appropriate indicator of noise effects. Significantly, however, it was found that complainants were not necessarily representative of the general population.
4.7 Following the investigation the Committee devised the Noise and Number Index (NNI), using the relationship between perceived annoyance and actual noise exposure, which they proposed should be used to describe the aircraft noise climate thereafter. The NNI was a measure of the daily aircraft noise exposure at any point in the study area, taking into account both the average number of aircraft heard and their average noise levels.48
48 http://www.caa.co.uk/docs/33/ERCD7907.pdf
Figure 4.1: ‘Schultz curve’ relationship between percentage of respondents highly annoyed and noise exposure level
Source: Schultz (1978)

32
4.8 The NNI identified that a 4.5dB change in noise exposure corresponded to a doubling or halving of the number of aircraft movements. From this observation it established a trade-off which implied that if the average noise of the aircraft increased by 4.5dB, annoyance could be kept constant by halving the number of aircraft movements, and vice-versa. The trade-off indicates the extent to which adverse reactions balance the magnitude of individual noise events on the one hand, and the total number of noise events on the other.
4.9 Using the NNI values the committee tentatively suggested a scale of day time community impacts, reflecting where people were likely to experience low annoyance (35NNI), moderate annoyance (45 NNI) and high annoyance (55NNI).49 The Government subsequently accepted the recommended NNI for assessing the impact of aircraft noise and introduced regular monitoring of the noise climate
49 Note, NNI values are not the same as LAeq levels, and should not be confused with them.
by issuing annual retrospective NNI contours for London Heathrow (and subsequently other airports).50
Schultz Curve
4.10 The next major step forward in measuring the impact of noise was by Theodore Schultz in 1978. Schultz articulated the first ever dose-response relationship for the percentage of highly annoyed respondents as a function in terms of LDNL (see Table 3.3) of noise level. Data came from social survey studies of public reactions to transport noise (aircraft, road and rail traffic) carried out in different countries. The analysis has been updated a number of times since. Figure 4.1 illustrates the relationship derived in this way. Each point in the diagram represents the proportion of respondents who felt they were highly annoyed due to exposure to the particular level of noise.
4.11 Schultz concluded that daytime noise exposure levels of less than 50LDNL cause little or no serious annoyance in
50 Brooker (2004) ‘The UK Aircraft Noise Index Study: 20 years on’.
Figure 4.2: Dose – response relationship between road, rail and aviation noise and annoyance
0
10
20
30
40
50
60
70
80
90
100
8075706560555045
Per
cent
age
‘hig
hly
anno
yed’
Noise level dBL(A)den
AviationRoadRail
Source: Miedema and Oudshoorn (2001)

33
Quantifying noise effects
the community, and that an environmental goal could be to establish 55LDNL as a target for outdoor noise levels in residential areas.51
4.12 The Schultz curve also shows that for a given noise exposure, a wide range of annoyance responses can occur. Nevertheless the use of a curve can be helpful, and has more recently been developed into separate curves for road, rail and aviation, as can be seen in Figure 4.252 (although these curves are still produced from a wide range of responses). As can be seen, the response curves differ notably, with aviation stimulating higher annoyance responses for given noise levels compared with other sources.
4.13 In subsequent years the Schultz curve continued to be updated and refined. However, by the 1980s it was considered that NNI was ‘out-of-line’ with aircraft noise disturbance indices used in other countries, which tended to be based on the relatively newer measures such as LAeq.
53
Day time noise: current measures
4.14 The Aircraft Noise Index Study (ANIS, 1982) was the next large aviation study to be undertaken in the UK, and its findings are still reflected in current policy on aviation noise. The study found LAeq a more appropriate metric than NNI to measure noise, and therefore adopted LAeq16h in defining a dose-
51 Schultz, 1978, Synthesis of social surveys on noise annoyance
52 Miedema and Oudshoorn, 2001, ‘Annoyance from transportation noise: relationships with exposure metrics TILS, DNL and DNEL and their confidence intervals’.
53 Brooker (2004) ‘The UK Aircraft Noise Index Study: 20 years on’: https://dspace.lib.cranfield.ac.uk/bitstream/1826/1004/3/UK%2520aircraft%2520noise%2520index%2520study.%252020%2520years%2520on-2004.pdf
response relationship.54 Table 4.1 displays the results of ANIS: an estimation of the percentage of people highly annoyed at the mid-point of each 3dB(A) noise exposure interval.
Table 4.1: Percentage of people ‘highly annoyed’ for each LAeq 16h mid-point level
Mid-point LAeq16h level
Percentage highly annoyed
55.5 6.6%
58.5 11.1%
61.5 18.0%
64.5 28.0%
67.5 40.7%
70.5 54.9%
73.5 68.2%
Source: CAA/CAP 725
4.15 The results from ANIS were used to derive 57 LAeq16h as the rough equivalent of 35 NNI, which is still used today as a means of identifying the approximate onset of significant community annoyance. Inherent in LAeq16h is a different trade off compared with NNI, in that a 3dB change (rather than 4.5dB change) equates to a doubling or halving of the number of aircraft movements.
4.16 A more recent study called the Attitudes to Noise from Aviation Sources in England (ANASE, 2007) attempted to further the ANIS work. Not all of the findings of ANASE have been accepted by commentators. However, generally accepted is its conclusion that more people are now annoyed by a given level of aircraft noise exposure than they were when ANIS was conducted. Surveys elsewhere in Europe have also supported this conclusion, although, in
54 Further discussion of the LAeq measure can be found in chapter 3.

34
some cases, there is concern that local issues may have distorted the results.55
4.17 Having examined current UK policy, it is also relevant to consider international studies and approaches taken in other countries. The World Health Organisation (WHO) released guidance in 1999, based on numerous studies and reviews that have occurred since the 1980s. The guidance proposes that in residential areas where the general daytime noise exposure is below 55LAeq (non-specific time period), few people will be ‘seriously annoyed’ by noise, and that few people will be ‘moderately annoyed’ below a value of 50LAeq. Significantly, however, the guidance also acknowledges that achieving average noise levels as low as these would be extremely challenging in many urban areas.56
Night noise
4.18 The effects of aircraft noise on sleep have been studied for almost as long its daytime effects. Early research, often laboratory based, focussed on the impacts an individual noise event had on the probability of awakening from sleep, with the aim of limiting maximum noise levels of individual events. More sophisticated field studies followed, where researchers noted dramatic differences between the probability of being awoken in the laboratory compared to an individual’s own home. These studies also identified different degrees of sleep disturbance beyond simple awakening. Other studies have found that aircraft noise is associated
with more self-reported sleep disturbance than road traffic.57
4.19 The UK’s first major field study on the effects of aircraft noise on sleep disturbance reported in 1992, and incorporated over 6,000 nights of data. The study’s main finding was that outdoor noise events below 90dBA SEL are unlikely to cause awakenings. Above this level the probability of being awoken was approximately 1 in 75. However, the 1992 research did not specifically look at issues such as difficulty in getting to sleep (delayed sleep onset), premature awakening, or the difficulty in getting back to sleep after being awakened.
4.20 Subsequent research in other countries, some of which has been undertaken using different methodologies, has found broadly similar probabilities of being awoken as those identified in the UK study. However, comparisons between studies are not easy to make, as some of the research concentrates on indoor, and some on outdoor, noise levels. Outdoor noise levels are easier to quantify but are not necessarily a good measure of indoor noise. For example, the indoor level could be markedly different depending on whether residents sleep with windows open or windows closed. In general, studies on indoor noise levels show a slow but steady rise in the probability of awakening between 50 to 70dBA SEL.58
4.21 In recent years research on night noise impacts has grown in sophistication, such that even large field studies can now incorporate the monitoring of
57 Miedema and Vos (2007) ‘Associations between self-reported sleep disturbance and environmental noise based on reanalysis of pooled data from 24 studies’.
58 Porter et al. (2000) ‘Adverse effects of night-time aircraft noise’.
55 http://www.bre.co.uk/pdf/NAS.pdf
56 More details can be found in World Health Organisation, Guidelines for Community Noise (1999): http://whqlibdoc.who.int/hq/1999/a68672.pdf

35
Quantifying noise effects
changes in brain wave (EEG) activity, blood pressure and stress levels, during sleep as well as waking. The German National Aeronautics and Space Research Centre ‘Strain’ study has identified significant changes in sleep stages caused by aircraft noise, which over the long-term could lead to adverse health effects, even though the noise levels are insufficient to cause awakenings.59 As a result WHO Europe issued new guidelines on night noise in 2009, for the long-term protection of public health.60
4.22 WHO Europe guidance sets an interim maximum target for noise levels of 55Lnight, and a long-term maximum target of 40Lnight. In the first round of mapping of night noise under the Environmental Noise Directive (2002/49/EC), it was estimated that 1.5 million people were exposed to more than 55Lnight due to road traffic noise in the London agglomeration61, whereas the value for Heathrow airport was 60,000.62 To achieve even the WHO Europe interim target in London would essentially require a near complete closure of the transport system between 23:00 and 07:00.
Monetising noise impacts
4.23 Environmental noise is typically a by-product of productive economic activity. However, as we have seen, noise itself carries a range of costs and disbenefits: for instance, the social cost of road traffic noise on England in 2008 has been estimated as being in excess of £9
59 DLR Institute for Aerospace Medicine: http://www.dlr.de/me/en/desktopdefault.aspx/tabid-2020/2943_read-4518/
60 http://www.euro.who.int/__data/assets/pdf_file/0017/43316/E92845.pdf
61 Directive 2002/49/EC
62 CAA ERCD Report 0706
billion.63 These costs can be recognised when making decisions on new planning or operational measures. Equally, monetising the impacts of aviation noise can play a role in estimating appropriate levels of compensation to persons who live under flight paths (we return to this topic in chapter 5).
4.24 However, monetising impacts can be controversial and especially in relation to aviation, where there is an active debate around the suitability of this approach, and the robustness of the monetising techniques and assumptions that can be deployed. Some argue that the science of noise monetisation is not well-established, and that monetising noise impacts does not offer a practical or effective method of reducing noise exposure, be it on a scheme by scheme or a policy basis.
4.25 The current approach to noise appraisal in the UK is to use DfT WebTAG64 values to monetise the value of amenity effects, and the value of health effects, in particular acute myocardial infarction (AMI or heart attacks). Building on this standard approach is the Government’s Interdepartmental Group on Costs and Benefits (IGCB), a Defra-led group of government analysts that provides analysis and advice relating to the quantification and valuation of local environmental impacts. Noise is one subject area the IGCB focuses on, and so far it has released two papers on this topic, with a third expected this summer. The rest of this chapter examines some of the monetisation techniques, and associated issues, that these bodies consider in their work.
63 £5bn in annoyance, £2bn in health and £2bn in productivity costs. The Interdepartmental Group on Costs and Benefits, second paper.
64 WebTAG is the Government’s transport appraisal guidance. See bibliography for reference.

36
Revealed preference valuation
4.26 Revealed preference valuation normally involves evaluating either a person’s willingness to pay for avoiding a particular cost (in this case noise), or the compensation they would be willing to accept to be exposed to a cost. There are a number of studies which consider this approach when quantifying noise impacts. Whilst a person’s revealed preference for less noise will encompass both day and night-time noise, models tend to equate revealed preference with daytime noise exposure.
4.27 One of the oldest forms of monetary valuation of noise is through the recognition that property value tends to decline as noise increases. The idea behind this is that some people will accept more noise in exchange for cheaper property, whereas at the other extreme some people will pay a premium for less noise. Either way, it implies noise exposure can be related to a monetary value equal to the change in property value.
4.28 The first studies linking aircraft noise with house prices were undertaken in the 1970s; the general methodology developed then is still widely used today.65 One early study found that a property exposed to 65LAeq sold for around 10% less than the same property exposed to 55LAeq.
66 More recent studies have tended to be more complex, controlling for factors such as demographics and the positive effects that accessibility to an airport can bring. One study surrounding Manchester Airport found that for each 1 unit increase in LAeq (above 55LAeq) there is a
65 Brooker (2006), ‘Aircraft noise: annoyance, house prices and valuations’.
66 Walters (1975), ‘Noise and prices’.
0.47% decrease in property price.67 At Atlanta Airport properties sold for 20.8% less in the 70-75dB DNL contour than those found below 65dB DNL. They also found, when controlling for noise impacts, that houses further from the airport sold for less, indicating that some benefits can be derived from proximity to an airport.68
4.29 The DfT has developed a model to estimate willingness-to-pay for peace and quiet in the housing market, based on real market behaviour. The underlying data is based on an assessment of road traffic noise on house prices, but the model is considered applicable to rail noise as well. An attempt to place a monetary value on aircraft noise (in the ANASE study in 2004) did not produce robust overall valuations. In the interim, the valuations which DfT uses for road and rail noise impacts are used as a guide for aviation noise.
4.30 The DfT figures69 show the annual value of the impact of a 1dB change in exposure to noise at noise levels from 45 to 81LAeq18hr. These are the standard appraisal values based on the UK average household income. For aircraft noise the LAeq16 noise metric is used, since it is judged that aircraft noise exposure over 16 or 18 hours will be highly correlated.
4.31 This poses a number of problems for aircraft. Aircraft noise decays at a much slower rate compared with road and rail noise, as the latter are heavily influenced by ground-based propagation and therefore noise exposure attenuates
67 Pennington et al (1990), ‘Aircraft noise and residential property values adjacent to Manchester Airport’.
68 Cohen and Coughlin (2008), ‘Changing noise levels and house prices near the Atlanta airport’.
69 http://www.dft.gov.uk/webtag/documents/expert/pdf/U3_3_2noise-120807.pdf

37
Quantifying noise effects
much more rapidly with distance. As a consequence, estimating aircraft noise at very low exposure levels becomes increasingly uncertain and equally difficult to validate. Secondly, noise levels from non-aviation sources rarely fall below 50dB(A) in urban and sub-urban areas, which raises the question of how to account for changes in noise exposure that occur below ambient noise levels.
Monetising health impacts
4.32 As discussed in Chapter 2, several pieces of research have found links between noise exposure and health effects. These health effects are typically accounted for in appraisal by estimating the size of the population exposed, and then linking this to scientific research on the level of noise and the risk of cardiovascular disease associated with it.
4.33 However, more recent research by Berry and Flindell (2009)70 and Health and Safety Laboratory (HSL) (2011)71, is being reflected by the IGCB in its forthcoming guidance. For instance, HSL (2011) considers a wide range of heath effects from noise-related hypertension, including acute myocardial infarction, strokes and dementia. The approach proposed by the IGCB uses dose-response functions to estimate the prevalence of these health impacts in the population, which is then monetised in relation to the value of Quality
70 Berry and Flindell (2009), ‘Estimating dose-response relationships between noise exposure and human health impacts in the UK’.
71 Commissioned by Defra and is available at: http://randd.defra.gov.uk/Default.aspx?Menu=Menu&Module=More&Location=None&ProjectID=17601&FromSearch=Y&Publisher=1&SearchText=hypertension&SortString=ProjectCode&SortOrder=Asc&Paging=10#Description
Adjusted Life Years (QALY).72 Once the additional number of noise related disease cases is calculated, a monetary value can be estimated.
4.34 Based on this approach the HSL (2011) estimate the noise impacts from road traffic and rail could equate to around £1bn and £43m of health effects per annum, respectively.73 Aircraft noise impacts were not estimated in this report. For further information on the health monetisation methodology please see the WHO report and HSL (2011).
Monetising sleep impacts
4.35 WHO Europe and the European Commission’s Joint Research Centre have set out methodological guidance for estimating Disability Adjusted Life Years (DALY)74 due to environmental noise to enable a monetary value for sleep disturbance to be calculated. They recommend use of a highly sleep-disturbed dose-response function (similar to those defined in Figures 4.1 and 4.2) that is relevant for Lnight, from 2300-0700, and have used this to define a ‘disability weighting’ of 0.07, which implies that environmental noise at night reduces a completely healthy individual’s health by around 7%. This is based on the disability weighting used more
72 ‘QALYS are calculated by estimating the years of life remaining for a patient following a particular treatment or intervention and weighting each year with a quality of life score (on a scale of zero to one, where zero is equivalent to death and one is equivalent to full health). It is often measured in terms of the person’s ability to perform the activities of daily life, free from pain and mental disturbance’ (National Institute for Health and Care Excellence definition). The Department for Health guidance suggests a central value for a QALY of £60,000. For more detailed information on the approach please see HSL (2011).
73 Note these cover 23 agglomerations in the UK, accounting for roughly 40% of the population.
74 This allows us to estimate the burden of disease. Technically this is equal to ‘years of life lost’ + ‘years lived with disability’, where the latter is calculated in relation to a disability weighting (DW).

38
generally for insomnia, which is around 10%.
4.36 The scientific literature does not suggest that sleep disturbance results in premature death. However, it is considered to have an impact on the years of life lost through disability (YLD). Once the YLD are calculated these can then be multiplied by the Department of Health’s QALY value to provide a monetary value of the noise impact. For further information on this methodology please see the WHO report and CAA (2013).75
Productivity and learning impacts
4.37 The productivity losses associated with noise, such as those caused by sleep disturbance, health effects, workplace distraction and (in early life) diminished academic performance are not well researched in terms of monetisation, with no agreed methodology in place.
4.38 There have, however, been a number of bespoke studies undertaken to estimate the size of noise impacts on productivity. A 2003 Japanese study estimated that the productivity loss due to sleep disturbance for noise from all sources cost the Japanese economy US$30.7bn per year. A 2004 report in Australia found the cost of sleep disturbance from all sources of noise amounted to 0.8% of GDP (equivalent to around US$4.9bn). A more recent UK study found that productivity loss for those affected by sleep disturbance amounted to 3.5 days absence from work, which equated to a €1,010 cost per employee per year.76 Though these studies are useful at informing us about the scale of the impact of noise on productivity, there
75 http://www.caa.co.uk/docs/33/ERCD1208.pdf
76 Maca et al.(2008) ‘Literature review of theoretical issues and empirical estimation of Health end – point unit values’.
still appear to be gaps in the evidence base which prevent a robust monetisation methodology being adopted by policy makers.
Conclusion
4.39 This Chapter has considered how the impacts of noise can be assessed. We have seen how relationships have been defined, and continue to be redefined, between noise and stated levels of annoyance. We have also considered the evolving body of research on night noise and its various impacts. Finally, we have seen how policy makers are increasingly trying to monetise noise impacts within cost-benefit analyses. However, there appears to be little consensus on the most appropriate method for quantifying or monetising noise impacts.
4.40 The Commission is interested in receiving views on all the issues raised in this chapter, but in particular on whether the approaches here summarised are a fair representation of the current evidence base on the quantification of noise impacts and effects. In addition the Commission is also keen to receive views on the following questions:
●● How could the methods described in this chapter be improved to better reflect noise impacts and effects?
●● Is monetising noise impacts and effects a sensible approach? If so, which monetisation methods described here hold the most credibility, or are most pertinent to noise and its various effects?
●● Are there any specific thresholds that significantly alter the nature of noise assessment, e.g. a level or intermittency of noise beyond which the impact or effect significantly changes in nature?

39
Quantifying noise effects
●● To what extent does introducing noise at a previously unaffected area represent more or less of an impact than increasing noise in already affected areas?

40
5. Mitigation
5.1 The previous two chapters have explored the measurement of noise and the quantification of its impacts and effects. In this final chapter we shift our focus to noise mitigation. How do airlines and airports reduce noise impacts, and how will they do so in the future? Can the industry improve upon the noise mitigation practices it currently has in place, and if so how?
5.2 The industry group Sustainable Aviation, which ‘speak[s] for over 90 per cent of UK airlines, airports and air navigation service providers, as well as all major UK aerospace manufacturers’, has predicted
that ‘noise from UK aviation will not increase despite a near doubling in flights over the next 40 years’.77
5.3 This chapter explores the noise mitigations identified by Sustainable Aviation and others. The chapter begins by considering technological improvements that can be and are used to reduce noise impact, then focuses on land-use planning measures, operational procedures and operating restrictions that can or will achieve the same. The final section of the chapter considers ‘passive’ noise mitigation: the compensation and community action
77 Sustainable Aviation, ‘Aviation Noise Road Map’ (2013), http://www.sustainableaviation.co.uk/wp-content/uploads/SA-Noise-Roadmap-Publication-version1.pdf
Figure 5.1: Historic and future trends in cumulative certificated aircraft noise levels
-40
-30
-20
-10
0
10
20
30
1960 1965 1970 1975 1980 1985 1990 1995 2000 2005 2010 2015 2020 2025 2030 2035 2040
Cum
ulat
ive n
oise
mar
gin
rela
tive
to C
hapt
er 3
(EPN
dB)
Year of Certification
Noise limit In-service aircraft Future aircraft ICAO long-term trend
Source: CAA data

41
Mitigation
schemes that are in place at a selection of global airports.
The Noise Mitigation Framework – The International Civil Aviation Organisation’s (ICAO) ‘Balanced Approach’
5.4 The ICAO has developed a ‘Balanced Approach to Noise Management’, which in the EU has been enshrined into law through the ‘Operating Restrictions Directive’ (2002/30/EC). In the APF the Government noted that it ‘fully recognises the ICAO Assembly ‘balanced approach’ principle to aircraft noise management.’78
5.5 The balanced approach consists of identifying the noise problem at an airport and then reducing it through the exploration of four principal elements, with the goal of addressing the noise problem in the most cost-effective manner. The elements are:
●● reduction at source;
●● land-use planning and management;
●● noise abatement operational procedures; and
●● operating restrictions.
Reduction of noise at source through technological improvements
5.6 The first element, reduction of noise at source, is given effect through the ICAO noise certification standards process, which ensures that the latest available noise reduction technology is incorporated into aircraft design (to receive certification, new aircraft must demonstrate that their maximum noise levels are not greater than required limits). A secondary effect of this process is to enable airports to incentivise take-up of
78 Aviation Policy Framework (2013), p.56.
aircraft with the latest available noise reduction technology, through for example noise-related landing charges.
5.7 Since jet aircraft entered service, the noise emission for an aircraft of a given size for a given flight has reduced by more than 90%. This is a notable achievement (far outstripping progress in fuel efficiency over the same period, for example). Evidence of this trend can be seen in the historic noise contours of Heathrow airport, displayed at Annex C.
5.8 However, the impact of this achievement has been eroded to some extent by the increasing size of aircraft over the past 60 years, and, in terms of the overall noise exposure, because of the growth in number of aircraft movements.
5.9 Figures 5.1 and 5.2 show how over the last fifty years new aircraft have become progressively quieter, and how this trend is expected to continue out to 2020. Beyond 2020, ICAO anticipates that the rate of noise reduction might reduce somewhat but still continue on a downward path.79 Based on past industry practice, it is reasonable to assume that airlines will operate the aircraft marked on the diagram for around 25 years after coming into service.
5.10 A major contributor to the improvements shown in Figures 5.1 and 5.2 is the increase in engine bypass ratio (the proportion of air that flows around the core of an engine), which reduces noise by reducing the speed of the jet exhaust whilst simultaneously improving fuel burn.
79 Data on past and future noise certification levels taken from the CAA, quoting ICAO, Boeing and Airbus. EPNdB is the noise measure that is used for aircraft certification processes. It is different from LAeq, in that it takes account of both noise tones and duration characteristic to an aircraft flyover.
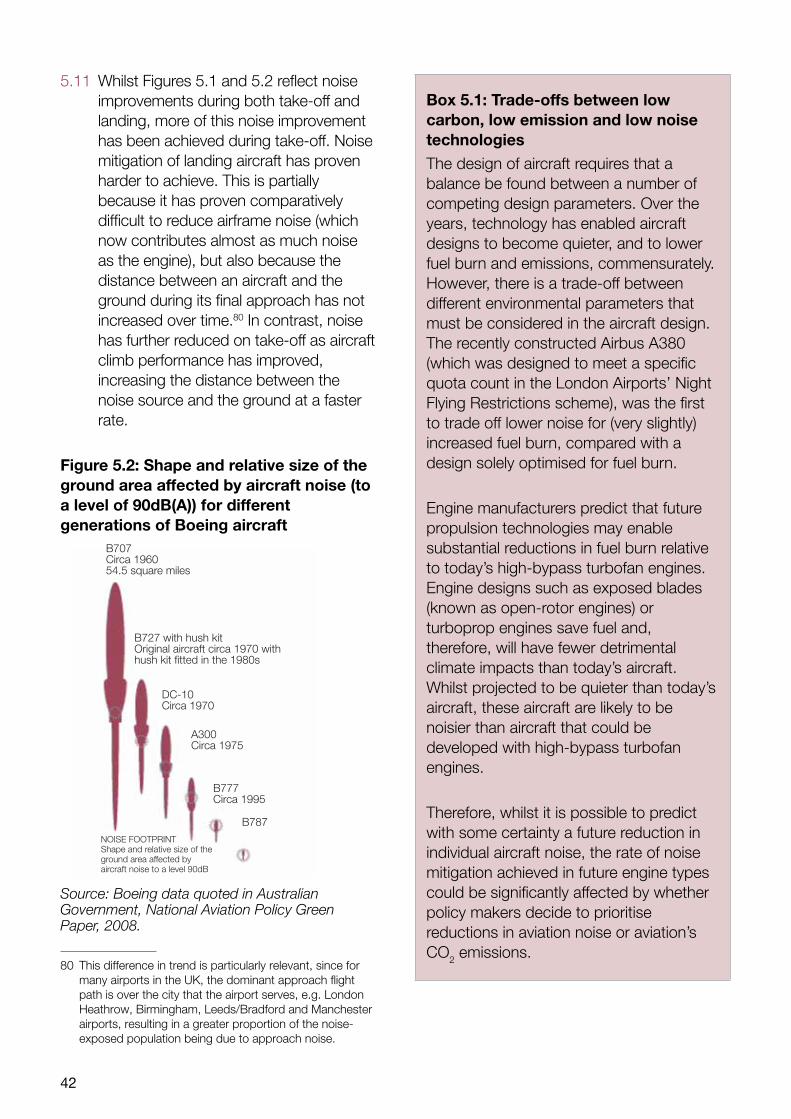
42
5.11 Whilst Figures 5.1 and 5.2 reflect noise improvements during both take-off and landing, more of this noise improvement has been achieved during take-off. Noise mitigation of landing aircraft has proven harder to achieve. This is partially because it has proven comparatively difficult to reduce airframe noise (which now contributes almost as much noise as the engine), but also because the distance between an aircraft and the ground during its final approach has not increased over time.80 In contrast, noise has further reduced on take-off as aircraft climb performance has improved, increasing the distance between the noise source and the ground at a faster rate.
Figure 5.2: Shape and relative size of the ground area affected by aircraft noise (to a level of 90dB(A)) for different generations of Boeing aircraft
B707Circa 196054.5 square miles
B727 with hush kitOriginal aircraft circa 1970 withhush kit fitted in the 1980s
DC-10Circa 1970
A300Circa 1975
B777Circa 1995
B787
NOISE FOOTPRINTShape and relative size of theground area affected byaircraft noise to a level 90dB
Source: Boeing data quoted in Australian Government, National Aviation Policy Green Paper, 2008.
80 This difference in trend is particularly relevant, since for many airports in the UK, the dominant approach flight path is over the city that the airport serves, e.g. London Heathrow, Birmingham, Leeds/Bradford and Manchester airports, resulting in a greater proportion of the noise-exposed population being due to approach noise.
Box 5.1: Trade-offs between low carbon, low emission and low noise technologiesThe design of aircraft requires that a balance be found between a number of competing design parameters. Over the years, technology has enabled aircraft designs to become quieter, and to lower fuel burn and emissions, commensurately. However, there is a trade-off between different environmental parameters that must be considered in the aircraft design. The recently constructed Airbus A380 (which was designed to meet a specific quota count in the London Airports’ Night Flying Restrictions scheme), was the first to trade off lower noise for (very slightly) increased fuel burn, compared with a design solely optimised for fuel burn.
Engine manufacturers predict that future propulsion technologies may enable substantial reductions in fuel burn relative to today’s high-bypass turbofan engines. Engine designs such as exposed blades (known as open-rotor engines) or turboprop engines save fuel and, therefore, will have fewer detrimental climate impacts than today’s aircraft. Whilst projected to be quieter than today’s aircraft, these aircraft are likely to be noisier than aircraft that could be developed with high-bypass turbofan engines.
Therefore, whilst it is possible to predict with some certainty a future reduction in individual aircraft noise, the rate of noise mitigation achieved in future engine types could be significantly affected by whether policy makers decide to prioritise reductions in aviation noise or aviation’s CO2 emissions.

43
Mitigation
5.12 So, in the medium term, planes are set to become significantly quieter. A question remains as to what extent airports are accelerating the onset of these quieter planes by incentivising the take-up of aircraft with the latest available noise reduction technology. By way of illustration, in May 2013 Heathrow Airport published ‘A Quieter Heathrow’, which noted that the airport would:
●● continue to provide a strong financial incentive for airlines to use the quietest planes currently available through the use of variable landing charges;
●● publish a quarterly ‘Fly Quiet’ league table to benchmark how quiet individual airline fleets are and how quietly they are flown; and
●● continue to support the development of quieter aircraft through engagement with airlines and manufacturers in the UK and internationally.81
We consider the first of these bullets in more detail under ‘Mitigation through operational restrictions’.
Mitigation through land use planning
5.13 The second pillar of the balanced approach is land-use planning. Primarily this aims to ensure that new airport developments are located away from noise-sensitive areas and that only compatible land-use development takes place in areas affected by aircraft noise. This works in two ways, firstly to direct incompatible land use (such as houses and schools) away from the airport environs, and secondly to encourage compatible land use (such as industrial and commercial use) to locate around airport facilities.
5.14 Delivering this outcome requires policies and measures to be put in place such that the economic lure of an airport does not attract residential development towards it. There is some evidence to demonstrate that, in the UK, the relevant policy and regulatory levers are achieving this objective, but only with regard to the highest noise impacts.
5.15 Figure 5.2 shows the measured encroachment towards eight UK airports between the 1991 and 2001 censuses.82 Whilst there appears to have been a net reduction in population at the highest exposure levels, populations appear to have increased in the locations that fall within the 54 and 63dB LAeq. (In terms of the dose-response functions presented in Chapter 4, this population encroachment would lead to a net increase in numbers of people described as ‘highly annoyed’, as the increase in the range 54-63dB LAeq far outweighs the decrease around the 69dB LAeq threshold.)
Mitigation through operational procedures
5.16 The third pillar of the ICAO Balanced Approach to noise management is operational procedures. These are classified by ICAO into three categories:83
81 Heathrow Airport Limited, May 2013 ‘A Quieter Heathrow’ p.4.
82 The eight airports are Heathrow, Gatwick, Manchester, Birmingham, Leeds/Bradford, Glasgow, Edinburgh, Bristol and Luton. This analysis was undertaken by the CAA as part of the UK contribution to the ICAO CAEP/8 Balanced Approach encroachment analysis. The data was subsequently incorporated into appendix 1 of ICAO Doc. 9829, that was updated in October 2010.
83 ICAO Doc 8168: Procedures for Air Navigation Services, Aircraft Operations, Volume I – Flight Procedures (PANS-OPS). Many of the issues discussed in this section, including dispersal, construction of noise preferential routes and altitude-based prioritisation of routes, are explored in detail in the government’s consultation on ‘Air navigation guidance to the Civil Aviation Authority’, which was published on June 25th (see reference).

44
●● the use of noise preferential runways to direct the flight paths of aircraft away from noise-sensitive areas (or to provide periods of respite for certain areas at certain times of day);
●● the use of specific take-off or approach procedures (such as Continuous Descent Operations, or steeper landing trajectories) to optimize the distribution of noise on the ground;
●● the use of noise preferential routes to assist aircraft in avoiding noise-sensitive areas on departure and arrival (such as the use of turns to direct aircraft away from noise-sensitive areas).
5.17 Operational procedures entail some judgement as to whether it is better to concentrate an airport’s noise over a small area of the population (so that few people are affected, but these people are heavily affected), or to spread it over a large area of population (so that more
people are affected, but these people feel reduced noise impacts compared to the first scenario). The first approach is called concentration (and is the predominant policy of the UK Government); the second is called dispersal. Box 5.2 considers the case-study of Sydney Airport, where a dispersed noise model is in operation.
Figure 5.3: Percentage change in population near 8 UK airports between 1991 and 2001P
erce
ntag
e ch
ange
in p
opul
atio
n 19
91 to
200
1
LAeq Contour band
-20%
-15%
-10%
-5%
0%
5%
10%
15%
20%
>7269-7266-6963-6660-6357-6054-57

45
Mitigation
Box 5.2: Sydney airport noise managementSydney (Kingsford Smith) Airport processes an average of 36 million passengers and 500,000 tonnes of airfreight annually.88 Positioned on the northern shoreline of Botany Bay, New South Wales, it is the only major airport serving Sydney. It is a primary hub for Qantas and secondary hub for Virgin Australia and Jetstar Airways.
The airport has three runways, the third of which, parallel to the main runway, was opened in 1994. Public concern over aircraft noise quickly escalated resulting in a 1995 Senate Select Committee on Aircraft Noise in Sydney. The Select Committee identified many deficiencies in the way in which aircraft noise information had been conveyed to the public through the reliance on the Australian Noise Exposure Forecast (ANEF) System (broadly comparable to the Leq system) in the Environmental Impact Statement (EIS) for the Third Runway at Sydney Airport. The additional noise metrics of PEI (Person Events Index), AIE (Average Individual Exposure) and N-contours, all of which are detailed in Chapter 3, were brought to prominence in response to these findings.
A feature highlighted with the new ways of describing noise was that certain populations received much higher noise doses than other populations. Significant public engagement led to Sydney adopting the principle that noise sharing should be prioritised at the expense of total exposure, i.e. AIE should be minimised at the expense of increasing PEI – spreading the noise around more people.
A Long Term Operating Plan (LTOP) was adopted in 1996 to implement this change. A key feature of the plan is the runway rotation system, involving 10 different ways/combinations of using the Airport’s three runways and associated flight paths (known as Runway Modes of Operation), to provide as far as possible individual areas with periods of respite from aircraft noise. Noise sharing modes must be used at the airport (except when weather or unusual traffic conditions prevent this) during the weekday hours of 06:00-07:00, 11:00-15:00 and 20:00-23:00. Longer noise sharing hours apply at weekends.89
An independent analysis of performance of the plan in 2005, after 7 years of operation, found that many of the noise sharing aims are being met. In particular the targets set to the south and east of the airport are usually met, although this occurs more rarely to the north and west of the airport. The report found that implementation was ‘reasonable considering the complexity of the LTOP in all its aspects’.90
In the UK, the general principle has been to confine aircraft noise to as few people as possible. However, the policy of landing-runway alternation at Heathrow airport follows the principles of the Sydney system, in that alternation shares the noise load across two flight paths and populations (minimising AEI), whilst at the same time exposing more people to noise overall (increasing PEI). As the designated runway changes at 3pm each day, this provides predictable respite for residents under the arrivals flightpath.
84 Air Services Australia (2013), ‘Sydney Airport’.
85 http://www.airservicesaustralia.com/wp-content/uploads/FINAL_Key-facts-about-noise-sharing.pdf; http://www.sacf.infrastructure.gov.au/airport/LTOP/index.aspx.
86 http://www.airservicesaustralia.com/wp-content/uploads/FINAL_Key-facts-about-noise-sharing.pdf.

46
5.18 The first and second of the operational procedures listed above are already widely implemented across the UK; therefore their potential for achieving further significant noise abatement seems limited.
5.19 The third procedure shows greater potential. Depending on how a population is distributed in the vicinity of an airport, it is possible to reduce overall exposure to noise by carefully plotting flight paths in order to displace noise to the least densely populated areas (or spread noise impacts between different population centres). Historically this concept has to some extent been under-utilised, as safety requirements have limited the number of departure procedures that any given airline or aircraft type can make.87
5.20 However, recent developments in Flight Management System (FMS) technology, first introduced on the Airbus A380 and since then on the Boeing 787, have enabled these aircraft to better optimise flight paths for particular flights, without compromising safety standards. The Commission is interested to hear further evidence on, or be provided with specific case studies about, this topic. We are interested to understand the scale of the noise abatement benefits FMS technology is predicted to bring about, and to be made aware of international examples of this technology being deployed effectively.
5.21 Beyond FMS, meaningfully reducing noise through operating procedures will require new and innovative thinking. Approaches at steeper angles have long been considered, but have rarely been sanctioned for environmental reasons alone. Modest increases in glide-path
87 ICAO PANS-OPS and EU OPS.
angle may be feasible (Frankfurt airport operates a glide path angle of 3.2° rather than the standard 3.0°, which may offer scope for noise reduction of up to 1dB(A) SEL) but as the technology shifts towards designing more aerodynamic (and thereby fuel efficient) aircraft, steeper angles of descent become more difficult to fly.
5.22 One final operating measure that may be deployed by airports to diminish the effect of noise (rather than the noise impact itself) could be through better communicating information to the affected public. Alterations to operational procedures (such as changing runway directions) can profoundly annoy the affected populous, especially if these changes are unexpected, or the reasons for the change are hidden. With the growth of the internet and social media, airports are better equipped than ever to communicate rapidly and responsively with those that their operations affect. Madrid Barajas’s real time WebTrak, which displays the airport’s incoming and outgoing flights and its ever-changing noise footprint (in LAeq), seems an excellent example of this.88 Again, the Commission would welcome examples of best practice.
Mitigation through operational restrictions
5.23 Operating restrictions are defined as ‘any noise-related action that limits or reduces an aircraft’s access to an airport.’ These could include limiting or prohibiting movements of the noisiest aircraft at an airport. ICAO encourages states not to apply operating restrictions as a first resort, but only after consideration of the benefits to be
88 Madrid-Barajas Airport, ‘Interactive Noise Map’, http://www.aena-aeropuertos.es/csee/Satellite/Aeropuerto-Madrid-Barajas/en/Page/1237543056506/1049727006413/Mapa-Interactivo-de-Ruido.html?other=3

47
Mitigation
gained from the other three principal elements of the balanced approach.
Landing charges
5.24 Airports are able to encourage the use of quieter aircraft through setting their landing charges to take account of the noise performance of an aircraft, and many do so.
5.25 The Government has asked the CAA to investigate the use of differential landing charges, and their effectiveness at incentivising industry to produce quieter aircraft.89 The report is awaited, but initial findings90 are that the monetary incentives designed to encourage airlines to use the quietest aircraft are not strong, and that UK airports increase charging levels for noisy aircraft types after most of them have already stopped operating. So the main effect appears to be to act as a backstop to dissuade airlines from re-introducing noisier aircraft, rather than being used to drive improvements.
Operating restrictions
5.26 There are various forms of noise-related operating restrictions in place at UK airports, ranging from caps on all movements (applying either all day or just at night), to restrictions or bans on certain types of noisier aircraft and noise quotas.
5.27 Noise-related operating restrictions may be imposed through local planning agreements, on a voluntary basis by the airport, or by Government. The only UK airports legally designated for noise
89 This work was announced in the Department for Transport’s Draft Aviation Policy Framework. The working title of the document is ‘Environmental Charging – review of impact of noise and NOx landing charges’.
90 Reported in the DfT’s Stage 1 consultation on night flying restrictions at Heathrow, Gatwick and Stansted, January 2013.
management purposes by the Government are Heathrow, Gatwick, and Stansted.
5.28 Unsurprisingly, noise-related operating restrictions are mainly focussed on night flights, and this is true of the three airports listed above: the Government sets controls on noise at night (23:30-06:00) at Heathrow, Gatwick and Stansted airports by means of a) a limit on the number of night-time aircraft movements and b) a limit on the noise energy which can be emitted. These controls are due to expire in October 2014 and the Government is intending to consult later this year on its proposals to replace them.
5.29 Aircraft are classified separately for landing and taking off according to the Quota Count (QC) classification system, introduced in 1993. Under the QC system, each aircraft type, including different versions of the same model, is assigned a Quota Count according to its noise performance, separately for arrival and departure, as determined by the ICAO noise certification process. The QC system allows each night flight to be individually counted against an overall noise quota (or noise budget) for an airport according to the QC rating (i.e. the noisiness of the aircraft used). The noisier the aircraft used the higher its QC rating and the fewer that can be operated within any given quota, thereby also providing an incentive for airlines to use less noisy aircraft.
5.30 Numbers of night flights vary from airport to airport. The Government permits on average 16 flights per night (23:30–06:00) at Heathrow, around 40 at Gatwick and around 33 at Stansted, although there are seasonal variations. This quota is almost fully utilised at Heathrow, whereas Gatwick and

48
Stansted have had some spare capacity in recent years, particularly in the winter.91
5.31 Despite imposing the above controls, the Government does not specify when movements may take place during the night, allowing the airports to control this themselves. At Heathrow, for instance, there is a voluntary agreement whereby no aircraft may be scheduled to land before 04.30. However, some jurisdictions and Governments do mandate night curfews. These include Frankfurt (23.00-05.00), Zurich (23.30-06.00) and Sydney (23.00-06.00), as well as London City (22.30-06.30) where the restriction is a planning condition.
5.32 Some commentators argue that night flight restrictions can be detrimental to an airport’s operation, limiting capacity, connectivity and efficient operation. The Commission is interested to hear submissions on this topic, in relation to the figures noted above, or any other evidence.
Noise envelopes
5.33 The term ‘noise envelope’ refers to imposing a limit or restriction on the overall noise impact of an airport. It could be stated in the terms of a contour area limit, or a cap on the total amount of sound energy that an airport is entitled to emit, or some other measure that takes account of the airport activity. Noise envelopes therefore have the capacity to act as an operational restriction, constraining the capacity of an airport. However, unlike a blunt operating restriction such as a cap on movements, a noise envelope may be used to adjust permitted operational capacity in response to an airport’s overall noise performance. In other words, if the noise
91 Data sourced from Department for Transport, Aviation Directorate.
impacts of aircraft reduce, then the noise envelope needn’t act as a limiter on an airport’s capacity or operations.
5.34 In the APF the Government stated that it wishes to pursue the concept of noise envelopes as a means of giving certainty to local communities about the levels of noise which can be expected in the future, and to give developers certainty on how they can use their airports. The APF noted that noise envelopes could be constructed for any new or existing airports, and that they should be established:
a) with regard to the Government’s overall noise policy;
b) in such a manner that within the limits of the envelope, the benefits of future technological improvements should be shared between the airport and its local communities, thereby achieving a balance between growth and noise reduction; and
c) to incentivise airlines to introduce the quietest suitable aircraft as quickly as is reasonably practicable.92
5.35 We note that the Government has commissioned the CAA to develop further the noise envelope concept and to produce guidance on the use and types of noise envelopes which may be used, and that this guidance is expected to be published later this year. Prior to this publication, however, the Commission is interested to understand more on the feasibility and potential effectiveness of noise envelopes, and on possible ways in which the noise envelope concept may be integrated into any assessments the Commission undertakes during its programme of work.
92 Aviation Policy Framework, p.61.

49
Mitigation
Independent Noise Regulator
5.36 Having discussed the operational measures, land-use planning measures and operational restrictions that are commonly used to abate noise, it is worth dwelling on the question of who should control these measures. In France and some other jurisdictions there is an independent noise regulator. ACNUSA (the independent French Airport Pollution Control Authority) operates on a six-year mandate with control over France’s ten largest airports, and hears cases submitted by civil aviation and town planning authorities, or other Government bodies, relating to noise (and other environmental pollution). It has a power of recommendation on the measurement of noise (in particular on suitable measuring indicators) and the assessment of noise pollution, and the ability to impose sanctions for breaches of noise regulations.93
5.37 When consulting on its APF the Government considered giving the Civil Aviation Authority a role in providing independent oversight of airports’ noise management, similar to that held by ACNUSA, but decided against the idea as additional regulatory costs could not be justified. However, responses to the consultation illustrate that a number of stakeholders are interested in the model of an independent noise regulator. One such stakeholder is Heathrow, which in ‘A Quieter Heathrow’ stated it would produce proposals for a new system of independent regulation of noise, in order to help build trust among local residents in the management of noise.94 The Commission is interested in hearing more from stakeholders on this idea, on the pros and cons of independent noise
93 ACNUSA, http://www.acnusa.fr/index.php/en/presentation/the-authority/442
94 A Quieter Heathrow, p. 5.
regulation, on its suitability in the UK regulatory climate, and on which bodies would be best suited to adopting the role.
Compensation
5.38 When all of the above noise abatement measures have been considered, airports and their surrounding communities still have recourse to ‘passive’ mitigation measures, such as noise insulation of existing residential dwellings and noise sensitive buildings (schools, hospitals, community centres). In the UK the Civil Aviation Act of 1982 gives powers to the Secretary of State to introduce Noise Insulation Grants Schemes, although the designated airport funds any scheme. Currently Heathrow and Gatwick airports are designated for the purposes of Section 79, though these powers have not been used for many years and schemes currently in place at these airports are voluntary.
5.39 Historically the compensation schemes in place at these airports have typically contributed 50% of the costs of new double-glazed windows, though Heathrow is currently piloting a new scheme which offers different levels of contribution according to location, while Gatwick is also planning to review its schemes. At Heathrow the level of exposure at which affected persons are able to apply for compensation under the day noise scheme is the 69LAeq 18h footprint95, and for the night noise scheme the ‘‘footprint’ of the noisiest aircraft regularly operating between 11.30pm–6.00am’.96
95 Heathrow Airport Ltd., ‘Day Noise Insulation Leaflet’, http://www.heathrowairport.com/noise/our-schemes-to-help-you/day-noise-insulation
96 Heathrow Airport Ltd., ‘Night Noise Insulation Leaflet’, http://www.heathrowairport.com/static/Heathrow_Noise/Downloads/PDF/Night_Noise_Leaflet.pdf

50
5.40 It is instructive to compare these schemes with those on offer in other countries. In the US, schemes typically insulate dwellings down to noise exposure levels of 65 DNL (equivalent to approximately 63LAeq16h), and cover a greater percentage of the costs. Chicago O’Hare’s Residential Sound Insulation Programme (RSIP) is the largest of its kind in the country, insulating to date around 8000 homes at a cost of $270 million.97 In Sydney compensation is provided within the 30 Australian Noise Exposure Forecast Zone, equivalent to approximately 63LAeq16h.
98
In Europe, compensation schemes also often cover a wider area around the airport than occurs in the UK. In France compensation arrangements are governed by ACNUSA (the independent Airport Pollution Control Authority), which establishes a compensatory regime out to the 55Lden footprint.99 All of Spain’s major airports have compensation arrangements within the 60LDAY and LEVENING, and/or 50dB(A) LNIGHT, footprints.100
5.41 A similar pattern can be articulated for airport funded schemes to attenuate noise in public buildings, such as schools or hospitals. Heathrow provides acoustic insulation out to the 63LAeq16h contour, whereas Chicago’s School Sound Insulation Programme insulates
97 Chicago O’Hare Airport, Community Noise Management website pages’, http://www.flychicago.com/OHare/EN/AboutUs/Community/NoiseManagement/RSIP/Residential-SIP.aspx
98 http://www.infrastructure.gov.au/aviation/environmental/insulation/index.aspx
99 http://www.acnusa.fr/userfiles/prescription%20PEB.pdf
100 http://www.aena-aeropuertos.es/csee/Satellite/sostenibilidad/en/Page/1237548870486//Frequently-asked-questions.html
schools out to its 60DNL footprint (equivalent to approximately 58LAeq16h).
101
5.42 Typically, therefore, it can be argued that compensation schemes are more generous in foreign countries than in the UK. This may be because these schemes rely, to a greater or lesser extent, on contributions from central or local Government. In France, for example, compensation arrangements are partially funded by a noise tax on departing aircraft; and in Chicago, the Federal Aviation Authority reimburses 80% of the costs of the SSIP. In the UK, the financial burden of compensation schemes has been borne more fully by the airports.
5.43 The Commission is interested in receiving further representations on this topic. We would like to better understand how compensation arrangements in the UK compare with those in different countries. Equally, we are interested in how a system of fair, robust compensation arrangements can be established in relation to the addition of aviation capacity to the UK. The question of monetising noise impacts in relation to compensatory actions on buildings and in communities is covered further in Chapter 4.
Conclusion
5.44 This chapter has described various methods and possible options for the mitigation of noise, as well as the regulatory regimes which operate at the international, European and UK levels. The Commission would be interested to receive views on additional mitigation methods that may be effective or worth
101 http://www.heathrowairport.com/static/Heathrow_Noise/Downloads/PDF/LHR_CBNIS_complete.pdf; http://www.flychicago.com/OHare/EN/AboutUs/Community/NoiseManagement/SSIP/School-Sound-Insulation-Program.aspx

51
Mitigation
consideration, but in particular responses that focus on the following questions:
●● To what extent is the use of a noise envelope approach appropriate, and which metrics could be used effectively in this regard?
●● To what extent should noise concentration and noise dispersal (as described in paragraph 5.17) be used in the UK? Where and how could these techniques be deployed most effectively?
●● What constitutes best practice for noise compensation schemes abroad and how do these compare to current UK practice? What noise assessments could be effectively utilised when designing compensation arrangements?

52
6. Conclusion
6.1 This paper has discussed a number of issues around the noise impacts of aviation, including measurement, assessment, and abatement.
6.2 We have set out in the document a number of particular areas in which we would welcome views and evidence. To guide those preparing submissions on noise, we have summarised below a number of our specific questions of interest. This should not be considered an exhaustive list, however, and we would welcome submissions covering any other relevant topics or issues.
●● What is the most appropriate methodology to assess and compare different airport noise footprints? For example:
– What metrics or assessment methods would an appropriate ‘scorecard’ be based on?
– To what extent is it appropriate to use multiple metrics, and would there be any issues of contradiction if this were to occur?
– Are there additional relevant metrics to those discussed in Chapter 3 which the Commission should be aware of?
– What baseline should any noise assessment be based on? Should an assessment be based on absolute noise levels, or on changes relative to the existing noise environment?
– How should we characterise a noise environment currently unaffected by aircraft noise?
●● How could the assessment methods described in Chapter 4 be improved to better reflect noise impacts and effects?
●● Is monetising noise impacts and effects a sensible approach? If so, which monetisation methods described here hold the most credibility, or are most pertinent to noise and its various effects?
●● Are there any specific thresholds that significantly alter the nature of any noise assessment, e.g. a level or intermittency of noise beyond which the impact or effect significantly changes in nature?
●● To what extent does introducing noise at a previously unaffected area represent more or less of an impact than increasing noise in already affected areas?
●● To what extent is the use of a noise envelope approach appropriate, and which metrics could be used effectively in this regard?
●● To what extent should noise concentration and noise dispersal be used in the UK? Where and how could these techniques be deployed most effectively?
●● What constitutes best practice for noise compensation schemes abroad

53
Conclusion
and how do these compare to current UK practice? What noise assessments could be effectively utilised when constructing compensation arrangements?
6.3 Submitted evidence will inform the Commission’s assessment of options to make best use of existing airport capacity, and in considering proposals for new infrastructure.
How to respond
6.4 Submissions of evidence should be no longer than 15 pages and should be emailed to [email protected] clearly marked as a response to the ‘Aviation Noise discussion paper’. Evidence will be reviewed thereafter by the Commission. If further information or clarification is required, the Airports Commission secretariat will be in touch.
6.5 We are therefore inviting submissions and evidence by 6th September 2013 to inform our consideration of the noise impacts of potential airport developments.
6.6 In exceptional circumstances we will accept submissions in hard copy. If you need to submit a hard copy, please provide two copies to the Commission Secretariat at the following address:
Airports Commission 6th Floor Sanctuary Buildings 20 Great Smith Street London SW1P 3BT
6.7 We regret that we are not able to receive faxed documents.

54
7. References
ACNUSA ([French] Airport Pollution Control Authority), Noise Maps of Paris Charles de Gaulle, http://www.acnusa.fr/index.php/fr/le-bruit-et-la-cartographie/la-cartographie/pgs-plan-de-gene-sonore/6513.
Aena Aeropuertos (Spanish Airport Regulator), http://www.aena-aeropuertos.es/csee/Satellite/sostenibilidad/en/Page/1237548870486//Frequently-asked-questions.html.
Air Services Australia, ‘Key Facts About Noise Sharing’, http://www.airservicesaustralia.com/wp-content/uploads/FINAL_Key-facts-about-noise-sharing.pdf.
Air Services Australia, ‘Sydney Airport’, http://www.airservicesaustralia.com/aircraftnoise/airport-information/sydney.
Australian Department of Infrastructure and Transport (2013), ‘Guidance Material for Selecting and Providing Aircraft Noise Information’, http://www.infrastructure.gov.au/aviation/environmental/transparent_noise/guidance.
Australian Government (2008), ‘National Aviation Policy Green Paper’
Babisch, W. (2006), ‘Transportation noise and cardiovascular risk: updated review and synthesis of epidemiological studies indicate that the evidence has increased’, Noise Health, Vol. 8, 1–29.
Babisch, W. (2005), ‘Hypertension and Exposure to Noise near Airports (HYENA); a European study on health effects of aircraft noise’, Proc. Inter-Noise.
Berry, B. and Flindell, I. H. (2009) ‘Estimating does-response relationships between noise exposure and human health impacts in the UK’, Berry Environmental Ltd, July 2009, http://archive.defra.gov.uk/environment/quality/noise/igcb/documents/project-report.pdf.
Brooker P. (2008), ‘ANASE: unreliable owing to design-induced biases’, Acoustics Bulletin, Vol., 33(1), 26–31.
Brooker, P. (2006) ‘Aircraft noise: annoyance, house prices and valuation’, Acoustics Bulletin, May/June, 29-32.
Brooker, P. (2004), ‘The UK Aircraft Noise Index Study: 20 years on’, Institute of Acoustics, Vol. 26 (2), 20-30.
Brussels Airport (2013), ‘Noise contours around Brussels Airport for the year 2012’, http://www.brusselsairport.be/en/cf/res/pdf/env/geluidscontouren2012.pdf.
CAA (1981) ‘The Noise and Number index’, DORA Communication 7907, http://www.caa.co.uk/docs/33/ERCD7907.pdf.
CAA (2007) ‘London Heathrow Airport Strategic Noise Maps 2006’, ERCD Report 0706,
http://www.caa.co.uk/application.aspx?catid=33&pagetype=65&appid=11&mode=detail&id=2993.
Campaign to Protect Rural England, http://www.cpre.org.uk/what-we-do/countryside/tranquil-places/in-depth/item/1688-how-we-mapped-tranquillity.

55
References
Chicago O’Hare Airport, Community Noise Management, http://www.flychicago.com/OHare/EN/AboutUs/Community/NoiseManagement/RSIP/Residential-SIP.aspx.
Clark, C. Martin, R. van Kempen, E. Alfred, T. Head, J. Davies, H. W. Haines, M. M. Barrio, I. L Matheson, M. and Stansfeld, S. A (2005) ‘Exposure-Effect relations between aircraft and road traffic noise exposure at school and reading comprehension: the ranch project’, American Journal of Epidemiology, Vol. 163 (1), 27-37.
Clark, C. Martin, R. van Kempen, E. Alfred, T. Head, J. Davies, H.W. Haines, M.M. Lopez Barrio, I. Matheson, M. & Stansfeld, S.A. (2006) ‘Exposure-effect relations between aircraft and road traffic noise exposure at school and reading comprehension: The RANCH project’ American Journal of Epidemiology, 163, 27-37.
Clark, C. and Stansfeld, S. A. (2007) ‘The Effect of Transportation Noise on Health and Cognitive Development: A Review of Recent Evidence’, International Journal of Comparative Psychology, Vol. 20, 145-158.
Cohen, J. P. and Coughlin, C. C. (2008) ‘Changing noise levels and housing prices near the Atlanta airport’, Federal Reserve Bank of St. Louis, http://research.stlouisfed.org/wp/2005/2005-060.pdf.
Department of Transport (1985) ’United Kingdom Aircraft Noise Index Study: Main Report (ANIS)’, DR Report 8402.
Department for Transport (2007) ‘Attitudes to noise from aviation sources in England’, www.dft.gov.uk/pgr/aviation/environmentalissues/Anase/.
Department for Transport (2012) ‘The Noise Sub-Objective: TAG unit 3.3.2’,
http://www.dft.gov.uk/webtag/documents/expert/pdf/U3_3_2noise-120807.pdf.
Department for Transport, ‘Air navigation guidance to the Civil Aviation Authority’ (June 2013), https://www.gov.uk/government/consultations/air-navigation-guidance-for-the-civil-aviation-authority.
Department for Transport (2012), Draft Aviation Policy Framework, http://assets.dft.gov.uk/consultations/dft-2012-35/draft-aviation-policy-framework.pdf.
Department for Transport (2013), ‘Summary of Responses for the Draft Aviation Policy Framework Consultation’, https://www.gov.uk/government/uploads/system/uploads/attachment_data/file/154561/consultation-responses.pdf.
Department for Environmental, Food and Rural Affairs (2006), Strategic Noise Mapping http://archive.defra.gov.uk/environment/quality/noise/environment/mapping/index.htm.
DLR Institute for Aerospace Medicine, http://www.dlr.de/me/en/desktopdefault.aspx/tabid-2020/2943_read-4518/.
Evans and Hygge, Evans, G. W. & Hygge, S. (2007), ‘Noise and performance in children and adults’, In Noise and its effects (eds L. Luxon & D. Prasher), London: Whurr Publishers.
European Environment Agency (2010) ‘Good practice guide on noise exposure and potential health effects’, EEA Technical Report No.11/2010.
European Commission (2002) Directive 2002/49/EC, June 2002, relating to the assessment and management of environmental noise.
Floud, S. Vigna-Taglianti, F. Hansell, A. Blangiardo, M. Houthuijs, D. Breugelmans, O. (2012) ‘Medication use in relation to noise from aircraft and road traffic in six European countries: results of the HYENA study’, Occup Environ Med ,Vol. 2 (7), 518-24.
56
Grimwood, C.J. Skinner, C.J. and Raw, G.J. (2002) ‘The UK National Noise Attitude Survey 1999/2000’, Noise Forum Conference 20 May 2002, http://www.bre.co.uk/pdf/NAS.pdf.
Haralabidis AS, Dimakopoulou K, Vigna-Taglianti F, Giampaolo M, Borgini A, Dudley ML, Pershagen G, Bluhm G, Houthuijs D, Babisch W, Velonakis M, Katsouyanni K and Jarup L, for the HYENA consortium (2008) ‘Acute effects of night-time noise exposure on blood pressure in populations living near airports’, European Heart Journal, Vol. 29(5), 658–664.
Harding, A. (2011) ‘Quantifying the links between Environmental noise related hypertension and health effects’, Health & Safety Laboratory, MSU/2011/07, http://randd.defra.gov.uk/Default.aspx?Menu=Menu&Module=More&Location=None&ProjectID=17601&FromSearch=Y&Publisher=1&SearchText=hypertension&SortString=ProjectCode&SortOrder=Asc&Paging=10#Description.
Hardoy, M.C., Carta, M.G., Marci, A.R., Carbone, F., Cadeddu, M., Kovess, V., Dell-Osso, L., & Carpiniello. B. (2005) ‘Exposure to aircraft noise and risk of psychiatric disorders’, Social Psychiatry and Psychiatric Epidemiology, Vol. 40, 24-26.
Hiramatsu, K., Yamamoto, T., Taira, K., Ito, A., & Nakasone, T. (1997) ‘A survey on health effects due to aircraft noise on residents living around Kadena airport in the Ryukyus’, Journal of Sound and Vibration, Vol. 205, 451-460.
Health Council of the Netherlands (2004), ‘The Influence of Night-time Noise on Sleep and Health’ The Hague: Health Council of the Netherlands, Publication No. 2004/14E.
Heathrow Airport Ltd. (May 2013) ‘A quieter Heathrow’, http://www.heathrowairport.com/noise/what-we-do-about-it/a-quieter-heathrow
Heathrow Airport Ltd., ‘Day Noise Insulation Leaflet’, ‘Night Noise Insulation Leaflet’ and ‘Community Buildings Noise Insulation Scheme’, http://www.heathrowairport.com/static/Heathrow_Noise/Downloads/PDF/Night_Noise_Leaflet.pdf
Hillman, D. R. Murphy, A. S. Antic, R. and Pezzullo, L. (2006), ‘The economic cost of sleep disorders’, SLEEP, Vol. 29 (3).
Hu, G., Tuomilehto, J., Silventoinen, T., Barengo, N. C., Peltonen M. and Jousilahti, P. (2005), ‘The effects of physical activity and body mass index on cardiovascular, cancer and all-cause mortality among 47,212 middle-aged Finnish men and women’, International Journal of Obesity, Vol. 29, 894-902.
ICM poll (2009), taken from: http://www.soundscape-cost.org/documents/Brighton_2011/COST_Brighton_Quiet_areas_policies_Grimwood.pdf
ICAO Doc. 9829: October 2010.
ICAO Doc 8168: Procedures for Air Navigation Services, Aircraft Operations, Volume I – Flight Procedures (PANS-OPS).
IGCB (N) (2008), ‘An economic valuation of noise pollution – developing a tool for policy appraisal’, First report of the Interdepartmental Group on Cost and Benefits, Noise Subject Group, Aug 2008, http://archive.defra.gov.uk/environment/quality/noise/igcb/documents/igcb-first-report.pdf.
IGCB (N) (2010) ‘Noise & Health – Valuing the human health of environmental noise exposure’, Second report of the Interdepartmental Group on Cost and Benefits, Noise Subject Group, July 2010, http://archive.defra.gov.uk/environment/quality/noise/igcb/documents/igcn-noise-health-response100707.pdf.

57
References
ISO (2003). ISO/TS 15666:2003, ‘Acoustics – assessment of noise annoyance by means of social and socio-acoustic surveys’. Geneva: International Standards Organization, http://www.iso.org/iso/catalogue_detail.htm?csnumber=28630.
Jarup L, Babisch W, Houthuijs D, Pershagen G, Katsouyanni K, Cadum E, Dudley ML, Savigny P, Seiffert I, Swart W, Breugelmans O, Bluhm G, Selander J, Haralabidis A, Dimakopoulou K, Sourtzi P, Velonakis M and VignaTaglianti F (2008), ‘Hypertension and exposure to noise near airports – the HYENA study’ Environ Health Perspect, Vol., 116, 329–333.
Knipschild PV (1977) ‘Medical effects of aircraft noise: community cardiovascular survey’, International Arch Occup Environ Health, Vol. 40 (3), 185–190.
Li, T. Y., Rana, J. S., Manson, J. E., Willett, W. C., Stampfer, M. J., Colditz, G. A., Rexrode, K. M. and Hu, F. B. (2006), ‘Obesity as compared with physical activity in predicting risk of coronary heart disease in women’, Circulation, Vol. 113, 499-506.
London Health Commission (Aug 2003), ‘Noise & health: making the link’, London Health Commission, http://www.healthimpactproject.org/resources/document/London-Health-Com_Noise_and_Health.pdf.
Maca, V. Melichar, J. and Scasny, M. (2008), ‘Literature review of theoretical issues and empirical estimation of health end-point unit values’, Noise (HEIMTSA Deliverable D.4.1.1).
Madrid-Barajas Airport, ‘Interactive Noise Map’, http://www.aena-aeropuertos.es/csee/Satellite/Aeropuerto-Madrid-Barajas/en/Page/1237543056506/1049727006413/Mapa-Interactivo-de-Ruido.html?other=3.
McMillen, D. P. (2004), ‘Airport expansions and property values: the case of Chicago O’Hare Airport’, Journal of Urban Economics, Vol. 55 (3), 627-640.
Michaud, D.S., Fidell, S., Pearsons, K., Campbell, K.C., & Keith, S.E. (2007), ‘Review of field studies of aircraft noise-induced sleep disturbance’, Journal of the Acoustic Society of America, Vol. 121 (1), 32-41.
Midema, H.M.E., & Vos, H. (2007), ‘Associations between self-reported sleep disturbance and environmental noise based on reanalyses of pooled data from 24 studies’, Behavioral Sleep Medicine, Vol. 5(1), 1-20.
Miedema HME and Oudshoorn C (2001), ‘Annoyance from transportation noise: relationships with exposure metrics DNL and DENL and their confidence intervals’ Journal of National and International Environmental Health Science, Vol. 109, 409–416.
Moorhouse, A (2009) ‘Environmental Noise and health in the UK’, Health protection Agency (Expert Group on the Effect of Environmental noise on Health), http://www.hpa.org.uk/webc/HPAwebFile/HPAweb_C/1279888026747.
Murihead, M. Morgan, P. A. and Morris, L. (2011), ‘Estimating the productivity impacts of noise’, Transport Research Laboratory CPR1080, https://knowledgehub.local.gov.uk/c/document_library/get_file?uuid=5fc72def-37e4-41d9-b2b3-9573158760f8&groupId=7057340.
Pennington, G. Topham, N. and Ward, R. (1990), ‘Aircraft noise and residential property values adjacent to Manchester International Airport’, Journal of Transport Economics and Policy, Vol. 24 (1), 49-59, http://www.bath.ac.uk/e-journals/jtep/pdf/Volume_XX1V_No_1_49-59.pdf.
Prescott, E., Osler, M., Andersen, K., Hein, H. O., Borch-Johnsen, K., Schnohr, P. and Vestbo, J. (1998), ‘Mortality in women and men in relation to smoking’, International Journal of Epidemiology, Vol. 27 (1), 27-23.

58
Porter N D, Kershaw A D and Ollerhead J B. (2000), ‘Adverse effects of night-time aircraft noise’, Department of Operational Research and Analysis, National Air Traffic Services Ltd, R&D Report 9964.
Rhodes, D. P. Weston, E. and Jones, K (Jan 2013), ‘Proposed methodology for estimating the cost of sleep disturbance from aircraft noise’, CAA, Environmental Research and Consultancy Department, ERCD Report 1209.
Salvi, M (2007), ‘Spatial estimations of the impact of airport noise on residential housing prices’, Cantonal bank of Zurich.
Schultz, T. J. (1978), ‘Synthesis of social surveys on noise annoyance’, Journal of the Acoustical Society of America, Vol. 64, 377–405.
Stansfeld, S. A., Berglund, B., Clark, C. (2005), ‘Aircraft and road traffic noise and children’s cognition and health: a cross-national study’, Lancet, Vol. 365, 1942-1949.
Stansfeld, S.A., Sharp, D.S., Gallacher, J., & Babisch, W. (1993), ‘Road traffic noise, noise sensitivity and psychological disorder’ Psychological Medicine, 23(4), 977-985.
Stansted Generation One Planning Application, ‘Histogram of LAMax noise exposure levels’, taken from CAA records.
Sustainable Aviation (2013), ‘The SA Noise Road Map: a blueprint for managing noise from aviation sources to 2050’, http://www.sustainableaviation.co.uk/wp-content/uploads/A4-Tri-fold-SA-Noise-Road-Map-Leaflet-Final-Version-230413.pdf.
Sydney Airport Community Forum, ‘Long Term Operating Plan’, http://www.sacf.infrastructure.gov.au/airport/LTOP/index.aspx.
Tontechnik Rechner, http://www.sengpielaudio.com/TableOfSoundPressureLevels.htm.
van Kamp, I., Houthuijs, D., van Wiechen, C., & Breugelmans, O. (2007), ‘Environmental noise and mental health: Evidence from the Schiphol monitoring program’ in Internoise 2007, Proceedings of the 2007 International Congress and Exhibition on Noise Control Engineering, Istanbul, Turkey: Turkish Acoustical Society.
Walters, A. A. (1975), ‘Noise and Prices’, Oxford University Press, London.
World Health Organisation (1999), Guidelines for Community Noise (B Berglund et al, eds), Geneva, Switzerland: World Health Organization, http://whqlibdoc.who.int/hq/1999/a68672.pdf, and http://www.who.int/docstore/peh/noise/guidelines2.html.
World Health Organisation (2011), ‘Burden of disease from environmental noise: quantification of healthy life years lost in Europe’, http://www.euro.who.int/en/what-we-publish/abstracts/burden-of-disease-from-environmental-noise.-quantification-of-healthy-life-years-lost-in-europe.

59
Annex B: LDEN and Freq 70 maps for Brussels airport
Annex A: Noise contours for Paris 2004
Mit
ry-M
ory
Oth
is
Go
nes
se
Ch
elle
s
Ois
sery
Mea
ux
Th
ieu
x
Ch
arn
yM
essy
Lu
zarc
he
s
Lo
uvr
es
Juil
ly
Pa
ris
12
ème
Pre
sles
Pa
ris
16
ème
Ba
rcy
Mo
nth
yo
n
Cla
ye-S
ou
illy
Joss
ign
y
Tre
mb
lay-
en
-Fra
nce
Torc
y
Vém
ars
Ga
gn
y
Dra
ncy
Arg
ente
uil
Vil
lep
inte
Sa
int-
Den
is
Le
Pin
Ch
am
bry
Se
vra
n
Do
mo
nt
Eco
uen
Jab
lin
es
Se
rris
Forf
ry
Mo
uss
y-le
-Ne
uf
Vil
leva
ud
é
Au
lna
y-so
us-
Bo
is
Sa
rcel
les
Vil
len
oy
Mo
ntr
eu
il
Sta
ins
Vo
ula
ng
is
No
isy-
le-G
ran
d
Ge
nn
evi
llie
rs
Sa
int-
So
up
ple
ts
Bo
nd
y
Go
uss
ain
vill
e
Ma
rcil
ly
Ro
issy
-en
-Fra
nce
Co
up
vra
y
Ch
essy
Bo
big
ny
Sa
int-
Pri
x
Ma
ure
ga
rd
Pa
nti
n
An
net
-su
r-M
arn
e
Ma
ffli
ers
Vil
lep
ari
sis
Tril
ba
rdo
u
Sa
int-
Wit
z
Vil
lero
y
Vil
len
euve
-le
-Co
mte
Bu
ssy-
Sa
int-
Ge
org
es
Co
lom
bes
Tig
eau
x
Vil
lero
n
Qu
incy
-Vo
isin
s
Att
ain
vill
e
Ferr
ière
s
Pa
ris
15
ème
Ch
au
con
in-N
eufm
on
tie
rs
Po
mp
on
ne
Mo
ntg
é-en
-Go
èle
Co
ute
vro
ult
L/I
sle-
Ad
am
Ma
rly
-la
-Vil
le
Pis
cop
No
isie
l
Bo
ule
urs
Cu
isy
Vin
an
tes
Ch
au
vry
Sa
nn
ois
Du
gn
y
Esb
ly
Pu
isie
ux
Pa
ris
13
ème
Eza
nvi
lle
Foss
es
Liv
ry-G
arg
an
Be
llo
y-en
-Fra
nce
Cro
issy
-Be
au
bo
urg
Lo
gn
es
Sa
int-
Ma
rd
Co
mp
an
s
Le
Mes
nil
-Am
elo
t
Da
mp
ma
rt
Erm
on
t
Pa
ris
19
ème
Sa
int-
Me
smes
Fon
ten
ay-
en-P
ari
sis
Vil
lie
rs-l
e-B
el
La
Co
urn
euve
Co
urt
ryL
esc
hes
Ma
rch
ém
ore
t
Do
uy-
la-R
am
ée
Ro
uvr
es
Su
rvil
lie
rs
Le
Bla
nc-
Me
snil
Ch
am
pig
ny-
sur-
Ma
rne
Gre
ssy
Cli
chy
Vig
nel
y
Pa
ris
18
ème
Pa
ris
20
ème
Co
ub
ron
Ba
ille
t-e
n-F
ran
ce
Mo
nté
vra
in
Pe n
cha
rd
Na
nto
uil
let
Pa
ris
17
ème
Pa
ris
14
ème
Au
ber
vill
iers
Mo
uss
y-le
-Vie
ux
Ea
ub
on
ne
Mo
ntf
erm
eil
Via
rmes
Vau
jou
rs
Ivry
-su
r-S
ein
e
Isle
s-lè
s-V
ille
no
y
No
isy-
le-S
ec
Ma
reil
-en
-Fra
nce
Le
Mes
nil
-Au
bry
Ner
vill
e-la
-Fo
rêt
Gro
sla
y
Le
Th
illa
y
Mo
ntr
y
An
dil
ly
Bo
uff
émo
nt
Meu
do
n
Sa
int-
Ou
en
Neu
illy
-su
r-M
arn
e
Co
urb
evo
ie
Pu
tea
ux
La
ssy
Pa
ris
7è
me
La
gn
y-su
r-M
arn
e
Pa
ris
8è
me
Cla
ma
rt
Vil
lem
om
ble
Po
ntc
arr
é
Ep
ina
y-su
r-S
ein
e Arc
ue
il
Van
ves
Sa
int-
Ma
ur-
de
s-Fo
ssés
Be
lle
fon
tain
e
Vil
lie
rs-A
da
m
Sa
int-
Ma
rtin
-du
-Te
rtre
Tave
rny
Sa
int-
Pa
thu
s
Da
mm
art
in-e
n-G
oè
le
Em
era
invi
lle
Ch
am
ps-
sur-
Ma
rne
Fres
ne
s-su
r-M
arn
e
Lo
ng
per
rier
Ma
reu
il-l
ès-
Mea
ux
Mo
nts
ou
lt
Ba
illy
-Ro
ma
invi
llie
rs
Mo
ntm
ore
ncy
Ro
sny-
sou
s-B
ois
Co
llé
gie
n
Vil
lie
rs-s
ur-
Mo
rin
Ch
arm
entr
ay
Vair
es-
sur-
Ma
rne
Na
nte
uil
-lè
s-M
eau
x
Pa
ris
11
ème
Sa
int-
Leu
-la
-Fo
rêt
Etr
ép
illy
Ba
gn
ole
t
Fon
ten
ay-
sou
s-B
ois
Ro
ma
invi
lle
Pré
cy-s
ur-
Ma
rne
Pu
ise
ux
-en
-Fra
nce
Ga
rges
-lè
s-G
on
esse
Ch
ali
fert
Ive
rny
Vil
len
euve
-Sa
int-
De
nis
Favi
ère
s
Vil
len
euve
-so
us-
Da
mm
art
in
Sa
int-
Bri
ce-s
ou
s-Fo
rêt
Ma
gn
y-le
-Ho
ng
re
Bo
uq
ue
val
Jag
ny-
sou
s-B
ois
De
uil
-la
-Ba
rre
Asn
ière
s-su
r-S
ein
e
Ma
iso
ns-
Alf
ort
Go
uve
rne
s
Th
ori
gn
y-su
r-M
arn
e
Bo
ulo
gn
e-B
illa
nco
urt
Mo
ntl
ign
on
Le
Ple
ssis
-Ga
sso
t
Bo
nn
eu
il-e
n-F
ran
ce
Cli
chy-
sou
s-B
ois
Mo
ntm
ag
ny
Vil
lie
rs-l
e-S
ec
Vil
lie
rs-s
ur-
Ma
rne
Pa
ris
10
ème
Ma
lak
off
Bry
-su
r-M
arn
e
Le
Ra
incy
Cré
gy-
lès-
Mea
ux
Pa
ris
5è
me
Ge
svre
s-le
-Ch
ap
itre
Neu
illy
-su
r-S
ein
e
Po
incy
Issy
-le
s-M
ou
lin
ea
ux
Sa
int-
Gra
tien
Bro
u-s
ur-
Ch
an
tere
ine
Neu
illy
-Pla
isa
nce
Co
uil
ly-P
on
t-a
ux
-Da
me
s
Bé
them
on
t-la
-Fo
rêt
Le
Ple
ssis
-l'E
vêq
ue
Le
Bo
urg
et
Pa
ris
1e
r
Ch
âti
llo
n
Mo
ntr
ou
ge
Vin
cen
nes
Sa
int-
Ger
ma
in-s
ur-
Mo
rin
Ep
iais
-lès
-Lo
uvr
es
Vil
leta
ne
use
Pa
ris
9è
me
Pa
ris
6è
me
Sa
int-
Th
iba
ult
-de
s-V
ign
es
Ch
enn
eviè
res-
lès-
Lo
uvr
es
Co
nch
es
Le
Per
reu
x-s
ur-
Ma
rne
Le
Ple
ssis
-au
x-B
ois
Ca
rne
tin
Bo
uti
gn
y
Da
mm
art
in-s
ur-
Tig
ea
ux
Le
Ple
ssis
-Tré
vise
Pie
rref
itte
-su
r-S
ein
e
Ep
ina
y-C
ha
mp
lâtr
eu
x
Ch
an
telo
up
-en
-Bri
e
So
isy-
sou
s-M
on
tmo
ren
cy
Ch
âte
na
y-en
-Fra
nce
Le
vall
ois
-Pe
rret
No
ge
nt-
sur-
Ma
rne
Pa
vill
on
s-so
us-
Bo
is
Ge
nti
lly
Le
s L
ila
s
Mo
isse
lle
s
Vil
len
euve
-la
-Ga
ren
ne
Join
vill
e-l
e-P
on
t
Pa
ris
4è
me
Alf
ort
vill
eB
ag
ne
ux
Bo
is-C
olo
mb
es
Bu
ssy-
Sa
int-
Ma
rtin
Cré
cy-l
a-C
ha
pel
le
Arn
ou
vill
e-l
ès-G
on
ess
e
Sa
int-
Ma
uri
ce
Se
ugy
Gu
erm
an
tes
L/I
le-S
ain
t-D
enis
Po
nta
ult
-Co
mb
au
lt
Vil
lain
es-s
ou
s-B
ois
Pa
ris
3è
me
Ch
are
nto
n-l
e-P
on
t
Co
nd
é-S
ain
te-L
ibia
ire
En
gh
ien
-les
-Ba
ins
Le
Ple
ssis
-Bo
uch
ard
Mér
iel
Pa
ris
2è
me
Go
urn
ay-
sur-
Ma
rne
La
Ga
ren
ne-
Co
lom
be
s
Le
Kre
mli
n-B
icêt
reR
ois
sy-e
n-B
rie
Ma
rgen
cy
Cré
teil
Sa
int-
Ma
nd
é
Vil
leju
if
Su
resn
es
Le
Ple
ssis
-Lu
zarc
he
s
Ch
enn
eviè
r es-
sur-
Ma
rne
Ch
au
mo
nte
l
Le
Pré
-Sa
int-
Ger
vais
Asn
ière
s-su
r-O
ise
Vit
ry-s
ur-
Sei
ne
Cré
cy-l
a-C
ha
pel
le
Vau
dh
erl
an
d
No
inte
l
Be
ssa
nco
urt
Co
urb
es b
ase
PG
S 2
00
4
LDE
N 5
5
LDE
N 6
0
LDE
N 6
5
LDE
N 7
0
Den
sité
de
po
pu
lati
on
(H
abit
ants
/Ha)
> 0
- 2
00
20
0 -
60
0
60
0.
- 2
00
0
20
00
- 6
50
0
65
00
- 1
70
00
A3
Form
at :
Ech
elle
Lab
ora
toir
eA
PR
L/E
Co
de
IAT
AA
nn
éeN
um
éro
d'é
tud
eN
um
éro
de
Pla
nIn
dic
e d
e r
évi
sio
nD
ate
d'é
mis
sio
nC
od
e p
lan
CD
G2
00
51
07
Avr
il 2
00
8
Ob
serv
ati
on
:
1:1
25
0
00
AÉ
RO
DR
OM
E D
EP
AR
IS-C
ha
rles
-de-
Ga
ull
e
Hyp
oth
èse
s P
GS
20
04
Source: ACNUSA, Noise Maps of Paris Charles de Gaulle, http://www.acnusa.fr/index.php/le-bruit-et-la-cartographic/la-cartographie/pgs-pbn-de-gene-sonore/6513

60
Annex B: LDEN and Freq 70 maps for Brussels airport

61
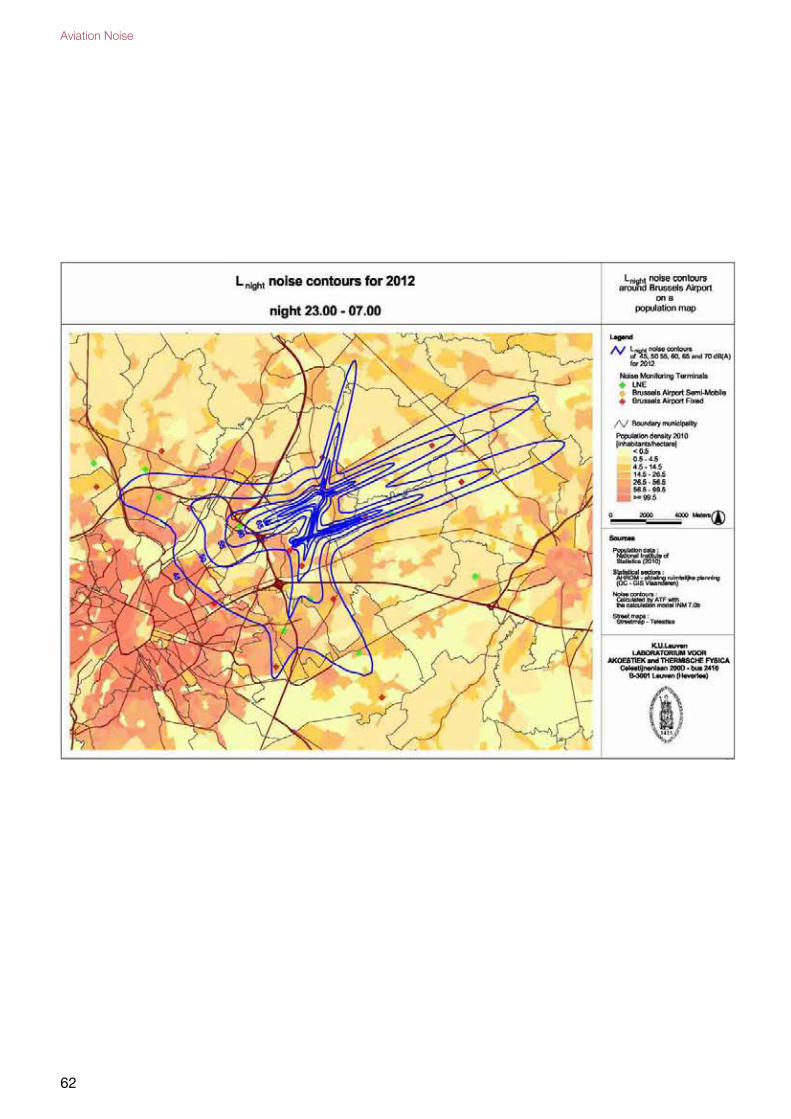
62
Aviation Noise

63

64
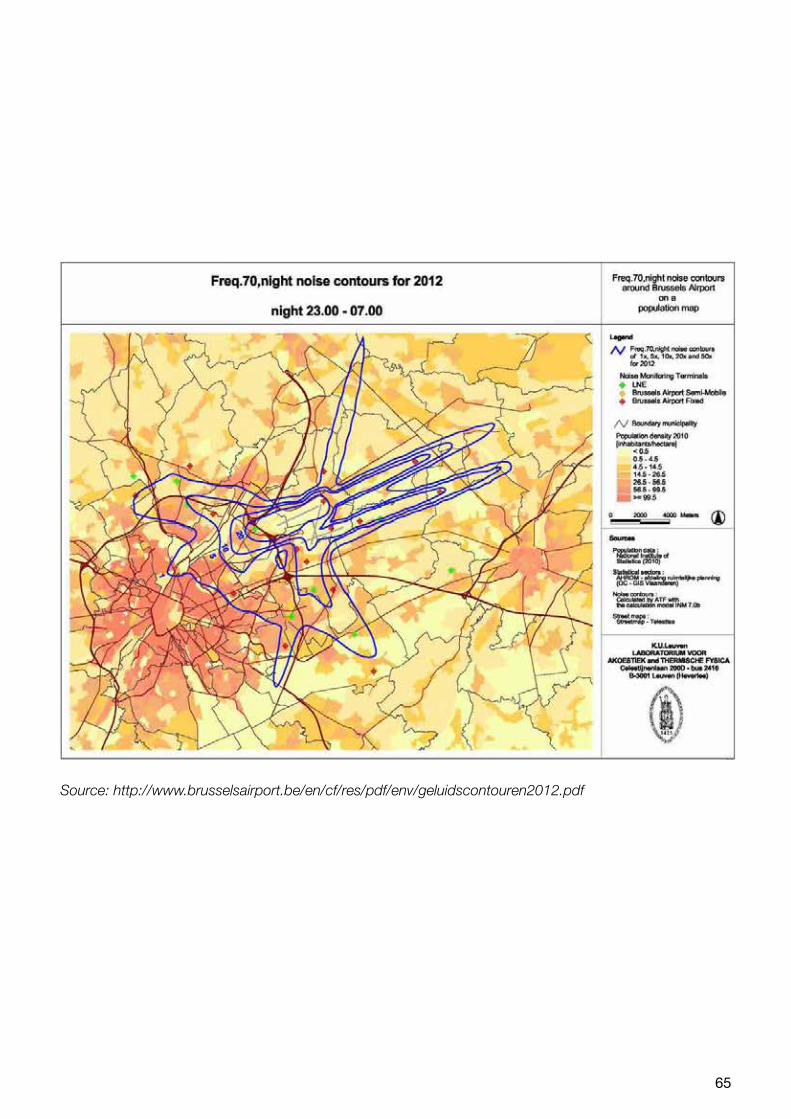
65
Source: http://www.brusselsairport.be/en/cf/res/pdf/env/geluidscontouren2012.pdf

66
Source: CAA
Aviation Noise
Annex C: Historical noise contours for Heathrow, 57LAeq

Contact Information
Website: www.gov.uk/government/organisations/airports-commission Email: [email protected]