Embed Size (px)
Citation preview

DISCUSSION DOCUMENT
PERSPECTIVES ON AN INCLUSIVE HIGHER JOB
RICH GROWTH PATH FOR SA BY 2025
EMBARGOED UNTIL 14H30 ON 2 DECEMBER 2010
2
Contents
1. EXECUTIVE SUMMARY 3
2. INTRODUCTION 5
3. ECONOMIC GROWTH TALK: THE CONVERSATION SO FAR 6
4. SOUTH AFRICA’S GROWTH AND EMPLOYMENT CHALLENGE 9
5. POSSIBLE ALTERNATE SCENARIOS FOR GROWTH AND EMPLOYMENT IN 2025 15
6. EXPLORING THE TOUGH CHOICES FOR AN INCLUSIVE JOB RICH GROWTH SCENARIO 22
7. CONCLUSION 30
8. ANNEXURE 'A' — Research Foundation Report
3
1. EXECUTIVE SUMMARY
1. OVERALL BACKGROUND
The point of departure is to identify high GDP growth as a necessary condition for meeting SA's socio-
economic challenges in a rapidly restructuring global economy. Long term scenario perspectives are required
to accommodate diverse ideas about the future and to be able to engage with the future scenarios developed
by other stakeholders in the social dialogue process.
In creating a framework for the discussion document the elements are —
1.1. The importance of the role of social dialogue.
1.2. Some government and labour positions.
1.3. SA compared with five similar countries and the conclusions drawn from there regarding issues such as
macro-economic stability, global competitiveness, poverty reduction, the labour market and the development
of the small and medium enterprise.
1.4. The role of the state as a country moves through different stages of development and faces new
challenges from the world economy growth.
2. POSSIBLE ALTERNATIVE SCENARIOS FOR GROWTH AND EMPLOYMENT BY 2025
2.1. Four possible scenarios
Scenario 4: Stalled at the starting gate
Scenario 3: The slow lane
Scenario 2: The fast lane
Scenario 1: Team South Africa
2.2. In order to lay a solid foundation for the inclusive job-rich scenario there are certain top priorities, such as
improving the educational system, skills development and public sector delivery. It is recognised that all these
activities need to happen in tandem taking account of the capacity of the state.
3. EXPLORING THE TOUGH CHOICES FOR AN INCLUSIVE JOB RICH GROWTH PATH
Tough Choice # 1: Stick to a disciplined macroeconomic approach instead of giving in to inflationary
temporary employment boosting
Tough Choice # 2: Focus effort on actions rather than talk shops in promoting an inclusive job rich
growth path.
Tough Choice # 3: Prioritise getting the Delivery State in place before embarking too far on the
Developmental State.
Tough Choice # 4: Put more skills and more support into the education system rather than more
money.
4
Tough Choice # 5: Get business to be deeply engaged in skills development rather than leaving it to
the SETAs and the education system.
Tough Choice # 6: Use a targeted approach to skills development and job creation for the
unemployed rather than broad-based programmes.
Tough Choice # 7: Use an incentivised approach to poverty reduction measures rather than
unconditional grants
Tough Choice # 8: Use a targeted value-add approach to industrial development and other more job
rich sectors rather than generating wish lists.
Tough Choice # 9: Boldly re-engineer State-Owned Enterprises with new partnerships to build up
regional infrastructure rather than tinkering with them.
Tough Choice # 10: Introduce strategic wage setting rather than sticking rigidly to the current labour
relations regime.
Tough Choice # 11: Take risk and invest in the SMME and Informal Sectors rather than waiting for
them to knock at the door.

5
PERSPECTIVES ON AN INCLUSIVE HIGHER
JOB-RICH GROWTH PATH BY 2025
DISCUSSION DOCUMENT
2. INTRODUCTION
The Purpose of this Discussion Document
This discussion document is intended to assist BUSA in engaging with its members and the other social partners on the issue of Inclusive Job Rich Growth with a view to developing and articulating a comprehensive approach. It therefore seeks to stimulate debate and develops tentative directions with a view to assisting in finalising a detailed policy position. The Discussion Document represents a further stage of development of the Research Foundation Document that is attached as Annexure A. It includes insight gained from ongoing discussions with BUSA members and the BUSA Inclusive Job Rich Growth Policy Forum on the 20th of October 2010.
An approach to the Job Rich Growth Conversation
We are aware the concept of Job Rich Growth has been coined to capture the global emphasis on new growth paths that create jobs to deal with the massive unemployment that followed in the wake of the Global Financial Crisis (GFC). In our context we wish to refer to Inclusive and High Job Rich Growth for the following reasons: Inclusive Growth: South Africa is the world’s most unequal upper middle income country and this trend is increasing. Unless the structural inequality between races, the employed and the unemployed and the aspirant middle class and the poor are addressed the prospects for a secure and prosperous future for South Africa are slim (see Chapter 3 of this document for our scenario insights for 2025).The prefix ‘inclusive’ reflects the BEE and BBBEE needs for transformative economic development in South Africa and the partnership elements needed for successful delivery of the growth strategy.
High Growth: without high GDP growth, South Africa cannot hope to tackle its immense inequality (see Chapter 3 on Scenarios for 2025). In the context of an increasingly integrated

6
world this means globally competitive industries and a business friendly infrastructural, regulatory and cost environment. This needs to be supported with regional and local economic development initiatives that make best use of the country’s resources and capabilities.
Within this framework we would wish to emphasise the following:
A pragmatic approach to job creation: in our view it is not useful to make grand assumptions about the number of jobs that will be created in future in sectors or industries without taking into account at least the following:
In a rapidly restructuring global economy the nature of employment is changing as fast as technology and business models are evolving (see Chapter 2 of the Research Foundation). The jobs of yesterday will not be the jobs of tomorrow and we need to be willing to constantly rethink how we both align and align and develop the productivity of our workforce and ensure that needs are met at the same time.
Jobs will be created by specific employers operating in specific industries. Unless they are involved in the job rich growth debate the conversation will remain abstract and will be unlikely to yield meaningful action.
A long term scenario perspective: building up South Africa’s productivity and skills base is an inter-generational project. We therefore suggest the use of scenarios to 2025 to so that the conversation is able to accommodate diverse ideas about the future and to be able to engage with the future scenarios put forward by the other social partners in the dialogue process.
3. ECONOMIC GROWTH TALK: THE CONVERSATION SO FAR
The Social Dialogue Concept
Social Dialogue involves all types of exchange between governments, employers and workers, on issues of common interest relating to economic and social policy. A key product of social dialogue could ultimately be a Social Pact: a consensus position on socio-economic development between Government, labour, business and civil society. Effective social dialogue was instrumental in South Africa’s shift to a more inclusive economy and society. The most recent and influential form of social dialogue has been the “Framework for South Africa’s Response to the International Economic Crisis” that has laid the foundation for social partners to offer leadership in socio-economic development. Ideally establishing a poverty-reduction programme based on growth should make it easier to find a consensus more quickly between different stakeholders in society, in view of the fact that it makes it possible to give more to everyone if well managed.
Government’s Response to the Global Financial Crisis (GFC) and the Growth Path Debate South Africa has been through a variety of national growth strategies over the past 15 years, including the RDP, GEAR, The Jobs Summit, The Growth & Development Summit, ASGISA and JIPSA and has now the recently unveiled Economic Growth Path (EGP).

7
The government adopted a strong counter-cyclical fiscal and monetary policy stance to the GFC. The “Framework for South Africa’s Response to the International Economic Crisis” of 19 February 2009 represented a unique partnership approach agreed to by the social partners (Government, Labour and Organised Business, plus Community) and facilitated by NEDLAC. Broad Principles were agreed to and the following measures adopted:
Investment in Public Infrastructure;
Macro Economic Policy Response;
Industrial and Trade Policy Measures;
Employment Measures;
Social Measures;
Global Coordination;
Social Partnership in Response to the Crisis; and
Prioritises industrial upgrading in more labour-intensive sectors.
South African social partners have recently agreed to the South African Decent Work Country Programme and have suggested a programme of improving rights and principles at work, employment opportunities, social security and protection and enhanced social dialogue. . A Presidential State Owned Enterprises (SOEs) Review Committee has been formed.
The EGP intends to address unemployment, inequality and poverty through unlocking employment opportunities in the private sector. It wants to create five million jobs in the next 10 years while reducing unemployment from 25 percent to 15 percent. Organised Business is seen as playing a major role to address key structural challenges in the economy.
"The new growth path is a broad framework that sets out a vision and identifies key areas where jobs can be created. The growth path we are announcing today places employment at the centre of economic policy for the government," Minister Chabane said in his press release on the 26th of October 2010. He cited China, India and Brazil as examples of countries which have growth prospects similar to those of South Africa. The country could use its influence and experience to gain similar grounds across Africa. "The new growth path commits South Africa to work with other countries on the continent to build a single African integrated economy, embracing one billion consumers and to focus immediately on expanding economic links with the rest of the continent," said Chabane. At least six key sectors of the economy, including infrastructure development, agriculture, mining, green economy, manufacturing and tourism, have been identified as having potential to unlock employment opportunities. For example, in the green economy, government identified a potential 300 000 jobs by 2020, with 80 000 in manufacturing with a potential to rise to well over 400 000 by 2030. The Government has committed itself to a consultation process on the New Growth Path which is heartily welcomed by BUSA. The following highly positive statements about the New Growth Path are included in National Treasury’s recently released Medium Term Budget Policy Statement:
“Strengthening labour-market institutions has to include improved and expanded further education and training opportunities, the reform of job search and placement services, and measures to increase the demand for labour.

8
In co-financing economic infrastructure investment, enterprise development, housing and farming support, an expanded role needs to be played by development finance institutions, in partnership with public-service delivery agencies and private-sector funders.
Industrial development promotion needs to be enhanced, as envisaged in government’s industrial policy action plan, together with increased support for small enterprises and local economic opportunities
Greater competition is needed in electricity, transport and communications. Eskom’s generation and systems operation responsibilities should be separated and independent power producers encouraged.
South Africa’s economic prospects are integrally linked with regional development, including financial and trade networks, transport, communications, energy, water and institutional coordination. Improved economic performance depends on better cooperation between countries in Southern Africa.
Sustained improvements in public service delivery will depend in part on better financial management, good governance, sound budgeting and contract management arrangements, and disciplined pursuit of agreed service delivery outputs and targets.”
A note of concern that needs to be raised at this point is the extent to which the New Growth will supersede or override previous high level economic policy positions such as ASGISA and JIPSA. Whilst differences can be inferred it would be useful in Government were to be explicit about what exactly is new about the Growth Path and how this affects lower tiers of policy and implementation. A second concern is that multiple state units (National Treasury, the National Planning Commission, the DTI and the Economic Development Department) appear to be developing policy frameworks that do not necessarily align (the MTSF, the Economic Development Strategic Plan and IPAP 2) with each other or the Growth Path. These entities also seem to be using different consultative mechanisms (advisory bodies and commissions). Engaging with the Growth Path should entail a single point of entry for social partners into Government and a coherent link with other economic policy making entities and processes. Generally, there needs to be better coordination and coherence in policy.
COSATU’s Position
COSATU has flatly rejected the idea of wage restraint which would follow from a national programme of boosting productivity in favour of a redistributive economic approach that sees monetary and economic policy designed to create a basis for wealth distribution. To this end, the State is seen as the residual employer of last resort. COSATU’s policy document advocates labour intensive industrialisation, strengthening trade policy and enforcing trade laws. It argues for control over a central state bank and strategic nationalisation of industries that will support industrialisation. It suggests that as the COSATU contribution, existing union investment companies should create and finance a vibrant co-operative sector and the feasibility of creating a Workers’ Bank is being explored.
A key concern here is that COSATU’s approach constantly calls for more state intervention and involvement. This not only flies in the face of international best practice but also places more stress on government delivery. The experience of the recent World Cup in SA was a public-private sector partnership on a large scale and has lessons for policy implementation. In seeking a higher growth path for SA we need to absorb these lessons.
9
4. SOUTH AFRICA’S GROWTH AND EMPLOYMENT CHALLENGE
Key Insights from the Research Foundation (Annexure A)
The work thus far has highlighted a number of themes that have guided the development of scenarios and the identification of tough choices for South Africa.
A shifting global landscape
South Africa needs to position itself in regard to the challenges of the post-GFC world which is seeing strong capital inflows into developing countries and a possibly restrictive trade environment as countries seek to protect themselves from the effects of the GFC. However, this will not reverse the globalisation process and by 2025 trade will account for close to 50% of world GDP. This will be accompanied by the transfer of geopolitical and economic power from West to East while China will surpass the US economy by 2025. The world will also be in environmental “pay-back time” to 2025 as major impacts from climate change adaptation and mitigation policies will be aggravated by what is termed the “Energy Interregnum”: a period of increasing energy costs due to high fossil fuel prices. The USA, China and the EU will compete for African commodities and markets.
The African growth opportunity
South Africa will compete with China, the USA, the EU and BRIC countries for a share of African markets. The African population will double from less than 1 billion to more than 2 billion by mid century, generating a huge “demographic dividend” of young workers and consumers. This market will be boosted by Africa’s immense commodity endowments.
How competitive is South Africa?
In an ever more globalised world, South African workers will be competing with other countries in terms of rising skills and productivity needs as new jobs are created in services, logistics, knowledge, high-end manufacturing, and biotechnology, the Green Economy as well as tourism, leisure and culture. South Africa’s competitiveness in the current and future global scenario is highly dichotomous and reflects its Apartheid legacy. On the one hand South Africa is highly competitive in regard to accountability of private institutions, financial market development, intellectual property protection, property rights and good scientific research institutions. On the other hand it is amongst the lowest ranked countries in regard to labour market efficiency, hiring and firing practices, flexibility in wage determination by companies, labour-employer relations, the business costs of crime and violence and the health of the workforce. Other factors which impede South Africa’s competitiveness include regulatory obstacles to entrepreneurship, anti-competitive situations and barriers to the flow of resources into export industries as well as transportation bottlenecks, skills shortages, and high import tariffs on inputs.

10
The inequality, unemployment and poverty challenge
South Africa has the world’s highest unemployment for an upper middle income country and the total number of unemployed has increased to 4,2m - 5,5m people. It also has one of the world’s highest Gini Coefficient (which measures inequality). The unemployment rate of young people aged 20 to 24 stands at some 44.7 per cent, which is globally one of the highest. By 2015 more than half of working age adults will still be out of work under best case scenarios. The structural inequality between those working and those out of work is the biggest transformation challenge facing South Africa both economically and socially. South Africa faces a tremendous education and education crisis in the context of an ever more open and competitive world. The education system is not performing and one out of three matriculants and 39% of those with incomplete schooling are unemployed. This means that inequality is being transmitted to the next generation as the most poorly performing schools are in townships and rural areas where many other factors serve to disadvantage young people. Thanks to a grant-based poverty reduction system, the real incomes of the poorest 20% of South Africans rose by 30% in real terms between 1994 and 2004. In 2009/10, spending on grants will increase to R80bn, representing 12% of total government spending. This has achieved huge benefits for the poor but cannot be expanded much further as 5.4m taxpayers are now in effect supporting 13.4m people drawing social grants.( The Brazilian experience of significant improvements in poverty reduction driven by social grants conditional on education and health requirements has had multiple benefits and is worth consideration.)
The impacts of the GFC
The GFC had a major impact on South Africa as the number of South Africans employed has fallen by 6.1% and employment levels are only likely to return to their 2008 peak by around 2015. It is estimated that if the economy grows at 5.5-6 percent a year, employment levels will return to their 2008 peak by 2013. According to Finance Minister Pravin Gordhan, South Africa needs sustained growth of at least 7 percent a year over a 20-year period to significantly reduce unemployment and poverty.
South Africa compared with five similar countries
In order to set South Africa’s development path in context, a comparison was made with Brazil, Chile, Malaysia, Poland and Ghana (see relevant Chapter of the Research Foundation). The following conclusions emerged:
All of the countries in the sample strived for macroeconomic stability as a basis for growth with Chile performing best on this aspect and most other factors. South Africa will need to ensure buy-in to the growth path as macro-economic stability and growth do not guarantee job creation or poverty reduction in the short term.
South Africa could look to the spirit of economic commitment that is evidenced in the high levels of partnership and collaboration between government and business evident in the cases of Brazil, Chile and Malaysia. Very special attention needs to be paid to Malaysia’s New Growth Path, which deals with many of the issues that South Africa
11
needs to deal with in a very direct and honest manner as the table of Strategic Reform Initiatives (SRI) reproduced at the end of this chapter aptly illustrates.
The South African economy is service-driven as in the case of Brazil, Chile and Poland and would require major structural overhaul in order to follow a manufacturing growth path as in the case of Malaysia. This would be very difficult given current low labour productivity and the low levels of socio economic development which underpin the quality of the labour force. It would also require unprecedented focus on seizing opportunities in the global manufacturing value chain in which countries in the Far East have massive competitive advantages.
The case studies of Chile and Malaysia indicate that technological innovation and labour up-skilling are critical issues in an economy that is trying to move out of the “middle income malaise” of a growth path that has soaked up its resource of cheap labour to meet low-cost mass manufacturing opportunities and now needs to position a relatively expensive work force to serve a service-driven economy and sophisticated manufacturing processes. This will soon be the position that China finds itself in and has been South Africa’s position since the 1990’s.
South Africa is far more capital intensive and skill intensive than one would expect given the high rate of unemployment of unskilled labour. The structure of the labour market has not been conducive to higher employment. A contributing factor to this and, hence, to the unemployment problem is also that the small and medium enterprise (SME) sector is not large enough and has not absorbed as much labour as it should. This is partly because of historical and new barriers to the growth and formalisation of microenterprises among the black population, but requires intensive commitment from all the social partners going forward.
Finally the lessons of incentivised poverty reduction from Brazil, Chile and Malaysia’s New Growth Plan deserve special attention. Brazil’s Bolsa Familia has helped 20 million people to lift themselves out of poverty. By contrast South Africa’s grant-based poverty reduction strategies are promoting short-term and long-term dependence and low productivity and are placing major demands on a relatively small taxpaying population.
The Role of the State in a developing economy
It is evident from the case studies (although far more research could be done on this) that the state needs to play an important but flexible role in the economy as a country moves through different stages of development and faces new challenges from the world economy. It is clear that there is no “one size fits all” solution to the question of what the role of the state should be in regard to at least the following:
To make a ‘mixed’ economy work better.
As fiscal manager of the macro economy.
As rule setter for the players in the economy
As provider of public goods and services
To find new creative ways to involve the private sector and other stakeholders in providing public goods and services
As an enabler, to allow the private sector to generate growth and create jobs.
12
Very careful thought needs to be given to the varying ways in which the state can ensure the provision of public goods and services without necessarily running the businesses that produce these goods and services.
When appropriate, public organizations should be put into the marketplace and make them dependent on competition for their revenues. When that is not appropriate, they should use contracting to create competition between public and private organizations (or public and public organizations). When neither is appropriate or politically possible, they should use the consequences strategy to shatter the status quo by measuring performance, rewarding improvement and excellence and refusing to tolerate persistent failure. This can be done in any government organization. These three approaches are known as
entrepreneurial management
managed competition, and
performance management.
And here one notes a world- wide trend for the state to strategically position its role to achieve maximum leverage of its financial and human capacity by involving the private sector as partner in the business aspects of service delivery. This not only brings in the capital, efficiencies and innovation that market forces generate but also frees the state to focus on those things that only it can do. It also avoids the corruption and nepotism that follow when the state is both player and referee in major sectors of the economy. Although the nature of these partnerships varied in the case studies, a strong role for the state was balanced with strong collaboration with business and a supportive labour force.
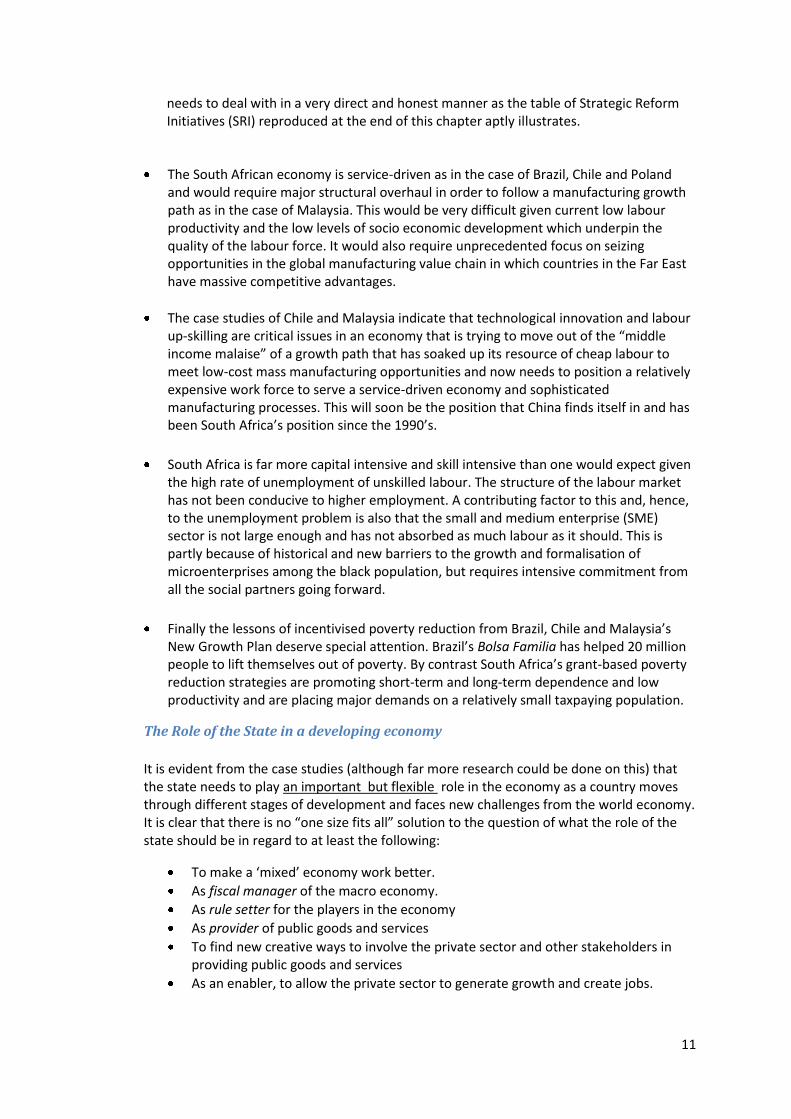
It is not possible to have a high growth path dialogue and at the same time a discussion as to whether to nationalise key sectors of the economy if the purpose is greater collaboration. Proposals to nationalise the mining industry have been counter-productive. The successful countries in our case studies developed partnerships with the private sector and it is worth noting the reasons why Malaysia in particular is withdrawing from direct involvement in the economy in its new economic plan.
Chapter Footnote: Extracts from Malaysia’s New Economic Model in its Tenth Malaysia Plan of the 10th of June 2010:
Old Approach New Approach Growth primarily through accumulation Growth through productivity
Dominant state participation in economy Private sector-led growth
Centralised strategic planning Localised autonomy in decision-making
Balanced regional growth Cluster- and corridor-based economic activities
Favour specific industries and firms Favour technologically capable industries and firms
Export dependence on Europe, US and Japan Asian and Middle-East export orientation
Restriction of foreign skilled workers Retain and attract skilled workers

13
Malaysian Strategic Reform Initiative
Possible Measures
1. Re-energising the private sector
Incentives for high value-added production
“Single-Window” licensing process through e-government
Reduce direct state participation in economy
Economy-wide broadband roll-out
No bail-outs for SOEs
Transparent and competitive procurement processes
Timely funding for hi-tech firms
Aggressive regional marketing
2. Developing quality workforce
Shift in educational approach from rote learning to creative/critical thinking
Demand-driven training, with increasing emphasis on technical and vocational training
Enhance English proficiency
Upgrade skills of bottom segment of labour force
Allow wage levels to reflect skill level
Centralise oversight of foreign labour to enable coherent practice
Build up critical mass of skilled professionals through simpler work permit and immigration procedures
Protect workers, not jobs, through stronger safety nets while encouraging labour market flexibility
Revise hiring/firing rules
Raise pay through productivity gains, not wage regulation
3. Creating competitive domestic economy
Revamp seed and venture capital funds to support budding entrepreneurs
Introduce fair-trade legislation
Provide technical and financial support for SMEs
Phase out price controls and subsidies
4. Strengthening public sector
Improve decision-making processes through ‘whole-of-government’ approach
Decentralise decision-making functions to local entities
Upgrade skills of staff to enable them to multi-task
Match qualifications with jobs
Reduce corruption
Codify best practices
Provide safety net to facilitate smooth transition
Widen tax base but lower taxes
5. Transparent and market-friendly affirmative action
Shift focus towards relative poverty
Phase out approaches that contributes to rent-seeking and patronage
Narrow regional differences
Encourage reward on basis of performance
6. Building knowledge base and infrastructure
Foster R&D links between higher learning institutions and private sector
Open access to funding to competition among researchers

14
7. Enhancing sources of growth
Identify and foster niche industries
Capture greater share of a distributional hub as intra-regional trade expands
Foster indigenous technologies
Capture greater share of niche tourism markets
Move into alternative energy generation as well as energy saving products and services
Promote corridor-based development
8. Ensuring sustainability of growth
Preserve natural resources
Develop comprehensive energy policy
Use pricing and regulatory polices to manage non-renewable resources
15
5. POSSIBLE ALTERNATIVES SCENARIOS FOR GROWTH AND EMPLOYMENT BY 2025
Four Possible Growth and Employment Scenarios to 2025
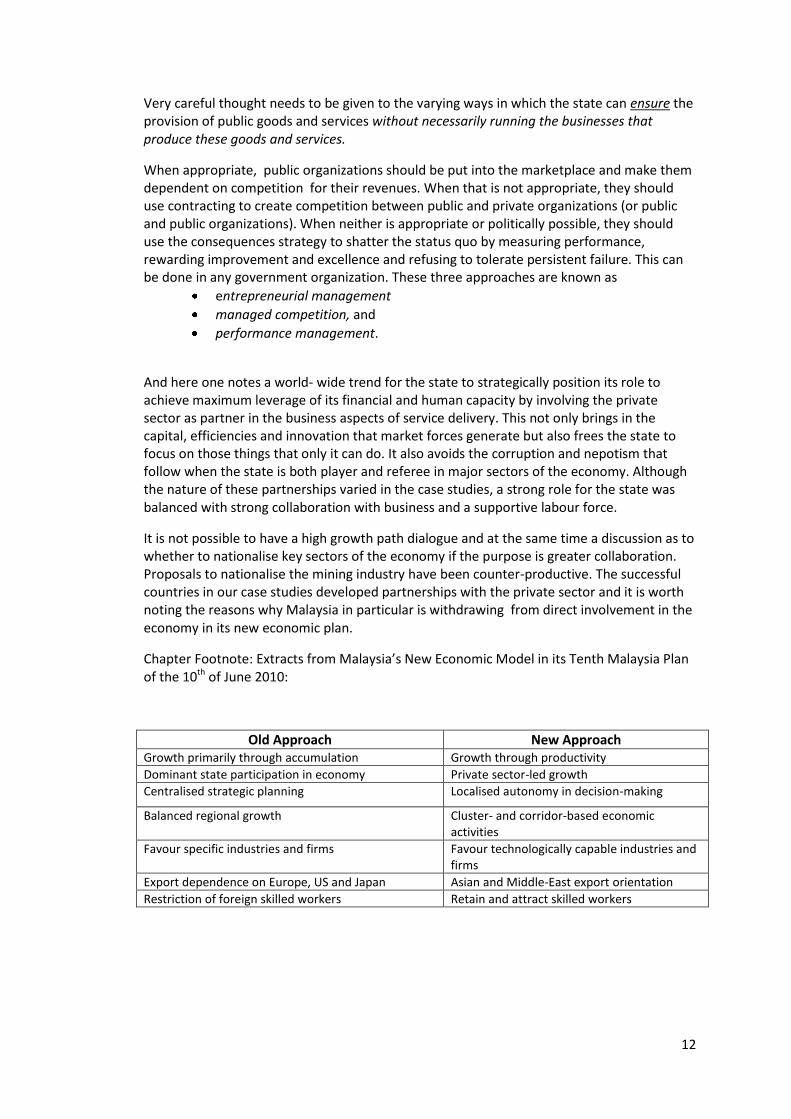
Various broad scenarios have been developed in order to highlight the importance of the roles of Business, Labour and Government in charting a course to an inclusive job rich future towards 2025 and the key policy choices that need to be made by all three social partners in that journey. They are to be used as a tool in taking the inclusive job rich growth debate from talking to acting and from finger-pointing to co-responsibility between Government, Business and Labour. The following four scenarios of South Africa’s possible jobs, growth and inclusivity path to 2025:
In Scenario 4: Stalled at the Starting Gate, a low GDP growth rate is accompanied by an exclusive and job-poor growth path where benefits are still concentrated in the hands of too few. Poverty, unemployment and income inequality is exceptionally high. Such societies are inherently unstable and often fall prey to civil war and conflict. South Africa was a Scenario 4 country in the late 1980’s. Business and Labour are usually co-opted into political factions. In Scenario 3: The Slow Lane, a low GDP growth rate follows from global isolation and a state-run economy seeks to create full employment. Growth is inclusive and job rich but services are poor and entrepreneurship is stifled in all but the black market. Income inequality is low, but poverty exists as an overall condition. At the ending of the Soviet era many East European countries were in that position in the late 1980’s. Both Business and Labour are suppressed by heavy handed government. In both scenarios 3 and 4 corruption, patronage and nepotism will persist. In Scenario 2: The Fast Lane, a high GDP growth rate is accompanied by an exclusive and job poor growth path where benefits are concentrated in the hands of a small group. Such
16
societies often fall prey to high levels of crime due to high levels of income inequality and large sectors of unemployment and poverty. South Africa is a Scenario 2 country at the moment as are many Latin American countries that have a segregated past. In the classical models of economic transition Scenario 2 is seen as a transition step to Scenario 1, but extreme inequalities require major affirmative measures as demonstrated in Malaysia and Brazil over the past decade. Business and Labour have a hostile relationship as each seeks to maximise benefits and Government has a weak or compromised role in the economy. Here, too, corruption and nepotism will continue. In Scenario 1: Team South Africa, a high GDP growth rate is accompanied by inclusive and job rich growth. As labour force participation is high there is a major and growing consumer market which fuels production in a virtuous circle. An open economy attracts foreign direct investment and capital and pushes up competitiveness in the local economy. Government takes a leading role in the economy but creates a role for the private sector in its business mandates through fair and transparent processes. Labour ensures that its members secure decent work and supports productivity programmes that ensure a competitive economy. Income inequality and poverty is limited. The Scenarios were generated by:
Reviewing the other such studies as detailed in the Research Foundation Report and input from the Policy Forum
Developing narratives of how hypothetical businesses might chart their course to 2025 with a special emphasis on issues of growth and employment.
Identifying common threads in the narratives.
Articulating the four scenarios with an emphasis on the issue of synergy and dissonance between the three social partners (Government, Business and Labour).
Reviewing the priorities that emerged.
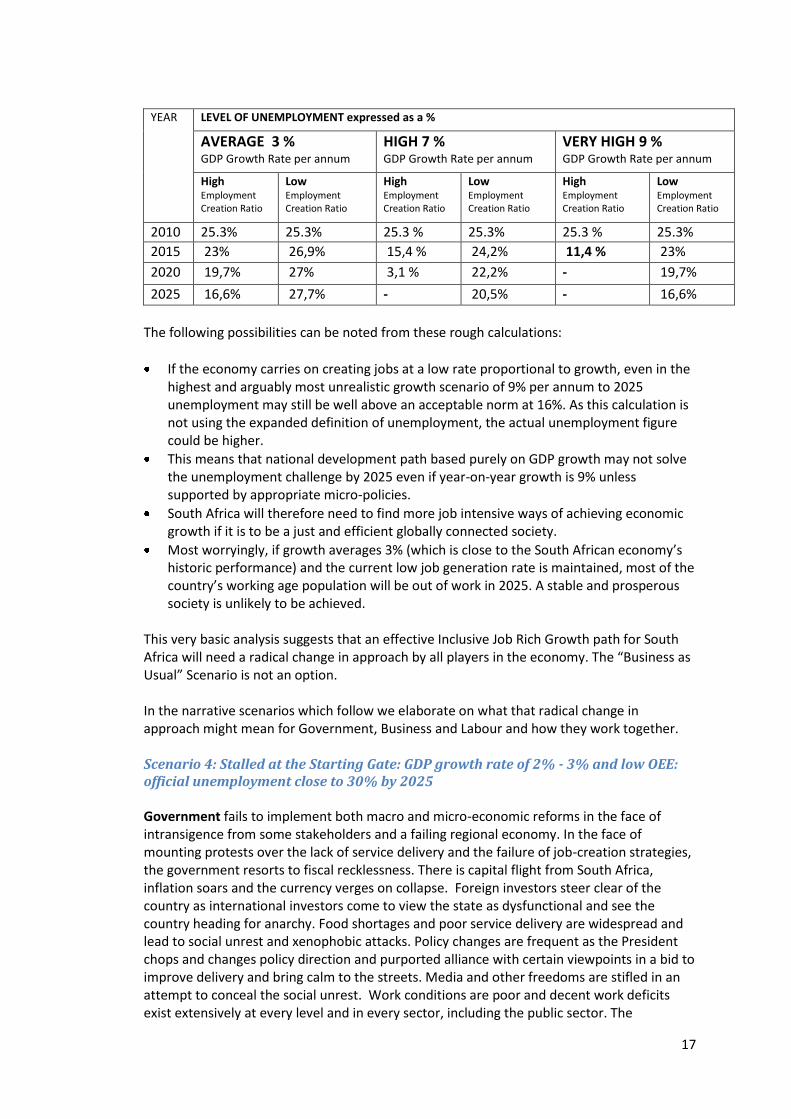
The numerical scenarios are based upon very simple projections in order to calibrate the challenge of growth and employment leading towards 2030. They were developed to illustrate the need for realism and further research in the face of a challenge that cannot be underestimated. The following methodology was used:
Demographic projections to 2025 for labour force growth were used as a platform.
High and Low estimates for the overall Output Elasticity of Employment (OEE) were calculated. The OEE is the percentage change of output (GDP) divided by the percentage change of employment as an input.
South Africa’s historical performance was used to calculate the low OEE and Malaysia’s to calculate a high OEE for scenario generation purposes. The following picture emerged:
17
YEAR
LEVEL OF UNEMPLOYMENT expressed as a %
AVERAGE 3 %
GDP Growth Rate per annum
HIGH 7 %
GDP Growth Rate per annum
VERY HIGH 9 % GDP Growth Rate per annum
High Employment Creation Ratio
Low Employment Creation Ratio
High Employment Creation Ratio
Low Employment Creation Ratio
High Employment Creation Ratio
Low Employment Creation Ratio
2010 25.3% 25.3% 25.3 % 25.3% 25.3 % 25.3%
2015 23% 26,9% 15,4 % 24,2% 11,4 % 23%
2020 19,7% 27% 3,1 % 22,2% - 19,7%
2025 16,6% 27,7% - 20,5% - 16,6%
The following possibilities can be noted from these rough calculations:
If the economy carries on creating jobs at a low rate proportional to growth, even in the highest and arguably most unrealistic growth scenario of 9% per annum to 2025 unemployment may still be well above an acceptable norm at 16%. As this calculation is not using the expanded definition of unemployment, the actual unemployment figure could be higher.
This means that national development path based purely on GDP growth may not solve the unemployment challenge by 2025 even if year-on-year growth is 9% unless supported by appropriate micro-policies.
South Africa will therefore need to find more job intensive ways of achieving economic growth if it is to be a just and efficient globally connected society.
Most worryingly, if growth averages 3% (which is close to the South African economy’s historic performance) and the current low job generation rate is maintained, most of the country’s working age population will be out of work in 2025. A stable and prosperous society is unlikely to be achieved.
This very basic analysis suggests that an effective Inclusive Job Rich Growth path for South Africa will need a radical change in approach by all players in the economy. The “Business as Usual” Scenario is not an option. In the narrative scenarios which follow we elaborate on what that radical change in approach might mean for Government, Business and Labour and how they work together. Scenario 4: Stalled at the Starting Gate: GDP growth rate of 2% - 3% and low OEE: official unemployment close to 30% by 2025 Government fails to implement both macro and micro-economic reforms in the face of intransigence from some stakeholders and a failing regional economy. In the face of mounting protests over the lack of service delivery and the failure of job-creation strategies, the government resorts to fiscal recklessness. There is capital flight from South Africa, inflation soars and the currency verges on collapse. Foreign investors steer clear of the country as international investors come to view the state as dysfunctional and see the country heading for anarchy. Food shortages and poor service delivery are widespread and lead to social unrest and xenophobic attacks. Policy changes are frequent as the President chops and changes policy direction and purported alliance with certain viewpoints in a bid to improve delivery and bring calm to the streets. Media and other freedoms are stifled in an attempt to conceal the social unrest. Work conditions are poor and decent work deficits exist extensively at every level and in every sector, including the public sector. The
18
government becomes overly sensitive to labour criticism and increasingly distrustful of business. Social dialogue breaks down. National and local elections are gerry meandered and government descends into factional schisms. Business is in survival mode. It speaks the right words to soothe the government but is insular and inward looking. Representative organisations form committees and partially attend stakeholder engagement forums but at heart engagement is weak and remains unfocussed with an attitude of ‘we have done this before and it got us nowhere so why bother? Within the business community, each company adopts a fortress mentality and looks to protect its own with an ‘us vs. them’ attitude. Yet given where we are, even under a weak growth scenario, boardrooms will continue to transform for demographic reasons alone. Due to the ongoing strife with labour, business adopts a capital intensive approach and continues to import expensive machinery that reduces its reliance on labour while exporting raw materials without beneficiation. Retrenchment at every downturn in the economy remains the order of the day as well as a lack of commitment to transformation or upgrading the weak skills of employees. Business despairs at the quality of school leavers and university graduates and instead attempts to outbid competitors in the race to capture skills in a dwindling pool of expertise as those who can, emigrate. Labour becomes increasingly disenchanted with the status quo and continues to push for higher wages and benefits and in an increasingly jobless society, and seeks to protect those that are employed. The unemployed form part of the discourse but with growing inflexibility over working conditions, business continues to avoid wage increases as well as increasing employee numbers. This vicious circle leads labour to distrust business on all levels and makes consensus politics impossible. Labour becomes increasing inflexible and challenges government policy decisions. This stance leads to a lack of trust with social partners, particularly business. Labour resorts to angry rhetoric and strikes turn violent. Government cracks down on labour leadership to maintain civic control. Scenario 3: The Slow Lane: GDP growth rate of 2% - 3% and high OEE: official unemployment at 15% -20% by 2025 Government largely gives up on its policy of growth leading to employment and instead moves towards creating a welfare state. Taxes rise and expenditure on social grants utilise a huge proportion of the national budget. The concept of public-private partnerships falls by the wayside and government relies on massive Public Works Programmes and bloated state employment to keep unemployment in check. Delivery in relation to business is poor. Larger numbers of the unemployed give up looking for jobs and rely on the state to meet their needs. A culture of lethargy and desperation becomes firmly entrenched in the country. Education and skills development are weak with little investment by the State. Social dialogue begins to unravel, with business being disenchanted and the partners become increasingly disengaged. . Business becomes disengaged and despondent. It continues to endorse government policies but looks offshore for future opportunities and growth. Government policies are implemented but without enthusiasm. Companies resort to a laager mentality and become divided on how to respond to the fiscal, growth and labour crisis. Short-term and knee-jerk reactions become the order of the day. Business, provides the minimum required labour standards because it has to. It is reactive and attempts to buy favours from government and to take advantage of large infrastructure contracts for its own enrichment. Social dialogue is treated with suspicion and a necessary evil.
19
Labour continues to be confrontational with both government and business as distrust overwhelms all dialogue and policy debates. Government seeks to appease labour by co-opting senior leaders into key positions in government. Attempts at social dialogue and social pacts are brushed aside in the rush to gain positions of influence. Strikes become less violent and prolonged. A labour aristocracy develops.
Scenario 2: The Fast Lane: GDP growth rate of 7 – 9% and low OEE: unemployment still at 15-20% by 2025 Government adopts a policy of growth at all costs in a desperate bid to tackle unemployment which continues to defy the pundits. Government policies of ill considered privatisation and selling land and mineral rights to foreign interests begin to bear some fruit as GDP hovers between of 7 – 9%. In a worst case scenario new strategies are implemented with a desperate air about them leading to hollow structures within and outside government. Skills levels remain generally low and education continues to be the bugbear of government as only the privileged have access to good private education. Politics dominates technocratic delivery and services fall by the wayside. Policy incoherence sets in. A significantly unequal, two-tier labour system is perpetuated where a narrow band of South African workers enjoy high benefits whilst millions of workers survive on the low income of those employed at low wages and with poor work conditions. There are outbreaks of social unrest on lack of service delivery, cost of food and basic products and xenophobic attacks occur. Workers from neighbouring countries are willing to work on very low wages outside the official system. Corruption remains rife and the government resorts to asset stripping to fund the fiscus. Lip-service is paid to social dialogue, and the state is trapped in talk shops, with little delivery.
Business is open to any new opportunities. In the face of reducing opportunities, business resorts to mergers, acquisitions and monopolistic behaviour to achieve growth and market share. This leads to a concentration of market share and anti-competitive strategies. Companies continue to invest in capital-intensive technology. Business joins organised business associations in order to make sure that they have access to information but are also locked into talk shops. Labour adopts a defensive stance and continues to fight for the rights of the employed over strategies to bring more workers into employment. Workers are unproductive and strikes are unprocedural as workers become increasingly disenchanted. It is covertly co-opted into the government’s collective agenda. Labour’s policies for employment growth are based on state intervention and enriching those employed Scenario 1: Team South Africa: GDP growth rate of 7- 9% and high OEE: unemployment gets to moderately acceptable levels (12%) in 5 – 6 years time Government facilitates a competitive and enabling environment. Social dialogue and pacts are conducted in an atmosphere of win-win. Engaging and successful partnerships lead to the creation of a delivery state. Education and skills development is world class, occupationally relevant and accessible to all. The government seeks to create a professional public service. It also moves from attempting to be the creator of jobs to rather providing a regulatory environment that is conducive to job creation. Decent work prevails and racial and income inequality declines, leading to large scale inclusion and poverty reduction. Financial stability and investment friendly policies are coupled with the right balance between savings and investment. Inflation stabilises and the rand assumes a competitive
20
position among world currencies. Immigration policies are simplified and skilled immigrants are fast tracked. Infrastructure and social conditions in the region improves, driven largely by South Africa. This creates a virtuous circle of trust and mutual respect, with collaborative partnerships recognising each social partner’s contribution. Social dialogue is embraced. Social partners take accountability for their contribution and role. Goals are mutually agreed and implemented with enthusiasm and integrity. Business engages with government and labour in an organised, honest and unapologetic manner. A coherent policy position based on long-term growth is formulated with business and business fully recognises the role of government and labour in reaching a common vision of sustainable development. Government and business enter into collaborative growth and delivery strategies and delivered through extensive PPPs. Companies are highly competitive. They take advantage of the window of opportunity to build capacity by investing and building their workforces with productive and decent work. Business puts its money where its mouth is and becomes globally competitive. Skills development and education become priority areas of focus. South Africa’s problems became ‘our problems’. Crime is radically reduced through this approach and education began to bear the fruits of the co-operative environment.
Labour sees business as an enabler and creator of jobs and exhortes members to take advantage of the skills upgrading on offer. Negotiations take place in a constructive atmosphere of real compromise. Flexibility is enabled provided decent work prevails. Wage setting recognises skills and performance. Wages are set at a level that promotes access to employment, productivity and career progress. The unemployed are put firmly on the agenda and broader issues of the country take precedence over labour self interest. Labour buys into delivery as the defining goal of the time and is both trusting of government and business and trustworthy itself.
Delivering the Team South Africa Scenario: Priority Directions for 2025 In order to lay a solid foundation for the inclusive job-rich growth scenario, the Policy Forum identified the following top priorities if South Africa is to achieve an inclusive and job rich growth path to 2025:
1. ‘Back to basics’ in education – world class and placement orientated and accessible to all
2. Skills development – accessible, relevant and widespread. 3. A Delivery State – policy and institutions aligned and monitored to deliver. 4. Regional Infrastructure – common economic union with economic and social
infrastructure 5. Inclusive wage setting – wages reflecting skills and productivity, with entry
wages facilitating access to employment
Other important issues identified included a possible social pact / social dialogue, SMME support and access to capital, growing the informal sector, opening up SADC markets (free trade, common customs union), more competitive business environment – reduce red tape, reduce crime and costs of doing business, minerals beneficiation. It was recognised that all these activities need to happen in tandem taking into account the capacity of the state. This demands that Government and social partners work together and that initiatives are planned and delivered with high trust and mutual respect and accountability for respective roles and contributions.
21
This will require that the following eleven tough choices be made which are explained in more detail in Chapter 5 below: Tough Choice # 1: Stick to a disciplined macroeconomic approach instead of giving in to inflationary and temporary employment boosting. Tough Choice # 2: Focus effort on actions rather than talk shops in promoting an inclusive job rich growth path for South Africa. Tough Choice # 3: Prioritise getting the Delivery State in place before embarking too far on the Developmental State. Tough Choice # 4: Put more skills and more support rather than more money into the education system. Tough Choice # 5: Get business deeply engaged in skills development rather than leaving it to the SETAs and the education system. Tough Choice # 6: Use a targeted approach to skills development and job creation for the unemployed rather than broad-based programmes. Touch Choice#7: Use an incentivised approach to poverty reduction measures rather than unconditional grants. Tough Choice # 8: Use a targeted value-add approach to job rich industrial development rather than sector wish lists. Tough Choice # 9: Boldly re-engineer State Owned Enterprises with new partnerships to build up regional infrastructure rather than tinkering with them and/or opening them up to more competition.
Tough Choice # 10: Introduce strategic wage setting rather than sticking rigidly to the current labour relations wage setting regime. Tough Choice # 11: Take risk and invest in the SMME and informal sectors rather than waiting for them to knock at the door.
22
6. EXPLORING THE TOUGH CHOICES FOR AN INCLUSIVE JOB RICH GROWTH SCENARIO As the “Business as Usual” scenario is not an option and will potentially generate the risks identified by Scenarios 4, 3 and 2, tough choices need to be made soon. BUSA puts forward the following tough choices as a basis for initial discussion so the growth path debate can start to focus on actions and specifics.
Tough Choice # 1: Stick to a disciplined macroeconomic approach instead of giving in to inflationary employment boosting
Our international research confirms that a basic requirement of a sustainable job rich growth path is a stable macroeconomic policy framework that is supportive of long-term stability. This is essential to promote investor confidence, savings and a stable currency. An overvalued rand in particular is not helpful for growth and employment. Shortfalls in domestic savings need to be made up for by the country integrating more to the global economy, by exporting more and by attracting increased FDI. The need for certainty and predictability needs to be emphasised in order to create a favourable overall investment climate and promote higher levels of investment. This has the following implications:
South Africa’s current approach to macroeconomic stability needs to be broadly maintained including flexible inflation targeting
National Treasury is requested to expedite the research paper on fiscal guidelines referred to by the Minister of Finance in the MTBPS of 2010.
When socio economic programmes are proposed which raise the level of public spending it is essential that:
o There is clarity as to how the required revenue will be raised and its implications for the taxable capacity of the economy
o The cost impact on the productive sectors of the economy is assessed o Major projects be phased according to priorities and affordability
Given the current and foreseeable volatility in the global financial outlook the challenge is how to benefit from capital inflows whilst minimising the costs of an overvalued rand. Although South Africa, as a small open economy with low domestic savings and relatively high financing needs, cannot fully offset the impact of large foreign capital inflows, we support the steps to promote a more stable and competitive rand outlined in the Medium Term Budget Policy Statement of 2010. South Africa needs to take steps to “lean against the wind” and it may be appropriate to investigate the long term desirability and feasibility of a Sovereign Wealth Fund, such as exists in the case of Chile and Norway.
Job creation should primarily take place through the private sector or should lead directly to employability in the private sector.
Improvements to labour productivity need to be sought in view of its contribution to Total Factor Productivity to retain and attract both FDI and local investment in globally competitive job creating industries.
23
Tough Choice # 2: Focus effort on actions rather than talk shops in promoting an inclusive job rich growth path. There is a strong feeling in the business community that too many previous commitments to well intentioned policies and programmes such as the RDP, GEAR, GDS and ASGISA and JIPSA have led to much talk and little action. Whilst the need for a well designed long-term growth part is not disputed, there is a need for concrete action by highly capable teams involving government, business and labour to design programmes and projects that make an immediate impact. This has the following implications:
Government’s proposal to engage the social partners on growth path for South Africa is warmly welcomed. This should be supported with:
o Clarity on how macro policy might have changed based upon candid assessment of past performance
o Coherent links to other economic policy and strategy initiatives o A clear framework and institutional responsibilities for implementation
within Government
Build broad understanding of the short-term sacrifices that need to be made should there be agreement on a social pact for long-term growth and employment in ways that can have meaningful buy- in from all South Africans and key stakeholders.
Where partnerships can support in delivery, form joint task teams that are well mandated and have clear time frames for performance in order to deal with key job rich growth issues .
Clear accountability.
Strong monitoring and evaluation.
Tough Choice # 3: Prioritise getting the Delivery State in place before embarking too far on the Developmental State. The business community is concerned that the state is already lacking the capacity to deal with its basic responsibilities or to implement many of its policy commitments. Major service delivery backlogs at local government level combined with inefficient and costly state-owned enterprises are significant growth constraints that impact on job creation. If the Developmental State is to entail more involvement in the economy without a major increase in capacity and skills (which are largely located in the private sector), the concern is that basic service delivery will suffer further and that the goals of the developmental state will remain at the level of lip service. Unless the issue of state capacity is frankly addressed, it will be impossible to get good scenarios. This has the following implications:
Boost the capacity of all three spheres of government — especially local government — to effectively plan and implement service delivery improvements.
Government needs to engage more actively with Organised Business on all levels starting, respectfully, with the office of Minister Chabane
Build a Professional Civil Service in order to attract and retain the best possible skills and experience
24
Identify where the government’s role is critical due to market failure, and excel in the few things that matter most.
Urgently establish in priority areas where government is not the only or best entity to deliver services.
Identify where government needs assistance to improve delivery especially at local government level.
Promote a corruption-free environment
Tough Choice # 4: Put more skills and more support into the education system rather than more money
Much has been done to revamp and refocus the education system and it is accepted that this is a lengthy and complex process. There is however much scope to do more and to engage more broadly in achieving better education results. The relevant trade unions in the education sector need to align their approach and behaviour in the interest of national goals.
We have the following imperatives:
Focus and incentivise schools on placement rates into jobs, FET’s or tertiary education.
Focus on the “Three R’s”: learners who can write, read and count can further their studies independently: those who cannot are highly disadvantaged.
Strengthen vocational learning options in line with industry needs.
Supplement teaching skills and capacity in poorly performing schools generally and in regard to maths and science specifically.
Develop the ethics and professional values of the teachers in the context of placing much higher value on the teaching profession
Import teaching skills from other countries if local capacity cannot be sourced.
Introduce effective performance management and incentives for schools and teachers.
Generally bringing the 2.8m in the 18-28 year old category, who are out of work and education into the mainstream of the economy.
Tough Choice # 5: Get business to be deeply engaged in skills development rather than leaving it to the SETAs and the education system.
Business has a key role to play in skills development but often finds itself hamstrung in doing so where SETAs do not function well. There is evidence that the SETA framework is gradually improving but progress is far too slow given South Africa’s profound skills crisis. However since small businesses have very little contact with SETAs and are very important to job creation, alternative measures are needed. Larger firms also have difficulties in securing tangible benefits from SETAs. This has the following implications:

25
Effectively align and re-align all public and private skills development resources through the new Human Resources Development Council
Understand that important challenges are to access the SETA funds.
Consider providing tax incentives for skills development by SMMEs and for businesses in industries where SETAs are ineffective or underperforming.
Develop a national register of unemployed graduates and a PPP placement agency that markets their skills to industry. Incentivise it based on successful placements.
Re-introduce the apprentice route to attract a new cadre of artisans.
Revamp and re-align the SETAs and the FETs to add direct benefit to both immediate needs in industry value chains and long-term skills development priorities.
Seek creative ways to deploy the billions of rands of unspent funds in the National Skills Development Fund into high priority needs e.g. capital investment in FETs
Attract high skilled immigration and retain high skilled South Africans: o Embrace the fact that most highly skilled immigrants will come from African
and Asian countries o Reduce red-tape and streamline immigration procedures as a priority o Tackle crime o Reduce small business start-up costs
Tough Choice # 6: Use a targeted approach to skills development and job creation for the unemployed rather than broad-based programmes.
The Expanded Public Works Programme (EPWP) has achieved a great deal and will soon be up scaled. The goal of EPWP phase 2 is to create 2 million full-time equivalent (FTE) jobs for poor and unemployed people in South Africa through the delivery of public and community services. This is expected to translate into 4.5 million work opportunities. However, the average duration of employments is only about 100 days and it is questionable whether meaningful skills development or effective job placement occurs at scale. An approach which targets specific unemployed people and provides more scope for business involvement is suggested. A broader basket of measures is also suggested.
This has the following implications:
To accept that a growing productive base is needed if broadening public works and social welfare are to be sustainable.
Register and target the structurally unemployed with marketing and motivational programmes.
Apply EPWP to developing community services.
Reintroduce national service (military and non-military) with a skills training component for school leavers up to the age of 23.
Expand the Expanded Public Works Programme to support semi-permanent jobs in businesses (in addition to government and the NGO sector).
Treat the youth unemployed as a resource and prioritise their access to employment and skills creation programmes.
Develop baskets of local skills development, job placement and temporary work opportunities in all municipalities.
26
Tough Choice # 7: Use an incentivised approach to poverty reduction measures rather than unconditional grants
The current system of social grants is promoting a culture of dependency and despondency. It is also unaffordable and unsustainable with taxpayers being outnumbered almost three to one by grant beneficiaries. Most importantly the huge population dependent on grants represent an unutilised productive asset which could place South Africa on a high growth path. The lessons of incentivised poverty reduction from Brazil, Chile and Malaysia’s New Growth Plan deserve special attention. South Africa’s grant-based poverty reduction strategies are promoting short term and long-term dependence and low productivity and are placing major demands on a relatively small taxpaying population. South Africa cannot afford to deepen the dependence of the majority of its population on grants that do not seek to change behaviour and bring the vast army of the unemployed into the economy. Creative, well managed, household-specific programmes need to be designed that reduce both poverty and dependence in the long term, together with a radically revamped education system that provides a meaningful path of entry into an ever more sophisticated economy. Reversing the current situation will therefore urgently require bold measures and a complete overhaul of the welfare system including comprehensive household specific databases, monitoring by social workers and other public agencies and decentralisation to local level. The case studies of Chile and Malaysia are both of interest but of particular note is Brazil’s Bolsa Familia. Poverty has decreased in Brazil by 81 percent from 1990 to 2008 including a 58 percent child labour reduction and 96 percent of children enrolled in schools. More than 12 million families are on the programme. Help is conditional on children staying in schools, vaccinations being kept up to date, women in the family following prenatal care, and no child labour. All these conditions protect families. Today there is $7.6 billion invested in the Bolsa Familia, and these are resources reach families directly in their own municipalities and we have been very successful in assisting the disabled and old people living in poverty.
This has the following implications:
Register and target the poor with local support and assistance services
Develop conditionality to an expanded grant system that incentivises: o Keeping children in School o Attending skills development programmes o Making use of preventative health services o Job seeking
27
Tough Choice # 8: Use a targeted value-add approach to industrial development and other more job rich sectors rather than generating wish lists.
Many businesses are unaware of the considerable efforts being undertaken by the DTI and provincial and local government to support industrial development. Many Customised Sector Plans (CSPs) have been drawn up in consultation with industry. However as is the case with IPAP 2, these initiatives tend to involve a wish list of sectors and industries, without the capacity or the resources to make a meaningful impact. We are also concerned that world-wide most new jobs are being created in services and a broad perspective is needed. There is mixed success in the global experience of government’s capacity to “pick winners” and champion them in an effective and justifiable way. The question is not that of reducing government incentives and supportive regulatory measures (indeed they need to be sensibly increased) but of focussing and leveraging innovation, value add and export opportunities in particular. Lastly it must be remembered that manufacturing is on the whole becoming more capital intensive and may not generate hundreds of thousands of direct jobs as many would hope. The benefit rather lies in downstream/upstream impacts of employment creation in specific areas and especially in light and medium manufacturing. This has the following implications:
Support the identification and development of viable job-rich industries and opportunities across all sectors in partnership with business.
Introduce structures and regular processes to unblock barriers to competitiveness for targeted value adding job rich industries
Introduce more competition into the so-called ‘network’ industries —energy, transport and telecommunication.
Push for greater integration of the SADC economy as soon as possible.
Develop export markets for tradeables and services in African countries.
Where appropriate increase innovation funding and alignment with high growth / job-rich sectors - a good example being the Green Economy and Green Jobs.
Increase government R&D funding to match those of competing emerging economy countries i.e. Chile and Brazil.
Work hands-on within industry value chains that have been identified as having employment creation potential in order to:
Ensure alignment with labour and business;
Deliver meaningful support and incentives;
Bring on board innovation and research;
Link with export programmes;
Bring on board new SMME’s and cooperatives
Align and support skills development ; and
Make venture capital available.
Critically assess the impact of ‘greeness’ on jobs and ensure that regulations to promote ‘greeness’ and the managing of climate change commitments take account of economic

28
realities in SA. Business will need to engage constructively on the recent Green Paper on SA’s national climate change response.
Tough Choice # 9: Boldly re-engineer State-Owned Enterprises with new partnerships to build up regional infrastructure rather than tinkering with them. South Africa’s transport, energy and telecommunications infrastructure represents a major cost factor and deterrent to job-creating investments and export competitiveness. After many years of tinkering measures, major problems remain with SoEs (Eskom, Transnet) and regulatory bodies (NERSA, ICASA). Others such as ACSA have performed relatively well. Urgent repositioning of underperforming SoE’s through PPP’s will therefore do much to boost job creation and investment. New business models are needed to mobilise market forces. The 3% of infrastructural spending set aside for PPPs needs to be increased closer to global norms. This also suggests that stronger lobbying and uptake from business is needed.
This has the following implications:
The establishment of the Presidential SoE review initiative is welcomed. This should be complemented with service-specific joint task teams supported by a well resourced PPP support institution to re-engineer the business models of underperforming SoEs and craft PPP solutions accordingly.
Senior appointments to SOEs need to be depoliticised to attract and retain skills.
Adopt a stronger and longer term framework for sustainable energy providers. National Treasury’s inclusion of a stronger role of Independent Power Producers in the new growth path as indicated in the latest MTBPS is strongly welcomed.
Revamp or privatise Transnet to secure a rail transport and logistics system that is efficient and effective.
We need to urgently examine why PPPs are not more extensively used and what are the barriers to the uptake.
Open up the telecommunications, energy and transport markets to serious competition.
The nationalisation debate is potentially taking South Africa in the opposite direction to that which it should be going in, and clear signals are needed to avoid destabilising the local and foreign investment climate if we aspire to a much higher a growth path.
Tough Choice # 10: Introduce strategic wage setting rather than sticking rigidly to the current labour relations regime.
The most important issue facing the SA economy today is improving conditions to make greater labour absorption possible. To achieve its stated objective of reducing unemployment and stimulating growth, government has to urgently address labour market policies and laws that exacerbate unemployment. We cannot focus on just the good intentions behind these policies. We must, perhaps even more importantly, rigorously investigate any unintended consequences.

29
It is also problematic in that indirect social costs are built into the cost of employment. For example, the cost of transport and housing is very high for employees due to the Apartheid legacy and this is built into wage costs. Minimum wages are insufficiently adjustable to different sectors, sizes of businesses and locations which results in wages creating barriers to employment in certain industries and locations (e.g. the recent Newcastle experience where unionised workers supported below-minimum wages in order not to lose their jobs). If Government and Labour are serious about job-rich growth they will support far greater “strategic flexibility” in regard to wage setting of specific worker types (e.g. the youth and the structurally unemployed), lagging regions and threatened industries, including small businesses. Targeted labour subsidies and incentives should also be introduced where this would be in the interests of job-rich growth.
Government’s plan to introduce youth-targeted wage subsidies is strongly supported and other incentives for business to train and employ young people should be considered. A policy framework from National Treasury is urgently needed.
In sensitive regions and industries, a sunset clause to protect existing minimum wages could be introduced, allowing new entrants to willingly accept lower (but not exploitative) wages.
Special measures should be introduced to facilitate part benefits or collective schemes for part-time and atypical employment.
Given the major role that labour brokers have played in enabling atypical employment (the major source of jobs post 1994) this industry should be regulated rather than phased out.
Government needs to assume a strong role to reduce the indirect costs of employment (transport, housing and benefits).
Tough Choice # 11: Take risk and invest in the SMME and Informal Sectors rather than waiting for them to knock at the door.
In the EU, SMMEs of under 250 people make up more than 90% of companies, and employ 65 million people. In many sectors, SMMEs are also responsible for driving innovation and competition. In India, Micro and Small Enterprises are estimated that, in terms of value, the sector accounts for about 39% of the manufacturing output and around 33% of the total exports of the country. South Africa needs to boost informal, small and medium businesses as probably as much as 80% of the jobs needed to reduce unemployment will come from these sectors. It is therefore clear that SMME development and entrepreneurship are crucial areas in improving economic development and implementing government pro-poor policies successfully, as well as achieving the UN Millennium Development Goals. This has at least the following implications:
Pool and align all SMME support in accessible and customer friendly one stop shops nationwide
Unblock SMME barriers and constraints and undertake impact studies on SMMEs in Regulatory Impact Assessments of all new laws and legislation
Support the activities of the Competition Commission in stemming collusive and anti-competitive behaviour
30
The Black Economic Empowerment Advisory Council needs to champion the benefits to SMMEs and big companies themselves of BEE Scorecard points in regard to Skills Development, Preferential Procurement, Enterprise Development and Socio Economic Development
Seek to expand the value chain of public and private services by maximising procurement links with SMMEs through sub contracting out sourcing and joint ventures where possible
Stimulate a culture of entrepreneurship.
Roll out well managed and commercially positioned trading markets countrywide in high footfall locations.
Make it much easier for SMMEs to start and do business.
Remove as much red tape as possible for enterprises employing 10-15 workers.
Make venture capital easily available for solid business plans and provide support at all levels to enable business plan development.
Large corporations increase their support for small business through appropriate procurement, outsourcing and sub-contracting policies.
7. Conclusion
South Africa has come a long way since the country emerged from isolation in 1994. But we face a set
of tough choices that have to be made if the country is to achieve the kind of economic growth rates
that can meaningfully expand the economy and reduce unemployment and poverty. To achieve higher
growth rates means improving the country’s competitiveness. No stakeholder can do this by
themselves. It has to be based on a collaborative effort to solve problems and grow the economy. It is
hoped that this discussion document will make a positive contribution to the debate and decision-
making that lies ahead.
31
INCLUSIVE HIGH JOB RICH GROWTH
ANNEXURE A TO DISCUSSION DOCUMENT : RESEARCH FOUNDATION REPORT
NOVEMBER 2010

32
Contents
EXECUTIVE SUMMARY...........................................................................................................................34
CHAPTER 1: INTRODUCTION AND OVERVIEW.......................................................................................35
CHAPTER 2: THE GLOBAL DRIVING FORCES SHAPING THE FUTURE OF GROWTH AND EMPLOYMENT.....37
CHAPTER 3: COMPARING SOUTH AFRICA WITH FIVE COUNTRIES.........................................................43
CHAPTER 4: SOCIAL DIALOGUE DYNAMICS..........................................................................................68
CONCLUSION........................................................................................................................................70
REFERENCES........................................................................................................................................70

33
EXECUTIVE SUMMARY
This Research Foundation Report is a literature review and a synopsis of key issues on the concept of Inclusive Job Rich Growth for South Africa going forward to 2025. It has been prepared in order to assist BUSA members in preparing for a Policy Forum meeting on the 20th of October 2010. The Policy Forum outcomes, Research Foundation Report and interview feedback will be used as input to a Discussion Document which sets out various scenarios, the desired employment and growth targets for South Africa, and the tough choices that will need to be made to achieve a new growth path. The Discussion Document will form the core of the business approach to Inclusive Job Rich Growth.
The report is outlined as follows:
In Chapter 1 the project process and the concept of “Inclusive Job Rich Growth” is explained In Chapter 2 we examine The Global Driving Forces Shaping the Future of Growth and Employment including Global Restructuring, rapid growth in Sub Saharan Africa and the effects of services, value chain management, biotechnology, green technology, community services and the grey economy on the nature and quantity of jobs. In Chapter 3 we compare South Africa’s economic and job creation performance with Chile, Brazil, Malaysia, Poland and Ghana, countries that have been selected on the basis that they are all developing economies that have experienced economic upheaval, despite which they have still managed to achieve growth and higher levels of employment. In Chapter 4 we review the Social Dialogue dynamics between the Government, Labour and Organised Business in South Africa.
34
Introduction and Overview
The Purpose of this Document
This Research Foundation Report is a literature review and a synopsis of key issues on the concept of Inclusive Job Rich Growth for South Africa going forward to 2025. It has been prepared in order to assist BUSA members in preparing for a Policy Forum meeting on the 20th of October 2010.
The document is produced at a very early stage in the process in order to create a platform for a useful strategic conversation on the Inclusive Job Rich Growth concept within BUSA. It should be noted that this document was drafted prior to Government’s announcement in late October 2010 on a new growth path.
Impact of the crisis on employment
The impact of the global economic crisis on South Africa is well documented. The country entered its first recession since 1992, with significant impact on employment. Several social, fiscal and monetary policy interventions were implemented to support economic demand and employment. The impact of the crisis on employment with 900 000 job losses, mirrored global developments with the ILO reporting that over 6 million jobs were lost in manufacturing, 2.8 million in construction, and 2.3 million in wholesale and retail trade in the two years to the third quarter of 2009 among the 15 G20 countries with available data.
Globally, policymakers recognised the need to adopt policies that would support employment. , with communication from G20 Summits in Washington (November 2008), London (April 2009) and Pittsburgh (September 2009) outlining the understanding that ” …implementing recovery plans that support decent work, help preserve employment and prioritize job growth.”
The Purpose of this Project
There are two main objectives to this policy making process within BUSA:
To capacitate and facilitate a process whereby Organised Business, as a social partner, develops a policy position in regard to Inclusive Job Rich Growth that builds on the principles of the South African Framework Response to the Global Economic crisis.
To identify how Organised Business could develop and sustain the capacity to participate effectively in ongoing social dialogue on Inclusive Job Rich Growth.
Core Research Questions
The following research questions have been posed by BUSA to guide this project:
1. What is BUSA’s vision for South Africa’s economy in 2025?
35
2. What are the long-term global driving forces and structural economic constraints that South Africa needs to address over the next 15 years?
3. How have emerging countries of similar size and history to South Africa managed to address similar structural constraints in order to achieve multi–year growth of 7% of more whilst reducing poverty and unemployment?
4. What should be the role of business as a social partner in regard to the linked but separate issues of Inclusive Job Rich Growth and poverty reduction?
5. What are the key sector and sub-sector growth opportunities where South Africa could achieve significant employment growth? What are the key employment growth barriers that need to be addressed at an economy wide, sector and firm level in the short term and the longer term?
6. What are the key cost drivers for business (in order of priority and impact) over the short term (3-5 years) and the long term (10 -15 years)?
7. What are the key instruments that Government, Organised Business and Organised Labour have at their disposal to promote Inclusive Job Rich Growth?
8. How aligned and effective are the current Government and Organised Labour policy positions on growth and employment?
9. What are the key policy choices (Industrial Strategy, Fiscal and Trade Policy, HRD etc) and business environment improvements that Business would advise the social partners to make to achieve inclusive job rich growth over the next 3- 5 years? Over the next 10-15 years?
10. What research, institutional and internal dialogue capability would Business need in order to be able to develop, engage and communicate its position on Inclusive Job Rich Growth on an ongoing basis?
The Approach to the Project
BUSA recognises that high unemployment especially amongst the youth as one of the pressing challenges to South Africa’s economic performance. In this context our approach is to refer to Inclusive and High Job Rich Growth for the following reasons:
Inclusive Growth: High inequality levels in South Africa compared to similar economies which undermine long term stability and prosperity (see Chapter 3 of this document for our scenario insights for 2025).The prefix ‘inclusive’ reflects the need for partnerships to achieve transformative economic development in South Africa.
High Growth: High GDP growth is a prerequisite for addressing underlying socio-economic challenges including inequality. This requires competitive industries and a business friendly infrastructural, regulatory and cost environment.
Within this framework we would wish to emphasise the following:
A pragmatic approach to job creation: in our view job creation targets must be informed by the following factors:
In a rapidly restructuring global economy the nature of employment is changing as fast as technology and business models are evolving (see Chapter 2 of the Research Foundation)..
36
Business in integral to employment creation, as such discussion on employment must involve business. Lack of business involvement will mean that the conversation will remain abstract and unlikely to yield meaningful outcomes.
A long term scenario perspective: International evidence suggest that economic growth is a long term project. We therefore suggest an approach that uses scenarios to 2025 and use those scenarios to develop a long term vision for South Africa which can be supported by all social partners.
The Global Driving Forces Shaping the Future of Growth and Employment
The Dynamic Nature of Jobs
The nature, quantity and location of employment is in a state of constant adaptation. This places the concept of decent work (captured under four thematic areas by the ILO as rights at work, employment creation, social protection and social dialogue) in a potential state of tension with the flexibility required in an ever competitive and dynamic global economy.
It is therefore important to identify, within the South African context, those “Key Driving Forces” that will reshape the nature of the job market. Such process will enable the recognition of factors and trends within specific sectors required to maximise the employment outcomes. There is a need to balance, longer term strategies, with shorter term imperatives that address the current mass of unemployment in the approach to job-rich growth. .
We can provisionally suggest the following key driving forces are likely to be most critical in terms of generating both growth and jobs-rich growth in South Africa and the world:
Key Structural Driving Forces shaping growth and employment
The Restructuring Global Economy
Almost half of global growth is due to increased demand in developing countries. Strong import demand from developing countries will increasingly counteract the historical exposure to economic cycles in the industrialised north (World Bank, 2010). In the graph below, the contribution of high-income countries is reflected in relation to the contribution by developing countries.
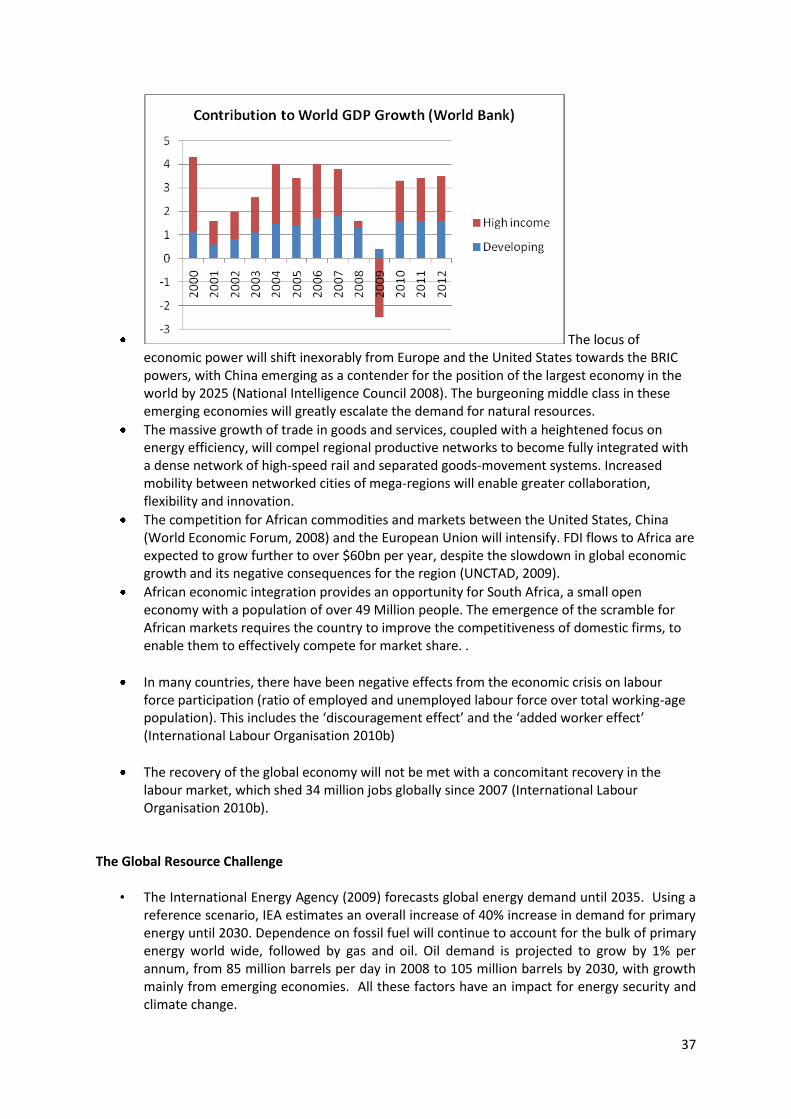
37
The locus of economic power will shift inexorably from Europe and the United States towards the BRIC powers, with China emerging as a contender for the position of the largest economy in the world by 2025 (National Intelligence Council 2008). The burgeoning middle class in these emerging economies will greatly escalate the demand for natural resources.
The massive growth of trade in goods and services, coupled with a heightened focus on energy efficiency, will compel regional productive networks to become fully integrated with a dense network of high-speed rail and separated goods-movement systems. Increased mobility between networked cities of mega-regions will enable greater collaboration, flexibility and innovation.
The competition for African commodities and markets between the United States, China (World Economic Forum, 2008) and the European Union will intensify. FDI flows to Africa are expected to grow further to over $60bn per year, despite the slowdown in global economic growth and its negative consequences for the region (UNCTAD, 2009).
African economic integration provides an opportunity for South Africa, a small open economy with a population of over 49 Million people. The emergence of the scramble for African markets requires the country to improve the competitiveness of domestic firms, to enable them to effectively compete for market share. .
In many countries, there have been negative effects from the economic crisis on labour force participation (ratio of employed and unemployed labour force over total working-age population). This includes the ‘discouragement effect’ and the ‘added worker effect’ (International Labour Organisation 2010b)
The recovery of the global economy will not be met with a concomitant recovery in the labour market, which shed 34 million jobs globally since 2007 (International Labour Organisation 2010b).
The Global Resource Challenge
• The International Energy Agency (2009) forecasts global energy demand until 2035. Using a reference scenario, IEA estimates an overall increase of 40% increase in demand for primary energy until 2030. Dependence on fossil fuel will continue to account for the bulk of primary energy world wide, followed by gas and oil. Oil demand is projected to grow by 1% per annum, from 85 million barrels per day in 2008 to 105 million barrels by 2030, with growth mainly from emerging economies. All these factors have an impact for energy security and climate change.
38
• Climate change, chronic mismanagement of fresh water resources and unprecedented levels of urbanization will together subject two thirds of the world population to water-shortage conditions by 2025, suggesting that desalinization will become one of the world’s fastest growing industries (Development, Concept and Doctrine Centre 2006).
• The binary crisis of rapidly rising energy costs and climate variability brought on by global warming may lead to episodic disruptions to the production, distribution and pricing of food (International Food Policy Research Institute 2007). The impact of higher food prices on poverty is a major concern as it risks undermining past progress in this area and places social cohesion at risk.
The Rapidly Growing Economy of Sub Saharan Africa
Rising international commodity prices will be bolstered by global economic recovery and strong demand from China,This provides support to economic activity in commodity-exporting countries, among others in Africa. Recent projections put the real growth rate of the African continent for 2010 at more than 5 per cent (National Treasury) Growth will also be influenced by internal social and demographic trends within the continent.
Africa’s broadband market is set to quadruple by 2012, with the current 2.7m soaring to 12.7m (AfricaNext Investment Research, 2008). A rapid acceleration of broadband penetration and level of service (dubbed the ‘African Broadband Revolution’) will become a major driver of economic growth, infrastructural investment and innovation, enabling vastly improved regional integration of social, cultural and economic information networks (International Telecommunications Union, 2008).
Although increased regional inter-connectivity and innovation enabled by the broadband revolution will stimulate economic diversification throughout Africa, overall growth will continue to be driven predominantly by commodities.
.
In SSA, the overall ‘vulnerable employment rate’ is approximately four-fifths of total employment. Decent work, as outlined by the ILO, has always been a challenge in many parts of SSA. With over four-fifths of total employment in sub-Saharan Africa characterised as ‘vulnerable employment’, the notion of ‘decent work’ raised by the ILO will continue to be a challenge in most of the region. However, large shifts toward vulnerable employment are only evident in countries without social protection schemes. Where such schemes exist, sharp increases in unemployment occur (International Labour Organisation 2010a).
The Consolidation of the Service Economy: Services sector has outstripped mining, manufacturing and agriculture for the past half century!
Throughout the world the services sector has been the major creator of jobs, with the exception of countries that have aggressively pursued industrialisation strategies (notably in the Far East).
39
The geopolitical and economic influence of the BRIC countries will nevertheless continue to grow relative to the West, but one of the main drivers of this growth – the burgeoning middle class – will also escalate demand for food and energy .
Africa’s relatively small manufacturing base will likely contract further in coming years, but new opportunities exist in tourism and services.
The Rise of the Outsourced Economy: serving many sectors with common needs
Countries with a large English speaking population, like South Africa, Ghana and Nigeria, are well-placed to benefit from outsourcing in the medium term.
South Africa – while an English speaking country – needs to improve its outsourcing competitiveness by improving rates of productivity and basic education and reducing labour costs. Also, it is difficult to compete with countries like India which produce 870,000 new IT graduates and more than a million engineers per annum (Dixon 2010).
The Rise of the Value Chain Economy: rising productivity through more integrated and ubiquitous IT and logistics
The improvement of communications technologies, coupled with rising commuting costs, growing ethical objections to conservation objectives and very high levels of congestion in most urban centres, will drive the wide scale transformation of work practices. This includes the adoption of technologies such as tele-presencing, which is expected to precipitate a migration of skilled professionals outside of major cities. Time and task tracking tools are revolutionising productivity measurement, and earnings will become increasingly linked to productivity.
In South Africa, trends will be shaped by the extent to which new technology-enabled transport options are adopted by the region. Creative opportunities in various stages of development include Bus Rapid Transit, the Gautrain, electronic free flow tolling and an Integrated Transport System. Other major determinants of future trends are the changing dynamics in energy costs and environmental constraints. These are becoming increasingly important due to fluctuations in energy supply; pricing and global warming concerns (Zyl, 2008).
Project teams are becoming increasingly international due to the growing power of web tools. Local skills will compete in a global marketplace, while critical skills will be sourced globally. Tertiary qualifications will be equivalent to matriculation twenty years ago. It will no longer guarantee a career, but will be critical in opening doors. The low uptake of ICT, coupled with underdeveloped infrastructure, will encumber its integration into global markets.
The Dawning of the Knowledge Economy: the skills pyramid lifts higher
Professional technical knowledge will become obsolete more quickly. An individual’s professional knowledge is becoming outdated at a much faster rate than ever before. Most professions will require continuous experience, instruction and retraining. Rapid changes in
40
the job market and work-related technologies will necessitate evolving job education for every worker. At any given moment, a substantial portion of the labour force will be in job retraining programmes (Cetron & Davies, 2008).
Informal education systems – such as online courses – will provide new educational opportunities in countries where academic institutions are weak or inaccessible.
However, it is presently unlikely that South Africa will be able to benefit fully from these opportunities, due to the paucity of skilled labour and a relatively regulated and unproductive labour force.
Without major intervention, unemployment is destined to grow due to businesses restructuring in response to changed conditions, especially in the manufacturing and service sectors.
The Dawning of the Bio Economy: the next technological wave
Worldwide the pharmaceutical market will grow extensively to US $1.3trillion and the fully integrated pharma model will give way to virtual integrated pharma model (biotechnology replacing current approaches).
Promising new technologies will emerge during this time in response to these challenges, but legacy costs in the first world (e.g. electricity generation and distribution infrastructure) and low levels of development and capacity in the developing world (e.g. water management systems and agricultural methods) will disallow the rate of technological diffusion necessary to avert the most salient social, economic and environmental impacts.
The Emergence of the Green Economy: retooling the energy, carbon, transport and waste infrastructure
Forward-looking and well-capacitated city regions will initiate bold, long-term programmes aimed at dramatically re-engineering their respective urban systems to attain carbon neutrality and zero waste. Expect these pioneers to establish new standards for best practice in urban design and policy.
In the global environment high carbon, energy intensive economies will become increasingly unattractive for economic investment. Energy efficiency and renewable energy are fundamental to any economic development plans for the future (Ward, 2008).
Green jobs become a new employment opportunity for the future, reaching into solar and other new forms of energy, recycling, and water conservation.
Expect an explosive growth in consultancy firms offering specialist advice on energy saving and compliance (Dixon 2010).
Saltwater agriculture and solar energy could be massive sources for sustainable growth (Glenn, Gordon, & and Florescu, 2008).
Drought, flooding and other climate change-related natural hazards will create waves of climate change refugees who flee to cities for survival, accelerating the informalisation of urban areas (Development, Concepts and Doctrine Centre , 2006)
Energy supply mix and demand will be shaped in South Africa by the effectiveness of which national government follows up on its commitment to pursue the ‘required by science’ carbon route (Dept. of Environment, 2008). This route sees South Africa reducing emissions in greenhouse gas emissions by between 30% and 40% from 2003 levels by 2050. These

41
targets may not be realistic and require pragmatic review. The lower end of the ‘Required by Science’ target (-40%) can be thought of as a global or collective bottom line. The degree of the burden sharing discount will be based on a number of factors:
o The coal-based nature of its energy economy and the degree of effort and cost to make the changes required;
o The extent to which the technological and financial resource transfers agreed in the Convention are realised; and
o The electricity supply crisis will not be resolved in the medium term (nuclear and new large coal power stations typically take 6 to 15 years to become operational) and electricity prices will also continue to rise. (Ward, 2008)
The Ongoing Explosion of the Leisure Economy: the world’s biggest and fastest growing industry
Global tourism boom over the last fifty years, growing from a mere $2bn in 1950 to $622bn in 2008.
Fastest growing global sector, creating 10 million jobs in 2006 alone.
Increase in developing countries’ market share from 28.6% in 1990 to 40.3% in 2005.
Tourism will grow dramatically, doubling worldwide from 842m in 2006 to 1.6bn in 2020. China will be the greatest source of tourists as well as the most popular destination (World Travel and Tourism Council, 2007).
Growing at 10.6% per year, Africa enjoys the highest rate of growth in tourism arrivals (WTO).
South Africa has experienced – since 1995 – a 5% annual growth in international visitors, and a 13.2% annual growth in tourism receipts. This trend is projected to continue until at least 2016.
South Africa, being a relatively new destination, must ensure that it protects and grows this sector in a sustainable manner.
0-1: Tourism and Travel Projections for South Africa (2009-2020)
42
(World Travel and Tourism Council, 2007)
The Community Economy is here to stay: health care, hairdressing, teaching and safety jobs will never become obsolete
Future trends will be driven by the extent to which existing skilled health professionals can be retained and new ones recruited, anti-retroviral treatment is made accessible and public awareness campaigns are effective. Another factor that may impact on future trends is the realisation of major funding committed by development nations and non-state actors such as the Gates Foundation to health issues. Such commitments are likely to pay returns in the coming decades in terms of malaria, HIV/AIDS and tuberculosis, yet the latency of the realisation of these benefits remain uncertain (Malemela, 2008).
New opportunities will be created in community gardens, local public transportation and energy and waste recycling infrastructure.
The Grey Economy: working outside the regulatory system
Relative to its main competitors, South Africa performs relatively well in terms of regulatory compliance. Whereas regulation does pose a burden on private capital and organized crime is on the increase, South Africa boasts the top global rank for its auditing and reporting standards, and also fares well in terms of the culture of tackling bribery.
Crime, corruption and rent-seeking behaviour is, however a leading economic impediment to growth and employment.
Illegal imports negate efforts to support local industry.
A successful youth employment programme would go a long way toward keeping young people out of the “grey economy”.
Comparing South Africa with Five Countries
Introduction: South Africa compared with Chile, Brazil, Poland, Malaysia and Ghana
Five countries have been selected as comparison with South Africa. Countries have been chosen for comparison where they have an emerging economy, economic upheaval, large scale social problems, yet they have still managed to achieve growth and some employment success. The lessons available from these countries are regarded as helpful insight for South Africa’s challenges on inclusive job rich growth.
South Africa’s average GDP growth rate of 4.59% for the five years prior to the GFC compares well with the five case studies which fell in the range of 4% - 6%. This suggests that from a growth perspective South Africa is doing relatively well and this ties up with the competitiveness data.
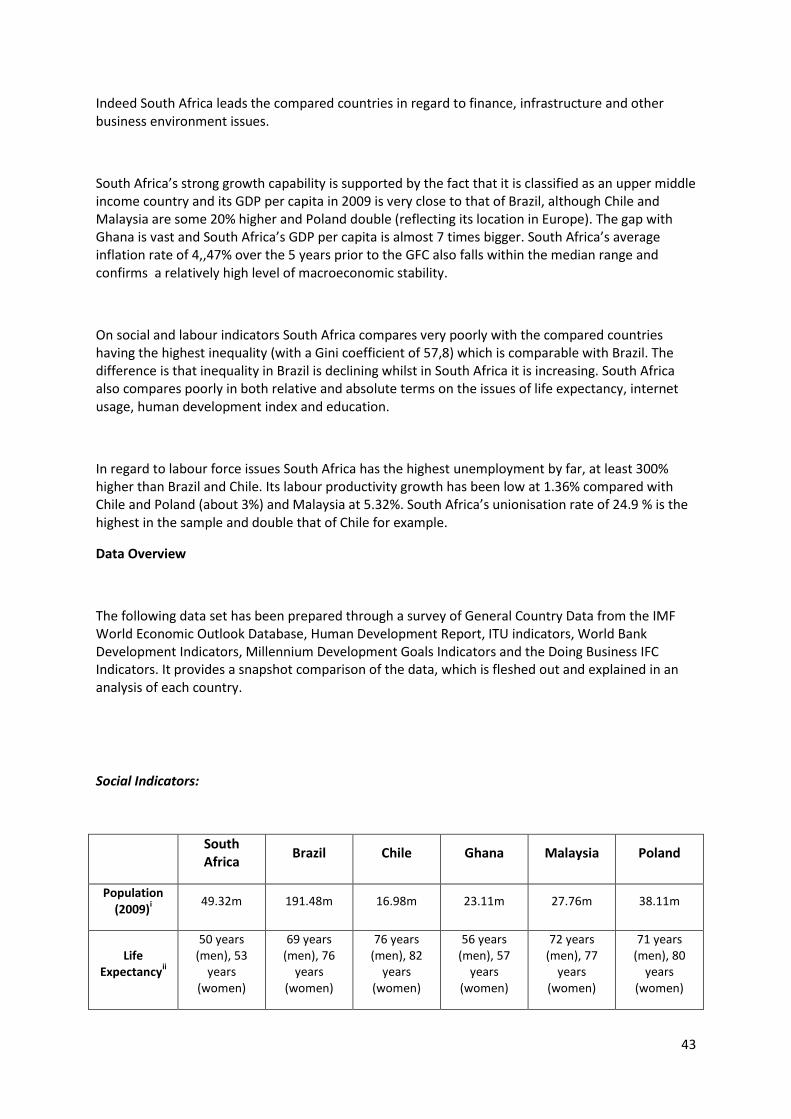
43
Indeed South Africa leads the compared countries in regard to finance, infrastructure and other business environment issues.
South Africa’s strong growth capability is supported by the fact that it is classified as an upper middle income country and its GDP per capita in 2009 is very close to that of Brazil, although Chile and Malaysia are some 20% higher and Poland double (reflecting its location in Europe). The gap with Ghana is vast and South Africa’s GDP per capita is almost 7 times bigger. South Africa’s average inflation rate of 4,,47% over the 5 years prior to the GFC also falls within the median range and confirms a relatively high level of macroeconomic stability.
On social and labour indicators South Africa compares very poorly with the compared countries having the highest inequality (with a Gini coefficient of 57,8) which is comparable with Brazil. The difference is that inequality in Brazil is declining whilst in South Africa it is increasing. South Africa also compares poorly in both relative and absolute terms on the issues of life expectancy, internet usage, human development index and education.
In regard to labour force issues South Africa has the highest unemployment by far, at least 300% higher than Brazil and Chile. Its labour productivity growth has been low at 1.36% compared with Chile and Poland (about 3%) and Malaysia at 5.32%. South Africa’s unionisation rate of 24.9 % is the highest in the sample and double that of Chile for example.
Data Overview
The following data set has been prepared through a survey of General Country Data from the IMF World Economic Outlook Database, Human Development Report, ITU indicators, World Bank Development Indicators, Millennium Development Goals Indicators and the Doing Business IFC Indicators. It provides a snapshot comparison of the data, which is fleshed out and explained in an analysis of each country.
Social Indicators:
South Africa
Brazil Chile Ghana Malaysia Poland
Population (2009)
i
49.32m 191.48m 16.98m 23.11m 27.76m 38.11m
Life Expectancy
ii
50 years (men), 53
years (women)
69 years (men), 76
years (women)
76 years (men), 82
years (women)
56 years (men), 57
years (women)
72 years (men), 77
years (women)
71 years (men), 80
years (women)
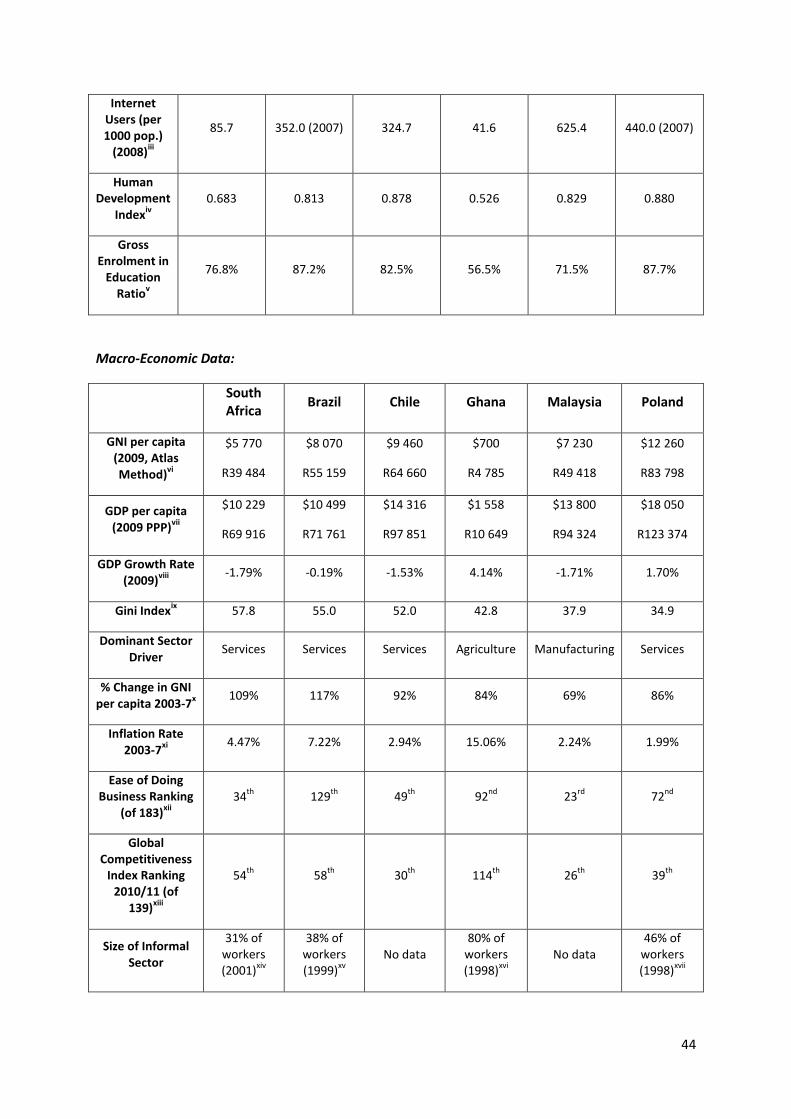
44
Internet Users (per 1000 pop.)
(2008)iii
85.7 352.0 (2007) 324.7 41.6 625.4 440.0 (2007)
Human Development
Indexiv
0.683 0.813 0.878 0.526 0.829 0.880
Gross Enrolment in
Education Ratio
v
76.8% 87.2% 82.5% 56.5% 71.5% 87.7%
Macro-Economic Data:
South Africa
Brazil Chile Ghana Malaysia Poland
GNI per capita (2009, Atlas Method)
vi
$5 770
R39 484
$8 070
R55 159
$9 460
R64 660
$700
R4 785
$7 230
R49 418
$12 260
R83 798
GDP per capita (2009 PPP)
vii
$10 229
R69 916
$10 499
R71 761
$14 316
R97 851
$1 558
R10 649
$13 800
R94 324
$18 050
R123 374
GDP Growth Rate (2009)
viii
-1.79% -0.19% -1.53% 4.14% -1.71% 1.70%
Gini Indexix
57.8 55.0 52.0 42.8 37.9 34.9
Dominant Sector Driver
Services Services Services Agriculture Manufacturing Services
% Change in GNI per capita 2003-7
x
109% 117% 92% 84% 69% 86%
Inflation Rate 2003-7
xi
4.47% 7.22% 2.94% 15.06% 2.24% 1.99%
Ease of Doing Business Ranking
(of 183)xii
34
th 129
th 49
th 92
nd 23
rd 72
nd
Global Competitiveness
Index Ranking 2010/11 (of
139)xiii
54th
58th
30th
114th
26th
39th
Size of Informal Sector
31% of workers (2001)
xiv
38% of workers (1999)
xv
No data 80% of
workers (1998)
xvi
No data 46% of
workers (1998)
xvii
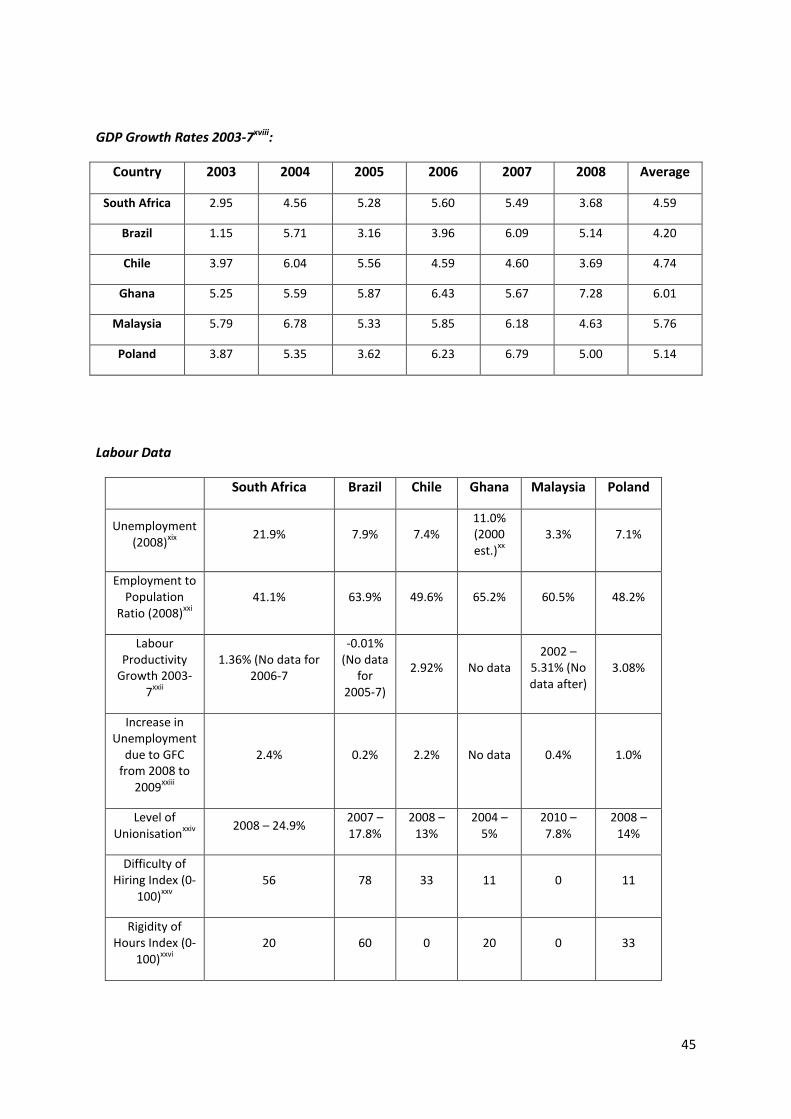
45
GDP Growth Rates 2003-7xviii:
Country 2003 2004 2005 2006 2007 2008 Average
South Africa 2.95 4.56 5.28 5.60 5.49 3.68 4.59
Brazil 1.15 5.71 3.16 3.96 6.09 5.14 4.20
Chile 3.97 6.04 5.56 4.59 4.60 3.69 4.74
Ghana 5.25 5.59 5.87 6.43 5.67 7.28 6.01
Malaysia 5.79 6.78 5.33 5.85 6.18 4.63 5.76
Poland 3.87 5.35 3.62 6.23 6.79 5.00 5.14
Labour Data
South Africa Brazil Chile Ghana Malaysia Poland
Unemployment (2008)
xix
21.9% 7.9% 7.4% 11.0% (2000 est.)
xx
3.3% 7.1%
Employment to Population
Ratio (2008)xxi
41.1% 63.9% 49.6% 65.2% 60.5% 48.2%
Labour Productivity
Growth 2003-7
xxii
1.36% (No data for 2006-7
-0.01% (No data
for 2005-7)
2.92% No data 2002 –
5.31% (No data after)
3.08%
Increase in Unemployment
due to GFC from 2008 to
2009xxiii
2.4% 0.2% 2.2% No data 0.4% 1.0%
Level of Unionisation
xxiv
2008 – 24.9% 2007 – 17.8%
2008 – 13%
2004 – 5%
2010 – 7.8%
2008 – 14%
Difficulty of Hiring Index (0-
100)xxv
56 78 33 11 0 11
Rigidity of Hours Index (0-
100)xxvi
20 60 0 20 0 33
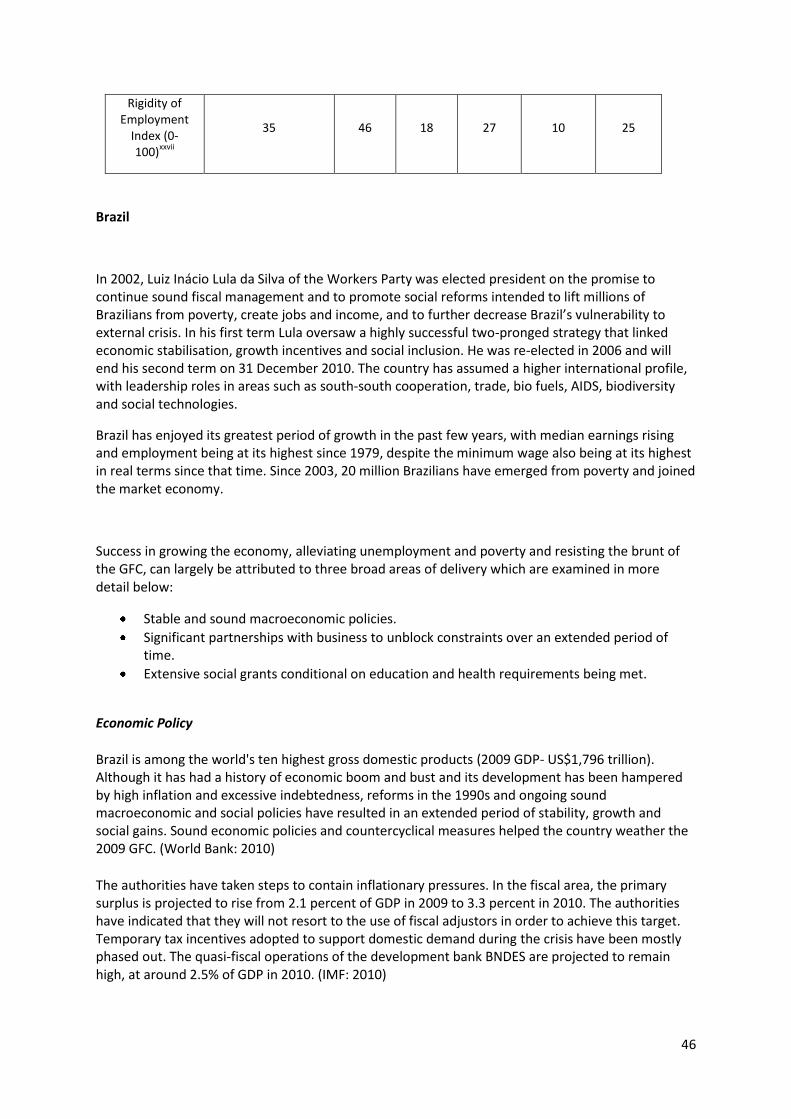
46
Rigidity of Employment
Index (0-100)
xxvii
35 46 18 27 10 25
Brazil
In 2002, Luiz Inácio Lula da Silva of the Workers Party was elected president on the promise to continue sound fiscal management and to promote social reforms intended to lift millions of Brazilians from poverty, create jobs and income, and to further decrease Brazil’s vulnerability to external crisis. In his first term Lula oversaw a highly successful two-pronged strategy that linked economic stabilisation, growth incentives and social inclusion. He was re-elected in 2006 and will end his second term on 31 December 2010. The country has assumed a higher international profile, with leadership roles in areas such as south-south cooperation, trade, bio fuels, AIDS, biodiversity and social technologies.
Brazil has enjoyed its greatest period of growth in the past few years, with median earnings rising and employment being at its highest since 1979, despite the minimum wage also being at its highest in real terms since that time. Since 2003, 20 million Brazilians have emerged from poverty and joined the market economy.
Success in growing the economy, alleviating unemployment and poverty and resisting the brunt of the GFC, can largely be attributed to three broad areas of delivery which are examined in more detail below:
Stable and sound macroeconomic policies.
Significant partnerships with business to unblock constraints over an extended period of time.
Extensive social grants conditional on education and health requirements being met.
Economic Policy
Brazil is among the world's ten highest gross domestic products (2009 GDP- US$1,796 trillion). Although it has had a history of economic boom and bust and its development has been hampered by high inflation and excessive indebtedness, reforms in the 1990s and ongoing sound macroeconomic and social policies have resulted in an extended period of stability, growth and social gains. Sound economic policies and countercyclical measures helped the country weather the 2009 GFC. (World Bank: 2010)
The authorities have taken steps to contain inflationary pressures. In the fiscal area, the primary surplus is projected to rise from 2.1 percent of GDP in 2009 to 3.3 percent in 2010. The authorities have indicated that they will not resort to the use of fiscal adjustors in order to achieve this target. Temporary tax incentives adopted to support domestic demand during the crisis have been mostly phased out. The quasi-fiscal operations of the development bank BNDES are projected to remain high, at around 2.5% of GDP in 2010. (IMF: 2010)

47
Brazil is fairly stable at 58th in the WEF GCR 2010-2011 rankings, with a slight improvement in score (4.3 vs. 4.2 in 2009), after following an impressive upward trend for the last couple of years (up 16 positions between 2007 and 2009). The country’s recent dynamism in the rankings has reflected the remarkable strides made in the past 20 years toward macroeconomic stability, liberalising and opening the economy, and reducing income inequality, among other dimensions. Among its solid competitive advantages are its large market size (10th), providing the efficient and dynamic business sector (ranked 31st for business sophistication) with important economies of scale, and a large basis on which to absorb and introduce process and product innovation (ranked 44th and 42nd for technological adoption and innovation, respectively). Moreover, Brazil displays one of the most developed and sophisticated financial sectors in the region (50th), coupled with fairly efficient infrastructure by regional standards (ranked 62nd, up 12 places from 2009) and a relatively well functioning higher education system (58th), notably in its on-the-job training component (38th).
These efforts have been instrumental in putting the economy on a much sounder competitiveness foundation and in providing a markedly more business friendly environment for private-sector development. Moreover, this has allowed Brazil to successfully react to the impact of the recent global economic crisis: while the country’s GDP contracted slightly in 2009 (GDP’s growth rate was –0.18% in 2009), the economy has started to grow again in 2010, with an expected annual growth rate of 5.5%.
“On the other hand, despite the progress made toward fiscal sustainability, the macroeconomic environment in the country remains worrisome, with notably low savings rates (15 percent, 101st), a high interest rate spread (35.4 percent, 136th), and relatively high public indebtedness (48 percent of GDP, 84th). Goods and labour markets display important rigidities that hinder the allocation of resources to their most efficient use (ranked 114th and 96th, respectively). In addition, the quality of institutions remains poorly assessed at 93rd, with limited trust of politicians and in the rule of law. (WEF: 2010).
Despite the important advances in microeconomic and institutional reforms, non-inflationary potential growth is still limited by various barriers and regulations, as well as inadequate infrastructure and a poor business climate. Brazil launched the successful Growth Acceleration Plan (PAC, in its acronym in Portuguese) in 2007 to increase investment in infrastructure and provide tax incentives for faster and more robust economic growth.
Social Policy
2009 unemployment was 7.9 % according to IMF World Outlook Economic Data. The highest unemployment rate was 14.1% (over the last 40 years) in 1981.
The Labour Code prohibits having too many unions for a single profession and in each region. Although the law has not created a central institution, either, representing the unions, four groups have tried to provide this but without legitimacy. Some industrial and mining sectors have powerful unions, however, the unions are less active in the rural areas where the great landowners still hold sway. Union dues are obligatory for all workers in the formal sector, and are set at the cost of one
48
working day's income per year. (Source: http://www.laposte-export-solutions.co.uk/uk/markets/country-profiles/brazil/labour-market.)
Inequality in Brazil remains at relatively high levels for a middle income country, and there is still a large gap in access to infant and secondary education. After having reached universal coverage in primary education, Brazil is now struggling to improve the quality and outcome of the system, especially at the basic and secondary levels. According to the WEF, “further focus and efforts are required to improve the quality of the educational system at all levels (ranked 106th for primary education and 97th for the quality of the higher education) and to reduce regional disparities in educational access and attainment.” (WEF GCR 2010-2011).
Brazil experiences extreme regional differences, especially in social indicators such as health, infant mortality and nutrition. The richer South and Southeast regions enjoy much better indicators than the poorer North and Northeast.
Poverty (PPP US$2 per day) has fallen markedly, from 20% of the population in 2004 to 7% in 2009. Extreme poverty (PPP US$1.25 per day) also dropped dramatically, from 10% in 2004 to 4% in 2009. Between 2001 and 2009, the income growth rate of the poorest ten percent of the population was 7% per year, while that of the richest ten percent was 1.7%. This helped decrease income inequality (measured by the Gini index) from 0.596 to 0.54 in the period. Key drivers of this have been low inflation, consistent economic growth, well-focused social programs, and a policy of real increases for the minimum wage.
An important and perhaps decisive precursor to Brazil’s economic success was its widescale adoption of social protection policies which were well-calibrated to local conditions. These originated in response to the Latin American crisis of the 1990s. Between the mid 1990s and mid 2000s, these policies resulted in a 21% reduction in income inequality. Conditional cash transfer programmes – such as the Bolsa Familia provide for small, monthly cash transfers to the poor on the basis of education and health conditions being met. Reaching 11,4 million families in 2006 (about a quarter of its population), it is the largest conditional cash transfer programme in the world (Rawlings & Rubio 2005). This is having a significant impact in breaking the poverty transmission to the next generation.
Response to the GFC
Brazil weathered the global financial downturn with relatively minor impacts. The country was one of the last to fall into recession in 2008, experiencing 5.1% growth in 2008, negative growth of 0.2% in 2009 and being among the first to resume growth in 2009. Brazil is expected to grow approximately 7% in 2010 largely on the strength of strong domestic demand. Brazilians are benefiting from stable economic growth, low inflation rates and improvements in social well-being.
Temporary tax incentives adopted to support domestic demand during the crisis have been mostly phased out in 2010. The quasi-fiscal operations of the development bank BNDES are projected to remain high, at around 2.5% of GDP in 2010. (IMF: 2010). Other measures included tax relief for companies in distress. (ILO Survey 2009)

49
Macroeconomic resilience was due both to the strength of the financial system and the combination of fiscal responsibility, exchange rate flexibility, and a credible commitment to inflation targeting—the pillars of the successful macroeconomic strategy that Brazil has pursued over the last decade.
The Brazilian financial sector is supporting the economic expansion. During the crisis, as the supply of new credit from private banks to the economy fell significantly, the expansion of credit by public banks played a critical role in preventing a potentially large output loss.
Brazil continues to be the recipient of heavy capital inflows, as global investors seek to benefit from the economy’s strong growth potential and relatively high interest rates. In October 2009, the authorities imposed a 2% tax on purchases of domestic bonds and equities by foreigners, which appears to have had some impact in slowing inflows. Since the beginning of 2009, the stock market index has risen by two-thirds and the real has appreciated by about 25 percent against the U.S. dollar. (Brazil World Bank)
Social Dialogue
The relative weakness of labour unions in Brazil can be attributed to both the country’s history of authoritarian regimes and the impact of de-industrialisation in the 1980s and 1990s, and accordingly without emphasis on worker rights, the labour market is regarded as amongst the most flexible in the world. In tandem with the economic development programs adopted in response to the country’s economic crisis in the 1990s, the successive governments of Cardoso and Lula initiated social dialogue processes with trade unions, but only in the latter regime was this done systematically through the National Forum of Labour (Forum Nacional do Trabaldo). The purpose of this tripartite forum is to reform labour and union laws, specifically relating to union structure (see www.mte.gov.br – Portuguese).
A successful regional precursor to this national programme was the Regional Chamber of the Greater ABC region (Sao Paolo), described as the most important social dialogue experience involving employment creation in the country. The chamber joined the mayors of four major industrial centres at a time of crisis after the neoliberal policies and the ‘competitive shock’ of the economic adjustment plan. The local community joined in a program of regional development involving infrastructure renewal, redefinition of the commodity and value chains including more attention to small and medium firms, training of dismissed workers, attraction of new investments to brownfield area and other issues. Annual meetings oversee the production of diagnostics of problems and the definition of public policies in strategic areas. Working groups were dedicated to respective production chains, and constituted of employer associations and workers as well as NGOS and politicians in all levels of government. The process was designed to propose systemic interventions in many areas, from water resources to transport and energy. There is broad consensus that this initiative had dramatic symbolic and economic impacts in favour of small business, services and high technology firms, thus bringing down unemployment rates significantly from of 25% in the 1990s (Cardoso & Corporation 2004).
Chile

50
Since the return of democracy in 1990, the country has been committed to advancing economic reforms, proactive social investments, a transparent public administration and a stable, consensus-based government, according to the World Bank. In March 2010, ‘Coalición por el Cambio’ candidate Sebastian Piñera was elected president, putting an end to 20 years of rule by the Consertación political movement. The president took office after the worst earthquake and tidal wave in Chile’s history. In response to the emergency, the government agenda prioritized reconstruction during the first part of Piñera’s term.
Chile has been the fastest growing economy in Latin America during the last 15 years, with an average annual per capita growth rate of 4.1% over the fifteen years following the return of democracy in 1990. Per capita incomes have doubled in real terms, and the relative income gap between Chile and high-income OECD countries has also been substantially reduced, according to the World Bank.
Lessons, captured in more detail below, in achieving rapid economic progress, keeping unemployment low and addressing a legacy of poor education can be attributed to:
Stable macroeconomic policy.
Investment in social protection.
Social consensus and delivery on education improvement.
Serious challenges, however, with income inequality and education persist and bear resemblance to those applicable in South Africa.
Economic Policy
According to the World Bank, Chile has consolidated macroeconomic stability in part through the adoption of a floating exchange rate regime and full-fledged inflation-targeting. Most important has been a carefully calibrated fiscal policy, which has balanced an expanding program of investments in social programs with an unquestioned commitment to countercyclical and disciplined fiscal policy.
The country’s financial system is large and well-diversified relative to its regional comparators, and the system is viewed as resilient to shocks, with a sound regulatory and supervisory framework. At the end of 2009, Chile became the first South American country in being an OECD member. However, Chile faces the challenges of having to diversify its copper-dependent economy. As the largest world producer, it is starting to feel the impact of the global economic crisis as export markets shrink.
In the past two years, the Chilean economy has successfully overcome the effects of the global financial crisis and the economic impact of the February 2010 earthquake. Real GDP growth fell to 3.7 % in 2008 and economic activity decreased by 1.5% in 2009, despite a large stimulus program. The IMF (29 Sept 2010) increased its outlook for Chile's 2010 GDP growth to 5.0% from a previous 4.7% estimate and maintained its 6% growth outlook for 2011.
Stable at 30th in the WEF GCS (2010-2011), “Chile remains the most competitive country in Latin America and the Caribbean, with a very convincing performance resting notably on solid basic requirements (37th) and efficiency enhancers (35th). The country has been at the forefront of market liberalization and opening, resulting in very efficient goods and labour markets (28th and 44th, respectively), one of the most sophisticated financial markets (41st), and the largest pension

51
industry in the region. The liberalisation process took place in the context of sound macroeconomic policies (26th for macroeconomic stability) and transparent institutions (28th in the institutions pillar). These attributes have not only spurred growth over the last 20 years, but also have provided the country with the resources needed to stimulate the economy in recent times of crisis and to address the pressing reconstruction challenges brought about by the tragic 2009 earthquake. Indeed, a part of the US$8.4 reconstruction plan envisaged by the government in the next four years is expected to come from the Economic and Stabilization Fund—one of the main tools used by the country in its counter-cyclical policies
Chile was the top destination for foreign direct investment in Latin America during the first quarter of 2010. During the recent World Conference for Trade and Development, the United Nations reported that Chile, with US$5.7 billion in foreign direct investment, had outpaced Brazil (US$5.6 billion) and Mexico (US$4.3 billion) among favourite locations for investors in the first quarter.
Chile has already taken maximum advantage of global trade liberalisation. It has more than 20 free-trade agreements with countries including the United States, China, Japan and Australia, as well as with the trade blocs Mercosur (Argentina, Brazil, Paraguay, Uruguay; Chile is an associate member) and the European Free Trade Association (Iceland, Lichtenstein, Norway and Switzerland). (Source: Wharton University)
Chile has a strong market orientation and has invested heavily in R&D to initiate new industries and devalued its currency for a period. (HRSC: 2008).
Social Policy
Unemployment in Chile is at 7.4%, according to the IMF Economic Outlook Data Indicators.
Chile, however, has an unsatisfactory quality of its educational system at all levels (ranked 101st for primary education and 45th for higher education and training), despite rising educational attainment rates and government efforts to improve educational quality, including through increased spending.
What is particularly evident is the country’s progress towards education reform since the early 1990s. Based on a strategy of continual and incremental changes, the success of the reform process is attributed to the following factors: (a) a national consensus on the role of education in achieving economic and social objectives, (b) continuous and consistent political support despite changes in national and ministerial administrations, (c) macroeconomic stability and growth, (d) widespread public acceptance of modernisation policies rather than polices relating to control and institutional power relations and (e) a system based on incentives, information sharing and evaluation and a focus on differentiation rather than homogeneity in educational services (Gajardo & Gomez 2005, p.5).
Despite substantial improvements in living standards and growth, some 13.7% of Chileans live below the poverty line, with many millions precariously just above it. The distribution of income is among the most unequal of any country in the world with a Gini coefficient of 52, and upward social mobility is scarce.
Chile has invested proactively in social protection programs, but the middle class as well as the poor, remain highly vulnerable to shocks. Notwithstanding a significant improvement over 20 years,
52
infrastructure and public services still remain outside the reach of many Chileans. Despite solid economic growth and specific policies such as Chile Solidario, the income ratio between the highest and lowest incomes remained largely unchanged between 1990 and 2009. The 20/20 ratio indicates that the average income of the richest 20 percent of Chileans was 12 times greater than that of the poorest 20 percent in 2009.
Response to the GFC
In June 2009, Chile’s Central Bank reported that the country’s economic activity had contracted 4.6%, its sixth consecutive fall. The contraction occurred despite a government stimulus plan of nearly $4 billion and measures to boost credit for small and medium-size companies. (World Bank: 2010)
Chile has, however, recovered well from the GFC and is expected to reach GDP of 5% in 2010.
Measures to address employment loss during the economic crisis included the introduction of wage subsidies for the hiring of young workers between the ages of 18 and 24. (ILO Survey. 2009)
Social Dialogue
Chile is identified as a country with strong and autonomous unions with the technical capacity to negotiate on a legislative basis and political commitment for engaging in social dialogue, respect for freedom of association, opportunities to build a national consensus and the establishment of linkages between unions and ministries as well as among unions and public opinion (Gajardo & Gomez 2005, p.4).
Tripartite mechanisms include:
A National Commission (made up of relevant actors from government, political parties and teachers’ organisations) is responsible for reaching consensus for a State policy, and acts as a forum for negotiation and decision-making.
Political agreement reached among Government and opposition in order to guarantee financial resources for school reform.
A protocol was signed between the Union and the Presidency inaugurating a new stage of social dialogue, a tripartite social dialogue mechanism involving the Ministry of Education, the Association of Municipal Governments and the national teachers’ union, whereby agreements were established between the national union and the highest authority of Government.
Chile is a good example where social dialogue was achieved within the context of a strong State with regulatory policies to compensate social inequalities or to preserve workers’ employment conditions, as well as strong teachers’ organisations with policy options and managerial strategies (Gajardo & Gomez 2005, p.42).
Ghana
Two years after winning power, the government of President John Atta Mills finds itself under increased pressure to fulfil campaign promises ahead of general elections in 2012. (World Bank 2009). The biggest immediate challenge faced by the Mills administration upon taking power was

53
how to quickly stabilize or ‘fix’ an economy which was showing cracks at various levels. In response, the government immediately adopted a multi-year fiscal stabilisation plan. The strategy comprised immediate actions in 2009 to restore expenditure control and pave the way for structural reforms in the public sector and in energy in 2010. These actions and reforms aim to stabilise the debt-to-(non-oil)-GDP ratio from 2010 onwards.
Interesting observations regarding Ghana include strong and sustained growth and relatively low unemployment, with particularly interesting strategies pertaining to:
Investment in telecommunications in improving delivery and bringing down costs.
Optimisation of natural resources – oil.
Social dialogue at a sector level to address blockages.
Economic Policy
Ghana has averaged growth of 6.01% over the period 2003-07 – the highest of all the five countries compared. Ghana’s core inflation, which excludes price changes of energy and utility items from the consumer. Inflation over the same period was at 15.06%. (IMF World Economic Outlook Database 2010)
The large stock of public expenditure arrears and outstanding commitments uncovered in the second half of 2009 makes the ambitious fiscal stabilisation objectives set forth in the 2010 budget much more difficult to meet, while weakening private and financial sectors, as well as utilities’ operational capacities.
While there are early signs of stabilization, achievements from 2009 need to be consolidated in 2010 and 2011 to pave the way for a developmental use of oil revenue. There is a clear recognition of the need to pursue stabilisation efforts over several years, while encouraging growth through supply-side reforms (productive infrastructure, agricultural modernisation, and private sector development). Oil revenues are projected to start flowing in early 2011 and could be instrumental in supporting a new growth agenda. Efforts are ongoing to ensure a developmental use of oil revenues through sound legislation and strong institutions that ensure an effective, transparent and accountable use of these new resources. But pressures to increase public wages and subsidies, as well as existing structural inefficiencies if left unattended, would lead to oil revenues being used for consumption rather than to finance much needed investments.
Ghana is ranked 114th this year in the WEF CWR (2010-2011) - the same position as last year, although gaining four positions in a constant sample. Ghana continues to display strong public institutions and governance indicators with relatively high government efficiency, particularly by regional standards. Some aspects of the country’s infrastructure are also good by regional standards, particularly ports (ranked 59th). Financial markets are also relatively well developed (ranked 60th). On the other hand, education levels continue to lag behind international standards at all levels, labour markets continue to be characterised by inefficiencies, and the country is not harnessing new technologies for productivity enhancements (ICT adoption rates are very low). Finally, the country is characterised by macroeconomic instability, with the government running high fiscal deficits and building up significant debt, and with high interest rate spreads pointing to inefficiencies in the financial system.
Progress as a result of World Bank assistance and engagement in Ghana has been largely positive, with notable advances in agricultural crop production, natural resources governance, land

54
management, household electrification, ICT, primary education completion, social protection, and safe water supply. Weaker progress was registered in private sector development, transport, health, and public sector. In the area of Private Sector Competitiveness, the World Bank’s four investment projects (MSME, EMCB, LAP, eGhana) have contributed to the country’s goals by increasing private sector credit and foreign direct investment. (World Bank: 2010)
There has been significant progress in the ICT sector with an increase in mobile phone penetration and internet connections. Competition in the telecommunications sector increased: there are now six mobile operators, with two joining in the last three years, and the liberalisation of the international gateway and landing rights has attracted two new submarine cable providers. As a result, access has been expanded, and the cost of communication has been reduced. The recent reduction of bandwidth prices by 50 percent promises to further accelerate progress. The IT and IT enabled services sector (ITES) has benefitted from the telecom boom as well as from the creation of dedicated support institutions, both public and private, and Ghana has been rated for two years in a row as the most competitive ITES destination in Africa. The eGhana project is contributing to these achievements by supporting critical applications, skills development, and regulatory institutions. (World Bank: 2010)
Social Policy
The goal set out in Ghana- Vision 2020 is for Ghana to increase growth in order to become a low middle-income country (threshold of US$760 per capita) by the turn of this decade. The vision calls for a transformation of the economy and society, in order to improve the quality of life for all Ghanaians, including through equitable distribution of the benefits of development, so as to achieve fairly balanced regional development and to eliminate gross deprivation and hard-core poverty, according to the World Bank. Government has outlined several specific objectives related to poverty reduction which are to:
o Reduce the incidence of poverty in both urban and rural areas; o Strengthen capabilities of the poor and vulnerable to earn income; o Reduce gender and geographical disparities; and o Improve the health and education levels and productivity of the population.
In the education sector, access and completion rates have improved steadily with primary completion increasing from 80.1 in 2007 to 86.3 in 2009, but quality remains low. The improvements in access to education across the country have been supported by the World Bank-financed Education Sector project
The Land Administration Project has also resulted in the strengthening and streamlining the institutional arrangements for land administration in Ghana with the passage of the Lands Commission Act 767 (2008) by Parliament on October 29, 2008. The decentralisation of the deeds registry to all the nine regional capitals has brought the registration of deeds closer to the clients making it easier to access land for agricultural purposes. The eight pilot activities which includes
55
systematic titling, customary lands demarcation, Geodetic reference network, land valuation database, land information systems, deed registration, community-based land use planning and land courts geared towards testing best practices have all yielded useful lessons for scaling-up.
Response to the GFC
The Ghana Statistical Service (GSS) reported that real GDP growth for 2009 turned in at 4.1%, down from 7.3% recorded in 2008. Since 2009, the Ghanaian economy has shown strong signs of stabilisation, while weathering the impact of the global financial crisis. Both fiscal and current account deficits were significantly reduced, the exchange rate was stabilised and consumer price inflation decelerated to single digit levels. But the large stock of public expenditure arrears and outstanding commitments uncovered in the second half of 2009 will make ambitious fiscal stabilisation objectives difficult to meet.
Social Dialogue
Ghana has a long history of social dialogue, starting with the National Tripartite Committee which was launched in 1972, and had its role made statutory and its responsibilities extended to advise the Minister responsible for employment on all labour market issues and on broader matters of social and economic importance. The NTC may also set up regional and district subcommittees, which must also be tripartite and must be supported by secretarial services for the effective performance of their function (Hodges & Baah 2006). Whereas the structure of bargaining in the formal sector is largely decentralised and formal, the fixing of the minimum wage by the NTC often sets the tone for wage negotiations.
Yet it is at sector level where the benefits of social dialogue are tangible. The Ministry of Health – which presides over a national health insurance system – commonly relies on tripartite participation to develop policy relating to pressing issues, including the dissemination of information, organising educational seminars, consultation and consensus building and setting up technical committees to draft policy papers (Dovlo 2005, p.viii)
However, the absence of a common agenda for dialogue and ad hoc engagements cast doubt on the sustainability of the process: whereas senior health sector managers and policymakers see social dialogue as a consultative and deliberative processes needed to reach consensus on certain policy issues, other partners viewed meetings and workshops as a substitute for true consultation and negotiation on the details of policy. Lastly, government viewed these processes as a means to defuse potential controversy and enable implementation without dissent or difficulty (Dovlo 2005, p.15)
Malaysia
After decades of rapid growth, Malaysia is caught in middle-income trap. Since 1997 crisis, Malaysia’s position as economic leader in the region has steadily eroded. Growth has been lower than other crisis-affected countries, while investment has not recovered. Public investment has
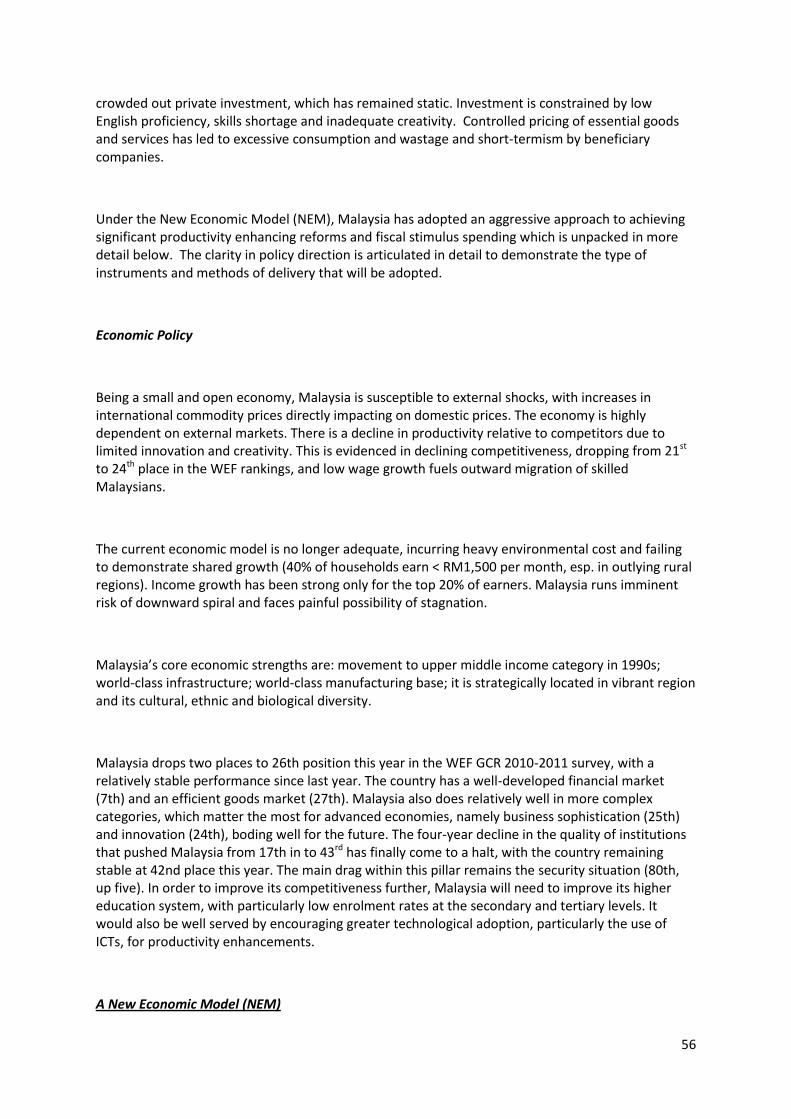
56
crowded out private investment, which has remained static. Investment is constrained by low English proficiency, skills shortage and inadequate creativity. Controlled pricing of essential goods and services has led to excessive consumption and wastage and short-termism by beneficiary companies.
Under the New Economic Model (NEM), Malaysia has adopted an aggressive approach to achieving significant productivity enhancing reforms and fiscal stimulus spending which is unpacked in more detail below. The clarity in policy direction is articulated in detail to demonstrate the type of instruments and methods of delivery that will be adopted.
Economic Policy
Being a small and open economy, Malaysia is susceptible to external shocks, with increases in international commodity prices directly impacting on domestic prices. The economy is highly dependent on external markets. There is a decline in productivity relative to competitors due to limited innovation and creativity. This is evidenced in declining competitiveness, dropping from 21st to 24th place in the WEF rankings, and low wage growth fuels outward migration of skilled Malaysians.
The current economic model is no longer adequate, incurring heavy environmental cost and failing to demonstrate shared growth (40% of households earn < RM1,500 per month, esp. in outlying rural regions). Income growth has been strong only for the top 20% of earners. Malaysia runs imminent risk of downward spiral and faces painful possibility of stagnation.
Malaysia’s core economic strengths are: movement to upper middle income category in 1990s; world-class infrastructure; world-class manufacturing base; it is strategically located in vibrant region and its cultural, ethnic and biological diversity.
Malaysia drops two places to 26th position this year in the WEF GCR 2010-2011 survey, with a relatively stable performance since last year. The country has a well-developed financial market (7th) and an efficient goods market (27th). Malaysia also does relatively well in more complex categories, which matter the most for advanced economies, namely business sophistication (25th) and innovation (24th), boding well for the future. The four-year decline in the quality of institutions that pushed Malaysia from 17th in to 43rd has finally come to a halt, with the country remaining stable at 42nd place this year. The main drag within this pillar remains the security situation (80th, up five). In order to improve its competitiveness further, Malaysia will need to improve its higher education system, with particularly low enrolment rates at the secondary and tertiary levels. It would also be well served by encouraging greater technological adoption, particularly the use of ICTs, for productivity enhancements.
A New Economic Model (NEM)
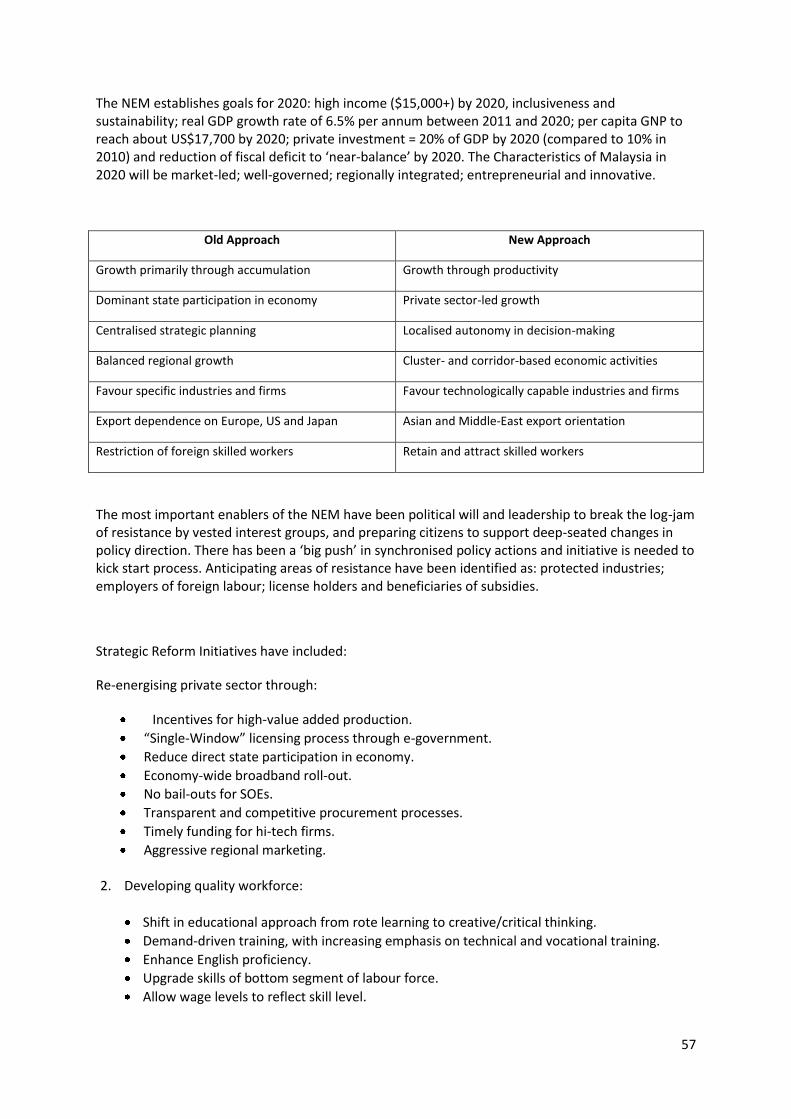
57
The NEM establishes goals for 2020: high income ($15,000+) by 2020, inclusiveness and sustainability; real GDP growth rate of 6.5% per annum between 2011 and 2020; per capita GNP to reach about US$17,700 by 2020; private investment = 20% of GDP by 2020 (compared to 10% in 2010) and reduction of fiscal deficit to ‘near-balance’ by 2020. The Characteristics of Malaysia in 2020 will be market-led; well-governed; regionally integrated; entrepreneurial and innovative.
Old Approach New Approach
Growth primarily through accumulation Growth through productivity
Dominant state participation in economy Private sector-led growth
Centralised strategic planning Localised autonomy in decision-making
Balanced regional growth Cluster- and corridor-based economic activities
Favour specific industries and firms Favour technologically capable industries and firms
Export dependence on Europe, US and Japan Asian and Middle-East export orientation
Restriction of foreign skilled workers Retain and attract skilled workers
The most important enablers of the NEM have been political will and leadership to break the log-jam of resistance by vested interest groups, and preparing citizens to support deep-seated changes in policy direction. There has been a ‘big push’ in synchronised policy actions and initiative is needed to kick start process. Anticipating areas of resistance have been identified as: protected industries; employers of foreign labour; license holders and beneficiaries of subsidies.
Strategic Reform Initiatives have included:
Re-energising private sector through:
Incentives for high-value added production.
“Single-Window” licensing process through e-government.
Reduce direct state participation in economy.
Economy-wide broadband roll-out.
No bail-outs for SOEs.
Transparent and competitive procurement processes.
Timely funding for hi-tech firms.
Aggressive regional marketing.
2. Developing quality workforce:
Shift in educational approach from rote learning to creative/critical thinking.
Demand-driven training, with increasing emphasis on technical and vocational training.
Enhance English proficiency.
Upgrade skills of bottom segment of labour force.
Allow wage levels to reflect skill level.

58
Centralise oversight of foreign labour to enable coherent practice.
Build up critical mass of skilled professionals through simpler work permit and immigration procedures.
Protect workers, not jobs through stronger safety net while encouraging labour.
3. Creating competitive domestic economy:
Market flexibility.
Revise hiring/firing rules.
Raise pay through productivity gains, not wage regulation.
Revamp seed and venture capital funds to support budding entrepreneurs.
Introduce fair trade legislation.
Provide technical and financial support for SMEs.
Phase out price controls and subsidies.
4. Strengthening the public sector
Improve decision-making processes through ‘whole-of-government’ approach.
Decentralise decision-making functions to local entities.
Upgrade skills of staff to enable them to multi-task.
Match qualifications with jobs.
Reduce corruption.
Codify best practices.
Provide safety net to facilitate smooth transition.
Widen tax base but lower taxes.
5. Transparent and market-friendly affirmative action
Shift focus towards relative poverty.
Phase out approaches that contribute to rent seeking and patronage.
Narrow regional differences.
Encourage reward on basis of performance.
6. Building knowledge base and infrastructure
Foster R&D links between higher learning institutions and private sector.
Open access to funding to competition among researchers.
7. Enhancing sources of growth
Identify and foster niche industries.
Capture greater share as a distributional hub as intra-regional trade expands.
Foster indigenous technologies.
Capture greater share of niche tourism markets.
Move into alternative energy generation as well as energy saving products and services.
Promote corridor-based development.
8. Ensuring sustainability of growth
Preserve natural resources.
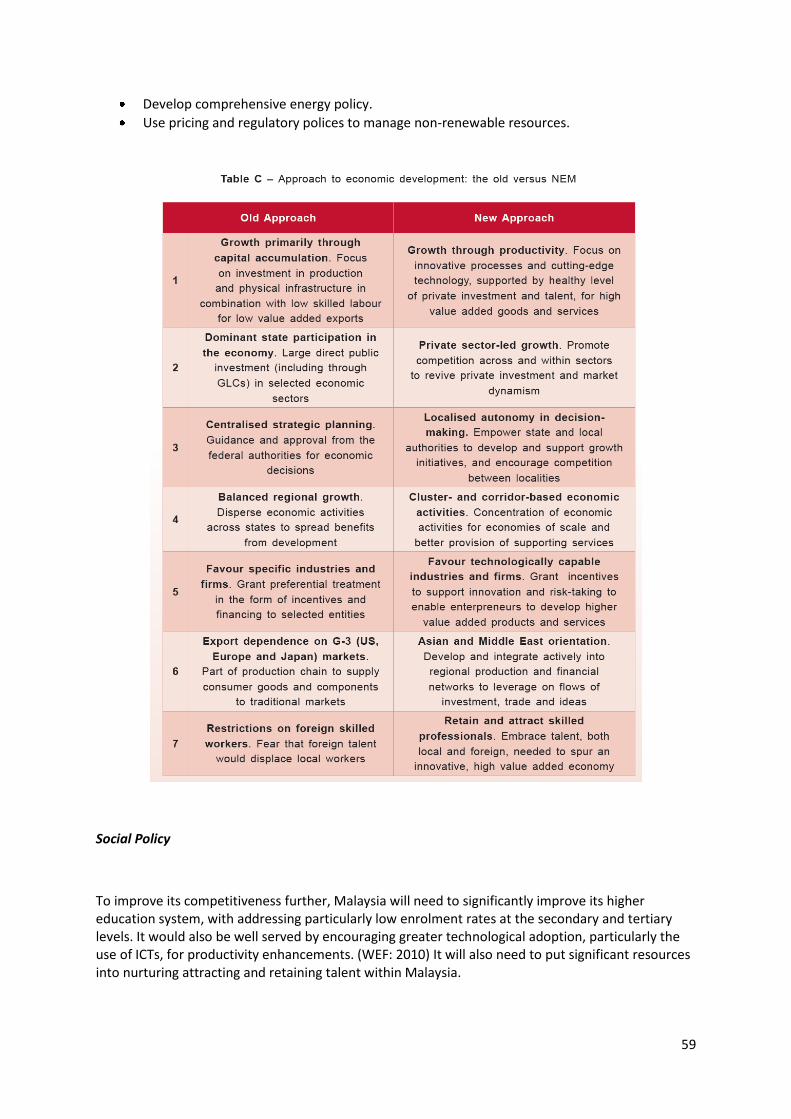
59
Develop comprehensive energy policy.
Use pricing and regulatory polices to manage non-renewable resources.
Social Policy
To improve its competitiveness further, Malaysia will need to significantly improve its higher education system, with addressing particularly low enrolment rates at the secondary and tertiary levels. It would also be well served by encouraging greater technological adoption, particularly the use of ICTs, for productivity enhancements. (WEF: 2010) It will also need to put significant resources into nurturing attracting and retaining talent within Malaysia.
60
While aggregate unemployment has shown limited movement, the labour market churning that has been a feature through the crisis has continued. Shifts into self-employment have been particularly strong, which might be associated with a rise in informal employment, as expected during a downturn. Patterns of employment and wage dynamics through the downturn and rebound have varied across sectors, in part reflecting exposures to the external demand shock. The labour market outlook is improving with vacancies on the rise and retrenchments sharply down from their crisis levels.
Response to the GFC
The reduction in Malaysia’s GDP growth rate was the steepest amongst middle-income countries in East Asia. Exports continue their climb out of one of their most severe slumps in history, driven by regional and, increasingly, global demand. Manufacturing is becoming the locomotive of growth again after services had provided a beacon of strength through the crisis. Stable monetary, fiscal and financial sector policies played a supportive role during the crisis
The Malaysian economy is experiencing a solid recovery, according to the World Bank. “Growth is expected to rebound to 5.7 percent in 2010, as momentum behind domestic private consumption and investment continues to build. The strength of the global recovery is one of the key near-term risks. The other is whether private sources of growth can lead the recovery once fiscal and monetary policy support unwinds. The medium-term growth outlook is favourable, with growth at 5.3% in 2011 and 5.6% in 2012. These forecasts price in gradual structural reform implementation as well as fierce external competition for trade, talent, and FDI.
Social dialogue (dealt with below) played a core role in the crisis recovery. Implementation of productivity-enhancing structural reforms put forward in the NEM is crucial to the medium-term outlook. The forecasts also reflect a fiercely competitive environment for trade and FDI, as the global economy continues rebalancing and countries around the region catch up along the value chain. The main upside risk to the long-term outlook is if the reform program will be comprehensively and expeditiously implemented.
Social Dialogue
It is against the backdrop of the Asian economic crisis of the late 1990s that the impact of social dialogue can be most clearly seen in Malaysia. Malaysian trade unions are historically weak because of the regulatory framework (Betcherman & Islam 2001, p.435). Yet the government’s decision to include the country’s largest worker organisation in decision-making at national level (Betcherman & Islam 2001, p.424) helped to limit retrenchments to 80,000, even through the country’s GDP contracted by 13% in 1998 (Betcherman & Islam 2001, p.433). Of retrenched workers, the overwhelming majority were placed in new jobs, although sometimes at lower wages.

61
The strengthening of tripartite dialogue played a central role in the government’s management of the GFC. The National Economic Recovery Plan was developed by a tripartite body called the National Economic Action Council, comprising of ministers, industry representatives and trade union leaders. It was within this forum that the Government showed its bona fide commitment to compromise by abandoning its proposals for a wage freeze and a moratorium on collective bargaining.
The Government’s unprecedented accommodation of organised labour was a reaction to the origins of the crisis itself, since the weakness or absence of democratic mechanisms were generally seen to be one of the causative factors. In this sense, economic considerations emerged as the main driver for social dialogue, with the latter being seen as a mechanism to disseminate information and thus improve the quality of decision-making.
The social dialogue in response to the GFC has provided the platform for social dialogue on the NEM.
Poland
Since 1989, Poland has undergone a remarkable political, social and economic transformation. Achievements included uninterrupted economic growth averaging 4.6% per annum from 1996-2007, accession to the European Union (EU) in May 2004, and during the recent crisis Poland was the only EU country to maintain positive growth in 2009.
Lessons from Poland pertain to its resilience and ability to register positive growth and maintain employment in difficult global economic conditions. Key factors of success dealt with below include:
Competent and stable macroeconomic policy.
Restructuring of enterprises for competitiveness.
Economic Policy
Poland began its transition to a market economy in 1990 under exceptionally difficult macroeconomic conditions, marked by hyperinflation, a high rate of hidden unemployment, a large legacy of external public debt, a high black market foreign exchange premium, and an obsolete state enterprise sector. Polish policymakers liberalised prices, made the Polish Zloty convertible, fixed the exchange rate, lowered import barriers, and started privatisation. Many predicted that Polish enterprises would not be able to cope with market conditions, leading to mass bankruptcy and social upheaval. On the contrary, thanks to competent policy management at the macroeconomic level and thorough restructuring of enterprises, Poland became a frontrunner among European transition countries.
62
The largest country among the new European Union (EU) members, Poland moves up by seven positions to 39th in the World Economic Forum GCR 2010-2011 survey.” This significant improvement for a second year in a row reflects the country’s relatively stronger resistance to the economic crisis as a result of more prudent economic policies and its growing domestic market size.”
The recently approved 2010 budget will, in the IMF’s view, entail an increase in the state deficit to about 4.5% of GDP, taking into account an expected revenue over-performance. With continued high deficits in the National Road Fund, social security system, and local governments, the general government deficit is set to increase to about 7.5% of GDP in 2010, or about 7% of GDP in cyclically-adjusted terms. Uncertainty around these projections remains high, especially with regard to the deficits of sub-national governments, whose 2009 outturn has not yet been finalised, and whose plans for 2010 can change during the year, as they are not directly under the control of the central authorities. (EC: 2010)
Rising external demand is projected to boost exports. However, this demand effect is likely to be partly offset by the impact of the appreciating currency (14% against the euro over February 2009 – February 2010), which may also stimulate imports following the large drop observed in 2009.
The country displays fairly even performance across all 12 pillars of competitiveness. Notable strengths include its large market size (21st) and high educational standards, in particular its high enrolment rates (18th). The financial sector is well developed (32nd), and the increased confidence in the banking sector (18th) has contributed to Poland’s very good performance over the past years.
Poland is ranked 72nd by the World Bank for ease of Doing Business. “As Poland transitions to the innovation-driven stage of development, it will have to focus more strongly on developing capacities in innovation and business sophistication.”
According the WEF, there are institutional problems in Poland’s Industrial framework. The quality of roads in Poland is particularly poor. And although its institutional framework has improved significantly this year, the business sector remains very critical of the efficiency of the government (103rd). Stronger clusters, more R&D orientation of companies, and intensified collaboration between universities and the private sector would help the country to move toward a more future-oriented development path.
Social Policy
The unemployment rate, according to the ILO, is 10.8% is May 2009. The highest unemployment rate was 19.9% (over the last 40 years) in 2000.
63
While it is still forecast to weigh on real disposable income and consumption, the situation of the labour market is less of a concern than initially expected. The prospects of recovery and the recent reforms that reduced labour costs and favoured adjustment of real wages, seem to be mitigating the effects of the downturn on employment. The unemployment rate is now expected to peak at about 9.4% of the labour force, instead of 10% in the autumn forecast.
Response to the GFC
Since late 2008, Poland has been hit by two shocks: the recession in high-income countries, which has hurt external demand for exports, and the global financial crisis, which has reduced capital inflows and thereby lowered domestic demand. The economic performance of the Polish economy was strong in 2009, with real GDP increasing by 1.7%. Real GDP growth remained positive throughout the year and accelerated in the last quarter of 2009, when it reached 1.2% q-o-q. This exceptional performance during the crisis reflects a constellation of favourable factors including sound fundamentals at the onset of the crisis, a well-capitalised and sound financial sector, the relatively low degree of openness of the economy, a sizeable depreciation of the Polish currency at an early stage of the crisis, the cushioning effect of real-wage adjustment on employment, and timely reactions from monetary and fiscal policies. While some of these factors are temporary in nature – with the worsening of the fiscal position the margin for supportive fiscal policy disappeared, and the exchange rate has been appreciating since the spring – most of them are set to continue to fuel growth in the coming quarters.
The Polish economy has weathered the global economic crisis well. The response of the authorities was timely and adequate The authorities have taken a number of measures, including liquidity support and bank confidence restoring measures (like adopting a EUR 10 billion repo facility at the European Central Bank and strengthening household deposit insurance), and securing a US$20.5 billion precautionary arrangement under the new IMF Flexible Credit Line (FCL). While Poland real GDP increased by 1.7% in 2009, the EU10 contracted by 3.6%, and the EU15 by 4 %. It was driven by private consumption and net exports. The IMF projects a continued recovery in domestic demand, in particular public investment; a gradual increase in real GDP growth to around 2.75% in 2010 and 3.25% in 2011; and closure of the negative output gap by 2011–12. The projection assumes a small negative contribution of the foreign balance to GDP growth, with the current account rising to around 3% of GDP in 2010–11.4.
The longer term effects of the global crisis on potential growth are also expected to be less pronounced than in other countries of the region. While it is still forecast to weigh on real disposable income and consumption, the situation of the labour market is less of a concern than initially expected. The prospects of recovery and the recent reforms that reduced labour costs and favoured adjustment of real wages seem to be mitigating the effects of the downturn on employment. The unemployment rate is now expected to peak at about 9.4% of the labour force, instead of 10% in the autumn forecast.
Social Dialogue
64
Gaining public acceptance for the cost and painful transformation from a State to a market economy required the building of a new social order based on the principles of social dialogue. Created on the basis of voluntary agreement between the government and major social partners, the Tripartite Commission for Social and Economic Affairs was belatedly established after years of popular discord as a forum to develop harmonised positions in the area of socio-economic policy (Casale & Team 1999, p.4).
The Commission’s opinions and positions were reached by consensus and were intended to guide the activities of the social partners in the relevant areas, including medium term wage growth caps per sector, national budget recommendations by social partners and modifications to social security policy (Casale & Team 1999, p.267). However, the efficacy and relevance of the Commission was undermined due to the politicisation of negotiations: all three sides had representation in Parliament (Meardi 2006, p.8). Consequently, the record of Polish tripartite negotiations is considered the poorest among usually modest Central European standards of façade tripartism, with many commentators attributing its failure to the politicisation of the concertation process (Meardi 2006, p.7). More recent attempts to draw up a new social pact have failed to move beyond the initial stage of discussion, with trade unions claiming that without direct involvement by the president, the social dialogue is ‘rhetoric devoid of real meaning’ (Towalski 2007).
Conclusion: what South Africa can learn from the five case studies?
All of the countries in the sample strived for macroeconomic stability as a basis for growth with Chile performing best on this aspect. The case of Ghana suggests however that high levels of macroeconomic stability and FDI do not necessarily lead to job creation and that special measures are needed to share growth. There is no choice between the growth and economic inclusivity growth paths for countries similar to South Africa. It is a question of how to achieve both and make the tough choices that achieve this.
South Africa needs to pay very high attention to a long-term vision and social formula to support growth and development. Given South Africa’s extremely high levels of inequality and the fact that macro-economic stability and growth do not guarantee job creation or poverty reduction, the temptations of quick fix measures will always be part of the political debate. Here Business needs to demonstrate practical leadership in demonstrating its capacity to generate growth and capture competitive opportunities that make best use of South Africa’s human resources. Lessons from Brazil are useful in this regard with social grants linked to strong education and health conditionalities.
South Africa could look to the spirit of economic patriotism that is evidenced in the high levels of partnership and collaboration between government and business evident in the cases of Brazil, Chile and Malaysia. Most of these countries had well branded long-term development strategies that took into account the complexities of their national societal development as well as a fast changing global economic order. Very special attention needs to be paid to Malaysia’s new growth path, which deals

65
with many of the issues that South Africa needs to deal with in a very direct and honest manner through its NEM.
The South African economy is service driven as in the case of Brazil, Chile and Poland and would require major structural overhaul in order to follow a manufacturing growth path as in the case of Malaysia. This would be very difficult given current low labour productivity and the low levels of socio-economic development which underpin the quality of the labour force. It would also require unprecedented focus on seizing opportunities in the global manufacturing value chain in which countries in the Far East have massive competitive advantages.
The case studies of Chile and Malaysia indicate that technological innovation and labour up skilling are critical issues in an economy that is trying to move out of the “middle income malaise” of a growth path that has soaked up its resource of cheap labour to meet low cost mass manufacturing opportunities and now needs to position a relatively expensive work force to serve a service-driven economy and sophisticated manufacturing processes. This will soon be the position that China finds itself in and has been South Africa’s position since the 1990’s.
South Africa is far more capital intensive and skill intensive than one would expect given the high rate of unemployment of unskilled labour. A contributing factor to this and, hence, to the unemployment problem is also that the small and medium enterprise (SMME) sector is not large enough and has not absorbed as much labour as it should. This is partly because of historical and new barriers to the growth and formalization of microenterprises among the black population, but requires intensive commitment from all the social partners going forward.
It is evident from the case studies (although far more research could be done on this) that the state needs to play an extremely important but varying role in the economy as a country moves through different stages of development and faces new challenges from the world economy. It is clear that there is no “one size fits all” solution to the question of what the role of the state should be in regard to at least the following levels:
o As economic leader and direction setter in the context of a world that is still largely made of nation state economies.
o As fiscal manager of the macro economy. o As rule setter for the players in the economy. o As provider of public goods including economic overhead capital and social overhead
capital. o As public service provider.
It is in relation to the word provider above that very careful thought needs to be given to the varying ways in which the state can ensure the provision of public goods and services without necessarily running the businesses that produce these goods and services. And here one notes a worldwide trend for the state to strategically position its role to achieve maximum leverage of its financial and human capacity by involving the private sector as partner in the business aspects of service delivery. This not only brings in the capital, efficiencies and innovation that market forces generate but also frees the state to focus on those things that only it can do (macro-economic stability, long term
66
vision and a social formula and economic patriotism as mentioned above) and avoids the corruption and nepotism that follow when the state is both player and referee in major sectors of the economy. Although the nature of these partnerships varied in the case studies, a strong role for the state was balanced with strong collaboration with business and a supportive labour force.
The successful countries in our case studies developed partnerships with the private sector and it is worth noting the reasons why Malaysia in particular is withdrawing from direct involvement in the economy in its new economic plan.
The lessons of incentivised poverty reduction from Brazil, Chile and Malaysia’s New Growth Plan deserve special attention. South Africa’s grant-based poverty reduction strategies are promoting short term and long-term dependence and low productivity and are placing major demands on a relatively small taxpaying population. South Africa cannot afford to deepen the dependence of the majority of its population on grants that do not seek to change behaviour and bring the vast army of the unemployed into the economy. Creative, well managed, household-specific programmes need to be designed that reduce both poverty and dependence in the long term, together with a radically revamped education system that provides a meaningful path of entry into an ever more sophisticated economy.
Finally, social dialogue has been identified as a key enabler of socio-economic delivery in all countries, other than Poland. Social dialogue at national, sectoral or firm level is mentioned as a key enabler of Malaysia’s new growth path, in Chile and Ghana’s delivery. Strategic engagement, and sometimes partnerships, with business to deliver job rich growth is evident in all the countries. In Brazil, Chile, Ghana and Malaysia there is evidence of business engagement to unblock micro-economic constraints. Engagement with organised labour is also evident in all the countries.

67
Social Dialogue Dynamics
In this chapter the benefits and role of social dialogue on Inclusive Job Rich Growth are examined, with a view to designing an engagement approach with Government and other social partners. The concept of social dialogue is advocated by the International Labour Organisation (ILO), an agency of the UN, as both a core pillar of decent work and a way of working within the ILO. The ILO has coined the concept of the ‘jobs pact’ for Government, Labour and Business to collectively respond to the global financial crisis. Social Dialogue
Social dialogue is defined by the ILO ‘to include all types of negotiation, consultation or simply exchange of information between, or among, representatives of governments, employers and workers, on issues of common interest relating to economic and social policy.
Social Pacts
Social pacts are a particular form of social dialogue that result in consensus on matters of socio-economic development between, at the least, government, labour and business. Social pacts differ depending on the political, economic, social and industrial relations culture of a specific country and are incredibly nuanced and complex, depending on the socio-economic, political, local and global context in which they are developed. There are also varied degrees of involvement by social partners at different stages of the process. There is essentially no set formula: social pacts have no standard format and could consist of a variety of instruments.
Recent significant social pacts have developed in different parts of the world. Notably, the Irish Croke Park Agreement between civil and public servants and the Government was a significant intervention in order to preserve jobs and attempt to sustain a struggling economy that has huge levels of debt. Core elements of the agreement include a complex set of compromises:
No further pay cuts for employees for duration of agreement, with an endeavour to restore pay rate cuts, with priority to lower earning employees.
Commitment to engage early.
Commitment to no redundancies during agreement.
Moratorium on recruitment and promotion. (Croke Park 2010)
Social Dialogue in South Africa
Social dialogue is a critical element of a democratic South Africa and has been instrumental in the shift to a more inclusive economy and social development post 1994. The pivotal institution of social dialogue, Nedlac was created by statute in 1994 (Nedlac Act, 1994). Nedlac consists of members who represent the interests of organised business, organised labour, organised community and development interests and the State (Nedlac Act (1994) s3(1). Included in the objectives of Nedlac

68
are to strive to promote, reach consensus and conclude agreements, encourage and promote the formulation of co-ordinated policy and consider significant changes to social and economic policy before it is implemented or introduced to parliament on the goals of economic growth, participation in economic decision-making and social equity. (Nedlac Act.(1994) s5)
Conditions for Successful Social Dialogue
Capacity for social dialogue on Inclusive Job Rich Growth is a requirement for the main social partners to engage successfully. It would be suggested that such capacity is independently constituted by each social partner, consisting of a multi-disciplinary team consisting of leadership with both social and economic skills. It is recommended that the Nedlac structures be utilised as the forum for engagement, with a specialised forum being established, similar to that on the Framework Response to the Economic Crisis. A dedicated Leadership Team should be nominated from each of the constituencies, including community. Further, it is recommended that a lead Minister be nominated by Government to chair the meetings.
A structured and proactive timetable of engagement should be established, with buy-in from the social partners, with the objective of a Social Pact on Inclusive Job Rich Growth. The process of engagement should commence with the agreement on guiding principles, both in terms of desired outcomes and operating principles. Thereafter, clear and achievable deliverables, accountability, communicating and monitoring mechanisms should be put in place. A lead ministry should be identified as accountable for monitoring. Monitoring should be scientific and with reference to existing available data.
Further, a comprehensive and targeted communications approach will be required, both collectively and independently by each social partner in order for constituencies to communicate and advocate the Social Pact.
Conditions for Successful Delivery of Socio-Economic Policies
The critical measure of success will be co-ordinated and effective delivery. Government will need to take the lead to ensure that it is aligned and capacitated in order to deliver. Social partners, will likewise need to commit to engaging and delivering on core priorities in accordance with the required outcomes. Regular monitoring and identification of areas of blockages and opportunity will be required. The reporting timetable will need to be structured and set out in advance.

69
Conclusion
This document sought to provide the theoretical framework to support BUSA position on an inclusive higher growth path. The document explored driver os future economic growthidentifying opportunities for South Africa. Further, comparative study was undertaken of countries similar to South Africa to assess different growth strategies, The last section considered social dialogue and its role in creating an environment for a higher growth path. During the process, researchers also reviewed existing scenario studies and critically reviewed proposals from Cosatu and government. These are included in annexures to this document. This information was used to developed the next chapters of this process.
References
3 Futures for South Africa. The Dinokeng Scenarios. Saturday 2nd October 2010
A Growth Path Towards Full Employment – Policy Perspectives of the Congress of South African Trade Unions (2010). Draft Discussion Document. COSATU. Available at: http://www.cosatu.org.za/docs/discussion/2010/cosatubooklet.pdf
Accelerated and Shared Growth Initiative (2005). International Labour Organisation. Pretoria. Sunday 17th October 2010
Alderson, A. & Neilson, F. (2001). Globalization and the Great U-Turn: Income Inequality Trends in 16 OECD Countries. Friday 8th October 2010
Altman, M. (2007). Employment Scenarios to 2024. Human Sciences Research Council. Thursday 14th October
An Overview of the South African Labour Market from Quarter 2 of 2009 to Quarter 2 of 2010 (2010). Development Policy Research Unit, University of Cape Town. Saturday 2nd October 2010
Annual Economic Report (2010). South African Reserve Bank. Saturday 2nd October 2010
Archer, S. (2007). The International Literature on Skill Training and the Scope for South African Application. Development Policy Research Unit, University of Cape Town. Sunday 17th October 2010
Aryeetey, E. & Baah-Boeteng, W. (2007). Growth, Investment and Employment in Ghana. Working Paper No. 80. Policy Integration Department, International Labour Office Barios, S. & Stroble, L. B. (2008). Dry Times in Africa: Rainfall and Africa's Growth Performance. Environment and Poverty Times #5 . Benjamin, P. (2009). Decent Work and Non-Standard Employees: Options for Legislative Reform in South Africa. Department of Labour. Saturday 2nd October 2010
Bhorat, H. & Oosthuizen, M. (2005). The Post-Apartheid South African Labour Market. Development Policy Research Unit, University of Cape Town. Bhorat, H. (2008). Labour Market Trend Paper. Development Policy Research Unit, University of Cape Town. Bhorat, H. (2009). Labour Reform in South Africa: Measuring Regulation and a Synthesis of Policy Suggestions. Development Policy Research Unit, University of Cape Town. Sunday 17th October 2010
70
Bhorat, H. & Oosthuizen, M. (2005). The Post-Apartheid South African Labour Market. Development Policy Research Unit, University of Cape Town. Sunday 17th October 2010
Bhorat, H. & Westhuizen, C. (2010). Poverty, Inequality and the Nature of Economic Growth in South Africa from Testing Democracy: Which is Africa Going?. IDASA
Brazil’s Presidential Election (2010). The Economist. Tuesday 12th October 2010
Budget Review (2010). National Treasury. Tuesday 12th October 2010
Business Protocol for Engaging in National Economic Development and Labour Council (NEDLAC). Saturday 2nd October 2010
BUSA Constituency Address to the NEDLAC SUMMIT (2010e). Futhi Matoba. BUSA. Available at: http://www.busa.org.za/docs/Speech%20by%20BUSA%20President%20to%20the%20Nedlac%20Annual%20Summit.pdf
BUSA Website (2010a). BUSA. Available at: http://www.busa.org.za/index.html
Business Urges G20 Partnership for Jobs Growth (2010). G20 Media Release. Saturday 2nd October 2010
Carson, M. (2010). Guiding Structural Change: the Role of Government in Development. International Labour Office. Saturday 9th October 2010
CDE Five Million Jobs (2009). Centre for Development and Enterprise & Business Leadership South Africa. Friday 8th October 2010
CDE Poverty and Inequality Executive Summary (2010). CDE Round Table. Wednesday 6th October 2010.
CDE Poverty and Inequality Report (2010). CDE Round Table. Wednesday 6th October 2010.
Cetron, M. J. & Davies, O. (2008). Trends Shaping Tomorrow's World.
Challenges Identified in the Employment Equity Act (EEA) – for Discussion and Amendment. Saturday 2nd October 2010
Coduras Martinez, A., Levie, J., Kelley, D., Saemundsson, R. & Schott, T. (2008). Global Entrepreneurship Monitor Special Report: A Global Perspective on Entrepreneurship, Education and Training. Global Entrepreneurship Monitor. Wednesday 13th October 2010
Cost of Doing Business in Middle Income Countries (2010). World Bank. Sunday 17th October 2010
Decent Work Country Programme 2010 – 2014 (2010). Government of RSA, ILO, Representative Employers’ and Workers’ Organizations & the Community Constituency. Friday 8th October 2010
Dixon, P. (2010). The Future of Outsourcing. Available at: www.globalchange.com/outsourcing.
Draft NEDLAC Report on Atypical Forms of Employment in South Africa and Labour Broking (2009). National Economic and Development Labour Council. Saturday 2nd October 2010
Draft South Africa Decent Work County Programme 2010-14 (2010). National Economic and Development Labour Council & International Labour Office. Sunday 3rd October 2010
Employment and Sustainable Enterprises: the Contribution of the African Private Sector to the G20 Debates. African Employers’ Conference, Johannesburg, 8-10 April 2010. Saturday 2nd October 2010
71
Final Recommendations of the International Panel on ASGISA (2008). Center for International Development at Harvard University. Sunday 3rd October 2010
Framework for South Africa’s Response to the International Economic Crisis (2009). Saturday 9th October 2010
Gauteng Vision 2055 (2009). Silimela Development Services.
Geldenbloem, E. & Pienaar, D. (2008). 15 Year Review: A Review of Changes in the Macro-Organisation of the State: 1994-2008. Department of Public Service and Administration. Tuesday 12th October 2010
Global Competitiveness- the Key to a Higher Inclusive Labour Absorbing Growth Path (2010d). Internal Working Document. BUSA.
Global Employment Trends (2010). International Labour Office. Saturday 2nd October 2010
Global Financial Stability Report: Sovereigns, Funding and Systemic Liquidity (2010). International Monetary Fund. Tuesday 12th October 2010
Globalization and Informal Jobs in Developing Countries (2009). International Labour Office & the Secretariat of the World Trade Organization. Sunday 3rd October 2010
Green Jobs: Towards Decent Work in a Sustainable, Low-Carbon World (2008). United Nations Environment Programme.
Guide to the New Millennium Development Goals Employment Indicators (2009). International Labour Office. Saturday 9th October 2010
Hassen, E. & Philip, K. (2008). The Review of Second Economy Programmes: An Overview for the Presidency’s 15 Year Review. Second Economy Strategy Project. Tuesday 12th October 2010
Herrington, M., Kew, J. & Kew, P. (2009). Tracking Entrepreneurship in South Africa: A GEM Perspective. Wednesday 13th October 2010
Horn, Z. (2009). No Cushion to Fall Back On: The Global Economic Crisis and Informal Workers. Inclusive Cities Study. Women in Informal Employment: Globalizing and Organizing. Friday 15th October 2010
Impact of Township Shopping Centres: Market Research Findings and Recommendations (2010). Demacon Market Studies. Saturday 16th October 2010
Industrial Policy Action Plan 2010-11 (2010). Department of Trade and Industry. Pretoria. Sunday 17th October 2010
JIPSA Annual Report 2008 (2008). International Labour Organisation. Pretoria. Sunday 17th October 2010
Joint Initiative on Priority Skills Acquisition (2007). International Labour Organisation. Pretoria. Sunday 17th October 2010
Kenworthy, L. & Kittel, B. (2002). Indicators of Social Dialogue: Concepts and Measurements. Working Paper 5. Policy Integration Department, International Labour Office. Saturday 2nd October 2010

72
Khan, A.R. (2007). Asian Experience on Growth, Employment and Poverty: An Overview with Special References to the Findings of Some Recent Case Studies. UNDP, ILO.
Leke, A., Lund, S., Roxburgh, C. & van Wamelen, A. (2010). What’s Driving Africa’s Growth? McKinsey Global Institute
Long Term Global Demographic Trends: Reshaping the Geopolitical Landscape (2001). Friday 8th October 2010
Lutz, W., Scherbov, S. & Van Aardt, C (2001). South Africa’s Uncertain Demographic Present and Future. International Institute for Applied Systems Analysis. Friday 8th October 2010
Malaysia’s New Economic Model: Executive Summary
Malemela, D. J. (2008). Health And Social Welfare Trend Paper.
Media Briefing: Industrial Policy Action Plan (2010b). BUSA. Available at: http://www.busa.org.za/pressreleases.html
Media Briefing: Global Competitiveness Must Underpin South Africa’s Economic Growth Strategy (2010c). BUSA. Available at: http://www.busa.org.za/pressreleases.html
Media Briefing: The Economic Outlook for 2010 Presentation (2009). BUSA. Available at: http://www.busa.org.za/pressreleases.html
Medium Term Strategic Framework (2009). Presidency. Pretoria.
Millennium Development Goals: County Report (2010). United Nations Development Programme. Saturday 2nd October 2010
Moving Beyond the Jobs Crisis (2010). Working Party on Employment, OECD. Saturday 2nd October 2010
Muller, C. (2003). Measuring South Africa’s Informal Sector: An Analysis of National Household Surveys. Development Policy Research Unit. University of Natal, Durban.
National Economic, Development and Council Act (1994). Saturday 2nd October 2010
Medium Term Budget Policy Statement 2010 speech by Pravin Gordhan Minister of Finance (27 Oct 2010). National Government (2010).
National Skills Development Strategy III (First Draft for Consultation) (2010). Saturday 2nd October 2010
NEDLAC Report on the Proposed Amendments to the Employment Equity Act. National Economic Development and Labour Council. Saturday 2nd October 2010
Neubacher, A. (2008). The Fragmented Future of World Trade. Der Spiegel.
Olavarria-Gambi, M. (2003). Poverty Reduction in Chile: Has Economic Growth Been Enough? Journal of Human Development, Vol. 4, No. 1
Parsons, R. (2009) Zumanomics – Which way to shared prosperity? Challenges for a new government.
Progress Report to the President of the Republic of South Africa on the Implementation of the Framework for South Africa’s Response to the International Economic Crisis (2009). Business Unity South Africa. Saturday 2nd October 2010

73
Promoting High-Level Sustainable Growth to Reduce Unemployment in Africa (2010). African Union Commission and the United Nations Economic Commission for Africa. Sunday 3rd October 2010
Proposed ILO Declaration on Social Justice for a Fair Globalization and Resolution on Strengthening the ILO’s Capacity to Assist its Members’ Efforts to Reach its Objectives in the Context of Globalization (2008). International Labour Office. Saturday 2nd October 2010
President Announces Changes to the National Executive (2010). Media Statement
Protecting People, Promoting Jobs. A survey of country employment and social protection policy responses to the global economic crisis: An ILO Report to the G20 Leaders’ Summit’ (2009). ILO Survey. Available at: http://www.ilo.org/public/libdoc/jobcrisis/download/protecting_people_promoting_jobs
Protecting People, Promoting Jobs. From crisis response to recovery and sustainable growth. Communication to G20 Leaders by ILO Director-General. Pittsburgh Summit 24-25 September 2009 (2009). ILO Communication. Available at: http://www.pittsburghsummit.gov/documents/organization/129864.pdf
Puyana, A. (2003). Economic Growth, Employment and Poverty Reduction: A Comparative Analysis of Chile and Mexico.
Quarterly Labour Force Survey, Quarter 2 2010 (2010). Statistics South Africa. Friday 8th October 2010
Quarterly Labour Force Survey, Quarter 3 2010 (2010). Statistics South Africa.
Ready to Govern:ANC Policy Guidelines (1992). ANC. Available at: http://www.anc.org.za/show.php?include=docs/pol/1992/readyto.html
Recovering From the Crisis: A Global Jobs Pact (2009). International Labour Office. Saturday 2nd October 2010
Regional Industrial Development Strategy (2006). Department of Trade and Industry. Pretoria. Sunday 17th October 2010
SA World Bank Data Profile (2010). Tuesday 12th October 2010
Schwab, K. (2010). The Global Competitiveness Report 2010-2011. World Economic Forum. Sunday 17th October 2010
See the Future: top 40 Industry Clusters in 2040 Revealed (2010). Price Waterhouse Coopers. Tuesday 5th October 2010
SETA Landscape 2011-16: Recertification and DHE&T Coordination. Department of Higher Education and Training, Republic of South Africa. Saturday 2nd October 2010
Silva, V. (2004). Health Systems – Better Ways to Identify Poor Individuals. The Programa Puente: Bridging the Gap Between the Poorest Families and Their Rights.
South Africa Now (2010). The Washington Post. Friday 15th October 2010
South Africa Scenarios 2025: The future we chose? (2008). Policy Co-ordination and Advisory Services (PCAS). Wednesday 13th October 2010

74
South Africa: Second Investment Climate Assessment Business Environment Issues Shared in Growth (2010). Saturday 2nd October 2010
Summary of Labour Relations Commission Clarification of ‘Croke Park’ Proposals (2010). Croke Park. Available at: http://www.impact.ie/iopen24/pub/crisis/agreement/clarificationbuletin.pdf
The Challenges of Growth, Employment and Social Cohesion (2010). Joint ILO-IMF conference in cooperation with the office of the Prime Minister of Norway. Sunday 3rd October 2010
The Decent Work Agenda in Africa: 2007-2015 (2007). International Labour Office. Friday 1st October 2010
The Global Competitiveness Report 2008-2009 (2008). World Economic Forum.
Transcript of a lecture on Higher Education by Professor Manuel Castells (2009). University of Cape Town. Wednesday 13th October 2010.
Tourism Impact Data Forecasting Tool (2007). World Travel and Tourism Council. Graphic Alliance.
Verick, S. (2010). Unravelling the impact of the global financial crisis on the South African labour market. Employment Working Paper No. 48. International Labour Office. Friday 1st October 2010
Wakeford, J. (2004). Productivity, Wages and Employment in South Africa’s Manufacturing Sector, 1970-2002. Development Policy Research Unit, University of Cape Town. Sunday 17th October 2010
Wall Street Journal (2010). http://online.wsj.com/article/BT-CO-20100929-711052.html
What kind of jobs? Creating opportunities for decent work – a business response (2009). Saturday 2nd October 2010
Wills, G. (2009). South Africa’s Informal Economy: A Statistical Profile. Urban Policies Research Report No. 7. Women in Informal Employment: Globalizing and Organizing. Friday 15th October 2010
World Bank: Brazil (2010). Available at: http://web.worldbank.org/WBSITE/EXTERNAL/COUNTRIES/LACEXT/BRAZILEXTN/0,,menuPK:322351~pagePK:141132~piPK:141107~theSitePK:322341,00.html
World Bank Website (2010). Available at: http://web.worldbank.org/WBSITE/EXTERNAL/COUNTRIES/AFRICAEXT/GHANAEXTN/0,,menuPK:351962~pagePK:141132~piPK:141107~theSitePK:351952,00.html
http://web.worldbank.org/WBSITE/EXTERNAL/COUNTRIES/LACEXT/CHILEEXTN/0,,contentMDK:22255176~pagePK:1497618~piPK:217854~theSitePK:325273,00.html
World Economic Outlook Update : Global Economic Slump Challenges Policies (2009). International Monetary Fund.
Zyl, K. v. (2008). Transport Trend Paper. Pretoria.

75
i IMF World Economic Outlook Database October 2010 ii Human Development Report 2009
iii International Telecommunication Union (ITU). 2009. World Telecommunication Indicators 2009. Geneva: ITU.
Available online at http://www.itu.int/ITU-D/ict/publications/world/world.html. iv Human Development Report 2009
v Human Development Report 2009
vi World Development Indicators database, World Bank, revised 9
th July 2010
vii IMF World Economic Outlook Database October 2010
viii IMF World Economic Outlook Database October 2010
ix Human Development Report 2009
x World Development Indicators database, World Bank
xi IMF World Economic Outlook Database October 2010
xii World Bank
xiii Schwab, K. (2010). The Global Competitiveness Report 2010-2011. World Economic Forum
xiv Muller, C. (2003). Measuring South Africa’s Informal Sector: An Analysis of National Household Surveys.
Development Policy Research Unit. University of Natal, Durban xv
Filho, F. (2005). Labour Legislation and the Size of the Informal Sector in Brazil. xvi
http://www.thestatesmanonline.com/pages/news_detail.php?section=7&newsid=3271 xvii
Grabowski, M. Informal Labor Market and Informal Economy During Transition: The Polish Perspective. xviii
IMF World Economic Outlook Database October 2010 xix
IMF World Economic Outlook Database October 2010 xx
CIA World Factbook xxi
Millennium Development Goals Indicators. United Nations xxii
Millennium Development Goals Indicators. United Nations xxiii
IMF World Economic Outlook Database October 2010 xxiv
http://www.newunionism.net/State_of_the_Unions.htm xxv
Doing Business IFC Indicators (2010). World Bank xxvi
Doing Business IFC Indicators (2010). World Bank xxvii
Doing Business IFC Indicators (2010). World Bank