Embed Size (px)
Citation preview
DN
HS
a
ARRA
KNSRG
1
dinPiPccs(ti[oirlTr
1d
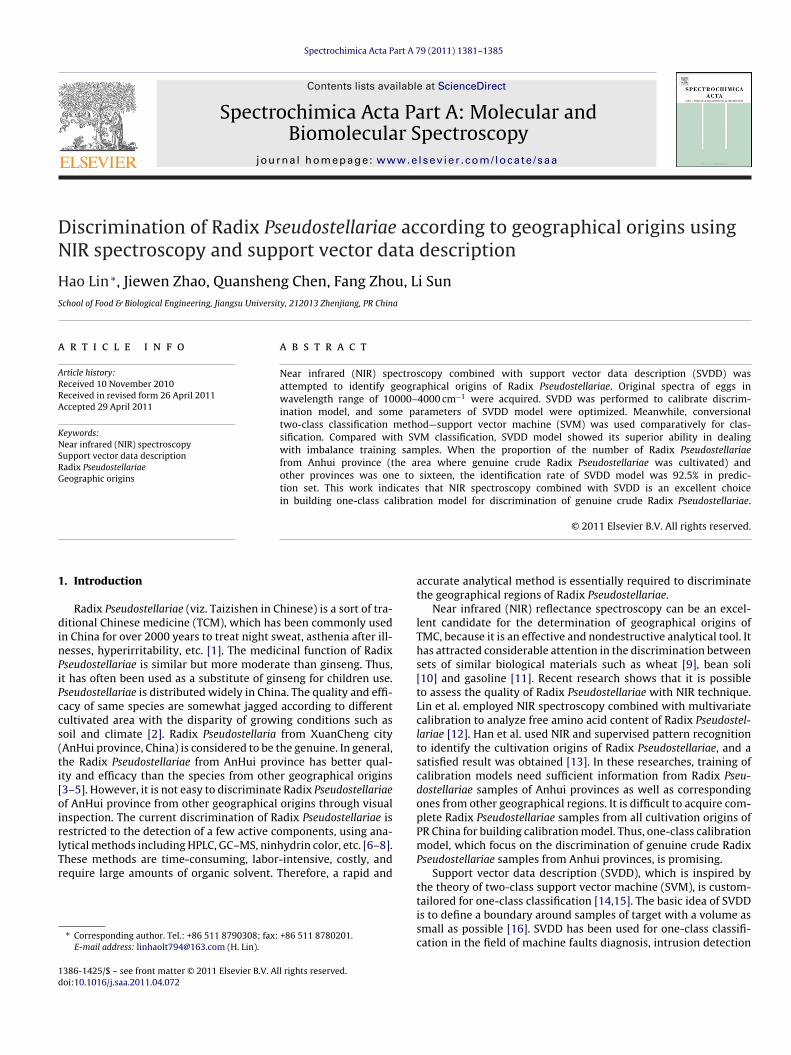
Spectrochimica Acta Part A 79 (2011) 1381– 1385
Contents lists available at ScienceDirect
Spectrochimica Acta Part A: Molecular andBiomolecular Spectroscopy
j ourna l ho me page: www.elsev ier .com/ locate /saa
iscrimination of Radix Pseudostellariae according to geographical origins usingIR spectroscopy and support vector data description
ao Lin ∗, Jiewen Zhao, Quansheng Chen, Fang Zhou, Li Sunchool of Food & Biological Engineering, Jiangsu University, 212013 Zhenjiang, PR China
r t i c l e i n f o
rticle history:eceived 10 November 2010eceived in revised form 26 April 2011ccepted 29 April 2011
eywords:ear infrared (NIR) spectroscopy
a b s t r a c t
Near infrared (NIR) spectroscopy combined with support vector data description (SVDD) wasattempted to identify geographical origins of Radix Pseudostellariae. Original spectra of eggs inwavelength range of 10000–4000 cm−1 were acquired. SVDD was performed to calibrate discrim-ination model, and some parameters of SVDD model were optimized. Meanwhile, conversionaltwo-class classification method—support vector machine (SVM) was used comparatively for clas-sification. Compared with SVM classification, SVDD model showed its superior ability in dealing
upport vector data descriptionadix Pseudostellariaeeographic origins
with imbalance training samples. When the proportion of the number of Radix Pseudostellariaefrom Anhui province (the area where genuine crude Radix Pseudostellariae was cultivated) andother provinces was one to sixteen, the identification rate of SVDD model was 92.5% in predic-tion set. This work indicates that NIR spectroscopy combined with SVDD is an excellent choicein building one-class calibration model for discrimination of genuine crude Radix Pseudostellariae.
. Introduction
Radix Pseudostellariae (viz. Taizishen in Chinese) is a sort of tra-itional Chinese medicine (TCM), which has been commonly used
n China for over 2000 years to treat night sweat, asthenia after ill-esses, hyperirritability, etc. [1]. The medicinal function of Radixseudostellariae is similar but more moderate than ginseng. Thus,t has often been used as a substitute of ginseng for children use.seudostellariae is distributed widely in China. The quality and effi-acy of same species are somewhat jagged according to differentultivated area with the disparity of growing conditions such asoil and climate [2]. Radix Pseudostellaria from XuanCheng cityAnHui province, China) is considered to be the genuine. In general,he Radix Pseudostellariae from AnHui province has better qual-ty and efficacy than the species from other geographical origins3–5]. However, it is not easy to discriminate Radix Pseudostellariaef AnHui province from other geographical origins through visualnspection. The current discrimination of Radix Pseudostellariae isestricted to the detection of a few active components, using ana-ytical methods including HPLC, GC–MS, ninhydrin color, etc. [6–8].
hese methods are time-consuming, labor-intensive, costly, andequire large amounts of organic solvent. Therefore, a rapid and∗ Corresponding author. Tel.: +86 511 8790308; fax: +86 511 8780201.E-mail address: [email protected] (H. Lin).
386-1425/$ – see front matter © 2011 Elsevier B.V. All rights reserved.oi:10.1016/j.saa.2011.04.072
© 2011 Elsevier B.V. All rights reserved.
accurate analytical method is essentially required to discriminatethe geographical regions of Radix Pseudostellariae.
Near infrared (NIR) reflectance spectroscopy can be an excel-lent candidate for the determination of geographical origins ofTMC, because it is an effective and nondestructive analytical tool. Ithas attracted considerable attention in the discrimination betweensets of similar biological materials such as wheat [9], bean soli[10] and gasoline [11]. Recent research shows that it is possibleto assess the quality of Radix Pseudostellariae with NIR technique.Lin et al. employed NIR spectroscopy combined with multivariatecalibration to analyze free amino acid content of Radix Pseudostel-lariae [12]. Han et al. used NIR and supervised pattern recognitionto identify the cultivation origins of Radix Pseudostellariae, and asatisfied result was obtained [13]. In these researches, training ofcalibration models need sufficient information from Radix Pseu-dostellariae samples of Anhui provinces as well as correspondingones from other geographical regions. It is difficult to acquire com-plete Radix Pseudostellariae samples from all cultivation origins ofPR China for building calibration model. Thus, one-class calibrationmodel, which focus on the discrimination of genuine crude RadixPseudostellariae samples from Anhui provinces, is promising.
Support vector data description (SVDD), which is inspired bythe theory of two-class support vector machine (SVM), is custom-
tailored for one-class classification [14,15]. The basic idea of SVDDis to define a boundary around samples of target with a volume assmall as possible [16]. SVDD has been used for one-class classifi-cation in the field of machine faults diagnosis, intrusion detection
1382 H. Lin et al. / Spectrochimica Acta Part A 79 (2011) 1381– 1385
Table 1Summary testing Radix Pseudostellariae samples.
Originals AnHui GuiZhou HeNan JiangSu FuJian
ie
PNdmai
2
2
fdrpssdgiuts
d1ccTp
2
tasNo1aspatwal
2
[co
Calibration set 40 40 40 40 40Prediction set 20 20 20 20 20
n the network, recognition of handwritten digits, face recognition,tc. [17–20].
This paper intends to develop a method for genuine crude Radixseudostellariae (AnHui province, China) discrimination based onIR spectroscopy technique. The algorithm of support vector dataescription (SVDD) was attempted to build a one-class calibrationodel. SVDD models were optimized according to cross-validation,
nd the performance of the final model was evaluated according todentification rates in prediction set.
. Materials and methods
.1. Sample preparation
All genuine crude Radix Pseudostellariae samples were collectedrom Xuan Cheng city of AnHui province in China. Other Radix Pseu-ostellariae samples were acquired from four different geographicalegions of PR China (‘Guizhou’ province, ‘Henan’ province, ‘Jiangsu’rovince and ‘Fujian’ province). All samples belonged to the samepecies (Pseudostellaria heterophylla), and they were already ontock within 4 months period. Total numbers of 300 Radix Pseu-ostellariae samples were used for this work, which contained 60enuine ones and 240 non-genuine ones. The samples were dividednto two subsets. One of the subsets called calibration set which wassed to build model, and the other called prediction set was used toest the robustness of model. Table 1 shows the detail of the testingamples.
Before data acquisition, all samples were dried in a forced-raught oven (Shanghai Yi-Heng Machine Co., Shanghai, China) at05 ◦C for about 5 h to remove moisture from them. After beingleaned through brushing soil off the surface, the samples wererushed into powder by a cyclone mill for consistent measuring.he particle size of powder was controlled below 80 meshes, thenut the sieved in airtight jars for further analysis.
.2. NIR spectroscopy measurement
NIR spectra were scanned on an Antaris II FT-NIR spec-rophotometer, with an integrating sphere and a standard sampleccessory (Thermo Electron Co., USA). The sample accessory is a cuppecifically designed by Thermo Electron Co. to hold samples. TheIR measurements were performed within the wavelength regionf 4000–10 000 cm−1. The data were measured with the interval of.928 cm−1, which resulted in 3112 variables. Each spectrum wasn average of 32 scanning spectra. For each Radix Pseudostellariaeample, about 1 g of the sample in the form of powder was denselyacked into the sample cup. Each sample was collected three times,nd the average of the three spectra was used as original informa-ion for following analysis. All spectra were recorded as log(1/R),here R was the relative reflectance. The temperature was kept
round 25 ◦C and the humidity remained at a steady level in theaboratory.
.3. Basic theory of SVDD
SVDD is inspired by the idea of the support vector machines21,22]. It is a method of data domain description also called one-lass classification. The basic idea of SVDD is to envelop samples orbjects within a high-dimensional space with the volume as small
Fig. 1. The sketch map in two dimensions of SVDD.
as possible by fitting a hypersphere around the samples. The sketchmap in two dimensions of SVDD is shown in Fig. 1. By introducingkernels, this inflexible model becomes much more powerful, andcan give reliable results when a suitable kernel is used [23]. Theproblem of SVDD is to find center a and radius R that has the min-imum volume of hypersphere containing all samples Xi. For a dataset containing i normal data objects, when only one or few andvery remote objects are in it, a very large sphere is obtained whichwill not represent the data very well. Therefore, we permit somedata points outside the sphere and introduce slack variable �i. As aresult, the minimization problem can be denoted in the followingform:
min L(R) = R2 + C
N∑i=1
�i,
s.t∥∥xi − a
∥∥2 ≤ R2 + �i,
�i ≥ 0(i = 1, 2, . . . , N)
⎫⎪⎪⎪⎬⎪⎪⎪⎭
(1)
where the variable C gives the trade-off between simplicity (volumeof the sphere) and the number of errors (number of target objectsrejected). The test objects x is accepted when the distance is smallerthan the radius. These objects are called the support objects of thedescription or the SVs.
In brief, SVDD firstly maps the data which cannot linearly sepa-rated into a high dimensional feature space, and then describe thedata with the maximal margin hypersphere.
2.4. Software
All algorithms were implemented in Matlab V7.0 (Mathworks,USA) under Windows XP. Result Software (Antaris II System,Thermo Electron Co., USA) was used in NIR spectral data acquisition.
3. Results and discussion
3.1. Spectra investigation
Fig. 2a presents the raw spectra of Radix Pseudostellariae sam-ples from different geographical regions. It is difficult to find specificbands in the raw NIR spectra based on geographical origins sincethere are hundreds of active ingredients in Radix Pseudostellariae.The most intensive band in the spectrum belonged to the vibra-tion of the overtone of the carbonyl group, following by the C–Hstretch and C–H deformation vibration, the –CH2, and the –CH3
overtone from the mid-infrared (MID-IR). The vibration of the car-bonyl group, the –C–H and –CH2 vibrations are caused by someingredients such as Pseudostellarinoside, Pseudostellarin, daucos-terine, Polysaccharide, free amino acid and so on.
H. Lin et al. / Spectrochimica Acta Part A 79 (2011) 1381– 1385 1383
Fig. 2. Spectra of Radix Pseudostellariae samples before (a) and after (b) SNV pre-p
amemsi[i
3
tro[l(r
l8rtfafist
rocessing.
Since the spectra are affected by the physical properties of thenalyzed products and other noises, it is necessary to performathematical processing to reduce the systematic noise and to
nhance the contribution of the chemical composition. SNV, as aathematical transformation method for spectra, is used to remove
lope variation and correct scatter effects, which has better abil-ty in correcting light scatter and also in removing slope variation24,25]. Therefore, SNV spectral preprocessing method is appliedn this research, which is presented in Fig. 2b.
.2. Principal component analysis (PCA)
The data of NIR spectra are the array of multiply variables con-aining overlapped information which bring great difficulty in theesearch. PCA makes it possible to extract useful information fromriginal spectral data by eliminating much overlapped information26,27]. It transforms the original independent variables (wave-engths) into new axes and calculates the principal componentsPCs) as new vectors. These vectors are used as latent variables toeplace the original data in developing a multivariate model.
Fig. 3 shows a three-dimensional (3D) space of Radix Pseudostel-ariae samples represented by PC1, PC2 and PC3. PC1 interprets2.21% variances, PC2 9.75%, and PC3 3.86%. Geometrical explo-ation based on PCA score plots shows the clusters trend in thehree-dimensional space, which cannot be used directly as a toolor discriminating Radix Pseudostellariae samples. Through PCA, theccumulated variance contribution rate was up to 99.3% for the top
ve PCs. In other words, top five PCs could load almost the wholepectral information. Therefore, the top five PCs were inputted intohe SVDD classifiers as latent variables.Fig. 3. Score cluster plot with top three principal components (PCs) for Radix Pseu-dostellariae samples.
3.3. Results of SVDD in discrimination genuine crude RadixPseudostellariae samples
SVDD model was build for classification of genuine crude RadixPseudostellariae (AnHui province) samples from other geographi-cal origins. Top five PCs obtained from PCA was used as the inputvectors of SVDD model. In order to obtain a good performance, theparameters of SVDD model should be optimized.
3.3.1. Parameters optimization in SVDD modelThe basic concept of SVDD is to map the original data X
nonlinearly into a higher dimensional feature space, and thetransformation is implemented by a kernel function [28]. So, theselection of kernel function has a high influence on the perfor-mance of SVDD model. Several kernel functions have been proposedfor the SVDD classifier. Not all kernel functions are equally useful.It has been demonstrated that Gaussian kernel results in tighterdescription, and gives a good performance under general smooth-ness assumptions [29]. Thus, Gaussian kernel was adopted in thispaper.
In order to obtain a good performance, the regularization param-eter C and the kernel function � have to be optimized. ParameterC determines the trade-off between minimizing the training errorand minimizing model complexity. By using Gaussian kernel, thedata description transformed from a solid hyper-sphere to a Parzendensity estimator. An appropriate selection with width parameter� of Gaussian kernel was important to the density estimation oftarget objects.
There is no systematic methodology for the optimization ofthese parameters. In this study, the procedure of optimizationwas carried out in two search steps. Firstly, a comparatively largestep length was attempted to search optimal value of parame-ters. The favorable results of the model were found with valuesof C between 0.005 and 0.1, and values of � between 1 and 10.Therefore, a much smaller step length was employed for furthersearching these parameters. In the second step, 10� values withthe step of 10 (� = 1, 2, . . ., 10) and 20C values with the step of0.005 (C = 0.005, 0.01, . . ., 1) were tested simultaneously in buildingmodel. Fig. 4 shows identification results of SVDD model influencedby values of � and C when the ratio of genuine crude samples tothe herbs from other geographical regions is one to four. The opti-
mal model was achieved when � was 2 and C was 0.05. Here, theidentification rates of genuine crude Radix Pseudostellariae sam-ples and other geographical ones were both 93.3% in prediction set.
1384 H. Lin et al. / Spectrochimica Acta P
Fa
Fb
3
ca
lfbpdatcfa
3
prdssPAmc
TD
ig. 4. Identification rates from SVDD model with different values of parameter Cnd �.
urther research found that the performance of SVDD model cannote improved by smaller search steps.
.3.2. Classification resultsIn this work, SVDD model was used to discriminate genuine
rude Radix Pseudostellariae (AnHui province) from one, two, three,nd four other geographical origins, respectively.
The results of SVDD model for genuine crude Radix Pseudostel-ariae (AnHui province) classification is shown in Table 2. Observedrom Table 2, the performance of SVDD model did not be affectedy the ratio of number Radix Pseudostellariae samples from Anhuirovince and other geographical originals. When SVDD was used toiscriminate Radix Pseudostellariae samples from AnHui provincend JiangSu province, the identification rates were 95%. Meanwhile,he identification rates were 98%, when the model was used to dis-riminate genuine crude Radix Pseudostellariae samples from thoserom other four geographical origins (e.g. JiangSu, HeNan, Gui Zhound FuJian).
.4. Comparison of discrimination models
In order to highlight the ability of SVDD in dealing with theroblem of imbalance training samples, the calibration set wasegrouped. The calibration set contained 10 genuine Radix Pseu-ostellariae samples, and different amount (10, 20, 40, 80 and 160amples) of non-genuine ones, respectively. Total number of 40amples constituted the prediction set, and both genuine Radix
seudostellariae samples and non-genuine ones had 20 samples.conventional two-class discrimination model—support vectorachine (SVM), were used comparatively to discriminate genuine
rude Radix Pseudostellariae from other geographical origins.
able 2iscrimination results of Radix Pseudostellariae samples from different geographic origin
Geographic origins Optimal parameters Classification
C � AnHui province
Ratio
One origina 0.1 1 18/20
Two originsb 0.15 2 17/20
Three originsc 0.05 2 18/20
Four originsd 0.1 1 18/20
a Jiangsu.b Jiangsu, Henan.c Jiangsu, Henan, GuiZhou.d Jiangsu, Henan, GuiZhou, FuJian.
art A 79 (2011) 1381– 1385
Table 3 shows the optimal results from SVM and SVDD mod-els with different ratios of genuine crude Radix Pseudostellariaesamples to those from other geographical origins in prediction set.When the number of genuine crude Radix Pseudostellariae samplesequaled to those from other geographic origins, SVM got better per-formance than SVDD model. However, with the ratio increasing,SVDD model showed its superior ability in dealing with imbalancetraining samples. When the ratios exceeded one to four, SVM modelwrongly recognized all the genuine crude samples were from othergeographical origins. The identification rates of the genuine andthe non-genuine from SVM model were 0% and 100%, respectively.However, in same case, the identifications rates of SVDD were 95%.When the ratio was one to sixteen, the identifications of SVDD stillremained 92.5%.
The basic concept of SVM is to map the original data X into ahigher dimensional feature space and find the ‘optimal’ hyperplaneboundary to separate two classes [30]. In SVM classification, the‘optimal’ boundary is defined as the most distant hyperplane fromboth sets, who is also called ‘middle point’ between classificationsets. This boundary is expected to be the optimal classification ofthe sets, since this boundary is the best in isolating one from twosets [31]. The margin is the minimal distance from the separatinghyperplane to the closest data points [32]. In general, when theinformation support from both positive and negative training setsis sufficient and equal, an appropriate separating hyperplane canbe obtained. However, when the samples from one class are insuf-ficient to support the separating hyperplane, the hyperplane willexcessively close to this class. As a result, most of un-known sam-ples will be recognized as the other class. Therefore, SVM got poorerperformance in discriminating Radix Pseudostellariae samples.
In general, in conventional two-class classification, the ultimatedecision function is based on sufficient information to supportfor both positive and negative training samples. Such classifica-tion would pay little attention to the minority class in buildingmodel. It is possible to obtain an inaccurate estimation of thecentroid between the two classes. Conventional two-class clas-sification always poorly describes the specific class with scarcetraining samples. Therefore, it is impractical to apply traditionaltwo-class classifier to solve the classification problem with imbal-ance number in training samples.
Differed from conventional classification-based approach, SVDDis an approach for one-class classification. It focuses mainly onnormal or target objects [33]. In this work, SVDD selected gen-uine crude Radix Pseudostellariae samples as target objects. It canhandle such a case with large or small amount of outlier objects(Radix Pseudostellariae from other geographical origins). Further-more, SVDD can adapt to the real shape of samples and find flexible
boundary with by introducing kernel function. The boundary isdescribed by a few training objects, the support vectors. It is pos-sible to replace normal inner products with kernel functions andobtain more flexible data descriptions [34]. Width parameter � cans of SVDD models in prediction set.
Other origins Total
% Ratio % Ratio %
90 20/20 100 38/40 9585 40/40 100 57/60 9590 60/60 100 78/80 97.590 80/80 100 98/100 98

H. Lin et al. / Spectrochimica Acta Part A 79 (2011) 1381– 1385 1385
Table 3Comparison results of SVM and SVDD models in discrimination authentic Radix Pseudostellariae samples in prediction set.
Geographic origins Classification results
SVM SVDD
AnHui province Other origins Total ratio AnHui province Other origins Total ratio
1:1 20/20 20/20 100% 18/20 20/20 95%1:2 17/20 16/20 81.7% 17/20 20/20 92.5%
505050
bet
4
tgowgfcfiUuf
A
P(Nsc
R
[[[
[[[[[[[[[[
[[[
[
[[[[
[
1:4 0/20 20/20
1:8 0/20 20/201:16 0/20 20/20
e set to give the desired number of support vectors. In addition,xtra data in the form of outlier objects can be helpful in improvinghe performance of SVDD model.
. Conclusion
The overall results sufficiently demonstrated that NIR spec-roscopy combined with SVDD could successfully discriminateenuine crude Radix Pseudostellariae samples from those fromther geographical origins. Conventional two class model (SVM)as also comparatively used for classification. When the ratio of
enuine crude samples to others exceeded one to four, the per-ormance of SVDD was remarkable better than SVM. It can beoncluded that SVDD is an excellent method in building one classi-cation model for identifying genuine crude Radix Pseudostellariae.sing NIR spectroscopy combined with SVDD to discriminate gen-ine crude Radix Pseudostellariae samples will have a promisinguture.
cknowledgements
This work has been financially funded by Priority Academicrogram Development of Jiangsu Higher Education InstitutionsPAPD), Key Technology R&D Program of Zhenjiang in China (Granto. NY2010019), and Natural Science Foundation of Jiangsu Univer-
ity (Grant No. 10JDG118). We also are grateful to many academicolleagues for many stimulating discussion in this work.
eferences
[1] X.Q. Xu, Q.L. Li, J.D. Yuan, Chin. J. Anal. Chem. 35 (2007) 206–210.[2] Y. Chen, M.M. Xie, Y. Yan, Anal. Chim. Acta 618 (2008) 121–130.
[
[[
% 18/20 20/20 95%% 20/20 18/20 95%% 18/20 19/20 92.5%
[3] X.P. Wang, Guangxi Plant 23 (2003) 385–390.[4] G.D. Yu, X.P. Liu, H.J. Pang, M.J. Qing, Z.N. Gong, Chin. Wild Plant Resour. 18
(1998) 9–11.[5] X.P. Wang, Guangxi Sci. 11 (2004) 363–365.[6] Y.Y. Chen, Y. Ding, W. Wang, Tsinghua Sci. Technol. 12 (2007) 389–393.[7] Q. Xu, H.F. Wang, X.Y. Zhou, Chin. Trad. Herbal Drugs 23 (2001) 799–800.[8] S.H. Li, X.H. Liu, Lishizhen Med. Res. 11 (2000) 1131–1133.[9] O. Jirsa, M. Hrusková, I. Svec, J. Food Eng. 87 (2008) 21–22.10] L. Wang, F.S.C. Lee, X.R. Wang, Y. He, Food Chem. 95 (2006) 529–536.11] R.M. Balabin, R.Z. Safieva, Fuel 87 (2008) 1096–1101.12] H. Lin, Q.S. Chen, J.W. Zhao, P. Zhou, J. Pharm. Biomed. Anal. 50 (2009) 803–
808.13] B.X. Han, N.F. Chen, Y. Yao, Pharmacogn. Mag. 20 (5) (2009) 279–286.14] D.M.J. Tax, R.P.W. Duin, Pattern Recogn. Lett. 20 (1999) 1191–1199.15] Y. Pan, J. Chen, L. Guo, Mech. Syst. Signal Process. 23 (2009) 669–681.16] S.W. Lee, J.Y. Park, S.W. Lee, Pattern Recogn. 39 (2006) 1809–1812.17] P. Podsiadlo, G.W. Stachowiak, Tribol. Int. 39 (2006) 1624–1633.18] C. Sanchez-Hernandeza, D.S. Boyd, G.M. Foody, Ecol. Inform. 2 (2007) 83–88.19] Y.H. Liu, S.H. Lin, Y.L. Hsueh, M.J. Lee, Expert Syst. Appl. 36 (2009) 1978–1998.20] H.W. Cho, Expert Syst. Appl. 36 (2009) 434–441.21] D.M.J. Tax, R.P.W. Duin, J. Mach. Learn. Res. 2 (2001) 155–173.22] D.M.J. Tax, R.P.W. Duin, Support vector data description, Mach. Learn. 54 (2004)
45–66.23] S.M. Guo, L.C. Chen, J.H.S. Tsai, Pattern Recogn. 42 (2009) 77–83.24] C. Ravna, E. Skibsted, R. Bro, J. Pharm. Biomed. Anal. 48 (2008) 554–561.25] R. Font, M.D. Río-Celestino, E. Cartea, A.D. Haro-Bailón, Phytochemistry 66
(2005) 175–185.26] R.L. Serudo, L.C. De Oliveira, J.C. Rocha, W.C. Paterlini, A.H. Rosa, H.C. Da Silva,
W.G. Botero, Geoderma 138 (2007) 229–236.27] Y. Roggo, L. Duponchel, J.P. Huvenne, Anal. Chim. Acta 477 (2003) 187–200.28] H.G. Bu, J. Wang, X.B. Huang, Eng. Appl. Artif. Intell. 22 (2009) 224–235.29] Q. Tao, G.W. Wu, J. Wang, Pattern Recogn. 38 (2005) 1071–1077.30] U. Thissen, M. Perers, B. Ustun, W.J. MELSSEN, L.M.C. Buydens, Chemom. Intell.
Lab. Syst. 73 (2004) 169–179.31] Q. Devos, C. Ruckebusch, A. Durand, L. Duponchel, J.P. Huvenne, Chemom. Intell.
Lab. Syst. 96 (2009) 27–33.
32] Q.S. Chen, J.W. Zhao, C.H. Fang, D.M. Wang, Spectrochim. Acta A 66 (2007)568–574.33] W.L. Huang, L.C. Jiao, Prog. Nat. Sci. 18 (2008) 455–461.34] G.M. Foody, A. Mathur, C. Sanchez-Hernandez, D.S. Boyd, Remote Sens. Environ.
104 (2006) 1–14.