Embed Size (px)
Citation preview

DISCOVERY l RESEARCH ARTICLE
© 2021 Discovery Scientific Society. All Rights Reserved. ISSN 2278–5469 EISSN 2278–5450 l OPEN ACCESS
Pag
e73
2
Investigation of Cassava Starch
Characteristics for Adhesive and
Integrity of Preservative
Methods
Ukpaka Chukwuemeka Peter, Gladys Nneoma Charles-
Orji, Ikenyiri Patience Nna
ABSTRACT
The research focussed on the need to preserve starch for the manufacture of
adhesives particularly for regions were sunlight or drying facility is either not
readily available or very uneconomical. Two key parameters were investigated
during preservation, the viscosity and the microbial formation. The method
involved the local extraction of two (2) starch species, two (2) each from primary
starch sources of Cassava (TMS82/00058 and TMS 30001). Sulphuric acid (H2SO4)
and Sodium Chloride (NaCl) were used as the acidic and alkaline preservatives
respectively. The various starch samples were preserved in different
concentrations of 0.1M, 0.3M, 0.5M, 0.7M, 0.9M, 1.0M for both preservatives and
for a period of three (3) months. Starch samples in distilled water were used as
control samples for all the two (2) starch species to check the effectiveness,
degradation or enhancement of the acidic and alkaline preservatives. The
viscosity of the preserved starch samples was measured at intervals of one (1)
month throughout the period of the three (3) months. The viscosities were
compared with those of the control sample. It was observed that the starch
viscosities varied with the starch specie, for the control samples, with those
samples in acidic and alkaline medium for the initial measurement. The samples
were investigated for microbial growth over the duration of preservation and
result showed that all control samples had microbial formation over the
preservation periods. It was also significantly observed that the viscosity of the
starch is affected by the presence of the preservatives at different levels of
concentrations. Another significant observation was the variation of viscosity
over preservation period for the same concentration of preservative for the starch
species. The preservation was significantly effective for the 1.0M concentration of
H2SO4 for all starch species since there was no microbe formation. For the cassava
starch CV1, specie designated as when preserved in 1.0M H2SO4 concentration,
however the alkaline preservation had reduction in viscosity over time. 5th order
polynomial was used to fit the viscosity data for the prediction of viscosity from
preservative concentration over time. The R2 values for the predictive models
were in the range of 0.98-1.0 indicating a high goodness of fit. The error
estimation between the predicted and measured value were below 3.0%.
Significantly, based on viscosity enhancement and non-microbial formations,
majority of the investigated starch species can be preserved over a period of three
DISCOVERY 57(311), November, 2021
To Cite:
Ukpaka CP, Gladys NCO, Ikenyiri PN. Investigation of cassava
starch characteristics for adhesive and integrity of preservative
methods. Discovery, 2021, 57(311), 732-748
Author Affiliation:
Department of Chemical/Petrochemical Engineering, Rivers State
University Port Harcourt, PMB 5080, Rivers State, Nigeria
Corresponding author:
Department of Chemical/Petrochemical Engineering, Rivers State
University Port Harcourt, PMB 5080, Rivers State, Nigeria
E-mail:[email protected]
Peer-Review History
Received: 29 August 2021
Reviewed & Revised: 30/August/2021 to 06/October/2021
Accepted: 09 October 2021
Published: November 2021
Peer-Review Model
External peer-review was done through double-blind method.
© 2021 Discovery Scientific Society. This work is licensed under a
Creative Commons Attribution 4.0 International License.
DISCOVERY SCIENTIFIC SOCIETY

DISCOVERY l RESEARCH ARTICLE
© 2021 Discovery Scientific Society. All Rights Reserved. ISSN 2278–5469 EISSN 2278–5450 l OPEN ACCESS
Pag
e73
3
months before use for adhesive production with 1.0M concentration of acidic (H2SO4) and alkaline (NaCl) preservatives.
Key words: Investigation, cassava starch, characteristics, adhesive, integrity, preservative methods
1. INTRODUCTION
As there continues a rise in environmental concerns about the industrial wastes generated from petroleum products and the
potential consequences from most industrial activities, the use of natural, biodegradable, and renewable materials and substances
has become more attractive. Starch is one of the most promising raw materials to produce biodegradable adhesives. Adhesives
industries have grown and demand for starch adhesives has increased drastically, which has led developing countries like Nigeria
to depend on locally sourced starchy materials for adhesive production [1-4]. But there is major drawback in the use of starch. This
is the stability of the product over time. Starch usually degrades and discolour due to microbial attack, resulting to poor quality of
starch [5].
Local farmers are discouraged from producing starch due to lack of equipment such as dryers for proper preservation of starch.
So, they end up washing away starch residue that is produced during cassava processing [6]. Therefore, there is need to investigate
the effect of preservatives on starch paste as a measure to determine the best and cheapest method to preserve starch paste for a
long time and still retain its properties for production of goods like adhesive [7-10].
The aim of this study is to investigate the effect of acidic and alkaline preservative mediums on starch paste obtained from
varieties of cassava for the production of adhesives. The aim of this study will be achieved or actualized by the following objectives
which are to: Determine the mode of extraction of starch from Cassava, analysis and packaging of the starch produced, preparation
and application of different concentrations of the preservative agents on the produced starch, investigate the pH level at which the
starch is being preserved starch to determine microbial survival rate, viscosity analyses for 3months of preservation period at
1month interval as the viscosity is the key parameter to determine good quality starch and determine which starch variety would
withstand the preservative agents when used to produce adhesive.
This study covers the production of starch from various species of cassava, potatoes and corn, the preservation of the starch pastes
with acidic and alkaline mediums preservative for production of stable adhesive in future, monitoring the pH of preserved starch,
and comparing the effect of the preservative concentration on the viscosity.
As the major drawback in the use of starch for adhesive and other products, is the stability of the product over time, this research
will help to achieve the prolonged preservation of starch while still maintaining the desired properties of starch for a stable
adhesive. This study will benefit local farmers especially cassava processors as it tends to improve their knowledge on easy
preservation of starch paste and encourage them to go into adhesive production.
The significance of the study is attributed to the importance of viscosity as key property for determining quality of starch used for
adhesive. The viscosity of the preserved starch was determined to ensure satisfactory quality of starch. The monitoring of the pH of
the preserved starch is significant to monitor the rate of microbial growth.
2. MATERIALS AND METHODS
The experiments were performed at the Unit Operations Laboratory of the Department of Chemical/Petrochemical Engineering,
Rivers State University of Science and Technology, Port-Harcourt.
Materials
Plant Materials: The different varieties of starchy crops are gotten from the Rivers State Agricultural Development Program (ADP)
research farm in Port Harcourt. Table 1 below below specify the starch sources and the varieties.
Table 1: Species of Starch Sources used for Investigation
s/no Starch source Species
A Tubers
1 Cassava(10kg each) CV1-TMS82/00058 CV2-TMS 30001
Instruments/Equipment used:1000g digital weighing balance, 50ml and250ml glass Pyrex Beakers, 50ml glass Pyrex measuring
cylinder and 1000ml plastic Pyrex measuring cylinder, Spatula, Funnel, 360oC Pyrex Thermometer,30ml Pyrex Pycnometer, Pyrex

DISCOVERY l RESEARCH ARTICLE
© 2021 Discovery Scientific Society. All Rights Reserved. ISSN 2278–5469 EISSN 2278–5450 l OPEN ACCESS
Pag
e73
4
crucible, DHG-9140A Drying Oven,pH-618 RoHpHmeter with Mettler Toledo technical Buffer Solution, Gerhardt hot plate and
NDJ-8S Digital Display Viscometer.
Chemical/Reagents: The two categories of preservative reagent used are the acidic and alkaline medium. For the acidic medium,
Analar Concentrated sulphuric acid (H2SO4) was used and for the alkaline medium, Dangote table salt (Concentrated Sodium
Chloride (NaCl)) was used. Distilled water (H2O) was used as a control preservative to serve as a base for comparative analysis to
determine the impacts of preservatives on starch species. Table 2 below specifies the preservative reagents used.
Table 2: Preservative Reagents
Acidic Preservative Alkaline Preservative Control
190ml Conc. H2SO4 205g Conc. NaCl 1000ml distilled H2O (12portions)
Method of Experiment
This research has to do with chemical Extraction process. Extraction is the process of separating one or more components from a
liquid mixture as the required component dissolves out with or without the aid of a solvent. The experimental procedure began
with the extraction of the raw starch from the different species of starch sources. The exact processes are explained in detail below.
Another vital aspect is the preparation of the reagents used as preservatives.
Extraction of Starch
For this study, starch was extracted from 2 different varieties each of starchy Tubers-Cassava. The basic unit operations involved in
the extraction of starch from tuber crops are highlighted in Figure 1.
Starch Extraction from Tubers
Figure 1: Flow Diagram for Starch Extraction from Tubers (Cassava).
Cassava Starch Extraction
The Cassava starches were extracted as described in the research conducted by Ukpaka et al [11]. The fresh tubers of cassava
speciesTMS82/00058(CV1) were washed with water to remove sand and dirt. The outer layers of the cassava tubers were peeled
manually with a knife. The peeled cassava tubers were washed again with clean tap water to clean it from dirt. These were then
grated with a grating machine. A large amount of water was added to the grated cassava and mixed thoroughly. The mixture was
sieved using a cloth sieve and the filtrate was allowed for sedimentation for 6hours in a bucket, after which the raw starch settles at
the bottom of the bucket and the water above the starch is decanted. The sediment starch was washed two times with clean water to
obtain a pure white starch. The starch was collected and put in a cloth bag and squeezed to remove extra water. The starch was then
weighed and put in covered plates to be mixed with the preservatives. This process is repeated for all the tubers; cassava species
TMS 30001(CV2).
Preparation of Reagents
The procedure for calculating and preparation of the reagents described by Ukpaka,et al. [11] was adapted. The reagents were
chosen paying attention to what the preserved starch will be used for (whether edible or contact with the skin) as well as not
influencing the properties of the preserved starch and the room temperature at which the starch would be preserved. The reagents
were prepared in different concentrations for the acidic medium and the alkaline medium. This is to determine what concentration
will best preserve the starch.
Natural Starch Decantation Sedimentation
Sieve washing Peeling, washing, grinding Tubers

DISCOVERY l RESEARCH ARTICLE
© 2021 Discovery Scientific Society. All Rights Reserved. ISSN 2278–5469 EISSN 2278–5450 l OPEN ACCESS
Pag
e73
5
Calculation for Portions of H2SO4 used to prepare the Acidic Preservatives.
The molarity and dilution equations were used to calculate the amount of H2SO4used to prepare the required preservative
concentration. Molarity (M), also known as the molar concentration of a solution is the amount of a substance in a certain volume of
solution. Molarity is defined as the moles of a solute per litres of a solution (moles of solute / litres of solution).
Also given is the Assay also known as purity. This is a measure of the composition and quality of a chemical substance. Molarity
can then be calculated giving the assay with the formula below.
(1)
Where
Assay is the average value of the actual concentration of the undiluted acid as seen on the bottle. and
.
Preparation of various Portions of Sulphuric acid (H2SO4)
From the calculations shown in appendix for H2SO4 the following were obtained.
5.4ml of concentrated sulphuric acid was measured into a volumetric flask containing 1000ml of distilled water to form 0.1M of
(H2SO4) acid.
16.3mls of (H2SO4) was measured into 1000ml of distilled H2O to form 0.3M of (H2SO4).
27.1mls of (H2SO4) was measured to 1000ml of distilled H2Oto form 0.5M of (H2SO4).
37.97ml of H2SO4 was mixed with 1000ml of distilled water to form 0.7M of (H2SO4).
48.82ml of H2SO4 was mixed with 1000ml of distilled water to form 0.9M of (H2SO4).
54ml of H2SO4 was mixed with 1000ml of distilled water to form 1.0M of (H2SO4).
Calculation for Portions of NaCl used to prepare the Alkaline Preservative
The molarity and Dilution equations are also used to determine the mass of NaCl needed to prepare the various concentrations of
the alkaline preservative. The equation is given as:
(2)
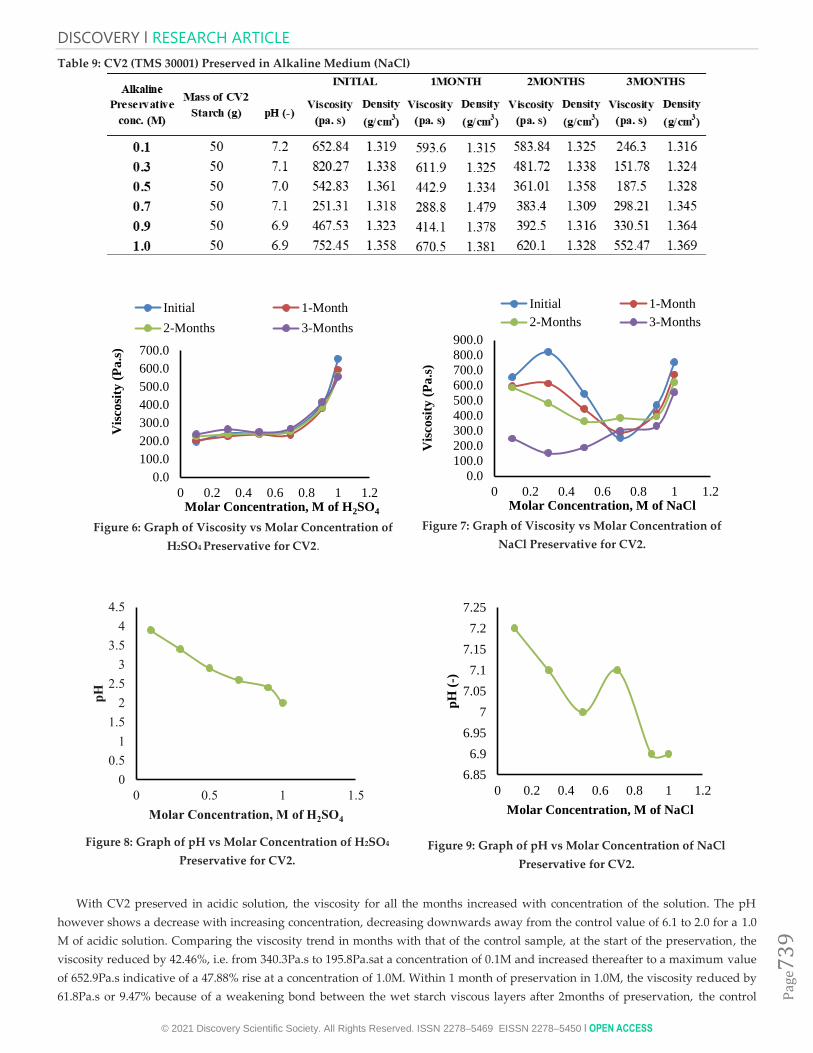
Converting moles to the mass needed we have;
(3)
Where n is the number of moles, m is the mass of NaCl needed, M is the molar mass of NaCl
C, V is concentration and volume respectively
Preparation of Various Portions of NaCl Salt
From the calculations shown in appendix D for NaCl the following were obtained.
i. 5.8g of NaCl dissolved in 1000ml of distilled H2O to form0.1M of NaCl.
ii. 17.5g of NaCl dissolved in 1000ml of distilled H2O to form 0.3M of NaCl.
iii. 29.2g of NaCl dissolved in 1000ml of distilled H2O to form 0.5M of NaCl.
iv. 40.9g of NaCl dissolved in 1000ml of distilled H2O to form 0.7M of NaCl.
v. 52.6g of NaCl dissolved in 1000ml of distilled H2O to form 0.9M of NaCl.
vi. 58.4g of NaCl dissolved in 1000ml of distilled H2O to form 1.0M of NaCl.
Preservation of Starch
The starch was preserved in a ratio of 1:1 for the starch and the preservative reagents. 50g of CV1-TMS82/00058 was weighed and
put in different containers. 50mls of 0.1M of H2SO4 was measured and mixed properly with the starch to form a paste. This was
labelled CV1Ap0.1M. This was repeated for other concentrations of the acidic medium and alkaline medium preservative agents. This
was then repeated for other varieties of the starch. The containers were labelled according to the different starch produced and the
different concentrations of acid medium preservative as (AP) and alkaline medium preservative medium as (SP). A total of 78
samples were collected for this research and labelled as follows:

DISCOVERY l RESEARCH ARTICLE
© 2021 Discovery Scientific Society. All Rights Reserved. ISSN 2278–5469 EISSN 2278–5450 l OPEN ACCESS
Pag
e73
6
CV1Ap0.1M, CV1Ap0.3M, CV1Ap0.5M, CV1Ap0.7M, CV1Ap0.9M, CV1Ap1.0M for CV1(TMS82/00058) preserved with AP(H2SO4).
CV1Sp0.1M, CV1Sp0.3M, CV1Sp0.5M, CV1Sp0.7M, CV1Sp0.9M, CV1Sp1.0Mfor CV1 (TMS82/00058) preserved with SP (NaCl).
CV2Ap0.1M–CV2Ap1.0M for CV2(TMS 30001) preserved with AP(H2SO4).
CV2Sp0.1M – CV2Sp1.0M for CV2(TMS 30001) preserved with SP(NaCl).
3. RESULTS AND DISCUSSION
Effect of Starch Preservative on Viscosity, pH, and Density
The effect of the preservative types on the various starch species are explicitly presented and discussed in the forgoing sections. The
properties investigated include the viscosity, the pH, the Density as well as the physical nature of the starch paste over the duration
of preservation. The six varieties were treated with the two different types of diluted concentrations of the preservatives for
duration of 3months. The viscosity and density properties were measured after intervals of 1month for a period of three months. As
benchmark samples, the properties of the starch paste (starch: water ratio of 1:1, 50g) without Alkaline or Acidic preservatives were
also measured for the different starch species for a period of 3 months at the interval of 1 month. These properties were compared
with samples with preservatives to see the extent of decay or viscosity enhancement as well as the microbial formations over the
period under investigation.
The results are presented in Table 3.
Table 3: Viscosity, Density and pH of the Benchmark Samples (Water Preservative)
Table 4: Identification and Characterization of Microbes Grown in Preserved Starch Paste
SAMPLE MACROSCOPY MICROSCOPY IDENTIFIED ORGANISM
CV1AP0.1M Same as above Same as above 1.Alternaria Sp.
2.Aspergillus Niger.
CV1AP0.3M White fluffy growth with
yellow reverse.
Septate branding hyphae,
with banana shape conidia
same as above
1.Fusarium Sp.
2.Alternaria Sp.
CV1AP0.5M Brown colony growth with
white periphery and yellow
reverse.
Septet hyphae, columnar
conidia, head spores.
1. Aspergillus Tereus.
2. Aspergillus Niger.
3. Yeast Sp.
CV1SP0.9M Same as above Same as above 1. Aspergillus Niger
CV1AP1.0M No growth No growth No growth
CV1Water Milk colour growth. Colloid cells. 1. Yeast Sp.
Table 5: Microbial Count in some of the Samples
Mass of
Starch and
water (g);
ratio (1:1)
(1:1)
CVI 50 5.9 315.9 1.386 315.7 1.364 341.8 1.345 367.7 1.365
CV2 50 6.1 340.3 1.365 328.3 1.353 358.3 1.352 377.6 1.352
PT1 50 5.2 425.5 1.327 374.7 1.349 339.15 1.322 252.8 1.343
PT2 50 5.4 397.5 1.07 327.6 1.267 322.6 1.093 246.5 1.152
CO1 50 5.5 170.7 1.357 164.9 1.366 171.8 1.324 217.8 1.352
CO2 50 4.3 158.2 1.266 161.5 1.287 172.4 1.284 196.3 1.276
Viscosity
(pa. s)
Density
(g/cm3)
INITIAL
Starch Type
1MONTH 2MONTHS 3MONTHS
pH (-)Viscosity
(pa. s)
Density
(g/cm3)
Viscosity
(pa. s)
Density
(g/cm3)
Viscosity
(pa. s)
Density
(g/cm3)
Preserved Starch Sample Colony Forming Units
CV1AP0.1M 0.4*105
CV1AP0.3M 0.02*105
CV1AP0.5M 0.4*105
CV1SP0.9M 0.7*105
CV1 Water 25.9*105

DISCOVERY l RESEARCH ARTICLE
© 2021 Discovery Scientific Society. All Rights Reserved. ISSN 2278–5469 EISSN 2278–5450 l OPEN ACCESS
Pag
e73
7
Effect of Preservative Agents on CV1 (TMS82/00058)
Table 6 and 7 shows the result for the cassava starch group CV1 (TMS82/00058) when preserved using acidic (H2SO4) and alkaline
(NaCl) preservatives respectively. The variation in viscosity as shown in Figure 2 and 3 with the pH for the various concentrations
are captured in Figures 4 and 5 for acidic and alkaline preservatives respectively.
Table 6: CV1 (TMS82/00058) Preserved in Acidic Medium (H2SO4)
Table 7: CV1 (TMS82/00058) Preserved in Alkaline Medium (NaCl)
Figure 2: Graph of Viscosity vs Molar Concentration for
H2SO4 Preservative for CV1.
Figure 3: Graph of Viscosity vs Molar Concentration of NaCl
Preservative for CV1.
0.1 50 3.5 179.3 1.366 196.8 1.347 230.6 1.352 256.5 1.348
0.3 50 3.3 185.4 1.427 199.9 1.400 240.0 1.408 294.6 1.399
0.5 50 2.5 222.7 1.328 231.6 1.406 249.9 1.415 277.1 1.400
0.7 50 2.3 260.0 1.449 236.5 1.342 259.9 1.432 259.6 1.220
0.9 50 2.2 445.9 1.333 407.0 1.324 399.4 1.315 422.6 1.311
1.0 50 2.1 631.8 1.321 571.9 1.256 538.9 1.387 585.2 1.245
Mass of CV1
Starch (g) Density
(g/cm3)
Acidic
Preservative
conc. (M)
1MONTH 2MONTHS 3MONTHS
pH (-)Viscosity
(pa. s)
Density
(g/cm3)
Viscosity
(pa. s)
Density
(g/cm3)
Viscosity
(pa. s)
Viscosity
(pa. s)
Density
(g/cm3)
INITIAL
0.1 50 3.9 195.8 1.348 201.8 1.286 224.68 1.298 235.82 1.287
0.3 50 3.4 240.7 1.427 224.6 1.293 237.24 1.372 265.34 1.292
0.5 50 2.9 243.8 1.320 237.1 1.339 240.12 1.473 249.26 1.333
0.7 50 2.6 260.3 1.360 233.6 1.512 253.21 1.365 268.78 1.375
0.9 50 2.4 407.5 1.425 381.3 1.396 384.46 1.372 415.26 1.382
1.0 50 2.0 652.9 1.388 591.1 1.296 557.21 1.275 553.01 1.285
Mass of CV2
Starch (g)
Acidic
Preservative
conc. (M)
1MONTH 2MONTHS 3MONTHS
pH (-)Viscosity
(pa. s)
Density
(g/cm3)
Viscosity
(pa. s)
Density
(g/cm3)
Viscosity
(pa. s)
Density
(g/cm3)
Viscosity
(pa. s)
Density
(g/cm3)
INITIAL
0.0
100.0
200.0
300.0
400.0
500.0
600.0
700.0
0 0.2 0.4 0.6 0.8 1 1.2
Vis
cosi
ty (
Pa.s
)
Molar Concentration, M of H2SO4
Initial 1-Month2-Months 3-Months
0.0100.0200.0300.0400.0500.0600.0700.0800.0900.0
0 0.2 0.4 0.6 0.8 1 1.2
Vis
co
sity
(P
a.s
)
Molar Concentration, M of NaCl
Initial 1-Month
CV1AP1.0M No growth
CV2AP1.0M No growth

DISCOVERY l RESEARCH ARTICLE
© 2021 Discovery Scientific Society. All Rights Reserved. ISSN 2278–5469 EISSN 2278–5450 l OPEN ACCESS
Pag
e73
8
Figure 4: Graph of pH vs Molar Concentration of H2SO4
Preservative for CV1.
Figure 5: Graph of pH vs Molar Concentration of NaCl
Preservative for CV1.
When preserved in acidic solution, the viscosities for all the months are seen to averagely vary in the upward direction with
increasing concentration of the solution. The pH however shows a decrease with increasing concentration showing it is acidic as it
decreases downwards away from the control value of 5.9 to 2,1 for a 1.0M of acidic solution. A comparative analysis with the initial
viscosity showed that the viscosity reduced from 315. 9Pa.sto179.3 (43.24% drop) on preserving with a concentration of 0.1M and
this is in line with observations from (Emblem et al. 2012) and increased thereafter peaking at 631.8Pa.sindicative of a 50% rise at a
concentration of 1.0M which is ten(10) times higher than 0.1M. During the second month of preservation, the control viscosity
increased to 341.8Pa.s showing a gain in 25.9Pa.s (7.36%). This is due to the increase in the coagulation resulting from the time of
preservation. Similar behaviour was observed at the 3rd month where the control viscosity of 367.7Pa.s reduced to 256.5Pa.s at0.1M
concentration and peaked at 585.2Pa.s with the 1.0M concentration. Uniquely for all the months of preservation, the control
viscosities though initially diminishing as the concentration increased were restored from 0.7M.and peaked at 1.0M. Comparing the
viscosity preservation and the microbial growth rate, although the viscosity values are generally good from 0.7M, there were
microbial formations on the samples for all cases except for the concentration of 1.0M of preservative concentration. It is thus
pertinent to conclude that the cassava starch specie CV1 is best preserved both in viscosity and usable form when the concentration
of the acidic preservative (H2SO4) is 1.0M for at least a minimum of 3months before usage.
The same conclusion is adduced for the alkaline preservative as well looking at the preserved values of the viscosities of 694.2,
604.4, 552.6 and 523.45Pa.s for initial condition, months 1, 2, and 3 respectively at alkaline concentration of 1.0M as no microbial
growth was observed.
Effect of Preservative Agents on CV2 (TMS 30001)
The results obtained for the cassava starch specie CV2 (TMS 30001) are shown in Tables 8 and 9, and the graphical representations
of the viscosity and the pH for the preservative concentrations used are captured in figures 4.6 to 4.9. From the observed trends, the
behaviour of the CV1 is very similar to that of CV2 because of the common primary source which is cassava.
Table 8: CV2 (TMS 30001) Preserved in Acidic Medium (H2SO4)
6.8
6.9
7
7.1
7.2
7.3
7.4
7.5
7.6
0 0.2 0.4 0.6 0.8 1 1.2
pH
(-)
Molar Concentration, M of NaCl
0.1 50 3.9 195.8 1.348 201.8 1.286 224.68 1.298 235.82 1.287
0.3 50 3.4 240.7 1.427 224.6 1.293 237.24 1.372 265.34 1.292
0.5 50 2.9 243.8 1.320 237.1 1.339 240.12 1.473 249.26 1.333
0.7 50 2.6 260.3 1.360 233.6 1.512 253.21 1.365 268.78 1.375
0.9 50 2.4 407.5 1.425 381.3 1.396 384.46 1.372 415.26 1.382
1.0 50 2.0 652.9 1.388 591.1 1.296 557.21 1.275 553.01 1.285
Mass of CV2
Starch (g)
Acidic
Preservative
conc. (M)
1MONTH 2MONTHS 3MONTHS
pH (-)Viscosity
(pa. s)
Density
(g/cm3)
Viscosity
(pa. s)
Density
(g/cm3)
Viscosity
(pa. s)
Density
(g/cm3)
Viscosity
(pa. s)
Density
(g/cm3)
INITIAL
DISCOVERY l RESEARCH ARTICLE
© 2021 Discovery Scientific Society. All Rights Reserved. ISSN 2278–5469 EISSN 2278–5450 l OPEN ACCESS
Pag
e73
9
Table 9: CV2 (TMS 30001) Preserved in Alkaline Medium (NaCl)
Figure 6: Graph of Viscosity vs Molar Concentration of
H2SO4 Preservative for CV2.
Figure 7: Graph of Viscosity vs Molar Concentration of
NaCl Preservative for CV2.
Figure 8: Graph of pH vs Molar Concentration of H2SO4
Preservative for CV2.
Figure 9: Graph of pH vs Molar Concentration of NaCl
Preservative for CV2.
With CV2 preserved in acidic solution, the viscosity for all the months increased with concentration of the solution. The pH
however shows a decrease with increasing concentration, decreasing downwards away from the control value of 6.1 to 2.0 for a 1.0
M of acidic solution. Comparing the viscosity trend in months with that of the control sample, at the start of the preservation, the
viscosity reduced by 42.46%, i.e. from 340.3Pa.s to 195.8Pa.sat a concentration of 0.1M and increased thereafter to a maximum value
of 652.9Pa.s indicative of a 47.88% rise at a concentration of 1.0M. Within 1 month of preservation in 1.0M, the viscosity reduced by
61.8Pa.s or 9.47% because of a weakening bond between the wet starch viscous layers after 2months of preservation, the control
0.0
100.0
200.0
300.0
400.0
500.0
600.0
700.0
0 0.2 0.4 0.6 0.8 1 1.2
Vis
cosi
ty (
Pa
.s)
Molar Concentration, M of H2SO4
Initial 1-Month
2-Months 3-Months
0.0
100.0
200.0
300.0
400.0
500.0
600.0
700.0
800.0
900.0
0 0.2 0.4 0.6 0.8 1 1.2
Vis
cosi
ty (
Pa
.s)
Molar Concentration, M of NaCl
Initial 1-Month
2-Months 3-Months
6.85
6.9
6.95
7
7.05
7.1
7.15
7.2
7.25
0 0.2 0.4 0.6 0.8 1 1.2
pH
(-)
Molar Concentration, M of NaCl

DISCOVERY l RESEARCH ARTICLE
© 2021 Discovery Scientific Society. All Rights Reserved. ISSN 2278–5469 EISSN 2278–5450 l OPEN ACCESS
Pag
e74
0
viscosity was observed to be 18Pa.shigher which translates to a 52.89% gain. Similar behaviour was observed at the 3 rd month where
the control viscosity of 377.6Pa.s reduced to 268.78Pa.s at 0.7M concentration and then increased to 553.01Pa.s when preserved in
1.0M concentration. Generally, throughout the 3 months of preservation studied, the control viscosities diminished initially as the
concentration increased and started rising from 0.7M and peaked at 1.0M. Again, comparing the preservation of viscosity and the
usability based on microbial growth rate, the viscosity values are generally adjudged good from 0.7M. However, there were
microbial formations on the samples for all cases except for the concentration of 1.0M of preservative concentration. It is then
important to suggest that the wet cassava starch specie CV2 can be preserved for a period of 3months both in viscosity and usable
form when the concentration of the acidic preservative (H2SO4) is 1.0M.
The same conclusion is adduced for the alkaline preservative as well looking at the preserved values of the viscosities of 752.45,
670.5, 620.1 and 552.47Pa.s for initial condition, one, two and three months respectively at alkaline concentration of 1.0M since no
microbial growth was observed as well. At this concentration, the viscosities in alkaline preservative are richer compared to those of
acidic concentration by 15.25%, 11.84% and 11.29% for initial or start of preservation, after month 1 and month 2 respectively.
However, during the 3rd month of preservation the values are approximately the same showing a small difference of -0.098%.
4. CONCLUSION
The research focussed on the need to preserve starch for the purpose of using it for the manufacture of adhesives particularly for
regions where sunlight or drying facility is either not readily available or very expensive. Amidst other starch properties, two key
parameters were investigated to determine the quality of starch before and after preservation. These include the viscosity; which is
the key parameter to determine the quality of starch and the microbial analysis; to determine the level of microbial formation after
preservation. The method involved the use of two different starch species from each of the primary sources which are different
species of cassava. Two preservative media were used; the acidic medium is a sulphuric acid (H2SO4) and the alkaline medium is
sodium chloride (NaCl) with different concentrations. This is to determine what concentration will best preserve the starch. The
concentrations are 0.1M, 0.3M, 0.5M, 0.7M, 0.9M, 1.0M concentrations of H2SO4 and NaCl solutions. Distilled water without acidic
or alkaline preservative was used as control or benchmark in order to check the effectiveness, degradation or enhancement of the
viscosity of the preserved starch. The viscosity is measured for all the different starch samples for a period of 3 months at the
interval of 1 month and compared using the control sample as benchmark. Conclusively, the following observations were recorded
thus:
1. The viscosity trend showed variation amongst the different starch types. This could be due to the difference in molecular weight
of the amylose portion and the ratio of amylose to amylopectin as reported by Anahita, [12]. As seen for the cassava starch (CV1
and CV2) maintained a viscosity that appeared enhanced over time ranging from 315.9 Pa.s (initial viscosity) to 367.7 Pa.s (@
month 3). However, the microbial analysis showed that the samples were not significantly preserved due to microbial
formations found on them after the period of preservation, which is similar to the result obtained by Lee [13].This moved on to
see how the viscosities were affected at the addition of the acidic and alkaline preservatives.
2. A 43.24% drop in viscosity was recorded at the addition of 0.1Mconcentration of the acidic preservative to the cassava starch
CV1 (TMS82/00058), compared with the benchmark CV1 sample (from315.9Pa.s to 179.3Pa.s).The pH however showed a decline
with concentration value of 5.9 to 2.1 for 1.0M concentration, which shows it is acidic. Uniquely for all the months of
preservation, the viscosities showed initial diminishing which was restored as concentration increased to 0.7M and peaked at
631.8Pa.s for1.0M concentration showing 50%. Increase. Comparing the viscosity preservation and the microbial growth rate,
although the viscosity values are generally good from 0.7M, there were microbial formations on the samples for all cases except
for the 1.0M concentration of the acidic preservative. It is thus pertinent to conclude that the cassava starch specie CV1 is best
preserved both in viscosity and usable form with1.0M concentration of the acidic preservative (H2SO4) for at least a minimum of
3months before usage. The same conclusion is drawn for the alkaline preservative with good viscosities ranging from 694.2,
604.4, 552.6 to 523.45Pa.s for initial condition, months 1, 2, and 3 respectively at alkaline concentration of 1.0M with no microbial
growth observed. The behaviour of the cassava starch CV1 (TMS82/00058) preserved in acidic concentrations are similar to those
observed for the cassava starch CV2 (TMS 30001). This could be because they of the common primary starch source which is
cassava.
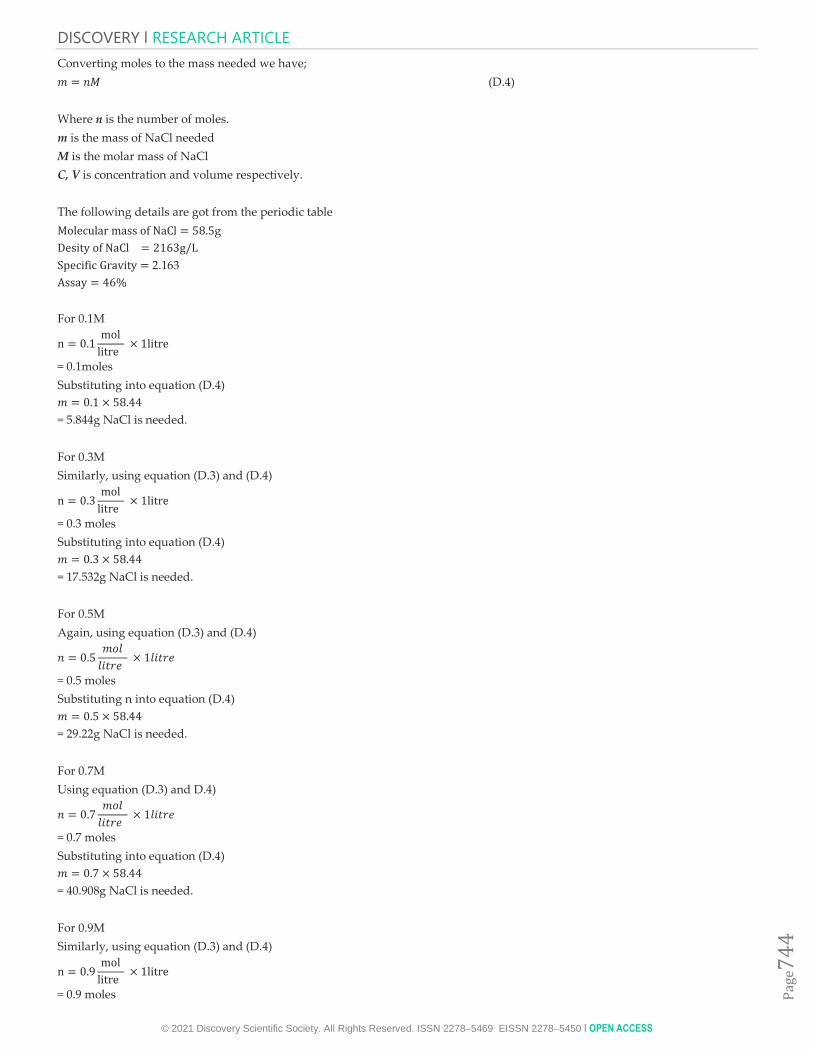
3. Mathematical Models for Predicting Viscosity and Concentration for Starch Preservation were developed using the regression
analysis with a polynomial model. The R2 value was monitored for best fit which led to the predominant use of the 5th order
polynomial.The R2 values for the models range from 0.98 to 1, indicating the goodness of the polynomial fit for the data used.
The models are validated simply from the measured values of the data. These models are also useful for the determination of

DISCOVERY l RESEARCH ARTICLE
© 2021 Discovery Scientific Society. All Rights Reserved. ISSN 2278–5469 EISSN 2278–5450 l OPEN ACCESS
Pag
e74
1
the viscosity of the sample for any expected duration by linearly interpolating in between periods as detail description is
demonstrated in the appendix.
Appendix
Starch Sources
(a) Cassava (TMS82/00058)
(b) (TMS30001)
Starch Extraction Process
(a) Grinding of Peeled Cassava
(b) Ground Cassava in abag
(c) Sieve Washing
(d) Decantation

DISCOVERY l RESEARCH ARTICLE
© 2021 Discovery Scientific Society. All Rights Reserved. ISSN 2278–5469 EISSN 2278–5450 l OPEN ACCESS
Pag
e74
2
(e) Natural White Starch
(f) Sedimentation
Appendix C
Extracted Starch Sample Preparation and Treatment
(a )Researcher in the Lab Mixing Samples
(b )Packed Samples (Starch +Preservation)
(c)Preserved Starch Samples ready for Measurement
(d)Gelatinized Starch in Beakers
(e ) Insufficiently Dried Starch attacked by Moulds
( f) Sample under a Viscometer
Manual Calculations for Preparation of Reagents
D1: Calculation for Portions of H2SO4 used to prepare the Acidic Preservative.
The equation below was used to determine the volume of H2SO4 needed to prepare the preservative. Equation (D.2) below
demonstrates the dilution equation
(D.1)
So that
(D.2)

DISCOVERY l RESEARCH ARTICLE
© 2021 Discovery Scientific Society. All Rights Reserved. ISSN 2278–5469 EISSN 2278–5450 l OPEN ACCESS
Pag
e74
3
Where,
concentration of the concentrated acid (M)
= Volume of needed to prepare the diluted solution.
= Concentration of the diluted solution (0.1M, 0.3M, 0.5M, 0.7M, 0.9M and 1.0M respectively).
= Total Volume of the solution (1000ml)
Given the following details from the periodic table
Substituting these values into equation (3.1), the molar concentration of H2SO4 will be as follows:
18.437mole/litre is the molar concentration of the undiluted H2SO4.
Substituting values into equation (D.2), we have
For 0.1M
5.4ml of H2SO4 is needed to prepare 0.1M of H2SO4 preservative
For 0.3M
For 0.5M
For 0.7M
For 0.9M
For 1.0M
D2: Calculation for Portions of NaCl used to prepare the Alkaline Preservative
The equation below was used to determine the amount of NaCl needed to prepare the preservative.
(D.3)
DISCOVERY l RESEARCH ARTICLE
© 2021 Discovery Scientific Society. All Rights Reserved. ISSN 2278–5469 EISSN 2278–5450 l OPEN ACCESS
Pag
e74
4
Converting moles to the mass needed we have;
(D.4)
Where n is the number of moles.
m is the mass of NaCl needed
M is the molar mass of NaCl
C, V is concentration and volume respectively.
The following details are got from the periodic table
g
2.163
For 0.1M
= 0.1moles
Substituting into equation (D.4)
= 5.844g NaCl is needed.
For 0.3M
Similarly, using equation (D.3) and (D.4)
= 0.3 moles
Substituting into equation (D.4)
= 17.532g NaCl is needed.
For 0.5M
Again, using equation (D.3) and (D.4)
= 0.5 moles
Substituting n into equation (D.4)
= 29.22g NaCl is needed.
For 0.7M
Using equation (D.3) and D.4)
= 0.7 moles
Substituting into equation (D.4)
= 40.908g NaCl is needed.
For 0.9M
Similarly, using equation (D.3) and (D.4)
= 0.9 moles

DISCOVERY l RESEARCH ARTICLE
© 2021 Discovery Scientific Society. All Rights Reserved. ISSN 2278–5469 EISSN 2278–5450 l OPEN ACCESS
Pag
e74
5
Substituting into equation (D.4)
= 52.596g NaCl is needed.
For 1.0M:
Using equation (D.3) and D.4)
= 1.0 moles
Substituting into equation (D.4)
= 58.44g NaCl is needed.
Data Sheet for Cassava
Table for Viscosity Predictive Models for Casava Starch Specie CV1
Month
Mathematical model,
Viscosity (y0, y1, y2 and y3);
Concentration (x)
Error based on zero conc.(x=0)
prediction
Error based on 1.0M conc.(x=1.0)
prediction
Measured/Predicted % Error Measured/Predicted % Error
CV1 in H2SO4
0
y0 = -6735.1x5 + 21746x4 -
24086x3 + 11703x2 - 2312.2x +
315.79
R² = 1
315.9/315.79 12.13 631.8 -0.06
1 y1= -7145.8x5 + 22491x4 -
24261x3 + 11304x2 - 2132.2x + 315.7/316.59 -0.24 0.12
IDViscosity (kg/ms)
or m2/sID
Viscosity (kg/ms)
or m2/s
1 0.1 CV1Ap1-0.1 CV2Ap1-0.1
2 0.3 CV1Ap1-0.3 CV2Ap1-0.3
3 0.5 CV1Ap1-0.5 CV2Ap1-0.5
4 0.7 CV1Ap1-0.7 CV2Ap1-0.7
5 0.9 CV1Ap1-0.9 CV2Ap1-0.9
6 1 CV1Ap1-1.0 CV2Ap1-1.0
7 0.1 CV1Sp1-0.1 CV2Sp1-0.1
8 0.3 CV1Sp1-0.3 CV2Sp1-0.3
9 0.5 CV1Sp1-0.5 CV2Sp1-0.5
10 0.7 CV1Sp1-0.7 CV2Sp1-0.7
11 0.9 CV1Sp1-0.9 CV2Sp1-0.9
12 1 CV1Sp1-1.0 CV2Sp1-1.0
13 NeutralDistilled
H2OCV1-water CV2-water
Salt NaCl
Acid H2SO4
Type Concentration (M)
CV1 CV2
s/no
Preservative STARCH - Casava (CV)

DISCOVERY l RESEARCH ARTICLE
© 2021 Discovery Scientific Society. All Rights Reserved. ISSN 2278–5469 EISSN 2278–5450 l OPEN ACCESS
Pag
e74
6
316.59
R² = 0.9993
2
y2= -7136.1x5 + 21762x4 -
22913x3 + 10420x2 - 1936.1x +
341.54
R² = 0.9999
341.8/341.54 7.34 -0.10
3
y3 = -11201x5 + 32474x4 -
32243x3 + 13319x2 - 2130.7x +
367.1
R² = 0.9996
367.7/367.1 15.55 0.03
CV1 in NaCl
0
y0 = -13049x5 + 28518x4 -
11795x3 - 7824.9x2 + 4529.7x
+ 318.86
R² = 0.997
315.9/318.86 11.60 6.85
1
y1 = 5319.7x5 - 17921x4 +
26554x3 - 18152x2 + 4493.4x +
314.64
R² = 0.9992
315.7/314.64 -9.01 2.98
2
y2 = 23600x5 - 65653x4 +
68052x3 - 30832x2 + 5044.1x +
332.94
R² = 0.9192
341.8/332.94 -4.67 557.21 -2.36
3
y3 = 15166x5 - 33422x4 +
23182x3 - 3655.9x2 - 1114.4x
+ 363.71
R² = 0.9869
367.7/363.71 10.46 553.01 -6.08
Table for Viscosity Predictive Models for Casava Starch Specie CV2
Month
Mathematical model,
Viscosity (y0, y1, y2 and
y3); Concentration (x)
Error based on zero conc.(x=0)
prediction
Error based on 1.0M conc.(x=1.0)
prediction
Measured/Predicted % Error Measured/Predicted % Error
CV2 in H2SO4
0
y0 = -6018.2x5 + 22036x4 -
26025x3 + 12698x2 -
2377.7x + 337.67
R² = 0.9955
340.3/337.67 -11.15
1
y1 = -5976.3x5 + 20987x4 -
24157x3 + 11582x2 -
2173.9x + 327.58
R² = 0.9995
328.3/327.58 -8.36
2
y2 = -6384.4x5 + 21040x4 -
23510x3 + 11249x2 -
2195.5x + 356.94 (R² =
0.998)
358.3/356.94 -5.05
3 y3 = -11146x5 + 32006x4 - 377.6/375.7 -2.17 553.01/552.1 -0.16
DISCOVERY l RESEARCH ARTICLE
© 2021 Discovery Scientific Society. All Rights Reserved. ISSN 2278–5469 EISSN 2278–5450 l OPEN ACCESS
Pag
e74
7
32119x3 + 13880x2 -
2444.6x + 375.7 (R² =
0.9958)
CV2 in NaCl
0
y0 = -13190x5 + 32066x4 -
18596x3 - 3431.4x2 +
3563.8x + 341.91 (R² =
0.9991)
340.3/341.91 -14.37 752.45/754.31 0.25
1
y1 = 6821x5 - 18638x4 +
23722x3 - 15486x2 +
3923.4x + 329.91
R² = 0.9982
328.3/329.91 -8.92 670.5/672.31 0.27
2
y2 = 26244x5 - 68952x4 +
67102x3 - 28747x2 +
4615.8x + 355.88
(R² = 0.9922)
358.3/355.88 -11.01 630.1/618.68 -1.81
3
y3 = 14033x5 - 30075x4 +
20088x3 - 2804.8x2 -
1066.4x + 373.
(R² = 0.9878)
377.6/373.9 2.93 552.47/548.7 -0.68
Funding
This study has not received any external funding.
Declaration of conflicting interests
The authors declare that there are no conflicts of interests.
Data and materials availability
All data associated with this study are present in the paper.
REFERENCES AND NOTES
1. Amani, G. G., Kamenan, A., Rolland-Sabaté, A. & Colonna.
2004. Stability of Yam Starch Gels During Processing,
African Journal of Biotechnology, 4 (1), 94-101.
2. Akhabue, C. E., Ebewele, R.O. & Oyedoh E.A. (2009).Effects
of Preservative Agents on Cassava Starch Adhesives,
Advanced Materials Research. 10(5), 62-64.
3. Mooney, B. P. (2009). The Second Green Revolution?
Production of Plant-based Biodegradable
Plastics. Biochemical Journal, 418(2), 219-232.
4. Bajpai, P. (2018), Corrugated Containers, Biermann's
Handbook of Pulp and Paper 2(3), 273-281.
5. Brunnschweiler, J., Luethi, D., Handschin, S., Farah, Z.,
Escher, F., & Conde‐Petit, B. (2005). Isolation,
Physicochemical Characterization and Application of Yam
(Dioscorea spp.) Starch as Thickening and Gelling
Agent. Starch‐Stärke, 57(3‐4), 107-117.
6. Neelam K., Vijay S. & Lalit S. (2012), Various techniques for
the modification of starch and the applications of its
derivatives. International research journal of pharmacy, 3(5), 25-
31.
7. Kushairi, M. S., Rokiah, H., Othman N. S., Salim H., Wan, N.
A., Norani, A. K., Nadiah, J & Lily Z. P. A. (2015),
Evaluation of properties of starch-based adhesives and
particleboard manufactured from them, Journal of Adhesion
Science and Technology, 29(4)319-336.
8. Karama, L. B.,Grossmanna, M. V. E., Rui, S.S.F.S., Cristina,
F.& Zaritzky, N. E.(2005), Gel Textural Characteristics of
Corn, Cassava and Yam Starch Blends, J. Starch/Starke.57,
62–70.
9. Peter O. O., Ajisegiri, E. S. A, IDAH P. A. (2007) ‘Production
of Adhesives from Cassava’Leonardo Electronic Journal of
Practices and Technologies. 10, 93-98.

DISCOVERY l RESEARCH ARTICLE
© 2021 Discovery Scientific Society. All Rights Reserved. ISSN 2278–5469 EISSN 2278–5450 l OPEN ACCESS
Pag
e74
8
10. Uchendu, N. O., Eze, S.O.O., Ugwu, O. P.C.,Enechi, O.C.
&Udeh, S. M.C. (2013), Characterization of Different
Varieties of Cassava Starch for Industrial Utilization.
IJRRPAS. 3(3), 370-386.
11. Ukpaka, C.P., Amadi, S.A. & Gumus, R.H. (2009),
Experimental Analysis of the Effect of Preservative Methods
of Cassava Starch for Adhesives. Global Journal of Engineering
and Technology. 2, 623-634.
12. Anahita N., Jim W. & Marc A. D.(2020). Using Lignin to
Modify Starch-Based Adhesive Performance. Journal of
Chemical Engineering, 4(3), 1-11.
13. Lee J., Park J. & Lee S., (2006), Effect of Starch and Base
Paper Properties an Adhesion Problem of Corrugated
Board, Journal of Korea Technical Association of the Pulp and
Paper Industry. (38)