Embed Size (px)
Citation preview
Discovering and Exploring Mandelbrot Set Points with a Graphing CalculatorAuthor(s): Roger FordSource: The Mathematics Teacher, Vol. 98, No. 1 (AUGUST 2004), pp. 38-46Published by: National Council of Teachers of MathematicsStable URL: http://www.jstor.org/stable/27971613 .
Accessed: 26/04/2014 05:45
Your use of the JSTOR archive indicates your acceptance of the Terms & Conditions of Use, available at .http://www.jstor.org/page/info/about/policies/terms.jsp
.JSTOR is a not-for-profit service that helps scholars, researchers, and students discover, use, and build upon a wide range ofcontent in a trusted digital archive. We use information technology and tools to increase productivity and facilitate new formsof scholarship. For more information about JSTOR, please contact [email protected].
.
National Council of Teachers of Mathematics is collaborating with JSTOR to digitize, preserve and extendaccess to The Mathematics Teacher.
http://www.jstor.org
This content downloaded from 143.167.204.167 on Sat, 26 Apr 2014 05:45:16 AMAll use subject to JSTOR Terms and Conditions
AWffJ5lnts Roger Ford
Discovering and Exploring
Mandelbrot Set Points
with a Graphing Calculator
The Mandelbrot set is one of the most beautiful and complicated objects in all of mathematics. The border of the set is infinite; no matter
how many times you magnify the set, dazzling new
images appear. Mandelbrot's discovery of the set and his subsequent work on fractals and recursive func
tions would not have been possible without the aid of the computer. Although the mathematics behind the Mandelbrot set is simple, creating the Mandelbrot set images involves millions of calculations.
Mandelbrot's genius allowed him to see in these wild
images a tool that helps explain many complex processes and problems in mathematics and science.
Because of Mandelbrot's work, advances have been
made in medicine, chaos theory, digital picture com
pression, and in modeling natural processes.
Technology has empowered students and mathe maticians to solve problems and understand them
This department is designed to provide in reproducible formats activities for stu
dents in grades 7-12. The material may be reproduced by classroom teachers for use in their own classes. Readers who have developed successful classroom activ
ities are encouraged to submit manuscripts, in a format similar to the "Activities"
already published, to the journal editor for review. Of particular interest are activi
ties focusing on the Council's curriculum standards, its expanded concept of basic
skills, problem solving and applications, and the uses of calculators and computers. Please send submissions to "Activities," Mathematics Teacher, 1906 Association
Drive, Reston, VA 20191; or send electronic submissions to [email protected].
Edited by Gene Potter Haze I wood West High School (retired) Hazelwood, MO 63031
in new ways. Using the graphing calculator to dis cover and explore the Mandelbrot set allows stu dents to see the mathematics behind a great mathe matical discovery and to see how valuable technolo
gy can be in solving and understanding problems.
background The Mandelbrot set is a set that consists of some of the points in the complex-number plane (the Argand plane). The points in the Mandelbrot set are determined by using a recursive formula.
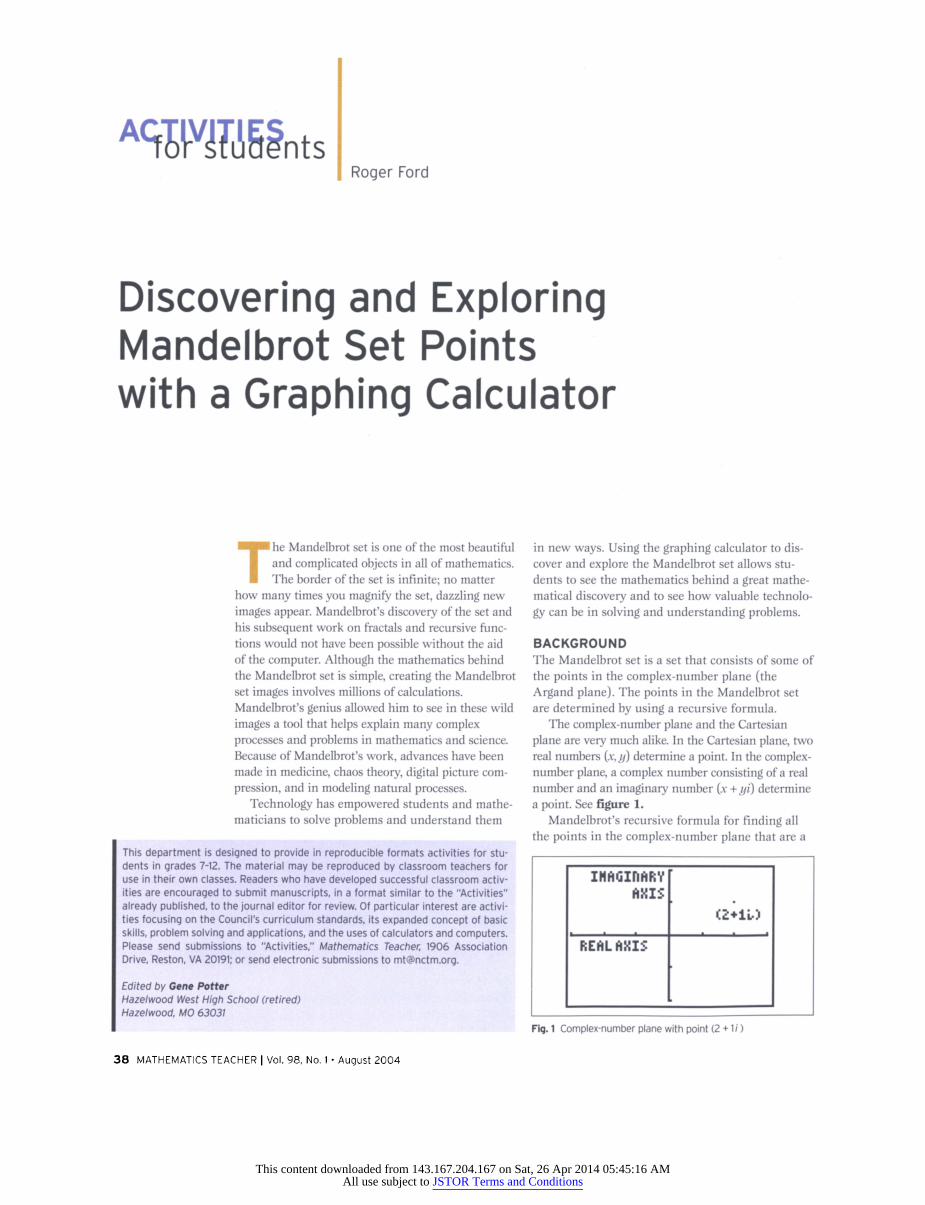
The complex-number plane and the Cartesian
plane are very much alike. In the Cartesian plane, two
real numbers {x,y) determine a point. In the complex number plane, a complex number consisting of a real
number and an imaginary number (x determine a point. See figure 1.
Mandelbrot's recursive formula for finding all the points in the complex-number plane that are a
ihagmary
F;EhLh!-:i;
Fig. 1 Complex-number plane with point (2 +1 / )
38 MATHEMATICS TEACHER | Vol. 98, No. 1 ? August 2004
This content downloaded from 143.167.204.167 on Sat, 26 Apr 2014 05:45:16 AMAll use subject to JSTOR Terms and Conditions
part of the Mandelbrot set starts by testing the
point Z0. This point's coordinates are squared, and the coordinates of the original point are added to create a new point Zx. For example, let our original point Z0 be -0.4 + 0.3/. Then
Zi = (Z0)2 + Z0,
Zx = (-0.4 + 0.3i)2 + -0.4 + 0.3/ = 0.07 - 0.24/ + -0.4 + 0.3/ = -0.33 + 0.06/.
From this point forward, the formula for finding the next new point or iteration point (Zj follows the
general formula Zn = {Zn_x)2 + Z0. For example, the
original point (Z0) and iteration points Z2 and Z3 are
computed as follows:
Z2 =(Z1)2 + Z0 = (-0.33 + 0.06/)2 + -0.4 + 0.3/ = -0.2947 + 0.2604/;
Z3 = (Z2)2 + Z0
= (-0.2947 + 0.2604?)2 + -0.4 + 0.3/ = -0.38096007 + 0.14652024/
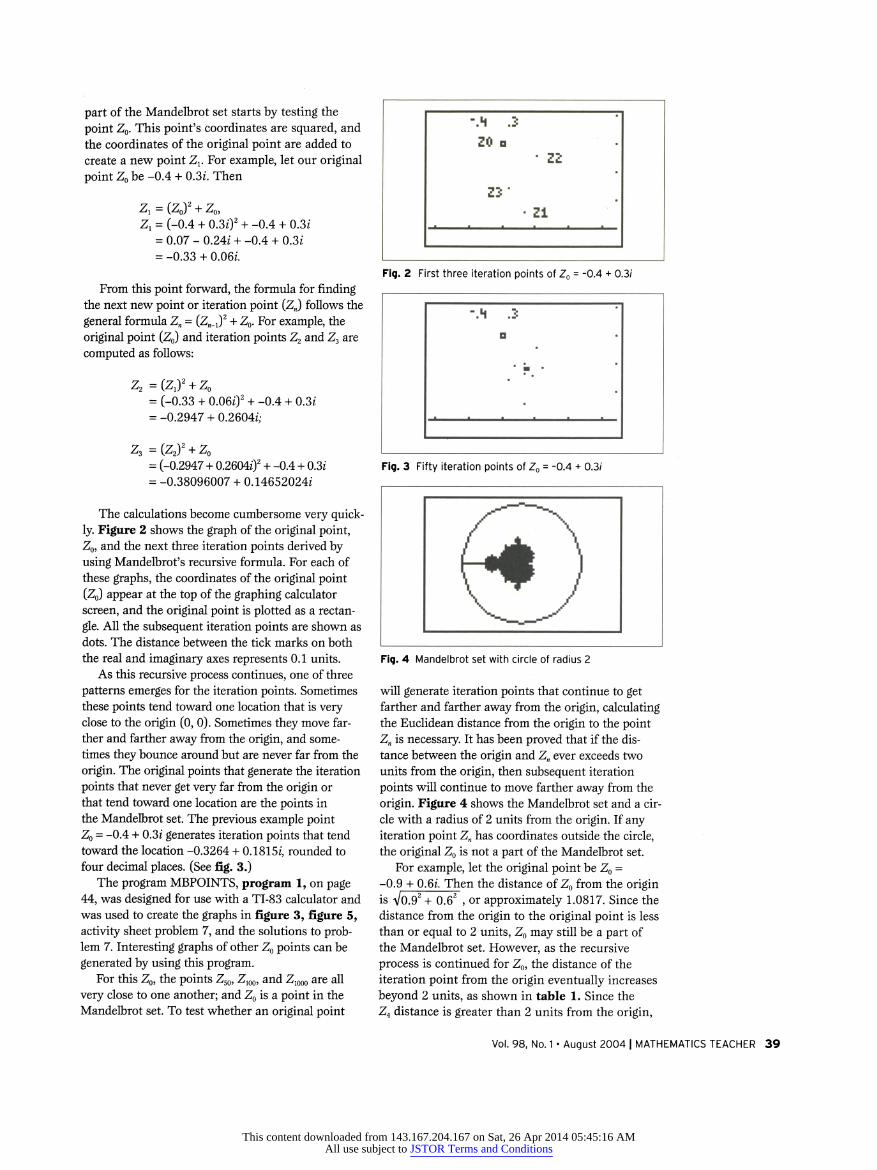
The calculations become cumbersome very quick ly. Figure 2 shows the graph of the original point, Z0, and the next three iteration points derived by using Mandelbrot's recursive formula. For each of these graphs, the coordinates of the original point (Z0) appear at the top of the graphing calculator
screen, and the original point is plotted as a rectan
gle. All the subsequent iteration points are shown as dots. The distance between the tick marks on both the real and imaginary axes represents 0.1 units.
As this recursive process continues, one of three
patterns emerges for the iteration points. Sometimes these points tend toward one location that is very close to the origin (0, 0). Sometimes they move far ther and farther away from the origin, and some times they bounce around but are never far from the
origin. The original points that generate the iteration
points that never get very far from the origin or that tend toward one location are the points in the Mandelbrot set. The previous example point Z0 = -0.4 + 0.3/ generates iteration points that tend toward the location -0.3264 + 0.1815/, rounded to four decimal places. (See fig. 3.)
The program MBPOINTS, program 1, on page 44, was designed for use with a TI-83 calculator and was used to create the graphs in figure 3, figure 5, activity sheet problem 7, and the solutions to prob lem 7. Interesting graphs of other Z0 points can be
generated by using this program. For this Z0, the points Z50, Z100, and Z1000 are all
very close to one another; and Z0 is a point in the Mandelbrot set. To test whether an original point
Z0 a Z2
Zi
Fig. 2 First three iteration points of Z0 = -0.4 + 0.3/
Fig. 3 Fifty iteration points of Z0 = -0.4 + 0.3/
Fig. 4 Mandelbrot set with circle of radius 2
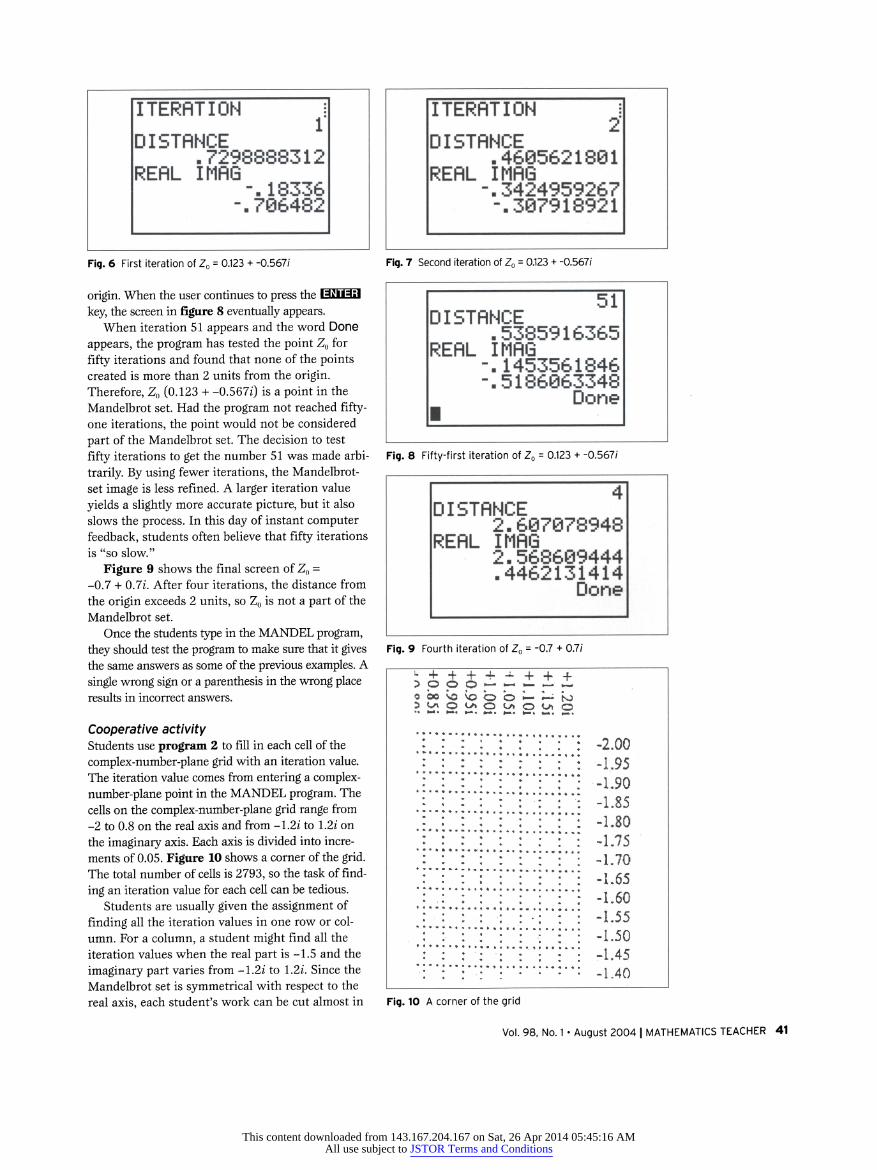
will generate iteration points that continue to get farther and farther away from the origin, calculating the Euclidean distance from the origin to the point Zn is necessary. It has been proved that if the dis tance between the origin and Zn ever exceeds two units from the origin, then subsequent iteration
points will continue to move farther away from the
origin. Figure 4 shows the Mandelbrot set and a cir cle with a radius of 2 units from the origin. If any iteration point Zn has coordinates outside the circle, the original Z0 is not a part of the Mandelbrot set.
For example, let the original point be Z0 =
-0.9 + 0.6/. Then the distance of Z0 from the origin is Vo.92 + 0.62 , or approximately 1.0817. Since the distance from the origin to the original point is less than or equal to 2 units, Z0 may still be a part of the Mandelbrot set. However, as the recursive
process is continued for Z0, the distance of the iteration point from the origin eventually increases
beyond 2 units, as shown in table 1. Since the
Z4 distance is greater than 2 units from the origin,
Vol. 98, No. 1 ? August 2004 | MATHEMATICS TEACHER 39
This content downloaded from 143.167.204.167 on Sat, 26 Apr 2014 05:45:16 AMAll use subject to JSTOR Terms and Conditions
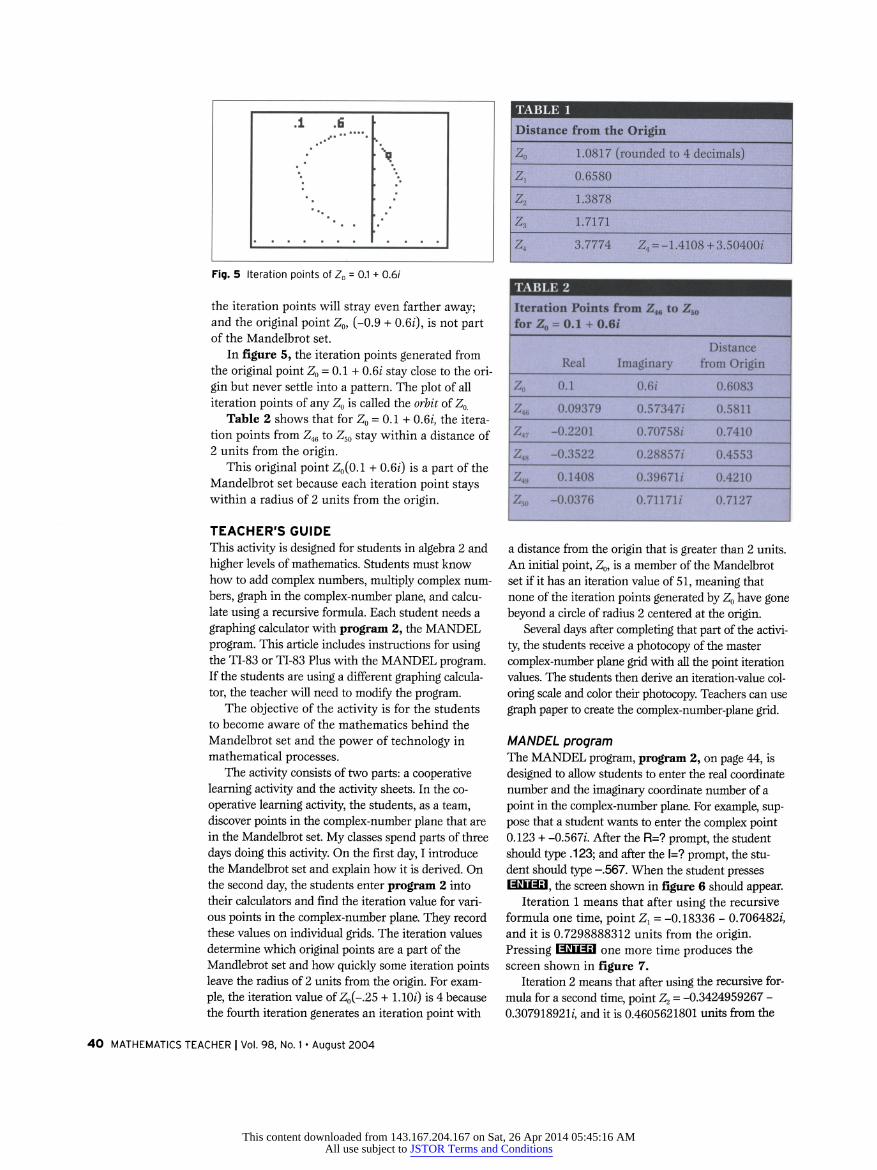
Fig. 5 Iteration points of Z0 = 0.1 + 0.6/
the Iteration points will stray even farther away; and the original point Z0, (-0.9 + 0.6/), is not part of the Mandelbrot set.
In figure 5, the iteration points generated from the original point Z0 = 0.1 + 0.6/ stay close to the ori
gin but never settle into a pattern. The plot of all iteration points of any Z0 is called the orbit of Z0
Table 2 shows that for Z0 = 0.1 + 0.6i, the itera tion points from Z46 to Z50 stay within a distance of 2 units from the origin.
This original point Z0(0.1 + 0.6/) is a part of the Mandelbrot set because each iteration point stays within a radius of 2 units from the origin.
TEACHER'S GUIDE This activity is designed for students in algebra 2 and
higher levels of mathematics. Students must know how to add complex numbers, multiply complex num
bers, graph in the complex-number plane, and calcu late using a recursive formula. Each student needs a
graphing calculator with program 2, the MANDEL
program. This article includes instructions for using the TI-83 or TI-83 Plus with the MANDEL program. If the students are using a different graphing calcula
tor, the teacher will need to modify the program. The objective of the activity is for the students
to become aware of the mathematics behind the Mandelbrot set and the power of technology in mathematical processes.
The activity consists of two parts: a cooperative learning activity and the activity sheets. In the co
operative learning activity, the students, as a team, discover points in the complex-number plane that are in the Mandelbrot set. My classes spend parts of three
days doing this activity. On the first day, I introduce the Mandelbrot set and explain how it is derived. On the second day, the students enter program 2 into their calculators and find the iteration value for vari ous points in the complex-number plane. They record these values on individual grids. The iteration values determine which original points are a part of the Mandlebrot set and how quickly some iteration points leave the radius of 2 units from the origin. For exam
ple, the iteration value of Z0(-.25 + 1.10/) is 4 because the fourth iteration generates an iteration point with
TABLE 2
a distance from the origin that is greater than 2 units. An initial point, Z0, is a member of the Mandelbrot set if it has an iteration value of 51, meaning that none of the iteration points generated by Z0 have gone beyond a circle of radius 2 centered at the origin.
Several days after completing that part of the activi
ty, the students receive a photocopy of the master
complex-number plane grid with all the point iteration values. The students then derive an iteration-value col
oring scale and color their photocopy. Teachers can use
graph paper to create the complex-number-plane grid.
MANDEL program The MANDEL program, program 2, on page 44, is
designed to allow students to enter the real coordinate number and the imaginary coordinate number of a
point in the complex-number plane. For example, sup pose that a student wants to enter the complex point 0.123 + -0.567/. After the R=? prompt, the student should type .123; and after the l=? prompt, the stu dent should type -.567. When the student presses
the screen shown in figure 6 should appear. Iteration 1 means that after using the recursive
formula one time, point Z, = -0.18336 - 0.706482/, and it is 0.7298888312 units from the origin. Pressing H?lHil one more time produces the screen shown in figure 7.
Iteration 2 means that after using the recursive for mula for a second time, point Z2 = -0.3424959267
-
0.307918921/, and it is 0.4605621801 units from the
TEACHER I Vol. 98, No. 1 ? August 2004
This content downloaded from 143.167.204.167 on Sat, 26 Apr 2014 05:45:16 AMAll use subject to JSTOR Terms and Conditions
ITERATION 1
DISTANCE .7298888312
REAL IMAG 18336
-.7 6482
Fig. 6 First iteration of Z0 = 0.123 + -0.567/
origin. When the user continues to press the HfliHii
key, the screen in figure 8 eventually appears. When iteration 51 appears and the word Done
appears, the program has tested the point Z0 for
fifty iterations and found that none of the points created is more than 2 units from the origin. Therefore, Z0 (0.123 + -0.567/) is a point in the
Mandelbrot set. Had the program not reached fifty one iterations, the point would not be considered
part of the Mandelbrot set. The decision to test
fifty iterations to get the number 51 was made arbi
trarily. By using fewer iterations, the Mandelbrot set image is less refined. A larger iteration value
yields a slightly more accurate picture, but it also slows the process. In this day of instant computer feedback, students often believe that fifty iterations
is "so slow."
Figure 9 shows the final screen of Z0 =
-0.7 + 0.7/. After four iterations, the distance from
the origin exceeds 2 units, so Z0 is not a part of the
Mandelbrot set. Once the students type in the MANDEL program,
they should test the program to make sure that it gives the same answers as some of the previous examples. A
single wrong sign or a parenthesis in the wrong place results in incorrect answers.
Cooperative activity Students use program 2 to fill in each cell of the
complex-number-plane grid with an iteration value.
The iteration value comes from entering a complex number-plane point in the MANDEL program. The
cells on the complex-number-plane grid range from
-2 to 0.8 on the real axis and from -1.2/ to 1.2/ on
the imaginary axis. Each axis is divided into incre
ments of 0.05. Figure 10 shows a corner of the grid. The total number of cells is 2793, so the task of find
ing an iteration value for each cell can be tedious.
Students are usually given the assignment of
finding all the iteration values in one row or col umn. For a column, a student might find all the
iteration values when the real part is -1.5 and the
imaginary part varies from -1.2/ to 1.2/. Since the
Mandelbrot set is symmetrical with respect to the
real axis, each student's work can be cut almost in
ITERATION 2
DISTANCE .46 56218 1
REAL IMAG -.3424959267 -.307918921
Fig. 7 Second iteration of Z0 = 0.123 + -0.567/
51
DISTANCE .5385916365
REAL IMAG -.1453561846 -.5186063348
Done
Fig. 8 Fifty-first iteration of Z0 = 0.123 + -0.567/
DISTANCE 2.6 7078948
REAL IMAG 2.568609444 .4462131414
Done
Fig. 9 Fourth iteration of Z0 = -0.7 + 0.7/
?L + + + -?"^ + + + > ? ? ?? ? ?
Q?OVOXQ???- ?-??o
-2.00
-1.95
-1.90
-1.85
-1.80
-1.75
-1.70
-L65 -1.60
-1.55
-1.50
-1.45
-1.40
Fig. 10 A corner of the grid
Vol. 98, No. 1 ? August 2004 | MATHEMATICS TEACHER 41
This content downloaded from 143.167.204.167 on Sat, 26 Apr 2014 05:45:16 AMAll use subject to JSTOR Terms and Conditions
Iteration values Color
1 blue
2 green
3-4 red
5-9 orange
10-50 yellow
51 black
Fiq 11 Coloring scale
Fig. 12 A student's graph
half by assigning the student a real number and the
nonnegative imaginary numbers. Also, the students will find that their work goes much faster if they eliminate the PAUSE statement in the second-to last line of the program. After the students have found all the iteration values for their assigned cells, those values are entered on a master complex
number-plane cell grid. Table 3 is an example that shows part of the grid.
This cooperative activity then turns back into an
individual activity. Each student receives a photo
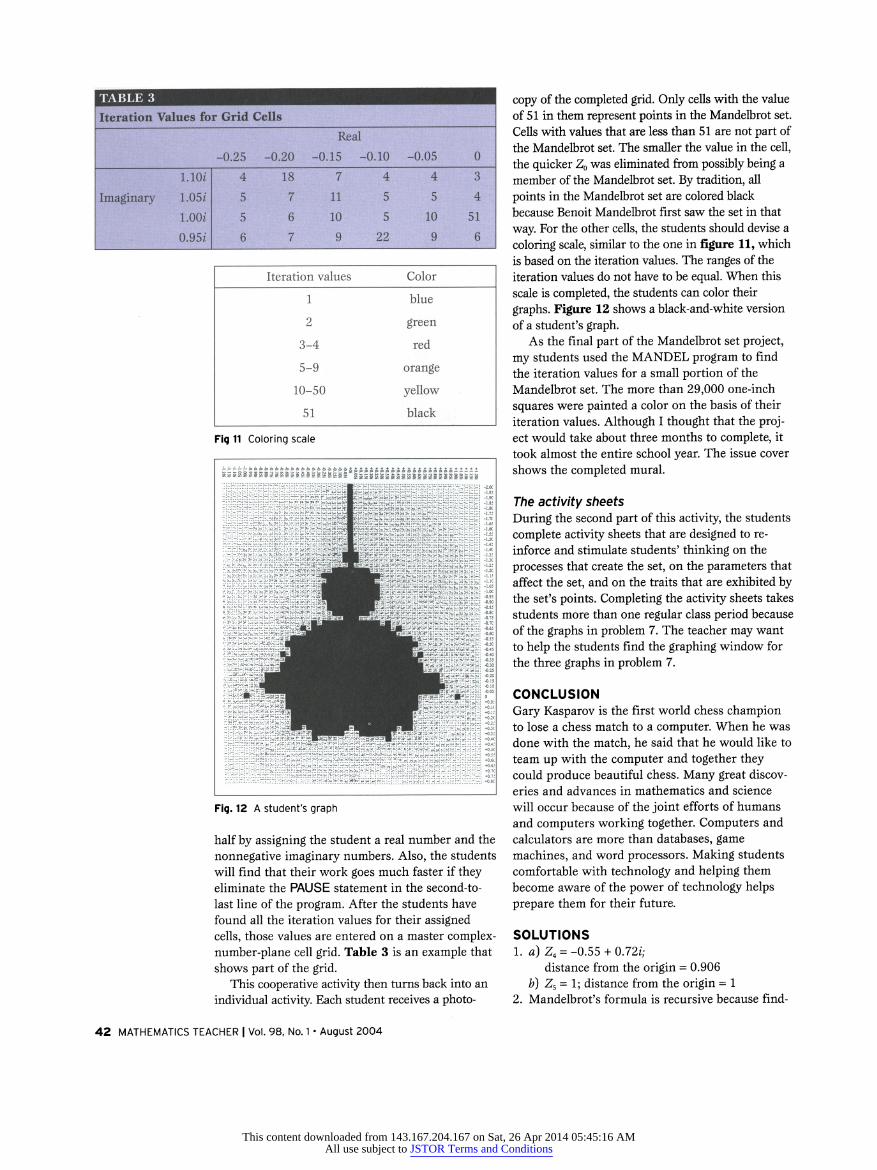
copy of the completed grid. Only cells with the value
of 51 in them represent points in the Mandelbrot set.
Cells with values that are less than 51 are not part of
the Mandelbrot set. The smaller the value in the cell, the quicker Z0 was eliminated from possibly being a
member of the Mandelbrot set. By tradition, all
points in the Mandelbrot set are colored black
because Benoit Mandelbrot first saw the set in that
way. For the other cells, the students should devise a
coloring scale, similar to the one in figure 11, which
is based on the iteration values. The ranges of the iteration values do not have to be equal. When this
scale is completed, the students can color their
graphs. Figure 12 shows a black-and-white version
of a student's graph. As the final part of the Mandelbrot set project,
my students used the MANDEL program to find the iteration values for a small portion of the
Mandelbrot set. The more than 29,000 one-inch
squares were painted a color on the basis of their iteration values. Although I thought that the proj ect would take about three months to complete, it
took almost the entire school year. The issue cover
shows the completed mural.
The activity sheets During the second part of this activity, the students
complete activity sheets that are designed to re
inforce and stimulate students' thinking on the
processes that create the set, on the parameters that
affect the set, and on the traits that are exhibited by the set's points. Completing the activity sheets takes students more than one regular class period because of the graphs in problem 7. The teacher may want to help the students find the graphing window for the three graphs in problem 7.
CONCLUSION Gary Kasparov is the first world chess champion to lose a chess match to a computer. When he was
done with the match, he said that he would like to team up with the computer and together they could produce beautiful chess. Many great discov eries and advances in mathematics and science
will occur because of the joint efforts of humans
and computers working together. Computers and
calculators are more than databases, game
machines, and word processors. Making students
comfortable with technology and helping them
become aware of the power of technology helps prepare them for their future.
SOLUTIONS 1. a) Z4 = -0.55 + Out
distance from the origin = 0.906
b) Z5 = 1; distance from the origin = 1 2. Mandelbrot's formula is recursive because find
42 MATHEMATICS TEACHER | Vol. 98, No. 1 ? August 2004
This content downloaded from 143.167.204.167 on Sat, 26 Apr 2014 05:45:16 AMAll use subject to JSTOR Terms and Conditions
ing the next answer in a sequence, Zn, requires
using the previous sequence answer, Zn_v
3. Since the point -0.55 + 0.65/ takes forty-eight iterations before it escapes beyond a radius of 2
units, the lowered iteration standard allows the
point to be included as a point in the Mandelbrot set. The standards for membership in the Mandelbrot set were lowered to forty iter
ations so more points are included in the set and the set becomes slightly larger. It thus tends to
be a less accurate representation of the set. 4. Since the point -0.75 + 0.05/ escapes the radius
of 2 after sixty-two iterations, the heightened iteration standard forces the point out of the
Mandelbrot set. With the increased iteration
standard, some of the points that were formerly in the set are no longer in the set and the set is
slightly smaller. It thus tends to be a more accu rate representation of the set.
5. The regions on the graph of the Mandelbrot set
graph that are not colored black represent the
points that are not in the Mandlebrot set. The colors represent different iteration values at
which the iteration points are outside a radius of 2 units from the origin.
6. a) The iteration points from 45 to 50 become fixed at one point.
b) The iteration points from 45 to 50 oscillate between two fixed points, or attractors, giv ing this Z0 a period of 2.
c) The iteration points from 45 to 50 oscillate between three fixed points, or attractors, giv ing this Z0 a period of 3.
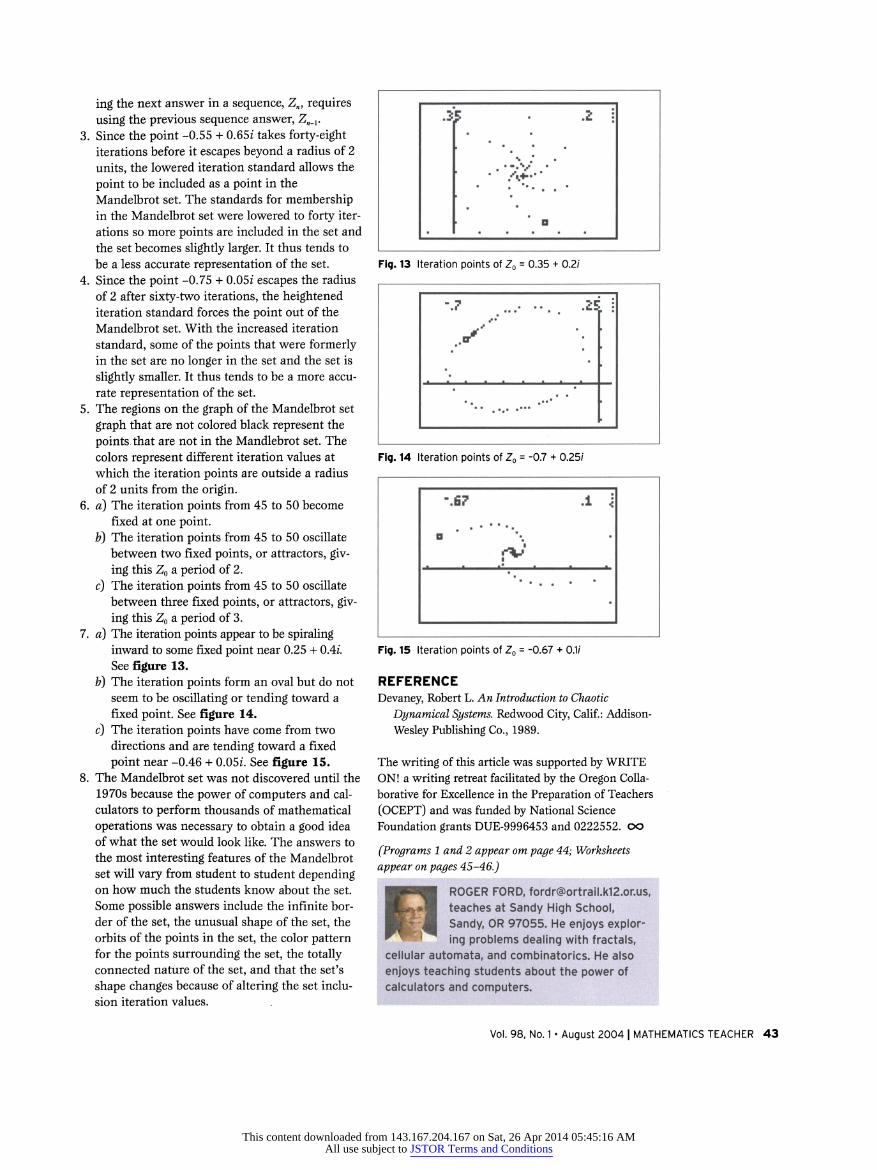
7. a) The iteration points appear to be spiraling inward to some fixed point near 0.25 + 0.4/. See figure 13.
b) The iteration points form an oval but do not seem to be oscillating or tending toward a
fixed point. See figure 14.
c) The iteration points have come from two directions and are tending toward a fixed
point near -0.46 + 0.05/. See figure 15. 8. The Mandelbrot set was not discovered until the
1970s because the power of computers and cal culators to perform thousands of mathematical
operations was necessary to obtain a good idea of what the set would look like. The answers to the most interesting features of the Mandelbrot set will vary from student to student depending on how much the students know about the set. Some possible answers include the infinite bor der of the set, the unusual shape of the set, the orbits of the points in the set, the color pattern for the points surrounding the set, the totally connected nature of the set, and that the set's
shape changes because of altering the set inclu sion iteration values.
Fig. 13 Iteration points of Z0 = 0.35 + 0.2/
Fig. 14 Iteration points of Z0 = -0.7 + 0.25/
Fig. 15 Iteration points of Z0 = -0.67 + 0.1/
REFERENCE Devaney, Robert L. An Introduction to Chaotic
Dynamical Systems. Redwood City, Calif.: Addison
Wesley Publishing Co., 1989.
The writing of this article was supported by WRITE ON! a writing retreat facilitated by the Oregon Colla borative for Excellence in the Preparation of Teachers
(OCEPT) and was funded by National Science Foundation grants DUE-9996453 and 0222552. oo
(Programs 1 and 2 appear om page 44; Worksheets
appear on pages 45-46.)
HROGER FORD, fordr?ortrail.k12.or.us, teaches at Sandy High School, Sandy, OR 97055. He enjoys explor ing problems dealing with fractals,
cellular automata, and combinatorics. He also
enjoys teaching students about the power of calculators and computers.
Vol. 98, No. 1 ? August 2004 | MATHEMATICS TEACHER 43
This content downloaded from 143.167.204.167 on Sat, 26 Apr 2014 05:45:16 AMAll use subject to JSTOR Terms and Conditions
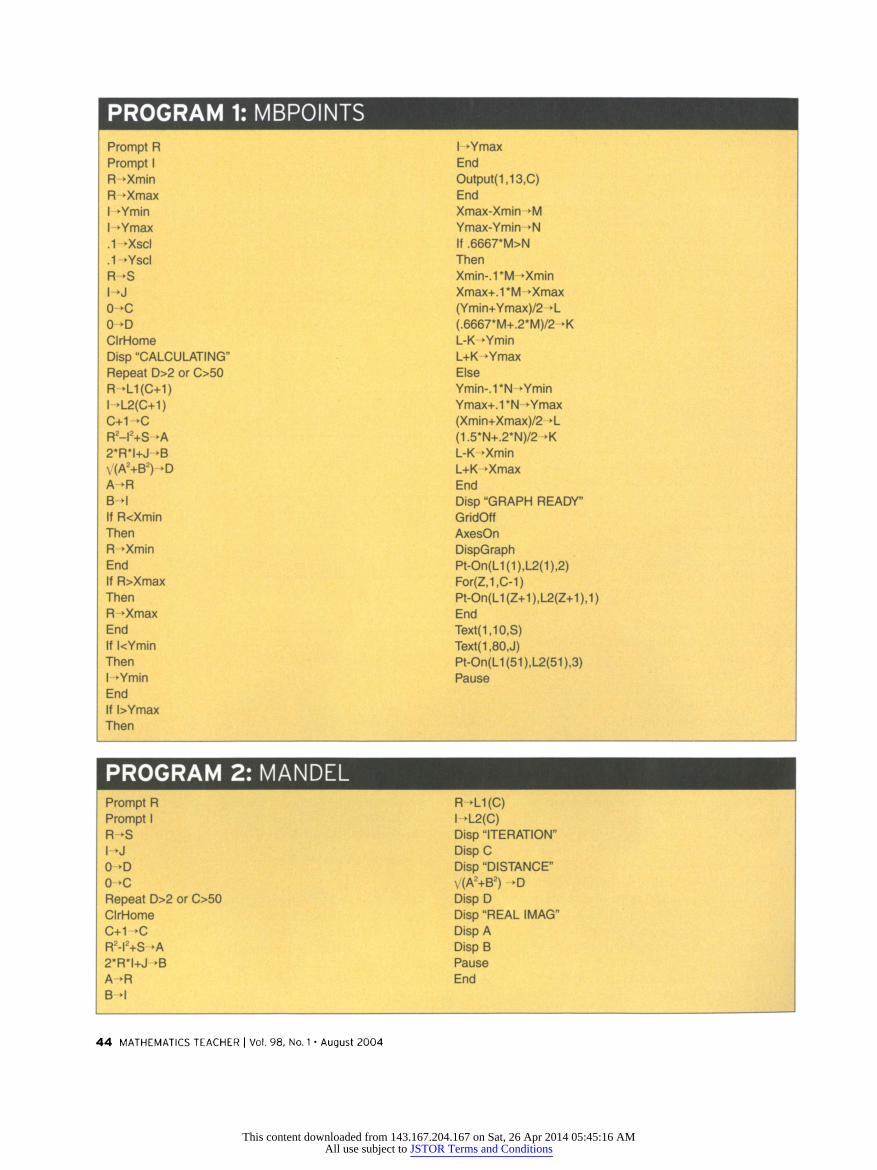
PROGRAM 1: MBPOINTS Prompt R
Prompt I R->Xmin
R-?Xmax
l->Ymin
l->Ymax
.I^Xscl
.1->Yscl
R^S l-J
0- C 0~+D
ClrHome
Disp "CALCULATING" Repeat D>2 or C>50
R->L1(C+1) 1- >L2(C+1)
C+1^C R2-l2+S-A
2*R*I+J^B
V(A2+B2)-D A->R
B-+I
If R<Xmin Then R->Xmin
End If R>Xmax
Then R->Xmax
End If kYmin
Then l->Ymin
End If l>Ymax
Then
KYmax End
Output(1,13,C) End Xmax-Xmin->M
Ymax-Ymin->N
If .6667*M>N Then Xmin-.1*M-0(min
Xmax+.1*M-*Xmax
(Ymin+Ymax)/2-+L (.6667*M+.2*M)/2-+K L-K^Ymin L+K->Ymax
Else Ymin-.1*N->Ymin
Ymax+.1 *N->Ymax
(Xmin+Xmax)/2->L (1.5*N+.2*N)/2->K L-K^Xmin L+K->Xmax
End Disp "GRAPH READY" GridOff AxesOn
DispGraph Pt-On(L1(1),L2(1),2) For(Z,1,C-1) Pt-On(L1(Z+1),L2(Z+1),1) End
Text(1,10,S) Text(1,80,J) Pt-On(L1(51),L2(51),3) Pause
PROGRAM 2: MANDEL Prompt R
Prompt I R^S l->J
0->D
0-+C
Repeat D>2 or C>50 ClrHome C+1-+C
R2-|2+S-+A
2*R*I+J-*B
A-R B-H
R^L1(C) l->L2(C)
Disp "ITERATION"
Disp C Disp "DISTANCE"
V(A2+B2) ->D
Disp D Disp "REAL IMAG"
Disp A Disp Pause End
44 MATHEMATICS TEACHER | Vol. 98, No. 1 ? August 2004
This content downloaded from 143.167.204.167 on Sat, 26 Apr 2014 05:45:16 AMAll use subject to JSTOR Terms and Conditions
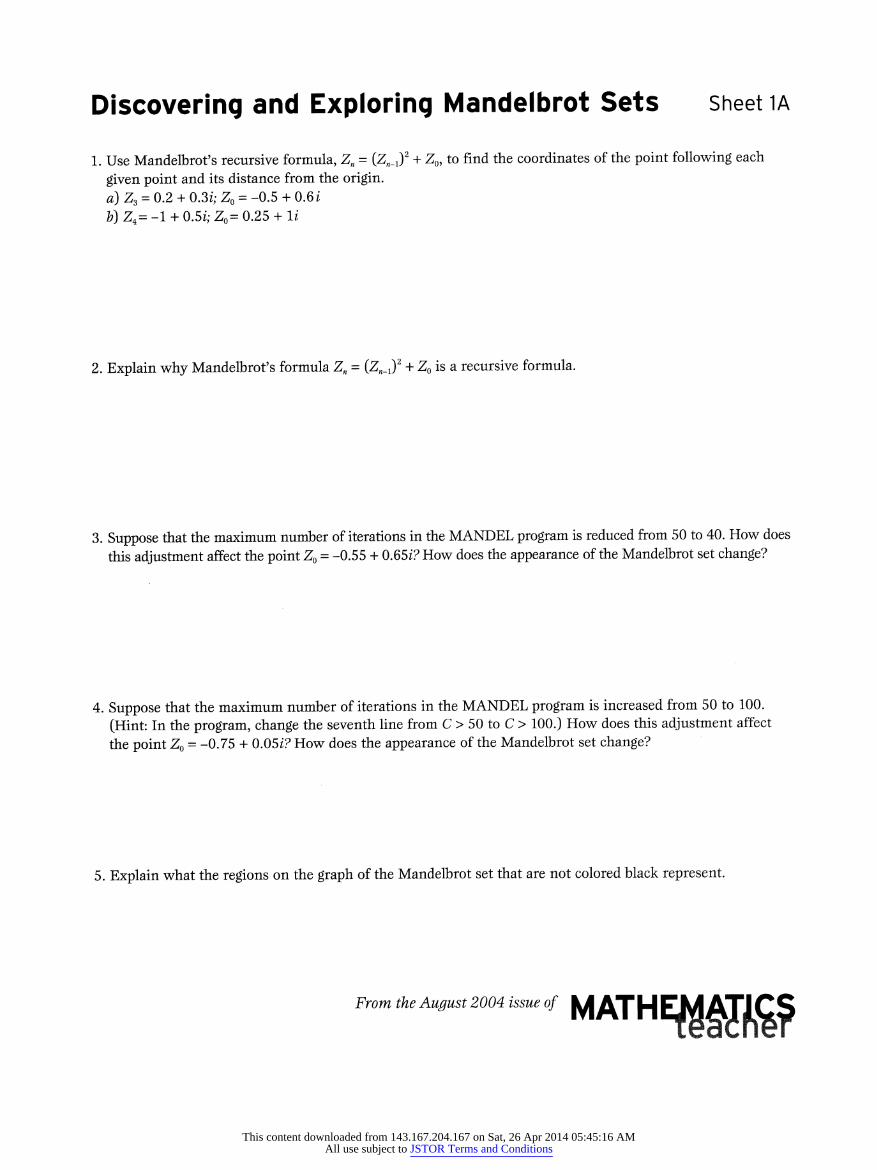
Discovering and Exploring Mandelbrot Sets sheet ia
1. Use Mandelbrot's recursive formula, Zn -
(Z?_J2 + Z0, to find the coordinates of the point following each
given point and its distance from the origin.
a) Z3 = 0.2 + 0.3/; Z0
= -0.5 + 0.6 i
b) Z4= -1 + 0.5?; Z0= 0.25 + li
2. Explain why Mandelbrot's formula Zn =
(ZW_J2 + Z0 is a recursive formula.
3. Suppose that the maximum number of iterations in the MANDEL program is reduced from 50 to 40. How does
this adjustment affect the point Z0 = -0.55 + 0.65i? How does the appearance of the Mandelbrot set change?
4. Suppose that the maximum number of iterations in the MANDEL program is increased from 50 to 100.
(Hint: In the program, change the seventh line from C > 50 to C > 100.) How does this adjustment affect
the point Z0 = -0.75 + 0.05?? How does the appearance of the Mandelbrot set change?
5. Explain what the regions on the graph of the Mandelbrot set that are not colored black represent.
From the August 2004 issue of j^jyy^ ̂
mm
This content downloaded from 143.167.204.167 on Sat, 26 Apr 2014 05:45:16 AMAll use subject to JSTOR Terms and Conditions
Discovering and Exploring Mandelbrot Sets sheet ib
For the next two problems, add the following two lines on the fourteenth and fifteenth lines of the MANDEL program: R-L1(C) I^L2(C )
These lines put the real and imaginary values for the fifty iteration points in lists L1 and L2, respectively.
6. The Mandelbrot set consists of circular regions, called bulbs, that are surrounded by an infinitely complex border. For the given Mandelbrot set bulbs, select a Z0 and explain the pattern that you find for iteration points numbered 45 through 50.
a) A point from the middle of the largest bulb of the Mandelbrot set that does not have a 0 coordinate
h) A point from the middle of the second-largest bulb of the Mandelbrot set that does not have a 0 coordinate
c) A point from the middle of the third-largest bulb of the Mandelbrot set
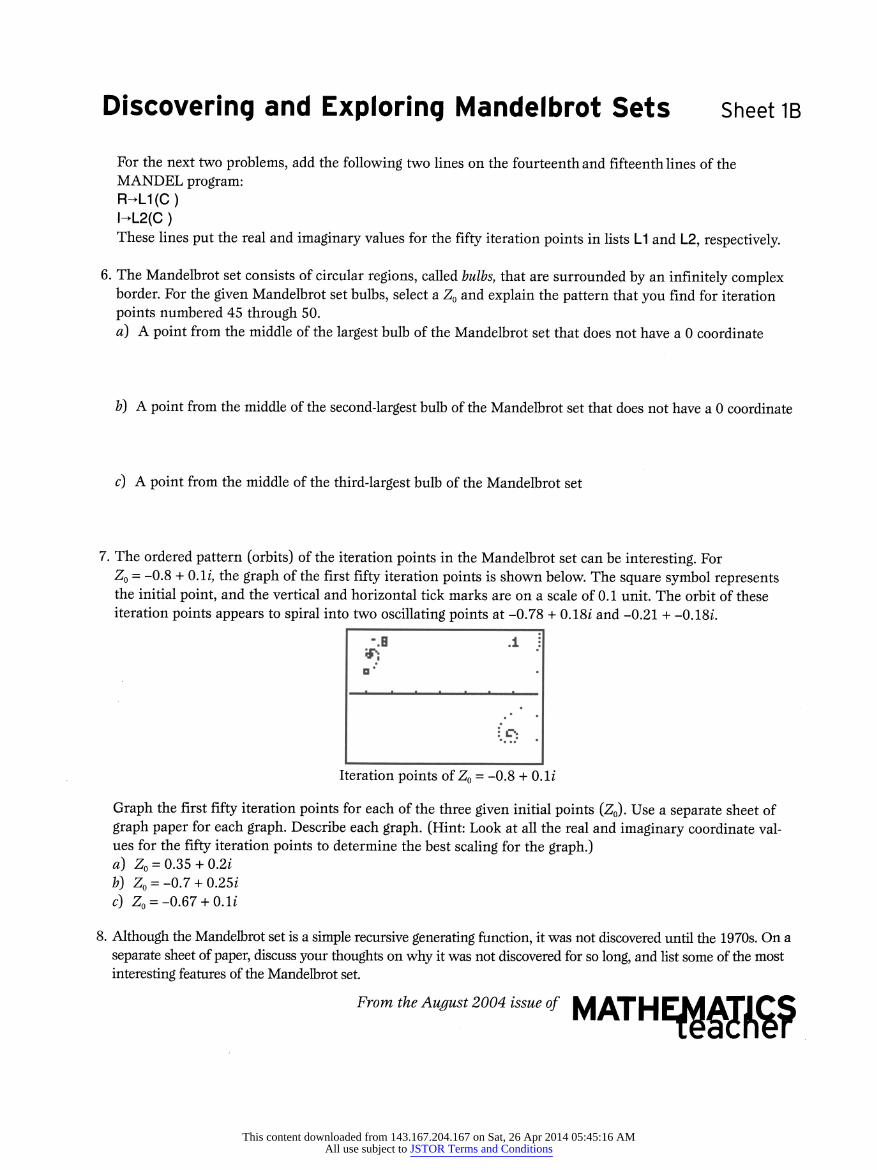
7. The ordered pattern (orbits) of the iteration points in the Mandelbrot set can be interesting. For Zq = -0.8 + 0.1/, the graph of the first fifty iteration points is shown below. The square symbol represents the initial point, and the vertical and horizontal tick marks are on a scale of 0.1 unit. The orbit of these iteration points appears to spiral into two oscillating points at -0.78 + 0.18/ and -0.21 + -0.18/.
Iteration points of Z0 = -0.8 + 0.1/
Graph the first fifty iteration points for each of the three given initial points (Z0). Use a separate sheet of graph paper for each graph. Describe each graph. (Hint: Look at all the real and imaginary coordinate val ues for the fifty iteration points to determine the best scaling for the graph.) a) Z0 = 0.35 + 0.2/
b) Z0 = -0.7 + 0.25/
c) Z0 = -0.67 + 0.1/
8. Although the Mandelbrot set is a simple recursive generating function, it was not discovered until the 1970s. On a
separate sheet of paper, discuss your thoughts on why it was not discovered for so long, and list some of the most
interesting features of the Mandelbrot set.
From the August 2004 issue of MATH
This content downloaded from 143.167.204.167 on Sat, 26 Apr 2014 05:45:16 AMAll use subject to JSTOR Terms and Conditions