Embed Size (px)
Citation preview

Disco Tour
This tour document gives you an overview about the main functionality of Disco.
Author: Anne RozinatContact: [email protected]: Friday, June 28, 2013Website: http://fluxicon.com/disco/
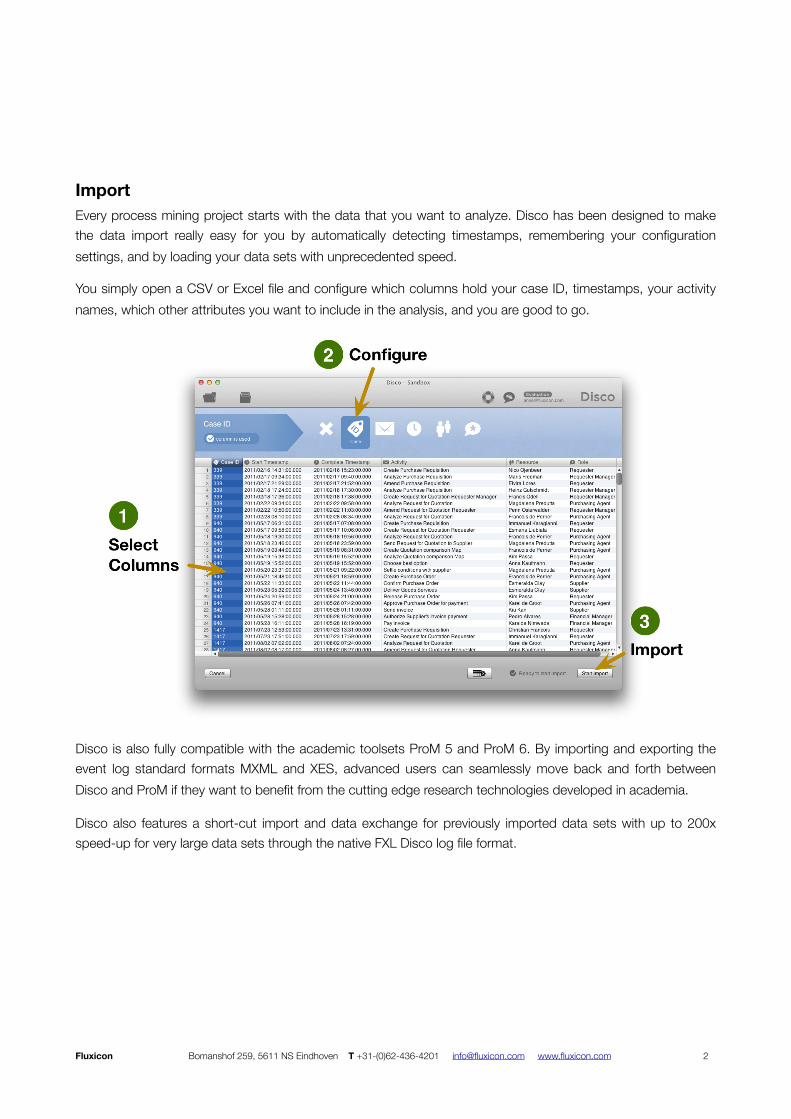
ImportEvery process mining project starts with the data that you want to analyze. Disco has been designed to make the data import really easy for you by automatically detecting timestamps, remembering your configuration settings, and by loading your data sets with unprecedented speed.
You simply open a CSV or Excel file and configure which columns hold your case ID, timestamps, your activity names, which other attributes you want to include in the analysis, and you are good to go.
Disco is also fully compatible with the academic toolsets ProM 5 and ProM 6. By importing and exporting the event log standard formats MXML and XES, advanced users can seamlessly move back and forth between Disco and ProM if they want to benefit from the cutting edge research technologies developed in academia.
Disco also features a short-cut import and data exchange for previously imported data sets with up to 200x speed-up for very large data sets through the native FXL Disco log file format.
Fluxicon Bomanshof 259, 5611 NS Eindhoven T +31-(0)62-436-4201 [email protected] www.fluxicon.com 2
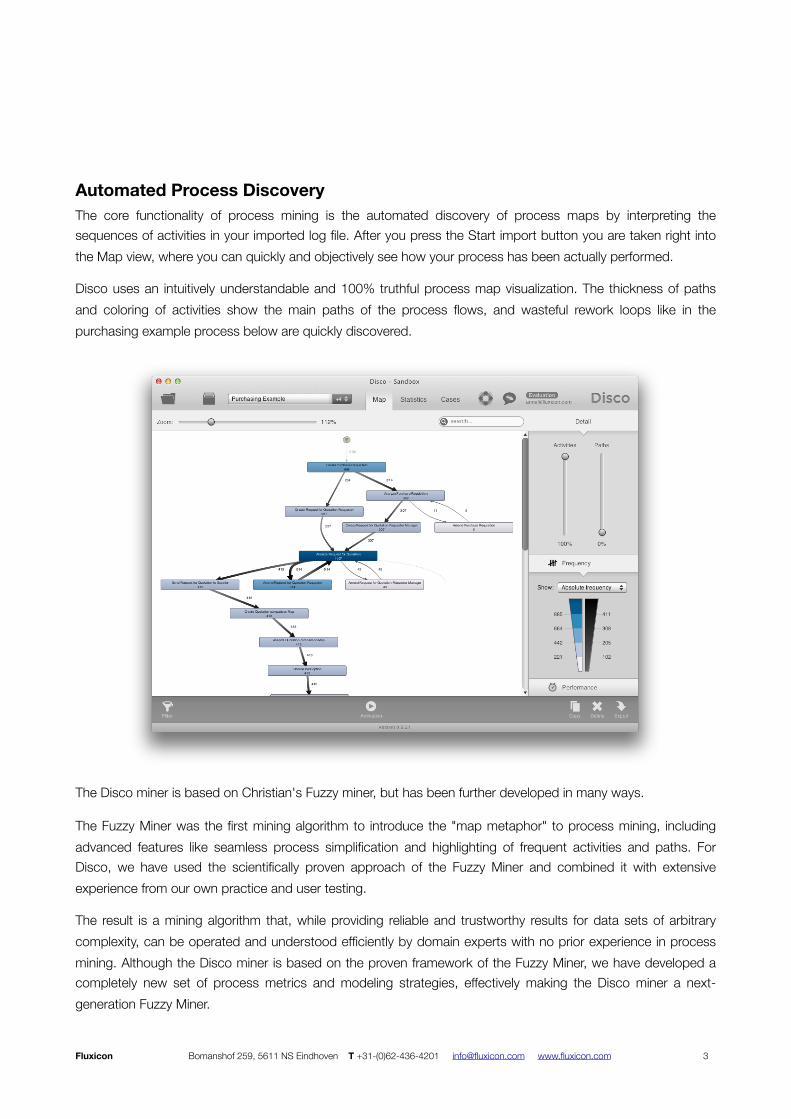
Automated Process DiscoveryThe core functionality of process mining is the automated discovery of process maps by interpreting the sequences of activities in your imported log file. After you press the Start import button you are taken right into the Map view, where you can quickly and objectively see how your process has been actually performed.
Disco uses an intuitively understandable and 100% truthful process map visualization. The thickness of paths and coloring of activities show the main paths of the process flows, and wasteful rework loops like in the purchasing example process below are quickly discovered.
The Disco miner is based on Christian's Fuzzy miner, but has been further developed in many ways.
The Fuzzy Miner was the first mining algorithm to introduce the "map metaphor" to process mining, including advanced features like seamless process simplification and highlighting of frequent activities and paths. For Disco, we have used the scientifically proven approach of the Fuzzy Miner and combined it with extensive experience from our own practice and user testing.
The result is a mining algorithm that, while providing reliable and trustworthy results for data sets of arbitrary complexity, can be operated and understood efficiently by domain experts with no prior experience in process mining. Although the Disco miner is based on the proven framework of the Fuzzy Miner, we have developed a completely new set of process metrics and modeling strategies, effectively making the Disco miner a next-generation Fuzzy Miner.
Fluxicon Bomanshof 259, 5611 NS Eindhoven T +31-(0)62-436-4201 [email protected] www.fluxicon.com 3
Our design priorities are what sets the Disco miner apart from other solutions:
1. Usability: Our goal was to have a miner that can be operated and understood by domain experts, with an adequate learning curve to also accommodate process mining experts (This is where most academic mining algorithms, understandably, fall painfully short). We also have put great effort into making our visualizations information-dense, while avoiding information overload. For Disco, we have used state-of-the-art UX and visualization research, user testing, and lots of development time to make sure our models are nice to read and quick to understand.
2. Fidelity: Creating a truthful model from a simple, well-structured process model is easy. When faced with complex data, though, most commercial approaches resort to drastically limiting the data used (only using the mainstream variants) to keep model complexity in check. We wanted a miner that can intelligently extract the most important parts of the process from the full set of data, and create a useful process model from data of arbitrary complexity.
3. Performance: Almost all process mining tools want to be used in a procedural fashion: You give them the data, and some parameters, they create a process model, done. We see process mining as an explorative and highly interactive task, where the domain expert learns to understand the data by looking at the process from multiple perspectives in quick succession. For this approach to work, we need our miner to work very fast.
The Disco miner is considerably faster than any other approaches we are aware of, while delivering superior model quality. We think there is inherent value in having a good approximation of complex behavior in a few seconds, versus a perfect model in three hours (which is what you get with, e.g., genetic approaches). By intensively optimizing the whole stack, down from the log storage layer up to the graph visualization, we have created a miner that fosters truly interactive usage which, ultimately, leads to better and more meaningful analysis results.
Fluxicon Bomanshof 259, 5611 NS Eindhoven T +31-(0)62-436-4201 [email protected] www.fluxicon.com 4

Process StatisticsNext to the process maps you can also inspect statistics about your process. For this, you simply change to the Statistics tab in the toolbar. You will get overview information about the number of cases and events in your data set, the time frame covered, and performance charts like the case duration chart shown below.
In the case duration chart below, you can see that while most cases in the purchasing process are relatively short, some of them take 77 days. It almost seems like there are two different processes, one taking up to 15 days, and another one taking 70 days and longer. From an process analysis perspective we would like to find out what is going on.
On the left, further statistics views give you frequency and performance information for all activities and resources in the process. Furthermore, you will see statistics for any additional data attribute column that you included in your data set. These additional data attributes are usually very important for your process analysis, because they hold relevant context information such as:
• Which product a service call was about,
• Which type of category a change request in an IT Service process falls in,
• The channel through which a lead in a sales process came in,
• Domain-specific characteristics such as warranty vs. out-of-warranty repairs in a service process,
Fluxicon Bomanshof 259, 5611 NS Eindhoven T +31-(0)62-436-4201 [email protected] www.fluxicon.com 5
• By which department the activity was handled,
• In which country the process was performed,
• The value of an order, which is relevant for many purchasing processes, because depending on the amount of money that is involved different anti-fraud rules will apply, etc. etc.
In our projects, we often get data sets with up to 40 or 60 additional data attributes that are relevant and can be used in the analysis. Disco shows you these attribute statistics, but also lets you use them to drill down and focus your analysis, and to split out and compare processes with respect to these categories.
Fluxicon Bomanshof 259, 5611 NS Eindhoven T +31-(0)62-436-4201 [email protected] www.fluxicon.com 6
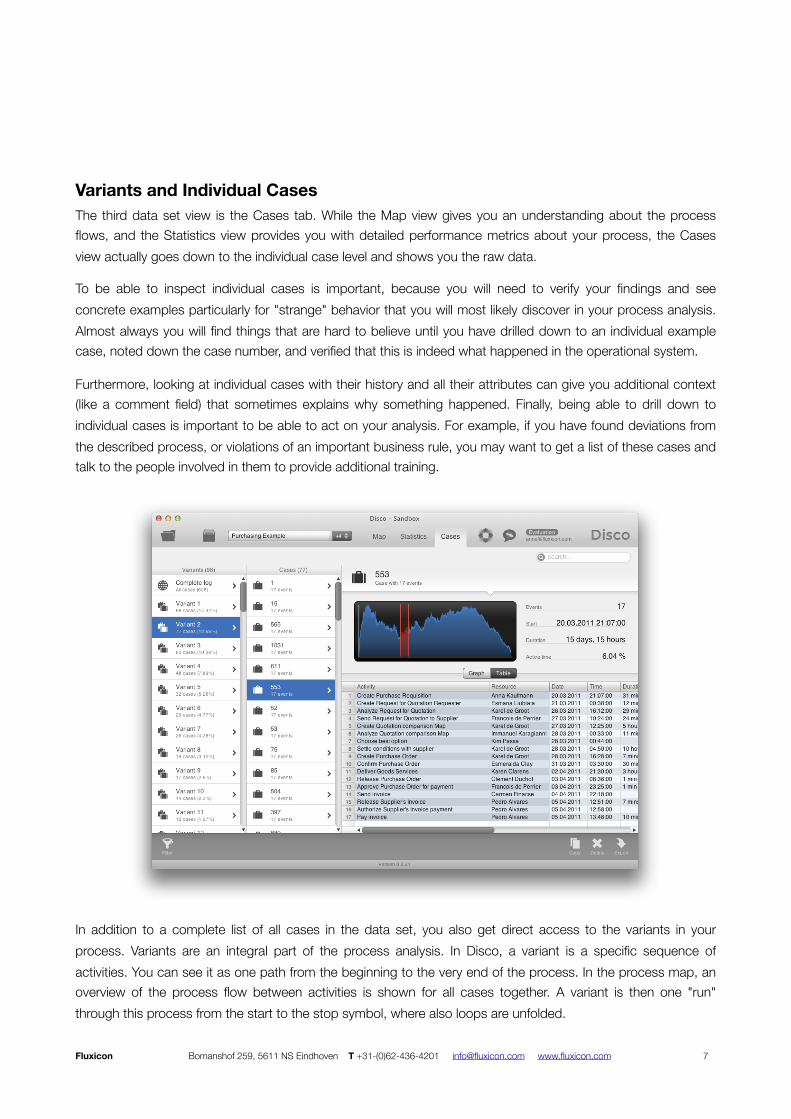
Variants and Individual CasesThe third data set view is the Cases tab. While the Map view gives you an understanding about the process flows, and the Statistics view provides you with detailed performance metrics about your process, the Cases view actually goes down to the individual case level and shows you the raw data.
To be able to inspect individual cases is important, because you will need to verify your findings and see concrete examples particularly for "strange" behavior that you will most likely discover in your process analysis. Almost always you will find things that are hard to believe until you have drilled down to an individual example case, noted down the case number, and verified that this is indeed what happened in the operational system.
Furthermore, looking at individual cases with their history and all their attributes can give you additional context (like a comment field) that sometimes explains why something happened. Finally, being able to drill down to individual cases is important to be able to act on your analysis. For example, if you have found deviations from the described process, or violations of an important business rule, you may want to get a list of these cases and talk to the people involved in them to provide additional training.
In addition to a complete list of all cases in the data set, you also get direct access to the variants in your process. Variants are an integral part of the process analysis. In Disco, a variant is a specific sequence of activities. You can see it as one path from the beginning to the very end of the process. In the process map, an overview of the process flow between activities is shown for all cases together. A variant is then one "run" through this process from the start to the stop symbol, where also loops are unfolded.
Fluxicon Bomanshof 259, 5611 NS Eindhoven T +31-(0)62-436-4201 [email protected] www.fluxicon.com 7
Usually, a large portion of cases in your data set is following just a few variants. For example, in the purchasing process shown above the top five most frequent variants cover the process flows of ca. 50% of all cases, although there are 98 different variants in total.
Furthermore, a live full text search across case names and all activity, resource, and data columns lets you find specific cases based on the words or word fragments you are looking for.
Fluxicon Bomanshof 259, 5611 NS Eindhoven T +31-(0)62-436-4201 [email protected] www.fluxicon.com 8
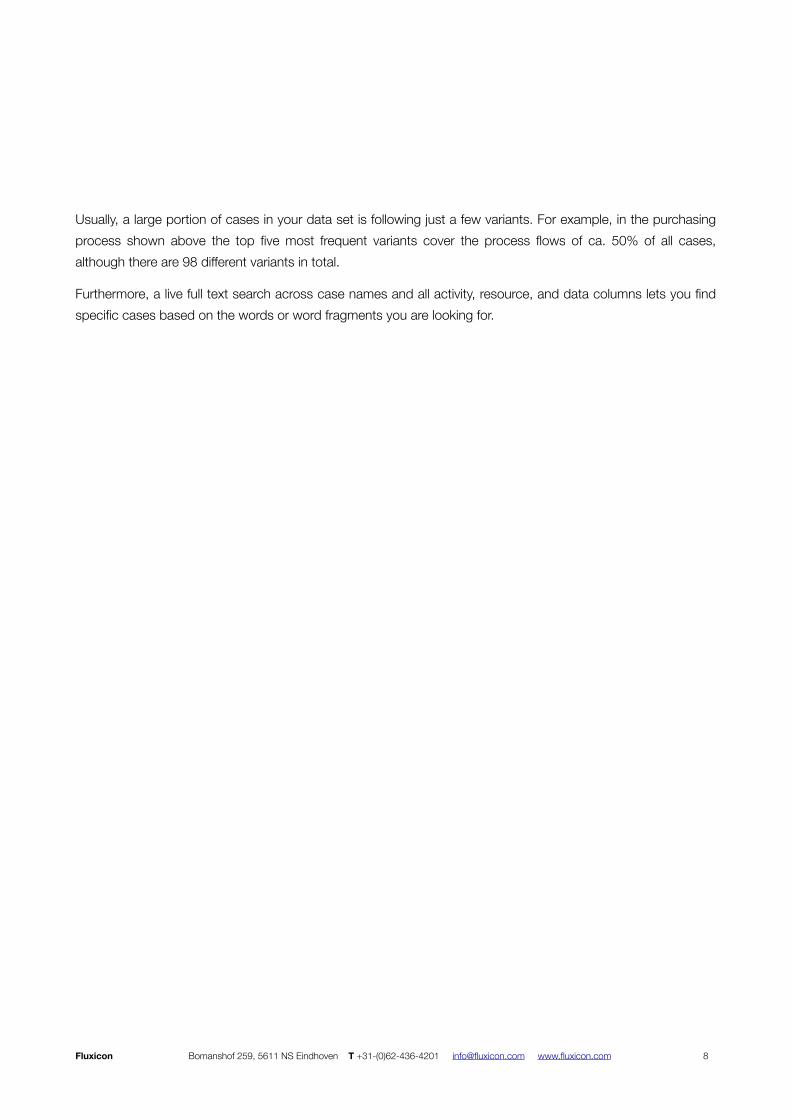
FilteringDisco provides you with powerful, non-destructive filtering capabilities for explorative drill-down, and for focusing your analysis. These filters are quickly accessible from any view and easy to configure.
For example, the Performance filter shown below lets you filter cases based on their throughput time. By moving the lower bound slider control, you can focus on just those cases that took longer than 70 days. The pie chart indicator tells you that the current selection covers ca. 15% of the cases in the data set. When you apply the filter, then all analysis views (Map, Statistics, and Cases) will just show you these 15% you are currently interested in.
In total, there are six powerful filter types available in Disco, and they can be combined and stacked in any order:
• The Timeframe filter with intuitive calendar controls to select cases and events based on a time window. You can use it, for example, to compare the processes before and after a process change.
• The Variation filter that allows you to focus your analysis on either the mainstream behavior or precisely the exceptional cases by making use of the variants from the Cases view.
• The Performance filter to focus on cases based on a variety of different performance metrics like, for example, the case duration as shown above.
Fluxicon Bomanshof 259, 5611 NS Eindhoven T +31-(0)62-436-4201 [email protected] www.fluxicon.com 9
• The Endpoints filter to select cases based on their start and end activities. For example, you can filter incomplete cases, or trim cases to cut out a part of the process.
• The Attribute filter to focus on (or exclude) certain activities, resources or process categories based on data attributes.
• The Follower filter for powerful process pattern-oriented filtering, including a 4-Eyes filter option that can be used to check for segregation of duty violations.
Together with the three analysis views, these filtering capabilities enable you to quickly and interactively explore your process into multiple directions, and to answer concrete questions about your process. Because filtering, and Disco in general, are so fast, you can also hold interactive process workshops, where you and a group of other process stakeholders get together to do an As-Is analysis and generate process improvement ideas along the way.
Fluxicon Bomanshof 259, 5611 NS Eindhoven T +31-(0)62-436-4201 [email protected] www.fluxicon.com 10

Performance HighlightingIn addition to the frequency-based process map, you can also analyze the time that is spent in the process. The durations of the activities and the inactive (waiting) times between activities are automatically extracted from the timestamps in the data set and visually projected onto the process map.
For example, for the subset of cases that take longer than 70 days from above you can see in the process map from the performance highlighting where most of the time is lost. Particularly the frequent rework loop from activity Amend Request for Quotation Requester to Analyze Request for Quotation takes on average 15 days (and is often performed multiple times).
An alternative Total durations performance highlighting option shows you these high-impact areas at one glance by summing up the durations for each activity and path for the complete data set.
Fluxicon Bomanshof 259, 5611 NS Eindhoven T +31-(0)62-436-4201 [email protected] www.fluxicon.com 11
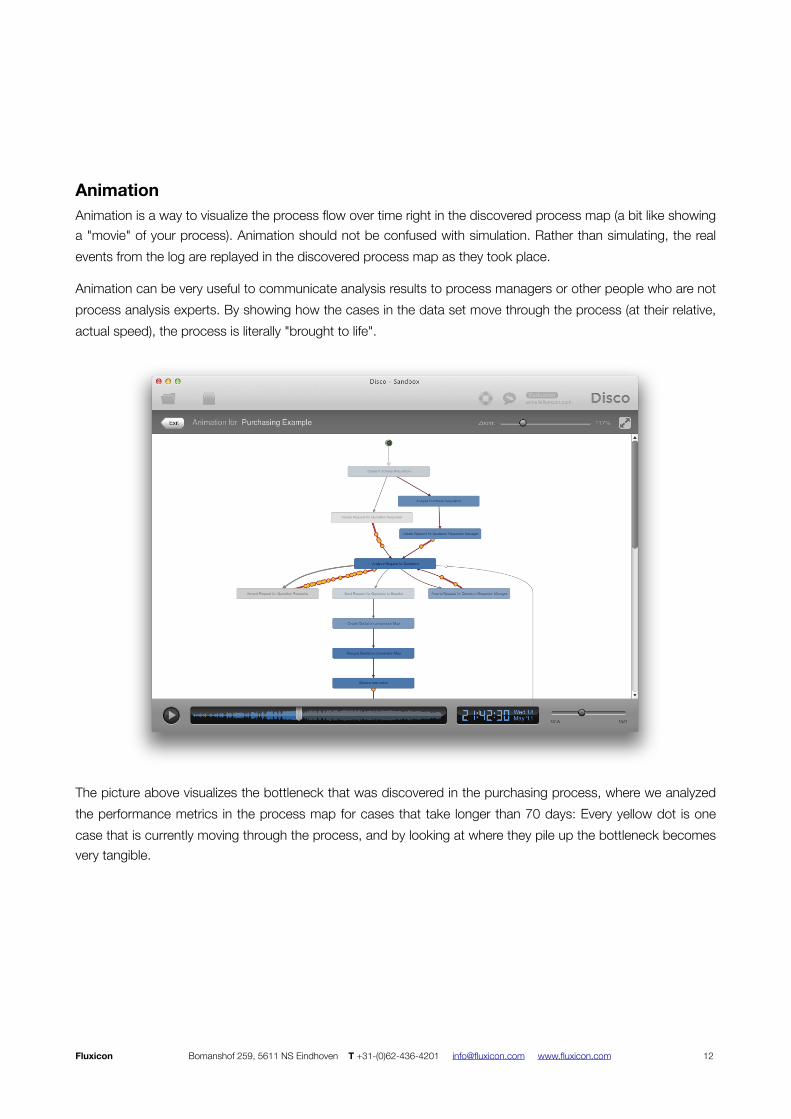
AnimationAnimation is a way to visualize the process flow over time right in the discovered process map (a bit like showing a "movie" of your process). Animation should not be confused with simulation. Rather than simulating, the real events from the log are replayed in the discovered process map as they took place.
Animation can be very useful to communicate analysis results to process managers or other people who are not process analysis experts. By showing how the cases in the data set move through the process (at their relative, actual speed), the process is literally "brought to life".
The picture above visualizes the bottleneck that was discovered in the purchasing process, where we analyzed the performance metrics in the process map for cases that take longer than 70 days: Every yellow dot is one case that is currently moving through the process, and by looking at where they pile up the bottleneck becomes very tangible.
Fluxicon Bomanshof 259, 5611 NS Eindhoven T +31-(0)62-436-4201 [email protected] www.fluxicon.com 12
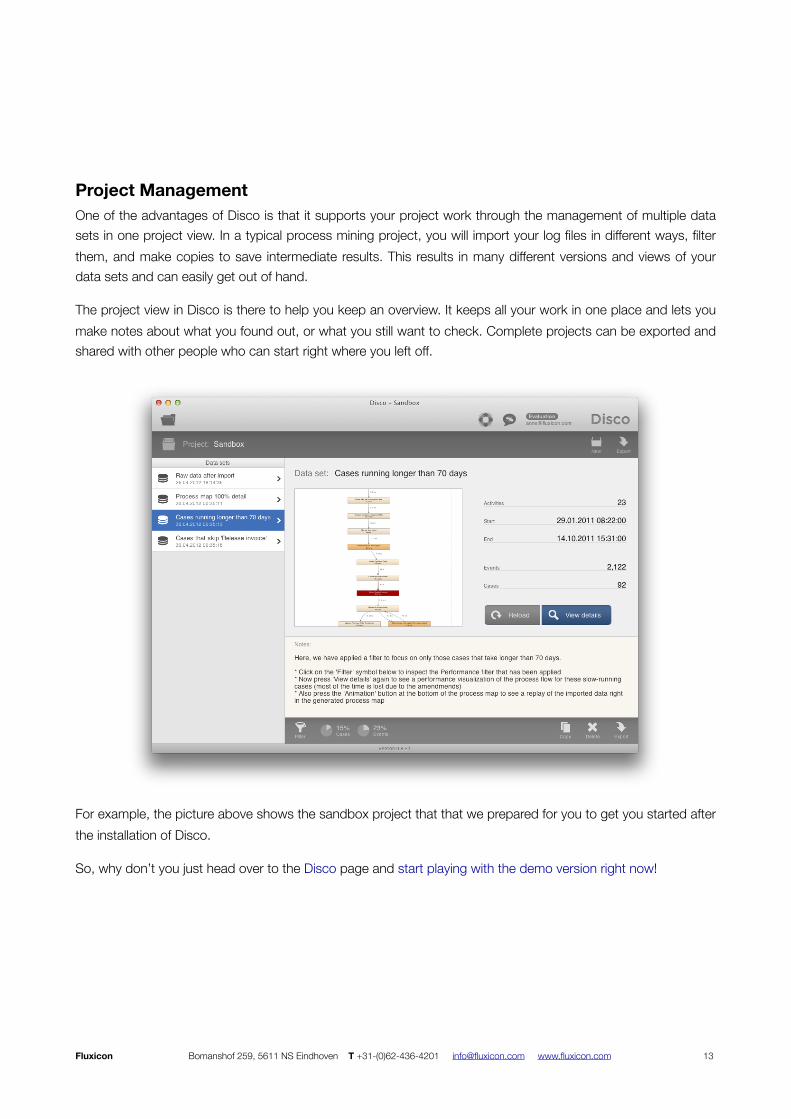
Project ManagementOne of the advantages of Disco is that it supports your project work through the management of multiple data sets in one project view. In a typical process mining project, you will import your log files in different ways, filter them, and make copies to save intermediate results. This results in many different versions and views of your data sets and can easily get out of hand.
The project view in Disco is there to help you keep an overview. It keeps all your work in one place and lets you make notes about what you found out, or what you still want to check. Complete projects can be exported and shared with other people who can start right where you left off.
For example, the picture above shows the sandbox project that that we prepared for you to get you started after the installation of Disco.
So, why don’t you just head over to the Disco page and start playing with the demo version right now!
Fluxicon Bomanshof 259, 5611 NS Eindhoven T +31-(0)62-436-4201 [email protected] www.fluxicon.com 13