Embed Size (px)
Citation preview
153
CHAPTER VII
DISCLOSURE OF INTANGIBLE ASSETS – COMPARISON
OF COMPANIES IN INDIA AND UK
While several intangible assets reporting studies have been carried out in
developed nations, there is still a dearth of comparative studies on intangible assets
disclosure between developed and developing countries. This chapter contributes to
understanding of intangible assets disclosure practices by comparing firms in India (a
developing country) and United Kingdom (a developed country).
The idea that different countries may be characterised by different reporting
behaviours is not new (Ahmed and Courtis, 1999). Recent decades have seen some
gradual convergence in accounting practice and disclosure cultures, scope still exists for
considerable variation across national boundaries (Vanstraelen et al., 2003) particularly in
the area of voluntary intangible assets disclosures. Macro or national level factors such as
business culture (Jaggi and Low, 2000), legal systems (Hope, 2003), historical
developments, government regulation, professional influence and taxation cultures
(Adhikari et al., 1998; Meek and Gray, 1989; Ball et al., 2000) influences variations in
disclosure practices across national boundaries. Abeysekera (2008) also pointed out that
different factors may intervene in determining intangible assets disclosure of firms,
whether it is a developed, moderately developed, or developing country could be one of
them.
The comparison on Indian and UK intangible assets disclosure practices has been
done on the basis attribute-wise disclosure, nature of disclosure, category-wise
disclosure and company-wise disclosure by applying the intangible assets disclosure
index to the annual reports of sample companies from both the countries.
There are four sections in this chapter. Section I discusses attribute-wise
disclosure, section II explains the nature of disclosure and section III deals with category
wise disclosure and section IV discusses the company-wise disclosure scores of sample
companies from India and UK.
154
SECTION I
7.1. ATTRIBUTE WISE DISCLOSURE IN ANNUAL REPORTS
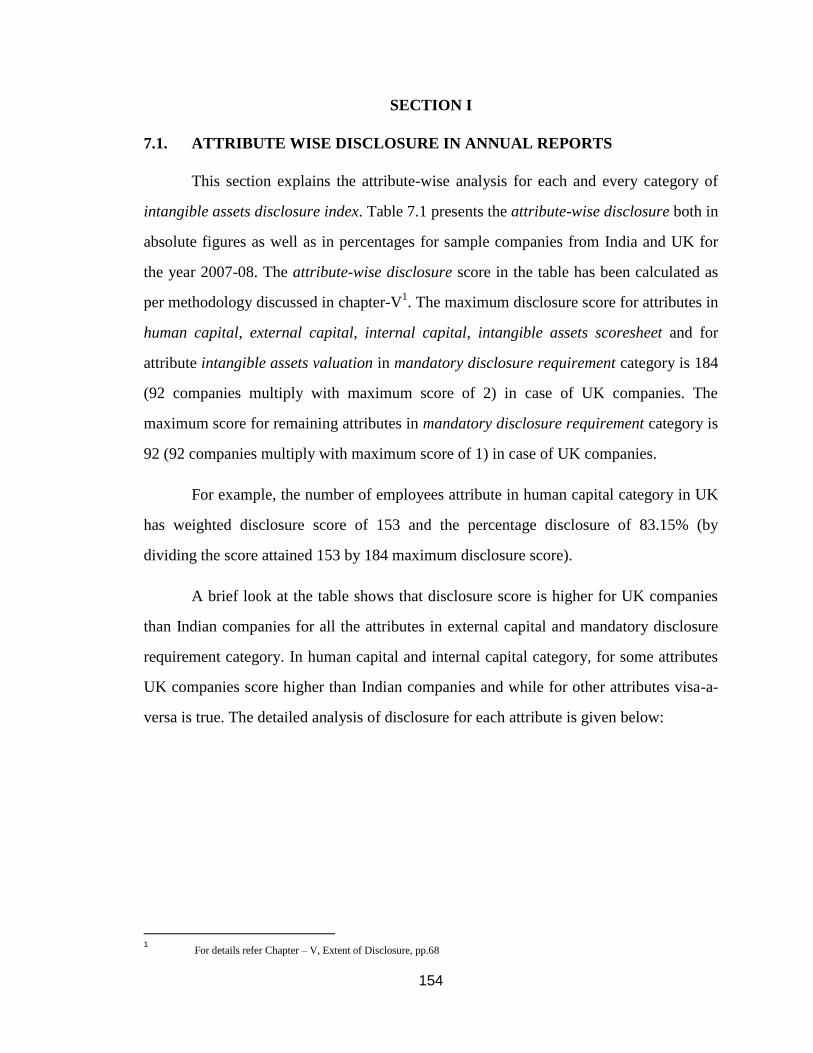
This section explains the attribute-wise analysis for each and every category of
intangible assets disclosure index. Table 7.1 presents the attribute-wise disclosure both in
absolute figures as well as in percentages for sample companies from India and UK for
the year 2007-08. The attribute-wise disclosure score in the table has been calculated as
per methodology discussed in chapter-V1. The maximum disclosure score for attributes in
human capital, external capital, internal capital, intangible assets scoresheet and for
attribute intangible assets valuation in mandatory disclosure requirement category is 184
(92 companies multiply with maximum score of 2) in case of UK companies. The
maximum score for remaining attributes in mandatory disclosure requirement category is
92 (92 companies multiply with maximum score of 1) in case of UK companies.
For example, the number of employees attribute in human capital category in UK
has weighted disclosure score of 153 and the percentage disclosure of 83.15% (by
dividing the score attained 153 by 184 maximum disclosure score).
A brief look at the table shows that disclosure score is higher for UK companies
than Indian companies for all the attributes in external capital and mandatory disclosure
requirement category. In human capital and internal capital category, for some attributes
UK companies score higher than Indian companies and while for other attributes visa-a-
versa is true. The detailed analysis of disclosure for each attribute is given below:
1 For details refer Chapter – V, Extent of Disclosure, pp.68
155
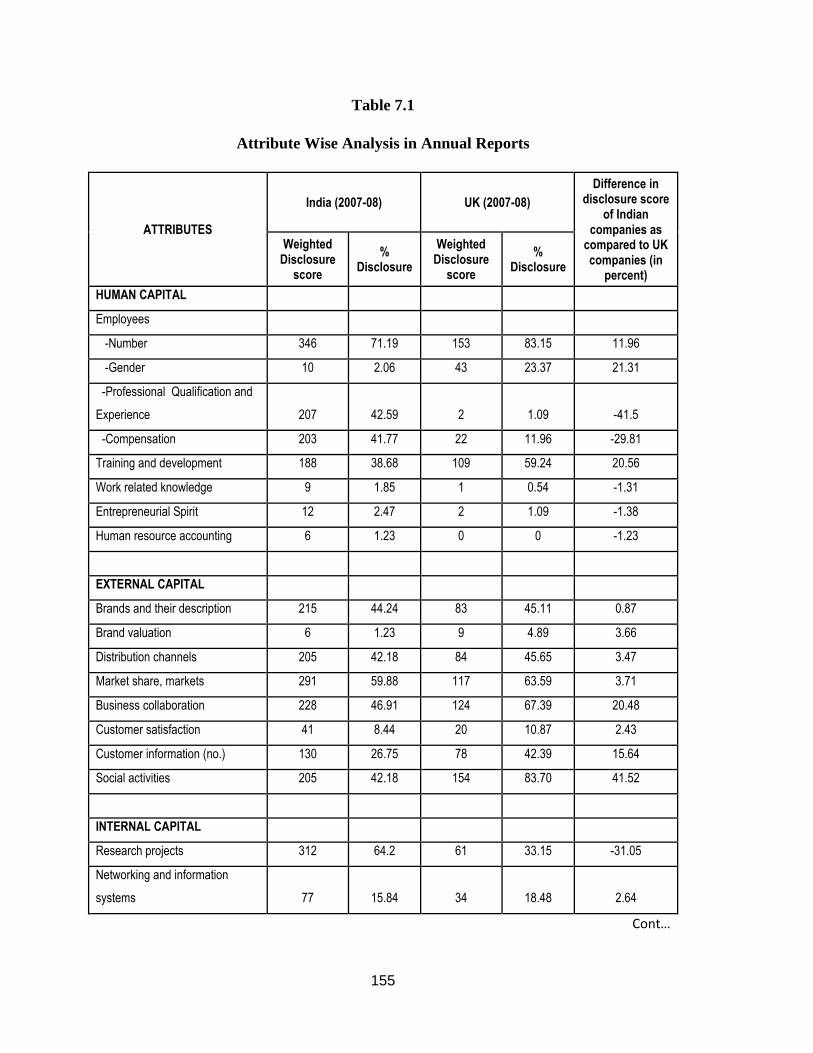
Table 7.1
Attribute Wise Analysis in Annual Reports
ATTRIBUTES
India (2007-08) UK (2007-08)
Difference in disclosure score
of Indian companies as
compared to UK companies (in
percent)
Weighted Disclosure
score
% Disclosure
Weighted Disclosure
score
% Disclosure
HUMAN CAPITAL
Employees
-Number 346 71.19 153 83.15 11.96
-Gender 10 2.06 43 23.37 21.31
-Professional Qualification and
Experience 207 42.59 2 1.09 -41.5
-Compensation 203 41.77 22 11.96 -29.81
Training and development 188 38.68 109 59.24 20.56
Work related knowledge 9 1.85 1 0.54 -1.31
Entrepreneurial Spirit 12 2.47 2 1.09 -1.38
Human resource accounting 6 1.23 0 0 -1.23
EXTERNAL CAPITAL
Brands and their description 215 44.24 83 45.11 0.87
Brand valuation 6 1.23 9 4.89 3.66
Distribution channels 205 42.18 84 45.65 3.47
Market share, markets 291 59.88 117 63.59 3.71
Business collaboration 228 46.91 124 67.39 20.48
Customer satisfaction 41 8.44 20 10.87 2.43
Customer information (no.) 130 26.75 78 42.39 15.64
Social activities 205 42.18 154 83.70 41.52
INTERNAL CAPITAL
Research projects 312 64.2 61 33.15 -31.05
Networking and information
systems 77 15.84 34 18.48 2.64
Cont…
156
ATTRIBUTES
India (2007-08) UK (2007-08) Difference in
disclosure score of Indian
companies as compared to UK companies (in
percent)
Weighted Disclosure
score %
Disclosure
Weighted Disclosure
score %
Disclosure
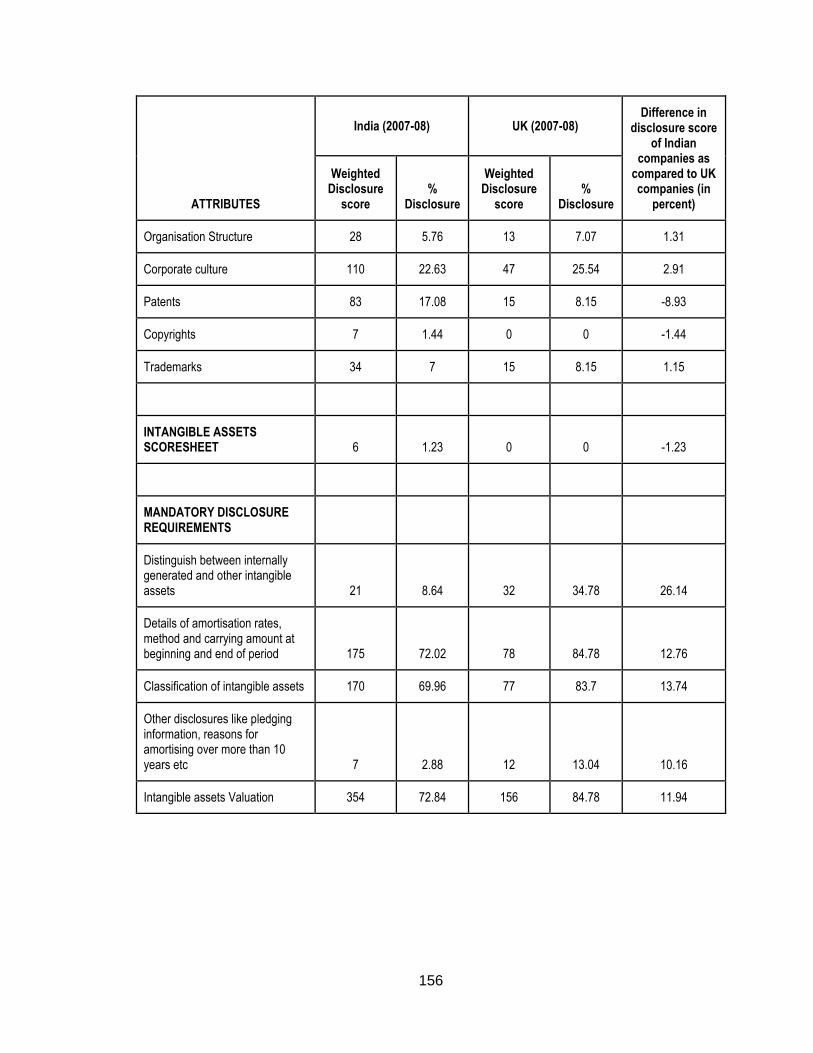
Organisation Structure 28 5.76 13 7.07 1.31
Corporate culture 110 22.63 47 25.54 2.91
Patents 83 17.08 15 8.15 -8.93
Copyrights 7 1.44 0 0 -1.44
Trademarks 34 7 15 8.15 1.15
INTANGIBLE ASSETS SCORESHEET 6 1.23 0 0 -1.23
MANDATORY DISCLOSURE REQUIREMENTS
Distinguish between internally generated and other intangible assets 21 8.64 32 34.78 26.14
Details of amortisation rates, method and carrying amount at beginning and end of period 175 72.02 78 84.78 12.76
Classification of intangible assets 170 69.96 77 83.7 13.74
Other disclosures like pledging information, reasons for amortising over more than 10 years etc 7 2.88 12 13.04 10.16
Intangible assets Valuation 354 72.84 156 84.78 11.94

157
7.1.1. HUMAN CAPITAL
Human capital consists of basic value drivers for any firm. This category
comprises total eight attributes which are number of employees, gender, professional
qualification and experience, compensation, training and development, work-related
knowledge, entrepreneurial spirit and human resource accounting.
The first human capital attribute number of employees has weighted disclosure
score of 71.19% for Indian companies and 83.15% for UK companies. It is the most
highly disclosed intangible assets attribute in human capital category in both India and
UK (Table 7.2).High disclosure concerning this attribute ratifies its importance for
corporates in both the nations. Cobham plc a UK based company reported “At the end of
2007, Cobham employed 9,500 people on five continents with major population centres
in the UK, continental Europe, North America and Australia.” (Cobham plc, Annual
report 2007, p.30). This information is helpful for investor to understand that Cobham plc
has operations in 5 continents and information on change in number of their employees
could indicate future growth prospects of the company.
Gender of employees is the next intangible assets attribute in human capital
category which has very low disclosure score of 2.06% in case of Indian companies. The
disclosure score concerning this attribute is higher in case of UK companies (23.37%).
The emphasis on equality of men and women at workplaces in developed countries is
reflected through higher disclosure concerning this attribute for UK companies.
The weighted disclosure score for the attribute Professional qualification and
experience of employees for UK companies (1.09%) is significantly lower than Indian
companies (42.59%). Higher reporting in India could be due to the fact that Indian
companies want to publicise their high calibre management and superior hiring policies
by giving this information in their annual reports. This attribute is the second most
reported attribute for Indian companies (Table 7.2).
Similar is the case for attribute Compensation whereby a low disclosure of
11.96% has been noticed for UK companies and a much higher score of 41.77% was
attained by Indian companies.
158
The next attribute in human capital category is training and development given to
the employees of an organisation. This attribute has weighted disclosure score of 38.68%
for Indian companies and 59.24% for UK companies. This attribute is second most
disclosed attribute in case of UK companies (Table 7.2). Johnson Matthey plc a UK
based company reported that “The Management Development and Remuneration
Committee of the board takes a special interest in ensuring compliance with the Training
and Development of People Policy objectives to:
• Ensure highest standards in the recruitment of employees.
• Assess training needs in the light of job requirements.
• Ensure relevance of training and link with business goals.
• Employ and evaluate effective and efficient training methods.
• Promote from within, from high potential pools of talent.
• Understand employees’ aspirations.
• Provide development opportunities to meet employees’ potential and
aspirations”. (Johnson Matthey plc, Annual report 2007, p.30)
For both the countries the attributes work related knowledge and entrepreneurial
spirit have low weighted disclosure score. Work related knowledge has weighted
disclosure score of 1.85% for Indian companies and 0.54% for UK companies. Similarly
for the attribute entrepreneurial spirit weighted disclosure score in India is 2.47 and in
UK is 1.09. Knowledge related to the kind of job or work which an employee does and a
high spirit of innovativeness or entrepreneurship is very essential for success of any
business unit. Companies are expected to disclose such information in their annual
reports. But unfortunately the weighted disclosure score received by this category is very
low for both the countries. This implies that not many companies are investing in and
encouraging work-related knowledge and entrepreneurial spirit attribute.
The final attribute in human capital category is human resource accounting. It has
zero disclosure score in case of UK companies and a very low disclosure score of 1.23%
in case of Indian companies. The probable reason for its low or non-disclosure could be
that companies consider its calculation and presentation as unnecessary taxing on its
resources. The other reason could be that companies want to keep such information for

159
internal management purposes only and does not wish to disclose it in their annual
reports.
7.1.2 EXTERNAL CAPITAL
External capital represents relationship of a company with its customers,
suppliers, industry associates, business partners, investors, market channels, society etc.
A glance at table 7.1 shows that weighted disclosure score (percentage) for all the
attributes in this category is more in case of UK companies as compared to Indian
companies. UK’s developed accounting practices might be the motivation for the same.
Weighted disclosure score regarding this first attribute brands and their
description, in external capital category is 44.24% for Indian companies and a slightly
higher score (45.11%) for UK companies. Higher disclosure regarding this attribute
infers that companies are using their annual reports in building and promoting its brand
by informing its investors.
Brand value is a summary measure of the financial strength of the brand.
However, a low weighted disclosure score regarding the brand valuation attribute was
observed. It is 1.23% for Indian companies and 4.89% for UK companies. BT Group plc-
a UK based company in its annual report reported “Our brand values are implicit in our
advertising strap line – Bringing it all together – which captures both what we can do for
customers and our commitment to acting as a single BT team.” (BT Group plc, Annual
report 2008, p.28).
The next attribute in external capital category is the distribution channels or
suppliers who play a crucial role in ensuring maximum value to customers and company.
The weighted disclosure score regarding this attribute is 42.18% for Indian companies
and 45.65% for UK companies. ITV Plc, a UK based company reported “ITV conducts
business with a range of suppliers. As a broadcaster, ITV commissions programmes from
a number of external production companies. A number of suppliers provide ITV with
services relating to the broadcasting of ITV channels on multiple platforms, including
transmission operator Arqiva, satellite operator SES Astra and satellite platform
operator Sky.” (ITV plc, Annual report 2007, p. 41). Sage Group plc a UK based
company reported “The diversity of our distribution channels is one of our key strengths.
160
Worldwide, we have over 40,000 advisers and 25,000 business partners and certified
consultants.” (Sage Group plc, Annual report 2007, p. 5)
Another attribute in external capital category is market or market share of a
company. Weighted disclosure score for this attribute is 59.88% for Indian companies
and 63.59% for UK companies. Within the external capital category, this attribute is the
most frequently reported attribute in case of Indian companies (Table 7.2). Anglo
American plc, a UK based company disclosed about its markets as “In Australia, 2007
opened with a strengthened market for thermal coal on the back of strong Asia Pacific
demand, particularly from China, which experienced a reduction in export tonnage and a
rise in domestic prices. Continued port congestion at Newcastle throughout the year, and
storm and flood events kept supply tight and further strengthened the export thermal
market. Prices steadily increased throughout the year and are likely to remain high into
2008. Export performance from South Africa and from Colombia was steady.” (Anglo
American plc, Annual report 2007, p.48)
The information regarding business collaborations has also received moderately
high disclosures for both the sample sets. The weighted disclosure score is 46.91% for
Indian companies and 67.39% for UK companies. This attribute is the second most
reported attribute in both Indian and UK context (Table 7.2). For instance GSK plc in its
annual report mentions “GSK has a very active external partnering strategy. In 2007 we
entered into nine external product licensing collaborations, together with a number of
other partnerships to develop further and utilise novel science and technologies in
pharmaceutical and biological R&D.” (GSK, Annual report 2007, p.7)
Satisfied Customers are challenging yet important intangible assets for an
organisation. But companies make meagre disclosure regarding this attribute in their
annual reports. Only 8.44% of maximum weighted disclosure score in India and 10.87%
in the UK relates to this attribute. This non-disclosure pattern may be taken to indicate
that only companies with good customer feedbacks want to mention this fact in their
annual report. Centrica Plc, a UK based company reported its customer satisfaction by
calculating NPS “ NPS is 3.1%- British Gas and 6.1%- Direct energy. Net promoter
score (NPS) is a measure of customer advocacy. It shows the percentage of customers
who would recommend us, minus the percentage who would not.” (Centrica Plc, Annual
report 2007, p. 15)
161
In addition to the above the Customers themselves also constitute to be important
intangible assets for an organisation. But its disclosure is not very high in India as
compared to UK. Weighted disclosure score is 26.75% in Indian context. It is almost
double at 42.39% for UK companies. Illustrating disclosure about this attribute from the
annual report of Admiral Group plc “Gladiator increased its customer base significantly
during the year and now boasts over 62,000 customers up from 43,000 last year (+44%),
which bodes well for the future.” (Admiral Group plc, Annual report 2007, p.12)
Disclosure about the attribute Social Activities is 42.18% in India and
comparatively higher (83.70%) for UK companies. Greater emphasis on societal needs
and its disclosure in annual reports of developed country (UK) is very encouraging for
companies in developing nation (India). For example Antofagasta plc, a UK based
company reported its social activities as “The Group supports local communities in many
ways, including providing education and training, fostering enterprises and encouraging
small businesses, job creation, the arts, health, sport, recreational activities and general
issues facing local communities.” (Antofagasta plc, Annual report 2007, p.55)
7.1.3 INTERNAL CAPITAL
In internal capital category, the disclosure regarding the first attributes Research
activities is 64.2% and 33.15% in India and UK respectively. This attribute is the most
reported attribute in case of both Indian and UK companies (Table 7.2). Johnson
Matthey, a UK based company reported “We maintain a high level of R&D expenditure
to ensure the continuous flow of new products and technologies to provide our customers
with cost effective solutions to meet legislated and technical requirements. In 2006/07 the
continuing operations spent £66.5 million gross on research and development.” (Johnson
Matthey, Annual report 2007, p.14).
Disclosure regarding Networking and information systems which is another
internal capital attribute is15.84% in case of Indian companies whereas it is slightly high
at 18.48% in case of UK companies.
Another important intangible assets attribute in internal capital category is
organisation structure of a company. Low disclosure of 5.76% for Indian companies and
7.07% for UK was noticed with regard to this attribute. Sage Group plc reported on this
attribute that “Sage operates a decentralised organisational structure with four regions
162
managing day-to-day business activities. Each region – UK & Ireland, Mainland Europe,
North America and Rest of World – is run by a regional management team headed by a
regional CEO. The regions all report into the parent Company.” (Sage Group plc,
Annual report 2007, p. 4)
Corporate culture attribute has mostly been reported in qualitative form in the
annual reports. It has 22.63% disclosure in India and 25.54% disclosure in the UK. This
is the second most reported attribute in internal capital category for both the datasets
(Table 5.4). A UK based company BAE Systems reported on this attribute “We seek to
nurture a culture within the Group of continuous improvement – in all aspects of business
performance. This includes ethical awareness as we work to achieve the highest
standards of governance in the conduct of our day-to-day business.” (BAE Systems,
Annual report 2007, p.2)
Intellectual capital assets like patents, trademarks and copyrights are other
attributes in internal capital category. Disclosure regarding patents is 17.08% in India and
8.15% in UK. In case of copyrights it is 1.44% in India and negligible in UK. For
trademarks disclosure is 7% in India and 8.15% in UK.
7.1.4 INTANGIBLE ASSETS SCORESHEET
Intangible assets Scoresheet is usually presented as additional information to the
investors. Only 1.23% companies in India (and none of the company in UK) are
disclosing this scoresheet in the annual reports.
7.1.5 MANDATORY DISCLSOURE REQUIREMENT
UK’s Financial Reporting Standard 10 on Goodwill and Intangible assets issued
in 1997 and Accounting Standard 26 on Intangible assets issued by the Institute of
Chartered Accountants of India in 2002 specifies some disclosure requirements for
companies having intangible assets in their balance sheets. These requirements have been
categorised into four sub-heads which are:
(a) Distinguish between internally generated and other intangible assets;
(b) Details of amortisation rates, method and carrying amount at beginning and end
of period;
163
(c) Classification of intangible assets; and
(d) Other disclosures like pledging information, reasons for amortising over more
than 10 years etc.
The sub-head (a) above which is distinguishing between internally generated and
other intangible assets, has a disclosure score of 8.64% in India and 34.78% in UK.
Lower disclosure score in case of Indian companies implies that not many Indian
companies, which have intangible assets in their books, are differentiating between
internally generated and acquired intangible assets.
Accounting Standard also requires that companies should give details of
amortisation rates, method and carrying amount at beginning and end of period. This
requirement has been fulfilled by all the companies which had intangible assets as a part
of their balance sheet. Disclosure score for this sub-head is 72.02% in India and 84.78%
in UK.
Another requisite of Accounting Standards is Classification of intangible assets
into separate classes. In case of Indian companies, out of 72.84% companies having
intangible assets in their balance sheet, 69.96% companies are categorising them into
classes like software, brand, licences etc. Similarly in case of UK companies, 83.70%
companies are categorising their intangible assets, out of a total of 84.78% of sample
companies which recognise intangible assets in their books of accounts.
Other disclosures like pledging information, reasons for amortising over more
than 10 years etc. have achieved a score of 2.88% in India and 13.04% in UK. Low
disclosure for this sub-head could be due to limited applicability of this disclosure
requirement.
Intangible assets Valuation
The category Intangible assets Valuation have received a disclosure score of
72.84% in India and 84.78% in UK.
164
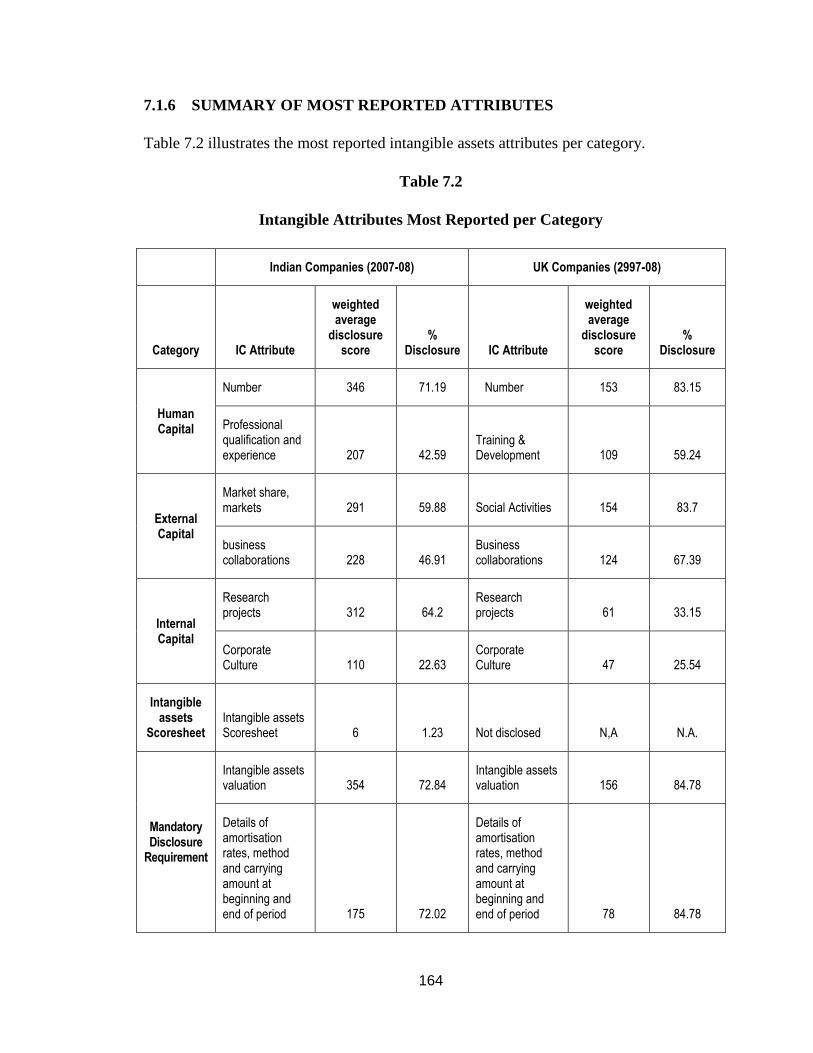
7.1.6 SUMMARY OF MOST REPORTED ATTRIBUTES
Table 7.2 illustrates the most reported intangible assets attributes per category.
Table 7.2
Intangible Attributes Most Reported per Category
Indian Companies (2007-08) UK Companies (2997-08)
Category IC Attribute
weighted average
disclosure score
% Disclosure IC Attribute
weighted average
disclosure score
% Disclosure
Human Capital
Number 346 71.19 Number 153 83.15
Professional qualification and experience 207 42.59
Training & Development 109 59.24
External Capital
Market share, markets 291 59.88 Social Activities 154 83.7
business collaborations 228 46.91
Business collaborations 124 67.39
Internal Capital
Research projects 312 64.2
Research projects 61 33.15
Corporate Culture 110 22.63
Corporate Culture 47 25.54
Intangible assets
Scoresheet Intangible assets Scoresheet 6 1.23 Not disclosed N,A N.A.
Mandatory Disclosure
Requirement
Intangible assets valuation 354 72.84
Intangible assets valuation 156 84.78
Details of amortisation rates, method and carrying amount at beginning and end of period 175 72.02
Details of amortisation rates, method and carrying amount at beginning and end of period 78 84.78
165
The attribute “Number of employees” and “Professional qualification and
experience” in case of Indian companies whereas attribute “Number of employees” and
“Training and development” in case of UK companies are the most reported attributes
from the human capital category.
“Market share, markets” and “Business collaboration” in Indian context and
“Social Activities” and “Business collaboration” in UK context are most highly
disclosed attributes in external capital category.
Focussing on internal capital category, ranking profiles are broadly similar for
both the countries. “Research projects” and “Corporate culture” are the most reported
intangible assets attributes.
Similarly for mandatory disclosure requirement category, “Intangible assets
valuation” and “Details of amortisation rates, method and carrying amount at beginning
and end of period” are most disclosed attributes in the annual reports of both India and
UK.
SECTION II
7.2 NATURE OF INTANGIBLE ASSETS DISCLOSURE
After explaining in detail the extent of disclosure it is very essential to discuss
about the nature of reporting of intangible assets. Nature of intangible assets disclosure
involves distinguishing between qualitative and quantitative nature of reporting.
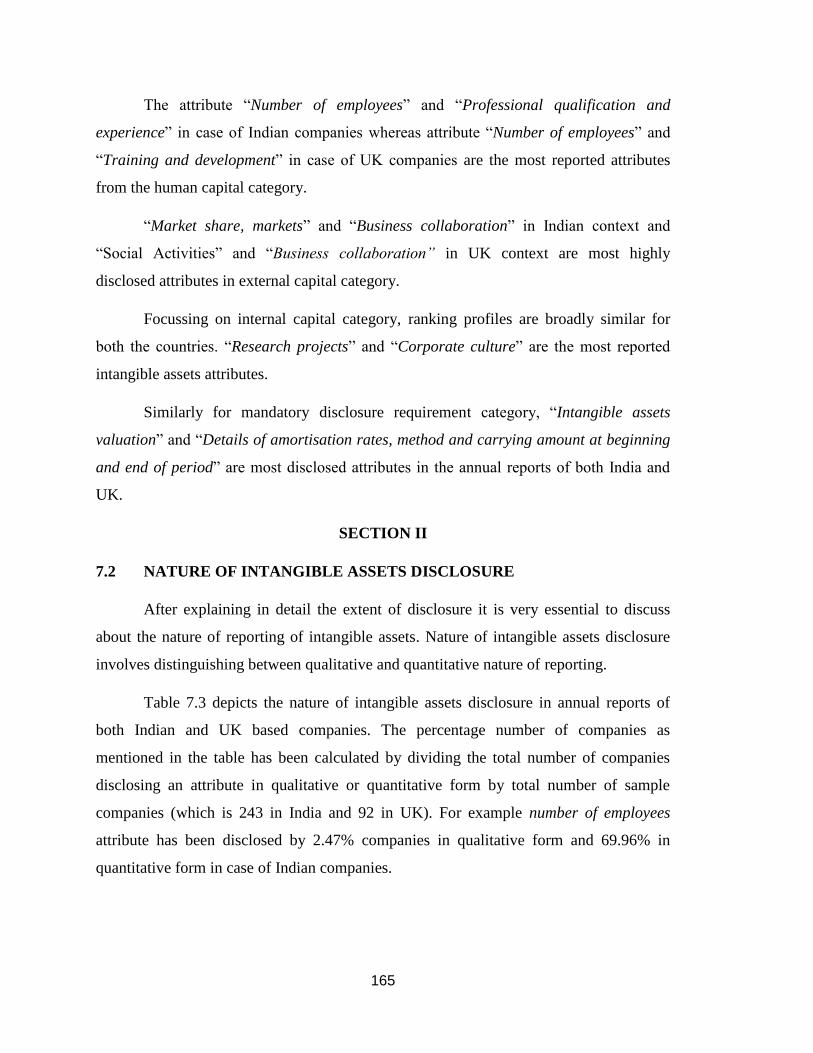
Table 7.3 depicts the nature of intangible assets disclosure in annual reports of
both Indian and UK based companies. The percentage number of companies as
mentioned in the table has been calculated by dividing the total number of companies
disclosing an attribute in qualitative or quantitative form by total number of sample
companies (which is 243 in India and 92 in UK). For example number of employees
attribute has been disclosed by 2.47% companies in qualitative form and 69.96% in
quantitative form in case of Indian companies.

166
Table 7.3
Nature of intangible assets disclosure (in percentage)
Attributes
Number of companies (in percent)
India UK
Qualitative Disclosure
Quantitative Disclosure
Qualitative Disclosure
Quantitative Disclosure
HUMAN CAPITAL
Employees
-Number 2.47 69.96 1.09 82.61
-Gender 1.65 1.23 3.26 21.74
-Professional qualification and Experience 7 39.09 0 1.09
-Compensation 8.64 37.45 10.87 6.52
Training & Development 39.51 18.93 35.87 41.30
Work related knowledge 2.88 0.41 1.09 0
Entrepreneurial Spirit 4.12 0.41 2.17 0
Human resource accounting 0 1.23 0 0
EXTERNAL CAPITAL
Brands and their specification 26.75 30.86 22.83 33.70
brand valuation 0 1.23 7.61 1.09
Distribution channels 29.22 27.57 26.09 32.61
Market share, markets 34.16 42.80 40.22 43.48
Business collaboration 19.75 37.04 13.04 60.87
Customer satisfaction 10.29 3.29 6.52 7.61
Customer information (no.) 7.41 23.05 8.70 38.04
Social activities 23.46 30.45 10.87 78.26
INTERNAL CAPITAL
Research projects 12.35 58.02 18.48 23.91
Networking and information systems 20.99 5.35 26.09 5.43
Organisation Structure 4.12 3.70 5.43 4.35
Cont…
167
Attributes
Number of companies (in percent)
India UK
Qualitative Disclosure
Quantitative Disclosure
Qualitative Disclosure
Quantitative Disclosure
Corporate culture 43.62 0.82 44.57 3.26
Patents 2.88 15.64 3.26 6.52
Copyrights 1.23 0.82 0 0
Trademarks 2.47 5.76 7.61 4.35
INTANGIBLE ASSETS SCORESHEET 0 1.23 0 0
MANDATORY DISCLOSURE REQUIREMENTS
Distinguish between internally generated and other intangible assets 8.64 N.A. 34.78 N.A.
Details of amortisation rates, method and carrying amount at beginning and end of period 72.02 N.A. 84.78 N.A.
Classification of intangible assets 69.96 N.A. 83.70 N.A.
Other disclosures like pledging information, reasons for amortising over more than 10 years etc 2.88 N.A. 13.04 N.A.
Intangible assets valuation 0 72.84 0 84.78

168
Table 7.3 brings out that nature of intangible assets reporting is more or less the
same in case of both the countries. Disclosure is more in discursive (Qualitative) form
rather than numerical (Quantitative) form. This finding is not unexpected with the
difficulty involved in quantifying what is, in many instances, essentially a qualitative
item. The detailed attribute-wise nature of intangible assets reporting is discussed below.
7.2.1 HUMAN CAPITAL
In human capital category, the attribute Number of Employees has been disclosed
by 69.96% companies in quantitative form and 2.47% companies in qualitative form in
India. Similarly in UK large number of companies (82.61%) is reporting this attribute in
quantitative form and only few companies (1.09%) are disclosing it in qualitative form.
The attribute Gender is more widely reported in the UK. In India only 1.23%
companies are disclosing this attribute in quantitative manner whereas the percentage of
companies disclosing it quantitatively is 21.74% in UK.
Contrary to the above results, for attributes Professional qualification &
experience and Compensation quantitative disclosure is more in case of Indian
companies. Further, the attribute Training and development has been reported by 39.51%
companies in qualitative form and 18.93% in quantitative manner in case of Indian
sample. It has been reported by 35.87% companies in qualitative form and 41.30% in
quantitative form in the UK.
As discussed in Section-I the disclosure on attributes Work-related knowledge and
Entrepreneurial spirit is minimal in case of both the countries. Regarding the nature of
reporting while none of the company is disclosing it in quantitative form in UK, 0.41%
companies are reporting this attributes in quantitative form in India. Further the attribute
Human resource accounting has been reported only by 1.23% Indian companies in
quantitative form.
7.2.2 EXTERNAL CAPITAL
For most companies the attributes in external capital category are reported in
quantitative rather than qualitative form. The nature of reporting seems similar in case of
both the sample sets.
169
For instance the attribute Brands and their descriptions have been reported by
26.75% companies in discursive form and 30.86% in numerical form in case of Indian
companies. Similarly for UK based companies this attribute has been reported by 22.83%
companies in qualitative form and 33.70% companies in quantitative form.
In India the attribute Brand valuation has been reported by only 1.23% companies
in quantitative form. While it has been disclosed by 7.61% companies in qualitative form
and 1.09% companies in quantitative form by UK companies
Further the attribute Distribution channels has been disclosed qualitatively by
29.22% companies in India and 26.09% companies in UK. This attribute has been
reported quantitatively by 27.57% companies in India and 32.61% companies in UK.
The attribute Markets and market share has been disclosed by 34.16% and 42.8%
Indian companies in qualitative and quantitative form respectively. The disclosure in
both forms is 40.22% and 43.48% in case of UK companies.
The nature of reporting appears to be more in quantitative form in case of attribute
Business collaborations in case of both the countries. 37.04% companies in India and
60.87% companies in UK are disclosing this attribute in quantitative form.
Disclosure for the attribute Customer satisfaction is in discursive manner
(10.29%) rather than quantitative form (3.29%) in India. The disclosure for this attribute
in UK is 6.52% in qualitative form and 7.61% in quantitative form.
The attribute Social has been disclosed by 23.46% Indian companies and 10.87%
UK companies in discursive form. It has been reported by 30.45% companies in India
and more than double (78.26%) UK companies in quantitative form
In nutshell there is similarity in the nature of reporting of attributes in external
capital category. The quantitative nature of disclosure is more in case of UK based
companies.
7.2.3 INTERNAL CAPITAL
As referred in section-I that the extent of disclosure on attributes in internal
capital category has not been very high in case of both the countries. The nature of
reporting on attributes of this category is also similar for both the countries.
170
The attribute Research activities has been reported by 12.35% companies in India
and 18.98% companies in UK in qualitative form. The number of companies reporting
this attribute in quantitative form is 58.02% in India and 23.91% in UK.
The reporting on attribute Networking and information systems is identical in
India and UK. This attribute has been disclosed in qualitative manner by 20.99% and
26.09% companies in India and UK respectively.
The reporting on the attribute Organisation structure is low in both the countries.
The manner of reporting is also similar. 4.12% and 3.7% companies in India are
disclosing this attribute in discursive and numerical form respectively. Similarly, 5.43%
and 4.35% companies in UK are reporting on this attribute in qualitative and quantitative
form respectively.
The attribute Corporate culture has been disclosed by both Indian and UK
companies in qualitative form. The number of countries disclosing this attribute in
quantitative form is 0.82% and 3.26% in India and UK.
Finally, as shown in table 7.3 the nature of reporting for attributes Patents,
Copyrights and Trademarks is also similar in case of both the countries.
7.2.4 INTANGIBLE ASSETS SCORESHEET
This attribute has been disclosed by very few (1.23%) companies in India. None
of the company in UK is disclosing this attribute in qualitative or quantitative form
7.2.5 MANDATORY DISCLOSURE REQUIREMENT
Intangible assets valuation attribute in this category has been disclosed by all companies
in quantitative form.2
SECTION-III
7.3 CATEGORY-WISE ANALYSIS
In this section, aggregated disclosure scores of intangible assets for each of the
five categories i.e. human capital, external capital and internal capital, intangible assets
2 Disclosure relating to remaining attributes in this category is of qualitative nature only

171
scoresheet and mandatory disclosure requirements has been calculated. This is to
determine the highest reported intangible assets category out of the five categories
mentioned above, for India and the UK. Table 7.4 and figure 7.1 & 7.2 shows the
different categories of intangible assets index and total score (in percent) for each
category for both the countries.
Table 7.3
Category-wise Disclosure
Categories India (2007-08)
UK
(2007-08)
Human Capital 27% 22%
External Capital 36% 43%
Internal Capital 18% 12%
Intangible assets scoresheet 0% 0%
Mandatory Disclosure Requirements 20% 23%
Note: Disclosure percentages have been calculated using the weighted means

172
Figure 7.1
Category-wise intangible assets disclosure (India)
27%
36%
18%
0%
20%
Human Capital External Capital
Internal Capital Intangible assets scoresheet
Mandatory Disclosure Requirements
Figure 7.2
Category-wise intangible assets disclosure (UK)
22%
43%
12%
0%
23%
Human Capital External Capital
Internal Capital Intangible assets scoresheet
Mandatory Disclosure Requirements
173
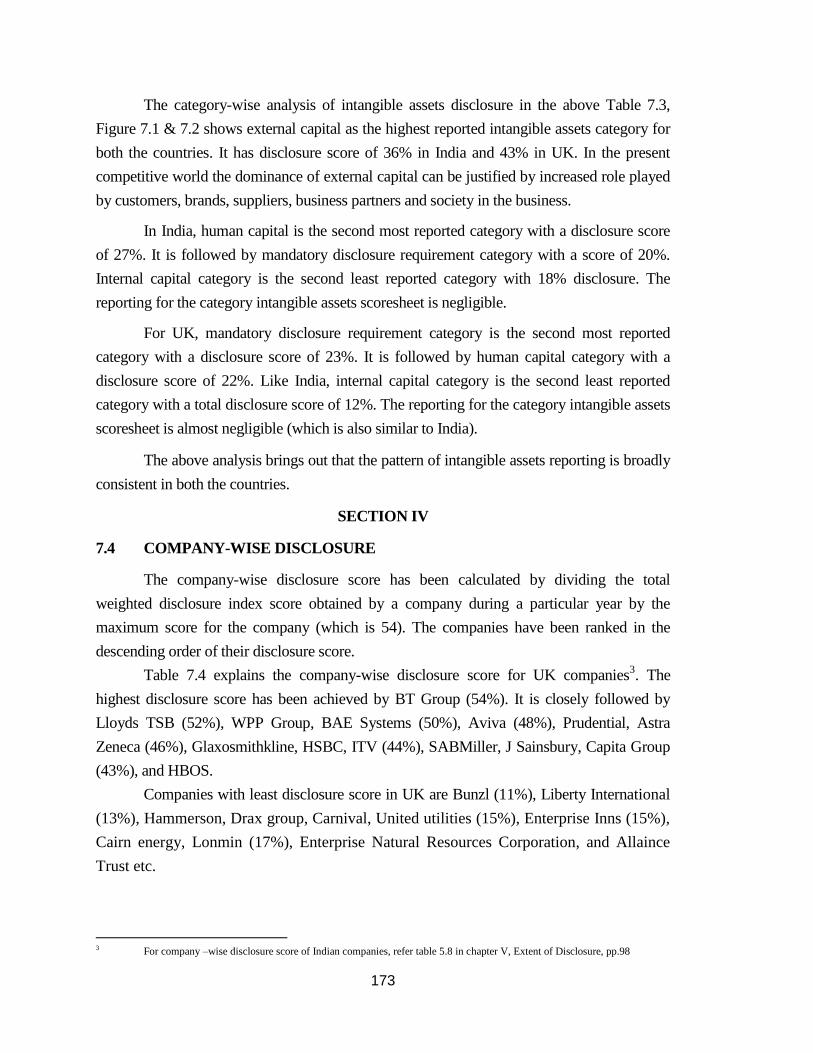
The category-wise analysis of intangible assets disclosure in the above Table 7.3,
Figure 7.1 & 7.2 shows external capital as the highest reported intangible assets category for
both the countries. It has disclosure score of 36% in India and 43% in UK. In the present
competitive world the dominance of external capital can be justified by increased role played
by customers, brands, suppliers, business partners and society in the business.
In India, human capital is the second most reported category with a disclosure score
of 27%. It is followed by mandatory disclosure requirement category with a score of 20%.
Internal capital category is the second least reported category with 18% disclosure. The
reporting for the category intangible assets scoresheet is negligible.
For UK, mandatory disclosure requirement category is the second most reported
category with a disclosure score of 23%. It is followed by human capital category with a
disclosure score of 22%. Like India, internal capital category is the second least reported
category with a total disclosure score of 12%. The reporting for the category intangible assets
scoresheet is almost negligible (which is also similar to India).
The above analysis brings out that the pattern of intangible assets reporting is broadly
consistent in both the countries.
SECTION IV
7.4 COMPANY-WISE DISCLOSURE
The company-wise disclosure score has been calculated by dividing the total
weighted disclosure index score obtained by a company during a particular year by the
maximum score for the company (which is 54). The companies have been ranked in the
descending order of their disclosure score.
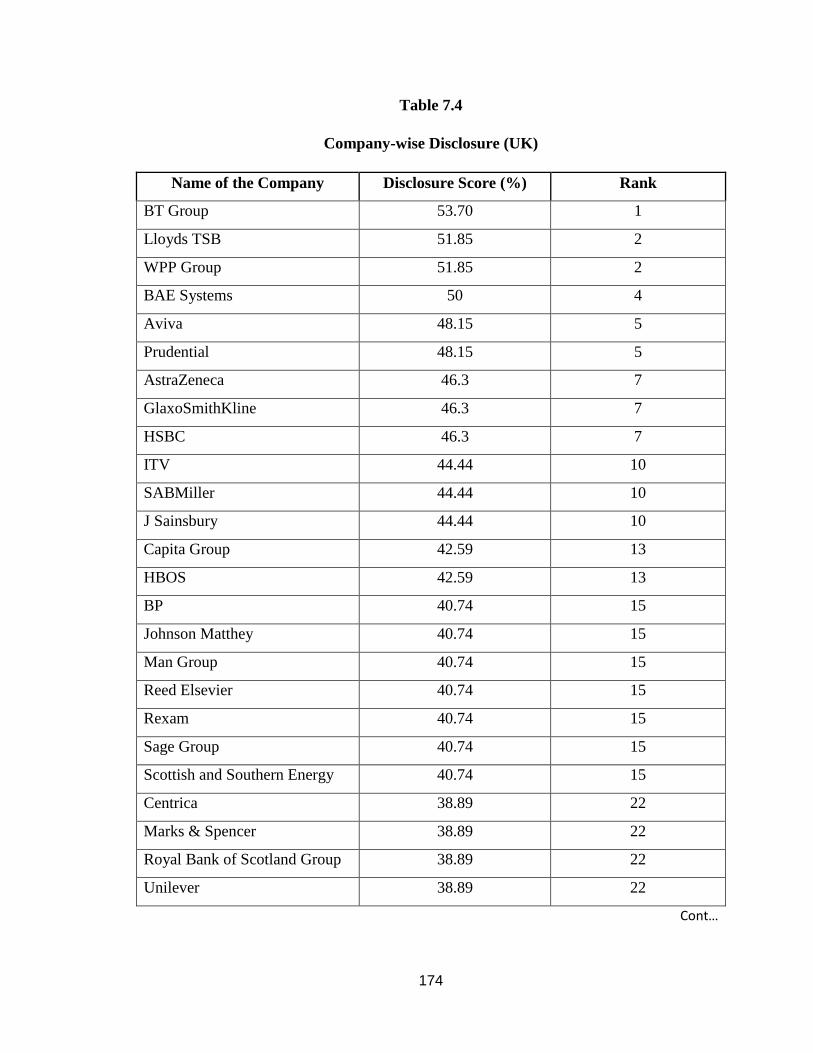
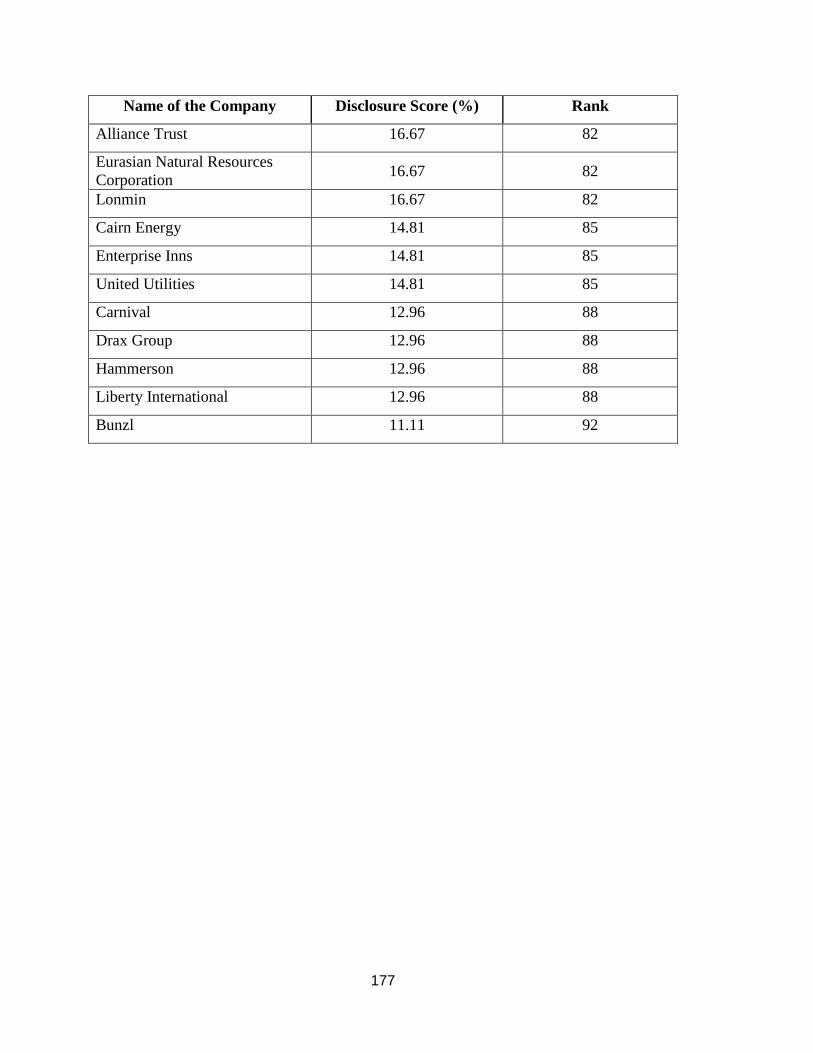
Table 7.4 explains the company-wise disclosure score for UK companies3. The
highest disclosure score has been achieved by BT Group (54%). It is closely followed by
Lloyds TSB (52%), WPP Group, BAE Systems (50%), Aviva (48%), Prudential, Astra
Zeneca (46%), Glaxosmithkline, HSBC, ITV (44%), SABMiller, J Sainsbury, Capita Group
(43%), and HBOS.
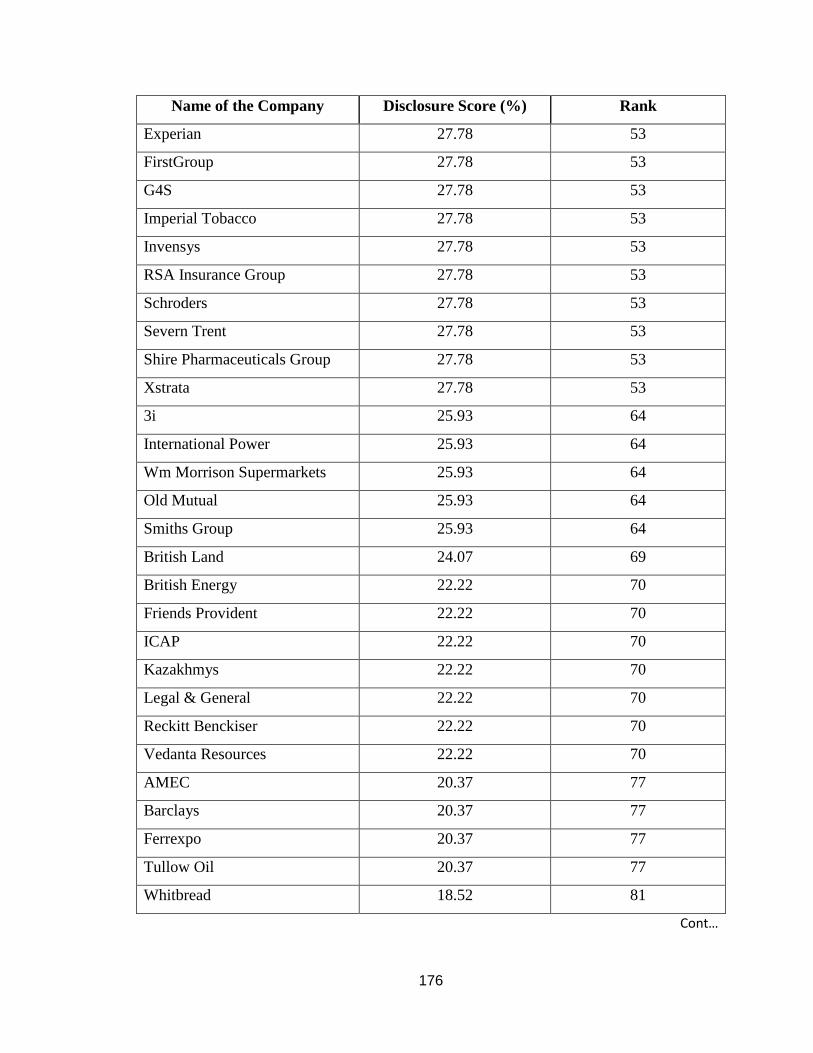
Companies with least disclosure score in UK are Bunzl (11%), Liberty International
(13%), Hammerson, Drax group, Carnival, United utilities (15%), Enterprise Inns (15%),
Cairn energy, Lonmin (17%), Enterprise Natural Resources Corporation, and Allaince
Trust etc.
3 For company –wise disclosure score of Indian companies, refer table 5.8 in chapter V, Extent of Disclosure, pp.98
174
Table 7.4
Company-wise Disclosure (UK)
Name of the Company Disclosure Score (%) Rank
BT Group 53.70 1
Lloyds TSB 51.85 2
WPP Group 51.85 2
BAE Systems 50 4
Aviva 48.15 5
Prudential 48.15 5
AstraZeneca 46.3 7
GlaxoSmithKline 46.3 7
HSBC 46.3 7
ITV 44.44 10
SABMiller 44.44 10
J Sainsbury 44.44 10
Capita Group 42.59 13
HBOS 42.59 13
BP 40.74 15
Johnson Matthey 40.74 15
Man Group 40.74 15
Reed Elsevier 40.74 15
Rexam 40.74 15
Sage Group 40.74 15
Scottish and Southern Energy 40.74 15
Centrica 38.89 22
Marks & Spencer 38.89 22
Royal Bank of Scotland Group 38.89 22
Unilever 38.89 22
Cont…

175
Name of the Company Disclosure Score (%) Rank
Associated British Foods 37.04 26
British American Tobacco 37.04 26
National Grid 37.04 26
Rolls-Royce Group 37.04 26
TUI Travel 37.04 26
BG Group 35.19 31
British Airways 35.19 31
Cable & Wireless 35.19 31
Tesco 35.19 31
Admiral Group 33.33 35
Cadbury 33.33 35
Compass Group 33.33 35
InterContinental Hotels Group 33.33 35
Kingfisher 33.33 35
London Stock Exchange Group 31.48 40
Antofagasta 29.63 41
Carphone Warehouse 29.63 41
Cobham 29.63 41
Diageo 29.63 41
Next 29.63 41
Petrofac 29.63 41
Rio Tinto Group 29.63 41
Royal Dutch Shell 29.63 41
Standard Chartered Bank 29.63 41
Thomas Cook Group 29.63 41
Wolseley 29.63 41
Wood Group 29.63 41
Anglo American 27.78 53
Cont…
176
Name of the Company Disclosure Score (%) Rank
Experian 27.78 53
FirstGroup 27.78 53
G4S 27.78 53
Imperial Tobacco 27.78 53
Invensys 27.78 53
RSA Insurance Group 27.78 53
Schroders 27.78 53
Severn Trent 27.78 53
Shire Pharmaceuticals Group 27.78 53
Xstrata 27.78 53
3i 25.93 64
International Power 25.93 64
Wm Morrison Supermarkets 25.93 64
Old Mutual 25.93 64
Smiths Group 25.93 64
British Land 24.07 69
British Energy 22.22 70
Friends Provident 22.22 70
ICAP 22.22 70
Kazakhmys 22.22 70
Legal & General 22.22 70
Reckitt Benckiser 22.22 70
Vedanta Resources 22.22 70
AMEC 20.37 77
Barclays 20.37 77
Ferrexpo 20.37 77
Tullow Oil 20.37 77
Whitbread 18.52 81
Cont…
177
Name of the Company Disclosure Score (%) Rank
Alliance Trust 16.67 82
Eurasian Natural Resources
Corporation 16.67 82
Lonmin 16.67 82
Cairn Energy 14.81 85
Enterprise Inns 14.81 85
United Utilities 14.81 85
Carnival 12.96 88
Drax Group 12.96 88
Hammerson 12.96 88
Liberty International 12.96 88
Bunzl 11.11 92
178
The above table reveals that the range of disclosure score of the UK companies
varies from 11.11 to 53.70. It is 1.85% to 57.41% for Indian companies (after excluding
two outperforming companies i.e. Infosys Technologies Ltd. and Satyam Computer
Services Ltd.).
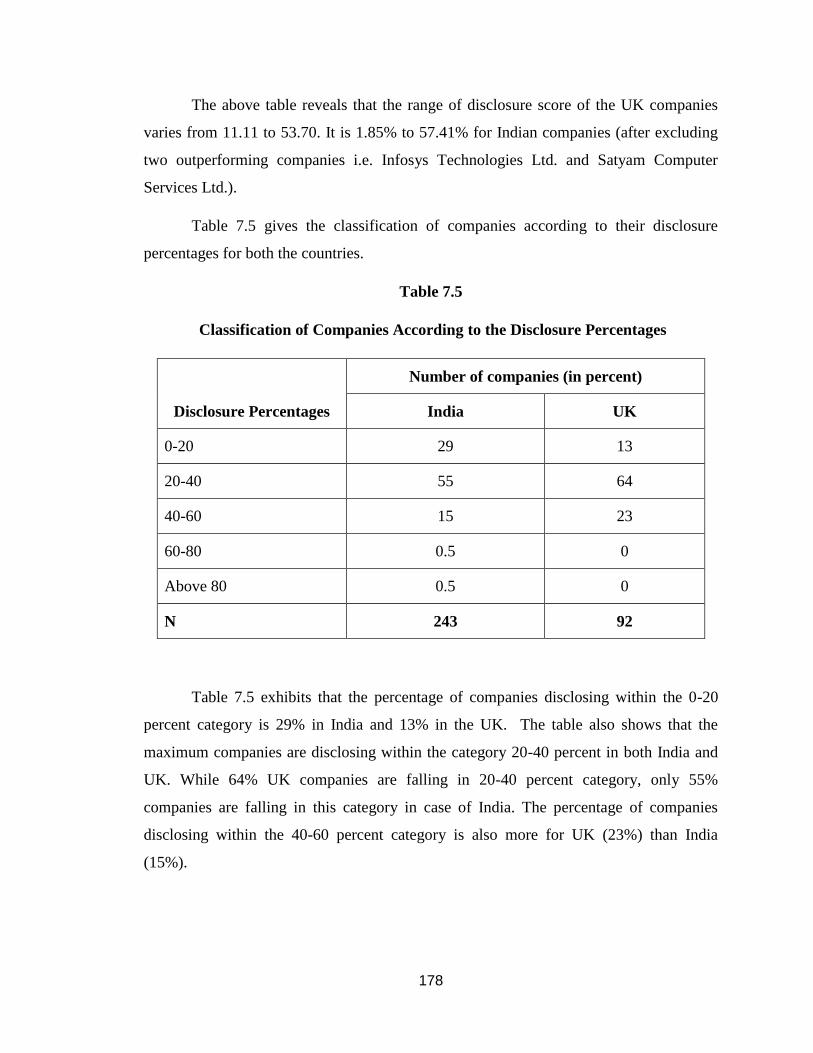
Table 7.5 gives the classification of companies according to their disclosure
percentages for both the countries.
Table 7.5
Classification of Companies According to the Disclosure Percentages
Disclosure Percentages
Number of companies (in percent)
India UK
0-20 29 13
20-40 55 64
40-60 15 23
60-80 0.5 0
Above 80 0.5 0
N 243 92
Table 7.5 exhibits that the percentage of companies disclosing within the 0-20
percent category is 29% in India and 13% in the UK. The table also shows that the
maximum companies are disclosing within the category 20-40 percent in both India and
UK. While 64% UK companies are falling in 20-40 percent category, only 55%
companies are falling in this category in case of India. The percentage of companies
disclosing within the 40-60 percent category is also more for UK (23%) than India
(15%).
179
Further only 0.5% Indian companies are within the disclosure range of 60-80
percent and Above 80 percent. None of the UK based company is in this disclosure
range.
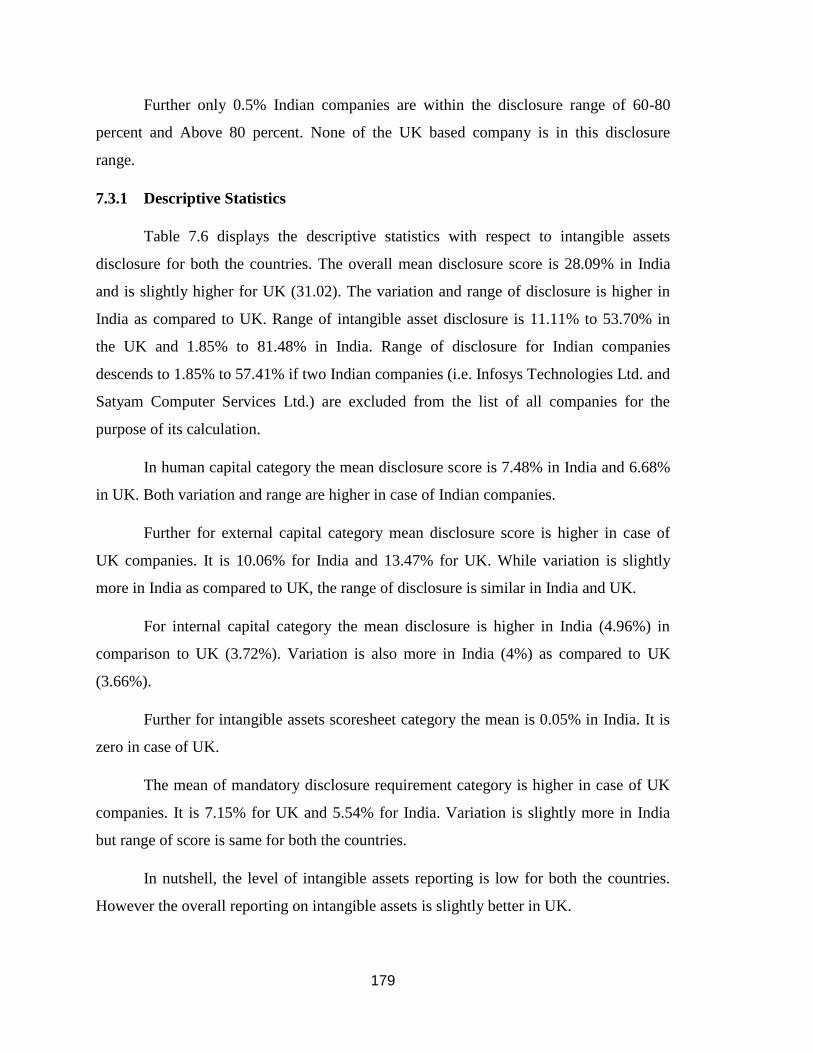
7.3.1 Descriptive Statistics
Table 7.6 displays the descriptive statistics with respect to intangible assets
disclosure for both the countries. The overall mean disclosure score is 28.09% in India
and is slightly higher for UK (31.02). The variation and range of disclosure is higher in
India as compared to UK. Range of intangible asset disclosure is 11.11% to 53.70% in
the UK and 1.85% to 81.48% in India. Range of disclosure for Indian companies
descends to 1.85% to 57.41% if two Indian companies (i.e. Infosys Technologies Ltd. and
Satyam Computer Services Ltd.) are excluded from the list of all companies for the
purpose of its calculation.
In human capital category the mean disclosure score is 7.48% in India and 6.68%
in UK. Both variation and range are higher in case of Indian companies.
Further for external capital category mean disclosure score is higher in case of
UK companies. It is 10.06% for India and 13.47% for UK. While variation is slightly
more in India as compared to UK, the range of disclosure is similar in India and UK.
For internal capital category the mean disclosure is higher in India (4.96%) in
comparison to UK (3.72%). Variation is also more in India (4%) as compared to UK
(3.66%).
Further for intangible assets scoresheet category the mean is 0.05% in India. It is
zero in case of UK.
The mean of mandatory disclosure requirement category is higher in case of UK
companies. It is 7.15% for UK and 5.54% for India. Variation is slightly more in India
but range of score is same for both the countries.
In nutshell, the level of intangible assets reporting is low for both the countries.
However the overall reporting on intangible assets is slightly better in UK.
180
Table 7.6
Descriptive Statistics of Indian (n=243) and UK (n=92) companies
Mean Median
Std.
Deviation Minimum Maximum
Overall Index
India 28.09 27.78 12.45 1.85 81.48
UK 31.01 29.63 10.27 11.11 53.70
Human capital
India 7.48 7.41 4.51 0 22.22
UK 6.68 7.41 3.61 0 14.81
External Capital
India 10.07 9.26 5.91 0 24.07
UK 13.47 12.96 5.43 1.85 25.93
Internal capital
India 4.96 3.70 4 0 20.37
UK 3.72 3.70 3.67 0 16.67
Intangible assets
scoresheet
India 0.05 0 0.41 0 3.70
UK 0 0 0 0 0
Mandatory
Disclosure
Requirements
India 5.54 7.41 3.48 0 11.11
UK 7.15 7.41 3.26 0 11.11
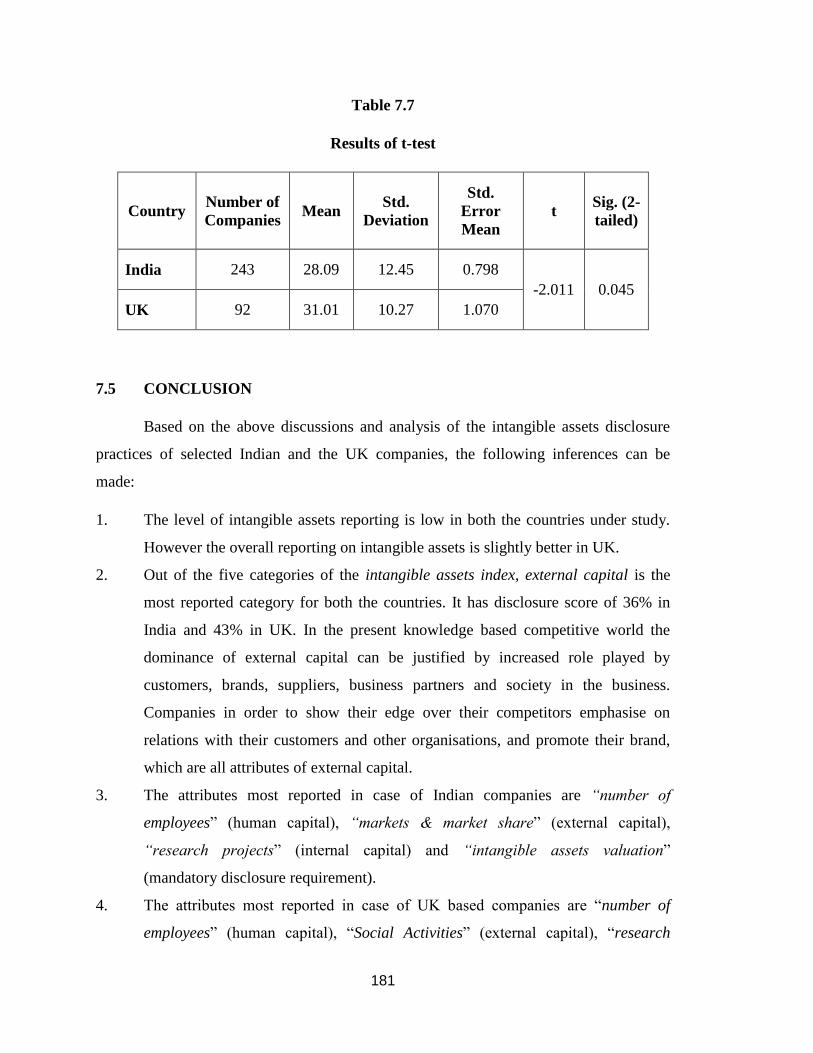
In order to prove any significant difference in the level of intangible assets
disclosure in India and UK, t-test was conducted. The pre-condition of equal variances of
t-test was satisfied by conducting Levene’s test of homogeneity of variance. The results
of t-test have been shown in table 7.7. The value of t (-2.011) is negative and significant
at 5% level of significance. It shows that the extent of disclosure is low in India as
compared to UK. The difference in intangible assets disclosure of both countries is
significant at 5% level of significance.
181
Table 7.7
Results of t-test
Country Number of
Companies Mean
Std.
Deviation
Std.
Error
Mean
t Sig. (2-
tailed)
India 243 28.09 12.45 0.798
-2.011 0.045
UK 92 31.01 10.27 1.070
7.5 CONCLUSION
Based on the above discussions and analysis of the intangible assets disclosure
practices of selected Indian and the UK companies, the following inferences can be
made:
1. The level of intangible assets reporting is low in both the countries under study.
However the overall reporting on intangible assets is slightly better in UK.
2. Out of the five categories of the intangible assets index, external capital is the
most reported category for both the countries. It has disclosure score of 36% in
India and 43% in UK. In the present knowledge based competitive world the
dominance of external capital can be justified by increased role played by
customers, brands, suppliers, business partners and society in the business.
Companies in order to show their edge over their competitors emphasise on
relations with their customers and other organisations, and promote their brand,
which are all attributes of external capital.
3. The attributes most reported in case of Indian companies are “number of
employees” (human capital), “markets & market share” (external capital),
“research projects” (internal capital) and “intangible assets valuation”
(mandatory disclosure requirement).
4. The attributes most reported in case of UK based companies are “number of
employees” (human capital), “Social Activities” (external capital), “research

182
projects” (internal capital) and “intangible assets valuation” (mandatory
disclosure requirement).
5. The nature of intangible assets reporting is more or less the same for UK and
India. Disclosure is more in discursive (Qualitative) form rather than numerical
(Quantitative) form for both the countries. Lack of consensus about the need of
the disclosure and the manner of disclosing it in the annual report might be a
cause for low level of quantification.
6. In India Infosys Technologies Ltd. has the highest intangible assets disclosure
score. BT Group has highest intangible assets disclosure score in the UK.
7. Overall mean disclosure score is 28.09% for Indian companies and 31.01% for
UK companies. The result of T-test showed that these differences are significant.
8. The range of mean disclosure score is higher for Indian companies (1.85% to
81.48%) than UK companies (11.11% to 53.70%). The range of disclosure score
descends to 1.85% to 57.41% for Indian companies, if mean scores of two
outperforming companies (namely Infosys Technologies Ltd. and Satyam
Computer Services Ltd.) are excluded from the data for the purpose of its
calculation.
9. Reporting of intangible assets is very unorganised and unsystematic in both the
countries. The lack of established and generally accepted intangible assets
reporting framework could have contributed to it.


![INTANGIBLE VALUE –FACT OR FICTION - AI Home | … · [IAS 38.8] 3. INTANGIBLE VALUE –FACT OR FICTION ... 2.36 INTANGIBLE PROPERTY (INTANGIBLE ASSETS): Non-physical assets, …](https://img.pdfslide.us/doc/110x75/5af0812f7f8b9ac2468e1bc2/intangible-value-fact-or-fiction-ai-home-ias-388-3-intangible-value.jpg)