Embed Size (px)
Citation preview
Disclosure and determinants studies: An extension using the
divisive clustering method (DIV)
Yuan Dinga, Linghui Fub, Hervé Stolowya and Huiwen Wangb
aHEC School of Management, Paris, France
bBeihang University, Beijing, P.R. China
Corresponding author: Hervé Stolowy, Department of Accounting and Management Control, HEC School of Management, 1, rue de la Liberation, 78351 - Jouy-en-Josas, France, Email: [email protected]. Acknowledgments: Yuan Ding and Hervé Stolowy are members of the Research Center on Financial Information (GREGHEC, CNRS, FRE 2810). The authors have benefited from helpful comments from Michel Tenenhaus, Marie Chavent, workshop participants at the University of Bordeaux IV (CRECCI, France, 2003), the International Conference on Research Methods “Crossing frontiers in quantitative and qualitative research methods” (Lyon, France, 2004) and the EAA Annual meeting (Prague, Czech Republic, 2004). Hervé Stolowy received financial support from HEC Paris (project A0426). Yuan Ding and Hervé Stolowy would also like to thank Nicolas Loock and Germain Le Graverend for their able research assistance. Finally, the authors are indebted to Ann Gallon for her much appreciated editorial help.

1
Disclosure and determinants studies: An extension using the
divisive clustering method (DIV)
Abstract Disclosure and determinants studies have been extensively carried out in past accounting research. However, they have one major methodological drawback: the disclosure analysis in these studies is often limited to the determination of the disclosure index, i.e. the sum of disclosed items, weighted or unweighted. The disclosure profile (which reflects the structure of published information) is generally not used in the research design. The objective of this paper is to introduce a divisive (descendant) clustering method which splits the sample into homogeneous sub-groups corresponding to disclosure patterns (or profiles), for clearer determination of the financial characteristics of each group. This methodology is illustrated by a study of disclosure on provisions by large French firms. The results show that the disclosure pattern is related to provision intensity, size, leverage, profit and market expectation, but not to return and industry. This new research method is a valuable complement to expand on disclosure and determinants studies, moving from disclosure levels to disclosure patterns.
Résumé De nombreuses études des déterminants de la publication d’information financière ont réalisées dans le cadre de la recherche en comptabilité financière. Cependant, elles souffrent d’une difficulté méthodologique majeure. L’étude de l’information publiée se limite souvent à la détermination d’un score d’items, pondérés ou pas. Le « profil » (structure) de l’information publiée n’est pas, en général, utilisé(e) dans la recherche. L’objectif de la présente recherche est de présenter une méthode de classification descendante dite « divisive ». Cette technique décompose l’échantillon global en sous-groupes homogènes qui correspondent à des profils de publication. Ceci permet, dans un second temps, de mieux étudier les caractéristiques financières de chaque sous-groupe. Cette méthodologie est illustrée par une étude de l’information publiée par les grands groupes français en matière de provisions pour risques et charges. Les résultats montrent que le profil de publication est lié à l’intensité des provisions, la taille, l’endettement, le profit et les attentes du marché, mais pas au rendement et à l’industrie. Cette nouvelle méthodologie de recherche est un complément utile pour développer les études des déterminants des publications, afin de passer de l’étude du niveau de publication au profil de publication.
Key words Disclosure – Determinants – Provisions – France – Size – Clustering method
Mots clés Publication – Déterminants – Provisions – France – Taille – Méthode de classification
2
1. Introduction
Accounting disclosure and determinants analysis is a major issue in accounting research (see
the abundant literature reviewed in the next section). Researchers try to answer two major
questions: (1) What attitude do firms take towards accounting disclosure, either general or
specific (e.g. disclosure on business segments, R&D activities, environmental protects, social
responsibility, etc.)? (2) Why do some firms disclose more (or less) than others? The first
research question is known as disclosure level evaluation and the second one as disclosure
determinants analysis.
The most common method used in the literature consists of calculating a firm-based
disclosure score and then running a multivariate linear regression, with this score as
dependent variable, and various characteristics (financial or otherwise) of the related firm
(firm size, leverage, financial performance, industry, listing status, audit firm size, etc.) as
independent variables.
However, there are several limitations to this methodological approach. (1) The
disclosure index is often determined by totaling several items. These items can be weighted or
unweighted; many papers mention this issue but there is no one dominant practice. (2) The
more independent variables the model contains, the more interesting it will be and the easier it
will be to find explanations of a particular disclosure behavior. However, the inclusion of too
many variables may create a multicollinearity difficulty (Wallace et al., 1994). Several
solutions have been proposed, including the regression of several separate models based on a
selection of independent variables or a factor analysis of all independent variables (Bah and
Dumontier, 2001). (3) The form of the relationship between dependent and independent
variables is not always known (Lang and Lundholm, 1993; Cooke, 1998). A “classical” linear
regression cannot systematically be the most suitable tool, and rank regression may appear an
appropriate solution. These three limitations have been discussed in the literature to a greater
or lesser extent. However, by aggregating the different disclosure items into one disclosure
index, all the existing studies retain only the quantity of disclosure (or the disclosure level).
The firms’ disclosure patterns and preferences are totally lost in the analysis, although the
information is present in the data collected.
The main objective of this paper is thus to propose a new methodological approach to
analyze firm’s disclosure practices and their determinants. Besides the traditional way of
analyzing the disclosure level and its determinants as described above, we introduce a DIV
(divisive clustering method) analysis to understand the different disclosure patterns. We then
explore the determinants of each disclosure pattern.

3
This method is illustrated with data on the disclosure of information on provisions
collected by analyzing the 2001 annual reports of French listed industrial and commercial
firms belonging to the SBF 120 index.
Although the results of the classical linear regression are rather weak, they are improved
using the rank regression. However, the most interesting results are produced by the DIV
analysis. We find that the disclosure pattern is related to provision intensity, size, leverage,
profit and market expectation, but not to return and industry. We also find that the group
which discloses the greatest amount of information has the highest proportion of provisions,
size, leverage, profit and market expectation.
The rest of the paper proceeds as follows. The next section provides a literature review
on voluntary disclosure, disclosure adequacy and their determinants and discusses the
methodological issues. Section 3 lays out the hypotheses. Section 4 explains our sample and
data collection. Section 5 discusses our research design. Section 6 presents the empirical
findings, and section 7 concludes the paper.
2. Literature review and methodological issues
Principle of disclosure studies
Healy and Palepu (2001), and a discussion by Core (2001), provide a broad overview of the
empirical disclosure literature. More specifically, many researchers have been interested in
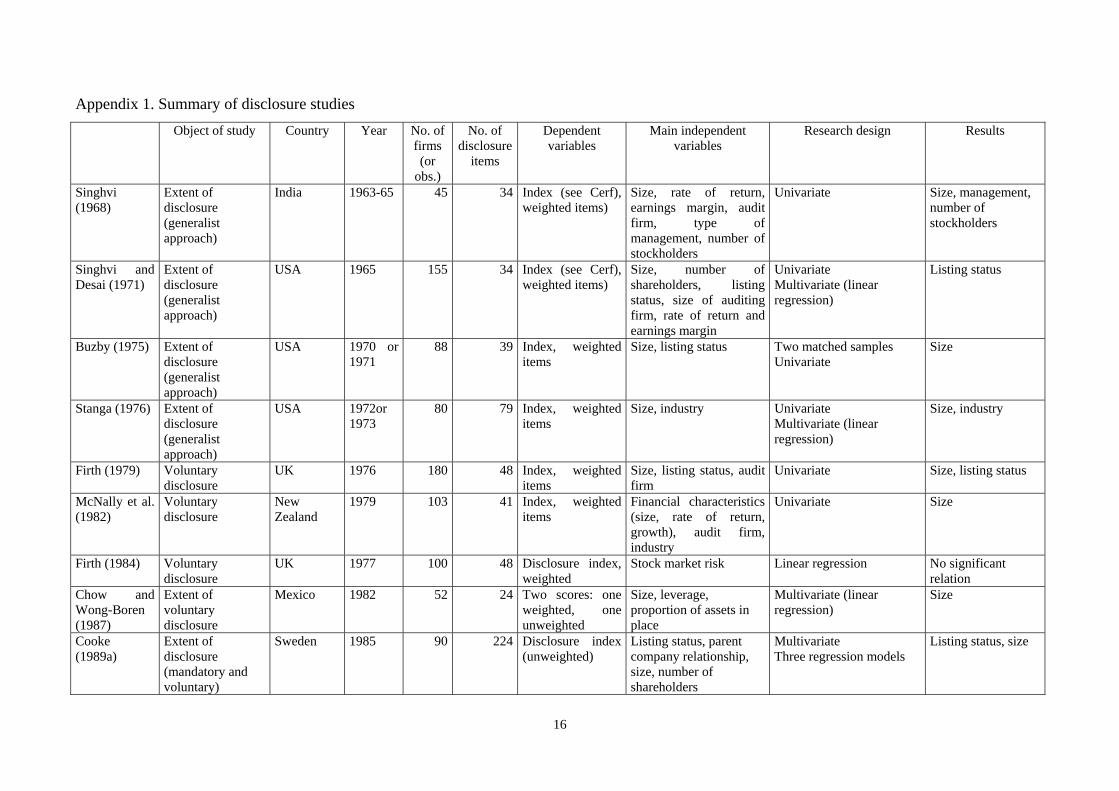
the corporate characteristics that could predict the disclosure level of a firm. We summarize
the abundant literature in Appendix 1; the reader can also refer to Ahmed and Courtis (1999)
who published a meta-analysis of 29 disclosure studies. The fact is that many firms exceed the
disclosure requirements by providing information not required by the existing law or
accounting standards (Dumontier and Raffournier, 1999). This increasing transparency is
supposed to help reduce the firm’s agency and political costs. For example, in his study,
Raffournier (1995) tried to explain the voluntary disclosure level of Swiss firms by their size,
share listing, profitability, ownership structure, use of external financing, size of auditing firm,
internationality and industry type. In a literature review on firms’ voluntary disclosure
decisions, Healy and Palepu (2001) analyze managers’ reporting and disclosure decisions in a
capital markets setting. They argue that six forces affect managers’ disclosure decisions for
capital market reasons: capital market transactions, corporate control contests, stock
compensation, litigation, proprietary costs, and management talent signaling.
Not all the papers concentrate on a general disclosure level. Several analyze more
specific types of information: interim reporting (Leftwich et al., 1981), segment information

4
(Mitchell et al., 1995; Aitken et al., 1997; Prencipe, 2004), communication on R&D
(Entwistle, 1999), and ratio disclosure (Watson et al., 2002). The link between corporate
disclosure policy and analyst behavior has also been investigated (Lang and Lundholm, 1996)
as well as the relation between disclosure level and the cost of equity capital (Botosan, 1997;
Botosan and Plumlee, 2002).
Overview of methodological issues
As mentioned in the introduction, several methodological issues have been raised, often
independently, by the numerous researchers interested in disclosure studies. Figure 1
summarizes the different issues identified in the past literature.
Insert Figure 1 about here
Determination of the disclosure index
The vast majority of disclosure studies adopt an item-based approach with a dichotomous
procedure in which an item scores one if it is disclosed and zero otherwise. A few articles use
a different approach: e.g. number of words used to describe an item disclosed (Copeland and
Fredericks, 1968) or a content analysis based on the number of sentences (Entwistle, 1999;
Williams, 1999).
In the most common approach, the concept of “disclosure index” was first used by
Buzby (1975, p. 27) and Stanga (1976, p. 48) and formalized by Cooke (1989b; 1989a). We
can summarize the determination of the index as follows:
∑∑==
==n
ii
m
ii dddisclosure Expecteddisclosure ActualIndex
11/
where d = 1 if item di is disclosed 0 if item di is not disclosed
m = number of items disclosed n = maximum number of disclosure items possible
The index is a ratio comparing the actual level of disclosure and the possible level (thus not
penalizing the firm for the items not relevant to it).
Although there is a general consensus on the determination of this index (see Appendix
1 for the numerous studies referring to the Cooke index), a debate has arisen concerning item
weighting. Cooke (1989b; 1991; 1992; 1993), followed by numerous authors (e.g., Tai et al.,
1990; Ahmed, 1994; Hossain et al., 1994; Wallace et al., 1994; Hossain et al., 1995; Chen
and Jaggi, 2000; Archambault and Archambault, 2003), are in favor of unweighted items,
implying that each item is of equal importance. The major argument is that “one class of user

5
will attach different weights to an item … than another class” and that “the subjective weights
of user groups will average each other out” (Cooke, 1989b, p. 115).
Conversely, other authors prefer to apply weighting to the different items. As Ahmed
and Nichols (1994, p. 68) point out, the weighting factors may be predetermined subjectively
(Cerf, 1961; Singhvi and Desai, 1971) or be taken from prior studies (Barrett, 1977). Finally,
some authors stress that certain items are more important to users than others, and send a list
of items (questionnaire) to some users, asking them to evaluate the importance of each item
(e.g., Buzby, 1975; Stanga, 1976; Firth, 1979; McNally et al., 1982; Giner, 1997).
Marston and Shrives (1991) provide a review of the literature that has made use of the
disclosure index as a measurement technique, while Coy, Tower, and Dixon (1993, p. 123)
compare the index construction methods used by different researchers. Finally, Ahmed and
Courtis (1999, p. 36) write that the approach based on unweighted items “has become the
norm in annual report studies” because it reduces subjectivity.
Independent variables and multicollinearity
For improved explanations of the disclosure index, the researcher may be tempted to increase
the number of independent variables, i.e. determinants. However, this decision may
strengthen the potential collinearity between the variables (Singhvi and Desai, 1971; Moore
and Buzby, 1972), which could be identified by running a correlation matrix. Another
symptom of collinearity could be the reversal of the signs of the coefficients on some
variables between the correlation matrix and regression equations (Wallace et al., 1994, p. 49).
Collinearity can also be diagnosed by evaluating the VIF (variance inflation factor) for each
variable (Patton and Zelenka, 1997; Owusu-Ansah, 1998; Ho and Wong, 2001; Chau and
Gray, 2002; Haniffa and Cooke, 2002). The VIF measures the degree to which each
explanatory variable is explained by the other explanatory variables. Traditionally,
collinearity is not considered to be a problem when the VIF does not exceed 10 (Neter et al.,
1983).
Several solutions have been put forward in past studies to solve this multicollinearity
issue. First, different regression models are run, each routine using only one of the
independent variables identified as generating a multicollinearity problem, in particular size
variables (Cooke, 1989b; Cooke, 1989a; Cooke, 1991; Ahmed, 1994; Depoers, 2000).
Another solution consists of factoring the collinear independent variables and using the
principal factors as regressors (Cooke, 1992; Eng and Mak, 2003).

6
Relationship between dependent and independent variables
The multiple linear regression method has been used extensively to link the disclosure level to
the financial (size, leverage, profitability, etc.) and non-financial (industry, listing status, audit
firm size, etc.) variables. However, the method can be applied only if several conditions are
met:
- The variables have a normal distribution;
- The error term has a normal distribution with a mean of zero. The variance of the error
term is constant across cases and independent of the variables in the model;
- The value of the error term for a given case is independent of the values of the variables
in the model and of the values of the error term for other cases;
- There is no multicollinearity among independent variables.
In order to verify the fundamental assumption of normality, several tests can be
conducted: skewness, kurtosis and Kolmogorov-Smirnov. But even if the results of these tests
are positive, a major difficulty has been identified: the “theoretically correct form of the
relation between [the disclosure index] and the independent firm variables is not known”
(Lang and Lundholm, 1993, p. 261). In other words, the linearity is only an assumption.
These authors suggest using rank regressions to analyze data, citing Iman and Conover (1979,
p. 508) who write that “rank regressions are quite powerful when the relations are nonlinear
but monotonic”. In practice, it is necessary to transform both independent and dependent
variables into ranks before applying the OLS regression (Wallace et al., 1994, p. 47; Wallace
and Naser, 1995).
Following Lang and Lundholm (1993), a few authors have applied the rank regression
in the context of disclosure studies (Wallace et al., 1994, p. 47; Wallace and Naser, 1995;
Owusu-Ansah, 1998). Some have even used both procedures (with unranked and ranked data)
in order to compare the results (Wallace and Naser, 1995).
Independently of the issue of the nature of the relationship between dependent and
independent variables, several authors have used the stepwise procedure (Malone et al., 1993;
Ahmed, 1994; Raffournier, 1995; Giner, 1997; Depoers, 2000). As explained by Cooke
(1991), one way to specify the regression model correctly is to adopt this stepwise procedure,
which adds variables to the model to maximize R² or equivalently minimize the error sum of
squares. This approach is useful in determining those variables which should be included in
the model.
Given all the methodological issues surrounding regression analysis, Cooke (1998)
reviews a number of transformations of data, including the rank regression.

7
3. Hypotheses
After surveying the various methodological issues inherent to disclosure studies, we will
introduce a new method in section 5. This method will be illustrated with a study of
disclosure on provisions in France. A provision, defined as a liability of uncertain timing or
amount (IASC, 1998), is calculated to face general risks or potential losses not linked directly
to asset items. For example, French firms record provisions for restructuring, foreign
exchange losses, litigations, etc. Pension liabilities are also recorded as provisions in France.
Our hypotheses concerning the determinants of firms’ provision disclosure level cover
the following characteristics of the firm: provision intensity, size, leverage, profitability,
performance, market expectation for the firm’s future growth, and industry type.
Provision intensity
The positive link between the relative proportion of provisions and their disclosure level is a
rational consequence of application of the materiality principle. When provisions are
equivalent to a high percentage of total assets, they become a major factor in evaluating the
firm’s risk level.
Our first hypothesis is:
H1: The extent of disclosure on provisions is positively related with the firm’s provision
intensity.
Size
The literature is in agreement on the positive relationship between the firm’s size and its
information disclosure level. There are at least three reasons for this link. First of all, large
firms are more willing to disclose information to reduce their political costs, since their higher
visibility can easily lead to more litigations and governmental intervention (Watts and
Zimmerman, 1978; Bujaki and Richardson, 1997). Secondly, thanks to their more developed
internal reporting system, the costs associated with a higher disclosure level are lower for
large firms. Thirdly, smaller firms are more likely to hide crucial information because of their
competitive disadvantage within their industry (Singhvi and Desai, 1971; Firth, 1979).
Appendix 1 provides numerous examples of disclosure studies which identify size as a
significant determinant (e.g., Stanga, 1976; McNally et al., 1982; Chow and Wong-Boren,
1987; Tai et al., 1990; Hossain et al., 1994; Meek et al., 1995; Marston and Robson, 1997;
Depoers, 2000).
Our second hypothesis is thus the following:
H2: The extent of disclosure on provisions is positively related with the firm’s size.

8
Leverage
Corporate information disclosure is often considered as an instrument to reduce the
monitoring costs for creditors. We can thus expect a positive link between a firm’s disclosure
level and its indebtedness, since in the case of high leverage, creditors will urge the firm to
disclose more information so they can better handle their own credit risk (Hossain et al.,
1994). For example, some studies show that diversified firms obtaining long-term capital
externally were more likely to disclose segmental financial data voluntarily (Salamon and
Dhaliwal, 1980). We expect this relationship to be more visible in our case, since provisions
are widely suspected of being an earnings management tool. Disclosure level is therefore very
precious information to help creditors correctly evaluate the risk.
Our third hypothesis is:
H3: The extent of disclosure on provisions is positively related with the firm’s leverage.
Profit and return
Profit and return have also been considered as relevant explanatory variables for the
disclosure level (Singhvi and Desai, 1971; Wallace and Naser, 1995). We thus expect a
positive relationship between a firm’s provision disclosure level and its profitability (Giner,
1997). In their paper, Singhvi and Desai (1971) propose that when the rate of return is high,
managers are motivated to disclose detailed information in order to support the continuance of
their positions and remuneration. Conversely, when the rate of return is low, they may
disclose less information in order to conceal the reasons for losses or declining profits.
We thus arrive at the two following hypotheses:
H4: The extent of disclosure on provisions is positively related with the firm’s level of profit.
H5: The extent of disclosure on provisions is positively related with the firm’s rate of return.
Market expectation for the firm’s future growth
One of the major roles of financial information disclosure is to reduce agency conflicts and to
minimize the firm’s capital cost by resolving the information asymmetry problem between the
principal (shareholders) and the agent (managers) (Jensen and Meckling, 1976). Therefore, a
higher provision disclosure level should be associated with a better market expectation for the
firm’s future growth.
Our sixth hypothesis is:
H6: The extent of disclosure on provisions is positively related with the market expectation
for the firm’s future growth.

9
Industry type
Several studies have highlighted a relationship between the disclosure level and the industry
sector (Cooke, 1992; Raffournier, 1995). Conversely, several arguments can be put forward to
show the evidence to date is inconclusive (Watson et al., 2002).
Our hypothesis No. 7 is:
H7: The extent of disclosure on provisions is not related with the industry.
4. Sample and data collection
Sample
Our statistical survey concerning the disclosure of provisions is based on a sample of large
French groups included in the SBF 120 stock index for the year 2001. This choice allowed us
to work on a sufficiently large sample and to carry out a relevant survey covering major
sectors of the French economy. It is important to note that only industrial, commercial and
service sectors are included in the survey; banks, insurance and such sectors as leasing
companies are excluded because they use sector-specific accounting principles and their
financial statements are not comparable to those of other economic sectors. We also decided
to exclude the stockbroking company Euronext. Our research covers only one year because
firms’ disclosure policies appear to remain relatively constant over time (Botosan, 1997, p.
327)
A few more companies are excluded from the sample due to the absence of published
consolidated financial statements or notes to the financial statements, or because there were
no associated data in the Worldscope database. In conclusion, 100 industrial and commercial
French listed companies belonging to the SBF 120 Index are included in our study (see Table
1 and the list of the firms in Appendix 2).
Insert Table 1 about here
Data collection and explanatory variables
To explore the provision disclosure pattern and level, we analyzed the 2001 annual reports of
the 100 firms included in our sample. Fourteen information items are studied (see the list in
Appendix 3). Some items are not strictly speaking information disclosures (e.g. items 13 and
14 which depend on certain conditions being met). The coexistence of items scored on a
“yes/no” basis and conditional items has already been observed (Barrett, 1976; Marston and
Robson, 1997). We use a dichotomous procedure in which an item (or a condition) scores one
if it is disclosed (or met), which reflects the firm’s effort in terms of transparency and

10
accurateness of information, and zero otherwise. These dummy variables not only define the
mapping of each firm regarding its provision disclosure structure, but also give us an
aggregated vision of firms’ general provision disclosure level.
In comparison to many other disclosure studies (see Appendix 1), the number of items
is limited. This results from the scope of the study, which concentrates on a single topic:
provisions and is consistent with past literature. (e.g., Prencipe, 2004, in the field of segment
information).
We then extract the financial data for our sample from the annual reports or from the
Thomson Analytics’ Worldscope Database. The analyzed variables, which constitute proxies
for our hypotheses, are described in table 2.
Insert Table 2 about here
Past research has used various classifications to group firms by category: conglomerate,
manufacturing, services, trading (Cooke, 1991); 1. metals, building materials and construction,
2. engineering, 3. consumer goods and services, 4. oil, chemicals and mining (Meek et al.,
1995); manufacturing, non-manufacturing (Cooke, 1992; Raffournier, 1995); basic industry,
manufacturing industry, service industry (Giner, 1997); 1. electronics and technology, 2.
publishing and printing, 3. food and beverage, 4. shipping and transportation (Chau and Gray,
2002). We have adopted a more detailed division into nine sectors: automobile, building,
consumer goods, energy, food, health, industry, media and technology.
5. Research design
In a preceding section, we discussed the numerous methodological issues surrounding
disclosure studies. In order to avoid problems described, we adopt a research design
comprising two steps (see figure 2). Firstly, we run a linear regression, with unranked then
ranked data in order to test the relationship between the disclosure level and the different
determinants. Secondly, we use the DIV method to identify the information items that
determine a firm’s provision disclosure pattern and to classify firms under different clusters
according to pattern. On the basis of this clustering, we will test our hypotheses by analyzing
the differences between our clusters’ financial characteristics based on their provision
disclosure pattern.
Insert Figure 2 about here
Disclosure index
We decided to adopt an unweighted index, treating all items equally, given that there is no
specific set of users of information on provisions (Cooke, 1989b). The index is the ratio of the

11
total score awarded to a company divided by the maximum possible score that company could
obtain.
Linear regression
The limits of linear regression have been discussed above. We will use two of the methods
mentioned: the OLS regression and the rank OLS regression, and check for multicollinearity
by computing the VIF (variance inflation factors).
DIV analysis
The regression method cannot reflect the structure of provision disclosure. We can expect
divergences between firms concerning the types of provision information. For example, some
companies prefer to disclose information related to the treatment of the provisions, while
others like to inform users about a particular type of provision (e.g. for restructuring). This
structural information cannot be reflected in the general provision disclosure level. Therefore
the regression will reduce the richness of our study.
In order to cope with this difficulty, we introduce the DIV method, a divisive clustering
method. It simultaneously defines a hierarchy of a set of objects and a monothetic
characterization of each cluster of the hierarchy (Chavent, 1998). It is similar to a
segmentation method, and starts with all objects in one group, dividing each group
successively into smaller ones. DIV is also a monothetic clustering method. A cluster is called
monothetic if a conjunction of logical properties is both necessary and sufficient for
membership in the cluster (Sneath and Sokal, 1973). At each stage, bipartition is performed
by a single variable and a specified value of the variable in monothetic clustering. The DIV
analysis is a descendant hierarchical clustering method (Chavent et al., 1999). It is very
different from the hierarchical clustering analysis found in statistical software (e.g., SPSS)
and already used in past research (Stolowy and Tenenhaus, 1998; Sucher et al., 1999). While
this second method is an ascendant hierarchical clustering, the DIV is descendant, as already
stated. Consequently, the major advantage of DIV analysis is that it explains the origin of the
clustering by determining the items which separate the companies into groups.
DIV was developed in the framework of symbolic data analysis. It is also applied in
standard data analysis (see Appendix 4 for details). DIV analysis was carried out using
SODAS. The “SODAS” software tool was developed jointly by 17 European teams
(sponsored by EUROSTAT) and is available free of charge. It facilitates the use of analysis
techniques for numeric or symbolic data, and can be used in particular for data of a complex

12
structure, to provide better explanations of statistical results, and to represent, manipulate or
better analyze concepts and metadata.
As mentioned above, disclosure level study results in the existing literature are often
limited to the aggregated final disclosure score. The DIV method gives us the possibility to
break through this limitation. Here, we will explore the provision disclosure structure of each
firm. This clustering method will classify the firm sample into several groups according to
their provision disclosure patterns (which information they emphasize and which information
they neglect). The criteria used for classification will also be very important information: the
presence or absence of one specific information item can predict the disclosure pattern of a
firm.
Determinants analysis between different groups
The usual way of analyzing the link between a firm’s provision disclosure level and its
financial characteristics is the linear regression method. For the reasons described above, we
will add the statistical method, measuring the differences in financial characteristics between
groups of firms classified according to their provision disclosure patterns. We will use either
parametric or non-parametric tests depending on the distribution patterns of the financial
characteristics.
6. Results
Regression model
The regression model below is applied, first with unranked data, then with ranked data
(following Wallace and Naser, 1995).
εααα
ααααα
∑=
++++
++++=8
1,765
43210 _
lllindustrymarketreturn
profitleveragesizeassprovIndex
where:

13
Index = Disclosure index αs = Regression parameters prov_ass = Provisions/Total assets Size = Sales Leverage = Total debt/Equity Profit = Earnings per share Return = Return on Equity (ROE) Market = Dividend yield industryl = Dummy variable equals 1 if the firm belongs to the following sector: auto building consumer energy health industry media techno
= = = = = = = =
Automotive Construction Consumer goods Energy Health Industry Media Technology Equals 0 otherwise. We define the model excluding the "Food" sector (which has the lowest Provisions/Total assets ratio of the nine sectors). In a linear regression, a categorical variable (i.e. one which can take several values, e.g. the business sector) should be split between a number of dummy variables equal to the number of possible values minus one. The excluded value (here the food industry) serves as a reference for the other dummy variables and this procedure will avoid perfect collinearity.
Regression with unranked data
Table 3, panel A discloses the results of the regression with unranked data. The overall model
is modestly significant (sig. (F)=0.083) and the coefficient of determination (R²) is 0.213. The
adjusted R² is 0.084. The VIF does not exceed 10 (Neter et al., 1983), which means that
multicollinearity is not a real issue. (The correlation matrix [not tabulated] does not disclose
high and significant correlations). As expected, disclosure increases with the proportion of
provisions over total assets (variable significant at the 0.05 level). This result is logical: we
would expect a firm to disclose more information if the proportion of provisions is higher. But
it is still interesting because, in an R&D context, Ding and Stolowy (2003) found no
relationship in France between R&D intensity and the total amount of information reported on
R&D. All other variables are non-significant.
As a sensitivity test, we reran the regression excluding Industry, which does not appear to be a
significant explanatory variable. The results remain unchanged (adjusted R² = 0.111).
Insert Table 3 about here
Regression with ranked data
Given that the Index variable does not have a normal distribution (Kolmogorov-Smirnov test)
and that there is uncertainty over the nature of the relationship, we transformed both
independent and dependent continuous variables into ranks before applying the OLS
regression (with the instruction Transform/Rank cases/Rank of SPSS). As in Lang and
Lundholm (1993), firms with tied ranks were assigned the average of the ranks they would

14
have had if they had not been tied. Results are provided in panel B of Table 3. They are more
significant (sig. F = 0.019) and the adjusted R² is 0.136. While the Provisions/Total assets
variable is even more significant (p=0.001), profit also appears to be significant (at the 0.10
level). As a sensitivity test, we reran the regression excluding Industry. The results remain
unchanged (adjusted R² = 0.179).
Disclosure pattern
Based on the disclosed information items, we used the Divisive Clustering method to classify
our sample. The number of clusters can be defined a priori. For the sake of simplification and
clarity of results, we chose a three-group clustering. The results of the DIV method are
presented in the form of a clustering tree (see Figure 3).
Insert Figure 3 about here
From the clustering according to provision information disclosure, we can observe that the
information items No. 2 (Inclusion in the notes of a description of a particular type of
provision) and 6 (Inclusion in the notes concerning pensions liabilities of information on the
computation of provisions) play a dominant role in firm group classification. (We also ran the
DIV clustering with four classes, and item No. 10 appeared as the third decision node). In
other words, the disclosure of Item No. 2 will broadly determine the firm’s overall disclosure
pattern (or profile) on provision information.
Table 4 below shows the descriptive statistics of these three firm groups, stating the
percentages of firms in each group disclosing the related item. For example, item 2 is
disclosed by 100% of firms in group 2, and by no firms in groups 1 and 3. As far as the
disclosure level is concerned, Table 4 also shows that firms in group 2 disclose the highest
quantity of information on their provisions, followed by group 3 and group 1.
Insert Table 4 about here
Determinants analysis between different groups
Because the distribution of the explanatory variables is not normal (as shown by the
Kolmogorov-Smirnov test for normality), it is necessary to consider using the nonparametric
procedures designed to test for the significance of the difference between groups. These
procedures are called nonparametric because they make no assumptions about the parameters
of a distribution, nor do they assume that any particular distribution is being used (Siegel and
Castellan, 1988). One popular nonparametric test for independent samples greater than two is
the Kruskal Wallis test. Table 5 shows the mean rank per group, for each variable, and the
results from the Kruskal Wallis test for differences between Groups 1, 2 and 3.

15
Insert Table 5 about here
Table 5 shows that most of our hypotheses are validated regarding the pattern (or profile) of
disclosure. Based on the disclosure pattern, as identified with the DIV method, the firms of
the three groups differ in: the ratio of provisions to total assets (at the 0.05 level), size (at the
0.10 level), leverage (at the 0.05 level), profit (at the 0.01 level) and market expectation (at
the 0.01 level).
But the results for the “index” variable also indicate a very significant difference
between groups (at the 0.01 level). Firms in group 2 disclose more information. Looking at
the mean rank for the other variables, we find another interesting result, which provides some
support to our original hypotheses: firms in group 2 (which disclose the highest number of
information items) have the highest provision intensity, the largest size, the highest leverage,
the highest profit and highest market expectation.
Conclusion
This study looks at the disclosure pattern for information related to provisions reported by
large French listed industrial and commercial firms. The firms’ financial characteristics linked
to this disclosure pattern are also studied.
By investigating the annual reports of 2001 for 100 French firms belonging to the SBF
120 Stock Index, we found that the disclosure pattern is associated with provision intensity,
size, leverage, profit and market expectation. Our study also shows that firms with the highest
score for disclosures have the highest provision intensity, firm size, leverage, profit, and
market expectation.
The objective of this paper was to make two contributions to the literature. Firstly, this
study used an innovative statistical approach to analyze firm’s disclosure patterns and levels.
Secondly, it performed the first empirical exploration in the field of disclosure on provisions
and the relationship between a firm’s provision disclosure and its financial characteristics, and
so enriches the existing literature, especially as regards voluntary disclosure issues.
Appendix 1. Summary of disclosure studies Object of study Country Year No. of
firms (or
obs.)
No. of disclosure
items
Dependent variables
Main independent variables
Research design Results
Singhvi (1968)
Extent of disclosure (generalist approach)
India 1963-65 45 34 Index (see Cerf),weighted items)
Size, rate of return, earnings margin, audit firm, type of management, number of stockholders
Univariate Size, management,number of stockholders
Singhvi andDesai (1971)
Extent of disclosure (generalist approach)
USA 1965 155 34 Index (see Cerf),weighted items)
Size, number ofshareholders, listingstatus, size of auditing firm, rate of return and earnings margin
Univariate Multivariate (linear
regression)
Listing status
Buzby (1975) Extent of disclosure (generalist approach)
USA 1970 or1971
88 39 Index, weighted items
Size, listing status Two matched samples Univariate
Size
Stanga (1976) Extent of disclosure (generalist approach)
USA 1972or1973
80 79 Index, weighted items
Size, industry Univariate Multivariate (linear regression)
Size, industry
Firth (1979) Voluntary disclosure
UK 1976 180 48 Index, weighteditems
Size, listing status, audit firm
Univariate Size, listing status
McNally et al. (1982)
Voluntary disclosure
New Zealand
1979 103 41 Index, weighteditems
Financial characteristics (size, rate of return, growth), audit firm, industry
Univariate Size
Firth (1984) Voluntary disclosure
UK 1977 100 48 Disclosure index,weighted
Stock market risk Linear regression No significantrelation
Chow andWong-Boren (1987)
Extent of voluntary disclosure
Mexico 1982 52 24 Two scores: oneweighted, oneunweighted
Size, leverage, proportion of assets in place
Multivariate (linear regression)
Size
Cooke (1989a)
Extent of disclosure (mandatory and voluntary)
Sweden 1985 90 224 Disclosure index(unweighted)
Listing status, parent company relationship, size, number of shareholders
Multivariate Three regression models
Listing status, size
16

Cooke (1989b)
Extent of voluntary disclosure
Sweden 1985 90 146 Index (actualdisclosure/possib-le disclosure), unweighted items
Size, listing status, parent company relationship, industry
Univariate Multinariate (linear regression – stepwise)
Listing status
Tai et al.(1990)
Mandatory disclosure
Hong Kong 1987 76 11 Index additive (unweighted)
Size, industry, audit firm Univariate Size
Cooke (Cooke, 1991)
Voluntary disclosure
Japan 1988 48 106 Disclosure index(relative) (unweighted)
Size, listing status, industry
Univariate Multivariate Three regression models
Size
Cooke (1992) Mandatory and voluntary disclosure
Japan 1988 35 165 Disclosure index(relative) (unweighted)
Size, listing status, industry
Multivariate (linear regression) Factor analysis of size variables.
Size, listing status, industry
Cooke (1993) Extent of voluntary disclosure
Japan 1988 48 195 Index,unweighted items
Listing status Univariate Listing status
Coy, Tower, and Dixon(1993)
Tertiary education annual reports
New Zealand
1985-90 33 43 Two scores:unweighted and weighted (“Accountability Disclosure Score”)
No variable No analysis -
Malone et al. (1993)
All financial disclosure in oil and gas industry
USA 1986 125 129 Weighteddisclosure index
Size, listing status, leverage, profitability, audit firm
Stepwise regression model Exchange listing status, ratio of debt to total equity, number of shareholders
Ahmed (1994) Mandatory disclosure
Bangladesh 1988 63 94 Disclosure index (relative) (unweighted) (Cooke)
Size, leverage, audit firm, multinationality, qualification of the chief accountant
Univariate Multivariate (two regression models) (stepwise)
Multinationality, accountant’s qualification, size
Hossain et al. (1994)
Voluntary disclosure
Malaysia 1991 67 78 Disclosure index(relative) (unweighted) (Cooke)
Size, ownership structure, leverage, assets-in-place, audit firm, listing status
Univariate Multivariate
Size, ownership structure, listing status
Wallace et al. (1994)
Mandatory and voluntary disclosure
Spain 1991 50 79 Disclosure index(unweighted)
Size, listing status, leverage, profitability, audit firm; liquidity
Multivariate (rank OLS regression)
Size (+), listing status (+); liquidity (-)
17

Hossain et al. (1995)
Extent of voluntary disclosure
New Zealand
1991 55 95 Index (Cooke),unweighted items
Size, leverage, assets-in-place, audit firm, listing status
Multivariate (OLS) Size, leverage, listing
Meek et al. (1995)
Voluntary disclosure
US, UK, France, Germany, Netherlands
116 +64 + 16 + 12 +
18
85 Score (unweighted) Strategic, nonfinancial, financial
Size, country origin, industries, leverage, multinationality, profitability, listing status
Linear regression: four models (overall, strategic, nonfinancial and financial)
Size, country, listing status
Raffournier (1995)
Voluntary financial disclosure (generalist approach) Annual reports Listed firms
Switzerland 1991 161 30 Index (score, seeCooke, 1989,1992) (unweighted items)
Company size, leverage, profitability, ownership structure, internationality, auditor size, industry type
Univariate analyses and multiple linear regressions (stepwise)
Size, internationality
Wallace and Nasser (1995)
Extent of mandatory disclosure
Hong Kong 1991 80 142 Index, unweighted items
Foreign registered office, profit margin, earnings return, liquidity ratio, leverage, size, outside shareowners, conglomerates, audit firm
Multivariate: OLS and rank OLS regression
Size, conglomerates, profits
Ahmed (1996) Mandatory and voluntary disclosure
Bangladesh 1987-88,1992-93
118 150 Disclosure index, unweighted index
Size, leverage, audit firm, relation with parent, qualification of accountants
Regression: logarithm of the odds ratio
Audit, multinationality
Marston and Robson (1997)
Mandatory and voluntary disclosure
India 1983,1990
29 17 Disclosure index (score = 1/0, or a scale or a scale based on judgment)
Size, change in time Univariate Size
Giner (1997) Mandatory and voluntary disclosure
Spain 1989-91 138obs.
50 Index (weighted items)
Size, listing status, profitability, leverage, audit firm, industry, dividend pay-out
Multivariate (stepwiseregression)
Size, auditing, stock exchange, profitability
18

Patton andZelenka (1997)
Extent ofdisclosure (generalist approach)
Czech republic
Joint stock companies
1993 50 37+12+17 Index (threelevels of indexes) (unweighted items)
Size, performance, risk factors, other monitoring factors (listing status, big six auditing firms, industry)
Univariate analyses and multiple linear regressions No collinearity problem (VIF, condition indexes)
Type of auditor, number of employees
Owusu-Ansah (1998)
Mandatory disclosure
Zimbabwe 1994 49 214 Relativedisclosure index (unweighted)
Size, ownership, age, multinational affiliation, profitability, audit, industry, liquidity
Multivariate: 4 regressions: OLS, rank OLS, without influential observations, robust
Size, ownership, age, multinational affiliation, profitability
Entwistle (1999)
R&D disclosureenvironment
Canada 1994 (or1993 or 1995)
113 - Content analysis (number if sentences)
R&D expense proportion, capitalization of R&D, cross-listing status, industry, capital structure, firm size
Multiple linear regression R&D intensity, cross listing and industry
Williams (1999)
Voluntary environmental and social disclosure
Seven Asia-Pacific nations
1995 356 - Content analysis(number if sentences)
Culture, political and civil system, legal system, level of economic development, equity market, control variables
3 linear regressions Uncertainty avoidance, masculinity, political and civil systems
Chen andJaggi (2000)
Mandatory disclosure
Hong Kong 1993, 1994
87 142 Disclosure index (unweighted) (see Wallace and Naser, 1995)
Independent non-executive directors, family control, profitability, leverage, size, audit firm
OLS regression Independent non-executive directors
Depoers (2000)
Voluntary disclosure (generalist approach)
France 1995 102 65 Disclosure score(unweighted)
Firm size, foreign activity, ownership structure, leverage, size of auditing, proprietary costs related to competition, labor pressure
Multiple linear regression (two O.L.S. regressions to avoid collinearity problems with the high correlation between size and barriers to entry) Stepwise procedure
Foreign activity and size
Jaggi and Low (2000)
Mandatory andvoluntary disclosure
28 countries
1991 28 90 Relativedisclosure index (unweighted)
Cultural, legal and financial variables
Univariate, multivariate (6 regression models)
Common law, culture
19

Gray et al. (2001)
Social and environmental disclosure
UK 1998-1995
100 - 8 measures of disclosure (CSEAR Social and Environmental Disclosure Database
Profit, turnover, capital employed, industry classification, number of employees
8 O.L.S regressions No unique and stable relationship
Ho and Wong (2001)
Voluntary disclosure
Hong Kong 1998 98 20 Relative disclosure index (weighted items)
Independent Non-executive directors, audit committee, dominant personalities, family + control variables
Multivariate (linear regression)
Audit committee, family
Bujaki andMcConomy (2002)
Voluntary disclosure
Canada 1997 272 25 Disclosure index Financial condition, leverage, share issue, unrelated directors, regulated industries, medium, size
Linear regression Unrelated directors, leverage
Chau andGray (2002)
Voluntary disclosure
Hong Kong Singapore
1997 62 approx.110
Disclosure index (unweighted) (3 scores)
Ownership structure, size, leverage, audit firm, profitability, multinationality, industry
Multivariate (linear regression)
Ownership structure
Ferguson et al. (2002)
Voluntary disclosure
Hong Kong 1995/96 142 93 Disclosure index Gray et al. (1995), Meek et al. (1995) Unweighted
Firm type, Size, leverage, industry, listing status
Univariate Multivariate (linear regression) Total score. Replication with partition: strategic, non-financial, financial information
Firm type, leverage (type of disclosure)
Haniffa andCooke (2002)
Voluntary disclosure
Malaysia 1995 167 65 Disclosure index(unweighted)
Corporate governance, cultural and firm-specific
Linear regression (31 variables) Restricted model.
Family members sitting on board, non-executive chairman
Archambault and Archambault (2003)
Voluntary and non voluntary disclosure
33 countries
1992, 1993
621 85 Disclosure index (unweighted)
Culture, national, financial systems
Multivariate (linear regression)
Many factors.
20

Eng and Mak (2003)
Voluntary disclosure
Singapore 1995 158 84 Aggregateddisclosure score of non-mandatory strategic, non-financial and financial information
Ownership structure, board composition
OLS regression (1 model + 3 variations)
Lower managerial ownership, government ownership, outside directors, lower debt
Prencipe (2004)
Extent ofvoluntary segment disclosure
Italy 1997 64 9 Disclosure index(unweighted and weighted)
Correspondence between the segments and legally identifiable sub-groups of companies, growth rate, listing status age, size, ownership diffusion, financial leverage, profitability
OLS regression (2 models) Correspondence and listing status age
21

22
Appendix 2. List of sample firms showing disclosure indexes for 2001 Company Index Company Index
Accor 0.643 L’Oréal 0.500 Air France 0.786 LVMH 0.214 Air Liquide 0.214 M6 0.500 Alcatel 0.643 Marionnaud 0.571 Alstom 0.571 Michelin 0.571 Alten 0.500 Neopost 0.643 Altran 0.143 Nexans 0.571 Atos Origin 0.786 NRJ 0.214 Aventis 0.929 Oberthur 0.429 Béghin-Say 0.500 Orange 0.143 Bic 0.357 Pechiney 0.643 Bouygues 0.857 Penauille 0.786 Business Objects 0.429 Pernod Ricard 0.571 Cap Gemini 0.214 PPR 0.714 Carbone Lorraine 0.500 Provimi 0.357 Carrefour 0.286 PSA 0.714 Casino 0.571 Publicis 0.714 Castorama 0.214 Renault 0.571 Céréol 0.357 Rexel 0.643 CGG 0.357 Rhodia 0.500 Ciments français 0.500 Royal Canin 0.571 Clarins 0.429 Sagem 0.286 Club Med 0.643 Saint-Gobain 0.429 Cointreau 0.500 Sanofi 0.571 Danone 0.429 Schneider 0.571 Dassault Systèmes 0.500 Seb 0.643 EADS 0.500 Simco 0.571 Eiffage 0.357 Sodexho 0.429 Elior 0.643 Soitec 0.286 Equant 0.286 Sophia 0.286 Essilor 0.429 Sopra Group 0.429 Eurodisney 0.143 Spir 0.571 Eurotunnel 0.286 SR Telecom 0.500 Faurecia 0.714 Steria Groupe 0.357 France Telecom 0.571 Technip 0.643 Galeries Lafayette 0.357 TF1 0.643 Gecina 0.643 Thales 0.643 Gemplus 0.357 Thomson 0.786 GFI 0.500 Total 0.786 GrandVision 0.357 Ubisoft 0.429 Guyenne et Gascogne 0.429 Unilog 0.714 Haulotte 0.500 Valeo 0.714 Havas 0.429 Vallourec 0.786 Hermes 0.429 Vinci 0.714 Imerys 0.857 Vivendi Environnement 0.500 Infogrames 0.286 Vivendi Universal 0.429 Ingenico 0.286 Wanadoo 0.357 JCDecaux 0.500 Wavecom 0.643 Lafarge 0.643 Wendel 0.500 Lagardère 0.286 Zodiac 0.571

23
Appendix 3. List of the 14 surveyed items
1. Inclusion in the “accounting principles” part of the notes to the financial statements (the “notes” in the rest
of this paper) of a specific note on the treatment of provisions (excluding pension liabilities). 2. Inclusion in the notes of the description of a particular type of provision (e.g., section on the provisions for
restructuring, for repair works, etc.). 3. Inclusion in the notes of a piece of information describing the methods for computation of provisions. (e.g.
statistical determination of a given provision). 4. Inclusion in the “accounting principles” note of a note on the treatment of pension liabilities. 5. Reference in the notes concerning pension liabilities to the accounting standard applied (IAS 19, FAS 87,
French regulation 99-02). 6. Inclusion in the notes concerning pension liabilities of details of the computation of provisions. (One point
has been attributed when the notes disclosed such information as statistical data on the population, discount rate, amount of funded pension liability, etc.).
7. Disclosure in the “Equity and liabilities” side of the balance sheet of a specific line “Provisions”. (We have attributed a 0 when the company reported a heading such as “Other long-term debts” covering provisions and other debts).
8. Disclosure in the balance sheet of a Year X1/Year X0 comparison. 9. Disclosure in the balance sheet of a Year X1/Year X0/Year X-1 comparison. (The disclosure of the two
preceding years’ figures will become compulsory in 2005 with implementation of the IFRS. All companies which have already incorporated this change were attributed one point).
10. Inclusion in the notes of a statement of changes in provisions (increases, decreases, etc). 11. Breakdown given of the item “Other” (provisions) allowing for restatement and distribution of this item
between the other major provisions. One point has been attributed when the company disclosed quantified information.
12. Distinction between short-term and long-term provisions in the notes. 13. Disclosure of specific lines of provisions. If there is only a breakdown between “risks” and “expenses”, a 0
is given. If more lines (with a threshold of 5) are disclosed, a 1 is given. 14. Amount relating to “other provisions” lower than the average for the 96 companies. The importance of the
“other” line is a major factor in the transparency of financial information disclosed by the company. The higher it is (measured relatively to the size = assets of the firm), the greater the possibilities of accounts manipulation are. We have transformed this complex variable into a dummy variable, specifying that all companies with an “other” lower than the sample average would be attributed one point, and the rest 0.

24
Appendix 4. DIV Analysis Method explained
In order to separate objects with DIV, a within-cluster variance criterion is defined. Let N be
the number of objects in set Ω. All objects are described on p real value variables by vector p
i Rx ∈ , Ni ,,1= . Each object is weighted by a real value 0≥iw ( Ni ,,1= ). The weights
are usually equal to 1 in classic data analysis.
A within-cluster variance of a cluster Ck is given by:
∑∈
−=ki
kCx
Ciik xxwCI2
:)(
where kCx is the centroid of the cluster Ck,
∑∈
=ki
kCx
iikC xwx µ
∑∈
=ki Cx
ik wµ
The variance criterion of K-partition C=(C1,…,CK) is given by:
∑=
=K
iiCICW
1)(:)(
This criterion is minimized among bipartitions induced by a set of binary questions. Let Ci be
a set of ni objects. The goal is to find the bipartition ),( 21iii CCC = such that the within-cluster
inertia is minimum. In DIV, a cluster C is divide according to a binary question of the form
“Is Yj≤c?” where Yj is a real variable and c∈R is called the cut point. The bipartition
),( 21iii CCC = induced by the binary question is defined as follows. Let x be an object in Ci. If
Yj(x) ≤ c then 1iCx∈ else 2
iCx∈ . Those objects in C answering “yes” go to the left
descendant cluster and those answering “no” to the right descendant cluster.
Let ),,( 1 KK CCP = be an K-partition of Ω. At each stage, a new (K+1)-partition is obtained
by separating one of the clusters Ki PC ∈ in two new clusters 1iC and 2
iC . The new partition is
chose such that }{},{ 211 iiiKK CCCPP −∪=+ has minimum within-cluster variance. Since
)()()()()( 211 iiiKK CICICIPWPW ++−=+ , minimizing )( 1+KPW is equivalent to choosing the
cluster so that the difference between the within-cluster variance of iC and the within-cluster
variance of its bipartition ),( 21ii CC is maximum. Thus, the criterion for selecting the cluster to
split is given by:
)()()()( 21iiii CICICIC −−=∆

25
It means that the bipartitions of all the clusters of the partition PK have been defined
previously. At each stage, the bipartitions of the two new clusters ),( 21ii CC are defined and
used in the next stage.
The divisions are stopped after a number L of iterations and L is given as input by the user.
The last partition obtained in the last iteration is an L + 1-clusters-partition. The stopping rule
ensures that the partitions of smallest within-cluster variance of the total hierarchy are
obtained after L iterations. However, this stopping rule does not solve the issue of
determining the number of clusters in the dataset (Milligan and Cooper, 1985).
The output of this divisive clustering method is a hierarchy H whose singletons are the L+1
clusters of the partition obtained in the last iteration of the algorithm. Each cluster HCk ∈ is
indexed by )( kC∆ . Because ∆ is a non-decreasing mapping, )()( '' kkkk CCCC ∆≤∆⇒⊂ ,
there will be no inversions in the dendogram of the hierarchy. This hierarchy is also a decision
tree. The L clusters are the leaves and the nodes are the binary questions selected by the
algorithm. Each cluster is characterized by a rule defined according to the binary questions
leading from the root to the corresponding leaves.
References
Ahmed, K. (1994) The impact of non-financial company characteristics on mandatory disclosure compliance in developing countries: The case of Bangladesh, The International Journal of Accounting, 29(1), pp. 62-77.
Ahmed, K. (1996) Disclosure policy choice and corporate characteristics: A study of Bangladesh, Asia-Pacific Journal of Accounting, 3(1), pp. 183-203.
Ahmed, K. and Courtis, J. K. (1999) Associations between corporate characteristics and disclosure levels in annual reports: A meta-analysis, British Accounting Review., 31, pp. 35-61.
Aitken, M., Hooper, C. and Pickering, J. (1997) Determinants of voluntary disclosure of segment information: A re-examination of the role of diversification strategy, Accounting and Finance, 37, pp. 89-109.
Archambault, J. J. and Archambault, M. E. (2003) A multinational test of determinants of corporate disclosure, The International Journal of Accounting, 38, pp. 173-194.
Bah, R. and Dumontier, P. (2001) R&D intensity and corporate financial policy: Some international evidence, Journal of Business Finance and Accounting, 28(5-6), pp. 671-692.
Barrett, M. E. (1976) Financial reporting practices: Disclosure and comprehensiveness in an international setting, Journal of Accounting Research, 14(1), pp. 10-26.
Barrett, M. E. (1977) The extent of disclosure in annual reports of large companies in seven countries, The International Journal of Accounting, 12(2), pp. 1-25.
Botosan, C. A. (1997) Disclosure level and the cost of equity capital, The Accounting Review, 72(3, July), pp. 323-349.
Botosan, C. A. and Plumlee, M. A. (2002) A re-examination of disclosure level and the expected cost of equity capital, Journal of Accounting Research, 40(1, March), pp. 21-40.
Bujaki, M. and McConomy, B. J. (2002) Corporate governance: Factors influencing voluntary disclosure by publicly traded Canadian firms, Canadian Accounting Perspectives, 1(2), pp. 105-139.
Bujaki, M. L. and Richardson, A. J. (1997) A citation trail review of the uses of firm size in accounting research, Journal of Accounting Literature, 16, pp. 1-27.
Buzby, S. L. (1975) Company size, listed versus unlisted stocks, and the extent of financial disclosure, Journal of Accounting Research, 13(1), pp. 16-37.
Cerf, A. R. (1961) Corporate reporting and investment decisions (Berkeley: University of California Press). Chau, G. K. and Gray, S. J. (2002) Ownership structure and corporate voluntary disclosure in Hong Kong and
singapore, The International Journal of Accounting, 37, pp. 247-265. Chavent, M. (1998) A monothetic clustering method, Pattern Recognition Letters, 19, pp. 989-996.
26
Chavent, M., Guinot, C., Lechevallier, Y. and Tenenhaus, M. (1999) Méthodes divisives de classification et segmentation non supervisée : Recherche d'une typologie de la peau humaine saine, Revue de Statistique Appliquée, XLVII(4), pp. 87-99.
Chen, C. J. P. and Jaggi, B. (2000) Association between independent non-executive directors, family control and financial disclosures in Hong Kong, Journal of Accounting and Public Policy, 19, pp. 285.310.
Chow, C. W. and Wong-Boren, A. (1987) Voluntary financial disclosure by Mexican corporations, The Accounting Review, 62(3), pp. 533-541.
Cooke, T. E. (1989a) Disclosure in the corporate annual reports of Swedish companies, Accounting and Business Research, 19(74), pp. 113-124.
Cooke, T. E. (1989b) Voluntary corporate disclosure by Swedish companies, Journal of International Financial Management and Accounting, 1(2), pp. 171-195.
Cooke, T. E. (1991) An assessment of voluntary disclosure in the annual reports of Japanese corporations, The International Journal of Accounting, 26, pp. 174-189.
Cooke, T. E. (1992) The impact of size, stock market listing and industry type on disclosure in the annual reports of Japanese listed corporations, Accounting and Business Research, 22(87), pp. 229-237.
Cooke, T. E. (1993) Disclosure in Japanese corporate annual reports, Journal of Business Finance & Accounting, 20(4, June), pp. 521-535.
Cooke, T. E. (1998) Regression analysis in accounting disclosure studies, Accounting and Business Research, 28(3), pp. 209-224.
Copeland, R. M. and Fredericks, W. (1968) Extent of disclosure, Journal of Accounting Research, 6(1), pp. 106-113.
Core, J. E. (2001) A review of the empirical disclosure literature: Discussion, Journal of Accounting and Economics, 31, pp. 441-456.
Coy, D., Tower, G. and Dixon, K. (1993) Quantifying the quality of tertiary education annual reports, Accounting and Finance, 33(2), pp. 121-130.
Depoers, F. (2000) A cost benefit study of voluntary disclosure: Some empirical evidence from French listed companies, European Accounting Review, 9(2), pp. 245-263.
Ding, Y. and Stolowy, H. (2003) Les facteurs déterminants de la stratégie des groupes français en matière de communication sur les activités de recherche et développement, Finance - Contrôle - Stratégie, 6(1), pp. 39-62.
Dumontier, P. and Raffournier, B. (1999) Vingt ans de recherche positive en comptabilité financière, Comptabilité Contrôle Audit, Numéro spécial(Les vingt ans de l'AFC), pp. 179-197.
Eng, L. L. and Mak, Y. T. (2003) Corporate governance and voluntary disclosure, Journal of Accounting and Public Policy, 22, pp. 325–345.
Entwistle, G. M. (1999) Exploring the R&D disclosure environment, Accounting Horizons, 13(4), pp. 323-341. Ferguson, M. J., Lam, K. C. K. and Lee, G. M. (2002) Voluntary disclosure by state-owned enterprises listed on
the stock exchange of Hong Kong, Journal of International Financial Management and Accounting, 13(2), pp. 125-152.
Firth, M. (1979) The impact of size, stock market listing, and auditors on voluntary disclosure in corporate annual reports, Accounting and Business Research, (Autumn), pp. 273-280.
Firth, M. (1984) The extent of voluntary disclosure in corporate annual reports and its association with security risk measures, Applied Economics, 16(2), pp. 269-277.
Giner, B. (1997) The influence of company characteristics and accounting regulation on information disclosed by Spanish firms, The European Accounting Review, 16(1), pp. 45-68.
Gray, R., Javad, M., Power, D. M. and Sinclair, C. (2001) Social and environmental disclosure and corporate characteristics: A research note and extension, Journal of Business Finance & Accounting, 28(3 & 4, April/May), pp. 327-356.
Haniffa, R. M. and Cooke, T. E. (2002) Culture, corporate governance and disclosure in Malaysian corporations, Abacus, 38(3), pp. 317-349.
Healy, P. M. and Palepu, K. G. (2001) Information asymmetry, corporate disclosure, and the capital markets: A review of the empirical disclosure literature, Journal of Accounting and Economics, 31, pp. 405-440.
Ho, S. and Wong, K. S. (2001) A study of the relationship between corporate governance structures and the extent of voluntary disclosure, Journal of International Accounting, Auditing & Taxation, 10(2), pp. 139-156.
Hossain, M., Perera, M. H. B. and Rahman, A. R. (1995) Voluntary disclosure in the annual reports of New Zealand companies, Journal of International Financial Management and Accounting, 6(1), pp. 69-85.
Hossain, M., Tan, L. M. and Adams, M. (1994) Voluntary disclosure in an emerging capital market: Some empirical evidence from companies listed on the Kuala Lumpur stock exchange, The International Journal of Accounting, 29(3), pp. 334-351.
IASC (1998) International accounting standard no. 37: Provisions, contingent liabilities and contingent assets (London: International Accounting Standards Board).
Iman, R. L. and Conover, W. J. (1979) The use of rank transformation in regression, Technometrics, 21, pp. 499-509.
27
Jaggi, B. and Low, P. Y. (2000) Impact of culture, market forces and legal system on financial disclosures, The International Journal of Accounting, 35(4), pp. 495-419.
Jensen, M. and Meckling, W. (1976) Theory of the firm: Managerial behavior, agency costs and ownership structure, Journal of Financial Economics, 3, pp. 305-360.
Lang, M. and Lundholm, R. (1993) Cross-sectional determinants of analyst ratings of corporate disclosures., Journal of Accounting Research, 31(2), pp. 246-271.
Lang, M. H. and Lundholm, R. J. (1996) Corporate disclosure policy and analyst behavior, The Accounting Review, 71(4), pp. 467-492.
Leftwich, R. W., Watts, R. L. and Zimmerman, J. L. (1981) Voluntary corporate disclosure: The case of interim reporting, Journal of Accounting Research, 19, pp. 50-77.
Malone, D., Fries, C. and Jones, T. (1993) An empirical investigation of the extent of corporate financial disclosure in the oil and gas industry, Journal of Accounting, Auditing and Finance, 3(3), pp. 249-273.
Marston, C. L. and Robson, P. (1997) Financial reporting in India: Changes in disclosure over the period 1982 to 1990, Asia-Pacific Journal of Accounting, 4(1), pp. 109-139.
Marston, C. L. and Shrives, P. J. (1991) The use of disclosure indices in accounting research: A review article, British Accounting Review, 23, pp. 195-210.
McNally, G. M., Eng, L. L. and Hasseldine, C. R. (1982) Corporate financial reporting in New Zealand: An analysis of user preferences, corporate characteristics and disclosure practices for discretionary information, Accounting and Business Research, 13(Winter), pp. 11-20.
Meek, G. K., Roberts, C. B. and Gray, S. J. (1995) Factors influencing voluntary annual report disclosures by U.S., U.K. And continental European... Journal of International Business Studies, 26(3), pp. 555-572.
Mitchell, J. D., Chia, C. W. L. and Loh, A. S. (1995) Voluntary disclosure of segment information: Further Australian evidence, Accounting and Finance, 35(November), pp. 1-16.
Moore, M. L. and Buzby, S. L. (1972) The quality of corporate financial disclosure: A comment, The Accounting Review, 47(July), pp. 581-584.
Neter, J., Wasserman, W. and Kutner, M. (1983) Applied linear regression models (Homewood: Irwin). Owusu-Ansah, S. (1998) The impact of corporate attributes on the extent of mandatory disclosure and reporting
by listed companies in Zimbabwe, The International Journal of Accounting, 33(5), pp. 605-631. Patton, J. and Zelenka, I. (1997) An empirical analysis of the determinants of the extent of disclosure in annual
reports of joint stock companies in the Czech republic, European Accounting Review, 6(4), pp. 606-626. Prencipe, A. (2004) Proprietary costs and determinants of voluntary segment disclosure: Evidence from italian
listed companies, European Accounting Review, 13,(2), pp. 319–340. Raffournier, B. (1995) The determinants of voluntary financial disclosure by Swiss listed companies, European
Accounting Review, 4(2), pp. 261-280. Salamon, G. and Dhaliwal, D. (1980) Company size and financial disclosure requirements with evidence from
the segmental reporting issue, Journal of Business Finance and Accounting, 7, pp. 555-568. Siegel, S. and Castellan, N. J. (1988) Nonparametric statistics for the behavioral sciences (New York: McGraw-
Hill, Inc.). Singhvi, S. (1968) Characteristics and implications of inadequate disclosure: A case study of India, The
International Journal of Accounting, 3(2), pp. 29-43. Singhvi, S. and Desai, H. (1971) An empirical analysis of the quality of corporate financial disclosure, The
Accounting Review, 46, pp. 129-138. Sneath, P. H. and Sokal, R. R. (1973) Numerical taxonomy (San Francisco: Freeman). Stanga, K. G. (1976) Disclosure in published annual reports, Financial Management, (Winter), pp. 42-52. Stolowy, H. and Tenenhaus, M. (1998) International accounting education in Western Europe., European
Accounting Review, 7(2), pp. 289-314. Sucher, P., Moizer, P. and Zarova, M. (1999) The images of the big six audit firms in the Czech republic.,
European Accounting Review, 8(3), pp. 499-521. Tai, B. Y. K., Au-Yeng, P.-K., Kwok, M. C. M. and Lau, L. W. C. (1990) Non-compliance with disclosure
requirements in financial statements: The case of Hong Kong companies, The International Journal of Accounting, 25(2), pp. 99-112.
Wallace, R. S. O. and Naser, K. (1995) Firm-specific determinants of comprehensiveness of mandatory disclosure in the corporate annual reports of firms listed on the stock exchange of Hong Kong, Journal of Accounting and Public Policy, 14, pp. 311-368.
Wallace, R. S. O., Naser, K. and Mora, A. (1994) The relationship between the comprehensiveness of corporate annual reports and firm characteristics in Spain, Accounting and Business Research, 25(97), pp. 41-53.
Watson, A., Shrives, P. and Marston, C. L. (2002) Voluntary disclosure of accounting ratios in the UK, British Accounting Review, 34(4), pp. 289-313.
Watts, R. and Zimmerman, J. (1978) Towards a positive theory of the determination of accounting standards, The Accounting Review, 53, pp. 112-134.
Williams, S. M. (1999) Voluntary environmental and social accounting disclosure practices in the Asia-pacific region: An international empirical test of political economy theory, The International Journal of Accounting, 34(2), pp. 209-238.

28
Table 1. Sample construction
Firms belonging to the SBF 120 Index 120 Banks, insurance and real estate companies -15 Firms not disclosing consolidated financial statements or notes, or Worldscope data not available
-2
Final sample studied 100 Table 2. Explanatory variables
Hypotheses Name of the variable Source Explanation (if necessary) H1 Provision intensity Provision intensity Computation
from the annual report
Provisions/Total assets
H2 Size Sales Annual report - H3 Leverage TotalDebtPctCommonEquity Worldscope (Long Term Debt + Short Term
Debt & Current Portion of Long Term Debt)/Common Equity * 100
H4 Profit EPS Worldscope Earnings per share H5 Return ReturnOnEquityTotal Worldscope - H6 Market expectation DividendYieldCurrent Worldscope - H7 Industry Industry Worldscope -
Table 3. OLS Regression Panel A – Unranked data
Variables B (Unstandardized
Coefficients)
t Sig. VIF
(Constant) 0.397 5.519 0.000 prov_ass 0.950 2.593 0.011** 1.310 size 0.000 0.339 0.735 1.449 leverage 0.000 0.842 0.402 1.185 profit -0.003 -0.348 0.729 2.123 return 0.001 1.178 0.242 1.775 market 0.010 0.815 0.418 1.336 auto 0.085 0.807 0.422 1.863 building 0.095 1.014 0.314 2.022 consumer 0.010 0.138 0.891 3.487 energy 0.099 0.806 0.422 1.582 health 0.111 0.928 0.356 1.487 industry -0.013 -0.169 0.866 3.483 media -0.050 -0.567 0.572 2.256 techno -0.001 -0.014 0.989 3.244 F-value: 1.645 Significance F: 0.083 R² = 0.213 Adj. R² = 0.084 ** Significant at the 5% level
Panel B – Ranked data
B (Unstandardized
Coefficients)
t Sig. VIF
(Constant) 8.042 0.541 0.590 rank of prov_ass 0.397 3.388 0.001*** 1.593 rank of size -0.074 -0.592 0.555 1.832 rank of profit 0.203 1.790 0.077* 1.493 rank of return 0.130 0.813 0.418 2.993 rank of leverage 0.039 0.287 0.775 2.160

29
rank of market 0.028 0.242 0.810 1.514 auto 20.405 1.246 0.216 1.778 building 6.533 0.433 0.666 2.064 consumer 5.003 0.433 0.666 3.495 energy 19.635 1.035 0.304 1.461 health 14.787 0.756 0.452 1.553 industry 2.857 0.233 0.817 3.613 media 1.064 0.072 0.943 2.479 techno 7.829 0.604 0.548 3.612 F-value: 2.112 Significance F: 0.019 R² = 0.258 Adj. R² = 0.136 * Significant at the 10% level *** Significant at the 1% level

30
Table 4. DIV results (descriptive statistics)
Percentages of 1 (item disclosed) within each group
Group 1 Group 2 Group 3
Item 1 20.00 90.63 21.43 Item 2 0.00 100.00 0.00 Item 3 2.50 50.00 0.00 Item 4 45.00 90.63 82.14 Item 5 5.00 15.63 32.14 Item 6 0.00 68.75 100.00 Item 7 80.00 84.38 71.43 Item 8 100.00 100.00 100.00 Item 9 72.50 90.63 85.71 Item 10 52.50 81.25 57.14 Item 11 22.50 18.75 42.86 Item 12 5.00 18.75 21.43 Item 13 42.50 53.13 46.43 Item 14 55.00 81.25 71.43 Number of firms 40 32 28 Average disclosure level 0.359 0.674 0.523

31
Table 5. Kruskal Wallis tests of differences between the three sub-groups
Variables Groups N Mean Rank Chi-Square Asymp. Sig. index 1 40 25.688 2 32 79.031 3 28 53.339 Total 100 61.365 0.000*** prov_ass 1 40 41.600 2 32 60.031 3 28 52.321 Total 100 7.329 0.026** size 1 40 42.600 2 32 56.563 3 28 54.857 Total 100 4.995 0.082* leverage 1 40 41.625 2 32 58.813 3 28 53.679 Total 100 6.707 0.035** profit 1 40 40.850 2 32 63.906 3 28 48.964 Total 100 11.337 0.003*** return 1 40 49.025 2 32 55.063 3 28 47.393 Total 100 1.216 0.544 market 1 40 39.388 2 32 60.422 3 28 55.036 Total 100 10.440 0.005*** * Significant at the 10% level ** Significant at the 5% level *** Significant at the 1% level

32
Figure 1. Overview of methodological issues and solutions
Unweighted items
Weighted items
Issue No. 1 Disclosure
index
Issue No. 3 Relation between the disclosure level and
the independent variables
),...,,(level disclosure General... 2121 nk VarVarVarfItemItemItem ==++
Issue No. 2 Number of
independent variables and multicollinearity
OLS regression
Rank OLS regression
Separate regression
models
Factor analysis
Diagnostic of multicollinearity: Reversal of the signs of the coefficients between the correlation matrix and the
regression equation High Variance Inflation Factor (VIF)
OLS (stepwise) regression

33
Figure 2. Research design
Disclosure index analysis: (Quantity analysis)
DIV analysis: (Pattern analysis)
level disclosure GeneralItemItemItem =+++ 1421 ...
Data
Univariate (parametric or non parametric tests)
Ordinary linear regression (OLS)
Rank linear regression

Figure 3. Clustering tree
N = 40
Item 6 = 1Item 6 = 0
Item 2 = 0 Item 2 = 1
Decision node 2
Cluster 1
Cluster 2
N = 32
Cluster 3
N = 28
Decision node 1
34