Embed Size (px)
Citation preview
Corporate Ownership & Control / Volume 12, Issue 4, Summer 2015, Continued – 6
671
AN ANALYSIS OF THE DETERMINANTS OF CORPORATE GOVERNANCE DISCLOSURE POLICIES IN MULTINATIONAL
ENTERPRISES: A MULTI- MEDIUM STUDY
Daniel Zeghal*, Manel Moussa**
Abstract Purpose – This research aims to identify the factors underlying the corporate governance disclosure policies of the world’s largest multinational companies (MNCs) based on the following: (1) national factors related to the MNCs’ home countries (2) governance factors related to their governance systems and (3) operational factors arising from the operational characteristics of the MNCs. Methodology – Our sample includes 159 MNCs from 24 countries representing three geographic regions. The corporate governance disclosure policy is examined in terms of level and quality of disclosed information in two different mediums (traditional i.e .paper vs. websites). Results – Multiple linear regressions indicate that national factors, especially cultural ones, are important determinants of MNCs corporate governance disclosure policy in the traditional print mediums. National factors, however, seem to play no part in governance disclosures on the internet but can rather be explained by the international MNCs listing status. Practical implications – This study could guide the harmonization efforts of international standard setters in identifying factors leading to different governance disclosure behaviors and the disclosure medium most influenced by these factors.
Keywords: MNCs, Disclosure, Policy, Corporate Governance, Cultural Characteristics, MNCs’ Characteristics, Traditional Mediums, Websites * Telfer School of Management, University of Ottawa ** Higher Institute of Business Administration, University of Gafsa, Tunisia
Acknowledgement We acknoledge the support of the CPA-Canada Accounting and Governance Research Center at the
University of Ottawa
1 Introduction A small number of large MNCs dominate the global economy. Consequently, the global economy relies upon their stable functioning. When governance mechanisms break down, the impact is felt not only in the home country but around the world (UNCTAD, 2011). A good example of this is the bankruptcies, frauds, social and environmental implications of MNCs businesses and the subprime crisis that was at the origin of the world economic crisis.
The harmful practices of a small number of
MNCs called into question the reputation of the
majority of them and showed the importance of good
corporate governance systems for the stability of
economies and wellbeing of society. Good governance
practices strengthen the trust between a company and
its partners and contributes to creating more value for
the company and its shareholders as well as
contributing to the economic development of these
countries. Governance disclosure represents the most
effective tool that regulators can use to encourage
companies to comply to best corporate governance
practices (Winter Report, 2002)1. Furthermore,
1 Report of the High Level Group of Company Law Experts on
a Modern Regulatory Framework for Company Law in
markets are more effective when investors have
sufficient information to properly assess corporate
governance and make better investment decisions
(OECD, 2004)2. Recently, governance disclosure has
become an important aspect of corporate transparency,
particularly, for those involved in global business and
aiming to improve their reputation in international
markets (Radebaugh et al. 2006; Markarian et al.
2007; Kolk, 2008).
Previous studies on governance disclosure
focused on domestic companies whose disclosure
practices are largely influenced by the legal and
financial contexts of their home countries (Bushman et
al. 2004; Vander Bauwhede and Willekens, 2008; Ben
Othman and Zeghal, 2008; Khan, 2009). A few studies
have examined whether governance disclosure by
multinationals, facing different legal, social and
regulatory parameters, could be affected by factors
other than those identified for national companies.
Furthermore, it should be noted that these studies
Europe, 4 November 2002. Available at: http://ec.europa.eu/internal_market/company/ docs/modern/report_en.pdf 2 Corporate government principles of the OECD, 2004
Corporate Ownership & Control / Volume 12, Issue 4, Summer 2015, Continued – 6
672
focused on a single disclosure medium, namely annual
reports.
In this study, we try to overcome these
limitations by focusing on a sample of MNCs and
analyzing two main disclosure mediums namely the
annual printed reports (.i.e. annual reports and proxy
statements) and websites.
The main objective of our research is to identify
the determinants of MNCs governance disclosure
policy. Governance disclosure policy will be
considered in terms of level and quality of disclosed
information via the two types of disclosure mediums
chosen. Determinants of governance disclosure policy
will be divided into three groups of factors: (1)
national factors related to the MNCs’ home countries
(2) governance factors related to MNCs’ governance
systems and (3) operational factors arising from the
operational characteristics of MNCs. The purpose of
our analysis is to determine which factors are likely to
best explain MNCs governance disclosure policy in
each of the studied mediums. Based on a sample of
159 MNCs from 24 countries, the results of this
research show that while national factors remain
preeminent determinants of MNCs in annual printed
reports, their influence is lessened on the websites
where governance disclosure policy is better explained
by international MNCs listing status.
The rest of the paper is organized as follows: the
second section presents the theoretical framework of
governance disclosure. In the third section, our
hypotheses are developed. Section 4 presents the
sample and the methodology used to collect data and
measure MNCs governance disclosure policy. Results
are presented in section 5 and the conclusion is the
subject of the last section.
2 Importance of Governance Disclosure for Companies and other Decision Makers
Recent developments in governance codes and
regulations around the world requiring companies to
disclose the main aspects of their governance
structures and practices, underline the importance of
this information to the various company stakeholders,
especially following the series of accounting scandals
of some companies in recent years (Webb et al.
2008,b).
Clear and comprehensive information on
governance is useful for the investing decisions of
both actual and potential investors (Parum, 2005)
allowing them to assess the credibility and
effectiveness of the governance system of a given
society (OECD, 2004) which, in turn, allows them to
deduce the quality of published accounting figures
(Klein, 2002) and make more accurate predictions of
future performance (Bhat et al. 2006).
The multinational status of the company makes
this disclosure more useful for investors in view of
the multitude of governance standards and principles
to which MNCs are subject and the difficulty of
assessing these companies’ risks and actual and future
performances (Luo, 2005 b; Radebaugh et al. 2006).
Governance disclosure is also important for
companies since raising capital at lower cost in
international financial markets depends increasingly
on efficiency and reliability guarantees that the
governance system can provide3. This largely explains
why companies increasingly provide to their
shareholders and other interested parties a description
of their situation in terms of governance. However,
despite the global consensus on the content of these
disclosures4, reporting on governance varies widely
around the world (Bushman et al. 2004; Vander
Bauwhede and Willekens, 2008; Ben Othman and
Zeghal, 2008).
2.1 Theoretical framework of the determinants of information disclosure on governance
According to the agency theory, greater corporate
governance disclosure would reduce agency costs
resulting either from separating ownership and control
or from debt (Vander Bauwhede and Willekens,
2008). This incentive is particularly relevant for
MNCs because the complexity of their global
operation aggravates the informational gap and the
difficulties of observing efforts made by managers to
optimally use funds of geographically scattered
shareholders or creditors (Luo, 2005 b). From a
political perspective, managers can disseminate
information about the level of their compliance with
good governance principles. They thus avoid the risk
of implementing more costly regulations for the
company in the governance and governance disclosure
fields5. The desire to mitigate the adverse effects of
political visibility on the international scale is greater
for large MNCs that attract more attention from the
media, politicians and the general public (Watts and
Zimmerman, 1978). From a signaling perspective,
well-governed MNCs would be interested in
increasing their governance disclosure level in order to
signal their governance quality to investors and have a
more advantageous cost of capital. Beyond the desire
to reduce agency and political and capital costs,
governance disclosure could serve as a tool to
legitimize a company’s activities. This is especially
true for MNCs which need to appear legitimate in
terms of the integrity of their governance system and
3 ASX Corporate Governance Council (2003), Principles of
Good Corporate Governance and Best Practice Recommendations, March 2003 4 UNCTAD, 2009 Review of the implementation status of
corporate governance disclosures: an inventory of disclosure requirements in 24 emerging markets, Twenty-sixth session, TD/B/C.II/ISAR/CRP.8 5 The Sarbanes Oxley Act 2002 and the European directive
2006/46/CE enacted as a reaction to a number of major corporate and accounting scandals of several large American and European companies set new and more severe reforms in the field of corporate governance and the information governance dissemination.
Corporate Ownership & Control / Volume 12, Issue 4, Summer 2015, Continued – 6
672
to avoid incurring costs resulting from non-legitimacy,
especially after the accounting scandals involving
several of these companies (legitimacy theory).
At an international level, accounting models
suggest that a number of factors are at play to explain
variation of governance disclosure practices. These
factors include the political and legal environment
(Belkaoui, 1983; La Porta et al. 1998; Jaggi and Low,
2000), the national culture (Gray, 1988; Zarzeski,
1996), the economic development level (Belkaoui,
1983; Adhikari and Tondkar, 1992), and capital
market factors such as size and activity level
(Adhikari and Tondkar, 1992; Doupnik and Salter,
1995).
2.2 Previous Studies on determinants of governance information disclosure
Many studies have been conducted on the
determinants of governance disclosure at a national
level (Labelle, 2002; Bujaki and McConomy, 2002;
Parum, 2005; Bhuiyan and Biswas, 2007; Parsa et al.
2007; Webb et al. 2008 b) and also internationally
(Bushman et al. 2004; Vander Bauwhede and
Willekens, 2008; Ben Othman and Zeghal, 2008;
Khan, 2009). Generally, results of these studies
showed that theories discussed above have a strong
explanatory power with respect to disclosure behavior
for the governance of the studied companies. Within a
national framework, variations in governance
disclosure levels are explained by factors representing
agency costs (corporate size, debt level, ownership
structure, etc.), political costs (performance, etc.), cost
of capital (inter-listing, intention to raise funds, etc.)
or by the characteristics of the corporate governance
system (size and independence of the board, etc.).
Internationally, these differences are mainly explained
by national factors, such as the legal system and the
development level of capital markets. However, the
usefulness of these theories in explaining governance
disclosures of MNCs, remains unexplored. Thus,
multinationalisation offers an interesting framework to
study the relevance, in the specific context of MNCs,
of the factors usually identified in the literature as
significant determinants of governance disclosure by
national companies.
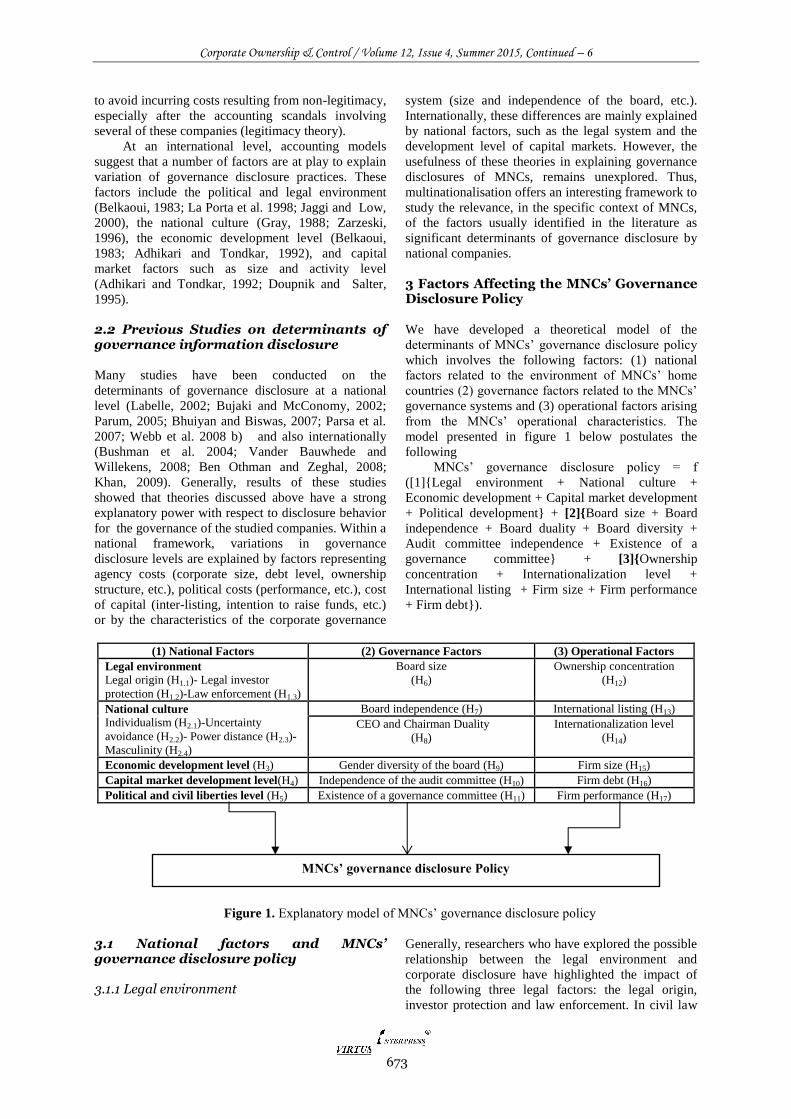
3 Factors Affecting the MNCs’ Governance Disclosure Policy
We have developed a theoretical model of the
determinants of MNCs’ governance disclosure policy
which involves the following factors: (1) national
factors related to the environment of MNCs’ home
countries (2) governance factors related to the MNCs’
governance systems and (3) operational factors arising
from the MNCs’ operational characteristics. The
model presented in figure 1 below postulates the
following
MNCs’ governance disclosure policy = f
([1]{Legal environment + National culture +
Economic development + Capital market development
+ Political development} + [2]{Board size + Board
independence + Board duality + Board diversity +
Audit committee independence + Existence of a
governance committee} + [3]{Ownership
concentration + Internationalization level +
International listing + Firm size + Firm performance
+ Firm debt}).
(1) National Factors (2) Governance Factors (3) Operational Factors
Legal environment
Legal origin (H1.1)- Legal investor
protection (H1.2)-Law enforcement (H1.3)
Board size
(H6)
Ownership concentration
(H12)
National culture
Individualism (H2.1)-Uncertainty
avoidance (H2.2)- Power distance (H2.3)-
Masculinity (H2.4)
Board independence (H7) International listing (H13)
CEO and Chairman Duality
(H8)
Internationalization level
(H14)
Economic development level (H3) Gender diversity of the board (H9) Firm size (H15)
Capital market development level(H4) Independence of the audit committee (H10) Firm debt (H16)
Political and civil liberties level (H5) Existence of a governance committee (H11) Firm performance (H17)
Figure 1. Explanatory model of MNCs’ governance disclosure policy
3.1 National factors and MNCs’ governance disclosure policy 3.1.1 Legal environment
Generally, researchers who have explored the possible
relationship between the legal environment and
corporate disclosure have highlighted the impact of
the following three legal factors: the legal origin,
investor protection and law enforcement. In civil law
MNCs’ governance disclosure Policy
673
Corporate Ownership & Control / Volume 12, Issue 4, Summer 2015, Continued – 6
674
countries, accounting practices and standards in
corporate law and in the commercial code, are highly
codified. In contrast, in common law countries, setting
accounting policies by professional organizations
results in practices that are more adaptive and
innovative in character (Jaggi and Low, 2000).
Thus, common law creates a governance model
oriented towards shareholders, where disclosure is
greater to meet their specific needs (Ball et al. 2000).
In addition, a relatively high legal protection level for
investors and creditors generally produces a diffuse
ownership and a high debt financing level (La Porta et
al. 1998). These firm characteristics are supposed to
trigger agency problems that in turn will generate
strong demand for detailed financial disclosure (Jaggi
and Low, 2000). Finally, efficient judicial systems
allowing good law enforcement, especially accounting
standards, could also have a positive impact on
corporate transparency (La Porta et al.1998). The
positive effect of common law legal origin, investor
protection and law enforcement on a corporate
governance disclosure level has been documented by
Bushman et al. (2004), Vander Bauwhede and
Willekens (2008) and Ben Othman and Zeghal (2008).
We study this association for MNCs through the
following assumptions: H1.1: MNCs’ governance disclosure policy is
positively influenced by the common law legal origin. H1.2: MNCs’ governance disclosure policy is
positively influenced by the investor protection level in their home countries.
H1.3: MNCs’ governance disclosure policy is positively influenced by the law enforcement level in their countries.
3.1.2 Cultural values
Studying the impact of culture on information
disclosure mainly refers to the cultural model of Gray
(1988, p.11) suggesting that « The higher a country
ranks in terms of uncertainty avoidance and power
distance and the lower it ranks in terms of
individualism and masculinity then the more likely it
is to rank highly in terms of secrecy». A preference for
collectivism rather than individualism is likely to be
characteristic of this type of closed society since it
reflects more concern for the interests of the group
most closely involved in the company’s management
and financing rather than for the interests of external
groups such as potential investors or the public in
general. A strong hierarchical distance favors the
secrecy preserving the inequality and therefore the
power of a select few. A preference for secrecy is also
a characteristic of a high uncertainty avoidance level
resulting from the need to restrict disclosures in order
to limit competition uncertainties and ensure safety.
Finally, dominance of masculine values (achievement,
material success, etc.) favors disclosure to publicize
achievements and success. Empirical studies generally
confirm these predictions (Salter and Niswander,
1995; Zarzeski, 1996; Hussein, 1996; Williams, 1999;
Jaggi and Low, 2000; Hope, 2003). We examine the
cultural potential impact on governance disclosure of
MNCs through these hypotheses: H2.1: MNCs’ governance disclosure policy is
positively influenced by the individualism level in their
home countries.
H2.2 : MNCs’ governance disclosure policy is
negatively influenced by the power distance level in their
home countries .
H2.3 : MNCs’ governance disclosure policy is
negatively influenced by the uncertainty avoidance level in
their home countries .
H2.4 : MNCs’ governance disclosure policy is
positively influenced by the masculinity level in their home
countries.
3.1.3 Economic development level
The more the economic activities and size of a
company increase, the more the social function of
accounting, as an instrument for measuring and
communicating economic data, becomes important
(Radebaugh et al. 2006). In addition, developed
countries have more resources to devote to the
accounting standardization and regulation process
which will have a direct impact on the requirements
and disclosure levels (Adhikari and Tondkar, 1992).
Some research shows that governance disclosure is
better in high-income countries than in countries with
a mainly low and middle income environment
(UNCTAD Survey, 20056; Khan, 2009). It is therefore
interesting to test this association for MNCs: H3 : MNCs’ governance disclosure policy is positively
influenced by the economic development level of their home
countries.
3.1.4 Capital markets development level
The larger the size of capital markets, the larger will
be the number of participants in these markets and
pressures for disclosure will be more important
(Adhikari and Tondkar, 1992). Moreover, the
existence of an active stock market causes increases
the information disclosure required for purchasing and
selling decisions from shareholders and potential
investors (Radebaugh and al. 2006). The results of
previous research generally confirms these predictions
(Bushman et al. 2004). We test the impact of the
capital markets development on MNCs’ disclosure
through the following hypothesis: H4 : MNCs’ governance disclosure policy is positively
influenced by the capital markets development level in their
home countries.
3.1.5 Political system
Political and civil systems can affect the disclosure
practices of companies (Belkaoui, 1983). If political
rights and civil liberties in a country are important, the
disclosure pressures of stakeholders are intense and
companies are encouraged to adopt transparent
6 International Accounting and Reporting Issues, 2005
Review. UNCTAD/ITE/TEB/2005/7
Corporate Ownership & Control / Volume 12, Issue 4, Summer 2015, Continued – 6
674
disclosure policies to meet the public's information
needs and maintain their image and external
relationships (Williams, 2004). The following
assumption explores the potential impact of the
political system on MNCs’ governance disclosure
policy: H5 : MNCs’ governance disclosure policy is positively
influenced by civil and political liberties in their home
countries.
3.2 Governance factors and MNCs’ governance disclosure policy 3.2.1 Board size
Large MNCs will usually have larger boards than
domestic companies. Higher board size allows the
board to create a pool of resources and experience
and can help monitor managers’ performance (Luo,
2005 a). Therefore, we conclude that when the MNCs
board is large, control is more efficient, and managers
act in the shareholders’ interests. The favorable effect
of the board size on manager control leads to a
positive influence on the MNCs’ governance
disclosure: H6 : MNCs’ governance disclosure policy is positively
influenced by their board size.
3.2.2 Board independence
As the size of the company increases, the need to
control agency conflicts increases. The inclusion of
independent directors who act as arbitrators in
conflicts and ratify decisions concerning serious
agency problems will help achieve this control (Luo,
2005 a).
These arguments suggest that management
control and decision-making processes are better in
MNCs when the board is composed of a majority of
independent directors which would positively
influence their governance disclosure. H7: MNCs’ governance disclosure policy is positively
influenced by their board independence.
3.2.3 Combining the position of Chairman and CEO
The agency theory considers that combining the
position of Chairman and CEO weakens the oversight
and governance functions of the board including the
firm's information disclosure policy towards
outsiders. We test the possible link between the
combination of these two functions and governance
disclosure of MNCs through the following hypothesis: H8 : MNCs’ governance disclosure policy is negatively
influenced by the combination of the positions of Chief Executive
Officer and Chairman of the Board.
3.2.4 Gender diversity of the board
According to the agency theory, diversity of gender in
the makeup of the board enables the board to perform
its manager’s oversight role more effectively (Adams
and Pereira, 2009). The positive impact of gender
diversity on managers’ behavior could result, among
other things, in a better monitoring of managers’
reports (Gul et al. 2011) and therefore in better
information disclosure (Fernandez-Feijoo et al. 2012).
We will thus assume that : H9 : MNCs’ governance disclosure policy is positively
influenced by the percentage of women within the board.
3.2.5 Board committees
The agency theory predicts that the creation of an
audit committee composed of independent members
reduces agency costs and improves the information
flow between shareholders and managers (Forker,
1992). Companies with independent audit committees
tend to be more active and effective in their
governance disclosure (Parsa et al. 2007). Similarly,
companies with a governance committee are more
likely to comply with best governance practices and to
release information to the public about this. Thus, we
expect: H10 : MNCs’ governance disclosure policy is
positively influenced by the ratio of independent members
within their audit committees.
H11 : MNCs’ governance disclosure policy is
positively influenced by the existence of a governance
committee.
3.3 Operational factors and MNCs’ governance disclosure policy 3.3.1 MNCs’ ownership concentration
According to the agency theory, information
disclosure is a particularly important tool that can be
used by managers to show that they act in owners’
interests. However, in companies where ownership
structure is concentrated in the hands of a few strong
shareholders with direct access to information, the
need for public financial information is less important
(La Porta et al.1998). Previous results generally
document a negative association between ownership
concentration and governance disclosure (Labelle,
2002 ; Vander Bauwhede and Willekens, 2008).
Similarly, we predict that: H12 : MNCs’ governance disclosure policy is
negatively influenced by the share percentage held by
blockholders.
3.3.2 MNCs’ international listing
Foreign exchange trading, particularly in the English-
speaking financial sector, with its more stringent
disclosure requirements, pushes companies to improve
their disclosures so as to access these markets (Meek
et al. 1995). Then, in order to achieve the expected
benefits of foreign trading, such as obtaining less
costly capital, the company will be encouraged to
increase its disclosure. In addition, dispersed
ownership may increase with access to the many listed
675
Corporate Ownership & Control / Volume 12, Issue 4, Summer 2015, Continued – 6
674
foreign exchanges which increases the need for
information dissemination. Hrasky and Collett (2005)
reveal that international listing of firms favors
governance disclosure. Thus, we suggest that: H13 : MNCs’ governance disclosure policy
governance is positively influenced by their inter-listing on
foreign capital markets.
3.3.3 MNCs’ multinationalisation level
The more the company is multinationalised, the
greater its influence will be and the more it will attract
the attention of regulators, international organizations,
international investors and various other groups that
are interested in the company’s behavior especially
with respect to its business management. Thus, it
becomes more important for highly multinationalised
companies to disclose non-financial information
especially regarding its ethics business and
governance structures and policies. The disclosure of
this information is necessary to promote corporate
accountability and complete disclosure of financial
information (Luo, 2005 a). Therefore, we expect that : H14 : MNCs’ governance disclosure policy is
positively influenced by their multinationalisation level.
3.3.4 MNCs’ size
Previous studies also show a positive association
between governance disclosure and company size
(Labelle, 2002; Gandia, 2008). This could reflect the
needs of large enterprises to manage their political
exposure costs or higher agency costs. Large firms
seem to have sufficient resources to provide more
relevant disclosure on their governance practices
(Vander Bauwhede and Willekens, 2008).
3.3.5 MNCs’ debt
Bujaki and Mconomy (2002) suggest that companies
that are financed by more borrowing are generally
more prodigal in information governance in order to
reduce debt agency costs.
3.3.6 MNCs’ performance
Several studies were able to document a positive
impact of companies’ performance on their
governance disclosure practices (Collett and Hrasky,
2005). Companies generating significant revenue are
indeed best placed to invest in governance practices
that could be then disclosed (Labelle, 2002). Thus, we
expect a positive relationship between the size, debt
and performance and disclosure policy of MNCs’
governance.
4 Methodology 4.1 The sample
To create our sample, we used a list of the 250 largest
MNCs in the world as listed in the Global Fortune 500
of 2011. We first removed the MNCs of the financial,
banking, insurance and securities sectors due to the
specifities of their activities and the particularity of
rules used to present their accounts. Then, we
removed unlisted MNCs. In addition, we excluded
MNCs whose annual reports of 2010 and/or websites
were not available or available but in a language other
than English or French.
We also excluded MNCs from cross-border
mergers between two groups with different
nationalities since it would be difficult to test the
impact of some national variables on the information
disclosure policy on the governance of these MNCs.
Finally, we removed MNCs that belong to countries
where some national data was lacking. Our final
sample is thus composed of 159 listed MNCs spread
over 24 countries that represent 3 different regions and
operate in 13 different industrial sectors7. The sample
is summarized in table 1.
4.2 Source of data
Information on governance was manually extracted
from two kinds of medium: print medium on the one
hand and MNCs’ websites on the other. In terms of the
print medium, our study focuses primarily on the
annual reports of 2010 as the main source of
information about MNCs. However, in the United
States, the study assesses companies’ disclosure from
a composite base, which incorporates annual reports
and proxy statements that represent the main
information disclosure medium on governance.
Information related to the explanatory variables
(operational and governance variables) were manually
collected from annual reports and / or proxy
statements of MNCs. Cultural dimensions indicators
were manually collected from Hofstede’s database
(1980), countries’ legal origin was based on La Porta
et al. (1998), investors’ protection level was according
to Djankov et al. (2006), the variables used to
calculate law enforcement quality and degree of civil
liberties are collected from World Governance
Indicators of Kauffmann et al. (2010)8, the economic
development level and capital markets’ development
level are from the World Bank database, World
development indicators 20109.
7 See Appendix 1 for a detailed list of the sampled countries
composition 8 www.govindicators.org.
9 http://data.worldbank.org/indicator
676
Corporate Ownership & Control / Volume 12, Issue 4, Summer 2015, Continued – 6
677
Table 1. Summary statement of the sampling procedure and the sample’s characteristics
Observations No.
Initial number of MNCs 250
Initial number of countries 30
Less MNCs from financial sector 62
Less unlisted MNCs 21
Less MNCs with no annual reports of 2010 and / or websites 3
Less merged MNCs between two groups with different nationalities* 1
Less absorbed MNCs during the data collection period**
2
Less MNCs from countries lacking some national data. 2
Final sample 159
Countries number 24
Continents number (America, Europe, Asia) 3
* The Anglo-Dutch Unilever group
** American Chrysler Group and Medco health solutions groups
4.3 Measure of the governance disclosure policy
To measure the information disclosure policy on
MNCs’ governance in each of the analyzed disclosure
medium we went through the following steps :
Development of the code frame of the information on governance
Based on a review of the various national and
international regulations and recommendations
specifying the content of disclosure on governance to
be published by companies as well as some research
on governance disclosure, particularly in the
international context10, 115 different items have been
identified and classified into five main categories
presented in table 2 below. This categorization is
based on the benchmark of good practices in corporate
governance disclosure developed by the
Intergovernmental Working Group of Experts on
International Standards of Accounting and Reporting
ISAR of the UNCTAD for the distribution of the 53
items contained in its transparency and publication
guide on corporate governance.
10
See Appendix 2 for a detailed description of the sources used to select governance items
Corporate Ownership & Control / Volume 12, Issue 4, Summer 2015, Continued – 6
678
Table 2. Information categories on Governance
Information categories on Governance Number of items
1 Information on the structure and process of the management and board of directors. 60
2 Information on ownership structure and shareholder rights. 17
3 Information about the audit. 8
4 Information about the governance of the social, environmental and ethical
responsibility of the company.
22
5 Financial transparency and information disclosure. 8
Total 115
Scale choice for measuring information on governance
To encode the different informational identified items,
we have used two measurement scales. The first scale
measures the level of information disseminated by
MNCs (existence or not), while the second assesses
the quality of the information disseminated (form and
detail level).
Measurement scale of the information disclosure
level on governance
This scale consists in assigning 1 to each
communicated item and 0 otherwise.
Measurement scale of the information disclosure
quality on governance
The second scale consists in assigning a score to
each item according to its informative content.
Specifically, 0 is given if there is no information; 1 if
the information is generally described; 2 if the
information is precise (i.e. if it is quantified but not
detailed or is detailed but not quantified); 3 if the
information is detailed and quantified. This weighted
coding procedure that allows for categorizing the
information quality on governance in terms of form
and detailing level ( literal and general, quantitative or
detailed, quantitative and detailed) was inspired by the
one used by Wiseman ( 1982) and Cormier et al.
(2009) that weights shortlisted informational items
from 0 to 3. But unlike these researchers who attribute
the maximum score of 3 points to quantitative items,
we attribute the mark 3 only to items disclosed in an
quantified but also detailed form ( Botosan, 1997; Eng
and Teo, 1999; Eng and Mak, 2003).
Content analysis of the disclosure and medium encoding of the disclosed information
Each section of the annual reports, proxy statements
and the websites of the selected MNCs has been read
carefully and all items on governance, grouped in an
analytical framework11, were encoded according to the
two pre-established coding procedures. It should be
noted that all the sampled MNCs’ websites were
recorded during October 2011 in order to maintain the
online coding while ensuring data consistency
(Cormier et al. 2009). In order to provide greater
reliability to the disclosure measurement process, the
11
The measurement grid (checklist) is provided in Appendix 3
two authors conducted individual coding of the
documents related to the first ten MNCs and compared
their results. Having reached a consensus on the
results of their encoding, a co-author, who is familiar
with the content analysis method, conducted the
coding of the remaining annual written medium and
websites.
Calculation of the MNCs’ governance information disclosure indices
At the end of the encoding process, two indices have
been calculated for each disclosure medium. Total
indexes were created with one measuring the
governance disclosure level corresponding to the total
of points obtained with 115 points as a maximum
index and the other a total index measuring the
disclosure quality with 345 points as a maximum
index.
LGDk (QGDk) = ∑ XNi=1 ik
With LGDk (QGDk ): Total index level (quality)
of the disclosure of the firm k; N: total number of
items expected to be disclosed by a firm k. N is equal
to 115. Xik : Score of item i
4.4 Descriptive analysis of the governance disclosure variable
Table 3 provides descriptive statistics of the MNCs
governance disclosure level (LGD) and quality (QGD)
in each studied medium. Compared to the annual
print mediums and websites, annual reports present
the lowest disclosure levels and qualities on
governance with indices below the mean (Panel A
from table 3). This is due to a large number of MNCs
(almost 40% of the sample), especially American ones
(32% of the sample), that do not devote a special
section to governance in their annual reports. These
MNCs publish this information elsewhere, in
particular in proxy statements. When we consider
disclosures on governance of American MNCs in
both annual reports and proxy statements, level and
quality indices of governance disclosures of MNCs
have significantly improved.
Corporate Ownership & Control / Volume 12, Issue 4, Summer 2015, Continued – 6
679
Table 3. Descriptive statistics for the disclosure indices by medium
N Mean Standard deviation Minimum Q1 Median Q3 Maximum
Panel A : Annual reports
LGD 159 41.30 27.462 4 14 36 67 92
QGD 159 97.78 70.355 5 30 78 167 244
Panel B : Annual Printed mediums
LGD 159 58.974 20.026 4 48 64 74 92
QGD 159 141.534 52.843 5 106 156 178 244
Panel C : Websites
LGD 159 54.43 15.906 2 44 54 65 88
QGD 159 130.7 44.302 4 102 125 159 241
Legend : Panel A provides descriptive statistics of disclosure indices in annual reports. Panel B provides descriptive
reports of disclosure indices on annual reports taking into consideration disclosures of American MNCs in proxy
statements. Panel C provides descriptive statistics on disclosure indices via websites.
Variables definitions: LGD = Governance disclosure level index; QGD = Governance disclosure quality index; N :
Number of observations.
According to Panel B of table 3, the average
disclosure level for the annual print mediums is
established at 58.974 which is slightly above the
mean. Half of the sampled MNCs disclose less than
64 items in the annual print mediums (median = 64).
25% of MNCs disclose less than 48 items (quartile 1)
and 25% diffuse more than 74 items (quartile 3). The
average quality of governance disclosure is 141.534
which remains below the mean. On average, standard
deviations of information disclosure on governance
compared to the mean are 20.026 and 52.843 items
proving the presence of a significant variation of the
qualities and levels of governance disclosure between
the MNCs of the sample. Results shown in panel C of
table 3 show that the information disclosure level on
governance via websites of our sampled MNCs is
practically at the mean (54.43) while the disclosure
quality is set to 130.7 and remains below the mean.
On average, the values of standard deviations of
information disclosure compared to the mean indicates
that the variation is quite strong for these medium.
The comparison of the governance information
disclosure policy of MNCs’ between the three
mediums show a kind of similarity among practices.
Whether we speak about the annual print mediums or
the websites of MNCs, disclosure level and quality are
close to the mean although they seem slightly higher
in the print medium. This result likely shows that
MNCs consider their websites as complementary
channels to disclose their information on governance.
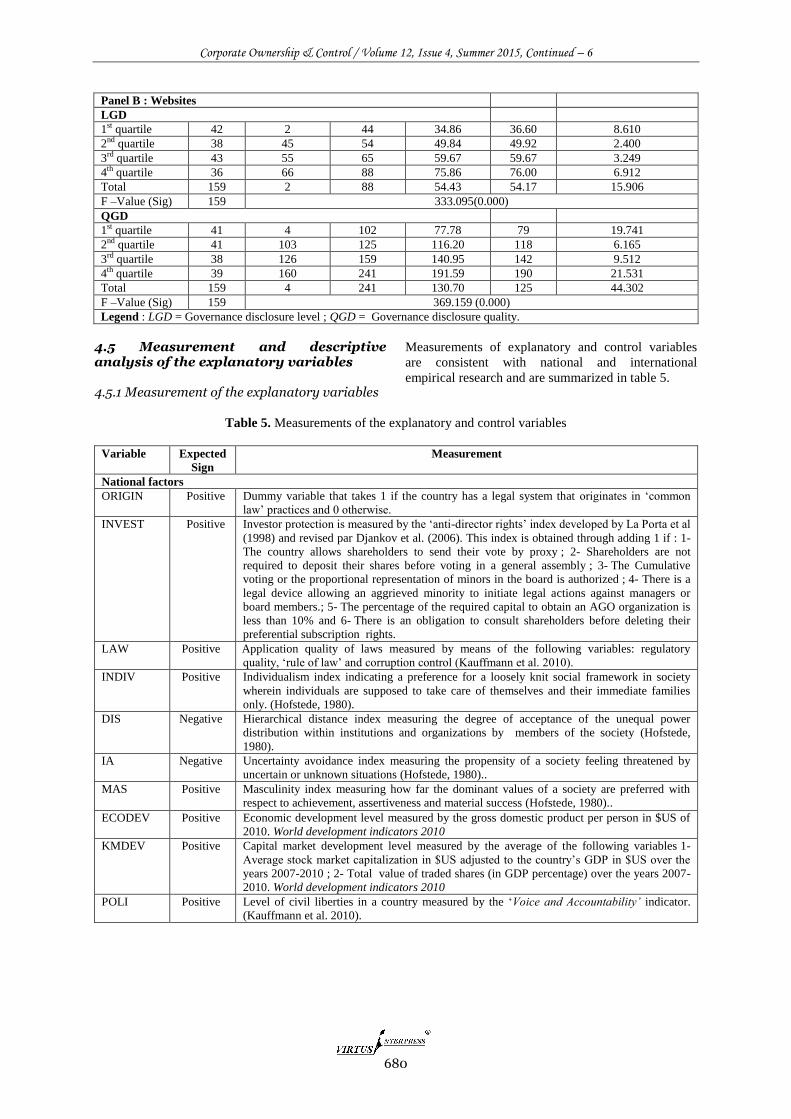
The descriptive analysis per quartile of the variables
LGD and QGD reported in table 4 (Panels A and B)
confirms the presence of a significant variability in the
governance disclosure policy of MNCs’, whether in
the print mediums or via their websites and justifies
our explanatory study about this variability.
Table 4. Descriptive statistics by quartile of disclosure indices
N Minimum Maximum Mean Median Standard deviation
Panel A : Annual printed mediums
LGD
1sr quartile 42 4 48 30.404 29.666 11.240
2nd quartile 38 49 64 58.473 58.857 4.578
3rd quartile 42 65 74 68.476 68.100 2.670
4th quartile 37 75 92 81.135 80.600 4.905
Total 159 4 92 58.974 64.272 20.026
F –Value (Sig) 159 408.528 (0.000)
QGD
1st quartile 40 5 106 62.825 59.5 23.416
2nd quartile 43 117 156 139.674 144 11.975
3rd quartile 38 157 178 168.473 168.5 6.306
4th quartile 38 180 244 199.552 196.5 15.493
Total 159 5 244 141.534 156 52.843
F –Value (Sig) 159 552.000 (0.000)
Corporate Ownership & Control / Volume 12, Issue 4, Summer 2015, Continued – 6
680
Panel B : Websites
LGD
1st quartile 42 2 44 34.86 36.60 8.610
2nd quartile 38 45 54 49.84 49.92 2.400
3rd quartile 43 55 65 59.67 59.67 3.249
4th quartile 36 66 88 75.86 76.00 6.912
Total 159 2 88 54.43 54.17 15.906
F –Value (Sig) 159 333.095(0.000)
QGD
1st quartile 41 4 102 77.78 79 19.741
2nd quartile 41 103 125 116.20 118 6.165
3rd quartile 38 126 159 140.95 142 9.512
4th quartile 39 160 241 191.59 190 21.531
Total 159 4 241 130.70 125 44.302
F –Value (Sig) 159 369.159 (0.000)
Legend : LGD = Governance disclosure level ; QGD = Governance disclosure quality.
4.5 Measurement and descriptive analysis of the explanatory variables 4.5.1 Measurement of the explanatory variables
Measurements of explanatory and control variables
are consistent with national and international
empirical research and are summarized in table 5.
Table 5. Measurements of the explanatory and control variables
Variable Expected
Sign
Measurement
National factors
ORIGIN Positive Dummy variable that takes 1 if the country has a legal system that originates in ‘common
law’ practices and 0 otherwise.
INVEST
Positive Investor protection is measured by the ‘anti-director rights’ index developed by La Porta et al
(1998) and revised par Djankov et al. (2006). This index is obtained through adding 1 if : 1-
The country allows shareholders to send their vote by proxy ; 2- Shareholders are not
required to deposit their shares before voting in a general assembly ; 3- The Cumulative
voting or the proportional representation of minors in the board is authorized ; 4- There is a
legal device allowing an aggrieved minority to initiate legal actions against managers or
board members.; 5- The percentage of the required capital to obtain an AGO organization is
less than 10% and 6- There is an obligation to consult shareholders before deleting their
preferential subscription rights.
LAW Positive Application quality of laws measured by means of the following variables: regulatory
quality, ‘rule of law’ and corruption control (Kauffmann et al. 2010).
INDIV
Positive Individualism index indicating a preference for a loosely knit social framework in society
wherein individuals are supposed to take care of themselves and their immediate families
only. (Hofstede, 1980).
DIS
Negative Hierarchical distance index measuring the degree of acceptance of the unequal power
distribution within institutions and organizations by members of the society (Hofstede,
1980).
IA Negative Uncertainty avoidance index measuring the propensity of a society feeling threatened by
uncertain or unknown situations (Hofstede, 1980)..
MAS Positive Masculinity index measuring how far the dominant values of a society are preferred with
respect to achievement, assertiveness and material success (Hofstede, 1980)..
ECODEV Positive Economic development level measured by the gross domestic product per person in $US of
2010. World development indicators 2010
KMDEV
Positive Capital market development level measured by the average of the following variables 1-
Average stock market capitalization in $US adjusted to the country’s GDP in $US over the
years 2007-2010 ; 2- Total value of traded shares (in GDP percentage) over the years 2007-
2010. World development indicators 2010
POLI Positive Level of civil liberties in a country measured by the ‘Voice and Accountability’ indicator.
(Kauffmann et al. 2010).
Corporate Ownership & Control / Volume 12, Issue 4, Summer 2015, Continued – 6
681
Governance factors
BSIZE Positive Board size measured by the number of the directors.
BINDEP Positive Board independence measured by the ratio: Number of independent members/ Board size.
BDUAL Negative Dichotomous variable that takes the value of 1 if the positions of Chief Executive Officer
and Chairman are combined and 0 otherwise.
BDIVER Positive Degree of board diversity measured by the percentage of women on the board of directors.
ACINDEP Positive Audit committee independence measured by the ratio of independent members over the total
number of members of the audit committee.
GCOM Positive Binary variable that takes 1 if the board has a governance committee and 0 otherwise.
Operational factors
BLOC
Negative Ownership concentration measured by the percentage of shares held by blockholders having
5% or more of the capital.
INTERLIST Positive Binary variable that takes the value of 1 if the company is listed in a foreign stock market
and zero otherwise.
MULTIN
Positive Degree of multinationalisation measured by the average of the following three ratios :
foreign sales/ total sales in $US;workforce abroad/ total work force and assets abroad/total
assets in $US. This measure is based on the transnationality index (TNI) calculated by the
UNCTAD to evaluate the multinationalisation degree of non-financial MNCs.
SIZE Positive Company size measured by the total assets logarithm in $US.
DEBT Positive Company debt measured by the ratio Total debt/ total assets.
PERF Positive Company performance measured by the return on equity.
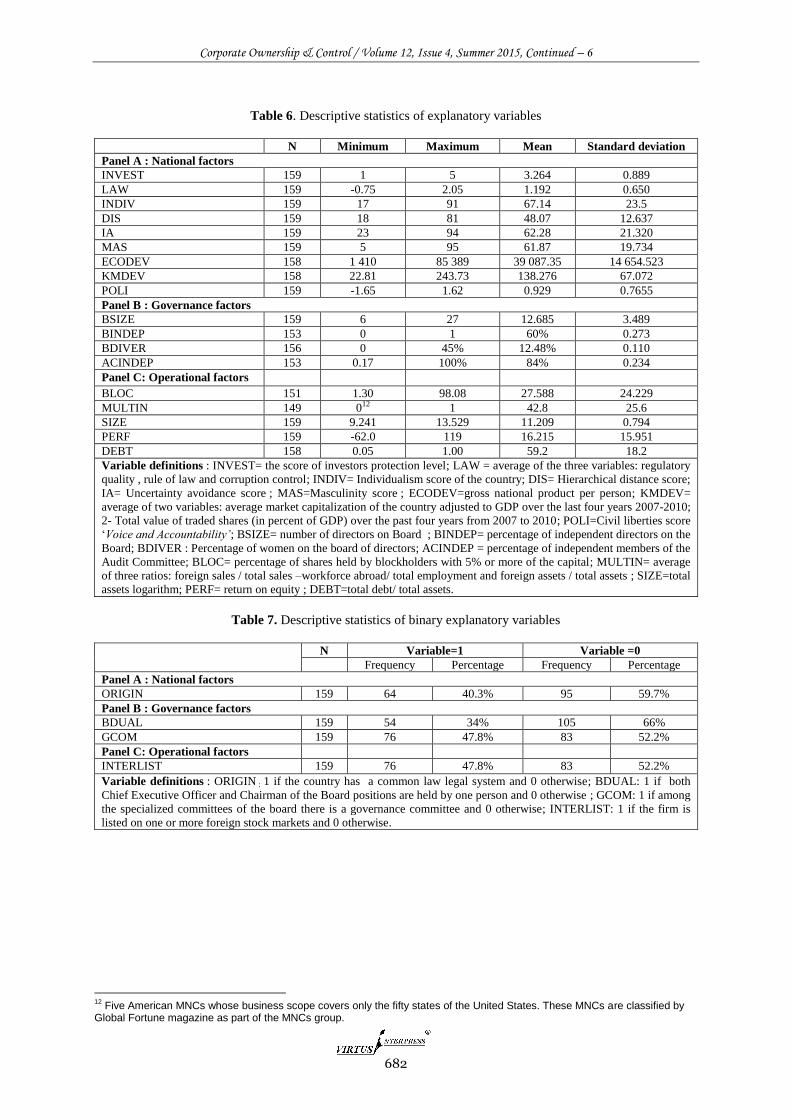
4.5.2 Descriptive analysis of explanatory variables
In table 6, the average index of investor protection
(INVEST) in countries of our sample is 3.264. China
has the lowest protection level with 1 as the index
compared to the United Kingdom, Spain, Brazil and
India that have the highest index of 5. The index
reflecting the quality of applying laws (LAW) varies
between a minimum of -0.75 (in Russia) and a
maximum of 2.05 (in Denmark). A country’s degree
of individualism in our sample (INDIV) varies
between a minimum index of 17 in Taiwan and a
maximum index of 91 in the United States. The
average index of acceptance for hierarchical
inequities (DIS) is 48.07. The degree of uncertainty
avoidance (IA) varies between a minimal value of 23
in Denmark and a maximum value of 94 in Belgium.
Finally, the degree of masculinity dominance in the
sampled countries (MAS) varies between a minimum
of 5 in Sweden and a maximum of 95 in Japan
suggesting that Sweden is the country with the highest
level of feminist values whereas masculinity values
are highest in Japan. On average, the degree of
economic development (ECODEV) of countries is $39
087.35 . The average degree of capital markets
development (KMDEV) is 138.276. The average score
on the level of civil liberties (POLI) in countries from
our sample is 0.929. There is a maximum value of
1.62 for Switzerland and a minimum value of -1.65 in
China. Table 7 shows that 40.3% of MNCs from our
sample are from common law countries (ORIGIN)
while 59.7% of MNCs are based in civil law
countries.
On average, the MNCs’ boards in our sample
are composed of 13 members (BSIZE). The smallest
boards have only 6 members while larger ones include
up to 27 members. On average, 60% of board
members of our sampled MNCs are not part of the
management team and are independent (BINDEP).
Concerning the variable BDUAL, in 34% of our
sampled MNCs the position of both CEO and
Chairman of the Board is held by one person . On
average, 12.5% of board members of the sampled
MNCs are women (BDIVER). Approximately 48% of
our MNCs have a governance committee set up by the
board of directors (GCOM). Majority shareholders
(BLOC) hold an average of 27.588% of MNCs
capital. The average multinationalisation percentage
(MULTIN) of our MNCs is 42.8%. Furthermore, 48%
of the MNCs are inter-listed on one or more foreign
stock markets (INTERLIST). The total assets
logarithm that indicates a company’s size (SIZE)
varied between a minimum of 9.241 and a maximum
of 13.529. On average, MNCs in our sample have an
ROE of 16.215% (PERF). The minimum level of
return on equity is -62% while the maximum is
established at 119%. The average debt ratio of the
sampled MNCs (DEBT) is 59.21% that indicates that
MNCs in our sample are highly leveraged.
Corporate Ownership & Control / Volume 12, Issue 4, Summer 2015, Continued – 6
682
Table 6. Descriptive statistics of explanatory variables
N Minimum Maximum Mean Standard deviation
Panel A : National factors
INVEST 159 1 5 3.264 0.889
LAW 159 -0.75 2.05 1.192 0.650
INDIV 159 17 91 67.14 23.5
DIS 159 18 81 48.07 12.637
IA 159 23 94 62.28 21.320
MAS 159 5 95 61.87 19.734
ECODEV 158 1 410 85 389 39 087.35 14 654.523
KMDEV 158 22.81 243.73 138.276 67.072
POLI 159 -1.65 1.62 0.929 0.7655
Panel B : Governance factors
BSIZE 159 6 27 12.685 3.489
BINDEP 153 0 1 60% 0.273
BDIVER 156 0 45% 12.48% 0.110
ACINDEP 153 0.17 100% 84% 0.234
Panel C: Operational factors
BLOC 151 1.30 98.08 27.588 24.229
MULTIN 149 012 1 42.8 25.6
SIZE 159 9.241 13.529 11.209 0.794
PERF 159 -62.0 119 16.215 15.951
DEBT 158 0.05 1.00 59.2 18.2
Variable definitions : INVEST= the score of investors protection level; LAW = average of the three variables: regulatory
quality , rule of law and corruption control; INDIV= Individualism score of the country; DIS= Hierarchical distance score;
IA= Uncertainty avoidance score ; MAS=Masculinity score ; ECODEV=gross national product per person; KMDEV=
average of two variables: average market capitalization of the country adjusted to GDP over the last four years 2007-2010;
2- Total value of traded shares (in percent of GDP) over the past four years from 2007 to 2010; POLI=Civil liberties score
‘Voice and Accountability’; BSIZE= number of directors on Board ; BINDEP= percentage of independent directors on the
Board; BDIVER : Percentage of women on the board of directors; ACINDEP = percentage of independent members of the
Audit Committee; BLOC= percentage of shares held by blockholders with 5% or more of the capital; MULTIN= average
of three ratios: foreign sales / total sales –workforce abroad/ total employment and foreign assets / total assets ; SIZE=total
assets logarithm; PERF= return on equity ; DEBT=total debt/ total assets.
Table 7. Descriptive statistics of binary explanatory variables
N Variable=1 Variable =0
Frequency Percentage Frequency Percentage
Panel A : National factors
ORIGIN 159 64 40.3% 95 59.7%
Panel B : Governance factors
BDUAL 159 54 34% 105 66%
GCOM 159 76 47.8% 83 52.2%
Panel C: Operational factors
INTERLIST 159 76 47.8% 83 52.2%
Variable definitions : ORIGIN : 1 if the country has a common law legal system and 0 otherwise; BDUAL: 1 if both
Chief Executive Officer and Chairman of the Board positions are held by one person and 0 otherwise ; GCOM: 1 if among
the specialized committees of the board there is a governance committee and 0 otherwise; INTERLIST: 1 if the firm is
listed on one or more foreign stock markets and 0 otherwise.
12
Five American MNCs whose business scope covers only the fifty states of the United States. These MNCs are classified by Global Fortune magazine as part of the MNCs group.
Corporate Ownership & Control / Volume 12, Issue 4, Summer 2015, Continued – 6
683
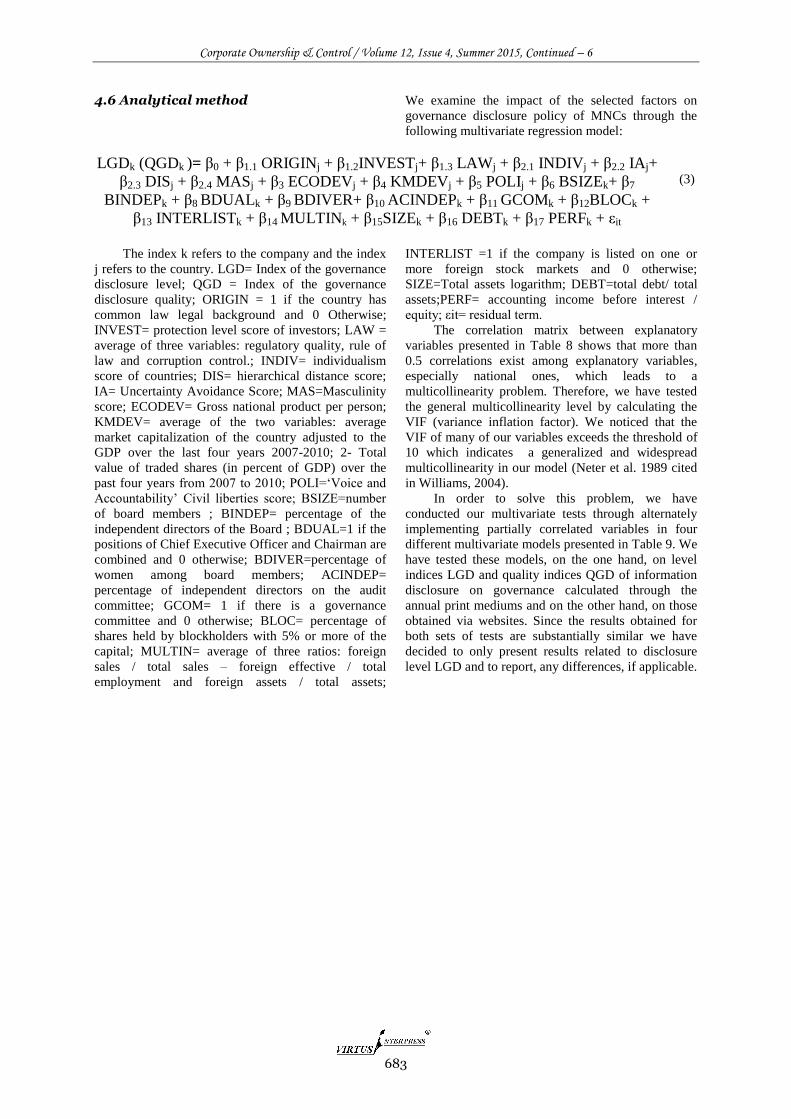
4.6 Analytical method
We examine the impact of the selected factors on
governance disclosure policy of MNCs through the
following multivariate regression model:
LGDk (QGDk )= β0 + β1.1 ORIGINj + β1.2INVESTj+ β1.3 LAWj + β2.1 INDIVj + β2.2 IAj+
β2.3 DISj + β2.4 MASj + β3 ECODEVj + β4 KMDEVj + β5 POLIj + β6 BSIZEk+ β7
BINDEPk + β8 BDUALk + β9 BDIVER+ β10 ACINDEPk + β11 GCOMk + β12BLOCk +
β13 INTERLISTk + β14 MULTINk + β15SIZEk + β16 DEBTk + β17 PERFk + εit
The index k refers to the company and the index
j refers to the country. LGD= Index of the governance
disclosure level; QGD = Index of the governance
disclosure quality; ORIGIN = 1 if the country has
common law legal background and 0 Otherwise;
INVEST= protection level score of investors; LAW =
average of three variables: regulatory quality, rule of
law and corruption control.; INDIV= individualism
score of countries; DIS= hierarchical distance score;
IA= Uncertainty Avoidance Score; MAS=Masculinity
score; ECODEV= Gross national product per person;
KMDEV= average of the two variables: average
market capitalization of the country adjusted to the
GDP over the last four years 2007-2010; 2- Total
value of traded shares (in percent of GDP) over the
past four years from 2007 to 2010; POLI=‘Voice and
Accountability’ Civil liberties score; BSIZE=number
of board members ; BINDEP= percentage of the
independent directors of the Board ; BDUAL=1 if the
positions of Chief Executive Officer and Chairman are
combined and 0 otherwise; BDIVER=percentage of
women among board members; ACINDEP=
percentage of independent directors on the audit
committee; GCOM= 1 if there is a governance
committee and 0 otherwise; BLOC= percentage of
shares held by blockholders with 5% or more of the
capital; MULTIN= average of three ratios: foreign
sales / total sales – foreign effective / total
employment and foreign assets / total assets;
INTERLIST =1 if the company is listed on one or
more foreign stock markets and 0 otherwise;
SIZE=Total assets logarithm; DEBT=total debt/ total
assets;PERF= accounting income before interest /
equity; εit= residual term.
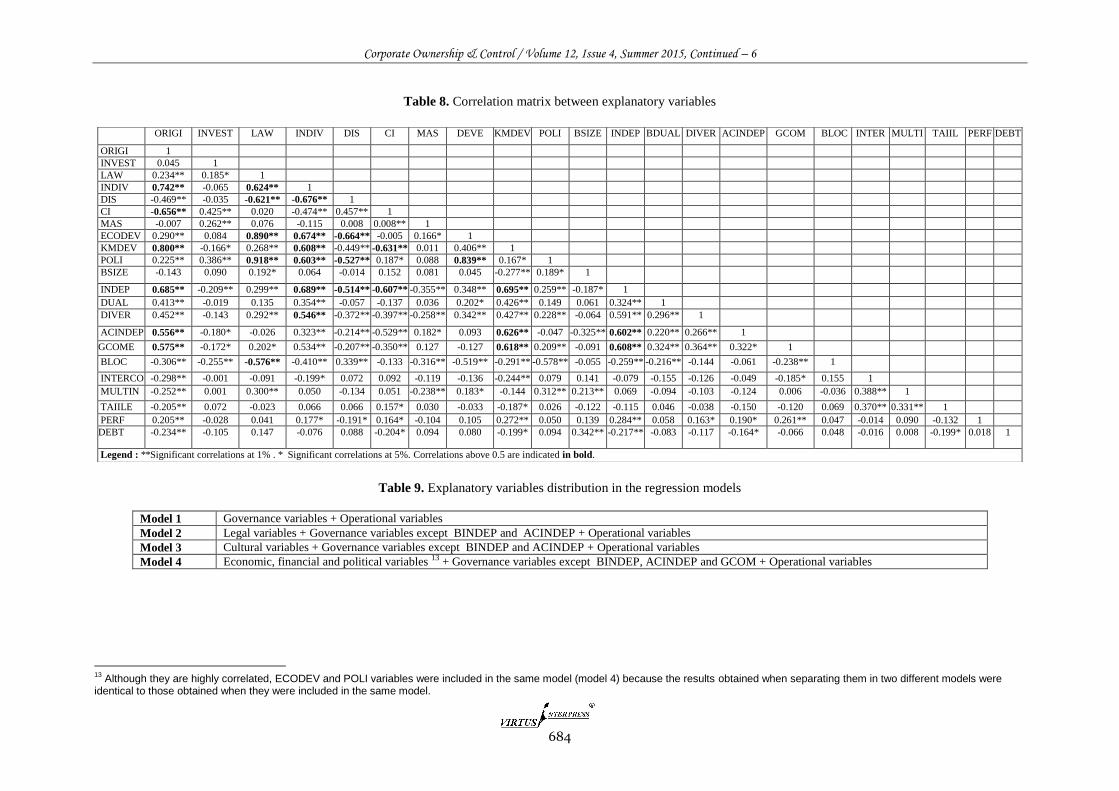
The correlation matrix between explanatory
variables presented in Table 8 shows that more than
0.5 correlations exist among explanatory variables,
especially national ones, which leads to a
multicollinearity problem. Therefore, we have tested
the general multicollinearity level by calculating the
VIF (variance inflation factor). We noticed that the
VIF of many of our variables exceeds the threshold of
10 which indicates a generalized and widespread
multicollinearity in our model (Neter et al. 1989 cited
in Williams, 2004).
In order to solve this problem, we have
conducted our multivariate tests through alternately
implementing partially correlated variables in four
different multivariate models presented in Table 9. We
have tested these models, on the one hand, on level
indices LGD and quality indices QGD of information
disclosure on governance calculated through the
annual print mediums and on the other hand, on those
obtained via websites. Since the results obtained for
both sets of tests are substantially similar we have
decided to only present results related to disclosure
level LGD and to report, any differences, if applicable.
(3)
Corporate Ownership & Control / Volume 12, Issue 4, Summer 2015, Continued – 6
684
Table 8. Correlation matrix between explanatory variables
Table 9. Explanatory variables distribution in the regression models
Model 1 Governance variables + Operational variables
Model 2 Legal variables + Governance variables except BINDEP and ACINDEP + Operational variables
Model 3 Cultural variables + Governance variables except BINDEP and ACINDEP + Operational variables
Model 4 Economic, financial and political variables 13 + Governance variables except BINDEP, ACINDEP and GCOM + Operational variables
13
Although they are highly correlated, ECODEV and POLI variables were included in the same model (model 4) because the results obtained when separating them in two different models were identical to those obtained when they were included in the same model.
ORIGI INVEST LAW INDIV DIS CI MAS DEVE KMDEV POLI BSIZE INDEP BDUAL DIVER ACINDEP GCOM BLOC INTER MULTI TAIIL PERF DEBT
ORIGI 1
INVEST 0.045 1
LAW 0.234** 0.185* 1
INDIV 0.742** -0.065 0.624** 1
DIS -0.469** -0.035 -0.621** -0.676** 1
CI -0.656** 0.425** 0.020 -0.474** 0.457** 1
MAS -0.007 0.262** 0.076 -0.115 0.008 0.008** 1
ECODEV 0.290** 0.084 0.890** 0.674** -0.664** -0.005 0.166* 1
KMDEV 0.800** -0.166* 0.268** 0.608** -0.449** -0.631** 0.011 0.406** 1
POLI 0.225** 0.386** 0.918** 0.603** -0.527** 0.187* 0.088 0.839** 0.167* 1
BSIZE -0.143 0.090 0.192* 0.064 -0.014 0.152 0.081 0.045 -0.277** 0.189* 1
INDEP 0.685** -0.209** 0.299** 0.689** -0.514** -0.607** -0.355** 0.348** 0.695** 0.259** -0.187* 1
DUAL 0.413** -0.019 0.135 0.354** -0.057 -0.137 0.036 0.202* 0.426** 0.149 0.061 0.324** 1
DIVER 0.452** -0.143 0.292** 0.546** -0.372** -0.397** -0.258** 0.342** 0.427** 0.228** -0.064 0.591** 0.296** 1
ACINDEP 0.556** -0.180* -0.026 0.323** -0.214** -0.529** 0.182* 0.093 0.626** -0.047 -0.325** 0.602** 0.220** 0.266** 1
GCOME 0.575** -0.172* 0.202* 0.534** -0.207** -0.350** 0.127 -0.127 0.618** 0.209** -0.091 0.608** 0.324** 0.364** 0.322* 1
BLOC -0.306** -0.255** -0.576** -0.410** 0.339** -0.133 -0.316** -0.519** -0.291** -0.578** -0.055 -0.259** -0.216** -0.144 -0.061 -0.238** 1
INTERCO -0.298** -0.001 -0.091 -0.199* 0.072 0.092 -0.119 -0.136 -0.244** 0.079 0.141 -0.079 -0.155 -0.126 -0.049 -0.185* 0.155 1
MULTIN -0.252** 0.001 0.300** 0.050 -0.134 0.051 -0.238** 0.183* -0.144 0.312** 0.213** 0.069 -0.094 -0.103 -0.124 0.006 -0.036 0.388** 1
TAIILE -0.205** 0.072 -0.023 0.066 0.066 0.157* 0.030 -0.033 -0.187* 0.026 -0.122 -0.115 0.046 -0.038 -0.150 -0.120 0.069 0.370** 0.331** 1
PERF 0.205** -0.028 0.041 0.177* -0.191* 0.164* -0.104 0.105 0.272** 0.050 0.139 0.284** 0.058 0.163* 0.190* 0.261** 0.047 -0.014 0.090 -0.132 1
DEBT -0.234** -0.105 0.147 -0.076 0.088 -0.204* 0.094 0.080 -0.199* 0.094 0.342** -0.217** -0.083 -0.117 -0.164* -0.066 0.048 -0.016 0.008 -0.199* 0.018 1
Legend : **Significant correlations at 1% . * Significant correlations at 5%. Correlations above 0.5 are indicated in bold.
Corporate Ownership & Control / Volume 12, Issue 4, Summer 2015, Continued – 6
685
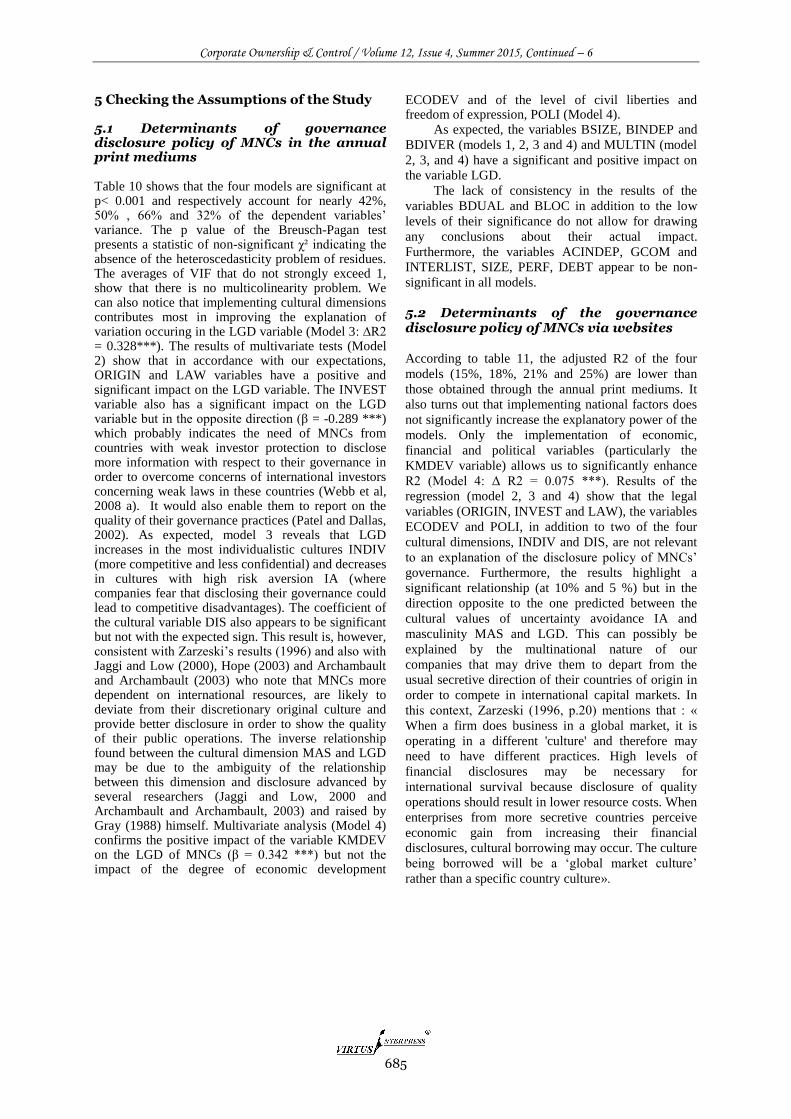
5 Checking the Assumptions of the Study 5.1 Determinants of governance disclosure policy of MNCs in the annual print mediums Table 10 shows that the four models are significant at p< 0.001 and respectively account for nearly 42%, 50% , 66% and 32% of the dependent variables’ variance. The p value of the Breusch-Pagan test presents a statistic of non-significant χ² indicating the absence of the heteroscedasticity problem of residues. The averages of VIF that do not strongly exceed 1, show that there is no multicolinearity problem. We can also notice that implementing cultural dimensions contributes most in improving the explanation of variation occuring in the LGD variable (Model 3: ∆R2 = 0.328***). The results of multivariate tests (Model 2) show that in accordance with our expectations, ORIGIN and LAW variables have a positive and significant impact on the LGD variable. The INVEST variable also has a significant impact on the LGD variable but in the opposite direction (β = -0.289 ***) which probably indicates the need of MNCs from countries with weak investor protection to disclose more information with respect to their governance in order to overcome concerns of international investors concerning weak laws in these countries (Webb et al, 2008 a). It would also enable them to report on the quality of their governance practices (Patel and Dallas, 2002). As expected, model 3 reveals that LGD increases in the most individualistic cultures INDIV (more competitive and less confidential) and decreases in cultures with high risk aversion IA (where companies fear that disclosing their governance could lead to competitive disadvantages). The coefficient of the cultural variable DIS also appears to be significant but not with the expected sign. This result is, however, consistent with Zarzeski’s results (1996) and also with Jaggi and Low (2000), Hope (2003) and Archambault and Archambault (2003) who note that MNCs more dependent on international resources, are likely to deviate from their discretionary original culture and provide better disclosure in order to show the quality of their public operations. The inverse relationship found between the cultural dimension MAS and LGD may be due to the ambiguity of the relationship between this dimension and disclosure advanced by several researchers (Jaggi and Low, 2000 and Archambault and Archambault, 2003) and raised by Gray (1988) himself. Multivariate analysis (Model 4) confirms the positive impact of the variable KMDEV on the LGD of MNCs (β = 0.342 ***) but not the impact of the degree of economic development
ECODEV and of the level of civil liberties and freedom of expression, POLI (Model 4).
As expected, the variables BSIZE, BINDEP and
BDIVER (models 1, 2, 3 and 4) and MULTIN (model
2, 3, and 4) have a significant and positive impact on
the variable LGD.
The lack of consistency in the results of the
variables BDUAL and BLOC in addition to the low
levels of their significance do not allow for drawing
any conclusions about their actual impact.
Furthermore, the variables ACINDEP, GCOM and
INTERLIST, SIZE, PERF, DEBT appear to be non-
significant in all models.
5.2 Determinants of the governance disclosure policy of MNCs via websites
According to table 11, the adjusted R2 of the four
models (15%, 18%, 21% and 25%) are lower than
those obtained through the annual print mediums. It
also turns out that implementing national factors does
not significantly increase the explanatory power of the
models. Only the implementation of economic,
financial and political variables (particularly the
KMDEV variable) allows us to significantly enhance
R2 (Model 4: Δ R2 = 0.075 ***). Results of the
regression (model 2, 3 and 4) show that the legal
variables (ORIGIN, INVEST and LAW), the variables
ECODEV and POLI, in addition to two of the four
cultural dimensions, INDIV and DIS, are not relevant
to an explanation of the disclosure policy of MNCs’
governance. Furthermore, the results highlight a
significant relationship (at 10% and 5 %) but in the
direction opposite to the one predicted between the
cultural values of uncertainty avoidance IA and
masculinity MAS and LGD. This can possibly be
explained by the multinational nature of our
companies that may drive them to depart from the
usual secretive direction of their countries of origin in
order to compete in international capital markets. In
this context, Zarzeski (1996, p.20) mentions that : «
When a firm does business in a global market, it is
operating in a different 'culture' and therefore may
need to have different practices. High levels of
financial disclosures may be necessary for
international survival because disclosure of quality
operations should result in lower resource costs. When
enterprises from more secretive countries perceive
economic gain from increasing their financial
disclosures, cultural borrowing may occur. The culture
being borrowed will be a ‘global market culture’
rather than a specific country culture».
Corporate Ownership & Control / Volume 12, Issue 4, Summer 2015, Continued – 6
686
Table 10. Multiple regressions under ordinary least squares of the relationship between the governance disclosure policy of MNCs in annual print mediums and its determinants
Dependent variable : LGD
Independent variables Expected
sign
Model 1
β (p value)
Model 2
β (p value)
Model 3
β (p value)
Model 4
β (p value)
Nat
ion
al
fact
ors
Constant -8.668 (0.711) 13.809 (0.518) -9.200 (0.623) 15.585 (0.531)
ORIGIN + 0.551***(0.000)
INVEST + -0.289***(0.000)
LAW + 0.134* (0.063)
INDIV + 0.674***(0.000)
DIS - 0.323***(0.000)
IA - -0.352***(0.000)
MAS + -0.195***(0.003)
ECODEV + -0.125 (0.408)
KMDEV + 0.342*** (0.003)
POLI + 0.110 (0.478)
Go
ver
nan
ce
fact
ors
BSIZE + 0.375*** (0.000) 0.316***(0.000) 0.303***(0.000) 0.347*** (0.000)
BINDEP + 0.592*** (0.000) - - -
BDUAL - -0.115 (0.140) -0.135* (0.056) -0.158***(0.008) -0.077 (0.355)
BDIVER + 0.186** (0.037) 0.241***(0.001) 0.108* (0.088) 0.407***(0.000)
ACINDEP + -0.023 (0.815) - - -
GCOM + 0.008 (0.931) 0.001 (0.994) -0.050 (0.444) -
Op
erat
ion
al
fact
ors
BLOC - 0.144** (0.049) 0.180** (0.020) 0.049 (0.440) 0.143 (0.113)
INTERLIST + -0.062 (0.442) 0.054 (0.451) 0.054 (0.362) -0.016 (0.846)
MULTIN + 0.111 (0.196) 0.257***(0.002) 0.115* (0.070) 0.245*** (0,005)
SIZE + 0.016 (0.851) 0.034 (0.638) 0.022 (0.723) -0.046 (0.583)
DEBT + 0.109 (0.141) 0.088 (0.204) 0.075 (0.170) 0.083 (0.294)
PERF +/- -0.049 (0.498) -0.043 (0.395) -0.001 (0.988) -0.040 (0.606)
Ex
pla
nat
ory
po
wer
an
d
Dia
gn
ost
ics
of
the
reg
ress
ion
Number of observations 149 149 149 149
R 2 adjusted 0.419 0.499 0.657 0.315
Fisher F 8.642*** 11.49*** 19.750*** 6.242***
Prob>F 0.000 0.000 0.000 0.000
∆ R 2 - 0.182*** 0.328*** 0.048**
Sig ∆ F - 0.000 0.000 0 .026
Breusch–Pagan test of
heteroscedasticity χ²
0.05 1.43 0.97 7.40
Prob> χ² 0.816 0.231 0.325 0.111
Mean VIF 1,62 1,59 1,73 2,01
Legend: *, ** and *** indicates a bilateral critical probability at 10% (p-value<0.10), 5% (p-value<0.05) and 1% (p-
value<0.01) respectively.
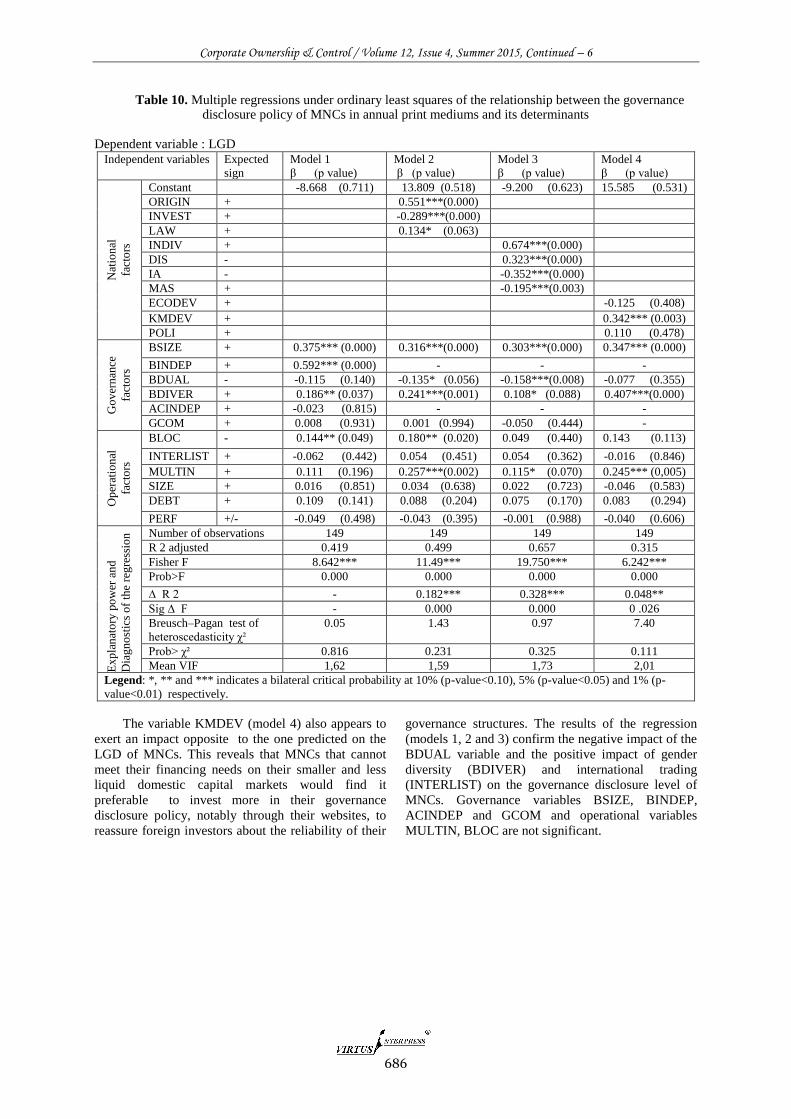
The variable KMDEV (model 4) also appears to
exert an impact opposite to the one predicted on the
LGD of MNCs. This reveals that MNCs that cannot
meet their financing needs on their smaller and less
liquid domestic capital markets would find it
preferable to invest more in their governance
disclosure policy, notably through their websites, to
reassure foreign investors about the reliability of their
governance structures. The results of the regression
(models 1, 2 and 3) confirm the negative impact of the
BDUAL variable and the positive impact of gender
diversity (BDIVER) and international trading
(INTERLIST) on the governance disclosure level of
MNCs. Governance variables BSIZE, BINDEP,
ACINDEP and GCOM and operational variables
MULTIN, BLOC are not significant.
Corporate Ownership & Control / Volume 12, Issue 4, Summer 2015, Continued – 6
687
Table 11. Multiple regressions under ordinary least squares of the relationship between the governance
disclosure policy of MNCs via websites and its determinants
Dependent variable : LGD
Independent variables Expected
sign
Model 1
β (p value)
Model 2
β (p value)
Model 3
β (p value)
Model 4
β (p value)
Nat
ion
al f
acto
rs
Constant 12.578 (0.570) 26.756 (0.206) 25.069 (0.252) 41.984** (0.038)
ORIGIN + -0.035 (0.779)
INVEST + -0.029 0.736)
LAW + -0.101 (0.366)
INDIV + 0.081 (0.561)
DIS - -0.094 (0.455)
IA - 0.226* (0.051)
MAS + -0.225** (0.021)
ECODEV + -0.116 (0.463)
KMDEV + -0.341***(0.005)
POLI + 0.152 (0.347)
Go
ver
nan
ce
fact
ors
BSIZE + 0.070 (0.485) 0.132 (0.139) 0.105 (0.222) 0.032 (0.712)
BINDEP + 0.146 (0.331) - - -
BDUAL - -0.212** (0.026) -0.191**(0.036) -0.182** (0.042) -0.106 (0.227)
BDIVER + 0.226** (0.036) .349***(0.000) 0.255***(0.009) 0.371*** (0.000)
ACINDEP + -0.073 (0.531) - - - - -
GCOM + -0.112 (0.289) -0.100 (0.333) -0.087 (0.382) - -
Op
erat
ion
al
fact
ors
BLOC - 0.011 (0.896) -0.058 (0.550) -0.011 (0.905) -0.035 (0.707)
INTERLIST + 0.236** (0.017) 0.195**(0.034) 0.214** (0.019) 0.195** (0.024)
MULTIN + 0.069 (0.506) 0.179* (0.087) 0.056 (0.559) 0.104 (0.252)
SIZE + 0.145 (0.154) 0.066 (0.481) 0.084 (0.362) 0.058 (0.513)
DEBT + 0.042 (0.636) 0.061 (0.493) 0.042 (0.613) -0.003 (0.970)
PERF +/- 0.042 (0.633) 0.047 (0.574) 0.056 (0.499) 0.099 (0.221)
Ex
pla
nat
ory
po
wer
an
d
Dia
gn
ost
ics
of
the
reg
ress
ion
Number of observations 149 149 149 149
R 2 adjusted 0.1466 0.176 0.213 0.249
Fisher F 2.810*** 3.254*** 3.644*** 4.778***
Prob>F 0.002 0.000 0.000 0.000
∆ dof R 2 - 0.008 0.047* 0.075***
Sig ∆of F - 0.733 0.095 0.005
Breusch–Pagan test of
heteroscedasticity χ²
0.38 0.,57 0.,83 2.02
Prob> χ² 0.538 0.450 0.363 0.155
Mean VIF 1.62 1.59 1.73 2.01
Legend: *, ** and *** indicates a bilateral critical probability at 10% (p-value<0.10),5% (p-value<0.05) and 1% (p-
value<0.01) respectively.
6 Analysis of Results and Conclusions
The main purpose of this study is to identify the
determinants of the information disclosure policy with
respect to MNCs’ governance. Governance disclosure
policy was approached in terms of the volume and the
quality of disclosed information via two types of
disclosure medium (traditional print mediums and
websites). The determinants of the disclosure policy
on governance were grouped into three groups of
factors: (1) national factors related to the environment
of the countries of origin of MNCs, (2) governance
factors related to MNCs’ governance systems and (3)
operational factors arising from the operational
characteristics of MNCs. The descriptive analysis
revealed that the level and quality of the disclosure on
governance differ significantly between MNCs,
particularly in the annual print mediums. The results
of the multivariate tests show that MNCs from the
most individualistic societies and societies with the
lowest uncertainty avoidance level disclose more and
better information on their governance. The same
tendency was observed in MNCs from countries that
are characterized by their common law legal origin,
by a respect for proper law enforcement and by having
more extensively developed capital markets. Beyond
the national factors, size, independence, gender
diversity in the board of directors and the degree of
multinationalisation of MNCs appear to have a
significant positive impact on their disclosure policy
on governance. Unlike their disclosure through the
print mediums, the governance disclosure policy of
MNCs via their websites does not seem to reflect the
impact of national factors. Moreover, we have
observed that MNCs from societies characterized by
high risk aversion and a low masculinity level tend to
deviate from the secretive direction of their countries
to provide better disclosure on governance through
their websites. The same trend was revealed in MNCs
belonging to countries with small and less developed
Corporate Ownership & Control / Volume 12, Issue 4, Summer 2015, Continued – 6
688
stock markets. This result can be explained by the
largely voluntary nature of the disclosure on
governance through websites that generally follow
more strategic reasons, such as the need to raise funds
on the international markets at low cost. The
significant and positive impact that we have found
from the foreign inter-listing of MNCs on their
governance disclosure policy via websites strongly
confirms these suggestions.
The results of this research suggest that even
among the MNCs, the diversity of cultural, legal and
financial contexts will continue to cause differences in
international disclosure practices on governance
through the annual print mediums and therefore
constitute an obstacle to the harmonization efforts of
these disclosures. Instead, it seems that the perception
of managers of MNCs that the internet is an effective
mechanism for information dissemination to a wider
global audience which encourages them to adopt good
information disclosure policy on governance via this
medium in order to meet the needs of international
stakeholders rather than national ones or even present
the information differently without reference to the
legal, cultural, economic and financial impacts of their
countries. Therefore, greater harmonization of the
information disclosure policy on governance could
possibly be made via the internet rather than annual
reports or other print mediums.
Our study contributes through its originality in
searching for the determinants of information
disclosure on governance at the international level by
studying the relevance of theoretical frameworks
usually asked to explain the disclosure on corporate
governance in general rather than in the specific
context of MNCs. Adopting a comparative approach
(between two mediums that differ in terms of format,
frequency, type and extended audience), showed that
the determinants of the disclosure policy on
governance differ from one medium to another. This
allows for extending previous international studies
that are focused on a single medium of disclosure,
namely annual reports. From our perspective, the use
of a disclosure index on governance that is manually
self-construct from the considered disclosure mediums
allows us to supplement international studies that
almost exclusively use disclosure indexes on
governance developed by rating agencies (Bushman et
al., 2004;. Vander Bauwhede and Willekens, 2008).
Finally, this research only studies the determinants of
governance disclosure of MNCs’. Future research
could examine financial consequences of information
disclosure on MNCs’ governance.
References: 1. Adams, R.B. and Ferreira, D. (2009), Women in the
boardroom and their impact on governance and
performance, Journal of Financial Economics, 94, 291-
309.
2. Adhikari, A. and Tondkar, R.H.(1992), Environmental
factors influencing accounting disclosure requirements
of global stock exchanges, Journal of International
Financial Management & Accounting, 4, 75-105.
3. Archambault, J.J. and Archambault, M.E. (2003), A
multinational test of determinants of corporate
disclosure, The International Journal of Accounting, 38,
173–194.
4. Ball, R., Kothari, S.P., and Robin, A. (2000), The effect
of international institutional factors on properties of
accounting earnings, Journal of Accounting and
Economics, 29, 1-51.
5. Belkaoui, A. (1983), Economic, political and civil
indicators and reporting and disclosure adequacy:
empirical investigation, Journal of Accounting and
Public Policy, 2, 3, 207–219.
6. Ben Othman, H. and Zeghal, D. (2008), A Study of
corporate governance disclosure and its country-level
determinants in the emerging markets, Research in
Accounting in Emerging Economies, 8, 125–155.
7. Bhat, G., Hope, O-K. and Kang, T. (2006), Does
corporate governance transparency affect the accuracy
of analyst forecasts?, Accounting and Finance, 46, 715–
732.
8. Bhuiyan, H.U. and Biswas, P. K. (2007), Corporate
governance and reporting: an empirical study of the
listed companies in Bangladesh, Journal of Business
Studies, 28, 1-32.
9. Botosan, C. A. (1997), Disclosure level and the cost of
equity capital, The Accounting Review, 72, 323-349.
10. Bujaki, M. and McConomy, B.J. (2002), Corporate
governance: factors influencing voluntary disclosure by
publicly traded Canadian firms, Canadian Accounting
Perspectives, 1, 105-139.
11. Bushman, R.M., Piotroski, J. D and Smith, A.J. (2004),
What determines corporate transparency?, Journal of
Accounting Research, 42, 207-252.
12. CNUCED (2011), Corporate governance disclosure in
emerging markets: statistical analysis of legal
requirements and company practices. United Nations
Publication, New York and Geneva. Collett, P. and
Hrasky, S. (2005), Voluntary disclosure of corporate
governance practices by listed Australian companies,
Corporate Governance, 13, 188-196.
13. Cormier, D., Ledoux, M.J. and Magnan, M. (2009), The
use of web sites as a disclosure platform for corporate
performance, International Journal of Accounting
Information Systems, 10, 1–24.
14. Djankov, S., La Porta., R, Lopez-de-Silanes., F. and
Shleifer., A. (2006), The law and economics of self-
dealing, http://dare.uva.nl/document/130387.
15. Doupnik, T. S., and Salter, S. B. (1995), External
environment, culture, and accounting practice: a
preliminary test of a general model of international
accounting Development, International Journal of
Accounting, 30, 2, 189-207.
16. Eng, L. L. and Mak, Y. T. (2003), Corporate governance
and voluntary disclosures, Journal of Accounting and
Public Policy, 22, 325–345.
17. Eng, L. L. and Teo, H. K. (1999), The relation between
annual report disclosures, analysts' earnings forecasts
and analyst following: evidence from Singapore, Pacific
Accounting Review, 11, 219-239.
18. Fernandez-Feijoo, B., Romero, S. and Ruiz, S. (2012),
Does board gender composition affect corporate social
responsibility reporting? International Journal of
Business and Social Science, 3, 1, 31-38.
Corporate Ownership & Control / Volume 12, Issue 4, Summer 2015, Continued – 6
688
19. Forker, J.J. (1992), Corporate governance and disclosure
quality, Accounting and Business Research, 22, 86, 111-
124.
20. Gandía, J.L. (2008), Determinants of internet-based
corporate governance disclosure by Spanish listed
companies, Online Information Review, 32, 6, 791-817.
21. Gray, S. J. (1988), Towards a theory of cultural
Influence on the development of accounting systems
nternationally, ABACUS, 24, 1-15.
22. Gul, F.A., Srinidhi, B. and Ng, A.C. (2011), Does board
gender diversity improve the informativeness of stock
prices? , Journal of Accounting and Economics, 51,
314–338.
23. Hofstede, G. (1980), Culture's consequences:
international differences in work-related values. Beverly
Hills: SAGE Publications.
24. Hope, O.K. (2003), Disclosure practices, enforcement of
accounting standards, and analysts' forecast accuracy: an
international study, Journal of Accounting Research, 41,
235-272.
25. Hussein, M. E. (1996), A comparative study of cultural
influences on financial reporting in the U.S. and The
Netherlands, The International Journal of Accounting,
31, 95-120.
26. Jaggi, B. and Low, P. Y. (2000), Impact of culture,
market Forces, and legal system on financial disclosures,
The International Journal of Accounting, 35, 495-519.
27. Khan, T. (2009), Corporate governance disclosure: an
international comparison, International Review of
Business Research Papers, 5, 3, 202-213.
28. Klein, A. (2002), Audit committees, board of director
characteristics and earnings management, Journal of
Accounting and Economics, 33, 375–400.
29. Kolk, A. (2008), Sustainability, Accountability and
Corporate Governance: Exploring Multinationals
Reporting Practices, Business Strategy and the
Environment, 18, 1-15.
30. La Porta R., Lopez-de-Silanes F., Shleifer A. and
Vishny R. (1998), Law and finance, Journal of Political
Economy, 106, 1113-1155.
31. Labelle, R. (2002), The statement of corporate
governance practices (SCGP): a voluntary disclosure
and corporate governance perspective, HEC Montreal
Working Paper.
32. Luo, Y. (2005), How does globalization affect corporate
governance and accountability? A perspective from
MNEs, Journal of International Management, 11, 19–
41.Luo, Y. (2005), Corporate governance and
accountability in multinational enterprises: concepts and
agenda, Journal of International Management, 11, 1–18.
33. Markarian, G., Parbonetti, A. and Previts, G. J. (2007),
The convergence of disclosure and governance practices
in the world’s largest Firms, Corporate Governance, 2,
294-310.
34. Meek, G. K., Roberts, C. B. and Gray, S. J. (1995),
Factors influencing voluntary annual report disclosures
by U.S., U.K. and Continental European multinational
corporations, Journal of International Business Studies,
26, 555–573.
35. Parsa, S., Chong, G. and Isimoya, E. (2007), Disclosure
of governance information by small and medium-sized
companies, Corporate Governance, 7, 635-648.
36. Parum, E. (2005), Does disclosure on corporate
governance lead to openness and transparency in how
companies are managed?, Corporate Governance : An
International Review, 13, 5,702-709.
37. Patel, S.A., et Dallas, G. (2002), Transparency and
Disclosure: Overview of Methodology and Study
Results—United States, http:/ssrn.com/ abstract
=422800, 1-29.
38. Radebaugh, L.H., Black, E.L. and Gray, S.J. (2006),
International accounting and multinational enterprises.
John Wiley & Sons Inc.,6th edition.
39. Salter, S.B. and Niswander, F. (1995), Cultural influence
on the development of accounting systems
internationally: a test of Gray's (1988) theory, Journal of
International Business Studies, 26, 379-397.
40. Vander Bauwhede, H. V. and Willekens, M. (2008),
Disclosure on corporate governance in the European
Union, Corporate Governance, 2, 101-115.
41. Watts, R. L. and Zimmerman, J. L. (1978), Towards a
positive theory of the determination of accounting
standards, The Accounting Review, 53, 1, 112-134.
42. Webb, K. A., Cahan, S.F. and Sun, J. (2008), The effect
of globalization and legal environment on voluntary
disclosure, The International Journal of Accounting, 43,
219–245.
43. Webb, L.H., Leda, J.C. and Wood, N.D. (2008), A
survey of governance disclosures among U.S. firms,
Journal of Business Ethics, 83,543–563.
44. Williams, S.M. (1999), Voluntary environmental and
social accounting disclosure practices in the Asia-Pacific
Region: an international empirical test of political
economy theory, The International Journal of
Accounting, 34, 209– 238.
45. Williams, S.M. (2004), An international investigation of
associations between societal variables and the amount
of disclosure on information technology and
communication problems: The case of Y2K, The
International Journal of Accounting, 39, 71– 92.
46. Wiseman, J. (1982), An evaluation of environmental
disclosures made in corporate annual reports, Acounting,
Organizations and Society, 7, 53–63.
47. Zarzeski, M.T. (1996), Spontaneous harmonization
effects of culture and market forces on accounting
disclosure practices, Accounting Horizons, 10, 1, 18-37.
689
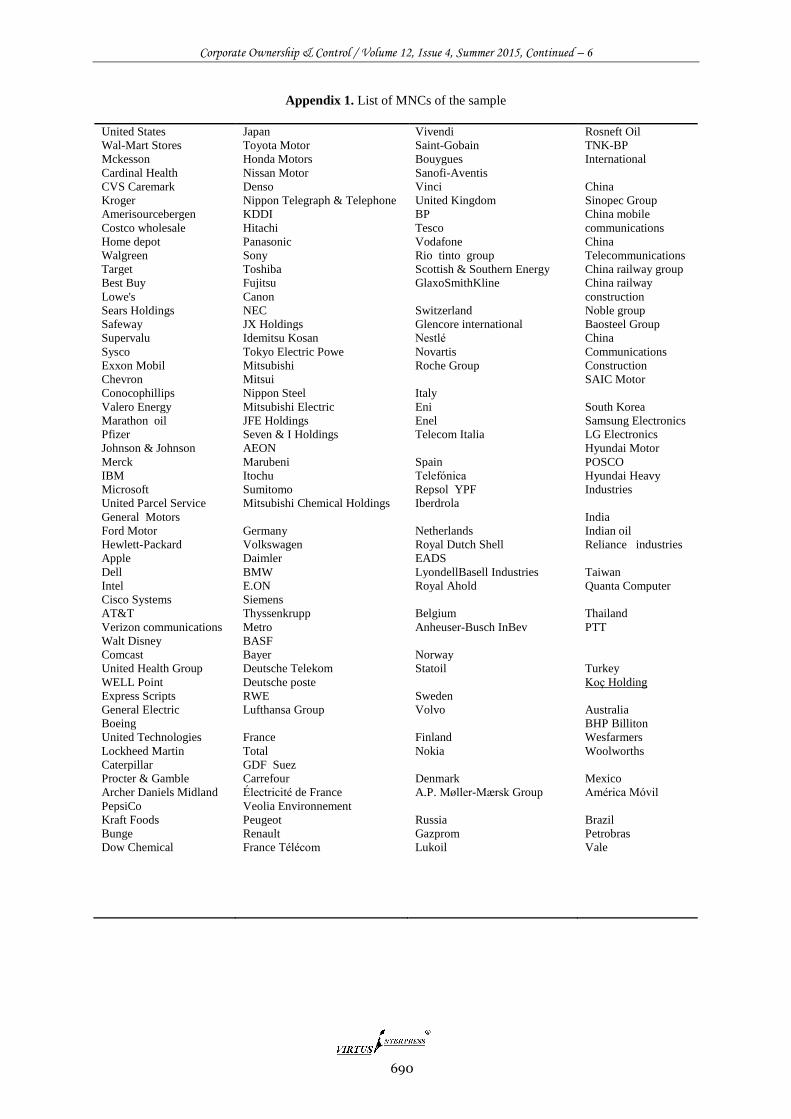
Corporate Ownership & Control / Volume 12, Issue 4, Summer 2015, Continued – 6
691
Appendix 1. List of MNCs of the sample
United States
Wal-Mart Stores
Mckesson
Cardinal Health
CVS Caremark
Kroger
Amerisourcebergen
Costco wholesale
Home depot
Walgreen
Target
Best Buy
Lowe's
Sears Holdings
Safeway
Supervalu
Sysco
Exxon Mobil
Chevron
Conocophillips
Valero Energy
Marathon oil
Pfizer
Johnson & Johnson
Merck
IBM
Microsoft
United Parcel Service
General Motors
Ford Motor
Hewlett-Packard
Apple
Dell
Intel
Cisco Systems
AT&T
Verizon communications
Walt Disney
Comcast
United Health Group
WELL Point
Express Scripts
General Electric
Boeing
United Technologies
Lockheed Martin
Caterpillar
Procter & Gamble
Archer Daniels Midland
PepsiCo
Kraft Foods
Bunge
Dow Chemical
Japan
Toyota Motor
Honda Motors
Nissan Motor
Denso
Nippon Telegraph & Telephone
KDDI
Hitachi
Panasonic
Sony
Toshiba
Fujitsu
Canon
NEC
JX Holdings
Idemitsu Kosan
Tokyo Electric Powe
Mitsubishi
Mitsui
Nippon Steel
Mitsubishi Electric
JFE Holdings
Seven & I Holdings
AEON
Marubeni
Itochu
Sumitomo
Mitsubishi Chemical Holdings
Germany
Volkswagen
Daimler
BMW
E.ON
Siemens
Thyssenkrupp
Metro
BASF
Bayer
Deutsche Telekom
Deutsche poste
RWE
Lufthansa Group
France
Total
GDF Suez
Carrefour
Électricité de France
Veolia Environnement
Peugeot
Renault
France Télécom
Vivendi
Saint-Gobain
Bouygues
Sanofi-Aventis
Vinci
United Kingdom
BP
Tesco
Vodafone
Rio tinto group
Scottish & Southern Energy
GlaxoSmithKline
Switzerland
Glencore international
Nestlé
Novartis
Roche Group
Italy
Eni
Enel
Telecom Italia
Spain
Telefónica
Repsol YPF
Iberdrola
Netherlands
Royal Dutch Shell
EADS
LyondellBasell Industries
Royal Ahold
Belgium
Anheuser-Busch InBev
Norway
Statoil
Sweden
Volvo
Finland
Nokia
Denmark
A.P. Møller-Mærsk Group
Russia
Gazprom
Lukoil
Rosneft Oil
TNK-BP
International
China
Sinopec Group
China mobile
communications
China
Telecommunications
China railway group
China railway
construction
Noble group
Baosteel Group
China
Communications
Construction
SAIC Motor
South Korea
Samsung Electronics
LG Electronics
Hyundai Motor
POSCO
Hyundai Heavy
Industries
India
Indian oil
Reliance industries
Taiwan
Quanta Computer
Thailand
PTT
Turkey
Koç Holding
Australia
BHP Billiton
Wesfarmers
Woolworths
Mexico
América Móvil
Brazil
Petrobras
Vale
690
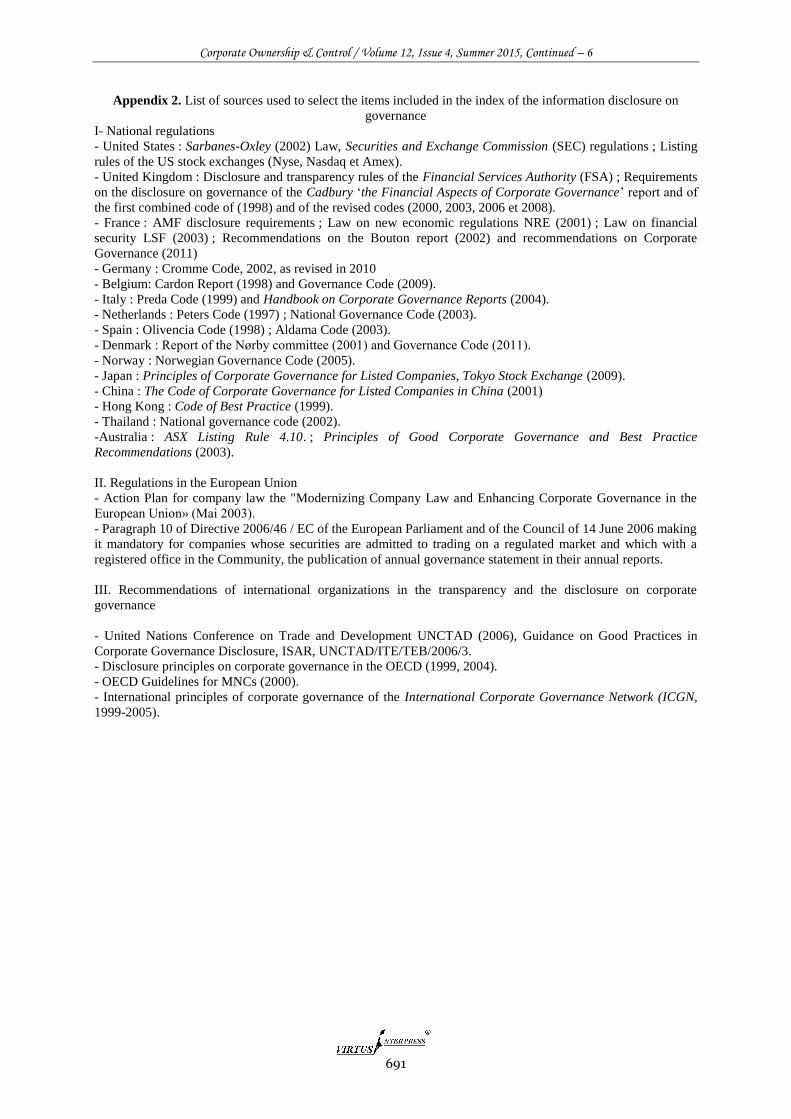
Corporate Ownership & Control / Volume 12, Issue 4, Summer 2015, Continued – 6
691
Appendix 2. List of sources used to select the items included in the index of the information disclosure on
governance
I- National regulations
- United States : Sarbanes-Oxley (2002) Law, Securities and Exchange Commission (SEC) regulations ; Listing
rules of the US stock exchanges (Nyse, Nasdaq et Amex).
- United Kingdom : Disclosure and transparency rules of the Financial Services Authority (FSA) ; Requirements
on the disclosure on governance of the Cadbury ‘the Financial Aspects of Corporate Governance’ report and of
the first combined code of (1998) and of the revised codes (2000, 2003, 2006 et 2008).
- France : AMF disclosure requirements ; Law on new economic regulations NRE (2001) ; Law on financial
security LSF (2003) ; Recommendations on the Bouton report (2002) and recommendations on Corporate
Governance (2011)
- Germany : Cromme Code, 2002, as revised in 2010
- Belgium: Cardon Report (1998) and Governance Code (2009).
- Italy : Preda Code (1999) and Handbook on Corporate Governance Reports (2004).
- Netherlands : Peters Code (1997) ; National Governance Code (2003).
- Spain : Olivencia Code (1998) ; Aldama Code (2003).
- Denmark : Report of the Nørby committee (2001) and Governance Code (2011).
- Norway : Norwegian Governance Code (2005).
- Japan : Principles of Corporate Governance for Listed Companies, Tokyo Stock Exchange (2009).
- China : The Code of Corporate Governance for Listed Companies in China (2001)
- Hong Kong : Code of Best Practice (1999).
- Thailand : National governance code (2002).
-Australia : ASX Listing Rule 4.10. ; Principles of Good Corporate Governance and Best Practice
Recommendations (2003).
II. Regulations in the European Union
- Action Plan for company law the "Modernizing Company Law and Enhancing Corporate Governance in the
European Union» (Mai 2003).
- Paragraph 10 of Directive 2006/46 / EC of the European Parliament and of the Council of 14 June 2006 making
it mandatory for companies whose securities are admitted to trading on a regulated market and which with a
registered office in the Community, the publication of annual governance statement in their annual reports.
III. Recommendations of international organizations in the transparency and the disclosure on corporate
governance
- United Nations Conference on Trade and Development UNCTAD (2006), Guidance on Good Practices in
Corporate Governance Disclosure, ISAR, UNCTAD/ITE/TEB/2006/3.
- Disclosure principles on corporate governance in the OECD (1999, 2004).
- OECD Guidelines for MNCs (2000).
- International principles of corporate governance of the International Corporate Governance Network (ICGN,
1999-2005).
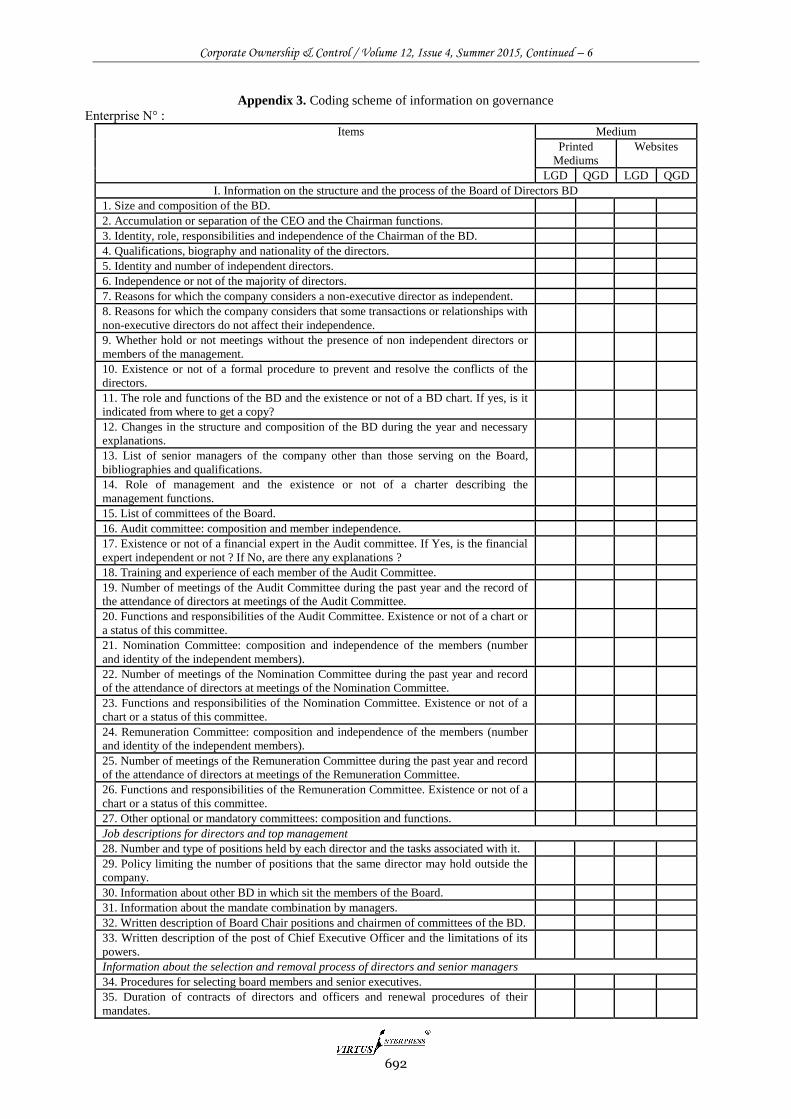
Corporate Ownership & Control / Volume 12, Issue 4, Summer 2015, Continued – 6
692
Appendix 3. Coding scheme of information on governance
Enterprise N° :
Items Medium
Printed
Mediums
Websites
LGD QGD LGD QGD
I. Information on the structure and the process of the Board of Directors BD
1. Size and composition of the BD.
2. Accumulation or separation of the CEO and the Chairman functions.
3. Identity, role, responsibilities and independence of the Chairman of the BD.
4. Qualifications, biography and nationality of the directors.
5. Identity and number of independent directors.
6. Independence or not of the majority of directors.
7. Reasons for which the company considers a non-executive director as independent.
8. Reasons for which the company considers that some transactions or relationships with
non-executive directors do not affect their independence.
9. Whether hold or not meetings without the presence of non independent directors or
members of the management.
10. Existence or not of a formal procedure to prevent and resolve the conflicts of the
directors.
11. The role and functions of the BD and the existence or not of a BD chart. If yes, is it
indicated from where to get a copy?
12. Changes in the structure and composition of the BD during the year and necessary
explanations.
13. List of senior managers of the company other than those serving on the Board,
bibliographies and qualifications.
14. Role of management and the existence or not of a charter describing the
management functions.
15. List of committees of the Board.
16. Audit committee: composition and member independence.
17. Existence or not of a financial expert in the Audit committee. If Yes, is the financial
expert independent or not ? If No, are there any explanations ?
18. Training and experience of each member of the Audit Committee.
19. Number of meetings of the Audit Committee during the past year and the record of
the attendance of directors at meetings of the Audit Committee.
20. Functions and responsibilities of the Audit Committee. Existence or not of a chart or
a status of this committee.
21. Nomination Committee: composition and independence of the members (number
and identity of the independent members).
22. Number of meetings of the Nomination Committee during the past year and record
of the attendance of directors at meetings of the Nomination Committee.
23. Functions and responsibilities of the Nomination Committee. Existence or not of a
chart or a status of this committee.
24. Remuneration Committee: composition and independence of the members (number
and identity of the independent members).
25. Number of meetings of the Remuneration Committee during the past year and record
of the attendance of directors at meetings of the Remuneration Committee.
26. Functions and responsibilities of the Remuneration Committee. Existence or not of a
chart or a status of this committee.
27. Other optional or mandatory committees: composition and functions.
Job descriptions for directors and top management
28. Number and type of positions held by each director and the tasks associated with it.
29. Policy limiting the number of positions that the same director may hold outside the
company.
30. Information about other BD in which sit the members of the Board.
31. Information about the mandate combination by managers.
32. Written description of Board Chair positions and chairmen of committees of the BD.
33. Written description of the post of Chief Executive Officer and the limitations of its
powers.
Information about the selection and removal process of directors and senior managers
34. Procedures for selecting board members and senior executives.
35. Duration of contracts of directors and officers and renewal procedures of their
mandates.
Corporate Ownership & Control / Volume 12, Issue 4, Summer 2015, Continued – 6
692
36. Notification requirements of the termination of services and the removal of directors.
37. Use or not the services of a consultant appointment. If so, information regarding his
identity, the outline of its mandate and fees paid to the consultant.
Information on orientation and continuous training policies for directors and senior executives
38. Does the company indicates that directors trainings is ensured ?
39. Training effectively received by directors during the considered exercise.
40. Learning and training types followed by directors during their duties.
41. Is it possible for directors to appeal to organizations able to provide professional
advice and indication of whether it has been appealed to such agencies during the
current year?
Ownership Information of the directors and the senior executives
42. Policy concerning the ownership of company shares by directors and officers.
43. Number of shares held by the directors.
44. Number of shares held by managers.
Information concerning the remuneration policy of directors and managers
45. Procedure followed to fix the remuneration of directors.
46. Directors’ remuneration Structure.
47. Procedure followed to determine compensation of executive officers.
48. Individual remuneration of senior executives.
49. Compensation payable to any director and officer in the case of the contract
cancellation or control change.
50. Use or not the services of a consultant majored in the remuneration of officers and
directors. If so, its identity, outlines its mandate and fees paid during the year.
Information on the annual evaluation policy of directors’ performance
51. Board and committees performance evaluation process.
52. Number of board meetings during the past year.
53. Record of attendance of each director.
54. Main activities of the Board and its committees during the year.
55. Evaluation Mechanism of the results obtained by the CEO.
Information on succession planning
56. Existence or not of a succession plan for executives in key positions.
57. Existence or not of a succession plan for members of BD.
Information on risk management systems and internal control
58. Activities and role of the Board in risk management.
59. Features of the risk management system and internal control systems.
60. Risk management systems and internal control related to the consolidated accounts.
Under disclosure index on category 1
2. Information on the ownership structure and rights of shareholder
61. Number, category and nominal amount of shares issued by the company.
62. Number and classification of the shareholders according to their types (institutional,
state, family, etc.).
63. Participation, Rights and structures of protection of minority shareholders.
64. Shareholders holding more than 5%, 10% and 20% of the capital (name and
number).
65. Information on top three, five and ten shareholders (identity and share in the capital).
66. Structure of control and how shareholders can exercise their control rights.
67. Shareholders with a disproportionate degree of control over their investments.
68. Rights associated with different classes of shares that the company may have issued.
69. Change in shareholding during the last three years.
70. Policy of the company's dividends.
71. The anti-takeover measures.
72. Process held annual general meetings and extraordinary general meetings.
73. Procedures concerning the participation of shareholders in general meetings.
74. Voting procedures employed.
75. The process by which shareholders can submit items for inclusion in the agenda.
76. Results of general meetings.
77. Communication procedures with shareholders.
Sub index of category 2
3. Information about the Audit
78. Internal audit function: the existence or not, responsibilities and tasks.
79. The process of interaction with the internal auditors of accounts.
80. Selection procedure and rotation of external auditors.
693
Corporate Ownership & Control / Volume 12, Issue 4, Summer 2015, Continued – 6
692
81. Length of relationship with the current auditor.
82. The process of interaction with the audit firm.
83. Fees paid during the last financial year to the external auditor for audit services.
84. Fees paid during the last fiscal year for the products and services provided by the
external auditor, other than audit services and the nature of services for these fees.
85. The Board declares he believes that the auditors are independent and their
competency and integrity have not been compromised in any way?
Sub index of category 3
4. Information on the governance of the social, environmental responsibilities and ethics of the company
86. Code of Ethics for employees, officers and directors and from where can we get the
text?
87. Complaints and denunciation mechanisms for the negligence of the ethics code and
mechanisms to protect those who report abuse.
88. Existence of an ethics committee or responsible of ethical issues and different
responsibilities assigned to it.
89. Is it a reference to ethical codes and policies to subsidiaries?
90. Use or not of consulting, auditing and certification of procedures of good conduct.
91. Existence or not of a diversity policy. If so, is this policy available to the public?
92. Percentage of women employed in the entire company, in the Board and in the
positions of senior managers.
93. Governance policies and mechanisms set to contribute to a better exercise of the
environmental and social responsibilities.
94. The company's commitment in the global agreements on sustainable development.
95. Performance of the company's environmental responsibility.
96. Performance of the company's social responsibility.
97. Prizes awarded for respecting the environmental and social responsibility.
98. Publication or not of a report on sustainable development. If so, is it indicated from
where can we get the text and if there was an external audit or not for the report?
99. Mechanism for the protection of other stakeholders (customers, suppliers, investors,
media, NGOs).
100. Is there any refers to the policies and performance of CSR subsidiaries?
101. Measures adopted to fight against corruption and extortion.
102. Existence of Directors elected by employed shareholders.
103. Governance Code applicable to the company and indicating where relevant codes
can be publicly available.
104. The degree of compliance with governance code's recommendations and the
indication of which parts of the code were not respected and define exemptions reasons?
105. Information on corporate governance practices beyond those provided for by
national law.
106. Prizes obtained for the adoption of best practices in the corporate governance.
107. Checking or not information on governance and different means used to validate
the information.
Sub index of category 4.
5. Financial transparency and information disclosure
108. Financial and operating results as a whole and by sector or geographical area.
109. Critical Accounting Estimates.
110. Accounting standards used for the accounts preparation and publication.
111. Important Transactions with related parties.
112. The decision making process for approving transactions with related parties
113. Significant interests held by directors and officers in the company's operations.
114. The corporate governance objectives.
115. Board Responsibilities concerning the preparation of financial information.
Legend : Printed mediums : Annual reports and/or Proxies statements ; LGD : Governance Disclosure Level ;
QGD : Governance Disclosure quality.
694