Embed Size (px)
Citation preview
DISCLAIMER
This document provides practicing engineers and building officials with a resource document for understanding the behavior of steel moment-frame buildings in earthquakes. It is one of the set of six State of the Art Reports containing detailed derivations and explanations of the basis for the design and evaluation recommendations prepared by the SAC Joint Venture. The recommendations and state of the art reports, developed by practicing engineers and researchers, are based on professional judgment and experience and supported by a large program of laboratory, field, and analytical research. No warranty is offered with regard to the recommendations contained herein, by the Federal Emergency Management Agency, the SAC Joint Venture, the individual joint venture partners, or the partner’s directors, members or employees. These organizations and their employees do not assume any legal liability or responsibility for the accuracy, completeness, or usefulness of any of the information, products or processes included in this publication. The reader is cautioned to review carefully the material presented herein and exercise independent judgment as to its suitability for application to specific engineering projects. This publication has been prepared by the SAC Joint Venture with funding provided by the Federal Emergency Management Agency, under contract number EMW-95-C-4770.
Cover Art. The beam-column connection assembly shown on the cover depicts the standard detailing used in welded, steel moment-frame construction, prior to the 1994 Northridge earthquake. This connection detail was routinely specified by designers in the period 1970-1994 and was prescribed by the Uniform Building Code for seismic applications during the period 1985-1994. It is no longer considered to be an acceptable design for seismic applications. Following the Northridge earthquake, it was discovered that many of these beam-column connections had experienced brittle fractures at the joints between the beam flanges and column flanges.
State of the Art Report on Systems Performance of Steel Moment Frames Subject to
Earthquake Ground Shaking
SAC Joint Venture A partnership of
Structural Engineers Association of California (SEAOC) Applied Technology Council (ATC)
California Universities for Research in Earthquake Engineering (CUREe)
Prepared for the SAC Joint Venture Partnership by Helmut Krawinkler
Department of Civil Engineering, Stanford University
Project Oversight Committee William J. Hall, Chair
Shirin Ader John M. Barsom
Roger Ferch Theodore V. Galambos
John Gross
James R. Harris Richard Holguin Nestor Iwankiw Roy G. Johnston
Len Joseph
Duane K. Miller John Theiss
John H. Wiggins
SAC Project Management CommitteeSEAOC: William T. Holmes ATC: Christoper Rojahn CUREe: Robin Shepherd
Program Manager: Stephen A. Mahin Project Director for Topical Investigations: James O. Malley Project Director for Product Development: Ronald O. Hamburger
Topical Investigation TeamC. Allin Cornell Kazukhio Kazai Bruce Maisson
Gregroy McRae Farzad Naeim
Andre Reinhorn Paul Sommerville
Technical Advisory PanelJacques Cattan Gary C. Hart
Y. Henry Huang
Dennis Randall Arthur E. Ross
C. Mark Saunders
W. Lee Shoemaker John Theiss
SAC Joint Venture SEAOC: www.seaoc.org ATC: www.atcouncil.org CUREe: www.curee.org
September 2000
THE SAC JOINT VENTURE SAC is a joint venture of the Structural Engineers Association of California (SEAOC), the Applied
Technology Council (ATC), and California Universities for Research in Earthquake Engineering (CUREe), formed specifically to address both immediate and long-term needs related to solving performance problems with welded, steel moment-frame connections discovered following the 1994 Northridge earthquake. SEAOC is a professional organization composed of more than 3,000 practicing structural engineers in California. The volunteer efforts of SEAOC’s members on various technical committees have been instrumental in the development of the earthquake design provisions contained in the Uniform Building Code and the 1997 National Earthquake Hazards Reduction Program (NEHRP) Recommended Provisions for Seismic Regulations for New Buildings and other Structures. ATC is a nonprofit corporation founded to develop structural engineering resources and applications to mitigate the effects of natural and other hazards on the built environment. Since its inception in the early 1970s, ATC has developed the technical basis for the current model national seismic design codes for buildings; the de facto national standard for postearthquake safety evaluation of buildings; nationally applicable guidelines and procedures for the identification, evaluation, and rehabilitation of seismically hazardous buildings; and other widely used procedures and data to improve structural engineering practice. CUREe is a nonprofit organization formed to promote and conduct research and educational activities related to earthquake hazard mitigation. CUREe’s eight institutional members are the California Institute of Technology, Stanford University, the University of California at Berkeley, the University of California at Davis, the University of California at Irvine, the University of California at Los Angeles, the University of California at San Diego, and the University of Southern California. These laboratory, library, computer and faculty resources are among the most extensive in the United States. The SAC Joint Venture allows these three organizations to combine their extensive and unique resources, augmented by subcontractor universities and organizations from across the nation, into an integrated team of practitioners and researchers, uniquely qualified to solve problems related to the seismic performance of steel moment-frame buildings.
ACKNOWLEDGEMENTS
Funding for Phases I and II of the SAC Steel Program to Reduce the Earthquake Hazards of Steel Moment-Frame Structures was principally provided by the Federal Emergency Management Agency, with ten percent of the Phase I program funded by the State of California, Office of Emergency Services. Substantial additional support, in the form of donated materials, services, and data has been provided by a number of individual consulting engineers, inspectors, researchers, fabricators, materials suppliers and industry groups. Special efforts have been made to maintain a liaison with the engineering profession, researchers, the steel industry, fabricators, code-writing organizations and model code groups, building officials, insurance and risk-management groups, and federal and state agencies active in earthquake hazard mitigation efforts. SAC wishes to acknowledge the support and participation of each of the above groups, organizations and individuals. In particular, we wish to acknowledge the contributions provided by the American Institute of Steel Construction, the Lincoln Electric Company, the National Institute of Standards and Technology, the National Science Foundation, and the Structural Shape Producers Council. SAC also takes this opportunity to acknowledge the efforts of the project participants – the managers, investigators, writers, and editorial and production staff – whose work has contributed to the development of these documents. Finally, SAC extends special acknowledgement to Mr. Michael Mahoney, FEMA Project Officer, and Dr. Robert Hanson, FEMA Technical Advisor, for their continued support and contribution to the success of this effort.
In Memory of Egor Popov, Professor Emeritus, University of California at Berkeley
Systems Performance of Steel Moment Frames Subject FEMA-355C to Earthquake Ground Shaking Table of Contents
iii
TABLE OF CONTENTS
LIST OF FIGURES ....................................................................................................................... ix LIST OF TABLES....................................................................................................................... xix 1. INTRODUCTION ................................................................................................................. 1-1
1.1 Purpose................................................................................................................. 1-1 1.2 Background.......................................................................................................... 1-2 1.3 Objectives ............................................................................................................ 1-9 1.4 Historical Perspective ........................................................................................ 1-10
2. INELASTIC CYCLIC CHARACTERISTICS OF STRUCTURAL ELEMENTS............... 2-1
2.1 Beam Behavior..................................................................................................... 2-4 2.2 Column Behavior ................................................................................................. 2-6 2.3 Panel Zone Shear Behavior.................................................................................. 2-7 2.4 Connection Behavior ......................................................................................... 2-11
3. METHODS FOR PREDICTION OF SEISMIC DEMANDS ............................................... 3-1
3.1 Modeling of Structural Elements for Inelastic Analysis...................................... 3-1 3.1.1 Modeling of Post-Fracture Behavior at Welded Connections ................. 3-3 3.1.2 Modeling of Beams with Post-Northridge Connections.......................... 3-6 3.1.3 Modeling of Panel Zone Shear Behavior................................................. 3-7 3.1.4 Modeling of Gravity Loads for P-Delta Effects .................................... 3-10 3.1.5 Other Modeling Considerations............................................................. 3-11
3.2 Inelastic Time History Analysis ........................................................................ 3-11 3.3 Inelastic Static Analysis (Pushover Analysis) ................................................... 3-12 3.4 Elastic Methods of Analysis .............................................................................. 3-13
3.4.1 Elastic Static Analysis ........................................................................... 3-13 3.4.2 Elastic Dynamic Analysis ...................................................................... 3-14
3.5 Building Structures, Analytical Models, and Ground Motions Used in the SAC System Performance Studies..................................................................... 3-15 3.5.1 Two-Dimensional Models ..................................................................... 3-17 3.5.2 Three-Dimensional Models ................................................................... 3-18
4. SELECTED ISSUES AFFECTING THE SEISMIC PERFORMANCE OF WSMF
STRUCTURES...................................................................................................................... 4-1 4.1 Global and Local Performance Issues ................................................................. 4-1 4.2 Importance of Relative Strength of Elements at a Connection............................ 4-1
4.2.1 The Strong Column Concept ................................................................... 4-2 4.2.2 Panel Zone Shear Strength....................................................................... 4-3 4.2.3 Sensitivity of Prediction of Local Demands ............................................ 4-4
4.3 Effects of Relative Member Strength on Local Deformation Demands.............. 4-6 4.4 Structure P-Delta Effect and Dynamic Instability ............................................. 4-10
4.4.1 The P-Delta Problem.............................................................................. 4-10 4.4.2 Case Study 1: The SAC 20-Story Los Angeles Building ...................... 4-17
Systems Performance of FEMA-355C Steel Moment Frames Subject Table of Contents to Earthquake Ground Shaking
iv
4.4.3 Case Study 2: The SAC 3-Story Seattle Building ................................. 4-25 4.4.4 Summary Assessment of Importance of P-Delta Effects....................... 4-30
5. INELASTIC SEISMIC DEMANDS FOR DUCTILE WSMF SYSTEMS WITH FULLY
RESTRAINED CONNECTIONS.......................................................................................... 5-1 5.1 Introduction.......................................................................................................... 5-1
5.1.1 Emphasis of this Chapter ......................................................................... 5-1 5.1.2 Ground Motion Issues.............................................................................. 5-2
5.2 Global and Local Behavior – Pushover Analysis ................................................ 5-2 5.2.1 Global Lateral Load - Drift Behavior ...................................................... 5-3
5.2.1.1 Variation in Story Drift Over Height ...................................... 5-11 5.2.1.2 Overstrength............................................................................ 5-11 5.2.1.3 Effects of Weak Panel Zones.................................................. 5-11 5.2.1.4 Strength of Structures in Regions of Different Seismicity ..... 5-12 5.2.1.5 Effects of Subjective Design Decisions.................................. 5-12 5.2.1.6 Post-Northridge Structures ..................................................... 5-12 5.2.1.7 Sensitivity to Analytical Model .............................................. 5-12 5.2.1.8 Contributions of Gravity Frames ............................................ 5-13 5.2.1.9 Expected Seismic Performance Based on Pushover Analysis 5-13
5.2.2 Local Element Behavior ........................................................................ 5-14 5.2.2.1 Evaluation of Relative Member Strength ............................... 5-16 5.2.2.2 Beam Plastic Rotations for Strong Panel Zones ..................... 5-17 5.2.2.3 Panel Zone Plastic Distortions for Weak Panel Zones ........... 5-17 5.2.2.4 Sharing of Plastic Deformations Between Beams and Panel
Zones....................................................................................... 5-18 5.2.2.5 Effects of Subjective Design Decisions.................................. 5-20 5.2.2.6 Effect of Nominal versus Expected Material Yield Strength . 5-20 5.2.2.7 Post-Northridge Connections.................................................. 5-21 5.2.2.8 Effect of Gravity Frames ........................................................ 5-23 5.2.2.9 Dispelling a Myth ................................................................... 5-23
5.3 Roof and Story Drift Demands Under Ground Motions of Different Intensity ............................................................................................................. 5-24 5.3.1 Spectral Characteristics of Sets of Records Used in Baseline Study..... 5-24 5.3.2 Roof Drift Demands............................................................................... 5-28 5.3.3 Story Drift Demands .............................................................................. 5-29
5.3.3.1 Observations Based on Response of SAC Structures ............. 5-31 5.3.3.2 Distribution of Story Drifts Over Height ................................ 5-34 5.3.3.3 Ratio of Maximum Story Drift to Roof Drift.......................... 5-35 5.3.3.4 Effects of P-Delta on Story Drifts........................................... 5-37 5.3.3.5 Sensitivity of Story Drifts to Design Issues............................ 5-38 5.3.3.6 Sensitivity of Story Drifts to the Relative Strength of Beams
vs. Panel Zones ....................................................................... 5-38 5.3.3.7 Dispersion of Story Drift Demands ........................................ 5-40 5.3.3.8 Outliers in Drift Demands....................................................... 5-41 5.3.3.9 Residual Story Drift ................................................................ 5-41 5.3.3.10 Post Northridge Structures...................................................... 5-42
Systems Performance of Steel Moment Frames Subject FEMA-355C to Earthquake Ground Shaking Table of Contents
v
5.3.3.11 Effect of Modeling Accuracy on Story Drift Predictions ....... 5-45 5.3.3.12 Drift Hazard Curves................................................................ 5-47
5.4 Global Force Demands ...................................................................................... 5-48 5.4.1 Base and Story Shear Forces ................................................................. 5-49 5.4.2 Base and Story Overturning Moments................................................... 5-53
5.5 Demands for Columns ...................................................................................... 5-56 5.5.1 Column Moment and Plastic Rotation Demands................................... 5-57 5.5.2 Column Plastic Rotation Demands at Base of First-Story Column....... 5-61 5.5.3 Column Axial Forces ............................................................................. 5-62 5.5.4 Moment and Axial Force Demands at Column Splices......................... 5-64
5.6 Demands for Beam Plastic Rotations and Panel Zone Distortions.................... 5-67 5.7 Sensitivity of Response ..................................................................................... 5-68
5.7.1 Effect of Strain-Hardening..................................................................... 5-69 5.7.2 Effect of Damping ................................................................................. 5-71 5.7.3 Effect of Period Variability.................................................................... 5-73 5.7.4 Effect of Material Strength Variability.................................................. 5-73 5.7.5 Effect of Configuration and Redundancy .............................................. 5-76
5.8 Effects of Ground Motion Characteristics ....................................................... 5-78 5.8.1 Near-Fault Effects.................................................................................. 5-78
5.8.1.1 SAC Near-Fault Study ............................................................ 5-82 5.8.2 Soft Soil Effects ..................................................................................... 5-85
5.8.2.1 SAC Pilot Study on Soft Soil Effects ..................................... 5-87 5.9 3-D Effects ......................................................................................................... 5-89
5.9.1 Simultaneous Horizontal Components of Motion ................................. 5-90 5.9.1.1 Behavior Difference of 3-D and 2-D Frames ......................... 5-90 5.9.1.2 Effect of Shaking Direction on Drift Magnitude .................... 5-91 5.9.1.3 Assessing Bi-Axial Demand in Inelastically Behaving 3-D
Frames..................................................................................... 5-92 5.9.1.4 Mx-My-P Interaction ............................................................... 5-94 5.9.1.5 Summary ................................................................................. 5-95
5.9.2 Vertical Component of Motion.............................................................. 5-96 5.9.2.1 Estimation of Peak Axial Force Due to Vertical Shaking ...... 5-97
5.10 Post-Northridge Structures ................................................................................ 5-98 5.10.1 Structures with Cover Plate Connections .............................................. 5-98 5.10.2 Reduced Beam Sections......................................................................... 5-98
5.11 Effects of Hysteretic Characteristics on Seismic Demands............................... 5-99 5.11.1 Effects of Hysteretic Characteristics on Seismic Demands for SAC
Structures ............................................................................................. 5-102 5.11.2 Summary Assessment of the Effects of Hysteretic Characteristics on
Seismic Demands................................................................................. 5-109 5.12 Special Issues ................................................................................................... 5-110
5.12.1 Approximate Prediction of Demands for WSMF Structures............... 5-110 5.12.1.1 Estimation of Roof Drift Demands ....................................... 5-111 5.12.1.2 Estimation of Inelastic Roof Drift Demand
Without P-Delta Effects........................................................ 5-113
Systems Performance of FEMA-355C Steel Moment Frames Subject Table of Contents to Earthquake Ground Shaking
vi
5.12.1.3 Estimate of Effects of P-Delta on Inelastic Roof Drift Demand ............................................................... 5-115
5.12.1.4 Relationship Between Roof Drift and Story Drift ................ 5-116 5.12.1.4.1 Estimation of the Ratio of Maximum Story
Drift to Roof Drift ............................................... 5-116 5.12.1.4.2 Variation of the Ratio of Story Drift to Roof
Drift Over Height of Structure............................ 5-116 5.12.2 Value of Pushover Analysis................................................................. 5-117
6. BEHAVIOR OF FRAMES WITH PRE-NORTHRIDGE CONNECTIONS........................ 6-1
6.1 Introduction.......................................................................................................... 6-1 6.2 Analytical Modeling of Fractured Connections................................................... 6-1
6.2.1 Beam Flange Fractures ............................................................................ 6-1 6.2.2 Column Fractures..................................................................................... 6-3
6.3 Effects of Beam Flange Connection Fractures on Drift Demands ...................... 6-4 6.3.1 Approach.................................................................................................. 6-4
6.3.1.1 Approach for Sensitivity Studies .............................................. 6-5 6.3.2 Beam Bottom Flange Connection Fractures Only (BFO Cases) ............. 6-5
6.3.2.1 Brittle Base Case Results for LA 9-Story Structures................ 6-6 6.3.2.1.1 θmax and θave Statistics............................................. 6-6 6.3.2.1.2 Spatial Variations of θi Statistics ............................ 6-7
6.3.2.2 Brittle Base Case Results for All Structures............................. 6-8 6.3.2.2.1 θmax and θave Statistics............................................. 6-8 6.3.2.2.2 Extremes and Collapses ........................................ 6-10 6.3.2.2.3 Summary of Brittle Base Case Results ................. 6-11
6.3.2.3 Results of Sensitivity Studies ................................................. 6-11 6.3.2.3.1 Sensitivity to Early Fractures................................ 6-11 6.3.2.3.2 Sensitivity to Plastic Rotation Capacity, θf+ ......... 6-14 6.3.2.3.3 Sensitivity to Residual Moment Strength, Mred+... 6-14 6.3.2.3.4 Summary of Results of Sensitivity Studies........... 6-14
6.3.3 Beam Top and Bottom Flange Connection Fractures (TBF Cases) ...... 6-15 6.3.3.1 TBF Connection Fracture Results for LA 9-Story Structure. 6-15
6.3.3.1.1 θmax Statistics ........................................................ 6-15 6.3.3.1.2 Extremes and Collapses ........................................ 6-16 6.3.3.1.3 Spatial Variations of θi Statistics .......................... 6-17
6.3.3.2 TBF Connection Fracture Results for All Structures.............. 6-17 6.3.3.3 Summary of TBF Connection Fracture Results...................... 6-19
6.3.4 Conclusions on Effects of Beam Flange Connection Fractures ............ 6-19 6.3.5 Effects of Interior Frames; The M1+ Model ......................................... 6-20
6.3.5.1 Collapses ................................................................................. 6-21 6.3.5.2 Story Drifts ............................................................................. 6-21
6.3.6 Effects of Near-Fault Records ............................................................... 6-23 6.3.6.1 Maximum Story Drift Angle Results...................................... 6-24 6.3.6.2 Conclusions Based on LA 9-Story Structure.......................... 6-25
6.3.7 Effects of Redundancy........................................................................... 6-25
Systems Performance of Steel Moment Frames Subject FEMA-355C to Earthquake Ground Shaking Table of Contents
vii
6.3.7.1 Modeling Assumptions ........................................................... 6-26 6.3.7.2 Story Drift Results .................................................................. 6-27
6.4 Effects of Column Fractures on Drift Demands ................................................ 6-28 6.4.1 Bottom Flange Fractures Only............................................................... 6-28 6.4.2 Top and Bottom Flange Fractures ......................................................... 6-30 6.4.3 “Pattern” of Column Fracture Triggers in Lower Stories...................... 6-31 6.4.4 Conclusions Based on LA 9-Story......................................................... 6-32
6.5 Methodology for Evaluation of Effects of Connection Fractures in a Probabilistic Format........................................................................................... 6-33 6.5.1 Procedure for Computing Drift Hazard Curves ..................................... 6-33
6.5.1.1 Spectral Acceleration Hazard ................................................. 6-33 6.5.1.2 Relationship between Spectral Acceleration and Drift........... 6-34 6.5.1.3 Drift Demand Hazard.............................................................. 6-34
6.5.2 Numerical Example ............................................................................... 6-35 6.6 Methodology for Safety Evaluation of Structures ............................................. 6-39
6.6.1 Collapse Limit State Probability............................................................ 6-40 6.6.2 Incremental Dynamic Analyses (IDAs)................................................. 6-41 6.6.3 Numerical Example ............................................................................... 6-42
7. FRAMES WITH PARTIALLY RESTRAINED CONNECTIONS...................................... 7-1
7.1 Modeling of Strength and Stiffness Properties of PR Connections..................... 7-1 7.2 Seismic Demands for Frames with PR Connections ........................................... 7-4
7.2.1 SAC Case Studies of Frames with PR Connections ................................ 7-5 7.2.2 Global Behavior Obtained from Pushover Analysis................................ 7-6 7.2.3 Story Drift Demands ................................................................................ 7-9 7.2.4 Connection Rotation Demands .............................................................. 7-14
7.3 Summary Observations on Frames with PR Connections ................................. 7-16 8. SUMMARY AND CONCLUSIONS .................................................................................... 8-1
8.1 Analytical Modeling ............................................................................................ 8-1 8.2 Element Behavior Issues...................................................................................... 8-2 8.3 System Behavior Issues ....................................................................................... 8-3 8.4 Global Strength Issues ......................................................................................... 8-4 8.5 Effects of Ground Motion Characteristics ........................................................... 8-5 8.6 Effects of Connection Fractures on Response and Safety ................................... 8-5 8.7 Behavior of Frames with PR Connections........................................................... 8-5
APPENDIX A – SAC GROUND MOTIONS............................................................................ A-1
A.1 Description of Sets of Ground Motions.............................................................. A-1 A.2 Spectral Characteristics of Ground Motions....................................................... A-1
Systems Performance of FEMA-355C Steel Moment Frames Subject Table of Contents to Earthquake Ground Shaking
viii
APPENDIX B – THE SAC MODEL BUILDINGS....................................................................B-1 B.1 Description of Buildings and Basic Loading Conditions .............................................B-1 B.2 Los Angeles (LA) Structures ........................................................................................B-3 B.3 Seattle (SE) Structures ..................................................................................................B-4 B.4 Boston (BO) Structures.................................................................................................B-5 B.5 Redesigned LA 9-Story Structures ...............................................................................B-6
REFERENCES, FEMA REPORTS, SAC REPORTS, AND ACRONYMS ..............................R-1 SAC PHASE II PROJECT PARTICIPANTS .............................................................................S-1
Systems Performance of Steel Moment Frames Subject FEMA-355C to Earthquake Ground Shaking List of Figures
ix
LIST OF FIGURES
Figure 1-1 Typical Welded Moment-Resisting Connection Prior to 1994 ........................... 1-4 Figure 1-2 Common Zone of Fracture Initiation in Beam-Column Connection ................... 1-4 Figure 1-3 Fractures of Beam-to-Column Joints ................................................................... 1-5 Figure 1-4 Column Fractures................................................................................................. 1-5 Figure 1-5 Vertical Fracture through Beam Shear Plate Connection.................................... 1-6 Figure 2-1 Cyclic Stress-Strain Diagram of Structural Steel ................................................ 2-1 Figure 2-2 Cyclic Response of a Steel Beam with Weld Fracture ........................................ 2-2 Figure 2-3 Cyclic Response of a Steel Beam with Local Buckling ...................................... 2-3 Figure 2-4 Desirable Cyclic Response of a Steel Beam........................................................ 2-5 Figure 2-5 Common Cyclic Response of a Steel Beam ........................................................ 2-5 Figure 2-6 Forces Around a Connection ............................................................................... 2-7 Figure 2-7 Shear Deformations in Panel Zone ...................................................................... 2-8 Figure 2-8 Force – Shear Distortion Diagram for a Panel Zone ........................................... 2-8 Figure 2-9 Components of Lateral Displacement in a Beam-Column Subassembly .......... 2-10 Figure 2-10 Effects of Excessive Joint Shear Distortions ..................................................... 2-11 Figure 3-1 Cyclic and Monotonic Response of a Beam with Minor Deterioration due
to Local and Lateral Buckling ............................................................................. 3-2 Figure 3-2 Cyclic Response of a Beam with Significant Deterioration due to
Local and Lateral Buckling.................................................................................. 3-3 Figure 3-3 Post-Fracture Models ........................................................................................... 3-5 Figure 3-4 Trilinear Shear Force – Shear Distortion Relationship of Panel Zone ................ 3-8 Figure 3-5 Simplified Panel Zone Model (Scissors Element) ............................................... 3-9 Figure 3-6 More Accurate Panel Zone Model with Rigid Boundaries.................................. 3-9 Figure 3-7 Use of Two Springs to Model Trilinear Behavior ............................................. 3-10 Figure 3-8 Shear Force – Shear Distortion Response for a Typical Panel Zone................. 3-10 Figure 3-9 Seismic Demands at a Connection Obtained from Elastic and
Inelastic Analysis ............................................................................................... 3-15 Figure 4-1 Elements Framing into a Beam-to-Column Connection...................................... 4-2 Figure 4-2 M-θ and V-γ Relationships for Beam and Panel Zone......................................... 4-5 Figure 4-3 Internal Forces at Plastic Hinge Locations in Span of a Beam............................ 4-6 Figure 4-4 Normalized Base Shear-Roof Displacement Diagram of a WSMF..................... 4-7 Figure 4-5 Force and Plastic Deformation Demands from Pushover Analysis
of a 4-Story WSMF.............................................................................................. 4-9 Figure 4-6 Lateral Load – Displacement Response of a Portal Frame
(Distributed Plasticity Analysis)........................................................................ 4-10 Figure 4-7 SDOF Lateral Force – Displacement Relationship without and with
P-Delta ............................................................................................................... 4-11
Systems Performance of FEMA-355C Steel Moment Frames Subject List of Figures to Earthquake Ground Shaking
x
Figure 4-8 Dynamic Response of an SDOF System with α = -0.05 ................................... 4-12 Figure 4-9 Mean Displacement Amplification for Bilinear SDOF Systems with
α = -0.03 ............................................................................................................ 4-12 Figure 4-10 Base Shear versus Roof Drift Diagrams for M1 Model of 20-Story LA
Structure without and with P-Delta, Pushover Analysis.................................... 4-13 Figure 4-11 Story Shear versus Story Drift Diagrams for Bottom 10 Stories of 20-Story
Structure M1 Model, Pushover Analysis........................................................... 4-14 Figure 4-12 Deflected Shapes of 20-Story Structure from Pushover Analysis,
M1 Model .......................................................................................................... 4-15 Figure 4-13 Ratios of Story Drift Angle to Roof Drift Angle, Plotted Against Roof
Drift Angle, for M1 Model, Pushover Analysis ................................................ 4-15 Figure 4-14(a) Time Histories Used for P-Delta Study of LA 20-Story Building .................... 4-17 Figure 4-14(b) Time Histories Used for P-Delta Study of LA 20-Story Building .................... 4-18 Figure 4-15 Base Shear versus Roof Drift Diagrams for Various Models of 20-Story
Structure, Pushover Analysis ............................................................................. 4-20 Figure 4-16 Second Story versus Drift Diagrams for Various Models of 20-Story
Structure, Pushover Analysis ............................................................................. 4-20 Figure 4-17 Ratios of Second Story Drift to Roof Drift for Various Models of
20-Story Structure, Pushover Analysis.............................................................. 4-21 Figure 4-18 Time Histories of Story 2 Drift for Various Models, Tabas Record ................. 4-22 Figure 4-19 Maximum Story Drift Angles for Various Models of 20-Story Structure,
Tabas Record ..................................................................................................... 4-23 Figure 4-20 Maximum Story Drift Angles for Various Models of 20-Story Structure,
Simulated Record............................................................................................... 4-24 Figure 4-21 Incremental Dynamic Analysis with Various Models of 20-Story Structure,
Tabas Record ..................................................................................................... 4-25 Figure 4-22 Change in Maximum Story Drifts with Increasing Ground Motion Severity,
Model M2A, Tabas Record ............................................................................... 4-26 Figure 4-23 Base Shear versus Roof Drift Diagrams for M1 and M2 Models of the
Seattle 3-Story Building, Pushover Analysis..................................................... 4-26 Figure 4-24(a) Time Histories Used for P-Delta Study of Seattle 3 Story Building,
Components SE27.............................................................................................. 4-27 Figure 4-24(b) Time Histories Used for P-Delta Study of Seattle 3 Story Building,
Components SE28.............................................................................................. 4-28 Figure 4-25 Elastic Displacement Spectra for Time Histories SE27 and SE28.................... 4-28 Figure 4-26(a) Roof Drift Time Histories for Seattle 3-Story Building, Records SE27
and SE28, Centerline Model M1 ....................................................................... 4-29 Figure 4-26(b) Roof Drift Time Histories for Seattle 3-Story Building, Records SE27
and SE28, Model with Panel Zone Elements (M2) ........................................... 4-30 Figure 5-1 Normalized Base Shear – Roof Drift Diagrams for LA Structures ..................... 5-4 Figure 5-2 Normalized Base Shear – Roof Drift Diagrams for Seattle Structures................ 5-5
Systems Performance of Steel Moment Frames Subject FEMA-355C to Earthquake Ground Shaking List of Figures
xi
Figure 5-3 Normalized Base Shear – Roof Drift Diagrams for Boston Structures ............... 5-6 Figure 5-4 Ratios of Story Drift to Roof Drift Angle, Plotted Against Roof
Drift Angle ........................................................................................................... 5-7 Figure 5-5 Global Pushover Curves for 20-Story LA, Seattle, and Boston
Structures; M2...................................................................................................... 5-8 Figure 5-6 Global Pushover Curves for Different Models .................................................... 5-8 Figure 5-7 Element Forces versus Story 1 Drift Angle, Seattle 3-Story Structure,
Different Models, Pushover Analysis ................................................................ 5-15 Figure 5-8 Element Plastic Deformations versus Story 1 Drift Angle, Seattle 3-Story
Structure, Different Models, Pushover Analysis ............................................... 5-16 Figure 5-9 Variation in Story Drift and Element Deformation Demands with
Increasing Roof Drift Angle, Seattle 9-Story Structure..................................... 5-18 Figure 5-10 Story Drift and Element Deformation Demands at 3% Roof Drift Angle,
(a) LA9 Structure, (b) R1-LA9 Structure, Expected Strength; Pushover Analysis.............................................................................................. 5-19
Figure 5-11 Story Drift and Element Deformation Demands at 3% Roof Drift Angle, (a) LA9Structure, (b) R1-LA9 Structure, Nominal Strength; Pushover Analysis.............................................................................................. 5-19
Figure 5-12 Global Pushover Curves for LA9 and R1-LA9 Structure, Expected Strength Properties............................................................................................. 5-20
Figure 5-13 Global Pushover Curves for LA9 and R1-LA9 Structure, Nominal Strength Properties............................................................................................. 5-21
Figure 5-14 Story Drift and Element Deformation Demands at 3% Roof Drift Angle, for Seattle 9-Story Structure, (a) Pre-Northridge, (b) Cover-Plated Post-Northridge, (c) RBS; Pushover Analysis................................................... 5-22
Figure 5-15 Global Pushover Curves for Seattle 9-Story Pre- and Post-Northridge Structures ........................................................................................................... 5-22
Figure 5-16 Variation in Story Drift and Element Deformation Demands with Increasing Roof Drift Angle, Seattle 9-Story Post-Northridge Designs; Pushover Analysis.............................................................................................. 5-23
Figure 5-17 Median Values of Elastic Spectral Strength (Acceleration) Demands for Sets of Records Used in Baseline Study............................................................ 5-26
Figure 5-18 Median Values of Elastic Spectral Displacement Demands for Sets of Records Used in Baseline Study........................................................................ 5-27
Figure 5-19 Median and 84th Percentile Story Drift Angle Demands for Pre-Northridge Structures, Model M2; 50/50 (LA), 10/50 and 2/50 Sets of Ground Motions .. 5-32
Figure 5-20 Median and 84th Percentile Story Ductility Demands for Pre-Northridge Structures, Model M2; 50/50 (LA), 10/50 and 2/50 Sets of Ground Motions . 5-33
Figure 5-21 Median Values of Ratio of Story Drift to Roof Drift Demand for all Pre-Northridge Structures, Model M2; 10/50 and 2/50 Sets of Records........... 5-36
Figure 5-22 Median Values of Ratio of Maximum Story Drift to Roof Drift ....................... 5-37
Systems Performance of FEMA-355C Steel Moment Frames Subject List of Figures to Earthquake Ground Shaking
xii
Figure 5-23 Median Values of Story Drift Demands for LA 20-Story Structure Subjected to Seattle Records and Vice Versa; 2/50 Sets of Ground Motions ... 5-38
Figure 5-24 Median and 84th Percentile Values of Interstory Drift Demands, LA 9-Story Structure with Nominal and Expected Properties .......................... 5-39
Figure 5-25 Median and 84th Percentile Values of Interstory Drift Demands, R1-LA9 Structure with Nominal and Expected Properties.............................................. 5-40
Figure 5-26 Measure of Dispersion of Elastic Spectral Displacement Demands for SAC Sets of Ground Motions ............................................................................ 5-40
Figure 5-27 Dispersion of Story Drifts for LA 20-Story Pre-Northridge Structure, 2/50 Set of Ground Motions .............................................................................. 5-41
Figure 5-28 Maximum and Residual Story Drift Demands for LA Structures, Model M2; 50/50, 10/50, and 2/50 Sets of Ground Motions............................. 5-43
Figure 5-29 Median Values of Story Drift Demands for LA Pre- and Post-Northridge Structures, Models M1 and M2; 50/50, 10/50, and 2/50 Sets of Ground Motions ................................................................................................. 5-44
Figure 5-30 Story Drift Demands for Seattle 9-Story Pre-N., Cover-Plated Post-N., and RBS Design; 2/50 Set of Ground Motions.................................................. 5-45
Figure 5-31 Median and 84th Percentile Values of Story Drift Demands, LA 9-Story Struct., Various Models; 2/50 Set of Records ................................ 5-46
Figure 5-32 Median and 84th Percentile Values of Story Drift Demands, Seattle 3-Story Struct., Various Models; 2/50 Set of Records ...................................... 5-46
Figure 5-33 Global Drift Values for Seattle 3-Story Structure, Various Models; 2/50 Set of Records............................................................................................ 5-47
Figure 5-34 Hazard Curves for Story 3 Drift Demand for LA, Seattle, and Boston 3-Story Structures .............................................................................................. 5-48
Figure 5-35 Hazard Curves for Maximum Story Drift Demand for LA 3-, 9-, and 20-Story Structures ............................................................................................ 5-48
Figure 5-36 Story Shear Capacity Estimates for LA and Seattle 20-Story Structures .......... 5-50 Figure 5-37 Median Values of Base and Story Shears for LA 20-Story Structure for
2/50 Set of Ground Motions, and Pushover Analysis........................................ 5-52 Figure 5-38 Maximum Base Shears for LA 20-Story Structure for 10/50 and
2/50 Sets of Ground Motions, and Pushover Analysis ...................................... 5-52 Figure 5-39 Story Overturning Moments from Dynamic Analysis and Simplified
Procedure, LA 9-Story Structure ....................................................................... 5-54 Figure 5-40 Story Overturning Moments from Dynamic Analysis and Simplified
Procedure, LA 20-Story Structure ..................................................................... 5-54 Figure 5-41 Story Overturning Moments from Dynamic Analysis and Simplified
Procedure, Seattle 20-Story Structure................................................................ 5-54 Figure 5-42 Median Story OTMs from Dynamic Analysis, LA and Seattle 20-Story
Structures Subjected to Same Sets of Ground Motions..................................... 5-55 Figure 5-43 Median Story OTMs for LA 20-Story Structure, for 2/50 Set of Ground
Motions and from Pushover Analysis................................................................ 5-56
Systems Performance of Steel Moment Frames Subject FEMA-355C to Earthquake Ground Shaking List of Figures
xiii
Figure 5-44 Base Overturning Moments for LA 20-Story Structure, for 10/50 and 2/50 Sets of Ground Motion and from Pushover Analysis ................................ 5-56
Figure 5-45 Moments Along Interior Column at Various Drifts, LA 20-Story Structure, Pushover Analysis.............................................................................................. 5-59
Figure 5-46 Variation (with Story Drift) of Bending Moment at Top and Bottom of Story 5 Interior Column, LA 20-Story; Pushover Analysis............................... 5-60
Figure 5-47 Predicted Column Overstrength Factor for Strong-Column Concept, for 3- and 12-Story Frame (Nakashima, 2000).................................................. 5-60
Figure 5-48 Variation in Story 1 Column Force Demands with Base Shear, LA 20-story Structure; Pushover Analysis ........................................................ 5-62
Figure 5-49 Seismic Axial Force Demands in Exterior Column of LA 20-Story Structure, from Dynamic Analysis and Estimates ............................................. 5-63
Figure 5-50 Variation in Normalized Force Demands with Increasing Drift; for Exterior Column Splices in Story 5, LA 20-Story Structure, Pushover Analysis.............................................................................................. 5-65
Figure 5-51 Variation with Story Drift of Force Demands for Interior Column Splices in Story 5 of LA 20-Story; Pushover Analysis .................................................. 5-65
Figure 5-52 Contributions of Element Plastic Deformations to Story Drift, LA 9-Story Structure; 2/50 Set of Records........................................................ 5-68
Figure 5-53 Contributions of Element Plastic Deformations to Story Drift, LA 20-Story Structure; 2/50 Set of Records...................................................... 5-68
Figure 5-54 Sensitivity of Global Pushover Curves to Element Strain-Hardening, Seattle 3-Story Structure; Pushover Analysis.................................................... 5-70
Figure 5-55 Sensitivity of Story Drift Demands to Element Strain-Hardening, Seattle 3-Story Structure; 2/50 Set of Ground Motions..................................... 5-70
Figure 5-56 Sensitivity of Global Pushover Curves to Element Strain-Hardening, LA 20-Story Structure; Pushover Analysis ....................................................... 5-71
Figure 5-57 Sensitivity of Story Drift Demands to Element Strain-Hardening, LA 20-Story Structure; 2/50 Set of Ground Motions ........................................ 5-71
Figure 5-58 Sensitivity of Median Story Drift Demands to Structural Damping, LA 3-Story Structure; 2/50 Set of Ground Motions .......................................... 5-72
Figure 5-59 Sensitivity of Median Story Drift Demands to Structural Damping, Seattle 3-Story Structure; 2/50 Set of Ground Motions..................................... 5-72
Figure 5-60 Sensitivity of Story Drift Demands to Period of Structure, LA 3-Story Structure; 2/50 Set of Ground Motions .......................................... 5-73
Figure 5-61 Sensitivity of Median Story Drift Demands to Period of Structure, LA 9-Story Structure; 2/50 Set of Ground Motions .......................................... 5-74
Figure 5-62 Sensitivity of Median Story Drift Demands to Period of Structure, LA 20-Story Structure; 2/50 Set of Ground Motions ........................................ 5-74
Figure 5-63 Sensitivity of Global Pushover Curve to Strength of Material, LA 20-Story Structure; Pushover Analysis ....................................................... 5-75
Systems Performance of FEMA-355C Steel Moment Frames Subject List of Figures to Earthquake Ground Shaking
xiv
Figure 5-64 Sensitivity of Story Drift Demands to Strength of Material, LA 20-Story Structure; 2/50 Set of Ground Motions ........................................ 5-75
Figure 5-65 Global Pushover Curves for Original and Redesigned LA 9-Story Structures ........................................................................................................... 5-77
Figure 5-66 Median Story Drift Demands for Original and Redesigned LA 9-Story Structures; 2/50 Set of Ground Motions ............................................................ 5-77
Figure 5-67 Acceleration, Velocity, and Displacement Time Histories of Fault-Normal Component of Lucerne Record (Forward Directivity) ............... 5-79
Figure 5-68 Acceleration (Elastic Strength Demand), Velocity, and Displacement Spectra for Different Components of Rinaldi Receiving Station Record (Alavi & Krawinkler, 1999)............................................................................... 5-80
Figure 5-69 Dependence of Story Ductility Demands on Base Shear Strength; NF15 Record, Structures with T = 3.0 sec. (Alavi & Krawinkler, 1999).......... 5-81
Figure 5-70 Velocity and Displacement Response Spectra of Near-Fault and Reference Ground Motions (Alavi & Krawinkler, 1999).................................. 5-82
Figure 5-71 Median Response Spectra for Strike-Normal and Strike-Parallel Near-Fault Record Components Used for LA Structures (MacRae, 1999) ....... 5-83
Figure 5-72 Median Peak Interstory Drift Angles for 9-Story LA Structure Subjected to Near-Fault and 10/50 Ground Motions (MacRae, 1999).............. 5-83
Figure 5-73 Median Peak Residual Interstory Drifts for 9-Story LA Structure Subjected to Near-Fault and 10/50 Ground Motions (MacRae, 1999).............. 5-84
Figure 5-74 Normalized Median Interior Column Moments Below Joints, LA 9-Story Structure (MacRae, 1999) .............................................................. 5-85
Figure 5-75 Axial Force Reduction Factor for Different Stories, LA 20-Story Structure (MacRae, 1999).................................................................................. 5-85
Figure 5-76 Elastic and Inelastic Strength Demand Spectra for a Typical Soft Soil Record (Rahnama & Krawinkler, 1994)............................................................ 5-86
Figure 5-77 Strength Reduction Factors for a Typical Soft Soil Record (Rahnama & Krawinkler, 1994) ........................................................................ 5-86
Figure 5-78 Median Acceleration Spectra for Soft Soil Record Sets SP1 to SP6 (MacRae, 1999) .................................................................................................................. 5-87
Figure 5-79 Median Drift Repsonse for LA 3-Story Structure, Soft Soil Record Sets SP1 to SP6 and 10/50 Set (MacRae, 1999)................................................ 5-88
Figure 5-80 Peak Story Drift Angles from 2-D and 3-D (2-Component) Analysis (MacRae, 1999) ................................................................................................. 5-90
Figure 5-81 Peak Drifts in Any Direction, Record NF1718 (MacRae, 1999)....................... 5-91 Figure 5-82 Plan of Earthquake Attack on Building (MacRae, 1999) .................................. 5-92 Figure 5-83 Drift Response for x-, y- and Combined x-y Components of Earthquake
Shaking in θ Direction due Attack Angle of ψ; Rψθx, Rψθy, and Rψθ (MacRae, 1999) ................................................................................................. 5-92
Figure 5-84 Beam Drift Angles at 2nd Floor Level in Different Directions (NF1718) (Macrae, 1999) .................................................................................. 5-93
Systems Performance of Steel Moment Frames Subject FEMA-355C to Earthquake Ground Shaking List of Figures
xv
Figure 5-85 Median Vertical Acceleration Response Spectrum for NF Ground Motions (Macrae, 1999) .................................................................................... 5-96
Figure 5-86 Effect of Horizontal and Vertical Shaking on Column Response (Macrae, 1999)................................................................................................... 5-96
Figure 5-87 Example of Strength Deterioration for Bilinear Hysteresis Model ................... 5-99 Figure 5-88 Simulation of Deterioration Observed in Steel Assembly Test ....................... 5-101 Figure 5-89 Example of a Stiffness Degradation Model ..................................................... 5-101 Figure 5-90 Example of a Slip (Pinching) Model (Naeim et al. 1999) ............................... 5-102 Figure 5-91 Examples of Hysteresis Models Used by Naeim et al., 1999 .......................... 5-104 Figure 5-92 Story Drift Demands for Bilinear LA Structures (Naeim et al. 1999)............. 5-105 Figure 5-93 Story Drift Demands for LA Structures with Severe Stiffness
Degradation (Naeim et al. 1999)...................................................................... 5-106 Figure 5-94 Story Drift Demands for LA Structures with Severe Slip
(Naeim et al. 1999) .......................................................................................... 5-107 Figure 5-95 Story Drift Demands for LA Structures with Severe Strength
Deterioration (Naeim et al. 1999) .................................................................... 5-108 Figure 5-96 Process for Simplified Seismic Demand Estimation ....................................... 5-111 Figure 5-97 Data Points for MDOF Modification Factor; LA 9-Story Building ................ 5-112 Figure 5-98 Data points for MDOF Modification Factor; BO 20-Story Building .............. 5-113 Figure 5-99 Data Points for Inelasticity Modification Factor; LA 20-Story Building........ 5-114 Figure 5-100 Data Points for P-Delta Modification Factor; LA 20-Story Building ............. 5-115 Figure 5-101 Relationship Between Story 8 Drift and Roof Drift; LA 9-Story Building..... 5-118 Figure 5-102 Relationship Between Story 3 Drift and Roof Drift; LA 9-Story Building..... 5-119 Figure 6-1 Post-Fracture Model Used in Study by Cornell and Luco (1999) ....................... 6-2 Figure 6-2 Spatial Variation of Median and 1-Sigma Level θi for LA 9-Story
Model Structure, 10/50 and 2/50 Ground Motions.............................................. 6-8 Figure 6-3 "Counted" Medians of θmax and θave for 2/50 Ground Motions ........................... 6-9 Figure 6-4 Percentage of "Extreme" Drifts (Including "Collapses") for 2/50
Ground Motions ................................................................................................. 6-10 Figure 6-5 Spatial Variation of "Counted" Median θi for LA 9-Story Model
Structure............................................................................................................. 6-13 Figure 6-6 Spatial Variation of "Counted" Median θi for LA 9-Story Model
Structure, Various Fracture Scenarios ............................................................... 6-17 Figure 6-7 "Counted" Median θmax for 2/50 Ground Motions, Various
Fracture Scenarios.............................................................................................. 6-18 Figure 6-8 Relation Between Beam Depth and Plastic Rotation Capacity
(Bonowitz and Maison (1998)).......................................................................... 6-27 Figure 6-9 Annual Hazard Curve for Spectral Acceleration ............................................... 6-37 Figure 6-10 Sa versus θmax and Regression Analysis Results; (a) Ductile
Connections, and (b) Brittle Connections.......................................................... 6-38
Systems Performance of FEMA-355C Steel Moment Frames Subject List of Figures to Earthquake Ground Shaking
xvi
Figure 6-11 Annual Hazard Curve for Maximum Story Drift Demand ................................ 6-39 Figure 6-12 “Probability of Failure” Versus Median θmax Capacity ..................................... 6-42 Figure 6-13 “Design Spectral Acceleration” Versus “Target Probability of Failure” .......... 6-43 Figure 6-14 IDA Curves for 3-Story Structure with Ductile and with Brittle
Connections ....................................................................................................... 6-44 Figure 7-1 Typical PR Connections (Kasai et al. (1999)) ................................................... 7-2 Figure 7-2 Test Results for T-Stub Connection. ATC-24 Loading History and
Responses to Five Ground Motions (Kasai et al. (1999)).................................... 7-3 Figure 7-3 Typical Hysteresis Model for Composite PR Connections
(Maison & Kasai (1999)) ..................................................................................... 7-4 Figure 7-4 Connection Moment-Rotation Relationships Used in Kasai’s Study
(Kasai et al. (1999)) ............................................................................................. 7-5 Figure 7-5 Periods for LA Structures Together with LA Median Displacement
Spectra for 10/50 and 2/50 Ground Motions (Kasai et al. (1999)) ...................... 7-6 Figure 7-6 Layout of Frames with PR Connections Used in Maison’s Study
(Maison & Kasai (1999)) ..................................................................................... 7-7 Figure 7-7 Global Pushover Curves for Structures with PR and FR Connections,
Maison’s Study (Maison & Kasai (1999))........................................................... 7-7 Figure 7-8 Global Pushover Curves for LA 20-Story Structures with PR and FR
Connections, Kasai’s Study (Kasai et al. (1999))................................................ 7-8 Figure 7-9 Comparison of Median Drifts of Structures with PR and FR Connections,
Maison’s Study (Maison & Kasai, 1999) .......................................................... 7-10 Figure 7-10 Median Story Drift Demands for LA 9-Story Structure, 10/50 and 2/50
Ground Motions (Kasai et al. (1999) ................................................................. 7-12 Figure 7-11 Median Story Drift Demands for Seattle 9-Story Structure, 10/50 and
2/50 Ground Motions (Kasai et al. (1999))........................................................ 7-13 Figure 7-12 Relationship Between PR Rotation Demand and Story Drift Demand,
Maison’s Study (Maison & Kasai (1999))......................................................... 7-15 Figure 7-13 Relationship Between PR Rotation Demand and Story Drift Demand,
Kasai’s Study (Kasai et al. (1999)).................................................................... 7-16 Figure 7-14 Story Shears Obtained from Pushover Analysis and Time History
Analyses, Maison’s Study, Seattle 9-Story Structure (Maison & Kasai (1999)) ................................................................................... 7-18
Figure A-1 Elastic Strength (Acceleration) Demand Spectra, 50/50 Set of LA Ground Motions ....................................................................... A-2
Figure A-2 Elastic Strength (Acceleration) Demand Spectra, 10/50 Set of LA Ground Motions ....................................................................... A-2
Figure A-3 Elastic Strength (Acceleration) Demand Spectra, 2/50 Set of LA Ground Motions ......................................................................... A-7
Figure A-4 Elastic Displacement Demand Spectra, 50/50 Set of LA Ground Motions ....................................................................... A-7
Systems Performance of Steel Moment Frames Subject FEMA-355C to Earthquake Ground Shaking List of Figures
xvii
Figure A-5 Elastic Displacement Demand Spectra, 10/50 Set of LA Ground Motions ....................................................................... A-7
Figure A-6 Elastic Displacement Demand Spectra, 2/50 Set of LA Ground Motions ......................................................................... A-8
Figure A-7 Elastic Strength Demand Spectra, 10/50 Set of Seattle Ground Motions ................................................................. A-8
Figure A-8 Elastic Strength Demand Spectra, 2/50 Set of Seattle Ground Motions ................................................................... A-8
Figure A-9 Elastic Displacement Demand Spectra, 10/50 Set of Seattle Ground Motions ................................................................. A-9
Figure A-10 Elastic Displacement Demand Spectra, 2/50 Set of Seattle Ground Motions ................................................................... A-9
Figure A-11 Elastic Strength Demand Spectra, 10/50 Set of Boston Ground Motions ................................................................. A-9
Figure A-12 Elastic Strength Demand Spectra, 2/50 Set of Boston Ground Motions ................................................................. A-10
Figure A-13 Elastic Displacement Demand Spectra, 10/50 Set of Boston Ground Motions ............................................................... A-10
Figure A-14 Elastic Displacement Demand Spectra, 2/50 Set of Boston Ground Motions ................................................................. A-10
Figure B-1 Floor Plans and Elevations for Model Buildings...............................................B-15 Figure B-2 Floor Plans Showing Layout of Moment-Resisting Frames for
LA Model Buildings ..........................................................................................B-15 Figure B-3 Floor Plans Showing Layout of Moment-Resisting Frames for
Seattle Model Buildings.....................................................................................B-16 Figure B-4 Floor Plans Showing Layout of Moment-Resisting Frames for
Redesigned LA 9-Story Buildings.....................................................................B-16

Systems Performance of Steel Moment Frames Subject FEMA-355C to Earthquake Ground Shaking List of Tables
xix
LIST OF TABLES
Table 5-1 Modal Properties of Pre-Northridge (Models M1 and M2) and Post-Northridge (Model M2) Structures............................................................ 5-10
Table 5-2 Properties of WSMF of LA 9-Story Structure (LA9) and Redesigned LA 9-Story ......................................................................................................... 5-15
Table 5-3 Statistical Values of Roof Drift Angle Demands for Pre- and Post-Northridge Structures (Models M1 and M2); Different Sets of Ground Motions ................................................................................................. 5-30
Table 5-4 Statistical Values for Plastic Rotation and Bending Moment Demands at Base of Story 1 Columns, LA 3-,9-, and 20-Story Structures; 2/50 Set of Ground Motions and Pushover Analysis......................................... 5-61
Table 5-5 Statistical Values for Axial Force and Bending Moment Demands for Splices in Story 5 of LA 20-Story Structure; 2/50 Set of Ground Motions....... 5-67
Table 5-6 Characteristics of Soft Soil Profiles................................................................... 5-88 Table 5-7 Statistical Values for the MDOF Modification Factor .................................... 5-113 Table 5-8 Statistical Values for the Inelasticity Modification Factor .............................. 5-114 Table 5-9 Ratio of Sum of Median Story Displacements to Median of Roof
Displacement.................................................................................................... 5-118 Table 6-1 LA 9-Story Model Structure with Ductile and with Brittle Base
Connections ......................................................................................................... 6-7 Table 6-2 LA 9-Story Model Structure with Different Locations of “Early”
Fracturing Connections...................................................................................... 6-12 Table 6-3 LA 9-Story Model Structure with BFO and with TBF Connection Fractures... 6-16 Table 6-4 Maximum Story Drift Angles for the LA 9-Story M1+ Model Structure
Under the 6 Most Damaging 2/50 records......................................................... 6-21 Table 6-5 θmax Statistics for M1+ Model Structures .......................................................... 6-23 Table 6-6 Near-Fault vs. LA Ground Motions, LA 9-Story Model Structure
θmax Medians and 1-Sigma Levels ..................................................................... 6-24 Table 6-7 θmax Statistics and % Increase from Ductile Case LA 9-Story
Redesigns and SAC Design for Two Fracture Scenarios .................................. 6-29 Table 6-8 θmax Statistics for LA 9-Story Structure with Column Fractures....................... 6-31 Table 6-9 Median and COV Values of θmax and Sa for 10/50 and 2/50
Ground Motions ................................................................................................. 6-38 Table 7-1 Collapse Cases for 10/50 and 2/50 Ground Motions, Kasai’s Study
(Kasai et al. (1999)) ........................................................................................... 7-14 Table A-1 Target Response Spectra Values for Soil Type SD for 5% Damping
Level (from Somerville et al. 1997).................................................................... A-2 Table A-2 Basic Characteristics of Los Angeles Ground Motion Records ......................... A-3 Table A-3 Basic Characteristics of Seattle Ground Motion Records .................................. A-4 Table A-4 Basic Characteristics of Boston Ground Motion Records .................................. A-5
Systems Performance of FEMA-355C Steel Moment Frames Subject List of Tables to Earthquake Ground Shaking
xx
Table A-5 Information on Near-Fault Records .................................................................... A-6 Table B-1 Beam and Column Sections, and Doubler Plate Thickness for
Los Angeles Model Buildings .............................................................................B-7 Table B-2 Cover Plate Details for LA Post-Northridge Model Buildings............................B-8 Table B-3 Beam and Column Sections, and Doubler Plate Thickness for
Seattle Model Buildings.......................................................................................B-9 Table B-4 Cover Plate Details for Seattle Post-Northridge Model Buildings....................B-11 Table B-5 Cover Plate Details for Seattle Post-Northridge RBS Model Building.............B-11 Table B-6 Reduced Beam Section Details for Seattle Post-Northridge
RBS Model Building .........................................................................................B-11 Table B-7 Beam and Column Sections, and Doubler Plate Thickness for
Boston Model Buildings ....................................................................................B-12 Table B-8 Cover Plate Details for Boston Post-Northridge Model Buildings ...................B-14 Table B-9 Beam and Column Sections for Redesigned LA 9-Story
Pre-Northridge Buildings...................................................................................B-14
Systems Performance of Steel Moment Frames Subject FEMA-355C to Earthquake Ground Shaking Chapter 1: Introduction
1-1
1. INTRODUCTION
1.1 Purpose
This report, FEMA-355C – State of the Art Report on Systems Performance of Steel Moment Frames Subject to Earthquake Ground Shaking, presents an overview of the current state of knowledge with regard to the response of moment-resisting steel frame buildings to strong ground shaking. This state of the art report was prepared in support of the development of a series of Recommended Design Criteria documents, prepared by the SAC Joint Venture on behalf of the Federal Emergency Management Agency and addressing the issue of the seismic performance of moment-resisting steel frame structures. These publications include:
• FEMA-350 – Recommended Seismic Design Criteria for New Steel Moment-Frame Buildings. This publication provides recommended criteria, supplemental to FEMA-302 – 1997 NEHRP Recommended Provisions for Seismic Regulations for New Buildings and Other Structures, for the design and construction of steel moment-frame buildings and provides alternative performance-based design criteria.
• FEMA-351 – Recommended Seismic Evaluation and Upgrade Criteria for Existing Welded Steel Moment-Frame Buildings. This publication provides recommended methods to evaluate the probable performance of existing steel moment-frame buildings in future earthquakes and to retrofit these buildings for improved performance.
• FEMA-352 – Recommended Postearthquake Evaluation and Repair Criteria for Welded Steel Moment-Frame Buildings. This publication provides recommendations for performing postearthquake inspections to detect damage in steel moment-frame buildings following an earthquake, evaluating the damaged buildings to determine their safety in the postearthquake environment, and repairing damaged buildings.
• FEMA-353 – Recommended Specifications and Quality Assurance Guidelines for Steel Moment-Frame Construction for Seismic Applications. This publication provides recommended specifications for the fabrication and erection of steel moment frames for seismic applications. The recommended design criteria contained in the other companion documents are based on the material and workmanship standards contained in this document, which also includes discussion of the basis for the quality control and quality assurance criteria contained in the recommended specifications.
Detailed derivations and explanations of the basis for these design and evaluation recommendations may be found in a series of State of the Art Reports prepared in parallel with these design criteria. These reports include:
• FEMA-355A – State of the Art Report on Base Metals and Fracture. This report summarizes current knowledge of the properties of structural steels commonly employed in building construction, and the production and service factors that affect these properties.
• FEMA-355B – State of the Art Report on Welding and Inspection. This report summarizes current knowledge of the properties of structural welding commonly employed in building construction, the effect of various welding parameters on these properties, and the
Systems Performance of FEMA-355C Steel Moment Frames Subject Chapter 1: Introduction to Earthquake Ground Shaking
1-2
effectiveness of various inspection methodologies in characterizing the quality of welded construction.
• FEMA-355C – State of the Art Report on Systems Performance of Steel Moment Frames Subject to Earthquake Ground Shaking. This report summarizes an extensive series of analytical investigations into the demands induced in steel moment-frame buildings designed to various criteria, when subjected to a range of different ground motions. The behavior of frames constructed with fully restrained, partially restrained and fracture-vulnerable connections is explored for a series of ground motions, including motion anticipated at near-fault and soft-soil sites.
• FEMA-355D – State of the Art Report on Connection Performance. This report summarizes the current state of knowledge of the performance of different types of moment-resisting connections under large inelastic deformation demands. It includes information on fully restrained, partially restrained, and partial strength connections, both welded and bolted, based on laboratory and analytical investigations.
• FEMA-355E – State of the Art Report on Past Performance of Steel Moment-Frame Buildings in Earthquakes. This report summarizes investigations of the performance of steel moment-frame buildings in past earthquakes, including the 1995 Kobe, 1994 Northridge, 1992 Landers, 1992 Big Bear, 1989 Loma Prieta and 1971 San Fernando events.
• FEMA-355F – State of the Art Report on Performance Prediction and Evaluation of Steel Moment-Frame Buildings. This report describes the results of investigations into the ability of various analytical techniques, commonly used in design, to predict the performance of steel moment-frame buildings subjected to earthquake ground motion. Also presented is the basis for performance-based evaluation procedures contained in the design criteria documents, FEMA-350, FEMA-351, and FEMA-352.
In addition to the recommended design criteria and the State of the Art Reports, a companion document has been prepared for building owners, local community officials and other non-technical audiences who need to understand this issue. A Policy Guide to Steel Moment Frame Construction (FEMA-354) addresses the social, economic, and political issues related to the earthquake performance of steel moment-frame buildings. FEMA-354 also includes discussion of the relative costs and benefits of implementing the recommended criteria.
1.2 Background
For many years, the basic intent of the building code seismic provisions has been to provide buildings with an ability to withstand intense ground shaking without collapse, but potentially with some significant structural damage. In order to accomplish this, one of the basic principles inherent in modern code provisions is to encourage the use of building configurations, structural systems, materials and details that are capable of ductile behavior. A structure is said to behave in a ductile manner if it is capable of withstanding large inelastic deformations without significant degradation in strength, and without the development of instability and collapse. The design forces specified by building codes for particular structural systems are related to the amount of ductility the system is deemed to possess. Generally, structural systems with more ductility are designed for lower forces than less ductile systems, as ductile systems are deemed
Systems Performance of Steel Moment Frames Subject FEMA-355C to Earthquake Ground Shaking Chapter 1: Introduction
1-3
capable of resisting demands that are significantly greater than their elastic strength limit. Starting in the 1960s, engineers began to regard welded steel moment-frame buildings as being among the most ductile systems contained in the building code. Many engineers believed that steel moment-frame buildings were essentially invulnerable to earthquake-induced structural damage and thought that should such damage occur, it would be limited to ductile yielding of members and connections. Earthquake-induced collapse was not believed possible. Partly as a result of this belief, many large industrial, commercial and institutional structures employing steel moment-frame systems were constructed, particularly in the western United States.
The Northridge earthquake of January 17, 1994 challenged this paradigm. Following that earthquake, a number of steel moment-frame buildings were found to have experienced brittle fractures of beam-to-column connections. The damaged buildings had heights ranging from one story to 26 stories, and a range of ages spanning from buildings as old as 30 years to structures being erected at the time of the earthquake. The damaged buildings were spread over a large geographical area, including sites that experienced only moderate levels of ground shaking. Although relatively few buildings were located on sites that experienced the strongest ground shaking, damage to buildings on these sites was extensive. Discovery of these unanticipated brittle fractures of framing connections, often with little associated architectural damage, was alarming to engineers and the building industry. The discovery also caused some concern that similar, but undiscovered, damage may have occurred in other buildings affected by past earthquakes. Later investigations confirmed such damage in a limited number of buildings affected by the 1992 Landers, 1992 Big Bear and 1989 Loma Prieta earthquakes.
In general, steel moment-frame buildings damaged by the Northridge earthquake met the basic intent of the building codes. That is, they experienced limited structural damage, but did not collapse. However, the structures did not behave as anticipated and significant economic losses occurred as a result of the connection damage, in some cases, in buildings that had experienced ground shaking less severe than the design level. These losses included direct costs associated with the investigation and repair of this damage as well as indirect losses relating to the temporary, and in a few cases, long-term, loss of use of space within damaged buildings.
Steel moment-frame buildings are designed to resist earthquake ground shaking based on the assumption that they are capable of extensive yielding and plastic deformation, without loss of strength. The intended plastic deformation consists of plastic rotations developing within the beams, at their connections to the columns, and is theoretically capable of resulting in benign dissipation of the earthquake energy delivered to the building. Damage is expected to consist of moderate yielding and localized buckling of the steel elements, not brittle fractures. Based on this presumed behavior, building codes permit steel moment-frame buildings to be designed with a fraction of the strength that would be required to respond to design level earthquake ground shaking in an elastic manner.
Steel moment-frame buildings are anticipated to develop their ductility through the development of yielding in beam-column assemblies at the beam-column connections. This yielding may take the form of plastic hinging in the beams (or, less desirably, in the columns), plastic shear deformation in the column panel zones, or through a combination of these mechanisms. It was believed that the typical connection employed in steel moment-frame
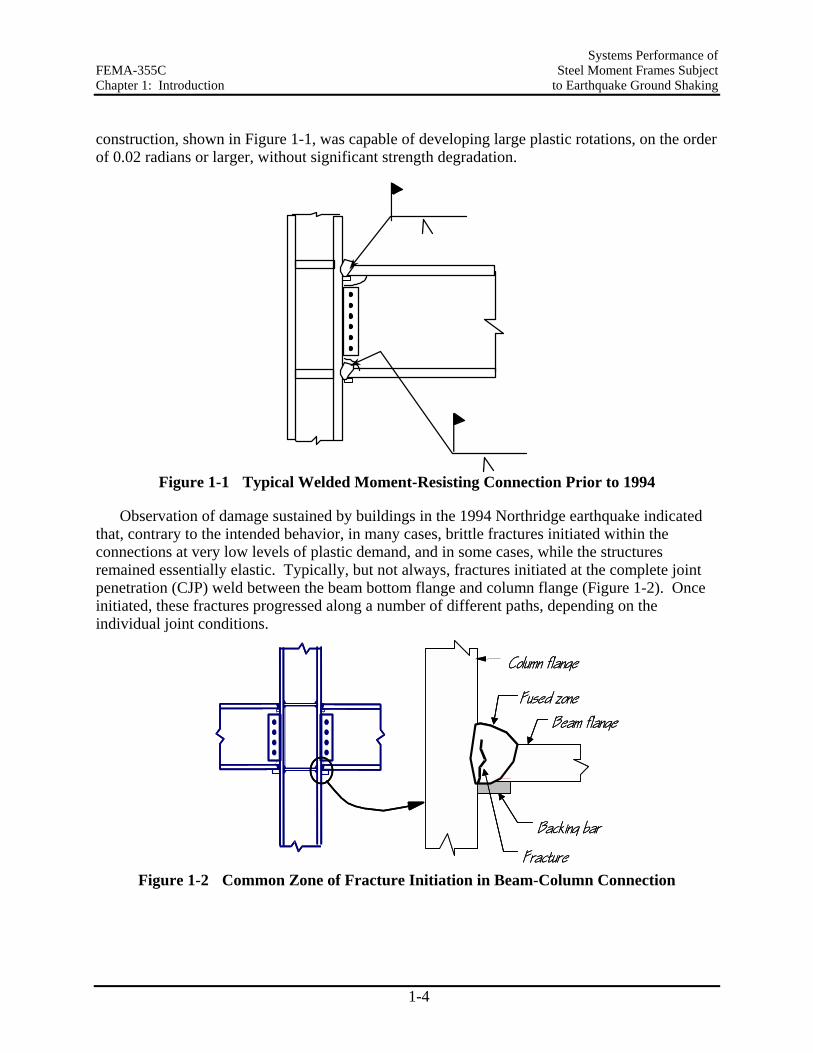
Systems Performance of FEMA-355C Steel Moment Frames Subject Chapter 1: Introduction to Earthquake Ground Shaking
1-4
construction, shown in Figure 1-1, was capable of developing large plastic rotations, on the order of 0.02 radians or larger, without significant strength degradation.
Figure 1-1 Typical Welded Moment-Resisting Connection Prior to 1994
Observation of damage sustained by buildings in the 1994 Northridge earthquake indicated that, contrary to the intended behavior, in many cases, brittle fractures initiated within the connections at very low levels of plastic demand, and in some cases, while the structures remained essentially elastic. Typically, but not always, fractures initiated at the complete joint penetration (CJP) weld between the beam bottom flange and column flange (Figure 1-2). Once initiated, these fractures progressed along a number of different paths, depending on the individual joint conditions.
Backing bar
Column flange
Beam flangeFused zone
Fracture
Backing bar
Column flange
Beam flangeFused zone
Fracture Figure 1-2 Common Zone of Fracture Initiation in Beam-Column Connection
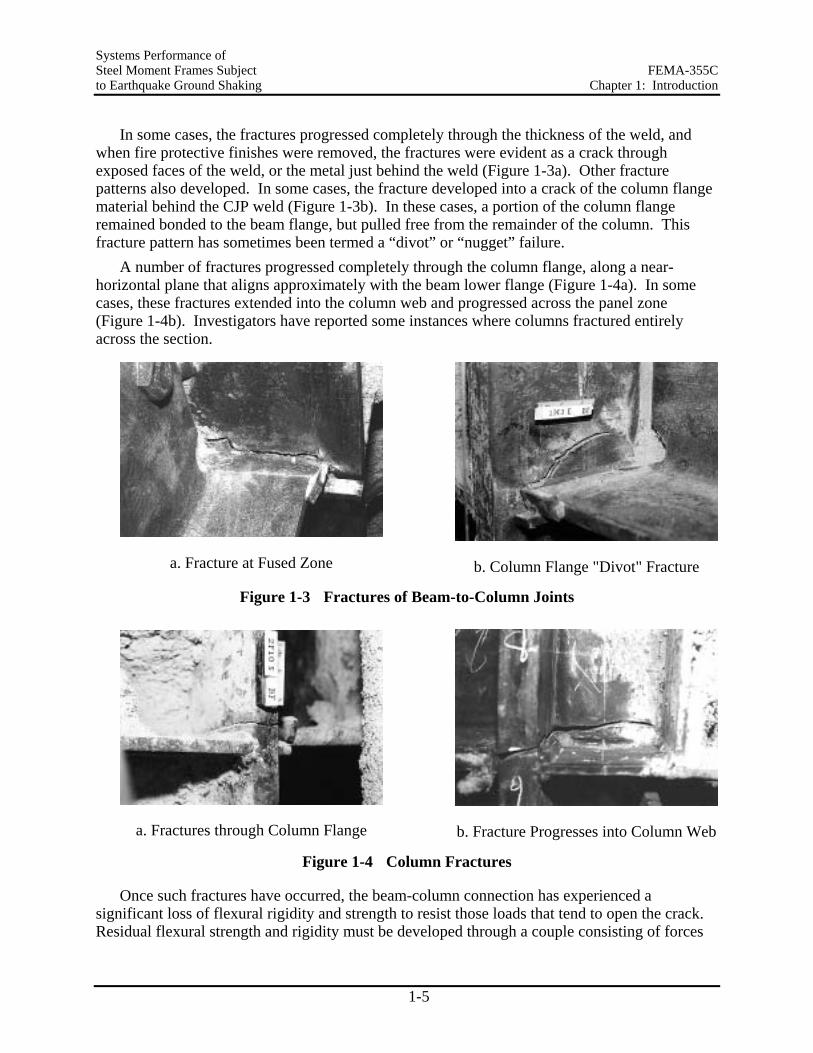
Systems Performance of Steel Moment Frames Subject FEMA-355C to Earthquake Ground Shaking Chapter 1: Introduction
1-5
In some cases, the fractures progressed completely through the thickness of the weld, and when fire protective finishes were removed, the fractures were evident as a crack through exposed faces of the weld, or the metal just behind the weld (Figure 1-3a). Other fracture patterns also developed. In some cases, the fracture developed into a crack of the column flange material behind the CJP weld (Figure 1-3b). In these cases, a portion of the column flange remained bonded to the beam flange, but pulled free from the remainder of the column. This fracture pattern has sometimes been termed a “divot” or “nugget” failure.
A number of fractures progressed completely through the column flange, along a near-horizontal plane that aligns approximately with the beam lower flange (Figure 1-4a). In some cases, these fractures extended into the column web and progressed across the panel zone (Figure 1-4b). Investigators have reported some instances where columns fractured entirely across the section.
a. Fracture at Fused Zone
b. Column Flange "Divot" Fracture
Figure 1-3 Fractures of Beam-to-Column Joints
a. Fractures through Column Flange
b. Fracture Progresses into Column Web
Figure 1-4 Column Fractures
Once such fractures have occurred, the beam-column connection has experienced a significant loss of flexural rigidity and strength to resist those loads that tend to open the crack. Residual flexural strength and rigidity must be developed through a couple consisting of forces
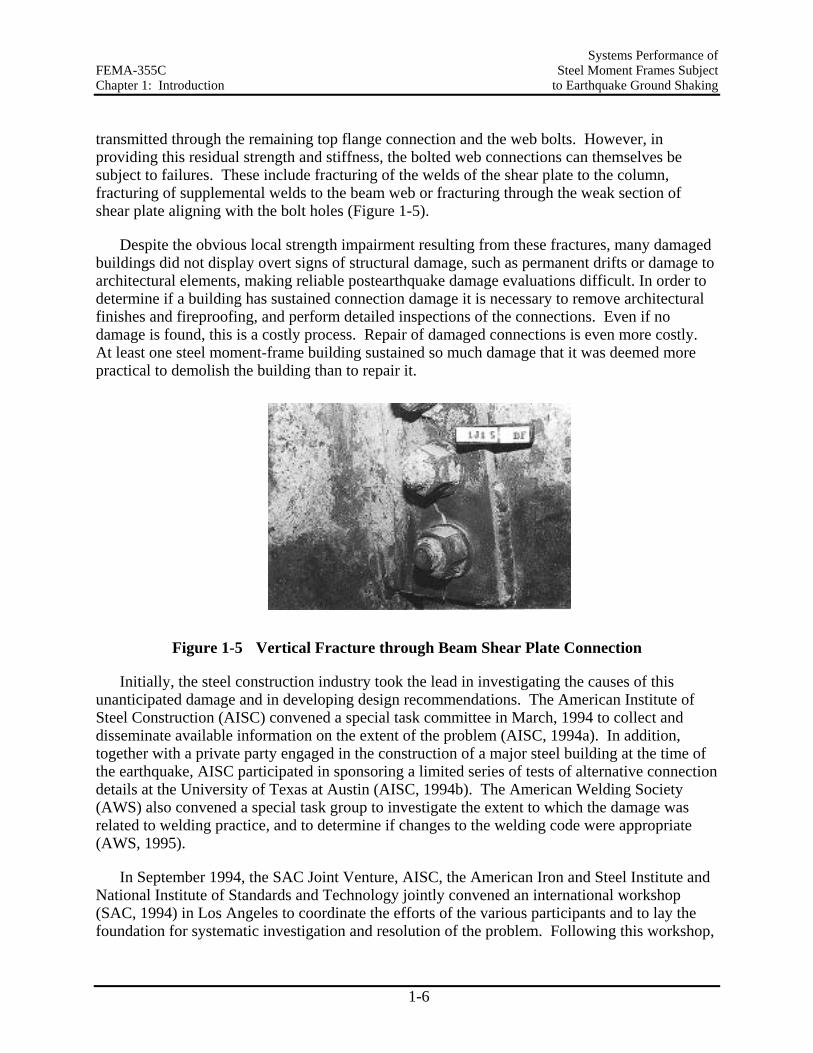
Systems Performance of FEMA-355C Steel Moment Frames Subject Chapter 1: Introduction to Earthquake Ground Shaking
1-6
transmitted through the remaining top flange connection and the web bolts. However, in providing this residual strength and stiffness, the bolted web connections can themselves be subject to failures. These include fracturing of the welds of the shear plate to the column, fracturing of supplemental welds to the beam web or fracturing through the weak section of shear plate aligning with the bolt holes (Figure 1-5).
Despite the obvious local strength impairment resulting from these fractures, many damaged buildings did not display overt signs of structural damage, such as permanent drifts or damage to architectural elements, making reliable postearthquake damage evaluations difficult. In order to determine if a building has sustained connection damage it is necessary to remove architectural finishes and fireproofing, and perform detailed inspections of the connections. Even if no damage is found, this is a costly process. Repair of damaged connections is even more costly. At least one steel moment-frame building sustained so much damage that it was deemed more practical to demolish the building than to repair it.
Figure 1-5 Vertical Fracture through Beam Shear Plate Connection
Initially, the steel construction industry took the lead in investigating the causes of this unanticipated damage and in developing design recommendations. The American Institute of Steel Construction (AISC) convened a special task committee in March, 1994 to collect and disseminate available information on the extent of the problem (AISC, 1994a). In addition, together with a private party engaged in the construction of a major steel building at the time of the earthquake, AISC participated in sponsoring a limited series of tests of alternative connection details at the University of Texas at Austin (AISC, 1994b). The American Welding Society (AWS) also convened a special task group to investigate the extent to which the damage was related to welding practice, and to determine if changes to the welding code were appropriate (AWS, 1995).
In September 1994, the SAC Joint Venture, AISC, the American Iron and Steel Institute and National Institute of Standards and Technology jointly convened an international workshop (SAC, 1994) in Los Angeles to coordinate the efforts of the various participants and to lay the foundation for systematic investigation and resolution of the problem. Following this workshop,
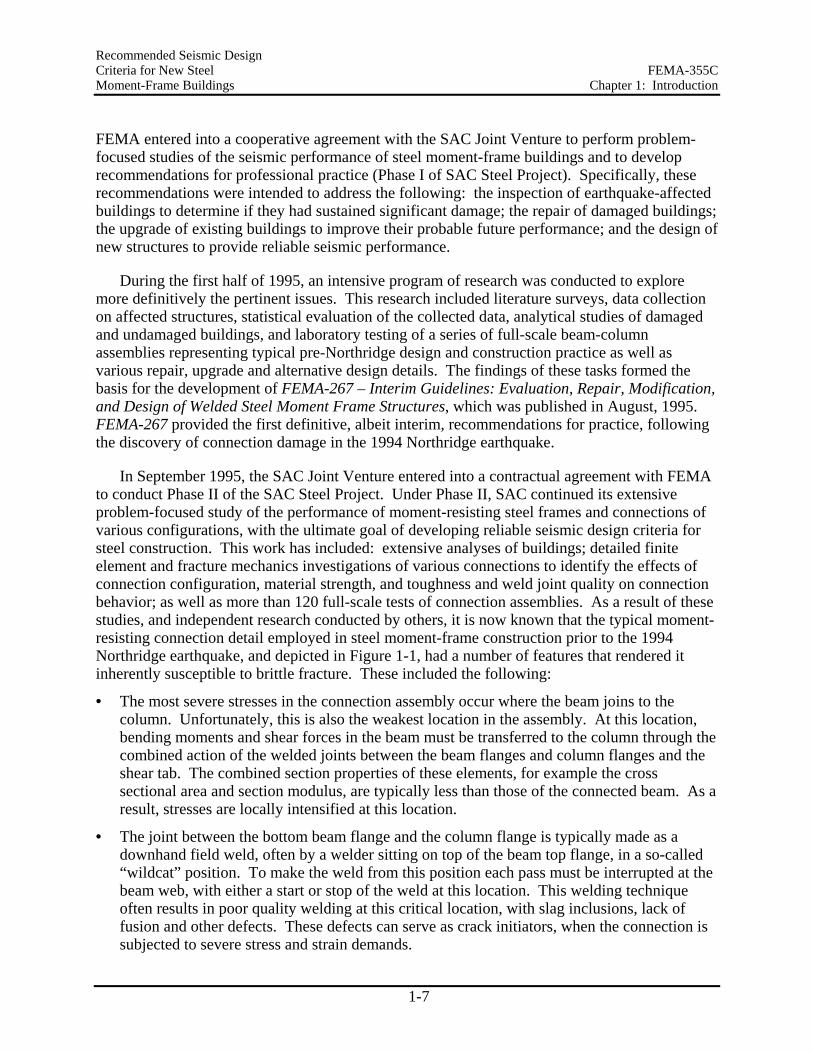
Recommended Seismic Design Criteria for New Steel FEMA-355C Moment-Frame Buildings Chapter 1: Introduction
1-7
FEMA entered into a cooperative agreement with the SAC Joint Venture to perform problem-focused studies of the seismic performance of steel moment-frame buildings and to develop recommendations for professional practice (Phase I of SAC Steel Project). Specifically, these recommendations were intended to address the following: the inspection of earthquake-affected buildings to determine if they had sustained significant damage; the repair of damaged buildings; the upgrade of existing buildings to improve their probable future performance; and the design of new structures to provide reliable seismic performance.
During the first half of 1995, an intensive program of research was conducted to explore more definitively the pertinent issues. This research included literature surveys, data collection on affected structures, statistical evaluation of the collected data, analytical studies of damaged and undamaged buildings, and laboratory testing of a series of full-scale beam-column assemblies representing typical pre-Northridge design and construction practice as well as various repair, upgrade and alternative design details. The findings of these tasks formed the basis for the development of FEMA-267 – Interim Guidelines: Evaluation, Repair, Modification, and Design of Welded Steel Moment Frame Structures, which was published in August, 1995. FEMA-267 provided the first definitive, albeit interim, recommendations for practice, following the discovery of connection damage in the 1994 Northridge earthquake.
In September 1995, the SAC Joint Venture entered into a contractual agreement with FEMA to conduct Phase II of the SAC Steel Project. Under Phase II, SAC continued its extensive problem-focused study of the performance of moment-resisting steel frames and connections of various configurations, with the ultimate goal of developing reliable seismic design criteria for steel construction. This work has included: extensive analyses of buildings; detailed finite element and fracture mechanics investigations of various connections to identify the effects of connection configuration, material strength, and toughness and weld joint quality on connection behavior; as well as more than 120 full-scale tests of connection assemblies. As a result of these studies, and independent research conducted by others, it is now known that the typical moment-resisting connection detail employed in steel moment-frame construction prior to the 1994 Northridge earthquake, and depicted in Figure 1-1, had a number of features that rendered it inherently susceptible to brittle fracture. These included the following:
• The most severe stresses in the connection assembly occur where the beam joins to the column. Unfortunately, this is also the weakest location in the assembly. At this location, bending moments and shear forces in the beam must be transferred to the column through the combined action of the welded joints between the beam flanges and column flanges and the shear tab. The combined section properties of these elements, for example the cross sectional area and section modulus, are typically less than those of the connected beam. As a result, stresses are locally intensified at this location.
• The joint between the bottom beam flange and the column flange is typically made as a downhand field weld, often by a welder sitting on top of the beam top flange, in a so-called “wildcat” position. To make the weld from this position each pass must be interrupted at the beam web, with either a start or stop of the weld at this location. This welding technique often results in poor quality welding at this critical location, with slag inclusions, lack of fusion and other defects. These defects can serve as crack initiators, when the connection is subjected to severe stress and strain demands.
Systems Performance of FEMA-355C Steel Moment Frames Subject Chapter 1: Introduction to Earthquake Ground Shaking
1-8
• The basic configuration of the connection makes it difficult to detect hidden defects at the root of the welded beam-flange-to-column-flange joints. The backing bar, which was typically left in place following weld completion, restricts visual observation of the weld root. Therefore, the primary method of detecting defects in these joints is through the use of ultrasonic testing (UT). However, the geometry of the connection also makes it very difficult for UT to detect flaws reliably at the bottom beam flange weld root, particularly at the center of the joint, at the beam web. As a result, many of these welded joints have undetected significant defects that can serve as crack initiators.
• Although typical design models for this connection assume that nearly all beam flexural stresses are transmitted by the flanges and all beam shear forces by the web, in reality, due to boundary conditions imposed by column deformations, the beam flanges at the connection carry a significant amount of the beam shear. This results in significant flexural stresses on the beam flange at the face of the column, and also induces large secondary stresses in the welded joint. Some of the earliest investigations of these stress concentration effects in the welded joint were conducted by Richard, et al. (1995). The stress concentrations resulting from this effect resulted in severe strength demands at the root of the complete joint penetration welds between the beam flanges and column flanges, a region that often includes significant discontinuities and slag inclusions, which are ready crack initiators.
• In order that the welding of the beam flanges to the column flanges be continuous across the thickness of the beam web, this detail incorporates weld access holes in the beam web, at the beam flanges. Depending on their geometry, severe strain concentrations can occur in the beam flange at the toe of these weld access holes. These strain concentrations can result in low-cycle fatigue and the initiation of ductile tearing of the beam flanges after only a few cycles of moderate plastic deformation. Under large plastic flexural demands, these ductile tears can quickly become unstable and propagate across the beam flange.
• Steel material at the center of the beam-flange-to-column-flange joint is restrained from movement, particularly in connections of heavy sections with thick column flanges. This condition of restraint inhibits the development of yielding at this location, resulting in locally high stresses on the welded joint, which exacerbates the tendency to initiate fractures at defects in the welded joints.
• Design practice in the period 1985-1994 encouraged design of these connections with relatively weak panel zones. In connections with excessively weak panel zones, inelastic behavior of the assembly is dominated by shear deformation of the panel zone. This panel zone shear deformation results in a local kinking of the column flanges adjacent to the beam-flange-to-column-flange joint, and further increases the stress and strain demands in this sensitive region.
In addition to the above, additional conditions contributed significantly to the vulnerability of connections constructed prior to 1994.
• In the mid-1960s, the construction industry moved to the use of the semi-automatic, self-shielded, flux-cored arc welding process (FCAW-S) for making the joints of these connections. The welding consumables that building erectors most commonly used inherently produced welds with very low toughness. The toughness of this material could be
Recommended Seismic Design Criteria for New Steel FEMA-355C Moment-Frame Buildings Chapter 1: Introduction
1-9
further compromised by excessive deposition rates, which unfortunately were commonly employed by welders. As a result, brittle fractures could initiate in welds with large defects, at stresses approximating the yield strength of the beam steel, precluding the development of ductile behavior.
• Early steel moment frames tended to be highly redundant and nearly every beam-column joint was constructed to behave as part of the lateral-force-resisting system. As a result, member sizes in these early frames were small and much of the early acceptance testing of this typical detail was conducted with specimens constructed of small framing members. As the cost of construction labor increased, the industry found that it was more economical to construct steel moment-frame buildings by moment-connecting a relatively small percentage of the beams and columns and by using larger members for these few moment-connected elements. The amount of strain demand placed on the connection elements of a steel moment frame is related to the span-to-depth ratio of the member. Therefore, as member sizes increased, strain demands on the welded connections also increased, making the connections more susceptible to brittle behavior.
• In the 1960s and 1970s, when much of the initial research on steel moment-frame construction was performed, beams were commonly fabricated using A36 material. In the 1980s, many steel mills adopted more modern production processes, including the use of scrap-based production. Steels produced by these more modern processes tended to include micro-alloying elements that increased the strength of the materials so that despite the common specification of A36 material for beams, many beams actually had yield strengths that approximated or exceeded that required for grade 50 material. As a result of this increase in base metal yield strength, the weld metal in the beam-flange-to-column-flange joints became under-matched, potentially contributing to its vulnerability.
At this time, it is clear that, in order to obtain reliable ductile behavior of WSMF construction a number of changes to past practices in design, materials, fabrication, erection, and quality assurance are necessary. The recommendations contained in this document, and the companion publications, are based on an extensive program of research into materials, welding and inspection technology, frame system behavior, and laboratory and analytical investigations of different connection details.
1.3 Objectives
This report focuses on information needed to understand the seismic behavior of steel moment-resisting frame (WSMF) structures, and on analytical techniques that can be employed to predict this behavior. "Structures" implies that the whole three-dimensional structural system is considered, which consists of columns, beams connected to the columns by means of fully restrained (rigid), partially restrained (semi-rigid), or simple joints, and floor systems that may contribute to lateral strength and stiffness and act as horizontal diaphragms that tie individual frames together at the floor levels. Diaphragms, which in WSMF structures are usually treated as rigid in their own plane, are not part of this discussion. It is assumed that sufficient shear resistance is provided between diaphragms and beams so that the seismic inertia forces generated at the floor levels can be transferred to MRFs, and shear forces generated by enforcing
Systems Performance of FEMA-355C Steel Moment Frames Subject Chapter 1: Introduction to Earthquake Ground Shaking
1-10
displacement compatibility can be transferred between MRFs. Foundation systems and nonstructural systems, which also may affect the dynamic response, are not considered either.
The emphasis of this report is on the prediction of strength and deformation demands that earthquake ground motions may impose on individual elements and stories, and on the whole structural system. The information is based on a review of the literature and on several studies that were carried out as part of the SAC Steel Program. The SAC studies focused on a series of model buildings located in Los Angeles, Seattle, and Boston, for which structural systems were designed in accordance with pre-Northridge codes (UBC'94 or BOCA) and the post-Northridge FEMA 267 Interim Guidelines (FEMA 1995). Basic information on these model buildings and on the ground motion records used in the SAC studies are summarized in Appendices A and B.
This report cannot provide a comprehensive discussion of all important behavior and design considerations for WSMF structures. The emphasis is on demand and system performance issues of WSMF structures in severe earthquakes. Serviceability and damage control issues, whose importance is unquestionable, are not addressed in this discussion with the one exception that demand predictions for the Los Angeles model buildings are also made for earthquakes with the relatively short return period of 72 years (50% probability of exceedance in 50 years).
The focus of the report is not on code design aspects but rather on dynamic behavior issues that have gained considerable importance because of the recently observed connection fracture problems. Standard code design has served the profession well, presuming that the deformation capacity of all elements that are expected to experience inelastic deformations is sufficiently large to tolerate large variations in expected demands, and presuming that connections fulfill their intended functions at these high demands. The latter presumption appeared to be justified before January 17, 1994, the date of the Northridge earthquake. Since that date it no longer is warranted, and standard code design for WSMF structures needs to be re-evaluated. This re-evaluation needs to be based on a more realistic assessment of imposed demands and available capacities than was done in the past. Moreover, the assessment of the seismic safety of existing WSMF structures will have to be based on more comprehensive concepts than are contained in present code procedures. This report attempts to summarize the state of knowledge relevant for these purposes.
1.4 Historical Perspective
In the 1950s, structural welding became a widely accepted process in the building industry. This trend, together with the need for strong and stiff but economical connections, accelerated the shift from riveted or bolted partially restrained connections to welded and fully restrained connections. Experimental research performed in the mid 60s to early 70s at U.C. Berkeley (e.g., Popov and Pinkney (1969), Popov and Stephen (1970)) provided some evidence that certain types of butt welded beam flange to column flange connections can behave satisfactorily under cyclic loading.
Based on the available evidence, the engineering profession and the steel industry embraced the full penetration butt welded beam flange to column flange connection because of its simplicity and economy. It became the standard moment connection and, in concept, remained
Recommended Seismic Design Criteria for New Steel FEMA-355C Moment-Frame Buildings Chapter 1: Introduction
1-11
the standard connection until 1994. WSMF structures of the mid 60s to mid 70s had the following specific characteristics which, in most cases, no longer apply today:
• Most (or all) connections in the structure were moment-resisting connections. • Most connections were 3- or 4-way connections in which the beams framing into the weak
direction of the column were also rigidly connected. • Because of the large number of moment connections and because of relatively small beam
spans, most beam and column sections were relatively small. • The beam material was either A-7 or A-373 (Fy = 32 ksi, phased out in 1960), or A-36 with a
yield strength the mean value of which was not much higher than the nominal value. • Field welding was usually done with the Shielded Metal Arc Welding (SMAW) process. • The panel zones were strong in shear (usually reinforced with doubler plates) so that little
shear yielding occurred in the panel zones before the beams developed their moment capacity.
The basic type of connection has changed little since that time, but design and construction practices have. Perhaps most important is the great reduction in the use of the 3- and 4-way connections. These connections are expensive and their performance is questionable unless precautions are taken. For weak-axis connections (beams framing into the column web) it was standard for many years to weld the beam flange to a continuity plate which in turn was welded to the web and the flanges of the column and did not extend beyond the column flanges. Tests have shown that this type of weak-axis connection is susceptible to fracture at the weld connecting the beam flange to the continuity plate (e.g., Rentschler (1980)). This problem can be mitigated by several measures, including extending the continuity plate beyond the column flanges. Because mitigating measures can be accomplished only at an additional expense, and in order to avoid large weak-axis column bending, the preferred choice for several years has been to eliminate weak-axis moment connections.
Because of this change in design practice, and because of changes in material production, fabrication, and construction practices, most of WSMF structures of the 80s and 90s have the following characteristics:
• Moment-resisting connections are used only on two frame lines in each direction, usually at the perimeter, in order to eliminate weak-axis connections.
• Often the frames with moment-resisting connections do not extend over the full length of the buildings. The number of moment-resisting connections is reduced as much as possible, resulting in structures with low redundancy.
• Because of the small number of moment connections, most beam sections are relatively large. For this reason weldments are large, which increases the susceptibility to weld cracking.
• Large beam sections necessitate large column sections in order to fulfill the strong-column-weak-girder concept. If deeper than W14 sections are used as columns (often cost effective because of large moment demands but small axial force demands in perimeter frame columns), then lateral bracing of column compression flanges may become an issue.
Systems Performance of FEMA-355C Steel Moment Frames Subject Chapter 1: Introduction to Earthquake Ground Shaking
1-12
• The beam material is usually A-36 steel with a yield strength the mean value of which is significantly higher than the nominal value. (According to recent data (SSPC, 1994), the mean is around 49 ksi for most A-36 beam section groups.) Thus, the actual stress level in the welds and the column, associated with hinging in the beam, is higher than predicted using the nominal yield strength.
• Columns are usually made of A-572 steel the mean yield strength of which is only about 15% higher than the nominal value. Thus, column hinging may occur even though the strong-column-weak-beam concept is fulfilled in design calculations.
• Field welding is mostly done with the Self Shielded Flux Core Arc Welding (FCAW-SS) process.
• In the 1985 UBC, the requirement for shear strength of the joint panel zone was relaxed considerably. Thus, in newer structures, many panel zones will yield in shear long before the beams reach their bending strength, and in severe earthquakes yielding may be limited to the joint panel zones.
Because of changes in steel production and because of the after-effects of the Northridge earthquake, steel moment frame design and construction now is undergoing another metamorphosis. New steels with modified properties are expected to take over the market (e.g., A-992), new design/detailing requirements will change behavior modes in and around beam-to-column connections (e.g., in the SAC Guidelines and in the AISC 2000 Seismic Provisions the panel zone strength requirements are being increased considerably), and new seismic load requirements that account more explicitly for the severe ground motions expected in a near-fault region will greatly affect the drift and ductility demands for WSMFs.
The simple conclusion is that specific modes of behavior are correlated with the practice prevailing at specific times. All conclusions made in this report must be interpreted with this statement in mind. There are a few general behavior patterns that apply to all steel structures regardless of age of construction. But most patterns are dependent on design decisions. Moreover, there are many critical issues affecting behavior that are not addressed in this report. Perhaps the most important ones have to do with behavior near collapse, where element deterioration controls behavior and where strength discontinuities (vertical or in plane) may have an overpowering effect. Thus, it will be impossible to put 1960, 70, 80, 90, and 2000 WSMF structures into one group. They are different and they will behave differently.
This report attempts to focus on general behavior patterns, but it is impossible to stay away from design/construction time-dependent behavior characteristics. The quantitative information presented here is based on specific designs, and must be interpreted from that perspective. Much of this quantitative information is derived from designs of regular WSMF structures designed in accordance with 1994 seismic codes. Backward (to earlier design codes and practice) and forward (to year 2000 practice) extrapolation should be based on behavior-based and not fully quantitative considerations.
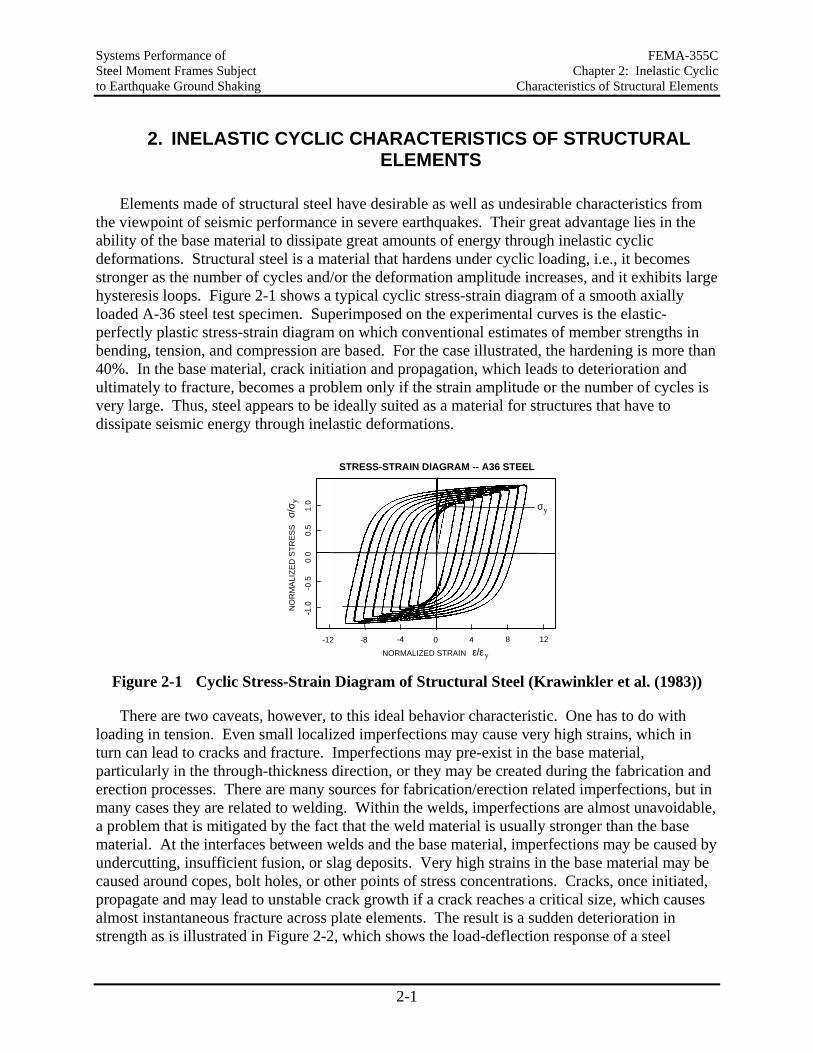
Systems Performance of FEMA-355C Steel Moment Frames Subject Chapter 2: Inelastic Cyclic to Earthquake Ground Shaking Characteristics of Structural Elements
2-1
2. INELASTIC CYCLIC CHARACTERISTICS OF STRUCTURAL ELEMENTS
Elements made of structural steel have desirable as well as undesirable characteristics from the viewpoint of seismic performance in severe earthquakes. Their great advantage lies in the ability of the base material to dissipate great amounts of energy through inelastic cyclic deformations. Structural steel is a material that hardens under cyclic loading, i.e., it becomes stronger as the number of cycles and/or the deformation amplitude increases, and it exhibits large hysteresis loops. Figure 2-1 shows a typical cyclic stress-strain diagram of a smooth axially loaded A-36 steel test specimen. Superimposed on the experimental curves is the elastic-perfectly plastic stress-strain diagram on which conventional estimates of member strengths in bending, tension, and compression are based. For the case illustrated, the hardening is more than 40%. In the base material, crack initiation and propagation, which leads to deterioration and ultimately to fracture, becomes a problem only if the strain amplitude or the number of cycles is very large. Thus, steel appears to be ideally suited as a material for structures that have to dissipate seismic energy through inelastic deformations.
0 4 8 12-12 -8 -4
-1.0
-
0.5
0
.0
0
.5
1.
0
ε/εNORMALIZED STRAIN y
NO
RM
ALIZ
ED S
TRES
Sσ/
σ y σy
STRESS-STRAIN DIAGRAM -- A36 STEEL
Figure 2-1 Cyclic Stress-Strain Diagram of Structural Steel (Krawinkler et al. (1983))
There are two caveats, however, to this ideal behavior characteristic. One has to do with loading in tension. Even small localized imperfections may cause very high strains, which in turn can lead to cracks and fracture. Imperfections may pre-exist in the base material, particularly in the through-thickness direction, or they may be created during the fabrication and erection processes. There are many sources for fabrication/erection related imperfections, but in many cases they are related to welding. Within the welds, imperfections are almost unavoidable, a problem that is mitigated by the fact that the weld material is usually stronger than the base material. At the interfaces between welds and the base material, imperfections may be caused by undercutting, insufficient fusion, or slag deposits. Very high strains in the base material may be caused around copes, bolt holes, or other points of stress concentrations. Cracks, once initiated, propagate and may lead to unstable crack growth if a crack reaches a critical size, which causes almost instantaneous fracture across plate elements. The result is a sudden deterioration in strength as is illustrated in Figure 2-2, which shows the load-deflection response of a steel
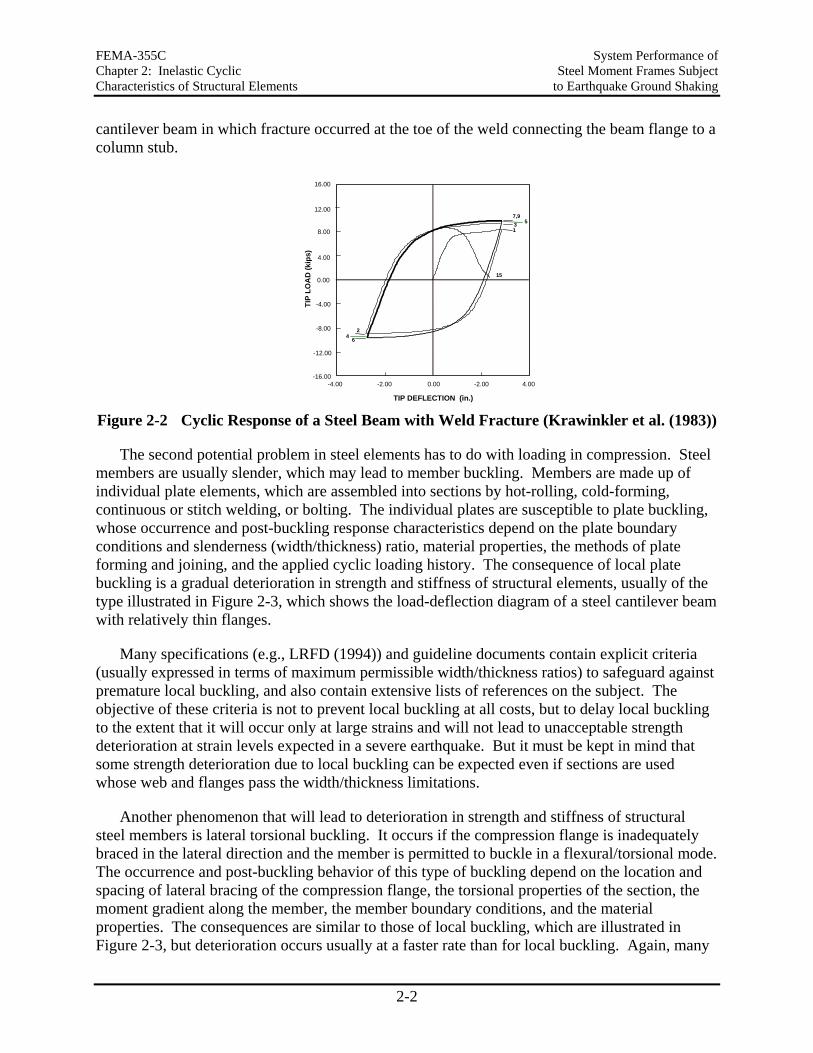
FEMA-355C System Performance of Chapter 2: Inelastic Cyclic Steel Moment Frames Subject Characteristics of Structural Elements to Earthquake Ground Shaking
2-2
cantilever beam in which fracture occurred at the toe of the weld connecting the beam flange to a column stub.
0.00 4.00-4.00 -2.00 -2.00
13 57,9
64
2
TIP DEFLECTION (in.)
TIP
LO
AD
(ki
ps)
150.00
-8.00
-4.00
4.00
8.00
12.00
-12.00
-16.00
16.00
Figure 2-2 Cyclic Response of a Steel Beam with Weld Fracture (Krawinkler et al. (1983))
The second potential problem in steel elements has to do with loading in compression. Steel members are usually slender, which may lead to member buckling. Members are made up of individual plate elements, which are assembled into sections by hot-rolling, cold-forming, continuous or stitch welding, or bolting. The individual plates are susceptible to plate buckling, whose occurrence and post-buckling response characteristics depend on the plate boundary conditions and slenderness (width/thickness) ratio, material properties, the methods of plate forming and joining, and the applied cyclic loading history. The consequence of local plate buckling is a gradual deterioration in strength and stiffness of structural elements, usually of the type illustrated in Figure 2-3, which shows the load-deflection diagram of a steel cantilever beam with relatively thin flanges.
Many specifications (e.g., LRFD (1994)) and guideline documents contain explicit criteria (usually expressed in terms of maximum permissible width/thickness ratios) to safeguard against premature local buckling, and also contain extensive lists of references on the subject. The objective of these criteria is not to prevent local buckling at all costs, but to delay local buckling to the extent that it will occur only at large strains and will not lead to unacceptable strength deterioration at strain levels expected in a severe earthquake. But it must be kept in mind that some strength deterioration due to local buckling can be expected even if sections are used whose web and flanges pass the width/thickness limitations.
Another phenomenon that will lead to deterioration in strength and stiffness of structural steel members is lateral torsional buckling. It occurs if the compression flange is inadequately braced in the lateral direction and the member is permitted to buckle in a flexural/torsional mode. The occurrence and post-buckling behavior of this type of buckling depend on the location and spacing of lateral bracing of the compression flange, the torsional properties of the section, the moment gradient along the member, the member boundary conditions, and the material properties. The consequences are similar to those of local buckling, which are illustrated in Figure 2-3, but deterioration occurs usually at a faster rate than for local buckling. Again, many
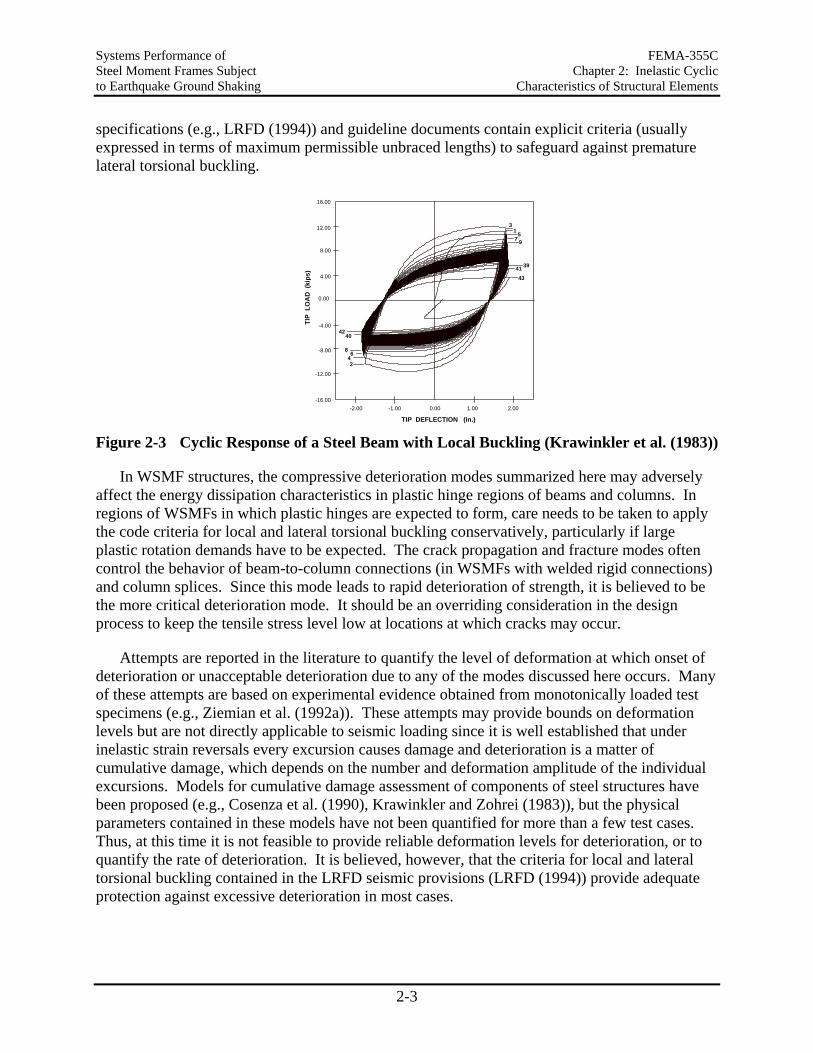
Systems Performance of FEMA-355C Steel Moment Frames Subject Chapter 2: Inelastic Cyclic to Earthquake Ground Shaking Characteristics of Structural Elements
2-3
specifications (e.g., LRFD (1994)) and guideline documents contain explicit criteria (usually expressed in terms of maximum permissible unbraced lengths) to safeguard against premature lateral torsional buckling.
-2.00 -1.00 1.00 2.000.00
0.00
-8.00
-4.00
4.00
8.00
12.00
-12.00
-16.00
16.00
TIP DEFLECTION (in.)
TIP
LO
AD
(ki
ps)
31
57 9
3941
43
4240
86
42
Figure 2-3 Cyclic Response of a Steel Beam with Local Buckling (Krawinkler et al. (1983))
In WSMF structures, the compressive deterioration modes summarized here may adversely affect the energy dissipation characteristics in plastic hinge regions of beams and columns. In regions of WSMFs in which plastic hinges are expected to form, care needs to be taken to apply the code criteria for local and lateral torsional buckling conservatively, particularly if large plastic rotation demands have to be expected. The crack propagation and fracture modes often control the behavior of beam-to-column connections (in WSMFs with welded rigid connections) and column splices. Since this mode leads to rapid deterioration of strength, it is believed to be the more critical deterioration mode. It should be an overriding consideration in the design process to keep the tensile stress level low at locations at which cracks may occur.
Attempts are reported in the literature to quantify the level of deformation at which onset of deterioration or unacceptable deterioration due to any of the modes discussed here occurs. Many of these attempts are based on experimental evidence obtained from monotonically loaded test specimens (e.g., Ziemian et al. (1992a)). These attempts may provide bounds on deformation levels but are not directly applicable to seismic loading since it is well established that under inelastic strain reversals every excursion causes damage and deterioration is a matter of cumulative damage, which depends on the number and deformation amplitude of the individual excursions. Models for cumulative damage assessment of components of steel structures have been proposed (e.g., Cosenza et al. (1990), Krawinkler and Zohrei (1983)), but the physical parameters contained in these models have not been quantified for more than a few test cases. Thus, at this time it is not feasible to provide reliable deformation levels for deterioration, or to quantify the rate of deterioration. It is believed, however, that the criteria for local and lateral torsional buckling contained in the LRFD seismic provisions (LRFD (1994)) provide adequate protection against excessive deterioration in most cases.
FEMA-355C System Performance of Chapter 2: Inelastic Cyclic Steel Moment Frames Subject Characteristics of Structural Elements to Earthquake Ground Shaking
2-4
2.1 Beam Behavior
Under severe seismic loading, beams that are part of WSMFs consist of elastic portions and partially or completely plastified regions whose location, length, and strain distribution depend on geometric parameters (depth, span), boundary conditions, the effect of gravity loading (magnitude and gradient of gravity moment diagram), and the interstory drift demands imposed by the earthquake. In pre-Northridge frames, the plastified regions are located, in most but not all cases, at the ends of the beam next to the column faces. These locations are desirable on one hand, because lateral bracing is provided by the column, and undesirable on the other hand because high demands are imposed on the connections.
If local and lateral torsional buckling are prevented, the moment curvature behavior at cross-sections away from the connection shows the same desirable characteristics as the material stress-strain behavior illustrated in Figure 2-1. In an earthquake, which causes random cycles, the response of a steel beam may be as illustrated in Figure 2-4. This beam exhibits stable and large hysteresis loops even though some local buckling was evident late in the loading history. To put this desirable behavior into perspective, this test was performed on a small W4 beam (with b/t = 11.5) framing into a well braced W8 column stub, using 1980 A-36 material. Thus, beams can exhibit very desirable energy dissipation characteristics provided they are braced adequately in the lateral direction and satisfy the code compactness criteria for seismic loading. For this reason, it has been an objective of seismic design of WSMFs to tune relative member strengths such that inelastic deformations are concentrated in plastified regions of beams. It is questionable whether this objective is being fulfilled in many designs, as will be discussed next.
In most engineering analyses the modeling of beams in plastified regions is greatly simplified. It is usually assumed that the moment-curvature relationship is bilinear elastic-perfectly plastic, with the "yield" value being equal to the plastic moment capacity given as FyZ (Fy = material yield strength, Z = plastic section modulus). There are two significant consequences of these assumptions. First, plastified regions disappear and are replaced by point plastic hinges. This modeling simplification does not affect the strength of members and the structure (if the moment capacity would actually be equal to FyZ), but it disguises the levels of stresses and strains occurring in beams and may give the engineer a misleading perception of the length and importance (particularly for lateral torsional buckling) of the plastified regions. Secondly, the computed strength value FyZ may be significantly smaller than the true strength of a beam in a WSMF. Cyclic strain hardening will increase the strength significantly, as is shown in Figure 2-4, in which the load corresponding to the strength value FyZ is indicated as Py. Moreover, the floor slab, which is usually connected to the beam with shear studs (partial or full composite construction), contributes also to the beam bending strength (e.g., Kato et al. (1984), Leon et al. (1998), Hajjar et al. (1998), Roeder (2000)).
Underestimating the strength of beams in the design process may have very undesirable consequences. Firstly, it underestimates the strength demands on beam-to-column connections and therefore the stress demands on weldments. Secondly, it underestimates the maximum moments that can be transferred from beams to panel zones and columns. Thus, the design intent of concentrating energy dissipation in plastic hinge regions of beams is often not fulfilled. If the
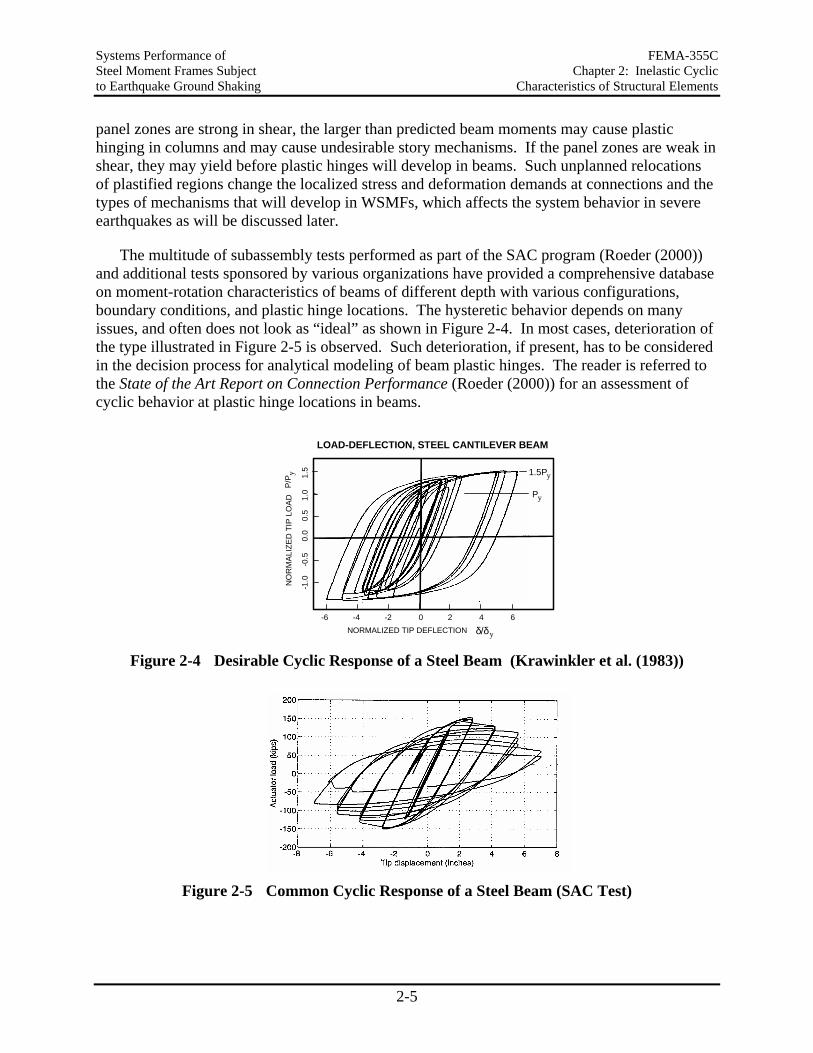
Systems Performance of FEMA-355C Steel Moment Frames Subject Chapter 2: Inelastic Cyclic to Earthquake Ground Shaking Characteristics of Structural Elements
2-5
panel zones are strong in shear, the larger than predicted beam moments may cause plastic hinging in columns and may cause undesirable story mechanisms. If the panel zones are weak in shear, they may yield before plastic hinges will develop in beams. Such unplanned relocations of plastified regions change the localized stress and deformation demands at connections and the types of mechanisms that will develop in WSMFs, which affects the system behavior in severe earthquakes as will be discussed later.
The multitude of subassembly tests performed as part of the SAC program (Roeder (2000)) and additional tests sponsored by various organizations have provided a comprehensive database on moment-rotation characteristics of beams of different depth with various configurations, boundary conditions, and plastic hinge locations. The hysteretic behavior depends on many issues, and often does not look as “ideal” as shown in Figure 2-4. In most cases, deterioration of the type illustrated in Figure 2-5 is observed. Such deterioration, if present, has to be considered in the decision process for analytical modeling of beam plastic hinges. The reader is referred to the State of the Art Report on Connection Performance (Roeder (2000)) for an assessment of cyclic behavior at plastic hinge locations in beams.
Py
1.5Py
-6 -4 -2 0 2 4 6
-1.0
-0
.5
0.0
0
.5
1.0
1
.5
NORMALIZED TIP DEFLECTION δ/δy
NO
RM
ALIZ
ED T
IP L
OAD
P/
P y
LOAD-DEFLECTION, STEEL CANTILEVER BEAM
Figure 2-4 Desirable Cyclic Response of a Steel Beam (Krawinkler et al. (1983))
Figure 2-5 Common Cyclic Response of a Steel Beam (SAC Test)
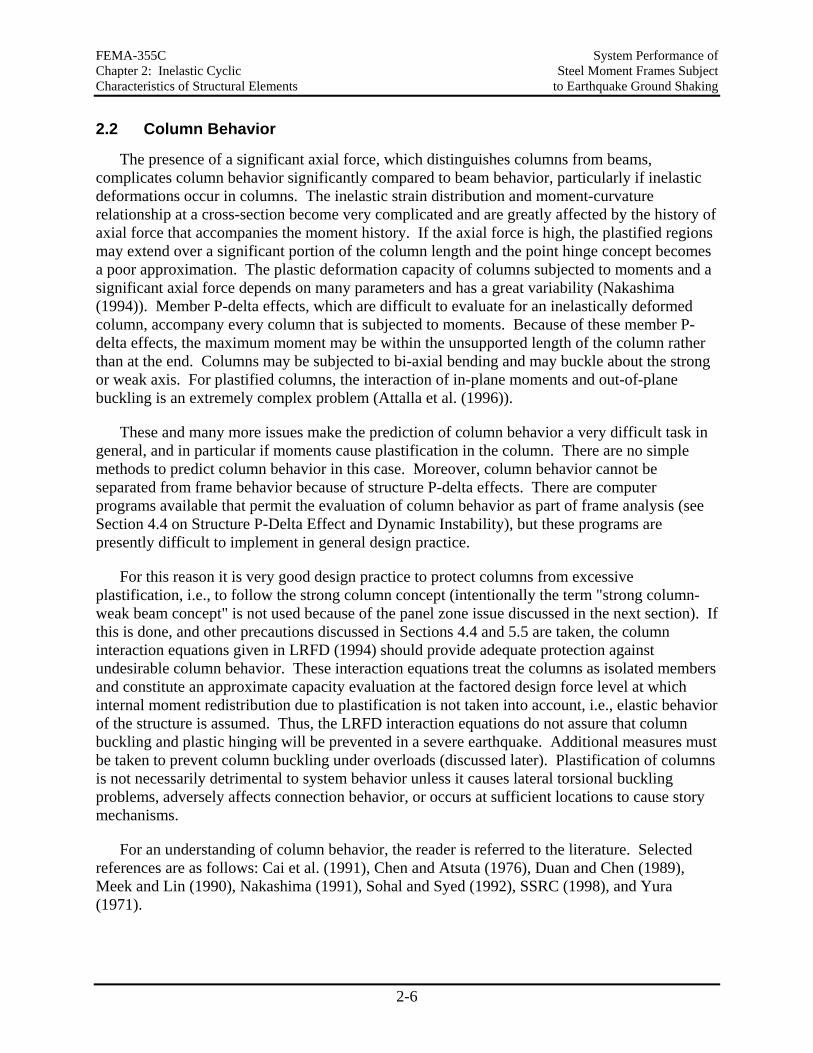
FEMA-355C System Performance of Chapter 2: Inelastic Cyclic Steel Moment Frames Subject Characteristics of Structural Elements to Earthquake Ground Shaking
2-6
2.2 Column Behavior
The presence of a significant axial force, which distinguishes columns from beams, complicates column behavior significantly compared to beam behavior, particularly if inelastic deformations occur in columns. The inelastic strain distribution and moment-curvature relationship at a cross-section become very complicated and are greatly affected by the history of axial force that accompanies the moment history. If the axial force is high, the plastified regions may extend over a significant portion of the column length and the point hinge concept becomes a poor approximation. The plastic deformation capacity of columns subjected to moments and a significant axial force depends on many parameters and has a great variability (Nakashima (1994)). Member P-delta effects, which are difficult to evaluate for an inelastically deformed column, accompany every column that is subjected to moments. Because of these member P-delta effects, the maximum moment may be within the unsupported length of the column rather than at the end. Columns may be subjected to bi-axial bending and may buckle about the strong or weak axis. For plastified columns, the interaction of in-plane moments and out-of-plane buckling is an extremely complex problem (Attalla et al. (1996)).
These and many more issues make the prediction of column behavior a very difficult task in general, and in particular if moments cause plastification in the column. There are no simple methods to predict column behavior in this case. Moreover, column behavior cannot be separated from frame behavior because of structure P-delta effects. There are computer programs available that permit the evaluation of column behavior as part of frame analysis (see Section 4.4 on Structure P-Delta Effect and Dynamic Instability), but these programs are presently difficult to implement in general design practice.
For this reason it is very good design practice to protect columns from excessive plastification, i.e., to follow the strong column concept (intentionally the term "strong column-weak beam concept" is not used because of the panel zone issue discussed in the next section). If this is done, and other precautions discussed in Sections 4.4 and 5.5 are taken, the column interaction equations given in LRFD (1994) should provide adequate protection against undesirable column behavior. These interaction equations treat the columns as isolated members and constitute an approximate capacity evaluation at the factored design force level at which internal moment redistribution due to plastification is not taken into account, i.e., elastic behavior of the structure is assumed. Thus, the LRFD interaction equations do not assure that column buckling and plastic hinging will be prevented in a severe earthquake. Additional measures must be taken to prevent column buckling under overloads (discussed later). Plastification of columns is not necessarily detrimental to system behavior unless it causes lateral torsional buckling problems, adversely affects connection behavior, or occurs at sufficient locations to cause story mechanisms.
For an understanding of column behavior, the reader is referred to the literature. Selected references are as follows: Cai et al. (1991), Chen and Atsuta (1976), Duan and Chen (1989), Meek and Lin (1990), Nakashima (1991), Sohal and Syed (1992), SSRC (1998), and Yura (1971).
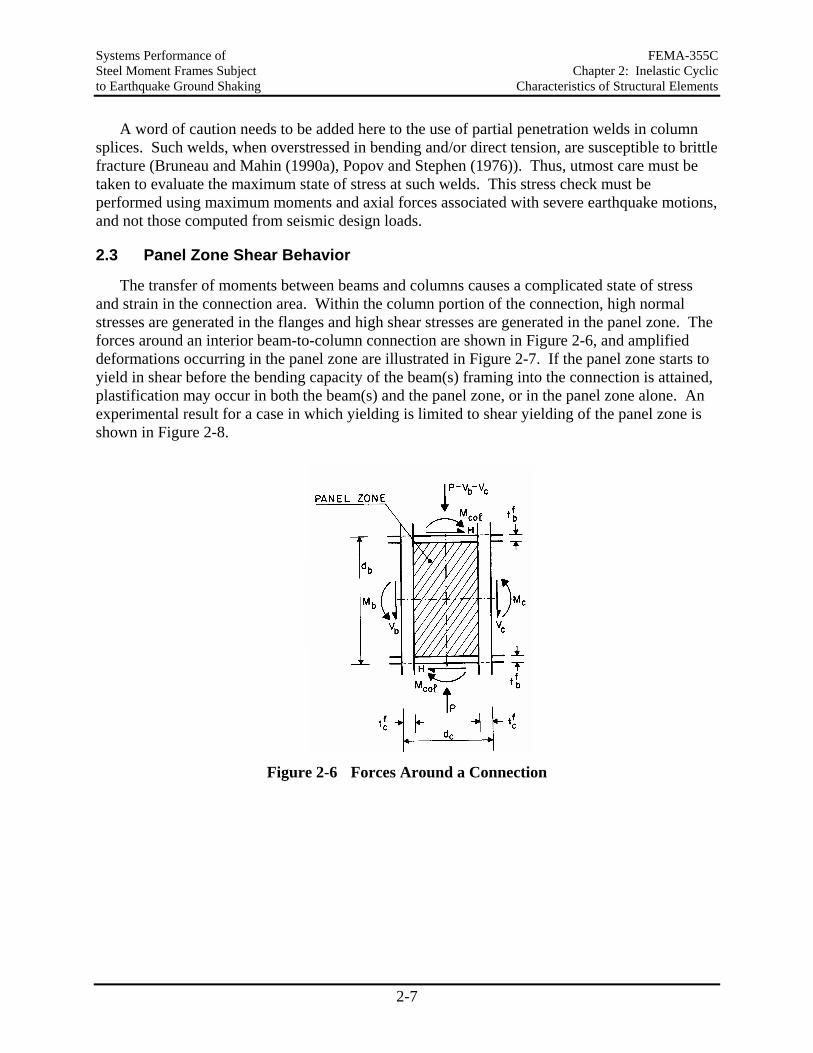
Systems Performance of FEMA-355C Steel Moment Frames Subject Chapter 2: Inelastic Cyclic to Earthquake Ground Shaking Characteristics of Structural Elements
2-7
A word of caution needs to be added here to the use of partial penetration welds in column splices. Such welds, when overstressed in bending and/or direct tension, are susceptible to brittle fracture (Bruneau and Mahin (1990a), Popov and Stephen (1976)). Thus, utmost care must be taken to evaluate the maximum state of stress at such welds. This stress check must be performed using maximum moments and axial forces associated with severe earthquake motions, and not those computed from seismic design loads.
2.3 Panel Zone Shear Behavior
The transfer of moments between beams and columns causes a complicated state of stress and strain in the connection area. Within the column portion of the connection, high normal stresses are generated in the flanges and high shear stresses are generated in the panel zone. The forces around an interior beam-to-column connection are shown in Figure 2-6, and amplified deformations occurring in the panel zone are illustrated in Figure 2-7. If the panel zone starts to yield in shear before the bending capacity of the beam(s) framing into the connection is attained, plastification may occur in both the beam(s) and the panel zone, or in the panel zone alone. An experimental result for a case in which yielding is limited to shear yielding of the panel zone is shown in Figure 2-8.
Figure 2-6 Forces Around a Connection
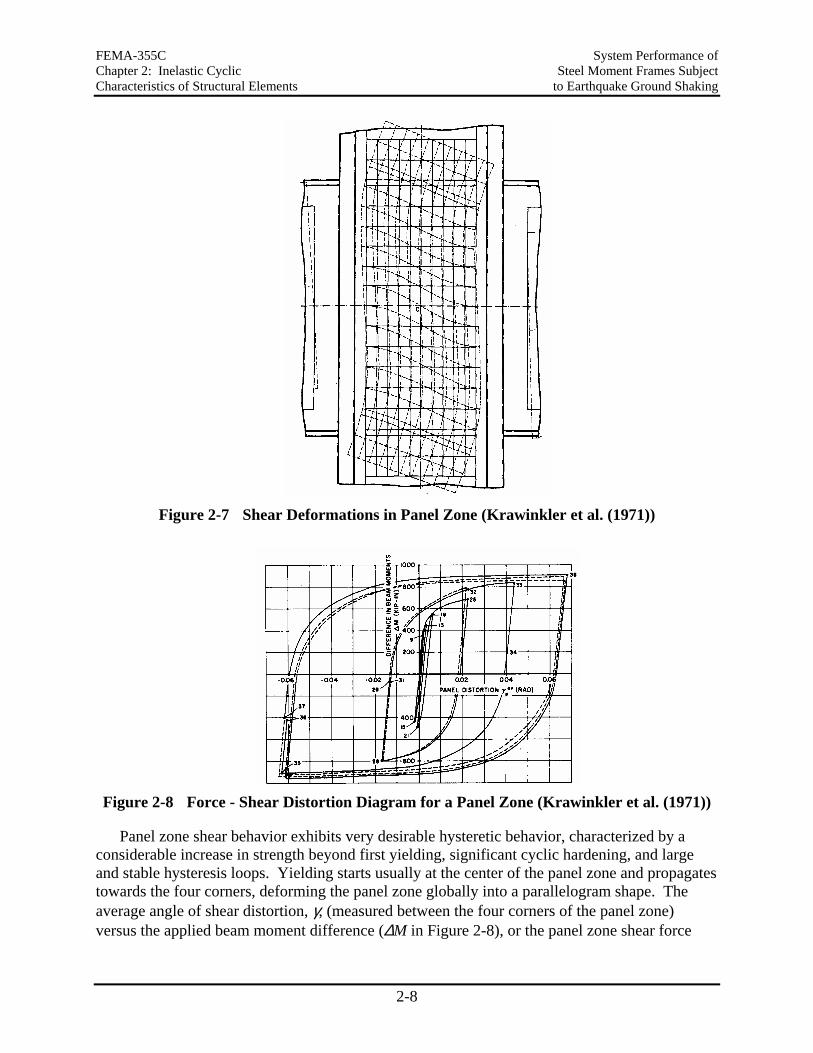
FEMA-355C System Performance of Chapter 2: Inelastic Cyclic Steel Moment Frames Subject Characteristics of Structural Elements to Earthquake Ground Shaking
2-8
Figure 2-7 Shear Deformations in Panel Zone (Krawinkler et al. (1971))
Figure 2-8 Force - Shear Distortion Diagram for a Panel Zone (Krawinkler et al. (1971))
Panel zone shear behavior exhibits very desirable hysteretic behavior, characterized by a considerable increase in strength beyond first yielding, significant cyclic hardening, and large and stable hysteresis loops. Yielding starts usually at the center of the panel zone and propagates towards the four corners, deforming the panel zone globally into a parallelogram shape. The average angle of shear distortion, γ, (measured between the four corners of the panel zone) versus the applied beam moment difference (∆M in Figure 2-8), or the panel zone shear force
Systems Performance of FEMA-355C Steel Moment Frames Subject Chapter 2: Inelastic Cyclic to Earthquake Ground Shaking Characteristics of Structural Elements
2-9
estimated from the forces shown in Figure 2-6, are usually employed to describe the panel zone shear behavior. Because of the desirable hysteretic characteristics of panel zones it appears to be attractive to have these elements participate in the energy dissipation during severe earthquakes. This can be achieved by tuning the relative strength of members framing into the joint as will be discussed later.
The fact that panel zones deform in shear may have a significant effect on the lateral displacements of WSMFs, and may have also a significant effect on the lateral load resistance if the shear strength of panel zones is low. As Figure 2-9 illustrates, lateral displacements in WSMF subassemblies are caused by flexural deformations in beams (δr) and columns (δc), and by panel zone shear deformations (δp). The displacement component caused by panel zone shear deformations, which can be estimated as:
( )a bp p p bh dδ δ δ λ= + = − (2-1)
is in many practical cases a significant component of the total lateral displacement, particularly if the panel zone is weak in shear and will yield under earthquake loading. The effect of panel zones on the strength, stiffness, and deformation demands for steel frames has been the subject of much research (Krawinkler and Mohasseb (1987), Tsai and Popov (1990), Liew and Chen (1996), Schneider and Amidi (1998)). The effect of interaction between the beams, columns, and panel zones is summarized in Section 4.2, and the importance of panel zone strength and stiffness on local and global seismic demands is discussed in Chapter 5.
It is a widely used practice to ignore the effects of joint shear distortion and shear strength on the lateral stiffness and strength of WSMFs, and to perform analysis with centerline dimensions of beams and columns. In stiffness (or lateral displacement) calculations, the argument is that the use of centerline dimensions compensates for the disregard of panel zone shear deformations and that stiffness estimates based on bare frame properties are only approximations anyway because of the disregard of nonstructural contributions. In strength calculations, the argument is that an accurate evaluation of strength is desirable but not critical in the evaluation of seismic performance.
These arguments need to be questioned for several reasons. In stiffness calculations, the use of centerline dimensions gives a very distorted picture of the relative importance of beam versus column stiffness in drift control. If centerline dimensions are used for columns rather than clear span dimensions, the contributions of the column flexural deformations to interstory drift can easily be overestimated by a factor of two or more. In strength calculations, the disregard of the panel zone shear strength may give a very distorted picture of the locations of plastified regions in a WSMF. Panel zones that fulfill post-1985 and pre-2000 code design requirements may be so weak in shear that they yield long before the plastic moment capacity of the beams framing into the column is attained. In such cases it is possible that all plastic deformations are located in panel zones, and the beams will never attain their bending strength and will remain essentially elastic in severe earthquakes. Again, one may want to argue that this is not critical since the shear behavior of panel zones is very ductile. However, in view of the observed failures at welded beam-to-column connections, it becomes an important issue to find out where
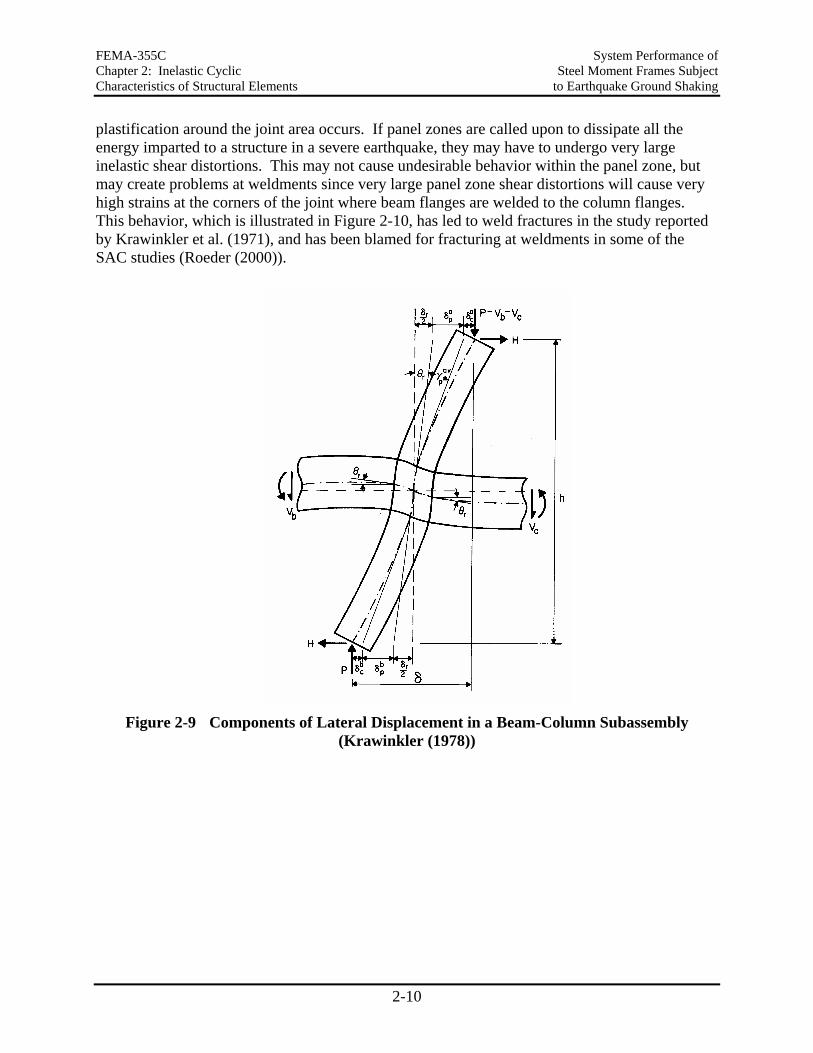
FEMA-355C System Performance of Chapter 2: Inelastic Cyclic Steel Moment Frames Subject Characteristics of Structural Elements to Earthquake Ground Shaking
2-10
plastification around the joint area occurs. If panel zones are called upon to dissipate all the energy imparted to a structure in a severe earthquake, they may have to undergo very large inelastic shear distortions. This may not cause undesirable behavior within the panel zone, but may create problems at weldments since very large panel zone shear distortions will cause very high strains at the corners of the joint where beam flanges are welded to the column flanges. This behavior, which is illustrated in Figure 2-10, has led to weld fractures in the study reported by Krawinkler et al. (1971), and has been blamed for fracturing at weldments in some of the SAC studies (Roeder (2000)).
Figure 2-9 Components of Lateral Displacement in a Beam-Column Subassembly
(Krawinkler (1978))
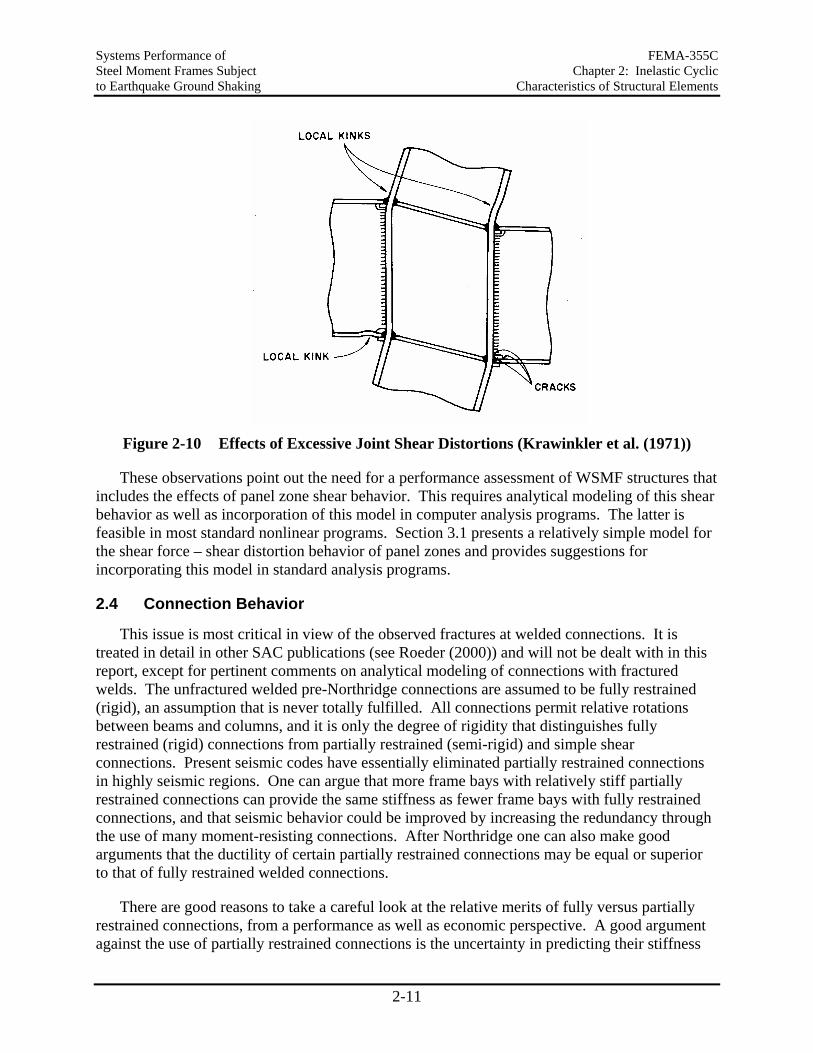
Systems Performance of FEMA-355C Steel Moment Frames Subject Chapter 2: Inelastic Cyclic to Earthquake Ground Shaking Characteristics of Structural Elements
2-11
Figure 2-10 Effects of Excessive Joint Shear Distortions (Krawinkler et al. (1971))
These observations point out the need for a performance assessment of WSMF structures that includes the effects of panel zone shear behavior. This requires analytical modeling of this shear behavior as well as incorporation of this model in computer analysis programs. The latter is feasible in most standard nonlinear programs. Section 3.1 presents a relatively simple model for the shear force – shear distortion behavior of panel zones and provides suggestions for incorporating this model in standard analysis programs.
2.4 Connection Behavior
This issue is most critical in view of the observed fractures at welded connections. It is treated in detail in other SAC publications (see Roeder (2000)) and will not be dealt with in this report, except for pertinent comments on analytical modeling of connections with fractured welds. The unfractured welded pre-Northridge connections are assumed to be fully restrained (rigid), an assumption that is never totally fulfilled. All connections permit relative rotations between beams and columns, and it is only the degree of rigidity that distinguishes fully restrained (rigid) connections from partially restrained (semi-rigid) and simple shear connections. Present seismic codes have essentially eliminated partially restrained connections in highly seismic regions. One can argue that more frame bays with relatively stiff partially restrained connections can provide the same stiffness as fewer frame bays with fully restrained connections, and that seismic behavior could be improved by increasing the redundancy through the use of many moment-resisting connections. After Northridge one can also make good arguments that the ductility of certain partially restrained connections may be equal or superior to that of fully restrained welded connections.
There are good reasons to take a careful look at the relative merits of fully versus partially restrained connections, from a performance as well as economic perspective. A good argument against the use of partially restrained connections is the uncertainty in predicting their stiffness
FEMA-355C System Performance of Chapter 2: Inelastic Cyclic Steel Moment Frames Subject Characteristics of Structural Elements to Earthquake Ground Shaking
2-12
and strength. Time and research can greatly reduce this uncertainty. Today much more is known about the stiffness and strength properties of partially restrained (and simple) connections than was known at the time when fully restrained connections became the standard in highly seismic regions. Familiarity with the literature on partially restrained connections is much encouraged. Good examples of papers on the behavior of partially restrained connections and the seismic performance of frames with such connections are: Ackroyd and Gerstle (1982), Altman et al. (1982), Astaneh-Asl et al. (1991), Astaneh-Asl, (1995), Attiogbe and Morris (1991), Bjorhovde et al. (1990), Deierlein and Yhao (1992), Frye and Morris (1975), Ghobarah et al. ( 1990), Kishi and Chen (1990), Leon and Forcier (1991), Leon et al. (1996), Leon (1997), Murray and Watson (1996), Nader and Astaneh-Asl (1991), Sivakumaran and Chen (1994), and Tsai and Popov (1990). Chapter 7 summarizes the analytical work that has been done in the SAC program on the behavior of frames with partially restrained connections.
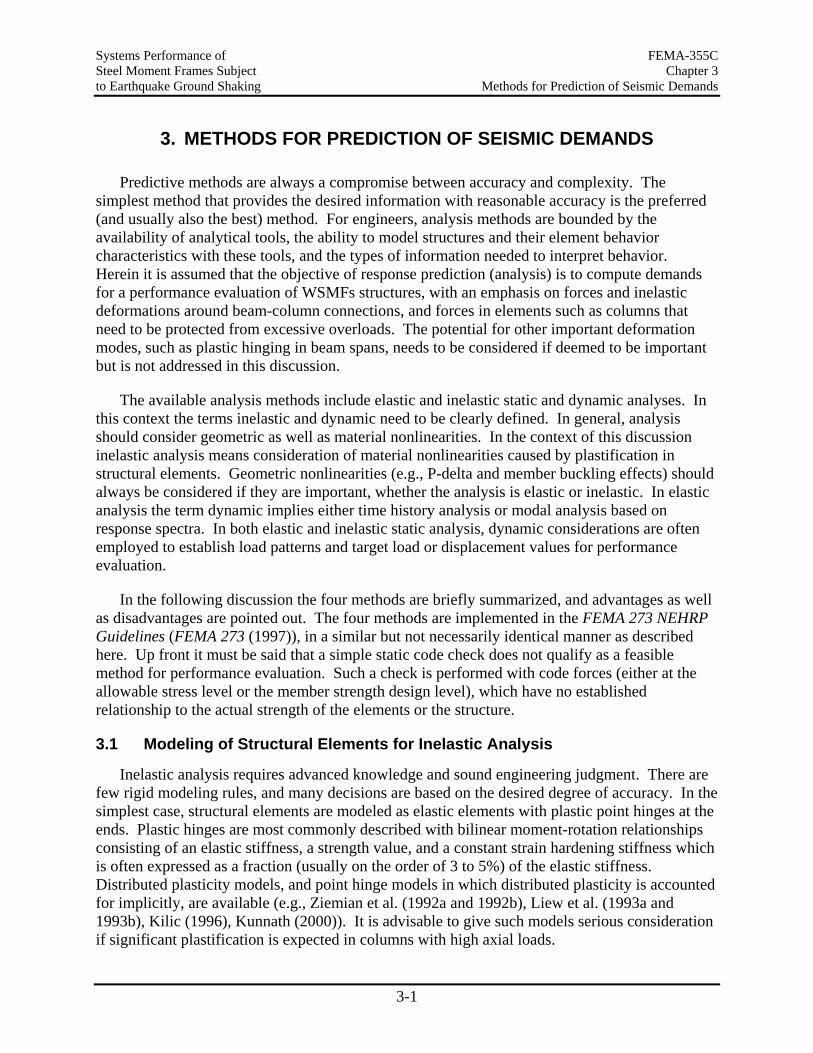
Systems Performance of FEMA-355C Steel Moment Frames Subject Chapter 3 to Earthquake Ground Shaking Methods for Prediction of Seismic Demands
3-1
3. METHODS FOR PREDICTION OF SEISMIC DEMANDS
Predictive methods are always a compromise between accuracy and complexity. The simplest method that provides the desired information with reasonable accuracy is the preferred (and usually also the best) method. For engineers, analysis methods are bounded by the availability of analytical tools, the ability to model structures and their element behavior characteristics with these tools, and the types of information needed to interpret behavior. Herein it is assumed that the objective of response prediction (analysis) is to compute demands for a performance evaluation of WSMFs structures, with an emphasis on forces and inelastic deformations around beam-column connections, and forces in elements such as columns that need to be protected from excessive overloads. The potential for other important deformation modes, such as plastic hinging in beam spans, needs to be considered if deemed to be important but is not addressed in this discussion.
The available analysis methods include elastic and inelastic static and dynamic analyses. In this context the terms inelastic and dynamic need to be clearly defined. In general, analysis should consider geometric as well as material nonlinearities. In the context of this discussion inelastic analysis means consideration of material nonlinearities caused by plastification in structural elements. Geometric nonlinearities (e.g., P-delta and member buckling effects) should always be considered if they are important, whether the analysis is elastic or inelastic. In elastic analysis the term dynamic implies either time history analysis or modal analysis based on response spectra. In both elastic and inelastic static analysis, dynamic considerations are often employed to establish load patterns and target load or displacement values for performance evaluation.
In the following discussion the four methods are briefly summarized, and advantages as well as disadvantages are pointed out. The four methods are implemented in the FEMA 273 NEHRP Guidelines (FEMA 273 (1997)), in a similar but not necessarily identical manner as described here. Up front it must be said that a simple static code check does not qualify as a feasible method for performance evaluation. Such a check is performed with code forces (either at the allowable stress level or the member strength design level), which have no established relationship to the actual strength of the elements or the structure.
3.1 Modeling of Structural Elements for Inelastic Analysis
Inelastic analysis requires advanced knowledge and sound engineering judgment. There are few rigid modeling rules, and many decisions are based on the desired degree of accuracy. In the simplest case, structural elements are modeled as elastic elements with plastic point hinges at the ends. Plastic hinges are most commonly described with bilinear moment-rotation relationships consisting of an elastic stiffness, a strength value, and a constant strain hardening stiffness which is often expressed as a fraction (usually on the order of 3 to 5%) of the elastic stiffness. Distributed plasticity models, and point hinge models in which distributed plasticity is accounted for implicitly, are available (e.g., Ziemian et al. (1992a and 1992b), Liew et al. (1993a and 1993b), Kilic (1996), Kunnath (2000)). It is advisable to give such models serious consideration if significant plastification is expected in columns with high axial loads.
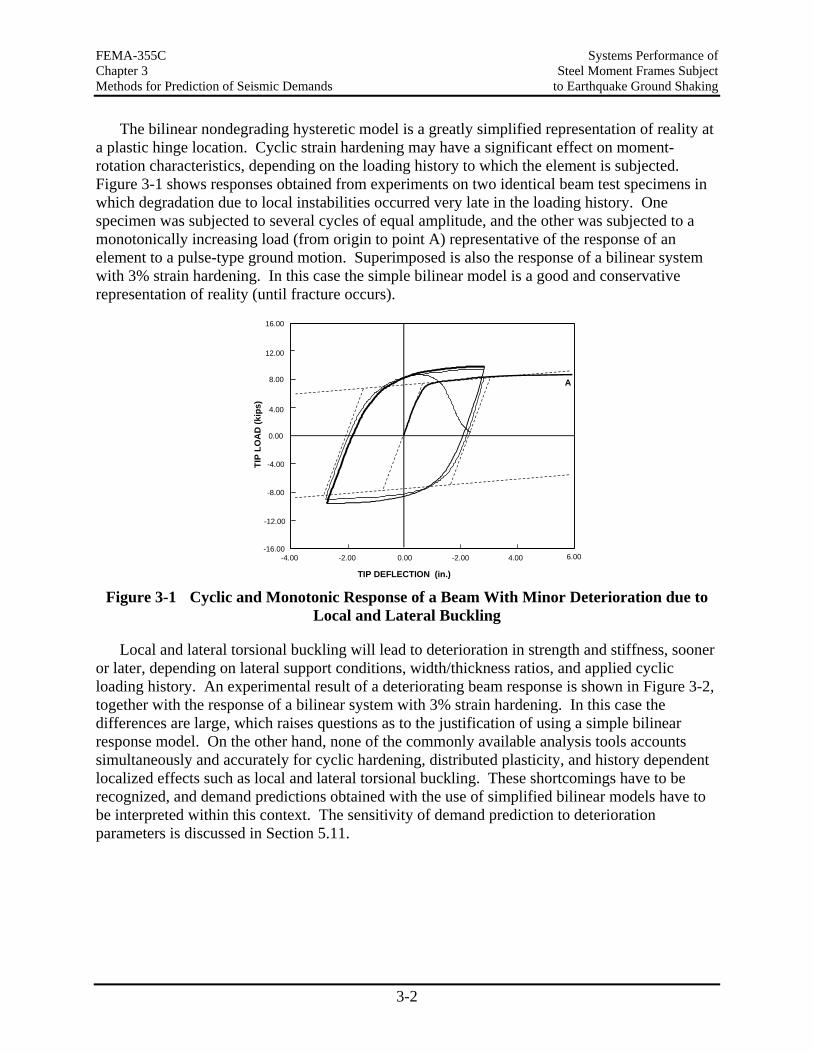
FEMA-355C Systems Performance of Chapter 3 Steel Moment Frames Subject Methods for Prediction of Seismic Demands to Earthquake Ground Shaking
3-2
The bilinear nondegrading hysteretic model is a greatly simplified representation of reality at a plastic hinge location. Cyclic strain hardening may have a significant effect on moment-rotation characteristics, depending on the loading history to which the element is subjected. Figure 3-1 shows responses obtained from experiments on two identical beam test specimens in which degradation due to local instabilities occurred very late in the loading history. One specimen was subjected to several cycles of equal amplitude, and the other was subjected to a monotonically increasing load (from origin to point A) representative of the response of an element to a pulse-type ground motion. Superimposed is also the response of a bilinear system with 3% strain hardening. In this case the simple bilinear model is a good and conservative representation of reality (until fracture occurs).
0.00 4.00-4.00 -2.00 -2.00
TIP DEFLECTION (in.)
TIP
LO
AD
(ki
ps)
0.00
-8.00
-4.00
4.00
8.00
12.00
-12.00
-16.00
16.00
A
6.00
Figure 3-1 Cyclic and Monotonic Response of a Beam With Minor Deterioration due to
Local and Lateral Buckling
Local and lateral torsional buckling will lead to deterioration in strength and stiffness, sooner or later, depending on lateral support conditions, width/thickness ratios, and applied cyclic loading history. An experimental result of a deteriorating beam response is shown in Figure 3-2, together with the response of a bilinear system with 3% strain hardening. In this case the differences are large, which raises questions as to the justification of using a simple bilinear response model. On the other hand, none of the commonly available analysis tools accounts simultaneously and accurately for cyclic hardening, distributed plasticity, and history dependent localized effects such as local and lateral torsional buckling. These shortcomings have to be recognized, and demand predictions obtained with the use of simplified bilinear models have to be interpreted within this context. The sensitivity of demand prediction to deterioration parameters is discussed in Section 5.11.
Systems Performance of FEMA-355C Steel Moment Frames Subject Chapter 3 to Earthquake Ground Shaking Methods for Prediction of Seismic Demands
3-3
Figure 3-2 Cyclic Response of a Beam with Significant Deterioration due to Local and
Lateral Buckling
3.1.1 Modeling of Post-Fracture Behavior at Welded Connections
Significant complexity is added if post-fracture behavior has to be modeled around welded fully restrained (FR) connections. Many different types of fractures were observed in the Northridge earthquake and in tests on beam-column subassemblies, and the post-fracture response varies significantly with the type of fracture. Only few experiments have been performed in which tests were continued after weld fracture occurred. Thus, the documentation of post-fracture response characteristics is scarce, and analytical modeling has to rely on simplifying assumptions.
One way of modeling post-fracture behavior is by means of fiber elements. In this approach the elements are modeled with a series of longitudinal fibers, and fracture of individual fibers can be associated with a predetermined level of strain or stress. This approach presumes that the fracture strain (stress) is known and that critical strains can be computed accurately in the analysis. Fiber elements are built into several analysis programs (e.g., Powell and Campbell (1994), Challa and Hall (1994)), but are primarily employed as research tools. The reader is referred to the references for further information.
If fracture causes separation of the beam flange from the column flange, the beam moment-rotation response at the column face can be represented by either a single rotational spring or a series of springs that represent the deteriorating properties at the beam-column interface. Several models are available for this purpose (Foutch and Shi (1996), Maison and Kasai (1997)). One model proposed by the writer, in which pre- and post-fracture strength and stiffness properties are input quantities and may incorporate shear tab and slab contributions, is presented here and is illustrated in Figure 3-3. This model is based on the following assumptions:
• The beam between connections can be modeled as an elastic element. Its stiffness is given by the beam alone, or it may include the slab effect.
FEMA-355C Systems Performance of Chapter 3 Steel Moment Frames Subject Methods for Prediction of Seismic Demands to Earthquake Ground Shaking
3-4
• All inelastic deformations in the beam, the slab (if considered), and the joining media, can be modeled by means of a spring at the beam end, that is, at the column face. (This is concentrated plasticity.)
• There are six bending strengths to be considered:
− Mp+ = positive bending strength (tension at bottom) before fracture (may include
effect of slab in compression) − Mp
- = negative bending strength before fracture (may include effect of slab in tension)
− M1+ = positive bending strength after bottom flange weld has fractured but top flange
is active in compression (unfractured or closed crack). Bending resistance comes from tension force and moment in web connections and compression resistance in top flange (and slab, if considered).
− M1- = negative bending strength after top flange weld has fractured but bottom flange
is active in compression (unfractured or closed crack). Bending resistance comes from tension force and moment in web connection and compression resistance in bottom flange, as well as from tension in slab (if considered).
− M2+ = positive bending strength after both top and bottom flange welds have fractured
and both cracks are open. Bending resistance comes from moment in web connection, and tension in web connection plus compression in slab (if considered).
− M2- = negative bending strength after both top and bottom flange welds have
fractured and both cracks are open. Bending resistance comes from moment in web connection, and compression in web connection plus tension in slab (if considered).
• Fracture may occur in either top or bottom flange weld, or in both welds.
• Weld fracture occurs when either the maximum or the cumulative plastic rotation at the spring reaches a predefined value. Cumulative plastic rotation is used as an alternative to maximum plastic rotation because all damaging excursions count.
• The "elastic" stiffness Ko of the spring is assumed to be close to infinite, i.e., it is assumed that no inelastic deformations take place in the beam and slab, and that no deformations (elastic or inelastic) occur in the connection until "strength" is attained. This stiffness can be adjusted if elastic deformations in the connection do indeed take place.
• Even after fracture it is assumed that the unloading stiffness of the spring remains constant (for simplicity only).
• When first fracture occurs, the strength drops (with a high negative stiffness) from the Mp value to the M1 value, regardless of the level of rotation (i.e., it is assumed that the M1 strength is mobilized immediately, which may be optimistic but is assumed for simplicity).
• When a crack is open, the hysteretic response is controlled by the M1 strengths (or the M2 strengths if both cracks are open), a close to infinite unloading stiffness, and a peak oriented reloading stiffness, until the rotation associated with the last crack opening is attained. At this instance the crack closes and the strength increases (with close to infinite stiffness if the
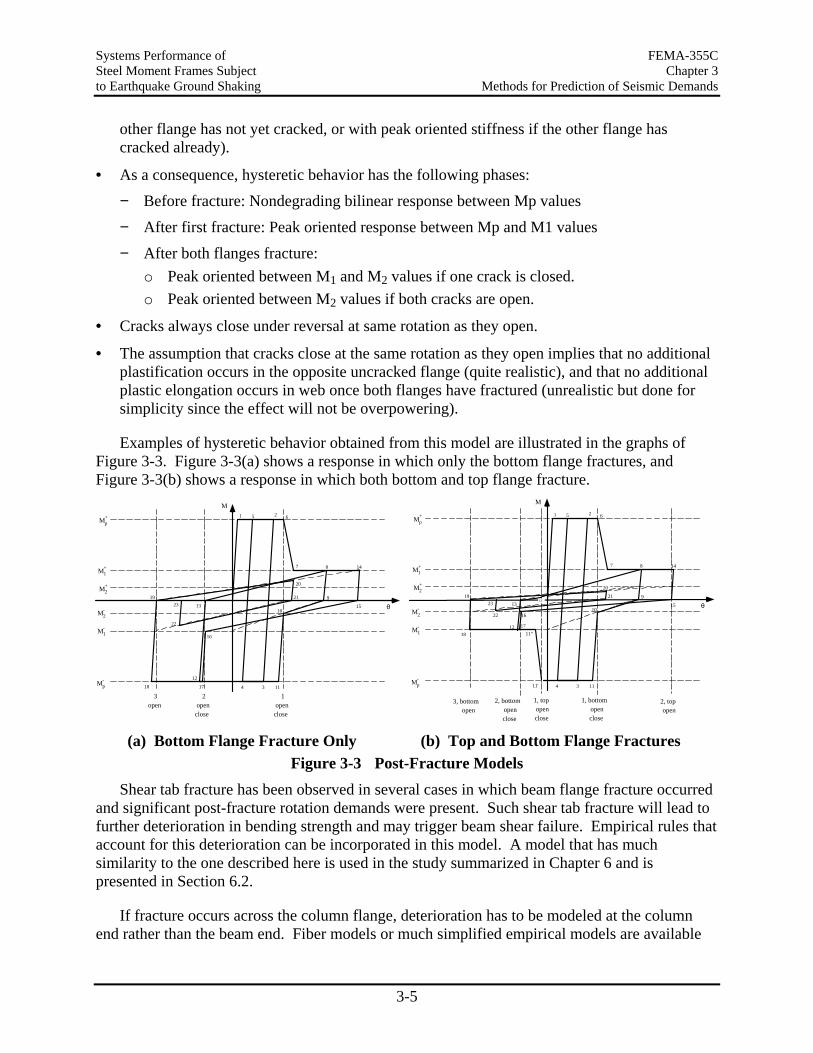
Systems Performance of FEMA-355C Steel Moment Frames Subject Chapter 3 to Earthquake Ground Shaking Methods for Prediction of Seismic Demands
3-5
other flange has not yet cracked, or with peak oriented stiffness if the other flange has cracked already).
• As a consequence, hysteretic behavior has the following phases: − Before fracture: Nondegrading bilinear response between Mp values − After first fracture: Peak oriented response between Mp and M1 values − After both flanges fracture:
o Peak oriented between M1 and M2 values if one crack is closed. o Peak oriented between M2 values if both cracks are open.
• Cracks always close under reversal at same rotation as they open.
• The assumption that cracks close at the same rotation as they open implies that no additional plastification occurs in the opposite uncracked flange (quite realistic), and that no additional plastic elongation occurs in web once both flanges have fractured (unrealistic but done for simplicity since the effect will not be overpowering).
Examples of hysteretic behavior obtained from this model are illustrated in the graphs of Figure 3-3. Figure 3-3(a) shows a response in which only the bottom flange fractures, and Figure 3-3(b) shows a response in which both bottom and top flange fracture.
Mp+
M1+
M2+
Mp-
M1-
M2-
M
θ
1 open close
2 open close
3 open
1 2
34
5 6
7 8
9
10
11
12
13
14
15
16
1718
19
20
21
22
23
Mp+
M1+
M2+
Mp-
M1-
M2-
M
θ
1, bottom open close
1, top open close
3, bottom open
1 2
34
5 6
7 8
9
10
1111'
13
14
15
18
19
20
21
22
23
2, bottom open close
13'
11"12
2, top open
17
16
(a) Bottom Flange Fracture Only (b) Top and Bottom Flange Fractures
Figure 3-3 Post-Fracture Models Shear tab fracture has been observed in several cases in which beam flange fracture occurred
and significant post-fracture rotation demands were present. Such shear tab fracture will lead to further deterioration in bending strength and may trigger beam shear failure. Empirical rules that account for this deterioration can be incorporated in this model. A model that has much similarity to the one described here is used in the study summarized in Chapter 6 and is presented in Section 6.2.
If fracture occurs across the column flange, deterioration has to be modeled at the column end rather than the beam end. Fiber models or much simplified empirical models are available

FEMA-355C Systems Performance of Chapter 3 Steel Moment Frames Subject Methods for Prediction of Seismic Demands to Earthquake Ground Shaking
3-6
for this purpose. One simple model is summarized in Section 6.2. Again, springs can be employed to model deterioration. In concept, the spring properties will depend on the depth to which cracks propagate into the column. Several cases are documented in which the fracture extended across the entire column section and noticeable horizontal offset was observed at the fracture surfaces. In such cases column uplift needs to be permitted, and the post-fracture bending strength is zero if the column is in tension and is related to the column axial load if the column is in compression. The column will also lose its shear resistance if in tension. To the writer’s knowledge no empirical model that considers all these issue is available at this time.
3.1.2 Modeling of Beams with Post-Northridge Connections
Guidelines such as FEMA 267 (1995), published after the Northridge earthquake, recommend design practices aimed at forcing of the plastic hinge in the beam away from the face of the column. Designs using the FEMA 267 guidelines are termed as “post-Northridge” designs. The movement of the plastic hinge away from the column face is induced by either increasing the capacity of the beam at the column face by addition of cover plates onto the beam flanges, and/or by reducing the strength of the beam at a distance away from the face of the column by reducing the beam flange material (reduced beam sections, RBS). Other techniques, like use of haunches or ribs, are aimed at similar outcomes.
The modeling of beams with post-Northridge connections needs to consider the following different features: 1) the plastic hinge is located at a distance away from the face of the column and may have a strength which is different from the strength of the bare beam (as in the case of reduced beam sections), 2) there is an additional element with varying strength and stiffness properties between the location of the plastic hinge and the face of the column, 3) the beam between the two plastic hinges may have a varying stiffness for reduced beam sections (RBS), and 4) a possibility exists for an additional plastic hinge formation at the face of the column.
For the post-Northridge structures designed as part of the SAC program (see Appendix B) the following simplifying assumptions were made in analytical modeling: 1) the zone of plasticity away from the column face can be approximated as a point plastic hinge with strength equal to that of the full beam section (for cover plated designs) or the reduced beam section (the contribution of the floor slab to strength deserves consideration), 2) the element between the column face and the plastic hinge can be modeled as a beam element with a uniform stiffness equal to the average of the stiffnesses at the face of the column and at the location of the plastic hinge, and a strength equal to the strength at the face of the column, and 3) the beam between the two plastic hinge locations can be modeled as an element of uniform stiffness because a reduction in section over a relatively small length (RBS) has little effect on global behavior.
Such a simplified model should be capable of representing all the major behavioral characteristics adequately and without undue complications. The location of the plastic hinges and the strength of the sections are determined as per the FEMA 267 recommendations coupled with the design details for the cover plates and the reduced beam sections.
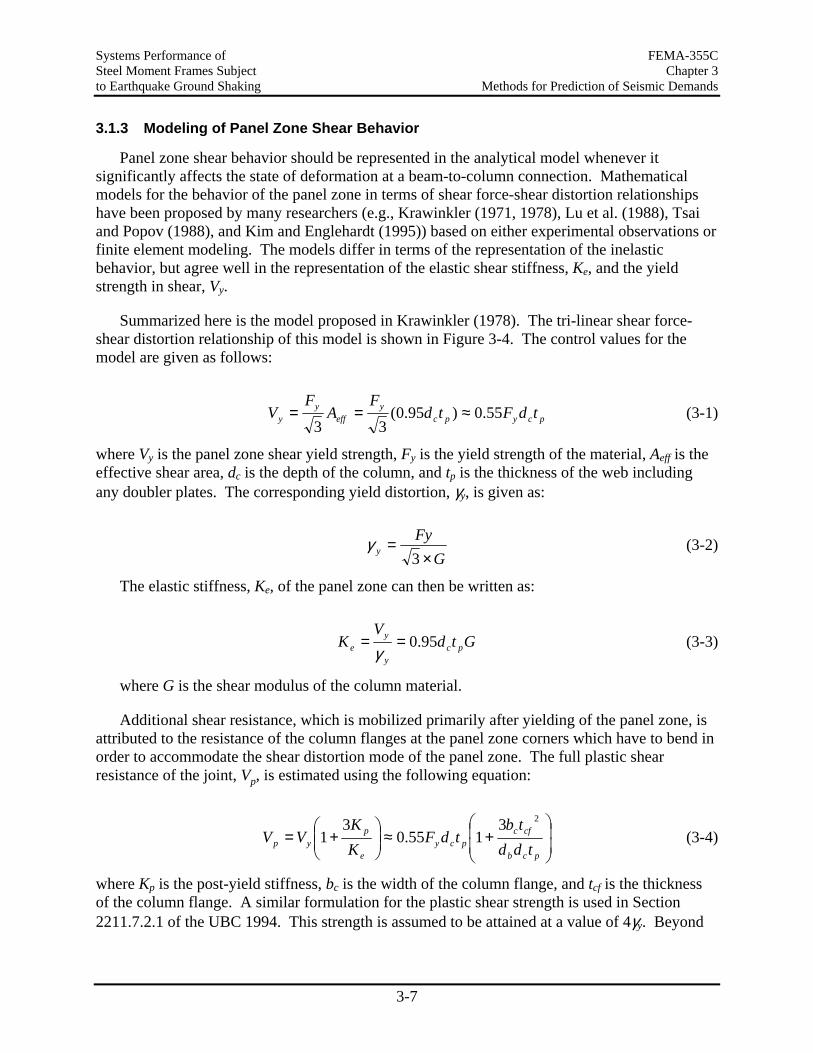
Systems Performance of FEMA-355C Steel Moment Frames Subject Chapter 3 to Earthquake Ground Shaking Methods for Prediction of Seismic Demands
3-7
3.1.3 Modeling of Panel Zone Shear Behavior
Panel zone shear behavior should be represented in the analytical model whenever it significantly affects the state of deformation at a beam-to-column connection. Mathematical models for the behavior of the panel zone in terms of shear force-shear distortion relationships have been proposed by many researchers (e.g., Krawinkler (1971, 1978), Lu et al. (1988), Tsai and Popov (1988), and Kim and Englehardt (1995)) based on either experimental observations or finite element modeling. The models differ in terms of the representation of the inelastic behavior, but agree well in the representation of the elastic shear stiffness, Ke, and the yield strength in shear, Vy.
Summarized here is the model proposed in Krawinkler (1978). The tri-linear shear force-shear distortion relationship of this model is shown in Figure 3-4. The control values for the model are given as follows:
pcypcy
effy
y tdFtdF
AF
V 55.0)95.0(33
≈== (3-1)
where Vy is the panel zone shear yield strength, Fy is the yield strength of the material, Aeff is the effective shear area, dc is the depth of the column, and tp is the thickness of the web including any doubler plates. The corresponding yield distortion, γy, is given as:
G
Fyy ×
=3
γ (3-2)
The elastic stiffness, Ke, of the panel zone can then be written as:
GtdV
K pcy
ye 95.0==
γ (3-3)
where G is the shear modulus of the column material.
Additional shear resistance, which is mobilized primarily after yielding of the panel zone, is attributed to the resistance of the column flanges at the panel zone corners which have to bend in order to accommodate the shear distortion mode of the panel zone. The full plastic shear resistance of the joint, Vp, is estimated using the following equation:
+≈
+=
pcb
cfcpcy
e
pyp tdd
tbtdF
KK
VV23
155.03
1 (3-4)
where Kp is the post-yield stiffness, bc is the width of the column flange, and tcf is the thickness of the column flange. A similar formulation for the plastic shear strength is used in Section 2211.7.2.1 of the UBC 1994. This strength is assumed to be attained at a value of 4γy. Beyond
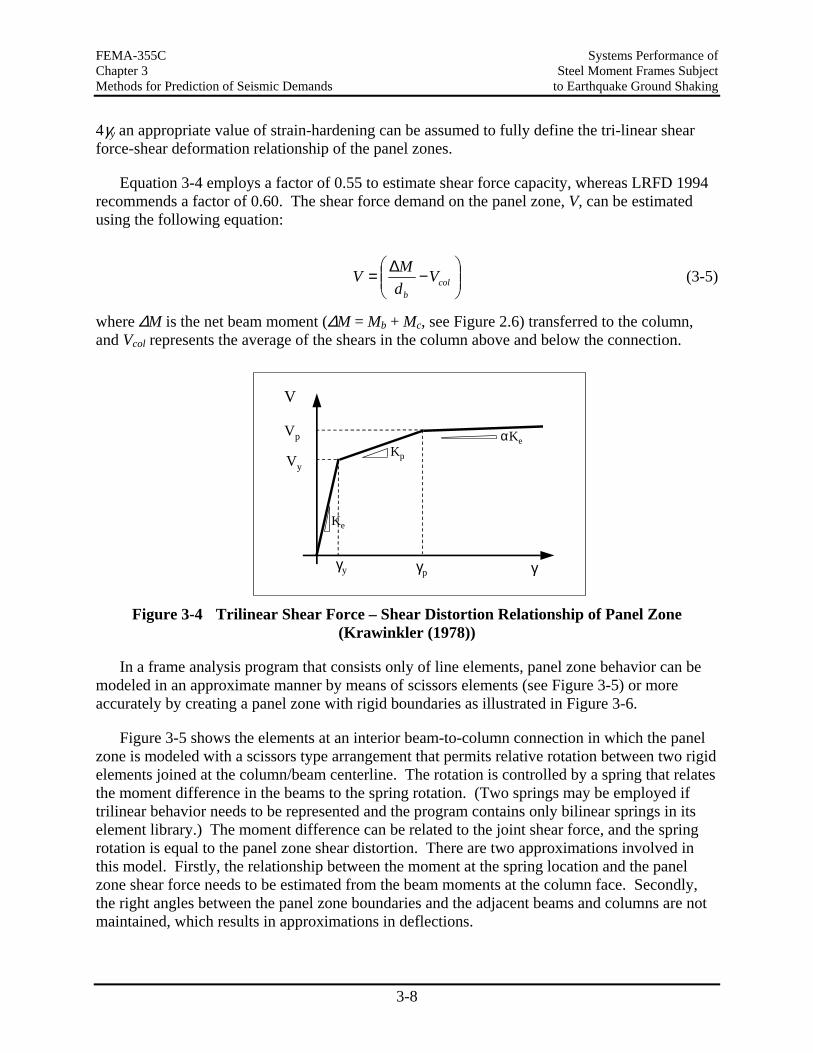
FEMA-355C Systems Performance of Chapter 3 Steel Moment Frames Subject Methods for Prediction of Seismic Demands to Earthquake Ground Shaking
3-8
4γy an appropriate value of strain-hardening can be assumed to fully define the tri-linear shear force-shear deformation relationship of the panel zones.
Equation 3-4 employs a factor of 0.55 to estimate shear force capacity, whereas LRFD 1994 recommends a factor of 0.60. The shear force demand on the panel zone, V, can be estimated using the following equation:
−∆= col
b
VdMV (3-5)
where ∆M is the net beam moment (∆M = Mb + Mc, see Figure 2.6) transferred to the column, and Vcol represents the average of the shears in the column above and below the connection.
γpγy γ
Vy
Vp
V
Ke
Kp
αKe
Figure 3-4 Trilinear Shear Force – Shear Distortion Relationship of Panel Zone
(Krawinkler (1978))
In a frame analysis program that consists only of line elements, panel zone behavior can be modeled in an approximate manner by means of scissors elements (see Figure 3-5) or more accurately by creating a panel zone with rigid boundaries as illustrated in Figure 3-6.
Figure 3-5 shows the elements at an interior beam-to-column connection in which the panel zone is modeled with a scissors type arrangement that permits relative rotation between two rigid elements joined at the column/beam centerline. The rotation is controlled by a spring that relates the moment difference in the beams to the spring rotation. (Two springs may be employed if trilinear behavior needs to be represented and the program contains only bilinear springs in its element library.) The moment difference can be related to the joint shear force, and the spring rotation is equal to the panel zone shear distortion. There are two approximations involved in this model. Firstly, the relationship between the moment at the spring location and the panel zone shear force needs to be estimated from the beam moments at the column face. Secondly, the right angles between the panel zone boundaries and the adjacent beams and columns are not maintained, which results in approximations in deflections.
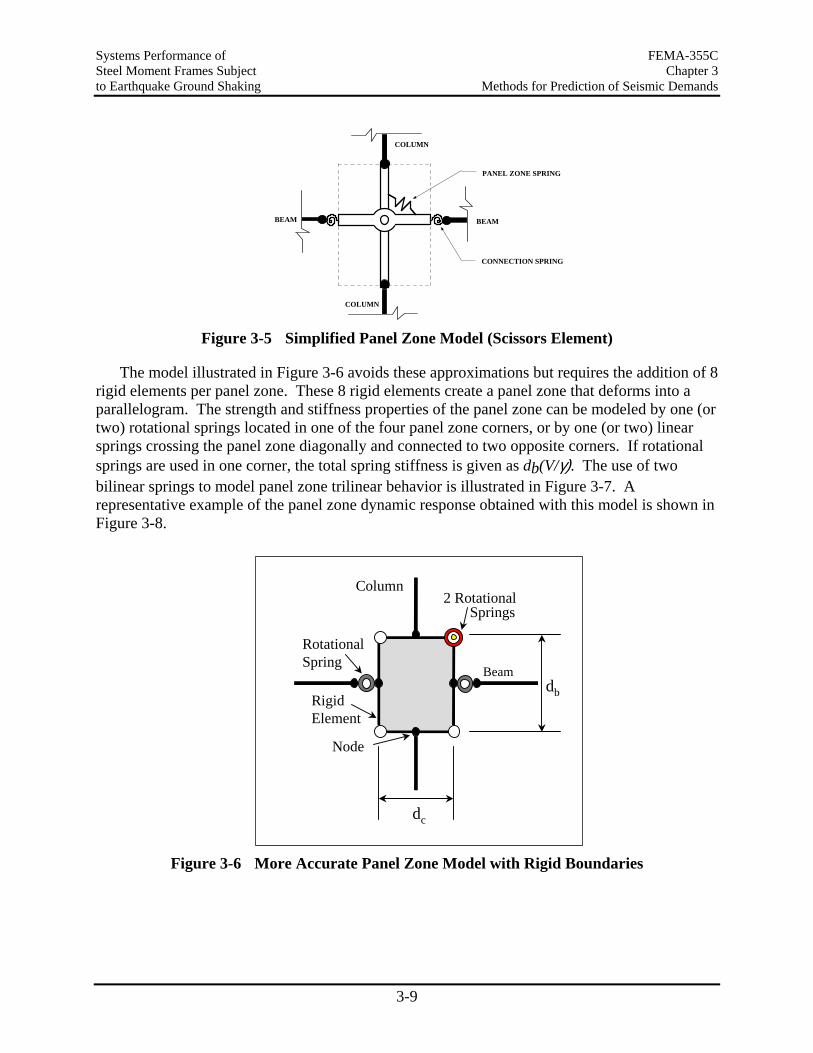
Systems Performance of FEMA-355C Steel Moment Frames Subject Chapter 3 to Earthquake Ground Shaking Methods for Prediction of Seismic Demands
3-9
BEAMBEAM
COLUMN
COLUMN
CONNECTION SPRING
PANEL ZONE SPRING
Figure 3-5 Simplified Panel Zone Model (Scissors Element)
The model illustrated in Figure 3-6 avoids these approximations but requires the addition of 8 rigid elements per panel zone. These 8 rigid elements create a panel zone that deforms into a parallelogram. The strength and stiffness properties of the panel zone can be modeled by one (or two) rotational springs located in one of the four panel zone corners, or by one (or two) linear springs crossing the panel zone diagonally and connected to two opposite corners. If rotational springs are used in one corner, the total spring stiffness is given as db(V/γ). The use of two bilinear springs to model panel zone trilinear behavior is illustrated in Figure 3-7. A representative example of the panel zone dynamic response obtained with this model is shown in Figure 3-8.
Beam
Column
Node
2 RotationalSprings
RotationalSpring
db
dc
RigidElement
Figure 3-6 More Accurate Panel Zone Model with Rigid Boundaries
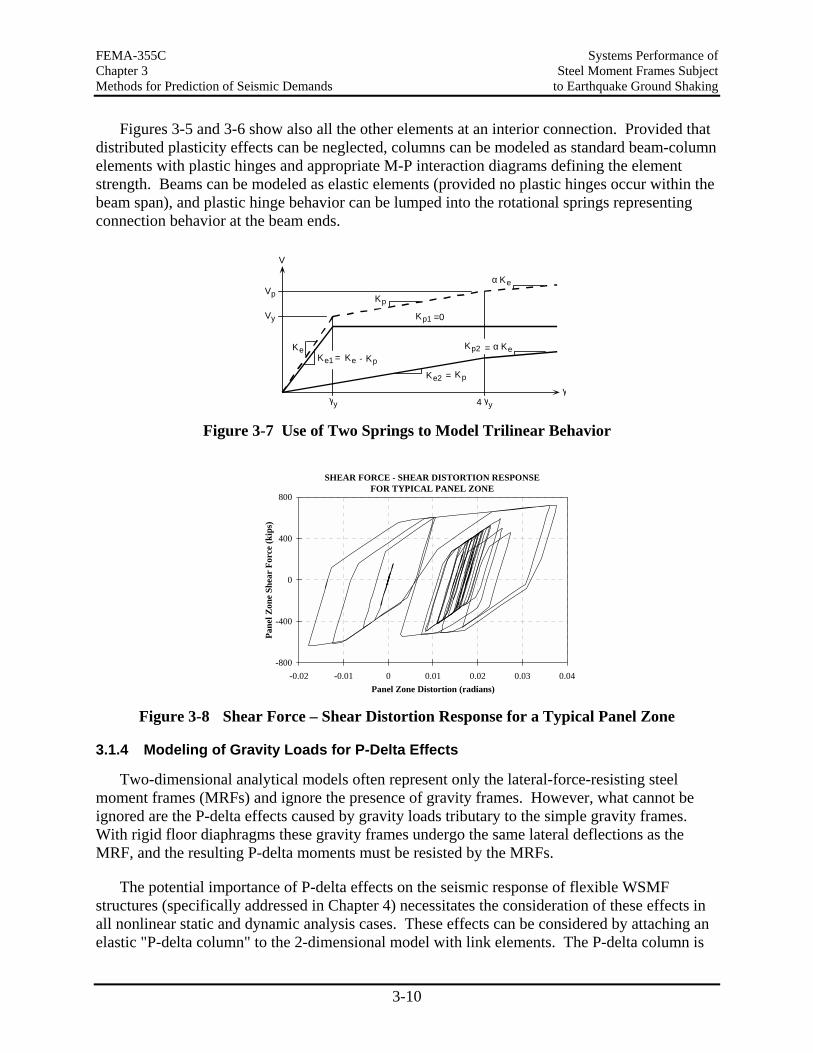
FEMA-355C Systems Performance of Chapter 3 Steel Moment Frames Subject Methods for Prediction of Seismic Demands to Earthquake Ground Shaking
3-10
Figures 3-5 and 3-6 show also all the other elements at an interior connection. Provided that distributed plasticity effects can be neglected, columns can be modeled as standard beam-column elements with plastic hinges and appropriate M-P interaction diagrams defining the element strength. Beams can be modeled as elastic elements (provided no plastic hinges occur within the beam span), and plastic hinge behavior can be lumped into the rotational springs representing connection behavior at the beam ends.
Ke1Ke
Ke Kp= -
Kp
Ke2 Kp=
Kp1 =0
Keα
KeαKp2 =
γy γy4γ
V
Vy
Vp
Figure 3-7 Use of Two Springs to Model Trilinear Behavior
SHEAR FORCE - SHEAR DISTORTION RESPONSEFOR TYPICAL PANEL ZONE
-800
-400
0
400
800
-0.02 -0.01 0 0.01 0.02 0.03 0.04Panel Zone Distortion (radians)
Pane
l Zon
e Sh
ear
Forc
e (k
ips)
Figure 3-8 Shear Force – Shear Distortion Response for a Typical Panel Zone
3.1.4 Modeling of Gravity Loads for P-Delta Effects
Two-dimensional analytical models often represent only the lateral-force-resisting steel moment frames (MRFs) and ignore the presence of gravity frames. However, what cannot be ignored are the P-delta effects caused by gravity loads tributary to the simple gravity frames. With rigid floor diaphragms these gravity frames undergo the same lateral deflections as the MRF, and the resulting P-delta moments must be resisted by the MRFs.
The potential importance of P-delta effects on the seismic response of flexible WSMF structures (specifically addressed in Chapter 4) necessitates the consideration of these effects in all nonlinear static and dynamic analysis cases. These effects can be considered by attaching an elastic "P-delta column" to the 2-dimensional model with link elements. The P-delta column is
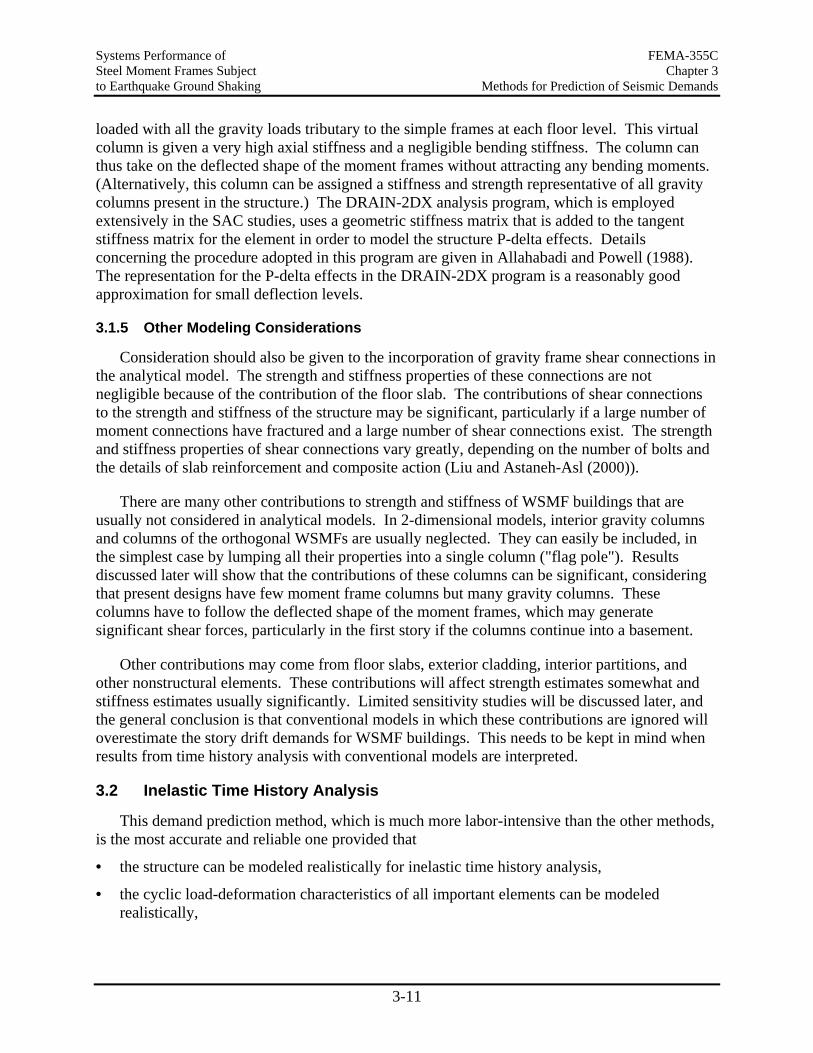
Systems Performance of FEMA-355C Steel Moment Frames Subject Chapter 3 to Earthquake Ground Shaking Methods for Prediction of Seismic Demands
3-11
loaded with all the gravity loads tributary to the simple frames at each floor level. This virtual column is given a very high axial stiffness and a negligible bending stiffness. The column can thus take on the deflected shape of the moment frames without attracting any bending moments. (Alternatively, this column can be assigned a stiffness and strength representative of all gravity columns present in the structure.) The DRAIN-2DX analysis program, which is employed extensively in the SAC studies, uses a geometric stiffness matrix that is added to the tangent stiffness matrix for the element in order to model the structure P-delta effects. Details concerning the procedure adopted in this program are given in Allahabadi and Powell (1988). The representation for the P-delta effects in the DRAIN-2DX program is a reasonably good approximation for small deflection levels.
3.1.5 Other Modeling Considerations
Consideration should also be given to the incorporation of gravity frame shear connections in the analytical model. The strength and stiffness properties of these connections are not negligible because of the contribution of the floor slab. The contributions of shear connections to the strength and stiffness of the structure may be significant, particularly if a large number of moment connections have fractured and a large number of shear connections exist. The strength and stiffness properties of shear connections vary greatly, depending on the number of bolts and the details of slab reinforcement and composite action (Liu and Astaneh-Asl (2000)).
There are many other contributions to strength and stiffness of WSMF buildings that are usually not considered in analytical models. In 2-dimensional models, interior gravity columns and columns of the orthogonal WSMFs are usually neglected. They can easily be included, in the simplest case by lumping all their properties into a single column ("flag pole"). Results discussed later will show that the contributions of these columns can be significant, considering that present designs have few moment frame columns but many gravity columns. These columns have to follow the deflected shape of the moment frames, which may generate significant shear forces, particularly in the first story if the columns continue into a basement.
Other contributions may come from floor slabs, exterior cladding, interior partitions, and other nonstructural elements. These contributions will affect strength estimates somewhat and stiffness estimates usually significantly. Limited sensitivity studies will be discussed later, and the general conclusion is that conventional models in which these contributions are ignored will overestimate the story drift demands for WSMF buildings. This needs to be kept in mind when results from time history analysis with conventional models are interpreted.
3.2 Inelastic Time History Analysis
This demand prediction method, which is much more labor-intensive than the other methods, is the most accurate and reliable one provided that
• the structure can be modeled realistically for inelastic time history analysis,
• the cyclic load-deformation characteristics of all important elements can be modeled realistically,
FEMA-355C Systems Performance of Chapter 3 Steel Moment Frames Subject Methods for Prediction of Seismic Demands to Earthquake Ground Shaking
3-12
• the ground motion time histories used in the analysis represent the range of demands the design earthquake will impose on the structure, and
• the results of the time history analyses can be interpreted in an unambiguous manner.
There is no simple, universally applicable approach to any of these issues, and an inelastic time history analysis will provide information whose relevance and reliability depend strongly on the quality of the effort put into addressing each of these issues. This report refers extensively to inelastic time history analysis results, but all results must be evaluated in the context of the assumptions made. The main objective is to improve our understanding of the seismic response of WSMF structures. The presented quantitative information depends on modeling assumptions and on the choice of ground motion records.
In the context of the evaluation of WSMF structures with potential connection problems, priority needs to be given to the inelastic time history analysis method, particularly when fractured connections exist and the post-fracture response of structures needs to be investigated. In such cases the response may depend strongly on the deterioration characteristics of the fractured connections and on increased P-delta effects because of the loss in stiffness and strength which usually amplifies lateral displacements.
In view of the importance of these issues in performance evaluation of WSMF structures, and of the increasing acceptance of an Incremental Dynamic Analysis (IDA, see Section 6.6.2), emphasis needs to be placed on the development of analysis tools that permit an efficient and reliable execution of inelastic time history analyses.
3.3 Inelastic Static Analysis (Pushover Analysis)
The pushover analysis is an evaluation method in which force and deformation demands at specified performance levels are estimated from a static inelastic analysis, and acceptability of a structure and its components is assessed by comparing these demands to performance level dependent force and deformation capacities. The method requires a description of the seismic input in terms of response spectra that define the site dependent seismic hazard for the specified performance levels.
The process is to (1) represent the structure in a two- or three-dimensional analytical model that accounts for all important elastic and inelastic response characteristics, (2) apply lateral loads in predetermined or adaptive patterns that represent approximately the relative inertia forces generated at locations of substantial masses, and (3) push the structure under these load patterns to a specific target displacement level. The internal forces and deformations computed at the target displacement level are estimates of the strength and deformation demands, which need to be compared to available capacities.
A target displacement level is a characteristic displacement in the structure that serves as an estimate of the global displacement experienced by the structure in a design earthquake associated with a specified performance level. The roof displacement is a convenient parameter for this purpose. This displacement can be estimated with reasonable accuracy from displacement spectra, using an equivalent SDOF system to obtain the SDOF displacement
Systems Performance of FEMA-355C Steel Moment Frames Subject Chapter 3 to Earthquake Ground Shaking Methods for Prediction of Seismic Demands
3-13
demand, and transforming this displacement to the roof level of the MDOF structure with the use of an appropriate shape vector.
The evaluation of a lateral load resisting system is based on an assessment of capacities and demands of important performance quantities. Such quantities include global drift, interstory drift, inelastic element and connection deformations (either absolute or normalized to a yield value), and element and connection forces (for elements and connections that cannot sustain inelastic deformations).
The method is relatively simple to implement, but hinges on a great number of assumptions and approximations that may be reasonable in many cases but unreasonable in some. Thus, the interpretation of results must be done within the context of the assumptions. In somewhat different formats the method has been proposed, formalized, and evaluated in several research studies (e.g., Fajfar & Fischinger (1988), Lawson et al. (1994), Miranda (1991), Saiidi & Sozen (1981)). Common to all formulations is the assumption that the deflected shape of the MDOF structure can be represented by a single shape vector that remains constant throughout the time history, regardless of the level of deformation. This shape vector together with the strength and elastic stiffness of the structure is used to define the equivalent inelastic SDOF system from which the aforementioned target displacement is estimated. In somewhat different formats the pushover analysis is implemented in recent seismic guidelines for retrofitting of existing building structures (FEMA 273, 1997, ATC-40, 1996).
This process has been shown to provide a reasonable estimate of the deformation response for structures that respond primarily in the first mode, but it must be emphasized that the pushover analysis cannot disclose performance problems caused by changes in the inelastic dynamic characteristics due to higher mode effects. More often than not the pushover will detect only one weakness in the structure and will ignore other weaknesses that may exist but are not exposed by a specific lateral load pattern. In order to bound the response behavior, it is advisable to perform the pushover analysis using several load patterns (uniform, triangular, and SRSS patterns, or adaptive load patterns that account for changes in dynamic characteristics). An extensive discussion of the feasibility and limitations of the pushover analysis is given in Krawinkler and Seneviratna (1997). Perhaps the biggest value of the pushover analysis lies in its capability to provide information on inelastic behavior characteristics that cannot be studied in detail from a time history analysis.
3.4 Elastic Methods of Analysis
3.4.1 Elastic Static Analysis
In this method lateral loads of pre-established pattern and magnitude are applied to the structure together with the gravity loads that are likely to exist at the time of the earthquake. Internal forces are computed under these load combinations by means of elastic analysis, and the resulting force quantities are normalized to capacity values to estimate demand/capacity ratios and evaluate acceptability of each component.
This method is simple in implementation but has many ambiguities since it attempts to predict inelastic dynamic demands by means of an elastic static analysis. Formalization requires
FEMA-355C Systems Performance of Chapter 3 Steel Moment Frames Subject Methods for Prediction of Seismic Demands to Earthquake Ground Shaking
3-14
the development of rules that need to facilitate simplicity, but the rules will always be subject to doubts since it is impossible to place inelastic behavior consistently into an elastic framework. This is particularly true if the response is controlled by dynamic inelastic P-delta effects.
The load pattern could be a code-type load pattern, and the magnitude of the lateral loads could be derived from an unreduced elastic smoothed ground motion spectrum. Except for force controlled components (components that cannot sustain inelastic deformations), the loads should be considered as a surrogate means to estimate element deformations due to the expected inelastic displacements of the structure. Since the inelastic displacements may differ significantly from the elastic ones, particularly for short period structures, the loads should be multiplied with estimates of the ratio of inelastic to elastic displacements, accounting also for issues such as pinching of hysteresis loops and dynamic P-delta effects (a very difficult task).
The analysis will result in computed demand/capacity ratios that can be employed for a performance evaluation (which requires the assignment of acceptable demand/capacity ratios), or for an estimate of the deformation demands in components. In many cases these estimates may be realistic, in others they will not since these ratios cannot account for redistribution of internal forces. Procedures to reconcile differences between the elastic static demand predictions and inelastic dynamic demand predictions by means of bias factors are under development.
3.4.2 Elastic Dynamic Analysis
The use of dynamic analysis procedures adds the benefit that the elastic dynamic characteristics of the structure are represented more realistically. If modal analysis is employed using a smoothed spectrum, a clear advantage is gained compared to the static method since dynamic effects are better represented. But all the other drawbacks of the elastic method still apply. For instance, a site-specific elastic spectrum that exhibits large peaks and valleys, such as a spectrum of an actual ground motion, may be a poor indicator of inelastic demands if the elastic structural periods coincide with peaks or valleys of the spectrum. This poor indication will be reflected in the results of an elastic dynamic analysis of a structure.
An example of the type of misleading results that can be obtained from an elastic time history analysis is illustrated in Figure 3-9. Shown are the demand/capacity ratios obtained from an elastic analysis, and the plastic deformation demands obtained from an inelastic analysis, for the elements framing into an interior beam-to-column connection of a 2-story frame subjected to the same ground motion. In the inelastic analysis, neither beams nor columns yield despite the large elastic demand/capacity ratios, and the joint shear distortion corresponds to a ductility ratio of 7.4.
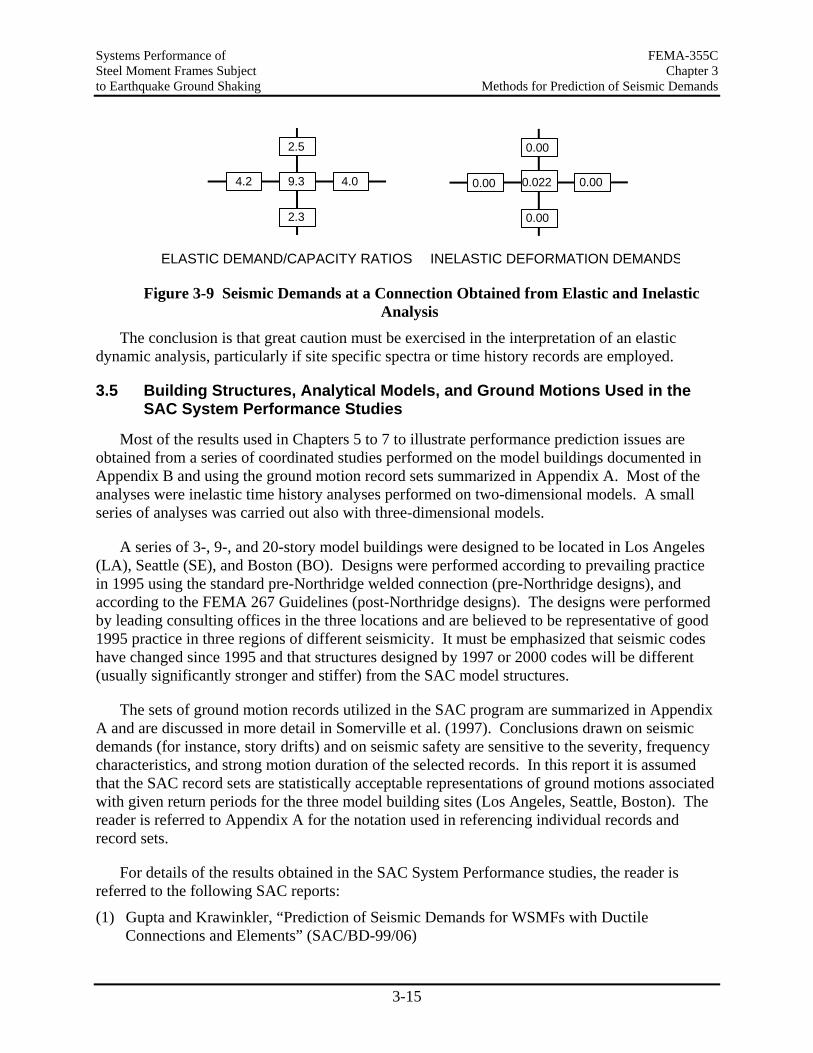
Systems Performance of FEMA-355C Steel Moment Frames Subject Chapter 3 to Earthquake Ground Shaking Methods for Prediction of Seismic Demands
3-15
0.022
0.00
0.00
0.00
0.00
2.5
4.2 4.0
2.3
9.3
ELASTIC DEMAND/CAPACITY RATIOS INELASTIC DEFORMATION DEMANDS
Figure 3-9 Seismic Demands at a Connection Obtained from Elastic and Inelastic Analysis
The conclusion is that great caution must be exercised in the interpretation of an elastic dynamic analysis, particularly if site specific spectra or time history records are employed.
3.5 Building Structures, Analytical Models, and Ground Motions Used in the SAC System Performance Studies
Most of the results used in Chapters 5 to 7 to illustrate performance prediction issues are obtained from a series of coordinated studies performed on the model buildings documented in Appendix B and using the ground motion record sets summarized in Appendix A. Most of the analyses were inelastic time history analyses performed on two-dimensional models. A small series of analyses was carried out also with three-dimensional models.
A series of 3-, 9-, and 20-story model buildings were designed to be located in Los Angeles (LA), Seattle (SE), and Boston (BO). Designs were performed according to prevailing practice in 1995 using the standard pre-Northridge welded connection (pre-Northridge designs), and according to the FEMA 267 Guidelines (post-Northridge designs). The designs were performed by leading consulting offices in the three locations and are believed to be representative of good 1995 practice in three regions of different seismicity. It must be emphasized that seismic codes have changed since 1995 and that structures designed by 1997 or 2000 codes will be different (usually significantly stronger and stiffer) from the SAC model structures.
The sets of ground motion records utilized in the SAC program are summarized in Appendix A and are discussed in more detail in Somerville et al. (1997). Conclusions drawn on seismic demands (for instance, story drifts) and on seismic safety are sensitive to the severity, frequency characteristics, and strong motion duration of the selected records. In this report it is assumed that the SAC record sets are statistically acceptable representations of ground motions associated with given return periods for the three model building sites (Los Angeles, Seattle, Boston). The reader is referred to Appendix A for the notation used in referencing individual records and record sets.
For details of the results obtained in the SAC System Performance studies, the reader is referred to the following SAC reports:
(1) Gupta and Krawinkler, “Prediction of Seismic Demands for WSMFs with Ductile Connections and Elements” (SAC/BD-99/06)
FEMA-355C Systems Performance of Chapter 3 Steel Moment Frames Subject Methods for Prediction of Seismic Demands to Earthquake Ground Shaking
3-16
(2) MacRae, “Parametric Study on the Effect of Ground Motion Intensity and Dynamic Characteristics on Seismic Demands in Steel Moment-Resisting Frames” (SAC/BD-99/01)
(3) Naeim, et al., “Effect of Hysteretic Deterioration Characteristics on Seismic Response of Moment-Resisting Steel Structures” (SAC/BD-99/18)
(4) Cornell and Luco, “The Effect of Connection Fractures on Steel Moment-Resisting Frame Seismic Demands and Safety” (SAC/BD-99/03)
(5) Maison and Kasai, “Seismic Performance of 3 and 9 Story Partially Restrained Moment Frame Buildings” (SAC/BD-99/16)
(6) Kasai, Maison, and Mayangarum, “Effects of Partially Restrained Connection Stiffness and Strength on Frame Seismic Performance” (SAC/BD-99/17)
Unless noted otherwise, the results and figures presented in this and the following chapters are based on the study summarized in the first reference in the above list. This study served as the base case. It focused on a comprehensive evaluation of local and global demands for all SAC model buildings, using different analytical models but considering only two-dimensional representations of the structures, non-deteriorating properties of individual elements, and “standard” sets of ground motions. The other studies used subsets of structures and analytical models, but focused on specific issues such as special ground motions (near-fault and soft soil), 3-D effects, deteriorating element properties, performance of structures with fractured connections, and the feasibility and limitations of using partially restrained connections.
All analyses were carried out with computer programs that were benchmarked to give close to identical results under the same conditions. Unless noted otherwise, the following assumptions were made in all analyses:
• Gravity loads corresponding to 1.0D (including 10 psf partitions) + 20 psf L are applied.
• Shear deformations in beam and column elements are neglected.
• Plastic zones in beams and columns are modeled as point hinges.
• The hysteretic behavior at plastic hinge locations is described by a bilinear moment-rotation diagram.
• All elements have 3% strain hardening. When plastic hinges are modeled with springs, the rotational strain hardening corresponds to 0.03 x 6EI/L of the element.
• This strain hardening is assumed to be maintained even at very large inelastic deformations.
• For columns, the following M-P interaction diagram is utilized: Mn = Mp for P < 0.15Py; Mn = 1.18Mp (1-P/Py) thereafter.
• Unless noted otherwise, expected rather than nominal yield strength values are used (49.2 ksi for A36 steel and 57.6 ksi for grade 50 steel).
• 2% viscous damping is used in first mode and at T = 0.2 sec. (except for the 20-story buildings in which 2% is used in the first and fifth modes).
Systems Performance of FEMA-355C Steel Moment Frames Subject Chapter 3 to Earthquake Ground Shaking Methods for Prediction of Seismic Demands
3-17
• The period of the structure is based on the elastic stiffness of all elements included in the analytical model.
• Soil-structure interaction is not considered. Buildings with basements are assumed to be prevented from translation at the ground and basement levels.
3.5.1 Two-Dimensional Models
Since the model buildings are almost symmetric in the two principal directions, only the NS direction is considered. Torsional effects due to the small penthouse on top of the buildings are ignored. Only one-half of the structures, consisting of one moment-resisting perimeter frame and one or more interior gravity frames, are analyzed. The columns in the 3-story WSMF are assumed to be fixed at the ground floor level, and the columns in the 9- and 20-story WSMFs are assumed to be pinned at the basement level. All gravity columns are assumed to be pinned at the base.
The following analytical models are utilized:
Model M1: Basic centerline model of bare moment-resisting frame. The beams and columns extend from centerline to centerline. Panel zone dimensions and shear distortions are neglected. Moments in beams and column are computed at the joint centerline rather than at faces of columns and beams, which leads to high estimates of moments.
Model M2: Bare moment-resisting frame model, but panel zone dimensions, strength, and stiffness are considered. The panel zone has dimensions of db by dc. Shear strength and stiffness properties of panel zones are as given in Section 3.1.3. Columns and beams have clear span length.
Model M2A: M2 model with estimate of all other "dependable" contributions to strength and stiffness. All gravity columns and weak axis columns of the orthogonal WSMFs are included in the model. The effect of the floor slab on the stiffness of all beams is considered, but the effect of the floor slab on the strength of the beams in the WSMF is neglected. All simple (shear) connections are included. Model M2A(1) denotes a model in which the positive (top in compression) and negative bending strengths at the shear connection are taken as 0.4Mp and 0.2Mp, respectively, and Model M2A(2) denotes a model in which these values are 0.2Mp and 0.1Mp. These two models provide reasonable bounds of the strength contribution of simple connections. The elastic stiffness of the simple connections (modeled as rotational springs) is obtained by assuming that the positive bending strength is attained at a rotation of 0.02 radians.
The reasons for selecting these models are as follows. The M1 model is widely used in engineering practice. It provides conservative (high) estimates of moments in beams and columns, but disregards the effects of panel zone shear behavior. Its shortcomings will be discussed in Chapter 5. The M2 model is a more realistic representation of the WSMF because it
FEMA-355C Systems Performance of Chapter 3 Steel Moment Frames Subject Methods for Prediction of Seismic Demands to Earthquake Ground Shaking
3-18
considers the effects of panel zone stiffness and limited strength, and provides beam and column moment values at the critical locations (element faces) and with due consideration given to the relative strength of elements framing into the beam-to-column connections. The M2A model provides the most reasonable estimate of structure strength and stiffness without having to resort to assumptions that are difficult to justify, considering the large variations in intangible contributions of nonstructural elements. It is noted that the strength and stiffness contributions of the simple connections may be overestimated in this model.
The shortcomings of the M1 models are well recognized, but in the study on post-fracture behavior there was no choice but to use the M1 models. At the time these studies were performed, no fracture criterion existed for connections in which all or much of the plastic deformations occurs in the panel zone rather than in a plastic hinge region of the beam.
3.5.2 Three-Dimensional Models
Three-dimensional effects on the response of the LA 3-story building are summarized in Section 5.9. Analyses were carried out using the program DRAIN-3DX (Powell et al., 1994). Centerline (M1) models were used in the analysis. Column modeling was carried out using a fiber element. Twelve element fiber models were used to describe the behavior of WF cross-sections. Columns in the perimeter frame were modeled with a fully restrained base for bending about both the weak and strong axis directions, and all internal gravity columns had pinned bases. Near-rigid struts were provided on the floor levels to ensure a rigid diaphragm.
Systems Performance of FEMA-355C Steel Moment Frames Subject Chapter 4: Selected Issues Affecting the to Earthquake Ground Shaking Seismic Performance of WSMF Structures
4-1
4. SELECTED ISSUES AFFECTING THE SEISMIC PERFORMANCE OF WSMF STRUCTURES
4.1 Global and Local Performance Issues
Performance assessment implies evaluation of demands and capacities at specific performance levels. This report is concerned mainly with demand evaluation, but with the recognition that both demands and capacities need to be evaluated and that the success of performance evaluation depends strongly on the choice of the most relevant performance parameters. For instance, inadequate system performance at the collapse prevention level implies that an analytically computed parameter approaches a state of instability. An evident example is uncontrolled increase in a story drift due to excessive P-delta effects. A less evident (or less likely) example may be the attainment of a beam rotation that leads to a loss in sufficient shear capacity to maintain gravity load resistance. Another example is the attainment of an axial force in a column that causes buckling and a subsequent deterioration in axial load capacity that renders the column incapable of resisting tributary gravity loading.
The conclusion is that the need exists to evaluate all demand parameters that may contribute to a state of instability. Story drift is an evident parameter, and it will receive much attention in the remainder of this report. With the focus on this parameter, the need exists to identify all conditions that may lead to a state of uncontrolled increase in story drift and to evaluate all local deformation parameters that may contribute to this state. Thus, the major performance issues at the incipient collapse level are P-delta effects and evaluation of local parameters on which P-delta effects depend. For WSMF structures it is the relative strength of the elements at a connection that will determine the importance of each local parameter. For instance, if weak columns exist, plastic hinging will occur in columns, story mechanisms may form that will amplify story drifts, the plastic rotation demands in the columns may become excessive, and strength deterioration in column may lead to P-delta sensitive situations. Moreover, the SAC tests have shown that the likelihood of fractures may be sensitive to the sharing (or lack thereof) of inelastic deformations between the elements at a connection. Thus, the issues of relative member strength and P-delta effects, which are recurring themes of later discussions, are treated separately in this Chapter.
4.2 Importance of Relative Strength of Elements at a Connection
At every beam-to-column connection of a WSMF, four types of "elements" exist: beams, columns, a panel zone, and joining media that connect beams to the column (see Figure 4-1). The stresses and deformation demands at the connection depend strongly on the relative strength of these elements. If the beam is the weak element, it will develop a plastic hinge, and the joining media are called upon to transfer the beam bending strength, with appropriate strain hardening, to the column. For a welded beam flange joint this implies the transfer of (a) very high horizontal normal stresses generated by axial yielding and strain hardening of the beam flange, (b) high shear stresses due to concentration of shear in the beam flange near the column face (Choi et al. (2000)), and (c) possibly high normal stresses due to local bending of the beam flange in the region along the cope hole. If the column is the weak element, it will develop a
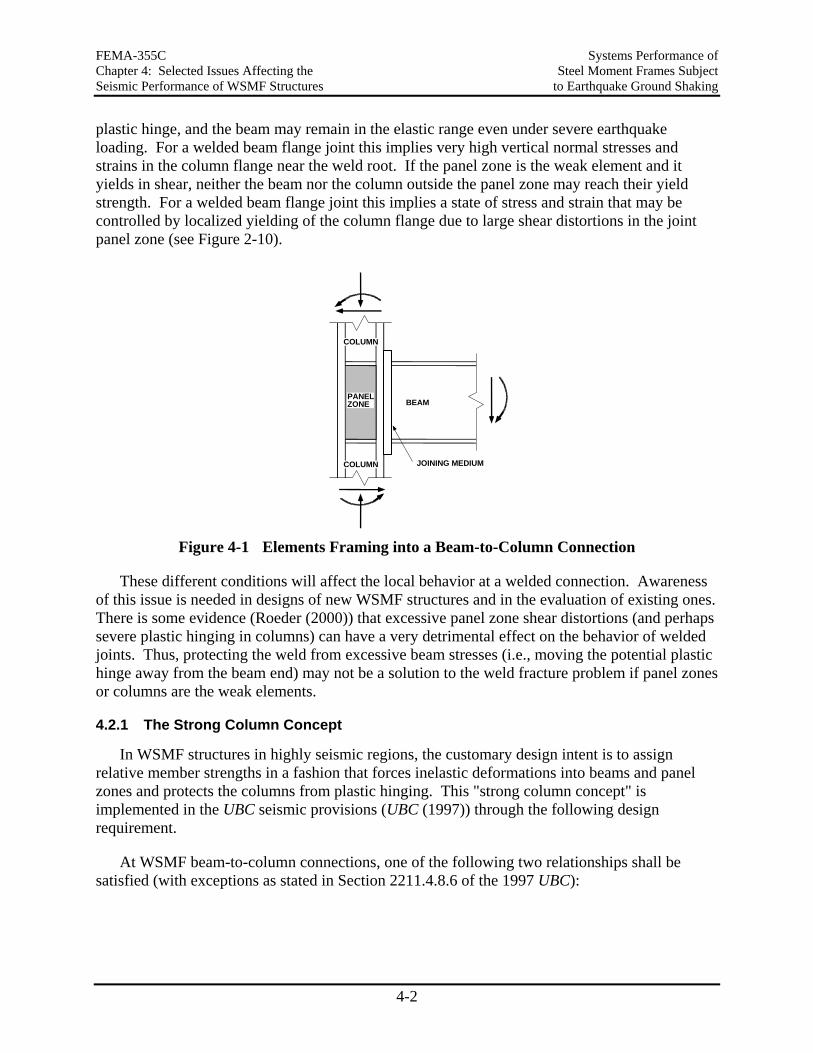
FEMA-355C Systems Performance of Chapter 4: Selected Issues Affecting the Steel Moment Frames Subject Seismic Performance of WSMF Structures to Earthquake Ground Shaking
4-2
plastic hinge, and the beam may remain in the elastic range even under severe earthquake loading. For a welded beam flange joint this implies very high vertical normal stresses and strains in the column flange near the weld root. If the panel zone is the weak element and it yields in shear, neither the beam nor the column outside the panel zone may reach their yield strength. For a welded beam flange joint this implies a state of stress and strain that may be controlled by localized yielding of the column flange due to large shear distortions in the joint panel zone (see Figure 2-10).
BEAMPANEL ZONE
COLUMN
COLUMN JOINING MEDIUM
Figure 4-1 Elements Framing into a Beam-to-Column Connection
These different conditions will affect the local behavior at a welded connection. Awareness of this issue is needed in designs of new WSMF structures and in the evaluation of existing ones. There is some evidence (Roeder (2000)) that excessive panel zone shear distortions (and perhaps severe plastic hinging in columns) can have a very detrimental effect on the behavior of welded joints. Thus, protecting the weld from excessive beam stresses (i.e., moving the potential plastic hinge away from the beam end) may not be a solution to the weld fracture problem if panel zones or columns are the weak elements.
4.2.1 The Strong Column Concept
In WSMF structures in highly seismic regions, the customary design intent is to assign relative member strengths in a fashion that forces inelastic deformations into beams and panel zones and protects the columns from plastic hinging. This "strong column concept" is implemented in the UBC seismic provisions (UBC (1997)) through the following design requirement.
At WSMF beam-to-column connections, one of the following two relationships shall be satisfied (with exceptions as stated in Section 2211.4.8.6 of the 1997 UBC):
Systems Performance of FEMA-355C Steel Moment Frames Subject Chapter 4: Selected Issues Affecting the to Earthquake Ground Shaking Seismic Performance of WSMF Structures
4-3
0.1)/(
≥Σ
−Σ
ybb
gucycc
FZAPFZ
or 0.1)/()/(
≥−
−Σ
bbn
gucycc
dHHdVAPFZ
(4-1)
The subscripts b and c refer to beams and columns, respectively, Puc/Ag is the axial stress in the column, H is the story height, and Vn is the nominal shear strength of the panel zone (same as Vp in Equation 3-4). The numerator is an estimate of the sum of the bending strengths of the columns above and below the connection (accounting approximately for the effect of an axial load on the column bending strength), and the denominator is an estimate of the sum of the maximum moments that can be transferred from the beams to the columns. The first criterion applies when the beams are weaker than the panel zone, and the second criterion applies when the panel zone is weaker than the beams. (The second criterion may become irrelevant once year 2000 design criteria, which will eliminate the existence of weak panel zones, will be implemented.)
The exceptions stated in Section 2211.4.8.6 of the 1997 UBC, and also the rule as expressed in Equation (4-1), permit plastic hinging in columns in many cases. If Equation (4-1) is intended to protect against plastic hinging in columns, it should be modified to include strain hardening and the contribution of the floor slab to the beam strength, and to reflect recent developments in steel production. (In SSPC (1994) it is stated that A-36 steel (used for most beams in existing WSMFs) has a mean yield strength that is about 35% higher than the nominal strength, whereas for A-572 the mean strength is only about 15% higher than the nominal one.) Thus, beams may be much stronger than is reflected in Equation (4-1), particularly if strain hardening during cyclic loading is considered.
Both criteria given in Equation (4-1) assume also that the column moments above and below the connection are about equal. This assumption is reasonable if the points of inflection in the columns are at the midheight of stories. This condition is usually not fulfilled in the first story of frame structures. As shown in Section 5.5 of this report, points of inflection move away from story midheight also when a significant difference in interstory drifts exists in adjacent stories. Thus, the occurrence of column hinging in WSMFs is a distinct possibility even when the strong column criteria presently employed are adhered to. This may not be very detrimental to global response unless column hinging leads to undesirable story mechanisms. However, column hinging will clearly affect the state of stress and strain at the beam-to-column connection and, therefore, the likelihood and direction of fracture at weldments.
4.2.2 Panel Zone Shear Strength
Even if plastic hinging in the columns is prevented, there is no assurance that energy in a severe earthquake will be dissipated through plastic hinging in beams. In many existing structures, panel zones will yield in shear before beams attain their yield strength. Many recent seismic codes do not place restrictions on the relative strength of beams and joint panel zones, except for the basic shear strength design requirement for panel zones, which is applied at the design load level. (Changes will occur in the SAC Guidelines and the AISC 2000 Seismic Provisions.) Since beam sizes are often larger than needed for seismic strength because of gravity loading and/or stiffness requirements, it can be expected that in many practical cases the panel zones are the weak elements and much or maybe all the plastification at beam-to-column
FEMA-355C Systems Performance of Chapter 4: Selected Issues Affecting the Steel Moment Frames Subject Seismic Performance of WSMF Structures to Earthquake Ground Shaking
4-4
connections is limited to panel zone shear deformations and the associated plastification in the columns flanges at the panel zone corners. Panel zone shear distortion is usually a very ductile mode of deformation (see Figure 2-8), but very large inelastic deformations in joint panel zones may have undesirable consequences on connection behavior as has been discussed earlier.
There is a basic dilemma in the assignment of relative strength between beams and panel zones. If the panel zones are very strong, all inelastic deformations will be concentrated in plastic hinge regions of beams, and the demands on plastic hinge rotations and on beam-to-column connections may become very high in severe earthquakes. If the panel zones are weak in shear compared to the bending strength of the beams, the associated large distortions may have undesirable consequences on welded beam flange joints. Thus, the concept of sharing of inelastic deformations between beams and panel zones is a very desirable one and should be implemented whenever feasible. This concept cannot be implemented at an elastic force level, even when factored loads are used. It needs to be implemented at the structure strength level and with estimates of the expected strengths of the elements and not nominal strengths.
4.2.3 Sensitivity of Prediction of Local Demands
The distribution of inelastic deformations to the individual elements may be very sensitive to the relative element strengths and the mathematical models used in an analysis. At a typical interior beam-to-column connection, the elastic and inelastic properties (in the simplest case: yield strength, elastic stiffness, strain hardening stiffness) of the following seven elements need to be considered, even if only behavior in one plane is considered (ignoring effects of orthogonal framing elements):
• Left and right beam (with or without slab contribution)
• Left and right beam-to-column joining media (FR or PR, with or without slab contribution)
• Column above and below the connection (including axial load effect on strength)
• Panel zone shear behavior
Any of the seven elements may control the distribution of inelastic deformations. In many cases the weak elements can be clearly identified and inelastic deformations can be assigned with high confidence. This will not be the case if several elements are of comparable strength, as is illustrated in the following simple example.
Let us consider an exterior beam-to-column connection and make the following simplifying assumptions:
• The columns are strong and will not yield.
• The beam-to-column joining media are strong and rigid, i.e., we have a FR connection that will not fracture.
• The effect of the floor slab on strength can be ignored.
With these assumptions the behavior at the connection can be described by one beam M-θ diagram and the panel zone V-γ diagram, as shown in Figure 4-2. Since in this case the
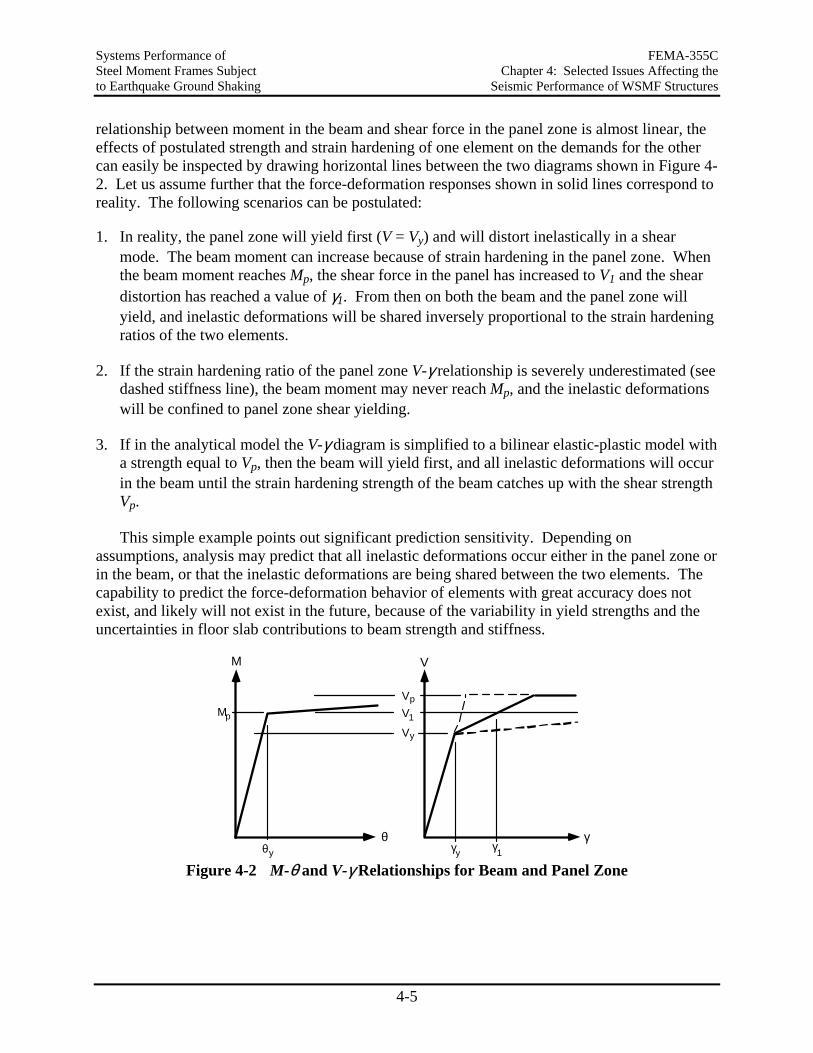
Systems Performance of FEMA-355C Steel Moment Frames Subject Chapter 4: Selected Issues Affecting the to Earthquake Ground Shaking Seismic Performance of WSMF Structures
4-5
relationship between moment in the beam and shear force in the panel zone is almost linear, the effects of postulated strength and strain hardening of one element on the demands for the other can easily be inspected by drawing horizontal lines between the two diagrams shown in Figure 4-2. Let us assume further that the force-deformation responses shown in solid lines correspond to reality. The following scenarios can be postulated:
1. In reality, the panel zone will yield first (V = Vy) and will distort inelastically in a shear mode. The beam moment can increase because of strain hardening in the panel zone. When the beam moment reaches Mp, the shear force in the panel has increased to V1 and the shear distortion has reached a value of γ1. From then on both the beam and the panel zone will yield, and inelastic deformations will be shared inversely proportional to the strain hardening ratios of the two elements.
2. If the strain hardening ratio of the panel zone V-γ relationship is severely underestimated (see dashed stiffness line), the beam moment may never reach Mp, and the inelastic deformations will be confined to panel zone shear yielding.
3. If in the analytical model the V-γ diagram is simplified to a bilinear elastic-plastic model with a strength equal to Vp, then the beam will yield first, and all inelastic deformations will occur in the beam until the strain hardening strength of the beam catches up with the shear strength Vp.
This simple example points out significant prediction sensitivity. Depending on assumptions, analysis may predict that all inelastic deformations occur either in the panel zone or in the beam, or that the inelastic deformations are being shared between the two elements. The capability to predict the force-deformation behavior of elements with great accuracy does not exist, and likely will not exist in the future, because of the variability in yield strengths and the uncertainties in floor slab contributions to beam strength and stiffness.
M V
γθ
MVp
Vy
p V1
θ γy yγ1
Figure 4-2 M-θ and V-γ Relationships for Beam and Panel Zone
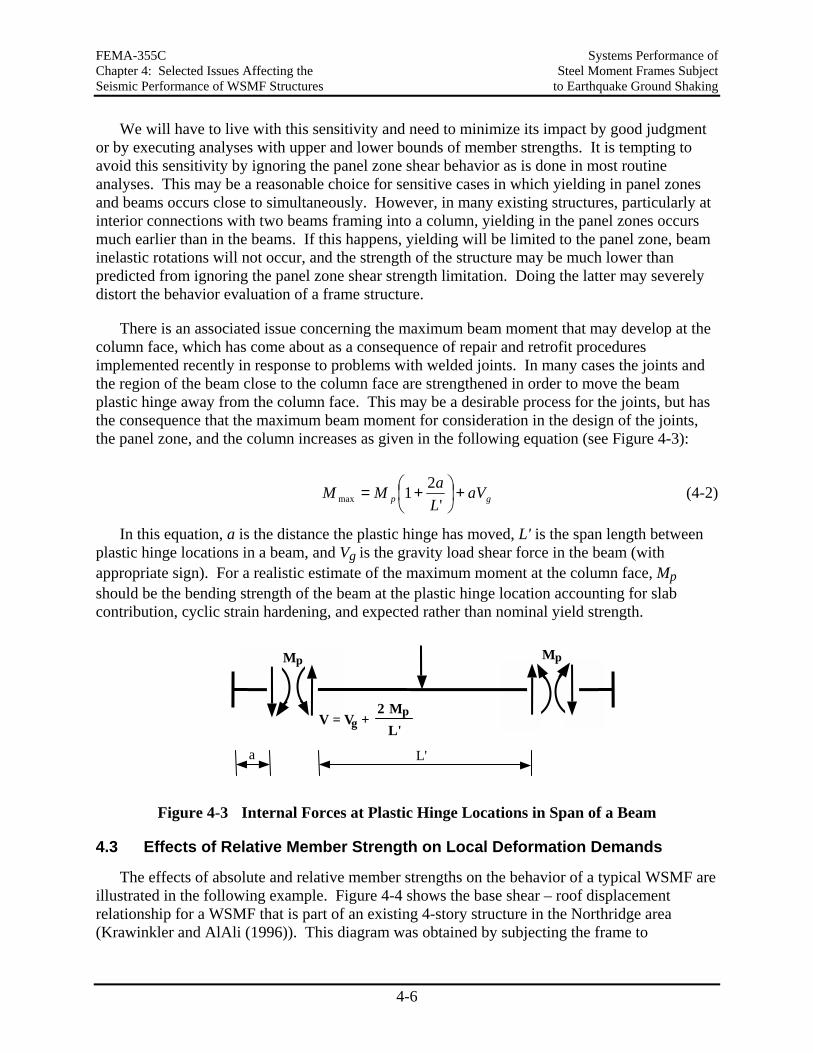
FEMA-355C Systems Performance of Chapter 4: Selected Issues Affecting the Steel Moment Frames Subject Seismic Performance of WSMF Structures to Earthquake Ground Shaking
4-6
We will have to live with this sensitivity and need to minimize its impact by good judgment or by executing analyses with upper and lower bounds of member strengths. It is tempting to avoid this sensitivity by ignoring the panel zone shear behavior as is done in most routine analyses. This may be a reasonable choice for sensitive cases in which yielding in panel zones and beams occurs close to simultaneously. However, in many existing structures, particularly at interior connections with two beams framing into a column, yielding in the panel zones occurs much earlier than in the beams. If this happens, yielding will be limited to the panel zone, beam inelastic rotations will not occur, and the strength of the structure may be much lower than predicted from ignoring the panel zone shear strength limitation. Doing the latter may severely distort the behavior evaluation of a frame structure.
There is an associated issue concerning the maximum beam moment that may develop at the column face, which has come about as a consequence of repair and retrofit procedures implemented recently in response to problems with welded joints. In many cases the joints and the region of the beam close to the column face are strengthened in order to move the beam plastic hinge away from the column face. This may be a desirable process for the joints, but has the consequence that the maximum beam moment for consideration in the design of the joints, the panel zone, and the column increases as given in the following equation (see Figure 4-3):
gp aVLaMM +
+=
'21max (4-2)
In this equation, a is the distance the plastic hinge has moved, L' is the span length between plastic hinge locations in a beam, and Vg is the gravity load shear force in the beam (with appropriate sign). For a realistic estimate of the maximum moment at the column face, Mp should be the bending strength of the beam at the plastic hinge location accounting for slab contribution, cyclic strain hardening, and expected rather than nominal yield strength.
Mp Mp
V = V + 2 Mp
L'g
a L'
Figure 4-3 Internal Forces at Plastic Hinge Locations in Span of a Beam
4.3 Effects of Relative Member Strength on Local Deformation Demands
The effects of absolute and relative member strengths on the behavior of a typical WSMF are illustrated in the following example. Figure 4-4 shows the base shear – roof displacement relationship for a WSMF that is part of an existing 4-story structure in the Northridge area (Krawinkler and AlAli (1996)). This diagram was obtained by subjecting the frame to
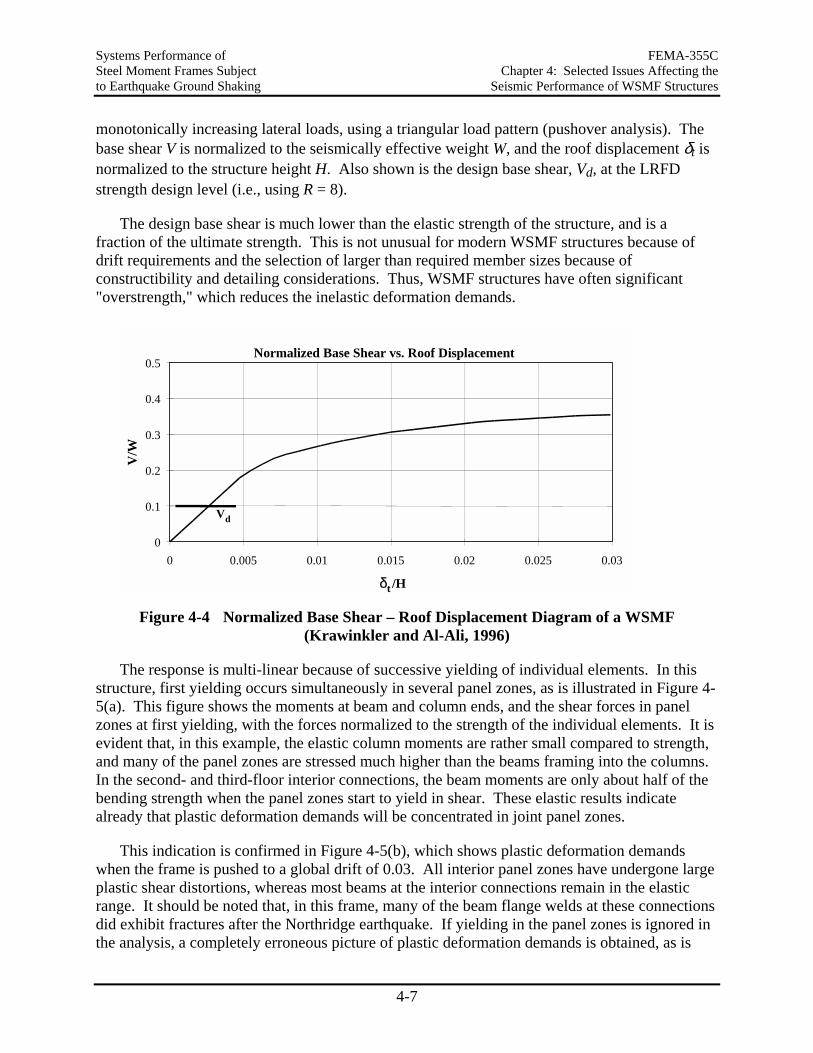
Systems Performance of FEMA-355C Steel Moment Frames Subject Chapter 4: Selected Issues Affecting the to Earthquake Ground Shaking Seismic Performance of WSMF Structures
4-7
monotonically increasing lateral loads, using a triangular load pattern (pushover analysis). The base shear V is normalized to the seismically effective weight W, and the roof displacement δt is normalized to the structure height H. Also shown is the design base shear, Vd, at the LRFD strength design level (i.e., using R = 8).
The design base shear is much lower than the elastic strength of the structure, and is a fraction of the ultimate strength. This is not unusual for modern WSMF structures because of drift requirements and the selection of larger than required member sizes because of constructibility and detailing considerations. Thus, WSMF structures have often significant "overstrength," which reduces the inelastic deformation demands.
0
0.1
0.2
0.3
0.4
0.5
0 0.005 0.01 0.015 0.02 0.025 0.03
V/W
Normalized Base Shear vs. Roof Displacement
Vd
δ /Ht Figure 4-4 Normalized Base Shear – Roof Displacement Diagram of a WSMF
(Krawinkler and Al-Ali, 1996)
The response is multi-linear because of successive yielding of individual elements. In this structure, first yielding occurs simultaneously in several panel zones, as is illustrated in Figure 4-5(a). This figure shows the moments at beam and column ends, and the shear forces in panel zones at first yielding, with the forces normalized to the strength of the individual elements. It is evident that, in this example, the elastic column moments are rather small compared to strength, and many of the panel zones are stressed much higher than the beams framing into the columns. In the second- and third-floor interior connections, the beam moments are only about half of the bending strength when the panel zones start to yield in shear. These elastic results indicate already that plastic deformation demands will be concentrated in joint panel zones.
This indication is confirmed in Figure 4-5(b), which shows plastic deformation demands when the frame is pushed to a global drift of 0.03. All interior panel zones have undergone large plastic shear distortions, whereas most beams at the interior connections remain in the elastic range. It should be noted that, in this frame, many of the beam flange welds at these connections did exhibit fractures after the Northridge earthquake. If yielding in the panel zones is ignored in the analysis, a completely erroneous picture of plastic deformation demands is obtained, as is
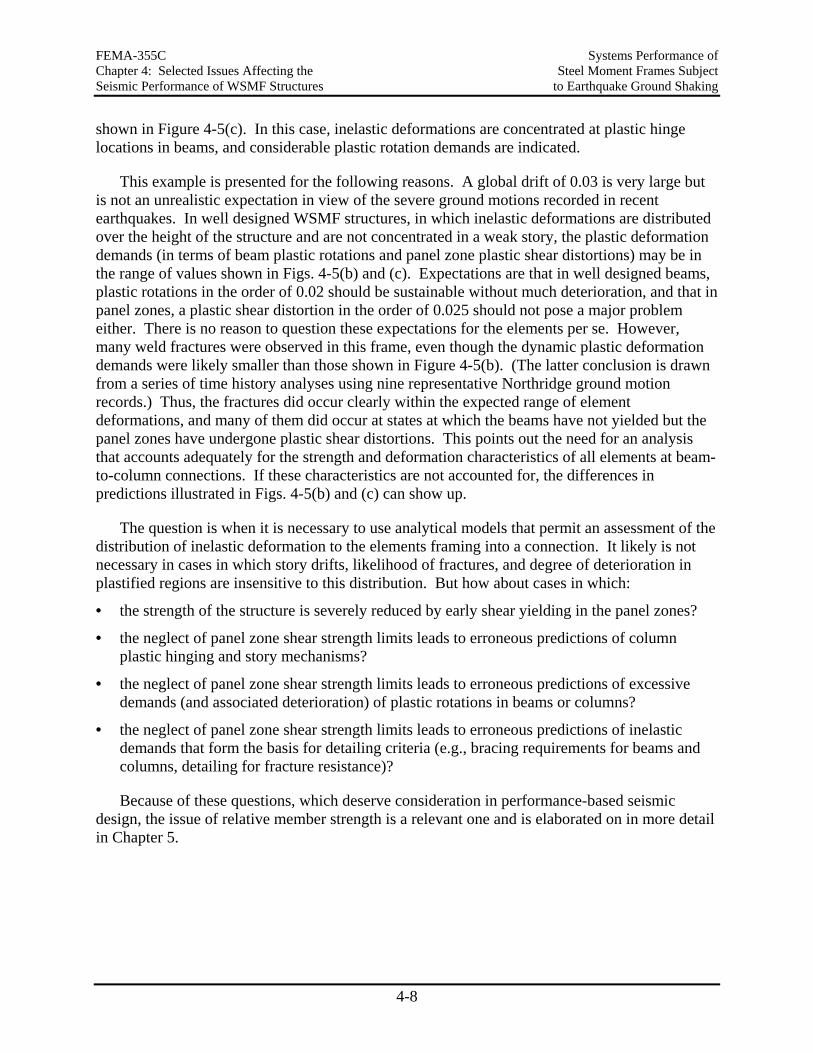
FEMA-355C Systems Performance of Chapter 4: Selected Issues Affecting the Steel Moment Frames Subject Seismic Performance of WSMF Structures to Earthquake Ground Shaking
4-8
shown in Figure 4-5(c). In this case, inelastic deformations are concentrated at plastic hinge locations in beams, and considerable plastic rotation demands are indicated.
This example is presented for the following reasons. A global drift of 0.03 is very large but is not an unrealistic expectation in view of the severe ground motions recorded in recent earthquakes. In well designed WSMF structures, in which inelastic deformations are distributed over the height of the structure and are not concentrated in a weak story, the plastic deformation demands (in terms of beam plastic rotations and panel zone plastic shear distortions) may be in the range of values shown in Figs. 4-5(b) and (c). Expectations are that in well designed beams, plastic rotations in the order of 0.02 should be sustainable without much deterioration, and that in panel zones, a plastic shear distortion in the order of 0.025 should not pose a major problem either. There is no reason to question these expectations for the elements per se. However, many weld fractures were observed in this frame, even though the dynamic plastic deformation demands were likely smaller than those shown in Figure 4-5(b). (The latter conclusion is drawn from a series of time history analyses using nine representative Northridge ground motion records.) Thus, the fractures did occur clearly within the expected range of element deformations, and many of them did occur at states at which the beams have not yielded but the panel zones have undergone plastic shear distortions. This points out the need for an analysis that accounts adequately for the strength and deformation characteristics of all elements at beam-to-column connections. If these characteristics are not accounted for, the differences in predictions illustrated in Figs. 4-5(b) and (c) can show up.
The question is when it is necessary to use analytical models that permit an assessment of the distribution of inelastic deformation to the elements framing into a connection. It likely is not necessary in cases in which story drifts, likelihood of fractures, and degree of deterioration in plastified regions are insensitive to this distribution. But how about cases in which:
• the strength of the structure is severely reduced by early shear yielding in the panel zones?
• the neglect of panel zone shear strength limits leads to erroneous predictions of column plastic hinging and story mechanisms?
• the neglect of panel zone shear strength limits leads to erroneous predictions of excessive demands (and associated deterioration) of plastic rotations in beams or columns?
• the neglect of panel zone shear strength limits leads to erroneous predictions of inelastic demands that form the basis for detailing criteria (e.g., bracing requirements for beams and columns, detailing for fracture resistance)?
Because of these questions, which deserve consideration in performance-based seismic design, the issue of relative member strength is a relevant one and is elaborated on in more detail in Chapter 5.
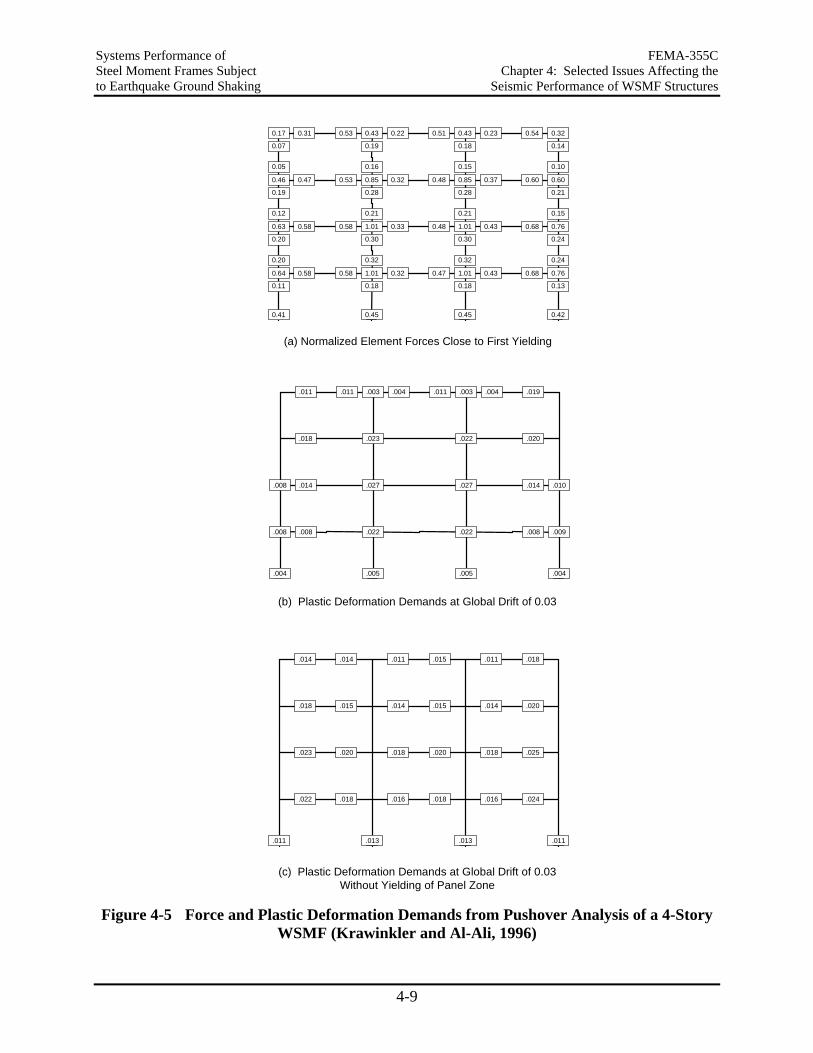
Systems Performance of FEMA-355C Steel Moment Frames Subject Chapter 4: Selected Issues Affecting the to Earthquake Ground Shaking Seismic Performance of WSMF Structures
4-9
0.20
0.11
0.58
0.12
0.63
0.20
0.58
0.05
0.46
0.19
0.47
0.07
0.31
0.64
0.32
0.18
0.321.010.58
0.21
0.30
0.331.010.58
0.16
0.28
0.320.850.53
0.19
0.220.53
0.45
0.32
0.18
0.430.47
0.21
0.30
0.431.010.48
0.15
0.28
0.370.850.48
0.18
0.230.51
0.450.41
0.24
0.13
0.760.68
0.15
0.24
0.760.68
0.10
0.21
0.600.60
0.14
0.54
0.42
0.17 0.43 0.43 0.32
1.01
.008
.008 .014
.018
.011
.008 .022
.027
.023
.004.011
.005
.027
.022
.004.011
.005.004
.009.008
.010.014
.020
.019
.004
.003 .003
.022
.022
.023
.018
.014
.016.018
.018.020
.014.015
.011.014
.013
.016.018
.018.020
.014.015
.011.015
.013.011
.024
.025
.020
.018
.011
(a) Normalized Element Forces Close to First Yielding
(b) Plastic Deformation Demands at Global Drift of 0.03
(c) Plastic Deformation Demands at Global Drift of 0.03Without Yielding of Panel Zone
Figure 4-5 Force and Plastic Deformation Demands from Pushover Analysis of a 4-Story WSMF (Krawinkler and Al-Ali, 1996)
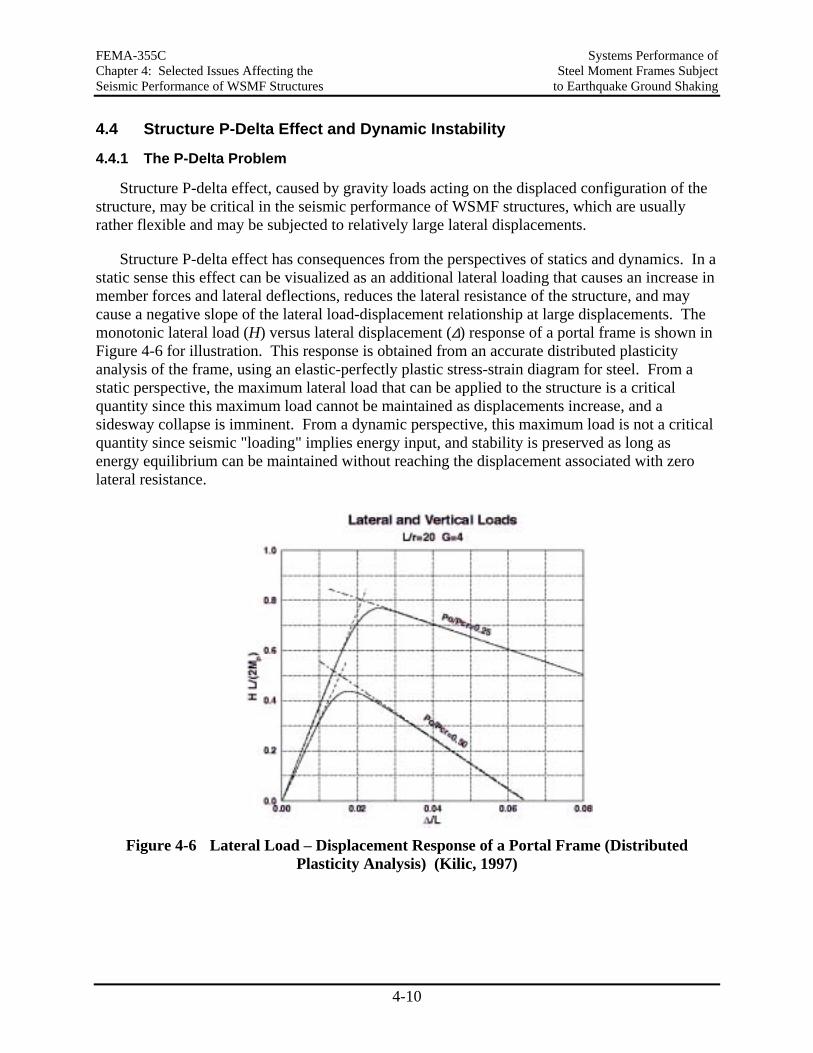
FEMA-355C Systems Performance of Chapter 4: Selected Issues Affecting the Steel Moment Frames Subject Seismic Performance of WSMF Structures to Earthquake Ground Shaking
4-10
4.4 Structure P-Delta Effect and Dynamic Instability
4.4.1 The P-Delta Problem
Structure P-delta effect, caused by gravity loads acting on the displaced configuration of the structure, may be critical in the seismic performance of WSMF structures, which are usually rather flexible and may be subjected to relatively large lateral displacements.
Structure P-delta effect has consequences from the perspectives of statics and dynamics. In a static sense this effect can be visualized as an additional lateral loading that causes an increase in member forces and lateral deflections, reduces the lateral resistance of the structure, and may cause a negative slope of the lateral load-displacement relationship at large displacements. The monotonic lateral load (H) versus lateral displacement (∆) response of a portal frame is shown in Figure 4-6 for illustration. This response is obtained from an accurate distributed plasticity analysis of the frame, using an elastic-perfectly plastic stress-strain diagram for steel. From a static perspective, the maximum lateral load that can be applied to the structure is a critical quantity since this maximum load cannot be maintained as displacements increase, and a sidesway collapse is imminent. From a dynamic perspective, this maximum load is not a critical quantity since seismic "loading" implies energy input, and stability is preserved as long as energy equilibrium can be maintained without reaching the displacement associated with zero lateral resistance.
Figure 4-6 Lateral Load – Displacement Response of a Portal Frame (Distributed
Plasticity Analysis) (Kilic, 1997)
Systems Performance of FEMA-355C Steel Moment Frames Subject Chapter 4: Selected Issues Affecting the to Earthquake Ground Shaking Seismic Performance of WSMF Structures
4-11
An accurate determination of the inelastic response that includes all aspects of member and structure P-delta effects is possible only through a large displacement distributed plasticity finite element analysis. To be reliable, this analysis should incorporate also local and flexural torsional buckling effects. The response determination under cyclic loading is even more complex, particularly if strength and/or stiffness deterioration have to be considered. If local and flexural torsional buckling problems are avoided, if member P-delta effects and out-of-plane buckling are not important issues, and if strength and stiffness deterioration are prevented, then a second order concentrated plasticity (plastic hinge) analysis should be adequate for an assessment of P-delta effects. The following discussion is based on these assumptions.
For a bilinear SDOF system with mass m and height h, the effect of P-delta can be represented as illustrated in Figure 4-7. A dimensionless parameter θ = mg/(Kh) can be used to describe the decrease in stiffness and strength. The elastic stiffness K is reduced to (1- θ)K, and the post-elastic stiffness α'K is reduced to (α' - θ)K. In this formulation, α' is the strain hardening ratio of the system without P-delta effect, and α' - θ is the strain "hardening" ratio with P-delta effect, which is denoted here as the effective strain "hardening" ratio α. If θ > α ', then α becomes negative.
∆y ∆
α 'K
(α '−θ)K
P∆y/h = Vy-V'y
Vy = K∆y
V'y = (1-θ)K∆y
K
V
∆1
P∆1/h
without P∆ Effect
with P∆ Effect
1
1(1-θ)K
1
1
1θK = P/h = mg/h
∆c“Collapse”
Figure 4-7 SDOF Lateral Force – Displacement Relationship without and with P-Delta
From a dynamic perspective, the structure P-delta effect may lead to a significant amplification in displacement response if α is negative and the displacement demands are high enough to enter the range of negative lateral stiffness. This is illustrated in Figure 4-8, which shows the dynamic response of an SDOF system whose hysteretic behavior is bilinear but includes P-delta effects that lead to a negative post-elastic stiffness αK = -0.05K. The presence of the negative stiffness leads to drifting (ratcheting) of the displacement response, which brings the SDOF system close to collapse. Using the set of 20 LA 2/50 records, mean values of the displacement amplification factor (displacement for α = -0.03 over displacement for α = 0.0) for different strength reduction factors R (R = elastic strength demand over yield strength) and a
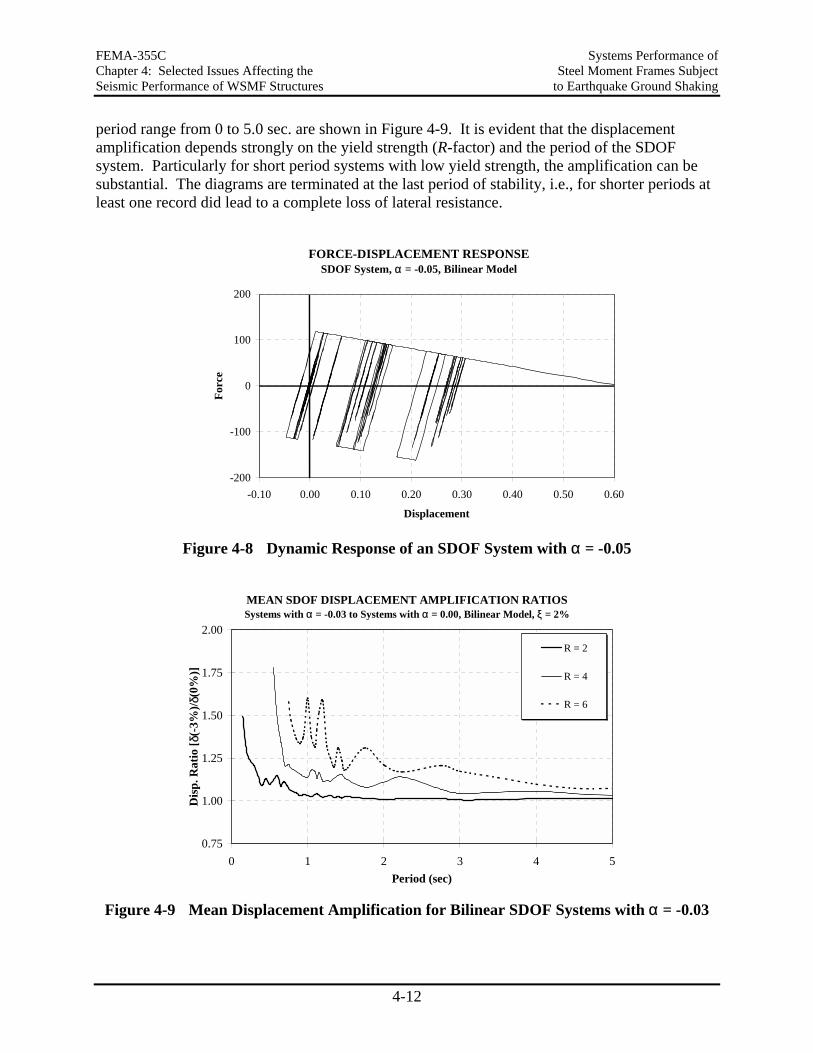
FEMA-355C Systems Performance of Chapter 4: Selected Issues Affecting the Steel Moment Frames Subject Seismic Performance of WSMF Structures to Earthquake Ground Shaking
4-12
period range from 0 to 5.0 sec. are shown in Figure 4-9. It is evident that the displacement amplification depends strongly on the yield strength (R-factor) and the period of the SDOF system. Particularly for short period systems with low yield strength, the amplification can be substantial. The diagrams are terminated at the last period of stability, i.e., for shorter periods at least one record did lead to a complete loss of lateral resistance.
FORCE-DISPLACEMENT RESPONSESDOF System, α = -0.05, Bilinear Model
-200
-100
0
100
200
-0.10 0.00 0.10 0.20 0.30 0.40 0.50 0.60
Displacement
Forc
e
Figure 4-8 Dynamic Response of an SDOF System with α = -0.05
MEAN SDOF DISPLACEMENT AMPLIFICATION RATIOS Systems with α = -0.03 to Systems with α = 0.00, Bilinear Model, ξ = 2%
0.75
1.00
1.25
1.50
1.75
2.00
0 1 2 3 4 5Period (sec)
Dis
p. R
atio
[ δ(-
3%)/ δ
(0%
)]
R = 2
R = 4
R = 6
Figure 4-9 Mean Displacement Amplification for Bilinear SDOF Systems with α = -0.03
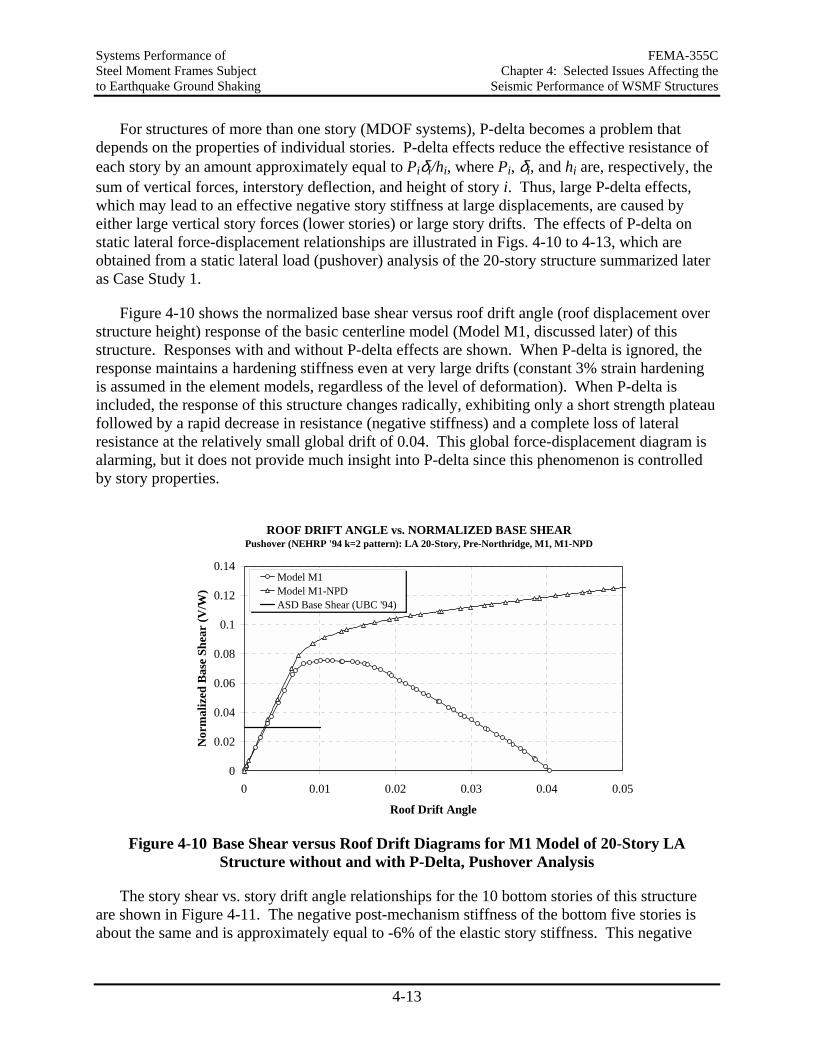
Systems Performance of FEMA-355C Steel Moment Frames Subject Chapter 4: Selected Issues Affecting the to Earthquake Ground Shaking Seismic Performance of WSMF Structures
4-13
For structures of more than one story (MDOF systems), P-delta becomes a problem that depends on the properties of individual stories. P-delta effects reduce the effective resistance of each story by an amount approximately equal to Piδi/hi, where Pi, δi, and hi are, respectively, the sum of vertical forces, interstory deflection, and height of story i. Thus, large P-delta effects, which may lead to an effective negative story stiffness at large displacements, are caused by either large vertical story forces (lower stories) or large story drifts. The effects of P-delta on static lateral force-displacement relationships are illustrated in Figs. 4-10 to 4-13, which are obtained from a static lateral load (pushover) analysis of the 20-story structure summarized later as Case Study 1.
Figure 4-10 shows the normalized base shear versus roof drift angle (roof displacement over structure height) response of the basic centerline model (Model M1, discussed later) of this structure. Responses with and without P-delta effects are shown. When P-delta is ignored, the response maintains a hardening stiffness even at very large drifts (constant 3% strain hardening is assumed in the element models, regardless of the level of deformation). When P-delta is included, the response of this structure changes radically, exhibiting only a short strength plateau followed by a rapid decrease in resistance (negative stiffness) and a complete loss of lateral resistance at the relatively small global drift of 0.04. This global force-displacement diagram is alarming, but it does not provide much insight into P-delta since this phenomenon is controlled by story properties.
ROOF DRIFT ANGLE vs. NORMALIZED BASE SHEARPushover (NEHRP '94 k=2 pattern): LA 20-Story, Pre-Northridge, M1, M1-NPD
0
0.02
0.04
0.06
0.08
0.1
0.12
0.14
0 0.01 0.02 0.03 0.04 0.05
Roof Drift Angle
Nor
mal
ized
Bas
e Sh
ear
(V/W
)
Model M1Model M1-NPDASD Base Shear (UBC '94)
Figure 4-10 Base Shear versus Roof Drift Diagrams for M1 Model of 20-Story LA
Structure without and with P-Delta, Pushover Analysis
The story shear vs. story drift angle relationships for the 10 bottom stories of this structure are shown in Figure 4-11. The negative post-mechanism stiffness of the bottom five stories is about the same and is approximately equal to -6% of the elastic story stiffness. This negative
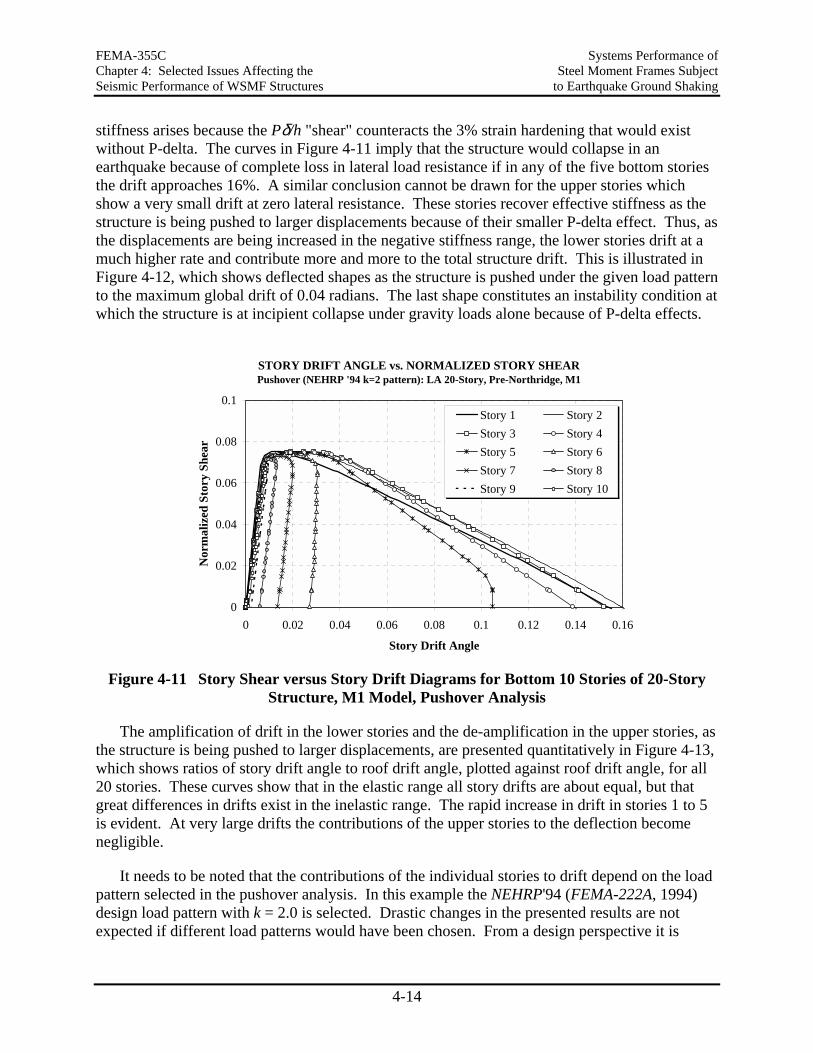
FEMA-355C Systems Performance of Chapter 4: Selected Issues Affecting the Steel Moment Frames Subject Seismic Performance of WSMF Structures to Earthquake Ground Shaking
4-14
stiffness arises because the Pδ/h "shear" counteracts the 3% strain hardening that would exist without P-delta. The curves in Figure 4-11 imply that the structure would collapse in an earthquake because of complete loss in lateral load resistance if in any of the five bottom stories the drift approaches 16%. A similar conclusion cannot be drawn for the upper stories which show a very small drift at zero lateral resistance. These stories recover effective stiffness as the structure is being pushed to larger displacements because of their smaller P-delta effect. Thus, as the displacements are being increased in the negative stiffness range, the lower stories drift at a much higher rate and contribute more and more to the total structure drift. This is illustrated in Figure 4-12, which shows deflected shapes as the structure is pushed under the given load pattern to the maximum global drift of 0.04 radians. The last shape constitutes an instability condition at which the structure is at incipient collapse under gravity loads alone because of P-delta effects.
STORY DRIFT ANGLE vs. NORMALIZED STORY SHEARPushover (NEHRP '94 k=2 pattern): LA 20-Story, Pre-Northridge, M1
0
0.02
0.04
0.06
0.08
0.1
0 0.02 0.04 0.06 0.08 0.1 0.12 0.14 0.16
Story Drift Angle
Nor
mal
ized
Sto
ry S
hear
Story 1 Story 2Story 3 Story 4Story 5 Story 6Story 7 Story 8Story 9 Story 10
Figure 4-11 Story Shear versus Story Drift Diagrams for Bottom 10 Stories of 20-Story
Structure, M1 Model, Pushover Analysis
The amplification of drift in the lower stories and the de-amplification in the upper stories, as the structure is being pushed to larger displacements, are presented quantitatively in Figure 4-13, which shows ratios of story drift angle to roof drift angle, plotted against roof drift angle, for all 20 stories. These curves show that in the elastic range all story drifts are about equal, but that great differences in drifts exist in the inelastic range. The rapid increase in drift in stories 1 to 5 is evident. At very large drifts the contributions of the upper stories to the deflection become negligible.
It needs to be noted that the contributions of the individual stories to drift depend on the load pattern selected in the pushover analysis. In this example the NEHRP'94 (FEMA-222A, 1994) design load pattern with k = 2.0 is selected. Drastic changes in the presented results are not expected if different load patterns would have been chosen. From a design perspective it is
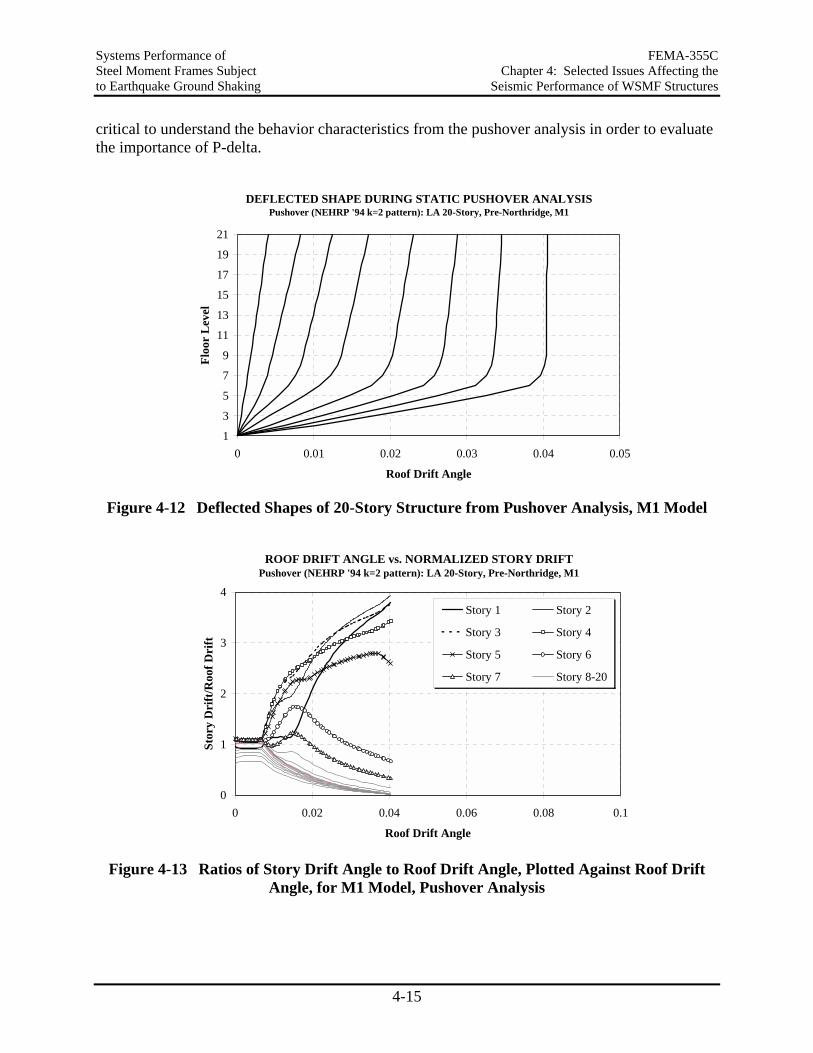
Systems Performance of FEMA-355C Steel Moment Frames Subject Chapter 4: Selected Issues Affecting the to Earthquake Ground Shaking Seismic Performance of WSMF Structures
4-15
critical to understand the behavior characteristics from the pushover analysis in order to evaluate the importance of P-delta.
DEFLECTED SHAPE DURING STATIC PUSHOVER ANALYSISPushover (NEHRP '94 k=2 pattern): LA 20-Story, Pre-Northridge, M1
1
3
5
7
9
11
13
15
17
19
21
0 0.01 0.02 0.03 0.04 0.05
Roof Drift Angle
Floo
r L
evel
Figure 4-12 Deflected Shapes of 20-Story Structure from Pushover Analysis, M1 Model
ROOF DRIFT ANGLE vs. NORMALIZED STORY DRIFT Pushover (NEHRP '94 k=2 pattern): LA 20-Story, Pre-Northridge, M1
0
1
2
3
4
0 0.02 0.04 0.06 0.08 0.1
Roof Drift Angle
Stor
y D
rift
/Roo
f Dri
ft
Story 1 Story 2
Story 3 Story 4
Story 5 Story 6
Story 7 Story 8-20
Figure 4-13 Ratios of Story Drift Angle to Roof Drift Angle, Plotted Against Roof Drift
Angle, for M1 Model, Pushover Analysis

FEMA-355C Systems Performance of Chapter 4: Selected Issues Affecting the Steel Moment Frames Subject Seismic Performance of WSMF Structures to Earthquake Ground Shaking
4-16
For steel moment frame structures in which member buckling is prevented, incremental sidesway collapse due to structure P-delta is the predominant global collapse mode. The P-delta problem is not adequately addressed in present codes. The utilization of an elastic story stability coefficient θi, such as the one used in the NEHRP'94 provisions (θi = Pi δi/(Vihi)), provides inadequate information on the occurrence of a negative post-mechanism stiffness and against excessive drifting of the seismic response. For elastic static behavior this coefficient is a measure of force and displacement amplification at the story level. For inelastic dynamic behavior, however, it is merely a rough indicator of the potential severity of P-delta effects. It is a flawed quantitative measure because of competing hardening and softening effects, and because the dynamic story stiffness (Vi/∆i) and strength may be quite different from the static counterparts due to force redistribution and higher mode effects.
The upshot of this short discussion is that inelastic dynamic P-delta effects are very difficult to evaluate, particularly if it is considered that their severity depends not only on structural characteristics and the intensity of seismic ground motions, but also on the duration and frequency characteristics of ground motions as will be illustrated later. On the other hand, it is postulated that P-delta effects are benign up to a certain level but potentially disastrous thereafter because they may lead to dynamic instability and collapse. When faced with such a dilemma, common sense dictates that efforts must be undertaken to understand and quantify the problem, but that in the interim every effort must be made in the design process to eliminate P-delta sensitive situations.
This section is an attempt to contribute to both of these objectives. Two case studies are presented for the purposes of
• illustrating P-delta sensitive behavior,
• identifying structural and ground motion characteristics that trigger P-delta sensitive response,
• demonstrating the sensitivity of predicted behavior to analytical modeling,
• contributing to the development of engineering guidelines for protection against excessive P-delta effects, and
• exploring the benefits of a secondary system for P-delta control.
The following two case studies illustrate the potential for severe P-delta effects for structures in which the cyclic load-deformation response of individual elements is assumed to be bilinear and stable, and is characterized by 3% strain hardening. If connections fracture or strength deterioration in elements occurs, the P-delta effects can only increase. However, there are mitigating conditions that are not considered in this study but which may reduce P-delta effects and any resulting global collapse potential. These conditions include cyclic hardening, which may greatly exceed the 3% assumed in this study, and contributions of nonstructural elements to the stiffness and strength of structures.
Much research is reported in the literature on the effects of P-delta on the seismic response of SDOF and MDOF systems. The reader is referred to Bernal (1998), Challa and Hall (1994),
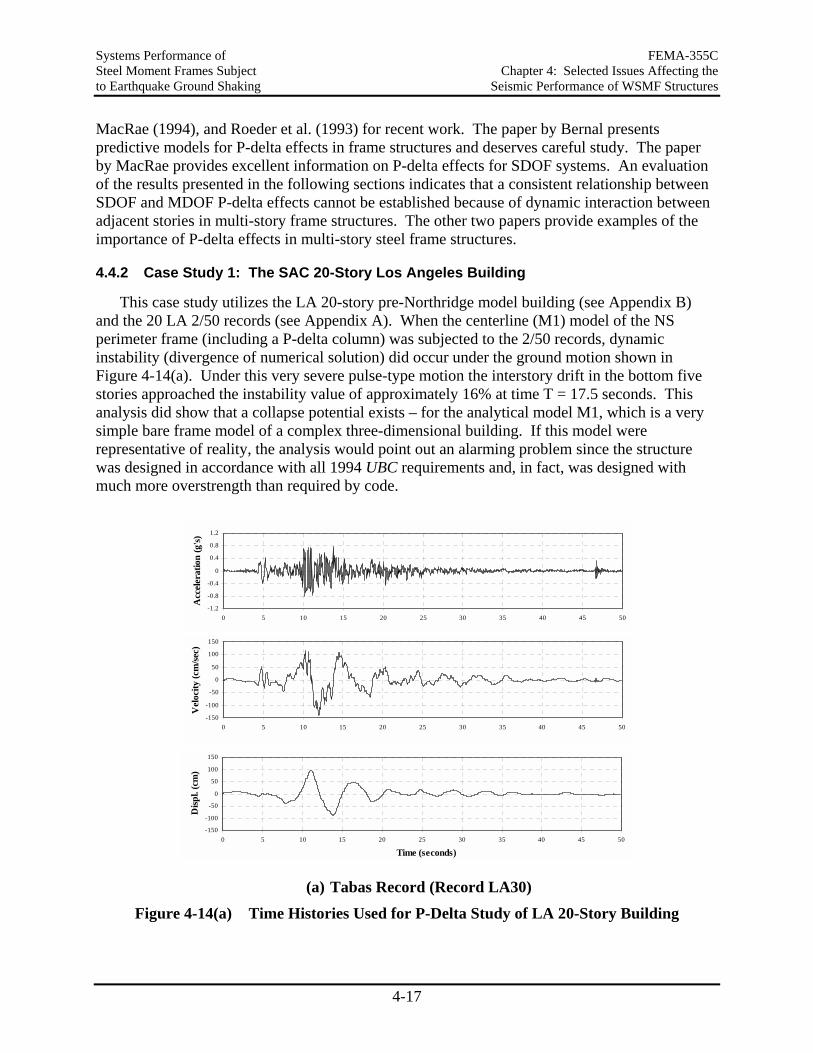
Systems Performance of FEMA-355C Steel Moment Frames Subject Chapter 4: Selected Issues Affecting the to Earthquake Ground Shaking Seismic Performance of WSMF Structures
4-17
MacRae (1994), and Roeder et al. (1993) for recent work. The paper by Bernal presents predictive models for P-delta effects in frame structures and deserves careful study. The paper by MacRae provides excellent information on P-delta effects for SDOF systems. An evaluation of the results presented in the following sections indicates that a consistent relationship between SDOF and MDOF P-delta effects cannot be established because of dynamic interaction between adjacent stories in multi-story frame structures. The other two papers provide examples of the importance of P-delta effects in multi-story steel frame structures.
4.4.2 Case Study 1: The SAC 20-Story Los Angeles Building
This case study utilizes the LA 20-story pre-Northridge model building (see Appendix B) and the 20 LA 2/50 records (see Appendix A). When the centerline (M1) model of the NS perimeter frame (including a P-delta column) was subjected to the 2/50 records, dynamic instability (divergence of numerical solution) did occur under the ground motion shown in Figure 4-14(a). Under this very severe pulse-type motion the interstory drift in the bottom five stories approached the instability value of approximately 16% at time T = 17.5 seconds. This analysis did show that a collapse potential exists – for the analytical model M1, which is a very simple bare frame model of a complex three-dimensional building. If this model were representative of reality, the analysis would point out an alarming problem since the structure was designed in accordance with all 1994 UBC requirements and, in fact, was designed with much more overstrength than required by code.
-1.2
-0.8
-0.4
0
0.4
0.8
1.2
0 5 10 15 20 25 30 35 40 45 50
Acc
eler
atio
n (g
's)
-150
-100
-50
0
50
100
150
0 5 10 15 20 25 30 35 40 45 50
Vel
ocity
(cm
/sec)
-150
-100
-50
0
50
100
150
0 5 10 15 20 25 30 35 40 45 50
Disp
l. (c
m)
Time (seconds)
(a) Tabas Record (Record LA30)
Figure 4-14(a) Time Histories Used for P-Delta Study of LA 20-Story Building
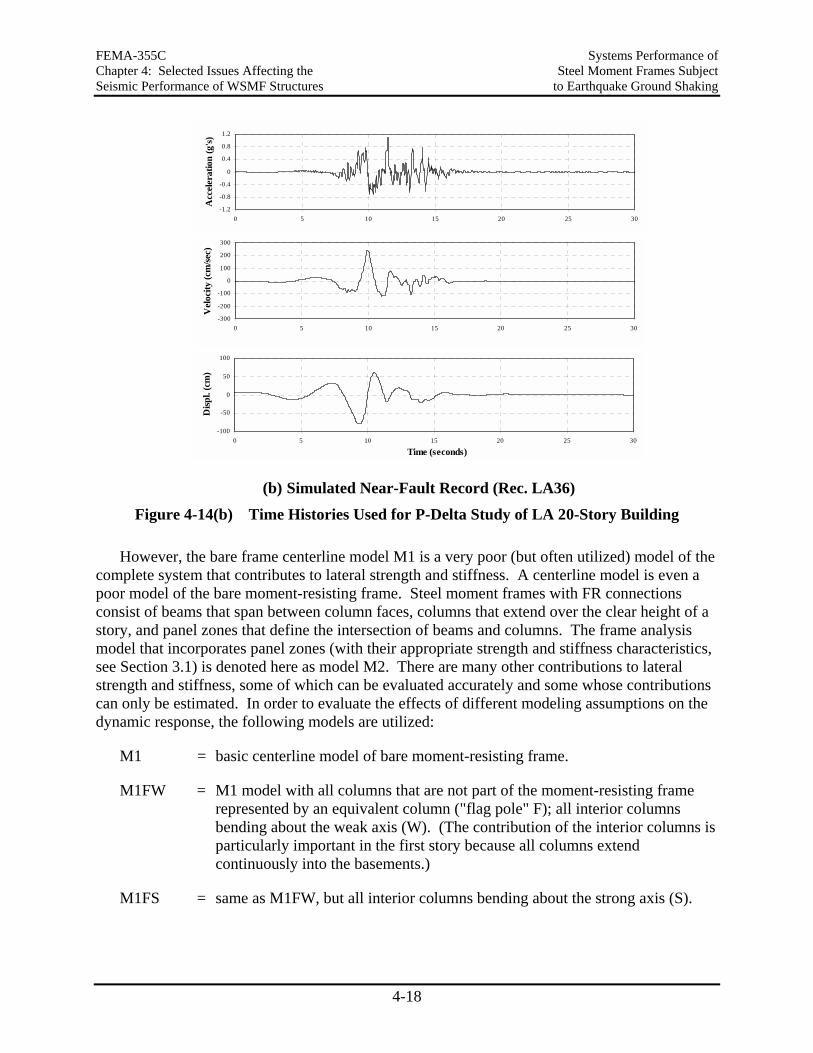
FEMA-355C Systems Performance of Chapter 4: Selected Issues Affecting the Steel Moment Frames Subject Seismic Performance of WSMF Structures to Earthquake Ground Shaking
4-18
-100
-50
0
50
100
0 5 10 15 20 25 30
Disp
l. (c
m)
-1.2
-0.8
-0.4
0
0.4
0.8
1.2
0 5 10 15 20 25 30A
ccel
erat
ion
(g's)
-300
-200
-100
0
100
200
300
0 5 10 15 20 25 30
Vel
ocity
(cm
/sec)
Time (seconds)
(b) Simulated Near-Fault Record (Rec. LA36)
Figure 4-14(b) Time Histories Used for P-Delta Study of LA 20-Story Building
However, the bare frame centerline model M1 is a very poor (but often utilized) model of the complete system that contributes to lateral strength and stiffness. A centerline model is even a poor model of the bare moment-resisting frame. Steel moment frames with FR connections consist of beams that span between column faces, columns that extend over the clear height of a story, and panel zones that define the intersection of beams and columns. The frame analysis model that incorporates panel zones (with their appropriate strength and stiffness characteristics, see Section 3.1) is denoted here as model M2. There are many other contributions to lateral strength and stiffness, some of which can be evaluated accurately and some whose contributions can only be estimated. In order to evaluate the effects of different modeling assumptions on the dynamic response, the following models are utilized:
M1 = basic centerline model of bare moment-resisting frame.
M1FW = M1 model with all columns that are not part of the moment-resisting frame represented by an equivalent column ("flag pole" F); all interior columns bending about the weak axis (W). (The contribution of the interior columns is particularly important in the first story because all columns extend continuously into the basements.)
M1FS = same as M1FW, but all interior columns bending about the strong axis (S).
Systems Performance of FEMA-355C Steel Moment Frames Subject Chapter 4: Selected Issues Affecting the to Earthquake Ground Shaking Seismic Performance of WSMF Structures
4-19
M1A = M1 model with best estimate of all (A) other "dependable" contributions (see comment below).
M2 = bare moment-resisting frame model incorporating panel zone strength and stiffness.
M2A = M2 model with best estimate of all other "dependable" contributions.
M2AK = M2A model with stiffness of beams and columns increased by 50% to account for nonstructural contributions.
M1-NPD = M1 model without P-delta effects.
M1E-PD = elastic M1 model with P-delta effects.
M1E-NPD = elastic M1 model without P-delta effects.
Strength and stiffness information on columns that are not part of the moment-resisting frames are taken from the design drawings. In the "A" models all interior columns bend about the weak axis.
Base shear versus roof drift diagrams for many of these models are shown in Figure 4-15. Significant improvements in strength and post-mechanism stiffness compared to the basic M1 model are evident. Adding the interior columns to the centerline model M1 (M1FW and M1FS) does not increase the strength by much but widens the strength plateau considerably, thus increasing the drift at which the global stiffness becomes negative. Adding all "reliable" contributions to the M1 model (M1A) increases the elastic stiffness and has an effect on the strength plateau similar to that of model M1FS.
The more realistic bare frame M2 model shows improved behavior compared to the M1 model because maximum moments in beams and columns are computed at panel zone boundaries rather than connection centerlines, and the shear strength and stiffness of the panel zones are relatively large. Adding all "reliable" contributions to the M2 model (M2A) increases the strength and widens the strength plateau considerably. The best behavior is observed for the model in which the stiffness of beams and columns is increased by 50% (M2AK).
Thus, a wide spectrum of static behavior is observed, depending on modeling assumptions. The most accurate model of the complete structure, M2A, exhibits a static response that is far superior to that of the simple centerline model M1. The width of the yield plateau is larger, the global drift at which a steep negative stiffness is attained is larger, and the global drift at which dynamic instability occurs is approximately 0.07 compared to 0.04 for model M1.
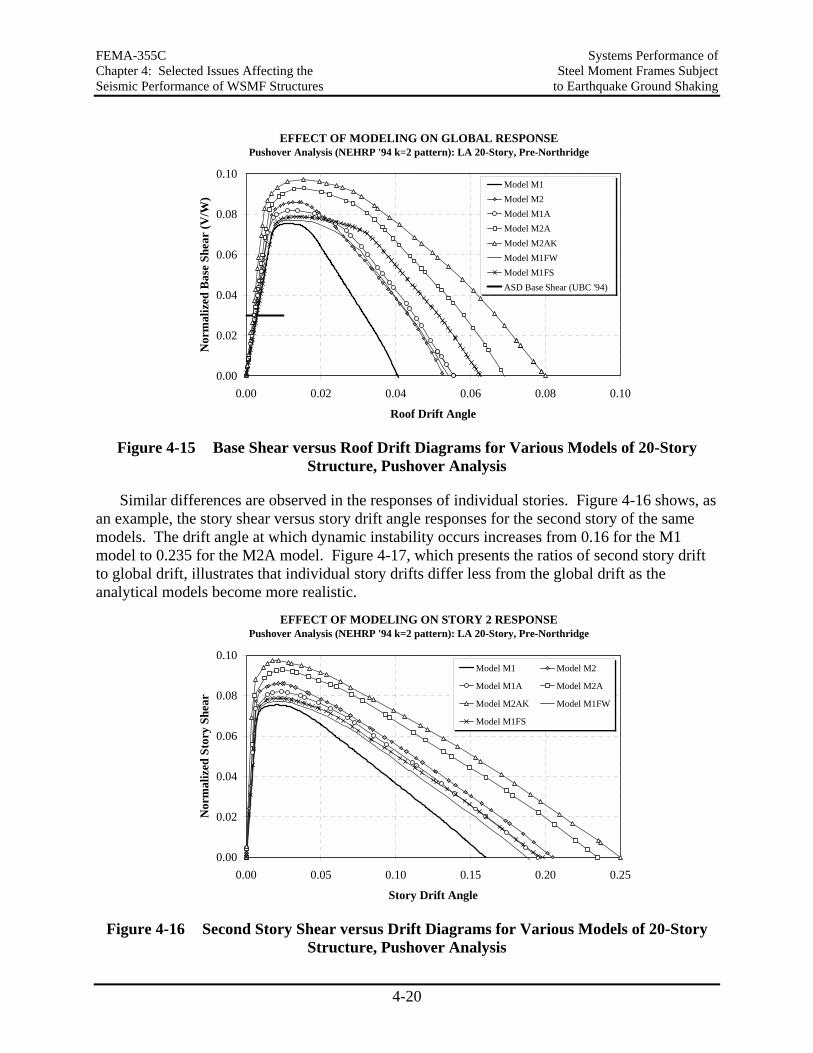
FEMA-355C Systems Performance of Chapter 4: Selected Issues Affecting the Steel Moment Frames Subject Seismic Performance of WSMF Structures to Earthquake Ground Shaking
4-20
EFFECT OF MODELING ON GLOBAL RESPONSEPushover Analysis (NEHRP '94 k=2 pattern): LA 20-Story, Pre-Northridge
0.00
0.02
0.04
0.06
0.08
0.10
0.00 0.02 0.04 0.06 0.08 0.10
Roof Drift Angle
Nor
mal
ized
Bas
e Sh
ear
(V/W
)
Model M1Model M2Model M1AModel M2AModel M2AKModel M1FWModel M1FSASD Base Shear (UBC '94)
Figure 4-15 Base Shear versus Roof Drift Diagrams for Various Models of 20-Story
Structure, Pushover Analysis
Similar differences are observed in the responses of individual stories. Figure 4-16 shows, as an example, the story shear versus story drift angle responses for the second story of the same models. The drift angle at which dynamic instability occurs increases from 0.16 for the M1 model to 0.235 for the M2A model. Figure 4-17, which presents the ratios of second story drift to global drift, illustrates that individual story drifts differ less from the global drift as the analytical models become more realistic.
EFFECT OF MODELING ON STORY 2 RESPONSEPushover Analysis (NEHRP '94 k=2 pattern): LA 20-Story, Pre-Northridge
0.00
0.02
0.04
0.06
0.08
0.10
0.00 0.05 0.10 0.15 0.20 0.25
Story Drift Angle
Nor
mal
ized
Sto
ry S
hear
Model M1 Model M2
Model M1A Model M2A
Model M2AK Model M1FW
Model M1FS
Figure 4-16 Second Story Shear versus Drift Diagrams for Various Models of 20-Story
Structure, Pushover Analysis
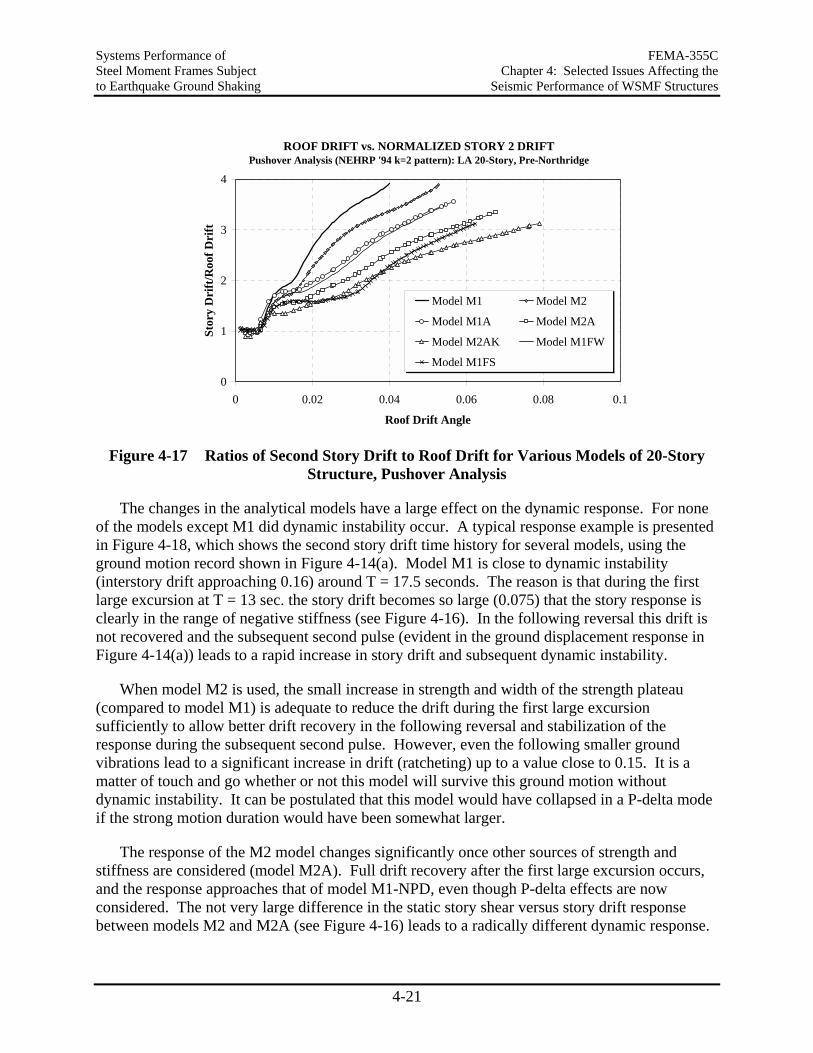
Systems Performance of FEMA-355C Steel Moment Frames Subject Chapter 4: Selected Issues Affecting the to Earthquake Ground Shaking Seismic Performance of WSMF Structures
4-21
ROOF DRIFT vs. NORMALIZED STORY 2 DRIFTPushover Analysis (NEHRP '94 k=2 pattern): LA 20-Story, Pre-Northridge
0
1
2
3
4
0 0.02 0.04 0.06 0.08 0.1
Roof Drift Angle
Stor
y D
rift
/Roo
f Dri
ft
Model M1 Model M2
Model M1A Model M2A
Model M2AK Model M1FW
Model M1FS
Figure 4-17 Ratios of Second Story Drift to Roof Drift for Various Models of 20-Story
Structure, Pushover Analysis
The changes in the analytical models have a large effect on the dynamic response. For none of the models except M1 did dynamic instability occur. A typical response example is presented in Figure 4-18, which shows the second story drift time history for several models, using the ground motion record shown in Figure 4-14(a). Model M1 is close to dynamic instability (interstory drift approaching 0.16) around T = 17.5 seconds. The reason is that during the first large excursion at T = 13 sec. the story drift becomes so large (0.075) that the story response is clearly in the range of negative stiffness (see Figure 4-16). In the following reversal this drift is not recovered and the subsequent second pulse (evident in the ground displacement response in Figure 4-14(a)) leads to a rapid increase in story drift and subsequent dynamic instability.
When model M2 is used, the small increase in strength and width of the strength plateau (compared to model M1) is adequate to reduce the drift during the first large excursion sufficiently to allow better drift recovery in the following reversal and stabilization of the response during the subsequent second pulse. However, even the following smaller ground vibrations lead to a significant increase in drift (ratcheting) up to a value close to 0.15. It is a matter of touch and go whether or not this model will survive this ground motion without dynamic instability. It can be postulated that this model would have collapsed in a P-delta mode if the strong motion duration would have been somewhat larger.
The response of the M2 model changes significantly once other sources of strength and stiffness are considered (model M2A). Full drift recovery after the first large excursion occurs, and the response approaches that of model M1-NPD, even though P-delta effects are now considered. The not very large difference in the static story shear versus story drift response between models M2 and M2A (see Figure 4-16) leads to a radically different dynamic response.
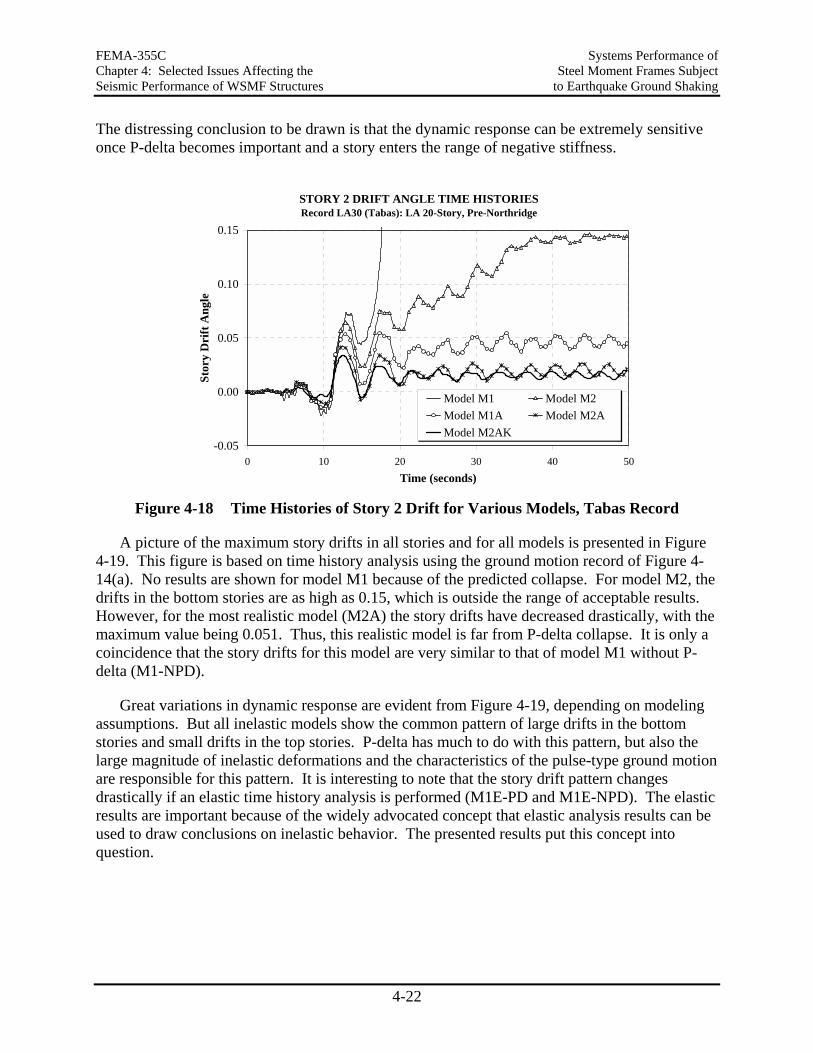
FEMA-355C Systems Performance of Chapter 4: Selected Issues Affecting the Steel Moment Frames Subject Seismic Performance of WSMF Structures to Earthquake Ground Shaking
4-22
The distressing conclusion to be drawn is that the dynamic response can be extremely sensitive once P-delta becomes important and a story enters the range of negative stiffness.
STORY 2 DRIFT ANGLE TIME HISTORIES Record LA30 (Tabas): LA 20-Story, Pre-Northridge
-0.05
0.00
0.05
0.10
0.15
0 10 20 30 40 50Time (seconds)
Stor
y D
rift
Ang
le
Model M1 Model M2Model M1A Model M2AModel M2AK
Figure 4-18 Time Histories of Story 2 Drift for Various Models, Tabas Record
A picture of the maximum story drifts in all stories and for all models is presented in Figure 4-19. This figure is based on time history analysis using the ground motion record of Figure 4-14(a). No results are shown for model M1 because of the predicted collapse. For model M2, the drifts in the bottom stories are as high as 0.15, which is outside the range of acceptable results. However, for the most realistic model (M2A) the story drifts have decreased drastically, with the maximum value being 0.051. Thus, this realistic model is far from P-delta collapse. It is only a coincidence that the story drifts for this model are very similar to that of model M1 without P-delta (M1-NPD).
Great variations in dynamic response are evident from Figure 4-19, depending on modeling assumptions. But all inelastic models show the common pattern of large drifts in the bottom stories and small drifts in the top stories. P-delta has much to do with this pattern, but also the large magnitude of inelastic deformations and the characteristics of the pulse-type ground motion are responsible for this pattern. It is interesting to note that the story drift pattern changes drastically if an elastic time history analysis is performed (M1E-PD and M1E-NPD). The elastic results are important because of the widely advocated concept that elastic analysis results can be used to draw conclusions on inelastic behavior. The presented results put this concept into question.
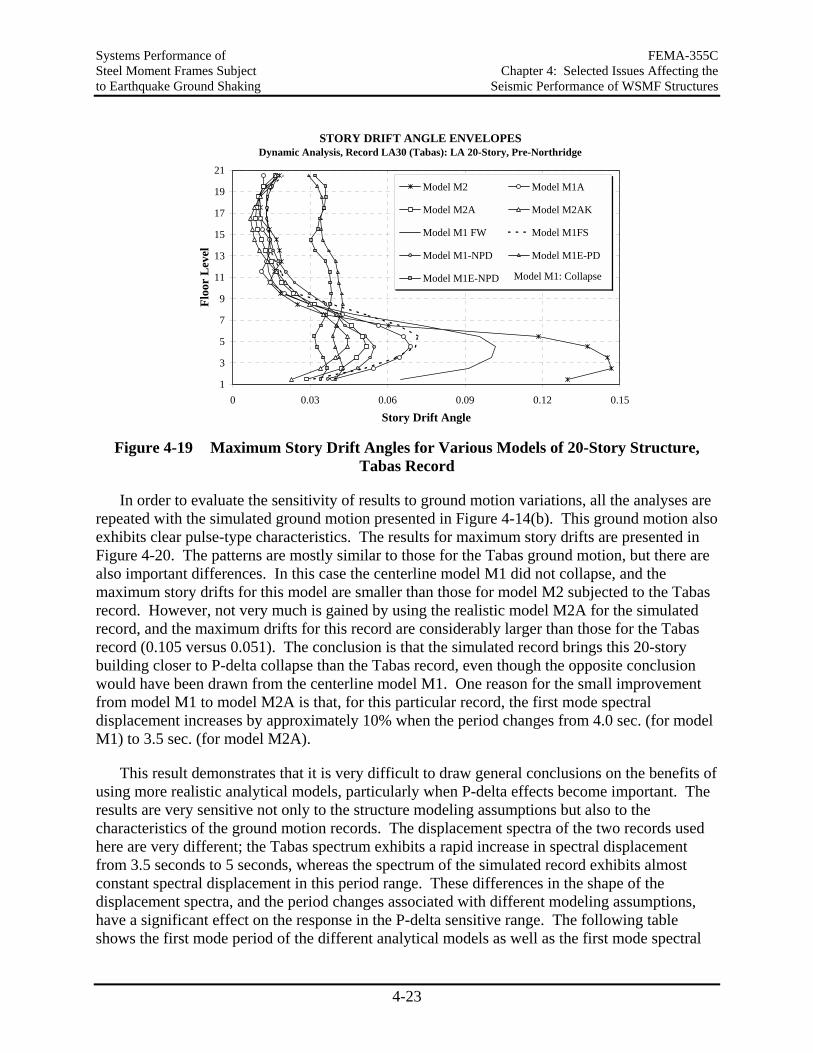
Systems Performance of FEMA-355C Steel Moment Frames Subject Chapter 4: Selected Issues Affecting the to Earthquake Ground Shaking Seismic Performance of WSMF Structures
4-23
STORY DRIFT ANGLE ENVELOPES Dynamic Analysis, Record LA30 (Tabas): LA 20-Story, Pre-Northridge
1
3
5
7
9
11
13
15
17
19
21
0 0.03 0.06 0.09 0.12 0.15
Story Drift Angle
Floo
r L
evel
Model M2 Model M1A
Model M2A Model M2AK
Model M1 FW Model M1FS
Model M1-NPD Model M1E-PD
Model M1E-NPD Model M1: Collapse
Figure 4-19 Maximum Story Drift Angles for Various Models of 20-Story Structure,
Tabas Record
In order to evaluate the sensitivity of results to ground motion variations, all the analyses are repeated with the simulated ground motion presented in Figure 4-14(b). This ground motion also exhibits clear pulse-type characteristics. The results for maximum story drifts are presented in Figure 4-20. The patterns are mostly similar to those for the Tabas ground motion, but there are also important differences. In this case the centerline model M1 did not collapse, and the maximum story drifts for this model are smaller than those for model M2 subjected to the Tabas record. However, not very much is gained by using the realistic model M2A for the simulated record, and the maximum drifts for this record are considerably larger than those for the Tabas record (0.105 versus 0.051). The conclusion is that the simulated record brings this 20-story building closer to P-delta collapse than the Tabas record, even though the opposite conclusion would have been drawn from the centerline model M1. One reason for the small improvement from model M1 to model M2A is that, for this particular record, the first mode spectral displacement increases by approximately 10% when the period changes from 4.0 sec. (for model M1) to 3.5 sec. (for model M2A).
This result demonstrates that it is very difficult to draw general conclusions on the benefits of using more realistic analytical models, particularly when P-delta effects become important. The results are very sensitive not only to the structure modeling assumptions but also to the characteristics of the ground motion records. The displacement spectra of the two records used here are very different; the Tabas spectrum exhibits a rapid increase in spectral displacement from 3.5 seconds to 5 seconds, whereas the spectrum of the simulated record exhibits almost constant spectral displacement in this period range. These differences in the shape of the displacement spectra, and the period changes associated with different modeling assumptions, have a significant effect on the response in the P-delta sensitive range. The following table shows the first mode period of the different analytical models as well as the first mode spectral
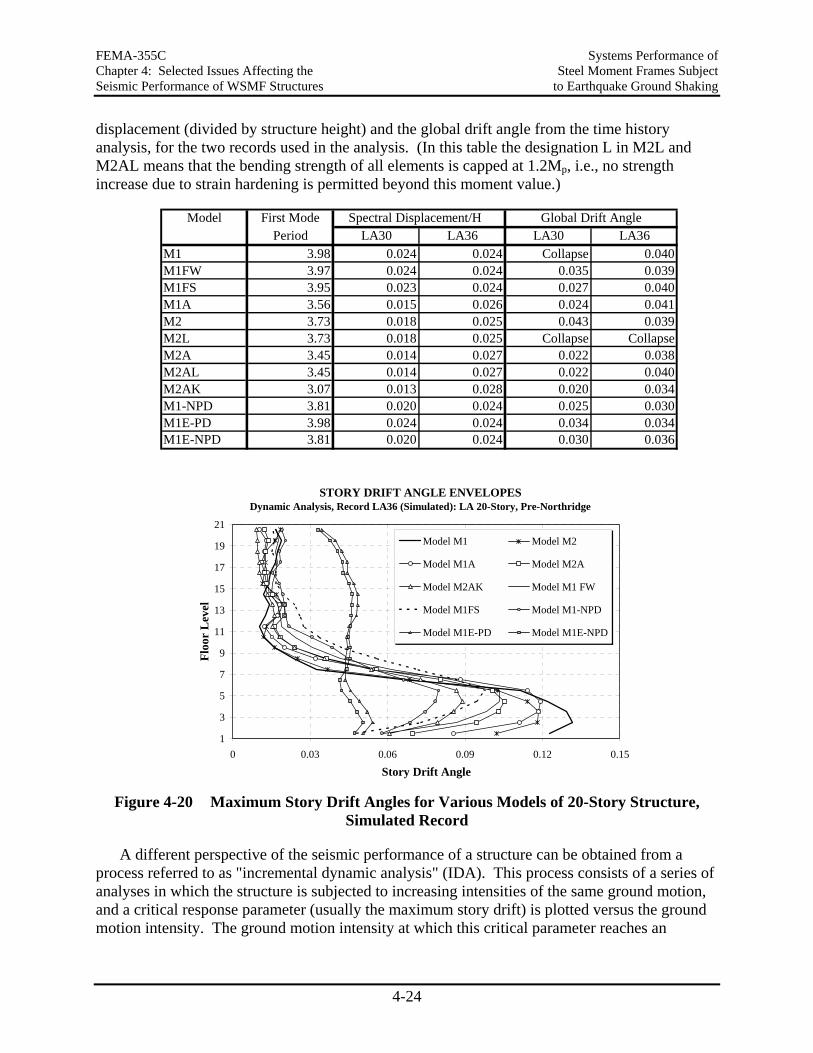
FEMA-355C Systems Performance of Chapter 4: Selected Issues Affecting the Steel Moment Frames Subject Seismic Performance of WSMF Structures to Earthquake Ground Shaking
4-24
displacement (divided by structure height) and the global drift angle from the time history analysis, for the two records used in the analysis. (In this table the designation L in M2L and M2AL means that the bending strength of all elements is capped at 1.2Mp, i.e., no strength increase due to strain hardening is permitted beyond this moment value.)
Model First Mode Spectral Displacement/H Global Drift AnglePeriod LA30 LA36 LA30 LA36
M1 3.98 0.024 0.024 Collapse 0.040M1FW 3.97 0.024 0.024 0.035 0.039M1FS 3.95 0.023 0.024 0.027 0.040M1A 3.56 0.015 0.026 0.024 0.041M2 3.73 0.018 0.025 0.043 0.039M2L 3.73 0.018 0.025 Collapse CollapseM2A 3.45 0.014 0.027 0.022 0.038M2AL 3.45 0.014 0.027 0.022 0.040M2AK 3.07 0.013 0.028 0.020 0.034M1-NPD 3.81 0.020 0.024 0.025 0.030M1E-PD 3.98 0.024 0.024 0.034 0.034M1E-NPD 3.81 0.020 0.024 0.030 0.036
STORY DRIFT ANGLE ENVELOPES Dynamic Analysis, Record LA36 (Simulated): LA 20-Story, Pre-Northridge
1
3
5
7
9
11
13
15
17
19
21
0 0.03 0.06 0.09 0.12 0.15
Story Drift Angle
Floo
r L
evel
Model M1 Model M2
Model M1A Model M2A
Model M2AK Model M1 FW
Model M1FS Model M1-NPD
Model M1E-PD Model M1E-NPD
Figure 4-20 Maximum Story Drift Angles for Various Models of 20-Story Structure,
Simulated Record
A different perspective of the seismic performance of a structure can be obtained from a process referred to as "incremental dynamic analysis" (IDA). This process consists of a series of analyses in which the structure is subjected to increasing intensities of the same ground motion, and a critical response parameter (usually the maximum story drift) is plotted versus the ground motion intensity. The ground motion intensity at which this critical parameter reaches an
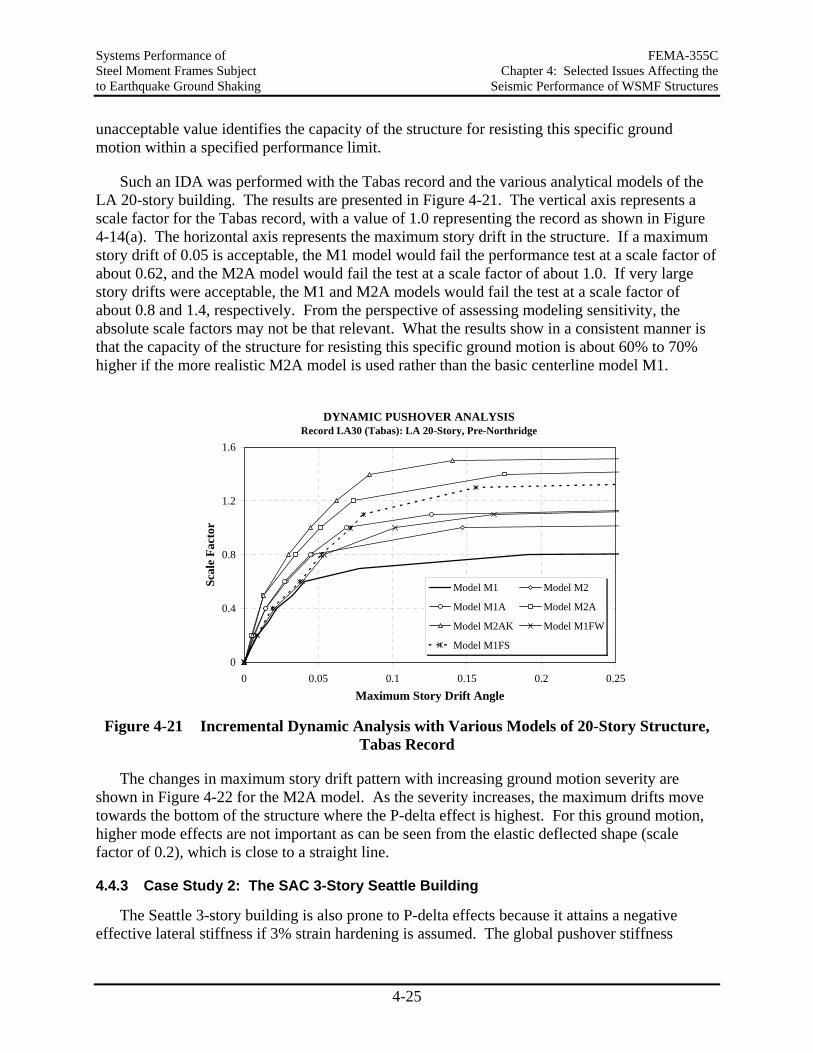
Systems Performance of FEMA-355C Steel Moment Frames Subject Chapter 4: Selected Issues Affecting the to Earthquake Ground Shaking Seismic Performance of WSMF Structures
4-25
unacceptable value identifies the capacity of the structure for resisting this specific ground motion within a specified performance limit.
Such an IDA was performed with the Tabas record and the various analytical models of the LA 20-story building. The results are presented in Figure 4-21. The vertical axis represents a scale factor for the Tabas record, with a value of 1.0 representing the record as shown in Figure 4-14(a). The horizontal axis represents the maximum story drift in the structure. If a maximum story drift of 0.05 is acceptable, the M1 model would fail the performance test at a scale factor of about 0.62, and the M2A model would fail the test at a scale factor of about 1.0. If very large story drifts were acceptable, the M1 and M2A models would fail the test at a scale factor of about 0.8 and 1.4, respectively. From the perspective of assessing modeling sensitivity, the absolute scale factors may not be that relevant. What the results show in a consistent manner is that the capacity of the structure for resisting this specific ground motion is about 60% to 70% higher if the more realistic M2A model is used rather than the basic centerline model M1.
DYNAMIC PUSHOVER ANALYSISRecord LA30 (Tabas): LA 20-Story, Pre-Northridge
0
0.4
0.8
1.2
1.6
0 0.05 0.1 0.15 0.2 0.25Maximum Story Drift Angle
Scal
e Fa
ctor
Model M1 Model M2
Model M1A Model M2A
Model M2AK Model M1FW
Model M1FS
Figure 4-21 Incremental Dynamic Analysis with Various Models of 20-Story Structure,
Tabas Record
The changes in maximum story drift pattern with increasing ground motion severity are shown in Figure 4-22 for the M2A model. As the severity increases, the maximum drifts move towards the bottom of the structure where the P-delta effect is highest. For this ground motion, higher mode effects are not important as can be seen from the elastic deflected shape (scale factor of 0.2), which is close to a straight line.
4.4.3 Case Study 2: The SAC 3-Story Seattle Building
The Seattle 3-story building is also prone to P-delta effects because it attains a negative effective lateral stiffness if 3% strain hardening is assumed. The global pushover stiffness
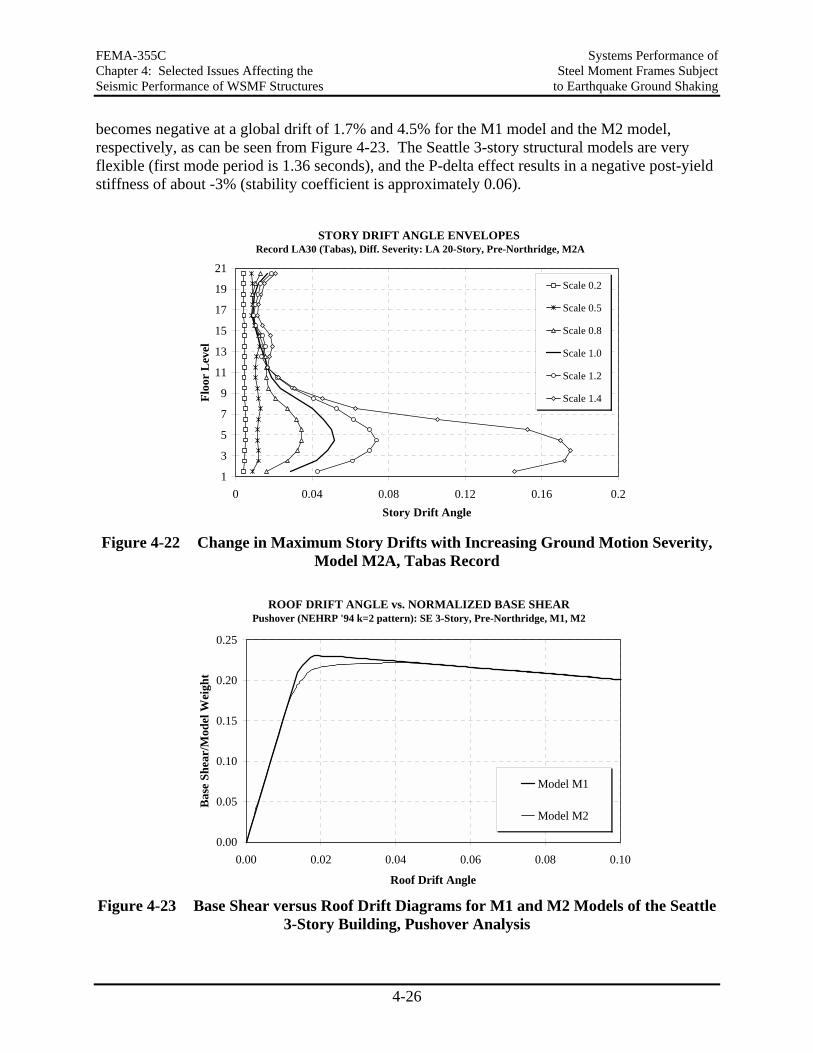
FEMA-355C Systems Performance of Chapter 4: Selected Issues Affecting the Steel Moment Frames Subject Seismic Performance of WSMF Structures to Earthquake Ground Shaking
4-26
becomes negative at a global drift of 1.7% and 4.5% for the M1 model and the M2 model, respectively, as can be seen from Figure 4-23. The Seattle 3-story structural models are very flexible (first mode period is 1.36 seconds), and the P-delta effect results in a negative post-yield stiffness of about -3% (stability coefficient is approximately 0.06).
STORY DRIFT ANGLE ENVELOPES Record LA30 (Tabas), Diff. Severity: LA 20-Story, Pre-Northridge, M2A
1
3
5
7
9
11
13
15
17
19
21
0 0.04 0.08 0.12 0.16 0.2Story Drift Angle
Floo
r L
evel
Scale 0.2
Scale 0.5
Scale 0.8
Scale 1.0
Scale 1.2
Scale 1.4
Figure 4-22 Change in Maximum Story Drifts with Increasing Ground Motion Severity,
Model M2A, Tabas Record
ROOF DRIFT ANGLE vs. NORMALIZED BASE SHEARPushover (NEHRP '94 k=2 pattern): SE 3-Story, Pre-Northridge, M1, M2
0.00
0.05
0.10
0.15
0.20
0.25
0.00 0.02 0.04 0.06 0.08 0.10
Roof Drift Angle
Bas
e Sh
ear/
Mod
el W
eigh
t
Model M1
Model M2
Figure 4-23 Base Shear versus Roof Drift Diagrams for M1 and M2 Models of the Seattle
3-Story Building, Pushover Analysis
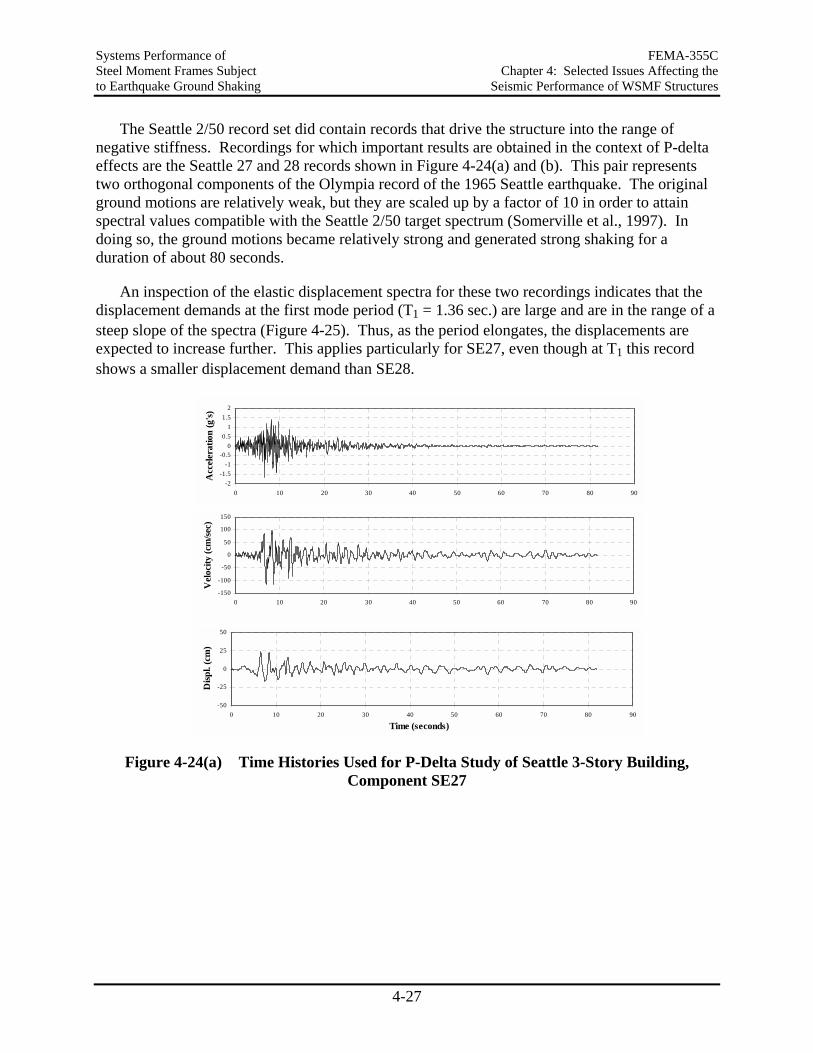
Systems Performance of FEMA-355C Steel Moment Frames Subject Chapter 4: Selected Issues Affecting the to Earthquake Ground Shaking Seismic Performance of WSMF Structures
4-27
The Seattle 2/50 record set did contain records that drive the structure into the range of negative stiffness. Recordings for which important results are obtained in the context of P-delta effects are the Seattle 27 and 28 records shown in Figure 4-24(a) and (b). This pair represents two orthogonal components of the Olympia record of the 1965 Seattle earthquake. The original ground motions are relatively weak, but they are scaled up by a factor of 10 in order to attain spectral values compatible with the Seattle 2/50 target spectrum (Somerville et al., 1997). In doing so, the ground motions became relatively strong and generated strong shaking for a duration of about 80 seconds.
An inspection of the elastic displacement spectra for these two recordings indicates that the displacement demands at the first mode period (T1 = 1.36 sec.) are large and are in the range of a steep slope of the spectra (Figure 4-25). Thus, as the period elongates, the displacements are expected to increase further. This applies particularly for SE27, even though at T1 this record shows a smaller displacement demand than SE28.
-2-1.5
-1-0.5
00.5
11.5
2
0 10 20 30 40 50 60 70 80 90
Acc
eler
atio
n (g
's)
-150
-100
-50
0
50
100
150
0 10 20 30 40 50 60 70 80 90
Vel
ocity
(cm
/sec)
-50
-25
0
25
50
0 10 20 30 40 50 60 70 80 90
Disp
l. (c
m)
Time (seconds)
Figure 4-24(a) Time Histories Used for P-Delta Study of Seattle 3-Story Building, Component SE27
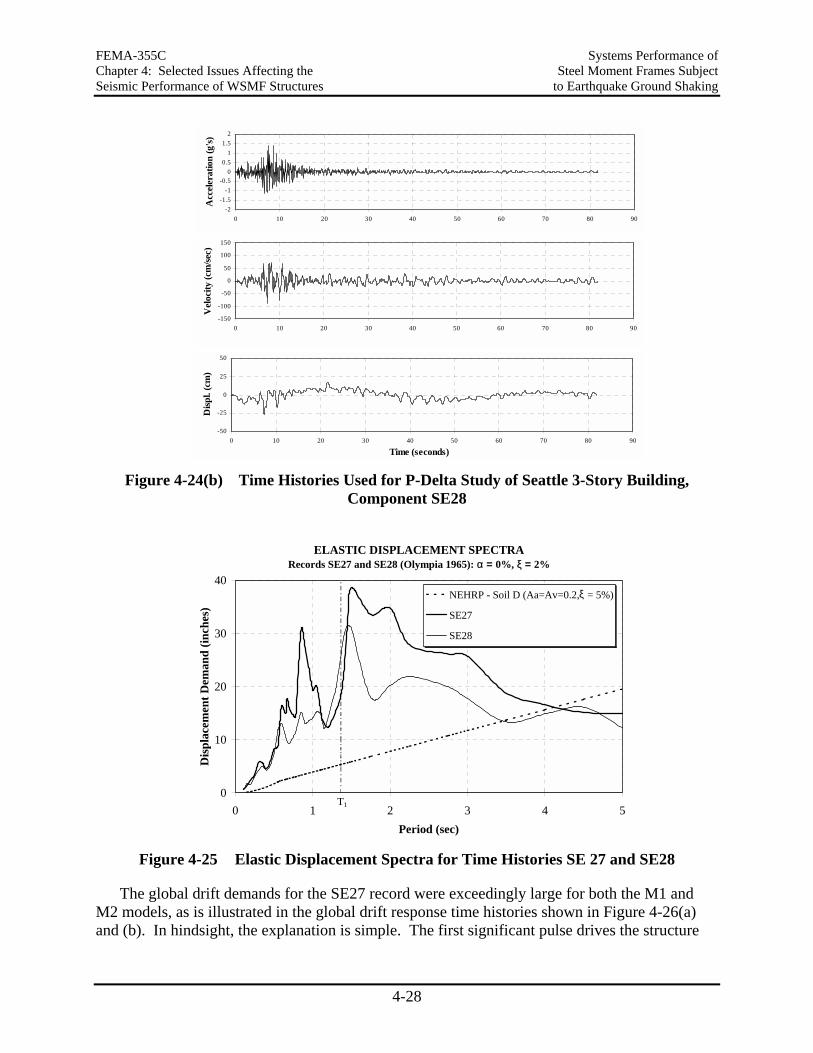
FEMA-355C Systems Performance of Chapter 4: Selected Issues Affecting the Steel Moment Frames Subject Seismic Performance of WSMF Structures to Earthquake Ground Shaking
4-28
-2-1.5
-1-0.5
00.5
11.5
2
0 10 20 30 40 50 60 70 80 90A
ccel
erat
ion
(g's)
-150
-100
-50
0
50
100
150
0 10 20 30 40 50 60 70 80 90
Vel
ocity
(cm
/sec)
-50
-25
0
25
50
0 10 20 30 40 50 60 70 80 90
Disp
l. (c
m)
Time (seconds) Figure 4-24(b) Time Histories Used for P-Delta Study of Seattle 3-Story Building,
Component SE28
ELASTIC DISPLACEMENT SPECTRARecords SE27 and SE28 (Olympia 1965): α = 0%, ξ = 2%
0
10
20
30
40
0 1 2 3 4 5Period (sec)
Dis
plac
emen
t Dem
and
(inch
es)
NEHRP - Soil D (Aa=Av=0.2, = 5%)
SE27
SE28
ξ
T1
Figure 4-25 Elastic Displacement Spectra for Time Histories SE 27 and SE28
The global drift demands for the SE27 record were exceedingly large for both the M1 and M2 models, as is illustrated in the global drift response time histories shown in Figure 4-26(a) and (b). In hindsight, the explanation is simple. The first significant pulse drives the structure
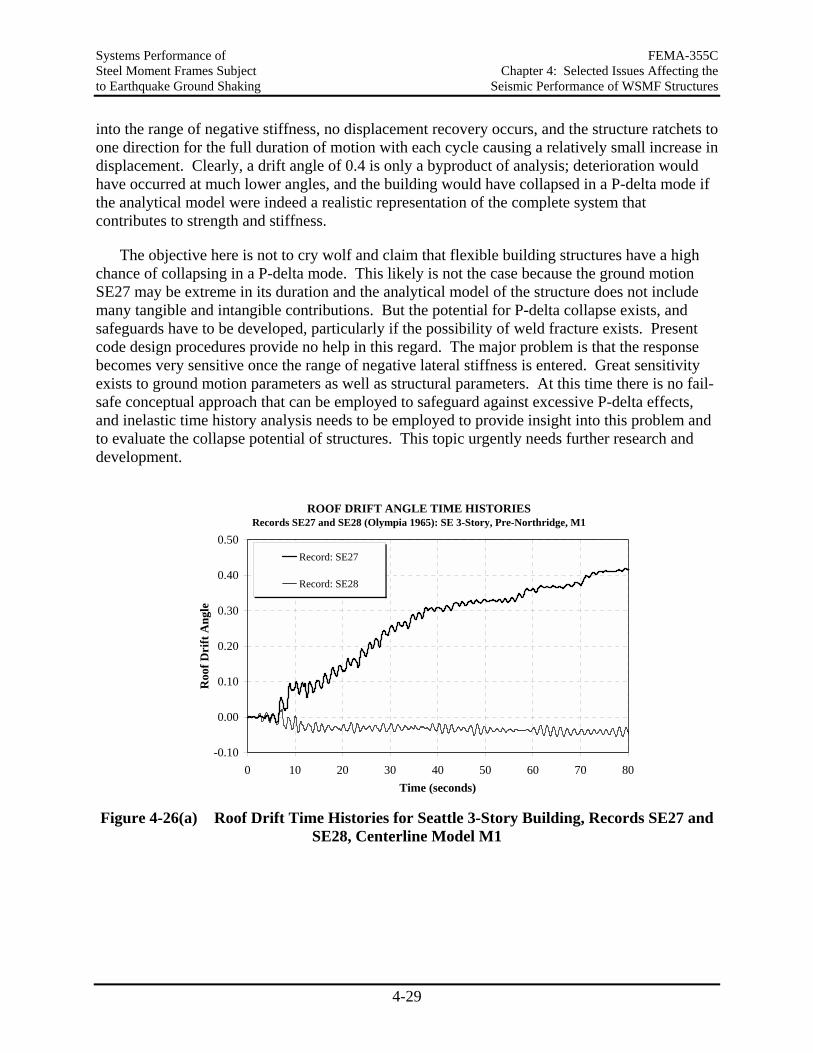
Systems Performance of FEMA-355C Steel Moment Frames Subject Chapter 4: Selected Issues Affecting the to Earthquake Ground Shaking Seismic Performance of WSMF Structures
4-29
into the range of negative stiffness, no displacement recovery occurs, and the structure ratchets to one direction for the full duration of motion with each cycle causing a relatively small increase in displacement. Clearly, a drift angle of 0.4 is only a byproduct of analysis; deterioration would have occurred at much lower angles, and the building would have collapsed in a P-delta mode if the analytical model were indeed a realistic representation of the complete system that contributes to strength and stiffness.
The objective here is not to cry wolf and claim that flexible building structures have a high chance of collapsing in a P-delta mode. This likely is not the case because the ground motion SE27 may be extreme in its duration and the analytical model of the structure does not include many tangible and intangible contributions. But the potential for P-delta collapse exists, and safeguards have to be developed, particularly if the possibility of weld fracture exists. Present code design procedures provide no help in this regard. The major problem is that the response becomes very sensitive once the range of negative lateral stiffness is entered. Great sensitivity exists to ground motion parameters as well as structural parameters. At this time there is no fail-safe conceptual approach that can be employed to safeguard against excessive P-delta effects, and inelastic time history analysis needs to be employed to provide insight into this problem and to evaluate the collapse potential of structures. This topic urgently needs further research and development.
ROOF DRIFT ANGLE TIME HISTORIES Records SE27 and SE28 (Olympia 1965): SE 3-Story, Pre-Northridge, M1
-0.10
0.00
0.10
0.20
0.30
0.40
0.50
0 10 20 30 40 50 60 70 80Time (seconds)
Roo
f Dri
ft A
ngle
Record: SE27
Record: SE28
Figure 4-26(a) Roof Drift Time Histories for Seattle 3-Story Building, Records SE27 and
SE28, Centerline Model M1
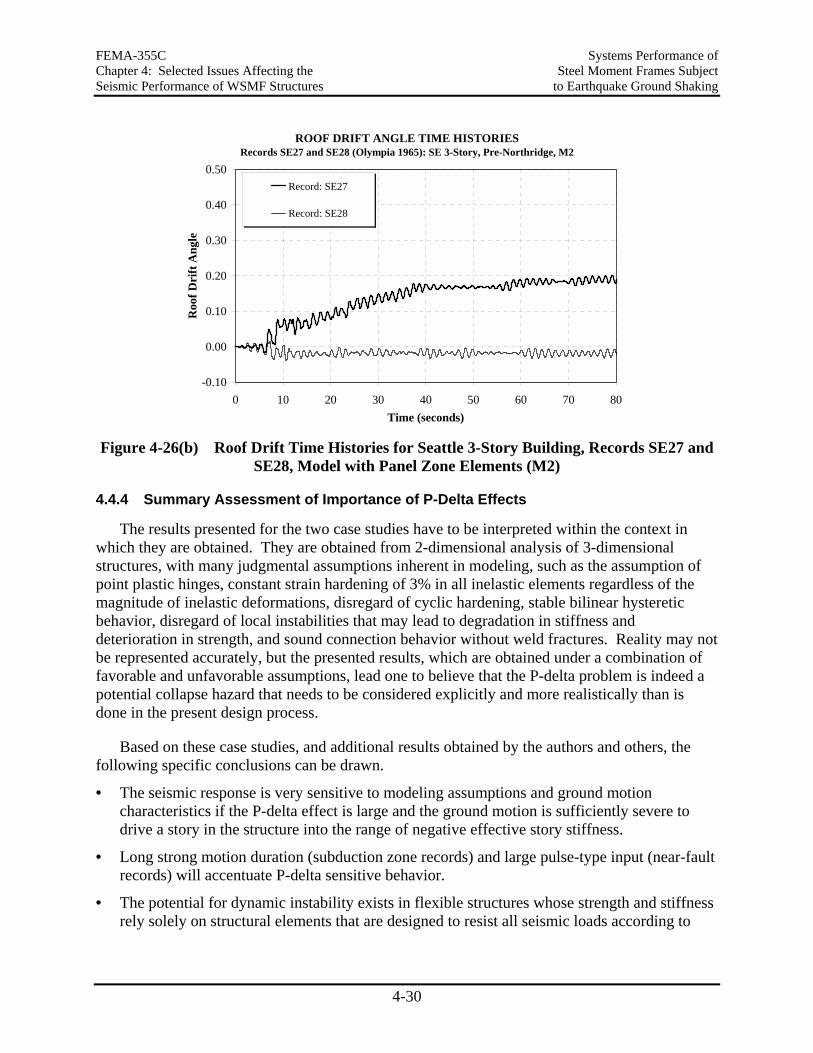
FEMA-355C Systems Performance of Chapter 4: Selected Issues Affecting the Steel Moment Frames Subject Seismic Performance of WSMF Structures to Earthquake Ground Shaking
4-30
ROOF DRIFT ANGLE TIME HISTORIES Records SE27 and SE28 (Olympia 1965): SE 3-Story, Pre-Northridge, M2
-0.10
0.00
0.10
0.20
0.30
0.40
0.50
0 10 20 30 40 50 60 70 80Time (seconds)
Roo
f Dri
ft A
ngle
Record: SE27
Record: SE28
Figure 4-26(b) Roof Drift Time Histories for Seattle 3-Story Building, Records SE27 and
SE28, Model with Panel Zone Elements (M2)
4.4.4 Summary Assessment of Importance of P-Delta Effects
The results presented for the two case studies have to be interpreted within the context in which they are obtained. They are obtained from 2-dimensional analysis of 3-dimensional structures, with many judgmental assumptions inherent in modeling, such as the assumption of point plastic hinges, constant strain hardening of 3% in all inelastic elements regardless of the magnitude of inelastic deformations, disregard of cyclic hardening, stable bilinear hysteretic behavior, disregard of local instabilities that may lead to degradation in stiffness and deterioration in strength, and sound connection behavior without weld fractures. Reality may not be represented accurately, but the presented results, which are obtained under a combination of favorable and unfavorable assumptions, lead one to believe that the P-delta problem is indeed a potential collapse hazard that needs to be considered explicitly and more realistically than is done in the present design process.
Based on these case studies, and additional results obtained by the authors and others, the following specific conclusions can be drawn.
• The seismic response is very sensitive to modeling assumptions and ground motion characteristics if the P-delta effect is large and the ground motion is sufficiently severe to drive a story in the structure into the range of negative effective story stiffness.
• Long strong motion duration (subduction zone records) and large pulse-type input (near-fault records) will accentuate P-delta sensitive behavior.
• The potential for dynamic instability exists in flexible structures whose strength and stiffness rely solely on structural elements that are designed to resist all seismic loads according to
Systems Performance of FEMA-355C Steel Moment Frames Subject Chapter 4: Selected Issues Affecting the to Earthquake Ground Shaking Seismic Performance of WSMF Structures
4-31
present code requirements (the M2 model is a rather accurate representation of the moment frames that are designed to resist all seismic design loads).
• Incorporation of other elements, which are not explicitly assigned to resist seismic effects but contribute to lateral strength and stiffness, in the analytical model may improve the seismic behavior significantly.
• Simplified analytical models (e.g., the M1 model) may give a misleading picture of the importance of P-delta effects. In cases not discussed here the M1 model developed story mechanisms that resulted in dynamic instability, whereas stable and controlled response was obtained with the M2 model.
• If large P-delta effects are present, the need exists to use the best possible analytical model of the complete structure in order to achieve a realistic assessment of the importance of P-delta effects.
• Elastic analysis will not be able to replicate the effects of P-delta on the inelastic system response, neither in terms of maximum response of critical parameters nor in terms of the distribution of demands over the height of the structure.
• The static pushover analysis is very useful in understanding the behavior of the structure and in identifying P-delta sensitivity. The analysis provides an estimate of the drift levels at which the negative post-yield stiffness is attained.
At this time no simple procedure can be recommended that will permit a definite assessment of the collapse hazard due to P-delta effects. There is a relatively simple, but not guaranteed, way to capture the onset of P-delta sensitive response. It is associated with the attainment of a drift at which the global pushover curve shows a clear negative slope. Once the range of negative stiffness is entered, ratcheting becomes an issue. This ratcheting may, but not necessarily will, bring the structure close to incremental collapse. For this reason it is prudent to design structures so that the negative stiffness range will not be entered. The following approach may be feasible to achieve this objective:
1. From a hazard analysis, determine the spectral displacement (at the fundamental period of the structure) for the hazard level at which protection against dynamic instability is desired. This should be a spectral displacement associated with a very low probability of being exceeded.
2. Multiply this spectral displacement by the first mode participation factor to obtain an estimate of the roof displacement demand for the structure (Krawinkler and Seneviratna 1998).
3. Perform several inelastic pushover analyses under various lateral load patterns. The FEMA 273 (1997) guidelines provide useful suggestions for this purpose. From the global pushover curves the smallest roof displacement at which the slope clearly becomes negative can be identified.
4. If the roof displacement determined in step 3 is greater than the roof displacement demand estimated in step 2, then dynamic instability is a very unlikely event. (Ideally, the pushover analysis in step 3 should be performed with an accurate analytical model that incorporates all “reliable” contributions to lateral strength and stiffness. Simplified models may be adequate
FEMA-355C Systems Performance of Chapter 4: Selected Issues Affecting the Steel Moment Frames Subject Seismic Performance of WSMF Structures to Earthquake Ground Shaking
4-32
if they provide low estimates of story strength and stiffness but still pass the criterion given here.)
5. If the roof displacement determined in step 3 is smaller than the roof displacement estimated in step 2, then additional protection against dynamic instability should be provided. This can be achieved in different ways, including but not limited to the following options:
• Provide a flexible backup system with sufficient story stiffness to overcome the effect of P-delta on the lateral stiffness. The interior gravity load system can fulfill this function, but it needs to be designed for it. (As a first approximation, the elastic stiffness of the gravity load system (as a percentage of the elastic stiffness of the bare frame) should exceed the stability coefficient value.)
• Provide more redundancy in the structural system and tune the strength of members such that plastic hinging occurs at widely spaced story drifts. This will increase the story drift at which a mechanism forms.
This procedure is feasible if the pushover response can be predicted with confidence up to the roof displacement demand estimated in step 2. This implies that element strength deterioration (including weld fracture) should be incorporated in the pushover analysis if it is expected to occur below this displacement level. This is easier said than done and is hardly possible with today’s analytical techniques. At this time we may have to compromise between simplicity and accuracy and accept the following argument of compensating “errors”: Some strength deterioration may occur before the reference displacement level is reached, which will accelerate the onset of negative stiffness, but attainment of the onset of negative stiffness merely is a trigger for ratcheting and is not synonymous with attainment of dynamic instability. The proposed procedure is neither elegant nor reliable, but most likely it provides conservative protection against dynamic instability. The need exists to develop better approaches through research.
For steel frame structures, safety against collapse implies control of story drift. In essence, there are only two phenomena that may lead to uncontrolled story drift. One is the effect of gravity loads acting on the deformed configuration of the structure (P-delta effect), and the other is deterioration in element behavior (local instabilities, fractures, member buckling, etc.). Such deterioration will amplify the P-delta effect because less resistance is available to counteract the second order effects.
Thus, P-delta is the overriding issue for collapse safety, and the system performance topics discussed in the remainder of this report must be interpreted with this statement in mind.
Systems Performance of FEMA-355C Steel Moment Frames Subject Chapter 5: Inelastic Seismic Demands for Ductile to Earthquake Ground Shaking WSMF Systems with Fully Restrained Connections
5-1
5. INELASTIC SEISMIC DEMANDS FOR DUCTILE WSMF SYSTEMS WITH FULLY RESTRAINED CONNECTIONS
5.1 Introduction
5.1.1 Emphasis of this Chapter
The response of WSMF structures, when subjected to severe ground motions, is controlled by the three-dimensional strength, stiffness, and energy dissipation characteristics of the structural system and its components. It is affected by higher mode effects, torsional effects, distribution of inelastic deformations in the structure, effects of strength, mass, and stiffness irregularities, and effects of deterioration of hysteretic characteristics. For structures that are regular in plan and elevation, whose story shear strength varies over the height in accordance with code design shear force distributions, and whose components do not deteriorate, the inelastic dynamic response characteristics will follow predictable patterns, even though these patterns will strongly depend on the frequency characteristics of the ground motions to which the structure may be subjected. When significant irregularities in plan or elevation exist, the inelastic dynamic characteristics may change drastically. In such cases it must be acknowledged that even a reasonable prediction of the inelastic dynamic response will necessitate the use of inelastic time history analysis. Irregularities are not addressed in this report. The purpose of this chapter is to point out discernible dynamic response characteristics that should be helpful in understanding and quantifying inelastic seismic response.
The emphasis in the following sections is on an evaluation of global and local demands for "regular" code designed structures in various regions of seismicity, and of the sensitivity of the demands to structural and ground motion characteristics. The SAC 3-, 9-, and 20-story structures represent "regular" code designed structures. The quantitative data derived from the response analysis of the SAC model structures must be put into perspective with the design process, which followed 1994 design codes. Designs according to newer codes would result in stronger and stiffer structures. Response results are used here merely to illustrate many of the issues and findings discussed in this chapter, but much advantage is taken of the large body of knowledge developed over the years on the seismic behavior characteristics of steel frames and their components in supporting the statements made and the conclusions drawn on seismic performance of WSMF structures. The discussion focuses on information derived from 2-dimensional inelastic time history analysis. Specific aspects of three-dimensional behavior are summarized in Section 5.9.
This chapter does not address all issues of importance in seismic demand evaluation of WSMFs. It focuses on issues that need to be considered in support of the basic objective of the SAC steel program, which is to evaluate, and find solutions to, seismic safety concerns raised by the recently observed fractures at welded beam-to-column connections. It does not address the performance of WSMFs with fractured connections, but it provides the background needed to assess fracture potential and its consequences on performance. The effects of deterioration of hysteretic characteristics are summarized in Section 5.11, but in all other sections it is assumed that no deterioration of hysteretic characteristics occurs. The chapter also focuses on issues that
FEMA-355C Systems Performance of Chapter 5: Inelastic Seismic Demands for Ductile Steel Moment Frames Subject WSMF Systems with Fully Restrained Connections to Earthquake Ground Shaking
5-2
will facilitate the development of alternatives to the standard pre-Northridge welded connection and of improvements to present design procedures. Last but not least it provides input and quantitative information for performance assessment at different performance levels, which should facilitate the development of performance-based design procedures.
5.1.2 Ground Motion Issues
For design purposes, ground motions are represented by design spectra that replicate uniform hazard spectra. The shape of the spectra is used to evaluate higher mode effects even though the shape usually is controlled by various events of different magnitude and distance rather than by a single event. Thus, higher mode effects may not be well represented by design spectra, and neither are specific characteristics of near-fault ground motions and of ground motions occurring in soft soils. The conclusion is that design spectra likely are adequate for what they are intended – to provide guidance for conceptual design and for sizing of structural elements. They may not be adequate for a performance evaluation, which should be based on the response to ground motions that are expected at the site, including appropriate measures of dispersion. For this reason, the discussion presented in this chapter is based on results of nonlinear time history analysis rather than spectral analysis. Sets of ground motions are used that correspond to specific return periods as discussed in Section 5.3.1. In Section 5.8, attention is given to the effects of special characteristics of near-fault and soft soil ground motions.
5.2 Global and Local Behavior – Pushover Analysis
The behavior of structures can be evaluated using inelastic static analysis (pushover analysis, Section 3.3). This analysis technique permits an estimation for the overstrength, identification of locations of potential weaknesses and irregularities (if any), assessment of force demands on brittle elements, assessment of completeness and adequacy of load path, and an estimate of the inelastic strength and deformation demands for ductile elements. The pushover analysis is useful to develop a better understanding of the behavior of the structure and for rationalization of the nonlinear dynamic response of the structure.
Different lateral load patterns may be applied to the model of the structure. In the SAC studies, the NEHRP '94 (FEMA 302 (1997)) design load pattern with an exponent of k = 2.0 is employed. Displacement control rather than load control needs to be applied in order to study the formation of mechanisms and structural behavior characteristics after mechanism formation. Pushover results may not mimic accurately the dynamic response, but they provide insight into structural behavior (Krawinkler and Seneviratna, 1998). An assessment of the pushover analysis as a tool for performance assessment is provided in Section 5.12.2.
Pushover analysis may be performed on 2- or 3-dimensional models of the structure. The results discussed here are based on 2-dimensional models of the SAC structures, using the NS perimeter frame and half the structure for P-delta considerations and contributions of interior frames.
Systems Performance of FEMA-355C Steel Moment Frames Subject Chapter 5: Inelastic Seismic Demands for Ductile to Earthquake Ground Shaking WSMF Systems with Fully Restrained Connections
5-3
5.2.1 Global Lateral Load – Drift Behavior
Global behavior may be described by means of base shear-roof drift diagrams, story shear-story drift diagrams, and diagrams that show how the individual story drifts change with an increase in the control displacement, which is usually the roof displacement. Shears can be normalized to the weight of the structure, and drifts can be expressed in terms of drift angles, i.e., the lateral displacements are divided by the structure height (for roof drift angle) or the story height (for story drift angle).
The basic pushover curve is the base shear-roof drift diagram, which permits an assessment of the global structure strength and stiffness, the overstrength (in relation to the design strength level), and the load-displacement behavior after the strength of the structure has been attained. The latter is important in assessing the sensitivity to P-delta effects. Global pushover curves for the nine pre- and post-Northridge structures are presented in Figures 5-1 to 5-3. Results for models M1 and M2 are presented for the pre-Northridge structures, and results for model M2 only are presented for the post-Northridge structures. The seismic design base shear level (allowable stress design was used) according to the UBC ‘94 is also marked on the figures to provide an estimate of the effective overstrength in the structures.
Basic information on system behavior characteristics can be obtained also from evaluating the variation of story drifts with an increase in roof drift. This behavior aspect can be represented by diagrams that depict the ratio of story drift over roof drift, plotted against roof drift. If this ratio is larger than unity, it implies that the story contributes more than its proportional share to the roof drift. An increase in this ratio with an increase in roof drift implies that the story becomes relatively soft, which is an indication that it is likely to experience very large drifts in major earthquakes. If the ratio becomes very large, it implies that a weak story exists that may lead to a concentration of deformation demands in this story. It may indicate the potential for a story mechanism. Specific examples of such diagrams are shown in Figure 5-4.
Additional global pushover curves, which are used for illustration in the subsequent discussion, are presented in Figures 5-5 and 5-6. An inspection of the diagrams presented in Figures 5-1 to 5-6 permits the extraction of important observations and conclusions on the seismic behavior of WSMFs. These observations and conclusions permit extrapolation to general conditions, but they must be interpreted with caution because they are based on a series of case studies utilizing specific designs that are affected by subjective decisions made by the design engineers. Global strength-drift response is a function of local behavior, in particular of the decisions made on the relative strength of the elements framing into beam-to column connections. The reader is referred to Appendix B, which delineates many of the design decisions and the resulting member sizes. The results also depend on assumptions made in analytical modeling. The basic assumptions in modeling the SAC structures are summarized in Section 3.5.
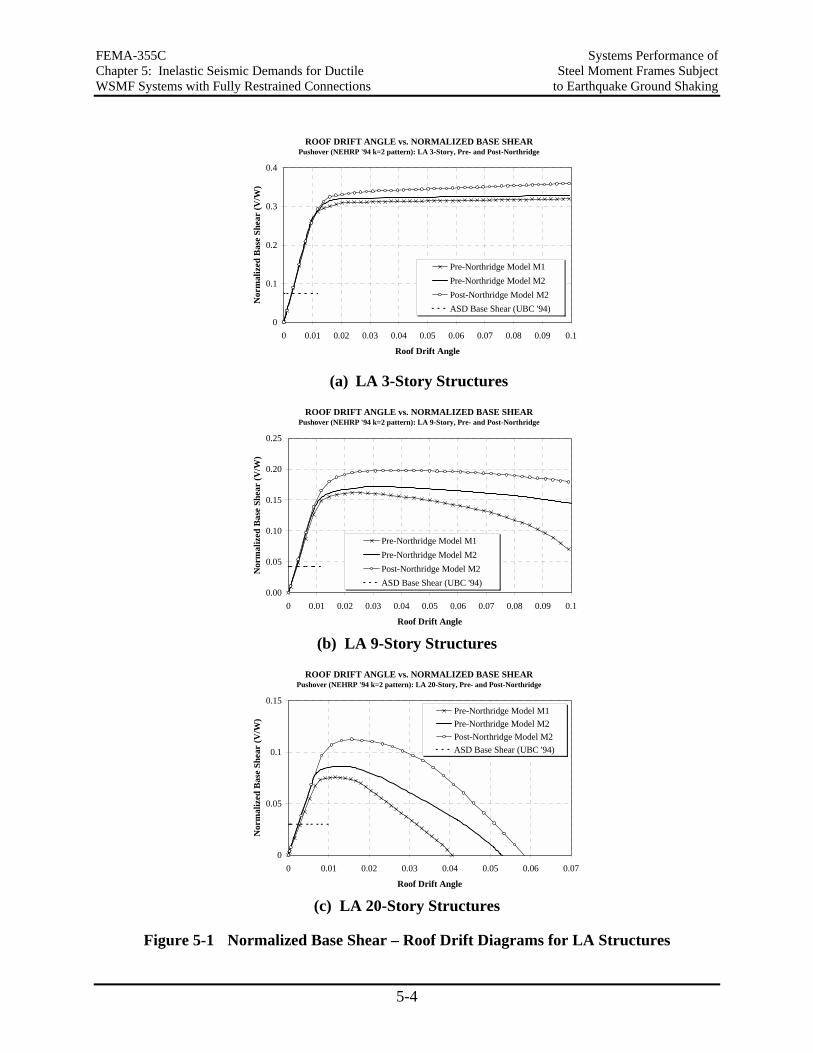
FEMA-355C Systems Performance of Chapter 5: Inelastic Seismic Demands for Ductile Steel Moment Frames Subject WSMF Systems with Fully Restrained Connections to Earthquake Ground Shaking
5-4
ROOF DRIFT ANGLE vs. NORMALIZED BASE SHEARPushover (NEHRP '94 k=2 pattern): LA 3-Story, Pre- and Post-Northridge
0
0.1
0.2
0.3
0.4
0 0.01 0.02 0.03 0.04 0.05 0.06 0.07 0.08 0.09 0.1
Roof Drift Angle
Nor
mal
ized
Bas
e Sh
ear
(V/W
)Pre-Northridge Model M1Pre-Northridge Model M2Post-Northridge Model M2ASD Base Shear (UBC '94)
(a) LA 3-Story Structures
ROOF DRIFT ANGLE vs. NORMALIZED BASE SHEARPushover (NEHRP '94 k=2 pattern): LA 9-Story, Pre- and Post-Northridge
0.00
0.05
0.10
0.15
0.20
0.25
0 0.01 0.02 0.03 0.04 0.05 0.06 0.07 0.08 0.09 0.1
Roof Drift Angle
Nor
mal
ized
Bas
e Sh
ear
(V/W
)
Pre-Northridge Model M1Pre-Northridge Model M2Post-Northridge Model M2ASD Base Shear (UBC '94)
(b) LA 9-Story Structures
ROOF DRIFT ANGLE vs. NORMALIZED BASE SHEARPushover (NEHRP '94 k=2 pattern): LA 20-Story, Pre- and Post-Northridge
0
0.05
0.1
0.15
0 0.01 0.02 0.03 0.04 0.05 0.06 0.07
Roof Drift Angle
Nor
mal
ized
Bas
e Sh
ear
(V/W
)
Pre-Northridge Model M1Pre-Northridge Model M2Post-Northridge Model M2ASD Base Shear (UBC '94)
(c) LA 20-Story Structures
Figure 5-1 Normalized Base Shear – Roof Drift Diagrams for LA Structures
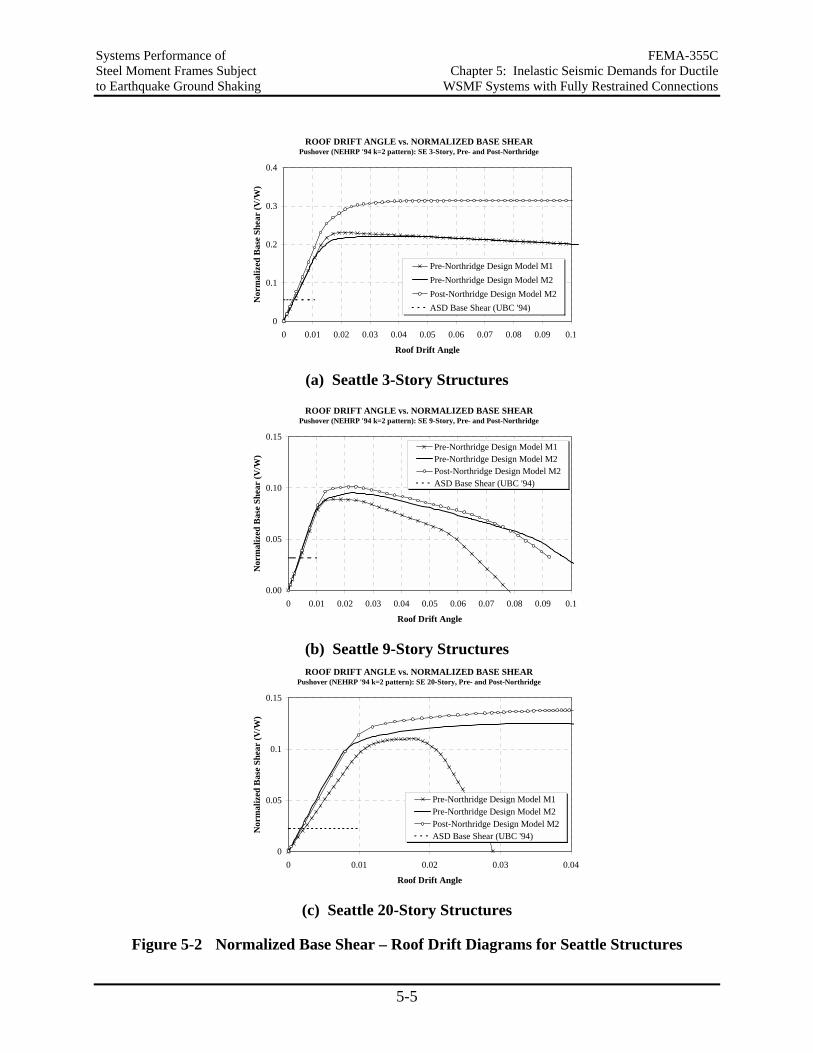
Systems Performance of FEMA-355C Steel Moment Frames Subject Chapter 5: Inelastic Seismic Demands for Ductile to Earthquake Ground Shaking WSMF Systems with Fully Restrained Connections
5-5
ROOF DRIFT ANGLE vs. NORMALIZED BASE SHEARPushover (NEHRP '94 k=2 pattern): SE 3-Story, Pre- and Post-Northridge
0
0.1
0.2
0.3
0.4
0 0.01 0.02 0.03 0.04 0.05 0.06 0.07 0.08 0.09 0.1
Roof Drift Angle
Nor
mal
ized
Bas
e Sh
ear
(V/W
)Pre-Northridge Design Model M1Pre-Northridge Design Model M2Post-Northridge Design Model M2ASD Base Shear (UBC '94)
(a) Seattle 3-Story Structures
ROOF DRIFT ANGLE vs. NORMALIZED BASE SHEARPushover (NEHRP '94 k=2 pattern): SE 9-Story, Pre- and Post-Northridge
0.00
0.05
0.10
0.15
0 0.01 0.02 0.03 0.04 0.05 0.06 0.07 0.08 0.09 0.1
Roof Drift Angle
Nor
mal
ized
Bas
e Sh
ear
(V/W
)
Pre-Northridge Design Model M1Pre-Northridge Design Model M2Post-Northridge Design Model M2ASD Base Shear (UBC '94)
(b) Seattle 9-Story Structures ROOF DRIFT ANGLE vs. NORMALIZED BASE SHEAR
Pushover (NEHRP '94 k=2 pattern): SE 20-Story, Pre- and Post-Northridge
0
0.05
0.1
0.15
0 0.01 0.02 0.03 0.04
Roof Drift Angle
Nor
mal
ized
Bas
e Sh
ear
(V/W
)
Pre-Northridge Design Model M1Pre-Northridge Design Model M2Post-Northridge Design Model M2ASD Base Shear (UBC '94)
(c) Seattle 20-Story Structures
Figure 5-2 Normalized Base Shear – Roof Drift Diagrams for Seattle Structures
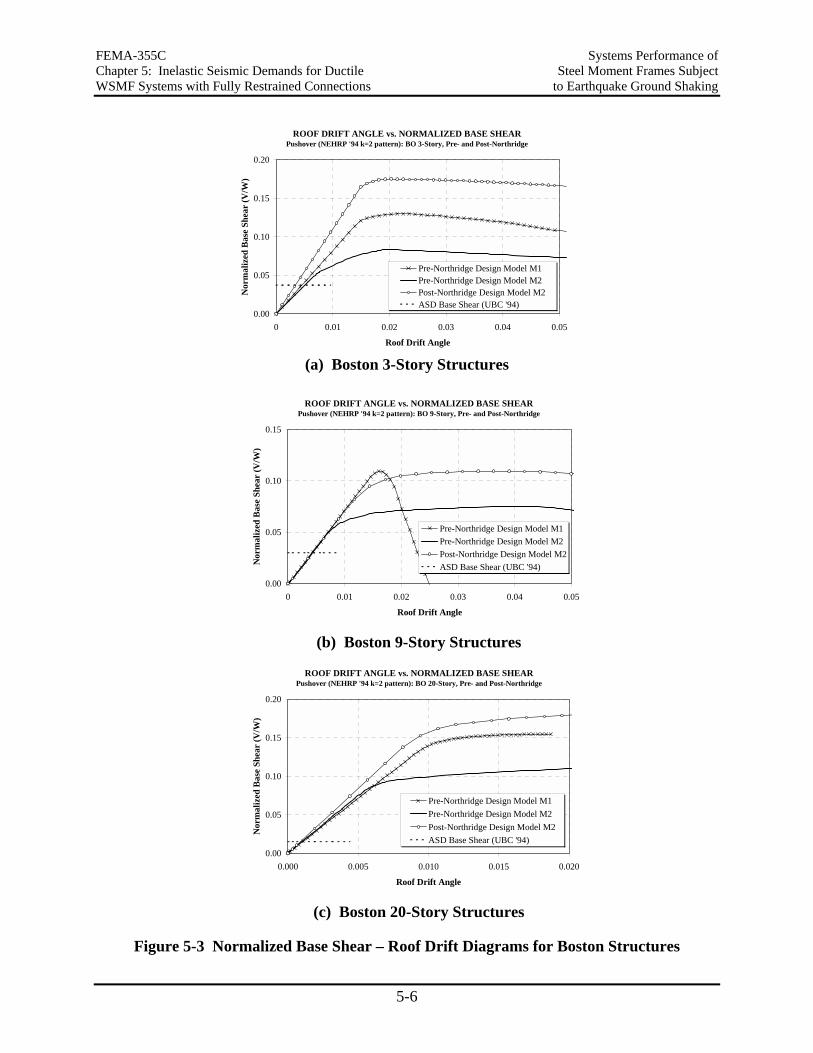
FEMA-355C Systems Performance of Chapter 5: Inelastic Seismic Demands for Ductile Steel Moment Frames Subject WSMF Systems with Fully Restrained Connections to Earthquake Ground Shaking
5-6
(a) Boston 3-Story Structures
ROOF DRIFT ANGLE vs. NORMALIZED BASE SHEARPushover (NEHRP '94 k=2 pattern): BO 9-Story, Pre- and Post-Northridge
0.00
0.05
0.10
0.15
0 0.01 0.02 0.03 0.04 0.05
Roof Drift Angle
Nor
mal
ized
Bas
e Sh
ear
(V/W
)
Pre-Northridge Design Model M1Pre-Northridge Design Model M2Post-Northridge Design Model M2ASD Base Shear (UBC '94)
(b) Boston 9-Story Structures
ROOF DRIFT ANGLE vs. NORMALIZED BASE SHEARPushover (NEHRP '94 k=2 pattern): BO 20-Story, Pre- and Post-Northridge
0.00
0.05
0.10
0.15
0.20
0.000 0.005 0.010 0.015 0.020
Roof Drift Angle
Nor
mal
ized
Bas
e Sh
ear
(V/W
)
Pre-Northridge Design Model M1Pre-Northridge Design Model M2Post-Northridge Design Model M2ASD Base Shear (UBC '94)
(c) Boston 20-Story Structures
Figure 5-3 Normalized Base Shear – Roof Drift Diagrams for Boston Structures
ROOF DRIFT ANGLE vs. NORMALIZED BASE SHEARPushover (NEHRP '94 k=2 pattern): BO 3-Story, Pre- and Post-Northridge
0.00
0.05
0.10
0.15
0.20
0 0.01 0.02 0.03 0.04 0.05
Roof Drift Angle
Nor
mal
ized
Bas
e Sh
ear
(V/W
)
Pre-Northridge Design Model M1Pre-Northridge Design Model M2Post-Northridge Design Model M2ASD Base Shear (UBC '94)
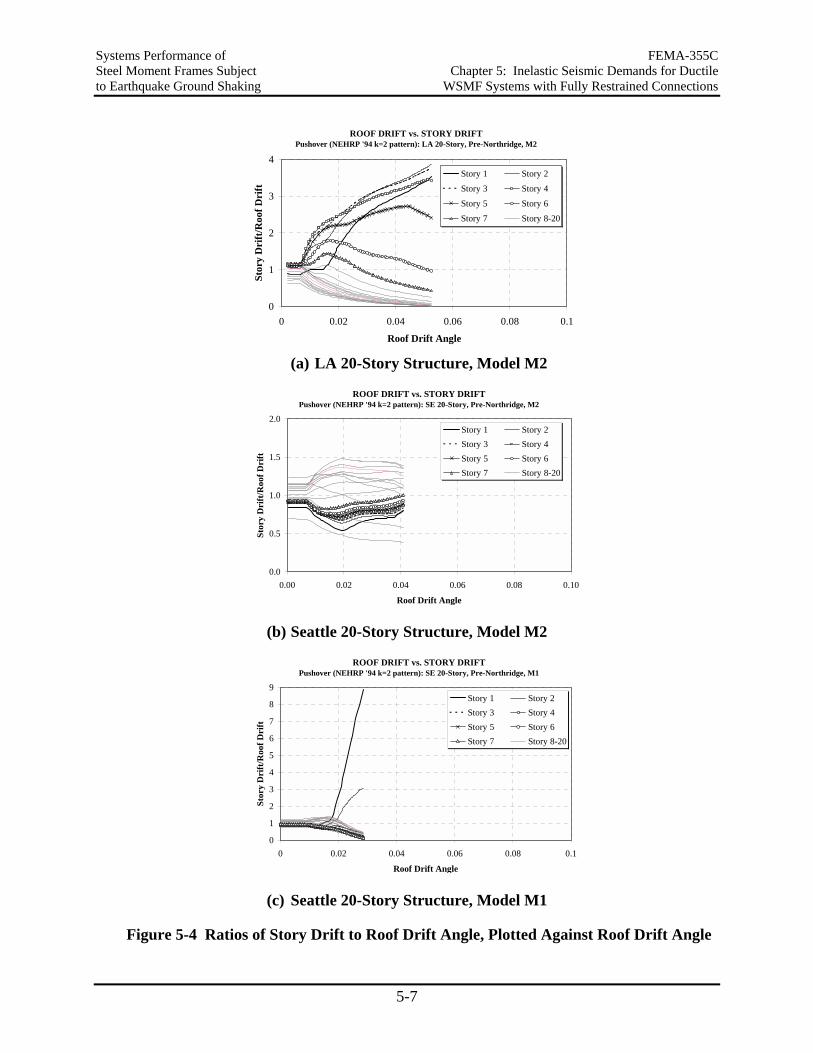
Systems Performance of FEMA-355C Steel Moment Frames Subject Chapter 5: Inelastic Seismic Demands for Ductile to Earthquake Ground Shaking WSMF Systems with Fully Restrained Connections
5-7
ROOF DRIFT vs. STORY DRIFTPushover (NEHRP '94 k=2 pattern): LA 20-Story, Pre-Northridge, M2
0
1
2
3
4
0 0.02 0.04 0.06 0.08 0.1
Roof Drift Angle
Stor
y D
rift
/Roo
f Dri
ft
Story 1 Story 2
Story 3 Story 4
Story 5 Story 6
Story 7 Story 8-20
(a) LA 20-Story Structure, Model M2
ROOF DRIFT vs. STORY DRIFTPushover (NEHRP '94 k=2 pattern): SE 20-Story, Pre-Northridge, M2
0.0
0.5
1.0
1.5
2.0
0.00 0.02 0.04 0.06 0.08 0.10
Roof Drift Angle
Stor
y D
rift
/Roo
f Dri
ft
Story 1 Story 2Story 3 Story 4Story 5 Story 6Story 7 Story 8-20
(b) Seattle 20-Story Structure, Model M2
ROOF DRIFT vs. STORY DRIFTPushover (NEHRP '94 k=2 pattern): SE 20-Story, Pre-Northridge, M1
0
1
2
3
4
5
6
7
8
9
0 0.02 0.04 0.06 0.08 0.1
Roof Drift Angle
Stor
y D
rift
/Roo
f Dri
ft
Story 1 Story 2Story 3 Story 4Story 5 Story 6Story 7 Story 8-20
(c) Seattle 20-Story Structure, Model M1
Figure 5-4 Ratios of Story Drift to Roof Drift Angle, Plotted Against Roof Drift Angle
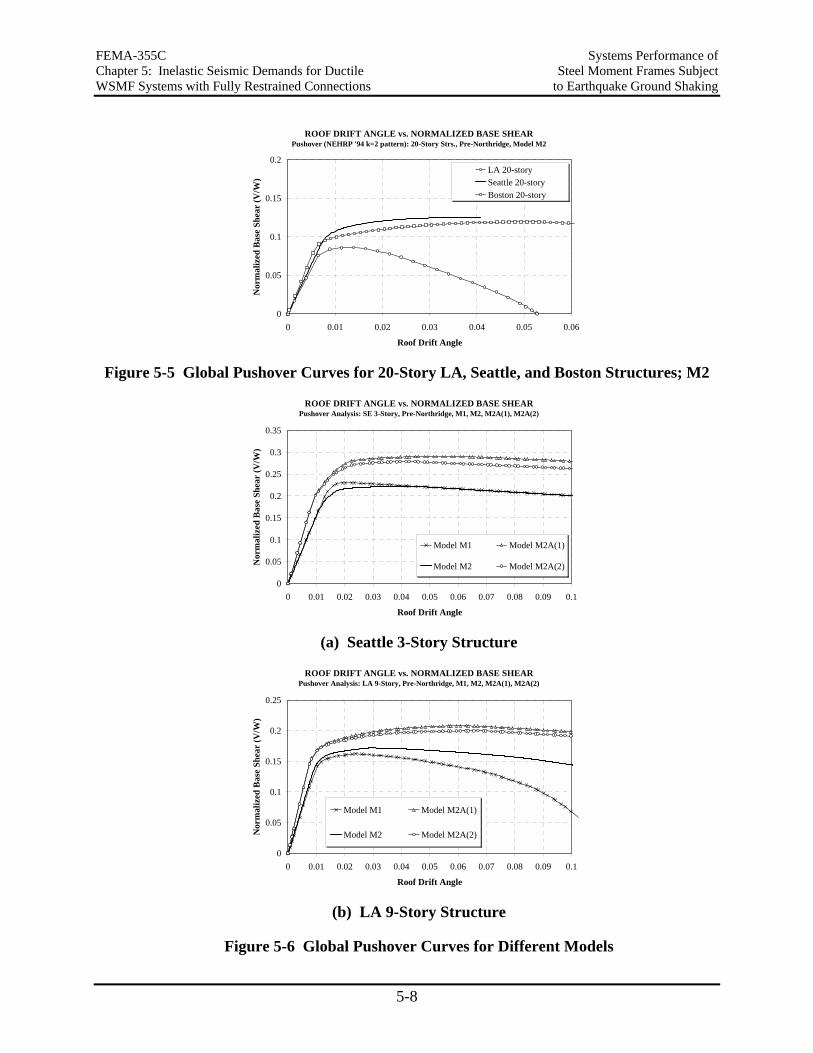
FEMA-355C Systems Performance of Chapter 5: Inelastic Seismic Demands for Ductile Steel Moment Frames Subject WSMF Systems with Fully Restrained Connections to Earthquake Ground Shaking
5-8
ROOF DRIFT ANGLE vs. NORMALIZED BASE SHEARPushover (NEHRP '94 k=2 pattern): 20-Story Strs., Pre-Northridge, Model M2
0
0.05
0.1
0.15
0.2
0 0.01 0.02 0.03 0.04 0.05 0.06
Roof Drift Angle
Nor
mal
ized
Bas
e Sh
ear
(V/W
)
LA 20-storySeattle 20-storyBoston 20-story
Figure 5-5 Global Pushover Curves for 20-Story LA, Seattle, and Boston Structures; M2
ROOF DRIFT ANGLE vs. NORMALIZED BASE SHEARPushover Analysis: SE 3-Story, Pre-Northridge, M1, M2, M2A(1), M2A(2)
0
0.05
0.1
0.15
0.2
0.25
0.3
0.35
0 0.01 0.02 0.03 0.04 0.05 0.06 0.07 0.08 0.09 0.1
Roof Drift Angle
Nor
mal
ized
Bas
e Sh
ear
(V/W
)
Model M1 Model M2A(1)
Model M2 Model M2A(2)
(a) Seattle 3-Story Structure
ROOF DRIFT ANGLE vs. NORMALIZED BASE SHEARPushover Analysis: LA 9-Story, Pre-Northridge, M1, M2, M2A(1), M2A(2)
0
0.05
0.1
0.15
0.2
0.25
0 0.01 0.02 0.03 0.04 0.05 0.06 0.07 0.08 0.09 0.1
Roof Drift Angle
Nor
mal
ized
Bas
e Sh
ear
(V/W
)
Model M1 Model M2A(1)
Model M2 Model M2A(2)
(b) LA 9-Story Structure
Figure 5-6 Global Pushover Curves for Different Models
Systems Performance of FEMA-355C Steel Moment Frames Subject Chapter 5: Inelastic Seismic Demands for Ductile to Earthquake Ground Shaking WSMF Systems with Fully Restrained Connections
5-9
It is helpful to refer to Table 5-1, which lists the modal characteristics of the different structures and analytical models. Since the mass of the structures of a particular number of stories is kept constant between the different regions, a comparison of the first mode periods reflects the differences in the elastic stiffness of the structures.
The following observations and conclusions are relevant in the context of seismic performance. Unless noted otherwise, the results from the M2 models of the SAC structures are used for illustration, since these models are more realistic representations of the actual strength and stiffness properties than the centerline M1 models.
Elastic Stiffness and Modal Periods. The analytical models indicate that WSMF structures designed in accordance with 1994 seismic codes are rather flexible (see Table 5-1), and that the first mode period is much longer than estimated by presently employed code period equations. For the LA structures, the first mode period is about twice the value obtained from the equation T = 0.03hn
3/4. Models M1 and M2 consider only the bare MRF and give no credit to all other contributions to stiffness (and strength). Consideration of other reliable contributions (model M2A) increases the period by about 10 to 20%, but does not bring it close to the code estimated period.
Shape of Global Pushover Curve. Global response is characterized by an elastic stiffness, a relatively sharp transition to a yield plateau, and a yield plateau of variable length, which in many cases is followed by a branch of negative stiffness. The sharp transition to the yield plateau is typical for structures with perimeter frames, because the beams are usually of uniform size at a floor level and attract only small gravity moments. For the SAC structures, the gravity moments are of the order of 5% of the beam bending strength.
Negative Stiffness Region. The existence, starting point, and shape of the negative stiffness branch depend on design decisions and the relative importance of P-delta effects. The relative importance of P-delta effects can be estimated by the story stability coefficient θ = Pδ/(Vh). Thus, it is a function of the gravity loads and the elastic stiffness (V/δ) of the structure. For instance, the 3-story SE structure exhibits a negative stiffness, but the 3-story LA structure does not, because the latter has a larger elastic stiffness. A continuous decrease in the negative global stiffness (increase in negative slope) indicates that one or several stories are becoming weak compared to others and exhibit large drift amplification due to P-delta. This is evident from Figure 5-4(c), which shows the effect on story drift of a story mechanism in story 1 of the M1 model for the Seattle 20-story structure. This story mechanism leads to concentration of P-delta effects and accounts for the rapid decrease in global resistance of the structure, as seen in Figure 5-2(c).
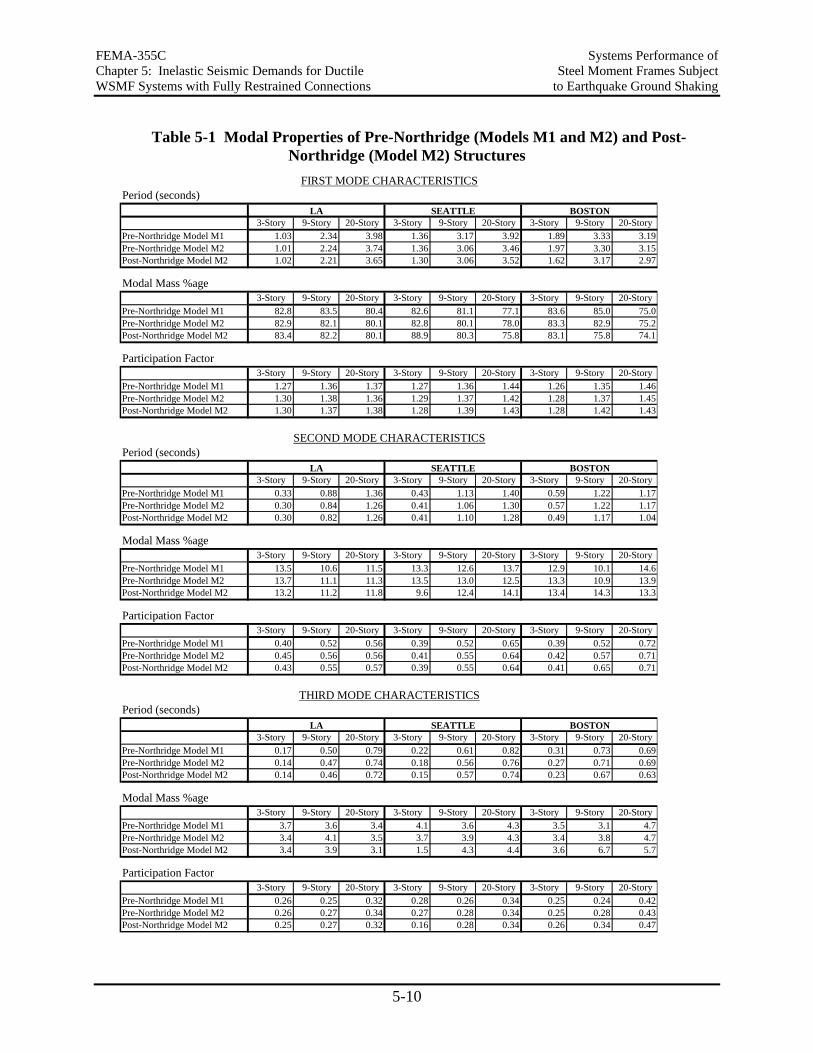
FEMA-355C Systems Performance of Chapter 5: Inelastic Seismic Demands for Ductile Steel Moment Frames Subject WSMF Systems with Fully Restrained Connections to Earthquake Ground Shaking
5-10
Table 5-1 Modal Properties of Pre-Northridge (Models M1 and M2) and Post-Northridge (Model M2) Structures
Period (seconds)
3-Story 9-Story 20-Story 3-Story 9-Story 20-Story 3-Story 9-Story 20-StoryPre-Northridge Model M1 1.03 2.34 3.98 1.36 3.17 3.92 1.89 3.33 3.19Pre-Northridge Model M2 1.01 2.24 3.74 1.36 3.06 3.46 1.97 3.30 3.15Post-Northridge Model M2 1.02 2.21 3.65 1.30 3.06 3.52 1.62 3.17 2.97
Modal Mass %age3-Story 9-Story 20-Story 3-Story 9-Story 20-Story 3-Story 9-Story 20-Story
Pre-Northridge Model M1 82.8 83.5 80.4 82.6 81.1 77.1 83.6 85.0 75.0Pre-Northridge Model M2 82.9 82.1 80.1 82.8 80.1 78.0 83.3 82.9 75.2Post-Northridge Model M2 83.4 82.2 80.1 88.9 80.3 75.8 83.1 75.8 74.1
Participation Factor3-Story 9-Story 20-Story 3-Story 9-Story 20-Story 3-Story 9-Story 20-Story
Pre-Northridge Model M1 1.27 1.36 1.37 1.27 1.36 1.44 1.26 1.35 1.46Pre-Northridge Model M2 1.30 1.38 1.36 1.29 1.37 1.42 1.28 1.37 1.45Post-Northridge Model M2 1.30 1.37 1.38 1.28 1.39 1.43 1.28 1.42 1.43
Period (seconds)
3-Story 9-Story 20-Story 3-Story 9-Story 20-Story 3-Story 9-Story 20-StoryPre-Northridge Model M1 0.33 0.88 1.36 0.43 1.13 1.40 0.59 1.22 1.17Pre-Northridge Model M2 0.30 0.84 1.26 0.41 1.06 1.30 0.57 1.22 1.17Post-Northridge Model M2 0.30 0.82 1.26 0.41 1.10 1.28 0.49 1.17 1.04
Modal Mass %age3-Story 9-Story 20-Story 3-Story 9-Story 20-Story 3-Story 9-Story 20-Story
Pre-Northridge Model M1 13.5 10.6 11.5 13.3 12.6 13.7 12.9 10.1 14.6Pre-Northridge Model M2 13.7 11.1 11.3 13.5 13.0 12.5 13.3 10.9 13.9Post-Northridge Model M2 13.2 11.2 11.8 9.6 12.4 14.1 13.4 14.3 13.3
Participation Factor3-Story 9-Story 20-Story 3-Story 9-Story 20-Story 3-Story 9-Story 20-Story
Pre-Northridge Model M1 0.40 0.52 0.56 0.39 0.52 0.65 0.39 0.52 0.72Pre-Northridge Model M2 0.45 0.56 0.56 0.41 0.55 0.64 0.42 0.57 0.71Post-Northridge Model M2 0.43 0.55 0.57 0.39 0.55 0.64 0.41 0.65 0.71
Period (seconds)
3-Story 9-Story 20-Story 3-Story 9-Story 20-Story 3-Story 9-Story 20-StoryPre-Northridge Model M1 0.17 0.50 0.79 0.22 0.61 0.82 0.31 0.73 0.69Pre-Northridge Model M2 0.14 0.47 0.74 0.18 0.56 0.76 0.27 0.71 0.69Post-Northridge Model M2 0.14 0.46 0.72 0.15 0.57 0.74 0.23 0.67 0.63
Modal Mass %age3-Story 9-Story 20-Story 3-Story 9-Story 20-Story 3-Story 9-Story 20-Story
Pre-Northridge Model M1 3.7 3.6 3.4 4.1 3.6 4.3 3.5 3.1 4.7Pre-Northridge Model M2 3.4 4.1 3.5 3.7 3.9 4.3 3.4 3.8 4.7Post-Northridge Model M2 3.4 3.9 3.1 1.5 4.3 4.4 3.6 6.7 5.7
Participation Factor3-Story 9-Story 20-Story 3-Story 9-Story 20-Story 3-Story 9-Story 20-Story
Pre-Northridge Model M1 0.26 0.25 0.32 0.28 0.26 0.34 0.25 0.24 0.42Pre-Northridge Model M2 0.26 0.27 0.34 0.27 0.28 0.34 0.25 0.28 0.43Post-Northridge Model M2 0.25 0.27 0.32 0.16 0.28 0.34 0.26 0.34 0.47
SEATTLE BOSTON
LA SEATTLE BOSTON
FIRST MODE CHARACTERISTICS
SECOND MODE CHARACTERISTICS
THIRD MODE CHARACTERISTICS
LA SEATTLE BOSTON
LA
Systems Performance of FEMA-355C Steel Moment Frames Subject Chapter 5: Inelastic Seismic Demands for Ductile to Earthquake Ground Shaking WSMF Systems with Fully Restrained Connections
5-11
5.2.1.1 Variation in Story Drift Over Height
The story drift variations with an increase in global drift, shown in Figure 5-4 for the LA and Seattle 20-story models, help in rationalizing the global load – drift behavior. For the LA 20-story model M2, Figure 5-1(c) shows a rapidly increasing negative slope beyond a drift of about 0.02. The explanation is found in Figure 5-4(a). Initially, the drift in all stories is about the same. Stories 2 to 7 yield first, at a global drift of about 0.007, and their contribution to the global drift increases rapidly, which leads to a yield plateau in the global pushover curve. When P-delta effects become sufficiently large to also cause a rapid increase in the contribution of the first story drift, the global stiffness becomes negative. As the roof displacement is increased, the bottom five stories “take over,” and the relative drift in all other stories becomes smaller. In fact, the upper stories straighten out and contribute very little to the global drift (see Figure 4.12 for M1 model).
A very different behavior is observed for the Seattle 20-story structure. As Figure 5-4(b) shows, all stories contribute a similar portion to the total drift, even at very large displacements. Thus, in none of the stories does P-delta become a critical issue and, as a consequence, the global response (Figure 5-2(c)) exhibits increasing strength beyond a roof drift of 0.04. The reason for this “better” behavior is that the design of the lower portions of this structure is controlled by wind loads, which provided more strength. The radically different behavior of the Seattle 20-story M1 model has been pointed out in the previous paragraph.
5.2.1.2 Overstrength
All structures exhibit considerable overstrength above the allowable stress design level. The overstrength comes from subjective design decisions (in many cases the columns are stronger than needed by code requirements) and from the need to fulfill code drift requirements. The overstrength in many cases is not as large as often perceived if it is considered that member strength corresponds to about 1.4 times the allowable stress level, and that the strength predictions are based on expected rather than nominal strength properties. The overstrength is largest in the wind controlled designs (taller Seattle and Boston structures), with the notable exception being the Boston 9-story structure. In this structure, as well as in all other Boston structures, the M2 models exhibit much smaller strength than the M1 models, which is the opposite of the LA and Seattle structures. The reason is that all Boston structures have weak panel zones (neither UBC ’94 nor BOCA ’93 has a minimum strength requirement (in addition to the basic ASD requirement) for panel zones in structures located in seismic zones 1 and 2).
5.2.1.3 Effects of Weak Panel Zones
Weak panel zones have a large effect on the lateral strength. If panel zones are sufficiently strong, the beams (or columns) will be capable of developing their bending strength, and the structure strength is controlled by a mechanism formed by plastic hinging in beams (or columns). Weak panel zones will not permit the development of the full bending strength in beams (or columns), and structure strength is controlled by a mechanism formed by plastification in the panel zones. The consequence is a significant reduction in structure strength, as illustrated in the differences between the strengths obtained in the Boston M1 and M2 models. The M1 model does not recognize the existence of panel zones, and always predicts structure strength based on
FEMA-355C Systems Performance of Chapter 5: Inelastic Seismic Demands for Ductile Steel Moment Frames Subject WSMF Systems with Fully Restrained Connections to Earthquake Ground Shaking
5-12
a mechanism formed by plastic hinging in beams (or columns). A mechanism formed by plastification in the panel zones leads to a reduction in strength, but not necessarily to a worsening in seismic performance. Its advantage is that it avoids the formation of story mechanisms, such as those indicated for the M1 models of the Seattle 20-story and Boston 9-story structures.
5.2.1.4 Strength of Structures in Regions of Different Seismicity
Design in regions of higher seismicity does not necessarily imply a stronger structure. For instance, the 20-story Seattle and Boston structures are stronger than the LA structure (see Figure 5-5), even though early yielding is observed in the panel zones of the Boston structure. The main reason for the larger strength is that wind strength and drift criteria controlled the design of the Seattle and Boston 20-story structures.
5.2.1.5 Effects of Subjective Design Decisions
Subjective design decisions and regional practice have a significant effect on the strength and deformation behavior of the same structural configuration in different regions. For instance, the designers of the LA 20-story structure decided to use stronger beams at floors 6 to 11 than at floors 1 to 5 (W30x108 vs. W30x99, see Table B.1). If the beams are the weak elements, which is the case for this structure, the shear strength of story i can be estimated as (ΣMpb
i + ΣMpb
i+1)/2h, where i and i + 1 refer to the floors bounding the story, Mpb is the beam bending strength, and h is the story height. Thus, for the LA structure, the shear strength of stories 1 to 5 is about 10% smaller than that of stories 7 to 10, with the strength of story 6 being in between. This unusual strength discontinuity accounts for the drift patterns seen in Figure 5-4(a) and for the undesirable negative stiffness region seen in Figure 5-5. Projecting to dynamic response, it is expected that the Seattle 20-story structure will perform significantly better than the LA structure, particularly under very severe ground motions.
5.2.1.6 Post-Northridge Structures
The global behavior of the nine post-Northridge structures (all structures have cover plate designs in conformance with FEMA 267) is not much different from that of the pre-Northridge structures. The LA and Seattle post-Northridge structures are somewhat stronger than the pre-Northridge structures, and exhibit similar load-displacement patterns. The reason for the larger strength is that similar (or identical) member sizes were selected by the designers, and for the same member sizes the relocation of the plastic hinges away from the column faces provides larger bending resistance at the beam-to-column connections. (Post-Northridge designs with reduced beam sections will be discussed in Section 5.10.2.) The Boston post-Northridge structures are significantly stronger than their pre-Northridge counterparts. An additional reason for the increase in strength is that, in the post-Northridge designs, the designer followed the panel zone strength requirements outlined in FEMA 267.
5.2.1.7 Sensitivity to Analytical Model
Large differences may have to be expected in the response predictions obtained from the M1 and M2 models. The M2 models are realistic models (within the constraints of the assumptions
Systems Performance of FEMA-355C Steel Moment Frames Subject Chapter 5: Inelastic Seismic Demands for Ductile to Earthquake Ground Shaking WSMF Systems with Fully Restrained Connections
5-13
made) of the bare WSMFs, but the M1 models ignore the existence of the panel zones. If the structure has only strong panel zones, or panel zones that yield at about the same load level as the beams (LA and Seattle structures), the responses of M1 and M2 models are similar, with the M2 model predicting a somewhat higher strength because of the use of clear span rather than centerline dimensions. If the structure has weak panel zones, which yield long before the beams (or columns) develop their bending strength, the M1 model may provide poor predictions of the post-elastic behavior. In many cases this is inconsequential for dynamic response predictions, but in some cases (particularly for P-delta sensitive structures) the use of a centerline model (M1) will provide misleading results. In all the cases in which M1 and M2 models were compared, the M1 model predicted poorer global seismic performance (larger story drifts) than the M2 model. This indicates that the M1 model may be employed for conservative predictions of global seismic performance. However, there is a caveat. The M1 model may provide misleading information on the location of plastic regions and the magnitude of plastic deformations in beams (and columns) and panel zones. This may be inappropriate in view of the potential effect of panel zone distortions on the likelihood of connection fractures, and the need for a realistic prediction of beam plastic rotation demands.
5.2.1.8 Contributions of Gravity Frames
If the strength and stiffness of the interior gravity frames is incorporated in the analytical model (M2A(1) and M2A(2), see Section 3.5.1), improvement in the global load-drift response can be achieved. The amount of improvement depends on the number of simple frames, the orientation of the columns (strong versus weak axis), and the column boundary conditions at the base. The contributions of the columns appears to be more effective than the contributions of the simple connections, as can be seen from Figure 5-6, which compares the M2A responses with the M1 and M2 responses for the Seattle 3-story and the LA 9-story structure (see also Figure 4.15 for the LA 20-story structure). In models M2A(1), the connection bending strength is twice that for model M2A(2), but the effect on global behavior is very small. Both M2A models lead to an increase in strength, and more important, they lead to a notable shift of the negative stiffness region into a range of drift that is very unlikely to be experienced even under very severe ground motions. Thus, gravity frames can fulfill the function of the flexible backup system, which is mentioned in Section 4.4 as one of the options for preventing P-delta sensitive response.
5.2.1.9 Expected Seismic Performance Based on Pushover Analysis
A pushover analysis is very helpful in assessing structural behavior and in preliminary predictions of seismic demands. Within limitations (Krawinkler and Seneviratna, 1998) it serves to estimate global deformation demands. It is rather reliable in assessing local demands in beams, columns, and connections if the story drift has been determined from a dynamic analysis. Results of the types presented in Figures 5-1 to 5-4 help in assessing expected seismic performance, particularly in regard to P-delta effects. Inspecting these figures, the expectation is that most of the structures will perform satisfactorily in major earthquakes. Of concern are the LA 20-story structure and the Seattle 3- and 9-story structures (unless M2 models are employed). These structures exhibit a negative post-yield stiffness in the range of drifts anticipated in major earthquakes. The last three statements are based on the presumptions that roof drifts can be
FEMA-355C Systems Performance of Chapter 5: Inelastic Seismic Demands for Ductile Steel Moment Frames Subject WSMF Systems with Fully Restrained Connections to Earthquake Ground Shaking
5-14
estimated with reasonable confidence (addressed in Section 5.12.1) and that no significant deterioration of any type (including weld fractures) will occur.
5.2.2 Local Element Behavior
For a given story drift, the force and deformation demands imposed on the individual structural elements depend on the relative strength of the elements at the connection, and they are rather well defined if material properties are known and adequate models for element behavior are employed. The following discussion is based on the use of models that account for panel zone strength and deformation behavior, i.e., M2 models. The M1 model cannot be employed for element demand evaluation since it ignores the existence of panel zones. The importance of relative strength of beams and panel zones has been pointed out in Section 4.2. In this section, issues are discussed that affect relative element strength, and the consequences of relative strength on deformation demands are evaluated using illustrative examples based on pushover analysis (Figures 5-7 to 5-16).
Reference is also made to Table 5-2, which shows section sizes of two designs of the perimeter WSMF of the Los Angeles 9-story structure and relative member strengths at an interior beam-to-column connection. The original LA 9-story design has very large columns and is about 20% stiffer than required by UBC ’94 (drift control was based on the code empirical period equation rather than the period of the bare frame). A redesign for the structure was performed using the computer tool BERT (Fuyama et al. 1993) to conform closer to minimum code requirements. In this redesign, all strength and drift requirements of the UBC 1994 are satisfied, and emphasis is placed on the criterion that drift control is achieved more efficiently by increasing girder sections rather than column sections. The column sizes could be significantly reduced at the expense of a small increase in girder sizes. The section properties for the redesign (referred to as R1-LA9) are listed in the lower portion of Table 5-2. The redesigned frame is 23% lighter than the original LA 9-story frame. In the redesign no panel zone doubler plates are used, because the minimum panel zone strength requirement according to UBC ‘94 (based on the shear force generated by gravity moments and 1.85 times the seismic moments at the allowable stress design level) did not require any doubler plates. This is not to say that such a design is desirable, but it is permitted by code. The consequence is that the redesign (R1-LA9) becomes a frame with weak panel zones that does not permit the development of the beam bending strength.
An illustration of the relative member strength and its effect on the element deformations with increasing story drift is presented in Figures 5-7 and 5-8, using the first story of the Seattle 3-story pre-Northridge structure as an example. Figure 5-7 shows the variation in the element forces (normalized to their yield values) as a function of the story drift angle for an interior connection at the second floor (top of story 1). Models M1, M2, and M2A are used for illustration. The figure presents the shear force for the panel zone (PZ), the moments at the top of the column framing from below (Col.St.1[t]) and the bottom of the column framing from above (Col.St.2[b]), and the moment in the beam framing from the left into the connection (Beam Fl.2[1]). In the M2 models (M2 and M2A), the panel zone starts to yield first and the beam barely yields even at large drifts. The columns above and below the floor remain elastic at all drifts. In the M1 model the beam is the only yielding element.
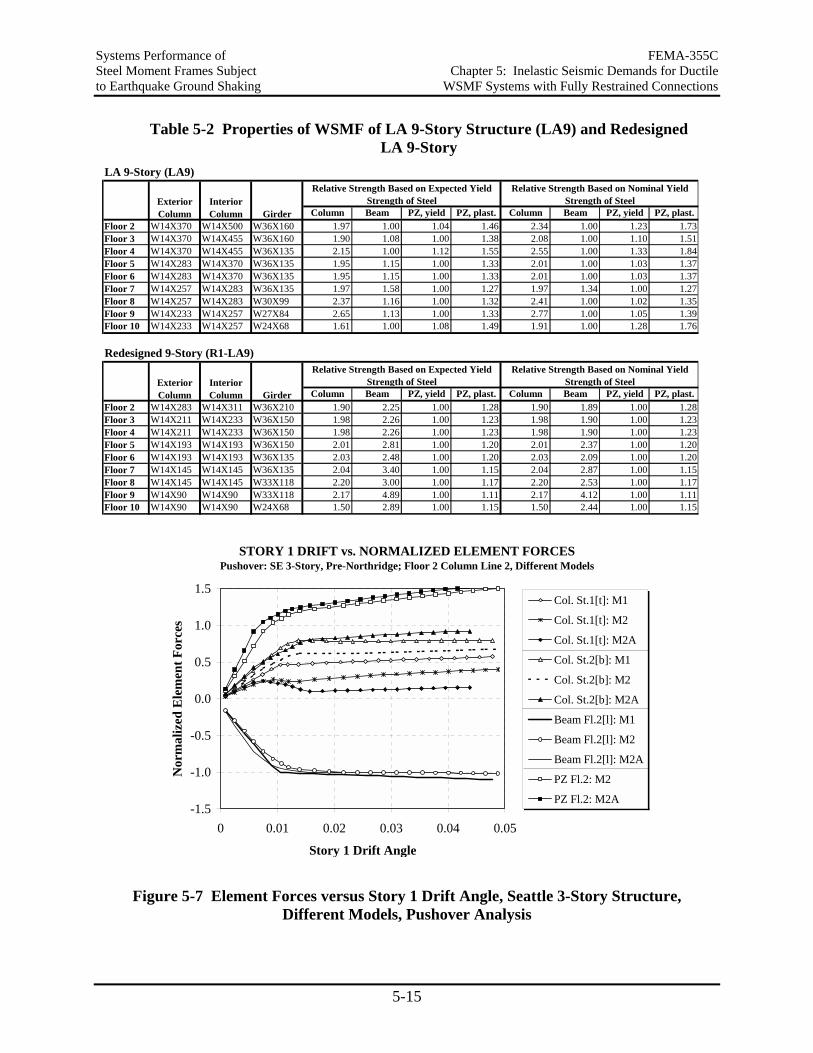
Systems Performance of FEMA-355C Steel Moment Frames Subject Chapter 5: Inelastic Seismic Demands for Ductile to Earthquake Ground Shaking WSMF Systems with Fully Restrained Connections
5-15
Table 5-2 Properties of WSMF of LA 9-Story Structure (LA9) and Redesigned LA 9-Story
LA 9-Story (LA9)
Column Beam PZ, yield PZ, plast. Column Beam PZ, yield PZ, plast.Floor 2 W14X370 W14X500 W36X160 1.97 1.00 1.04 1.46 2.34 1.00 1.23 1.73Floor 3 W14X370 W14X455 W36X160 1.90 1.08 1.00 1.38 2.08 1.00 1.10 1.51Floor 4 W14X370 W14X455 W36X135 2.15 1.00 1.12 1.55 2.55 1.00 1.33 1.84Floor 5 W14X283 W14X370 W36X135 1.95 1.15 1.00 1.33 2.01 1.00 1.03 1.37Floor 6 W14X283 W14X370 W36X135 1.95 1.15 1.00 1.33 2.01 1.00 1.03 1.37Floor 7 W14X257 W14X283 W36X135 1.97 1.58 1.00 1.27 1.97 1.34 1.00 1.27Floor 8 W14X257 W14X283 W30X99 2.37 1.16 1.00 1.32 2.41 1.00 1.02 1.35Floor 9 W14X233 W14X257 W27X84 2.65 1.13 1.00 1.33 2.77 1.00 1.05 1.39Floor 10 W14X233 W14X257 W24X68 1.61 1.00 1.08 1.49 1.91 1.00 1.28 1.76
Redesigned 9-Story (R1-LA9)
Column Beam PZ, yield PZ, plast. Column Beam PZ, yield PZ, plast.Floor 2 W14X283 W14X311 W36X210 1.90 2.25 1.00 1.28 1.90 1.89 1.00 1.28Floor 3 W14X211 W14X233 W36X150 1.98 2.26 1.00 1.23 1.98 1.90 1.00 1.23Floor 4 W14X211 W14X233 W36X150 1.98 2.26 1.00 1.23 1.98 1.90 1.00 1.23Floor 5 W14X193 W14X193 W36X150 2.01 2.81 1.00 1.20 2.01 2.37 1.00 1.20Floor 6 W14X193 W14X193 W36X135 2.03 2.48 1.00 1.20 2.03 2.09 1.00 1.20Floor 7 W14X145 W14X145 W36X135 2.04 3.40 1.00 1.15 2.04 2.87 1.00 1.15Floor 8 W14X145 W14X145 W33X118 2.20 3.00 1.00 1.17 2.20 2.53 1.00 1.17Floor 9 W14X90 W14X90 W33X118 2.17 4.89 1.00 1.11 2.17 4.12 1.00 1.11Floor 10 W14X90 W14X90 W24X68 1.50 2.89 1.00 1.15 1.50 2.44 1.00 1.15
Relative Strength Based on Expected Yield Strength of Steel
Relative Strength Based on Nominal Yield Strength of Steel
Exterior Column
Interior Column Girder
Relative Strength Based on Expected Yield Strength of Steel
Relative Strength Based on Nominal Yield Strength of Steel
Exterior Column
Interior Column Girder
STORY 1 DRIFT vs. NORMALIZED ELEMENT FORCESPushover: SE 3-Story, Pre-Northridge; Floor 2 Column Line 2, Different Models
-1.5
-1.0
-0.5
0.0
0.5
1.0
1.5
0 0.01 0.02 0.03 0.04 0.05
Story 1 Drift Angle
Nor
mal
ized
Ele
men
t For
ces
Col. St.1[t]: M1
Col. St.1[t]: M2
Col. St.1[t]: M2A
Col. St.2[b]: M1
Col. St.2[b]: M2
Col. St.2[b]: M2A
Beam Fl.2[l]: M1
Beam Fl.2[l]: M2
Beam Fl.2[l]: M2A
PZ Fl.2: M2
PZ Fl.2: M2A
Figure 5-7 Element Forces versus Story 1 Drift Angle, Seattle 3-Story Structure, Different Models, Pushover Analysis
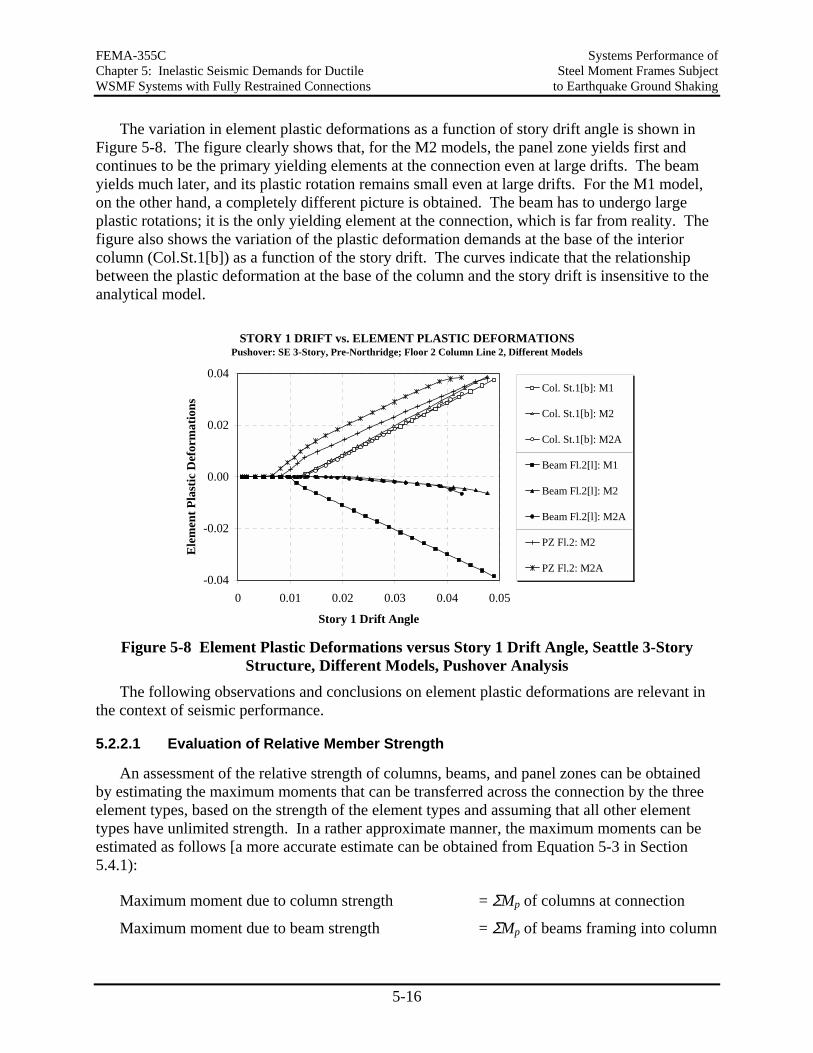
FEMA-355C Systems Performance of Chapter 5: Inelastic Seismic Demands for Ductile Steel Moment Frames Subject WSMF Systems with Fully Restrained Connections to Earthquake Ground Shaking
5-16
The variation in element plastic deformations as a function of story drift angle is shown in Figure 5-8. The figure clearly shows that, for the M2 models, the panel zone yields first and continues to be the primary yielding elements at the connection even at large drifts. The beam yields much later, and its plastic rotation remains small even at large drifts. For the M1 model, on the other hand, a completely different picture is obtained. The beam has to undergo large plastic rotations; it is the only yielding element at the connection, which is far from reality. The figure also shows the variation of the plastic deformation demands at the base of the interior column (Col.St.1[b]) as a function of the story drift. The curves indicate that the relationship between the plastic deformation at the base of the column and the story drift is insensitive to the analytical model.
STORY 1 DRIFT vs. ELEMENT PLASTIC DEFORMATIONSPushover: SE 3-Story, Pre-Northridge; Floor 2 Column Line 2, Different Models
-0.04
-0.02
0.00
0.02
0.04
0 0.01 0.02 0.03 0.04 0.05
Story 1 Drift Angle
Ele
men
t Pla
stic
Def
orm
atio
ns
Col. St.1[b]: M1
Col. St.1[b]: M2
Col. St.1[b]: M2A
Beam Fl.2[l]: M1
Beam Fl.2[l]: M2
Beam Fl.2[l]: M2A
PZ Fl.2: M2
PZ Fl.2: M2A
Figure 5-8 Element Plastic Deformations versus Story 1 Drift Angle, Seattle 3-Story
Structure, Different Models, Pushover Analysis The following observations and conclusions on element plastic deformations are relevant in
the context of seismic performance.
5.2.2.1 Evaluation of Relative Member Strength
An assessment of the relative strength of columns, beams, and panel zones can be obtained by estimating the maximum moments that can be transferred across the connection by the three element types, based on the strength of the element types and assuming that all other element types have unlimited strength. In a rather approximate manner, the maximum moments can be estimated as follows [a more accurate estimate can be obtained from Equation 5-3 in Section 5.4.1):
Maximum moment due to column strength = ΣMp of columns at connection
Maximum moment due to beam strength = ΣMp of beams framing into column
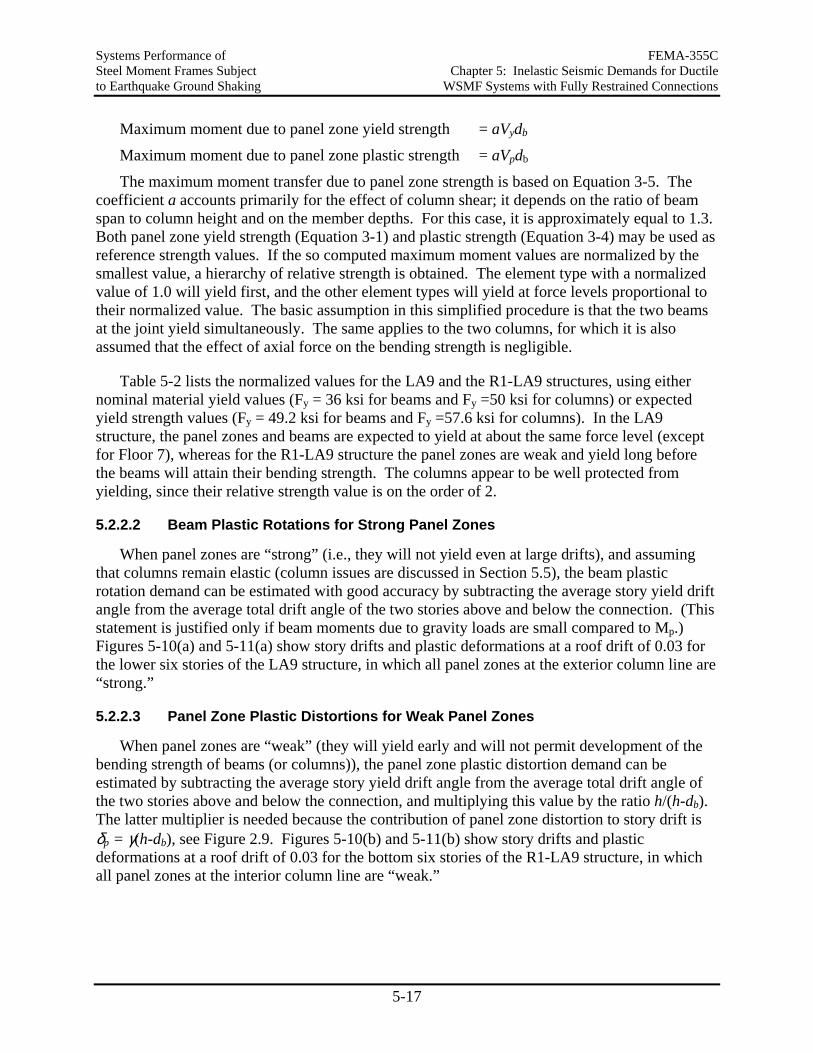
Systems Performance of FEMA-355C Steel Moment Frames Subject Chapter 5: Inelastic Seismic Demands for Ductile to Earthquake Ground Shaking WSMF Systems with Fully Restrained Connections
5-17
Maximum moment due to panel zone yield strength = aVydb
Maximum moment due to panel zone plastic strength = aVpdb
The maximum moment transfer due to panel zone strength is based on Equation 3-5. The coefficient a accounts primarily for the effect of column shear; it depends on the ratio of beam span to column height and on the member depths. For this case, it is approximately equal to 1.3. Both panel zone yield strength (Equation 3-1) and plastic strength (Equation 3-4) may be used as reference strength values. If the so computed maximum moment values are normalized by the smallest value, a hierarchy of relative strength is obtained. The element type with a normalized value of 1.0 will yield first, and the other element types will yield at force levels proportional to their normalized value. The basic assumption in this simplified procedure is that the two beams at the joint yield simultaneously. The same applies to the two columns, for which it is also assumed that the effect of axial force on the bending strength is negligible.
Table 5-2 lists the normalized values for the LA9 and the R1-LA9 structures, using either nominal material yield values (Fy = 36 ksi for beams and Fy =50 ksi for columns) or expected yield strength values (Fy = 49.2 ksi for beams and Fy =57.6 ksi for columns). In the LA9 structure, the panel zones and beams are expected to yield at about the same force level (except for Floor 7), whereas for the R1-LA9 structure the panel zones are weak and yield long before the beams will attain their bending strength. The columns appear to be well protected from yielding, since their relative strength value is on the order of 2.
5.2.2.2 Beam Plastic Rotations for Strong Panel Zones
When panel zones are “strong” (i.e., they will not yield even at large drifts), and assuming that columns remain elastic (column issues are discussed in Section 5.5), the beam plastic rotation demand can be estimated with good accuracy by subtracting the average story yield drift angle from the average total drift angle of the two stories above and below the connection. (This statement is justified only if beam moments due to gravity loads are small compared to Mp.) Figures 5-10(a) and 5-11(a) show story drifts and plastic deformations at a roof drift of 0.03 for the lower six stories of the LA9 structure, in which all panel zones at the exterior column line are “strong.”
5.2.2.3 Panel Zone Plastic Distortions for Weak Panel Zones
When panel zones are “weak” (they will yield early and will not permit development of the bending strength of beams (or columns)), the panel zone plastic distortion demand can be estimated by subtracting the average story yield drift angle from the average total drift angle of the two stories above and below the connection, and multiplying this value by the ratio h/(h-db). The latter multiplier is needed because the contribution of panel zone distortion to story drift is δp = γ(h-db), see Figure 2.9. Figures 5-10(b) and 5-11(b) show story drifts and plastic deformations at a roof drift of 0.03 for the bottom six stories of the R1-LA9 structure, in which all panel zones at the interior column line are “weak.”
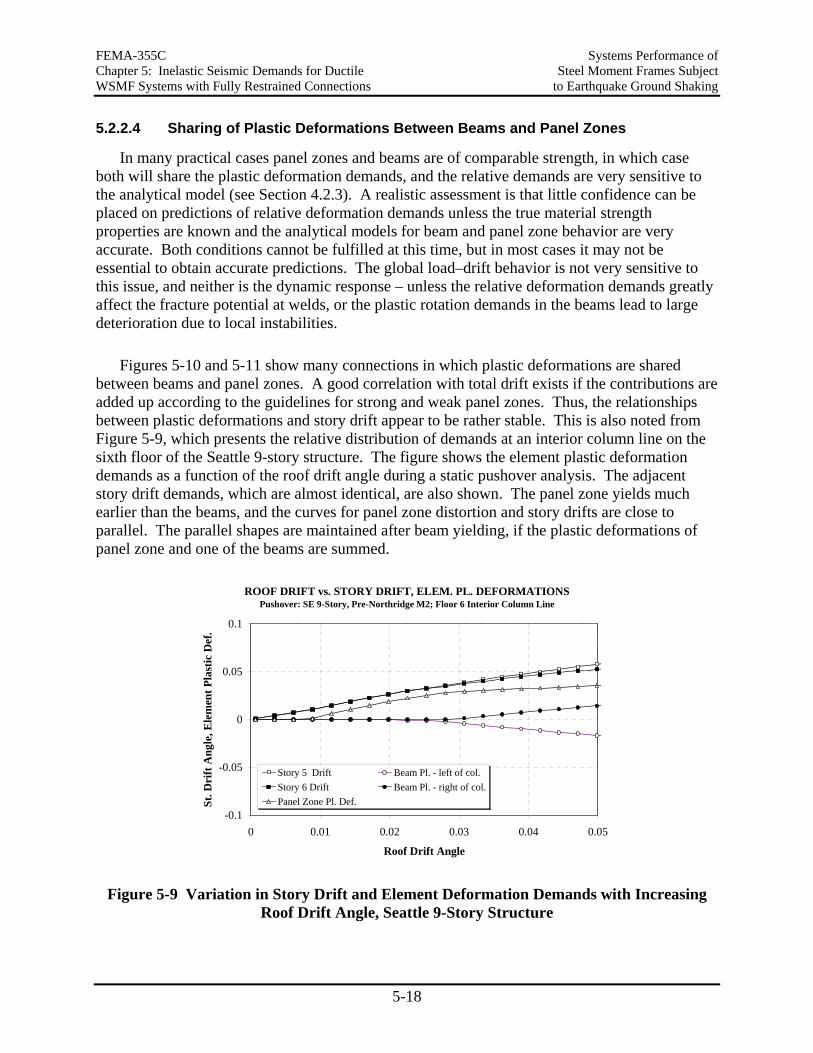
FEMA-355C Systems Performance of Chapter 5: Inelastic Seismic Demands for Ductile Steel Moment Frames Subject WSMF Systems with Fully Restrained Connections to Earthquake Ground Shaking
5-18
5.2.2.4 Sharing of Plastic Deformations Between Beams and Panel Zones
In many practical cases panel zones and beams are of comparable strength, in which case both will share the plastic deformation demands, and the relative demands are very sensitive to the analytical model (see Section 4.2.3). A realistic assessment is that little confidence can be placed on predictions of relative deformation demands unless the true material strength properties are known and the analytical models for beam and panel zone behavior are very accurate. Both conditions cannot be fulfilled at this time, but in most cases it may not be essential to obtain accurate predictions. The global load–drift behavior is not very sensitive to this issue, and neither is the dynamic response – unless the relative deformation demands greatly affect the fracture potential at welds, or the plastic rotation demands in the beams lead to large deterioration due to local instabilities.
Figures 5-10 and 5-11 show many connections in which plastic deformations are shared between beams and panel zones. A good correlation with total drift exists if the contributions are added up according to the guidelines for strong and weak panel zones. Thus, the relationships between plastic deformations and story drift appear to be rather stable. This is also noted from Figure 5-9, which presents the relative distribution of demands at an interior column line on the sixth floor of the Seattle 9-story structure. The figure shows the element plastic deformation demands as a function of the roof drift angle during a static pushover analysis. The adjacent story drift demands, which are almost identical, are also shown. The panel zone yields much earlier than the beams, and the curves for panel zone distortion and story drifts are close to parallel. The parallel shapes are maintained after beam yielding, if the plastic deformations of panel zone and one of the beams are summed.
ROOF DRIFT vs. STORY DRIFT, ELEM. PL. DEFORMATIONSPushover: SE 9-Story, Pre-Northridge M2; Floor 6 Interior Column Line
-0.1
-0.05
0
0.05
0.1
0 0.01 0.02 0.03 0.04 0.05
Roof Drift Angle
St. D
rift
Ang
le, E
lem
ent P
last
ic D
ef.
Story 5 Drift Beam Pl. - left of col.Story 6 Drift Beam Pl. - right of col.Panel Zone Pl. Def.
Figure 5-9 Variation in Story Drift and Element Deformation Demands with Increasing Roof Drift Angle, Seattle 9-Story Structure
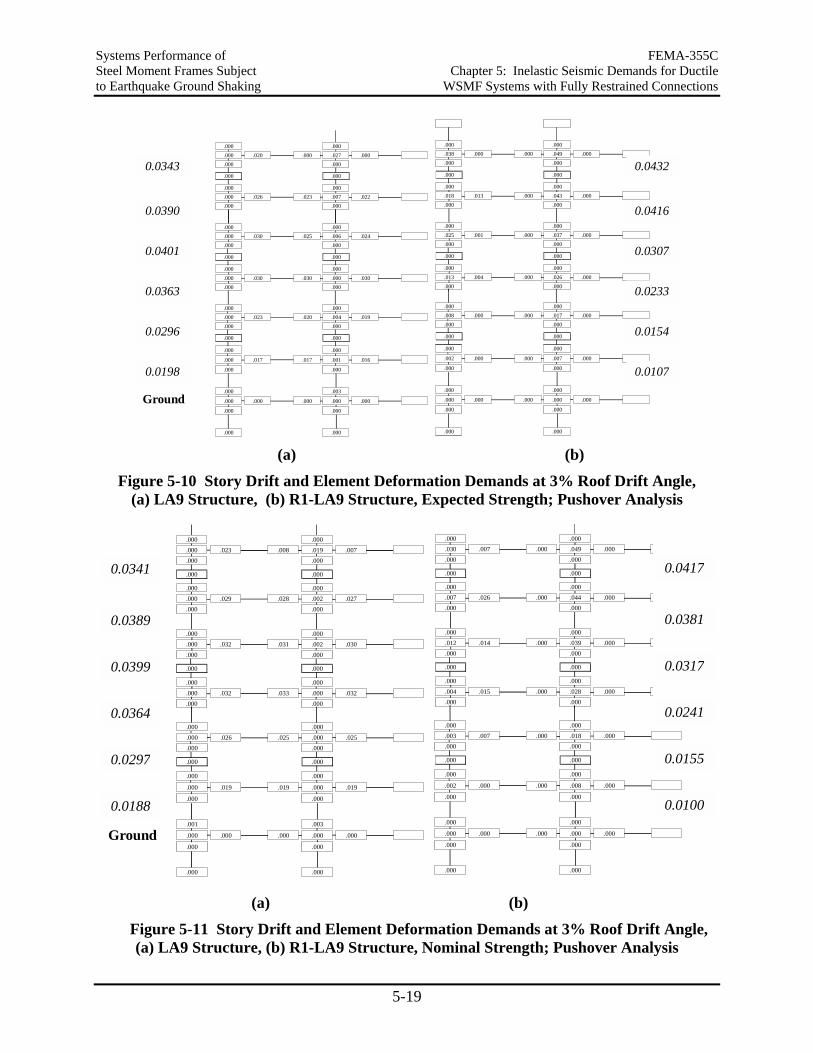
Systems Performance of FEMA-355C Steel Moment Frames Subject Chapter 5: Inelastic Seismic Demands for Ductile to Earthquake Ground Shaking WSMF Systems with Fully Restrained Connections
5-19
.000 .000
.000 .020 .000 .027 .000
.000 .000
.000 .000
.000 .000
.000 .026 .023 .007 .022
.000 .000
.000 .000
.000 .030 .025 .006 .024
.000 .000
.000 .000
.000 .000
.000 .030 .030 .000 .030
.000 .000
.000 .000
.000 .023 .020 .004 .019
.000 .000
.000 .000
.000 .000
.000 .017 .017 .001 .016
.000 .000
.000 .003
.000 .000 .000 .000 .000
.000 .000
.000 .000
.000 .000
.038 .000 .000 .049 .000
.000 .000
.000 .000
.000 .000
.018 .013 .000 .043 .000
.000 .000
.000 .000
.025 .001 .000 .037 .000
.000 .000
.000 .000
.000 .000
.013 .004 .000 .026 .000
.000 .000
.000 .000
.008 .000 .000 .017 .000
.000 .000
.000 .000
.000 .000
.002 .000 .000 .007 .000
.000 .000
.000 .000
.000 .000 .000 .000 .000
.000 .000
.000 .000
0.0198
0.0296
0.0363
0.0401
0.0390
0.0343
0.0107
0.0154
0.0233
0.0307
0.0416
0.0432
Ground
(a) (b)
Figure 5-10 Story Drift and Element Deformation Demands at 3% Roof Drift Angle, (a) LA9 Structure, (b) R1-LA9 Structure, Expected Strength; Pushover Analysis
.000 .000
.000 .023 .008 .019 .007
.000 .000
.000 .000
.000 .000
.000 .029 .028 .002 .027
.000 .000
.000 .000
.000 .032 .031 .002 .030
.000 .000
.000 .000
.000 .000
.000 .032 .033 .000 .032
.000 .000
.000 .000
.000 .026 .025 .000 .025
.000 .000
.000 .000
.000 .000
.000 .019 .019 .000 .019
.000 .000
.001 .003
.000 .000 .000 .000 .000
.000 .000
.000 .000
.000 .000
.030 .007 .000 .049 .000
.000 .000
.000 .000
.000 .000
.007 .026 .000 .044 .000
.000 .000
.000 .000
.012 .014 .000 .039 .000
.000 .000
.000 .000
.000 .000
.004 .015 .000 .028 .000
.000 .000
.000 .000
.003 .007 .000 .018 .000
.000 .000
.000 .000
.000 .000
.002 .000 .000 .008 .000
.000 .000
.000 .000
.000 .000 .000 .000 .000
.000 .000
.000 .000
0.0100
0.0155
0.0241
0.0317
0.0381
0.0417
0.0188
0.0297
0.0364
0.0399
0.0389
0.0341
Ground
(a) (b)
Figure 5-11 Story Drift and Element Deformation Demands at 3% Roof Drift Angle, (a) LA9 Structure, (b) R1-LA9 Structure, Nominal Strength; Pushover Analysis
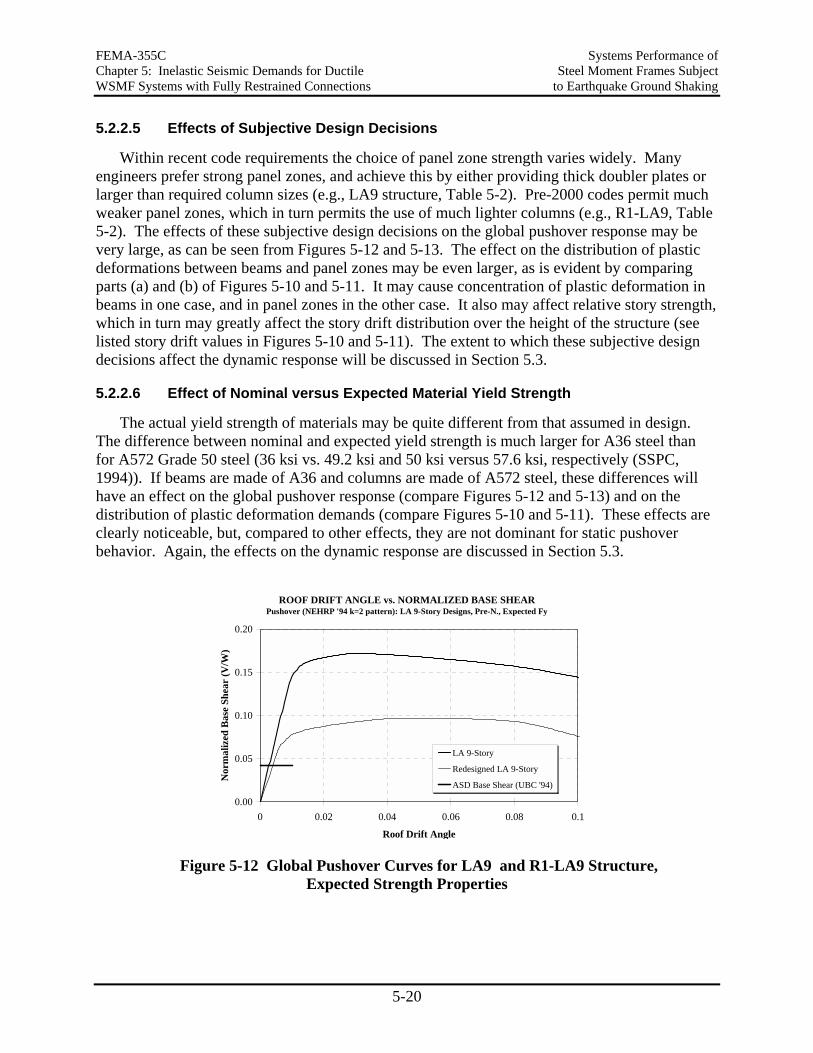
FEMA-355C Systems Performance of Chapter 5: Inelastic Seismic Demands for Ductile Steel Moment Frames Subject WSMF Systems with Fully Restrained Connections to Earthquake Ground Shaking
5-20
5.2.2.5 Effects of Subjective Design Decisions
Within recent code requirements the choice of panel zone strength varies widely. Many engineers prefer strong panel zones, and achieve this by either providing thick doubler plates or larger than required column sizes (e.g., LA9 structure, Table 5-2). Pre-2000 codes permit much weaker panel zones, which in turn permits the use of much lighter columns (e.g., R1-LA9, Table 5-2). The effects of these subjective design decisions on the global pushover response may be very large, as can be seen from Figures 5-12 and 5-13. The effect on the distribution of plastic deformations between beams and panel zones may be even larger, as is evident by comparing parts (a) and (b) of Figures 5-10 and 5-11. It may cause concentration of plastic deformation in beams in one case, and in panel zones in the other case. It also may affect relative story strength, which in turn may greatly affect the story drift distribution over the height of the structure (see listed story drift values in Figures 5-10 and 5-11). The extent to which these subjective design decisions affect the dynamic response will be discussed in Section 5.3.
5.2.2.6 Effect of Nominal versus Expected Material Yield Strength
The actual yield strength of materials may be quite different from that assumed in design. The difference between nominal and expected yield strength is much larger for A36 steel than for A572 Grade 50 steel (36 ksi vs. 49.2 ksi and 50 ksi versus 57.6 ksi, respectively (SSPC, 1994)). If beams are made of A36 and columns are made of A572 steel, these differences will have an effect on the global pushover response (compare Figures 5-12 and 5-13) and on the distribution of plastic deformation demands (compare Figures 5-10 and 5-11). These effects are clearly noticeable, but, compared to other effects, they are not dominant for static pushover behavior. Again, the effects on the dynamic response are discussed in Section 5.3.
ROOF DRIFT ANGLE vs. NORMALIZED BASE SHEARPushover (NEHRP '94 k=2 pattern): LA 9-Story Designs, Pre-N., Expected Fy
0.00
0.05
0.10
0.15
0.20
0 0.02 0.04 0.06 0.08 0.1
Roof Drift Angle
Nor
mal
ized
Bas
e Sh
ear
(V/W
)
LA 9-Story
Redesigned LA 9-Story
ASD Base Shear (UBC '94)
Figure 5-12 Global Pushover Curves for LA9 and R1-LA9 Structure,
Expected Strength Properties
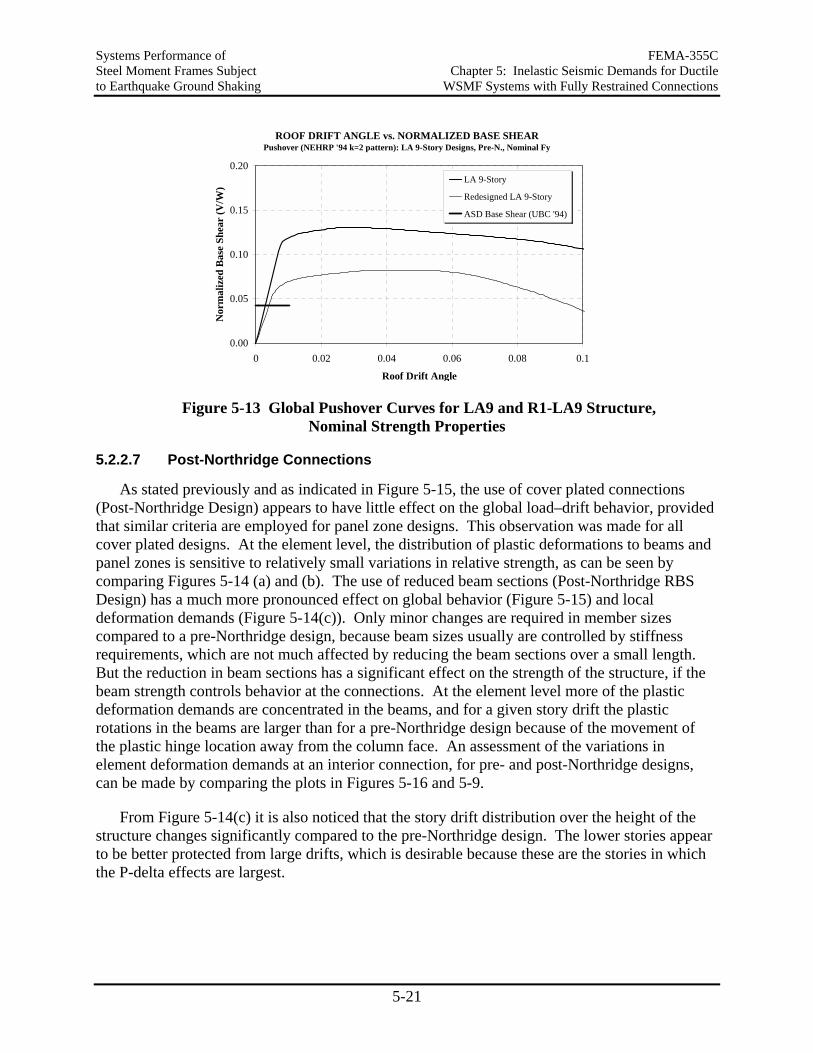
Systems Performance of FEMA-355C Steel Moment Frames Subject Chapter 5: Inelastic Seismic Demands for Ductile to Earthquake Ground Shaking WSMF Systems with Fully Restrained Connections
5-21
ROOF DRIFT ANGLE vs. NORMALIZED BASE SHEARPushover (NEHRP '94 k=2 pattern): LA 9-Story Designs, Pre-N., Nominal Fy
0.00
0.05
0.10
0.15
0.20
0 0.02 0.04 0.06 0.08 0.1
Roof Drift Angle
Nor
mal
ized
Bas
e Sh
ear
(V/W
)
LA 9-Story
Redesigned LA 9-Story
ASD Base Shear (UBC '94)
Figure 5-13 Global Pushover Curves for LA9 and R1-LA9 Structure,
Nominal Strength Properties
5.2.2.7 Post-Northridge Connections
As stated previously and as indicated in Figure 5-15, the use of cover plated connections (Post-Northridge Design) appears to have little effect on the global load–drift behavior, provided that similar criteria are employed for panel zone designs. This observation was made for all cover plated designs. At the element level, the distribution of plastic deformations to beams and panel zones is sensitive to relatively small variations in relative strength, as can be seen by comparing Figures 5-14 (a) and (b). The use of reduced beam sections (Post-Northridge RBS Design) has a much more pronounced effect on global behavior (Figure 5-15) and local deformation demands (Figure 5-14(c)). Only minor changes are required in member sizes compared to a pre-Northridge design, because beam sizes usually are controlled by stiffness requirements, which are not much affected by reducing the beam sections over a small length. But the reduction in beam sections has a significant effect on the strength of the structure, if the beam strength controls behavior at the connections. At the element level more of the plastic deformation demands are concentrated in the beams, and for a given story drift the plastic rotations in the beams are larger than for a pre-Northridge design because of the movement of the plastic hinge location away from the column face. An assessment of the variations in element deformation demands at an interior connection, for pre- and post-Northridge designs, can be made by comparing the plots in Figures 5-16 and 5-9.
From Figure 5-14(c) it is also noticed that the story drift distribution over the height of the structure changes significantly compared to the pre-Northridge design. The lower stories appear to be better protected from large drifts, which is desirable because these are the stories in which the P-delta effects are largest.
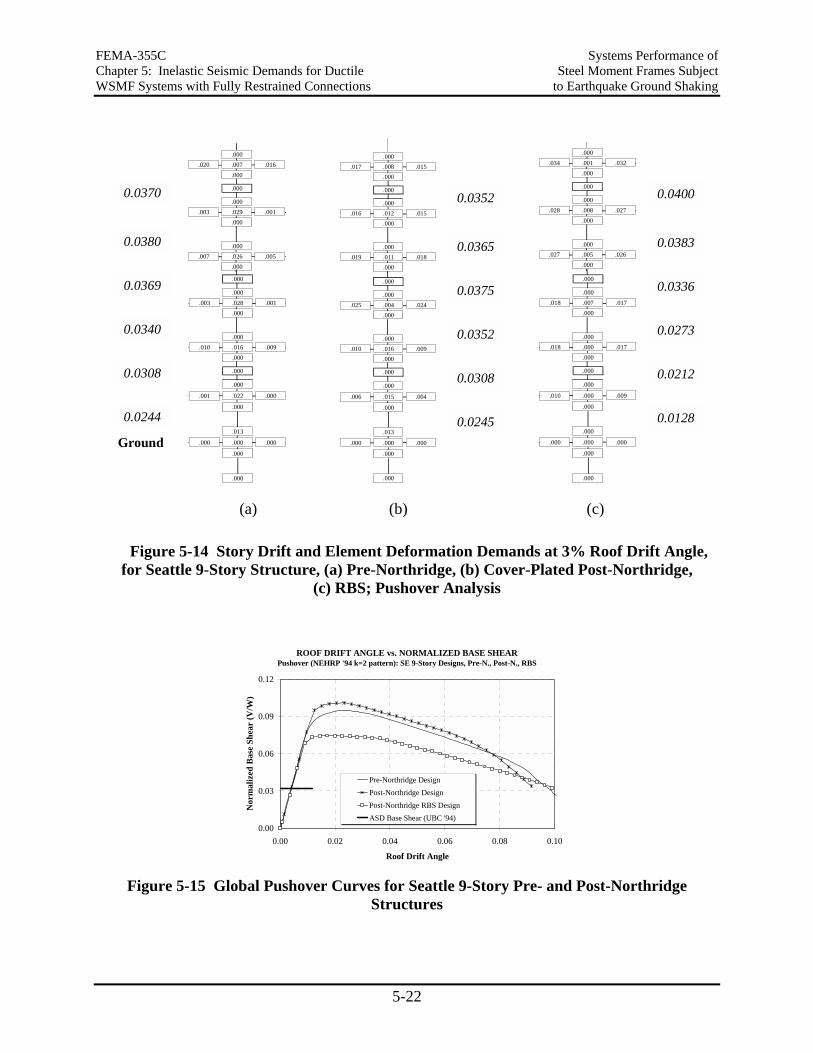
FEMA-355C Systems Performance of Chapter 5: Inelastic Seismic Demands for Ductile Steel Moment Frames Subject WSMF Systems with Fully Restrained Connections to Earthquake Ground Shaking
5-22
0.0244
0.0308
0.0340
0.0369
0.0380
0.0370
0.0245
0.0308
0.0352
0.0375
0.0365
0.0352
.000.020 .007 .016
.000
.000
.000.003 .029 .001
.000
.000.007 .026 .005
.000
.000
.000.003 .028 .001
.000
.000.010 .016 .009
.000
.000
.000
.001 .022 .000
.000
.013
.000 .000 .000
.000
.000
.000.017 .008 .015
.000
.000
.000.016 .012 .015
.000
.000.019 .011 .018
.000
.000
.000.025 .004 .024
.000
.000.010 .016 .009
.000
.000
.000
.006 .015 .004
.000
.013
.000 .000 .000
.000
.000
.000.034 .001 .032
.000
.000
.000.028 .008 .027
.000
.000.027 .005 .026
.000
.000
.000.018 .007 .017
.000
.000.018 .000 .017
.000
.000
.000
.010 .000 .009
.000
.000
.000 .000 .000
.000
.000
Ground
0.0128
0.0212
0.0273
0.0336
0.0383
0.0400
(a) (b) (c)
Figure 5-14 Story Drift and Element Deformation Demands at 3% Roof Drift Angle, for Seattle 9-Story Structure, (a) Pre-Northridge, (b) Cover-Plated Post-Northridge,
(c) RBS; Pushover Analysis
ROOF DRIFT ANGLE vs. NORMALIZED BASE SHEARPushover (NEHRP '94 k=2 pattern): SE 9-Story Designs, Pre-N., Post-N., RBS
0.00
0.03
0.06
0.09
0.12
0.00 0.02 0.04 0.06 0.08 0.10
Roof Drift Angle
Nor
mal
ized
Bas
e Sh
ear
(V/W
)
Pre-Northridge DesignPost-Northridge DesignPost-Northridge RBS DesignASD Base Shear (UBC '94)
Figure 5-15 Global Pushover Curves for Seattle 9-Story Pre- and Post-Northridge
Structures
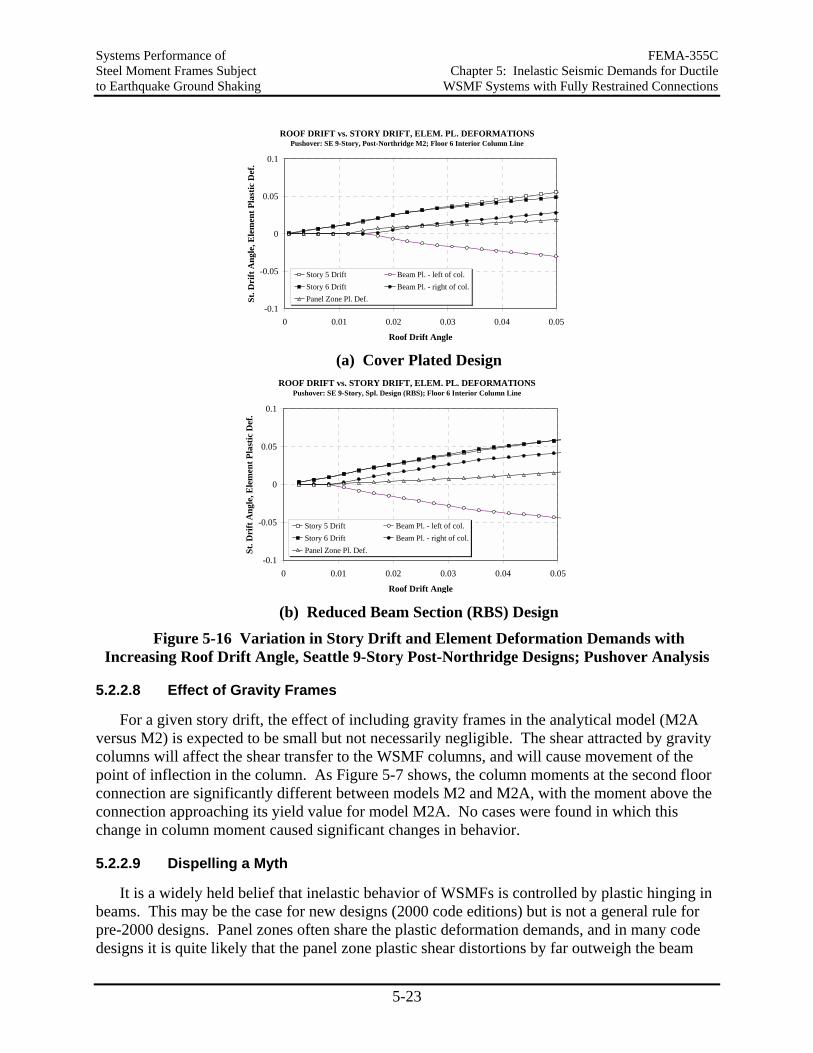
Systems Performance of FEMA-355C Steel Moment Frames Subject Chapter 5: Inelastic Seismic Demands for Ductile to Earthquake Ground Shaking WSMF Systems with Fully Restrained Connections
5-23
ROOF DRIFT vs. STORY DRIFT, ELEM. PL. DEFORMATIONSPushover: SE 9-Story, Post-Northridge M2; Floor 6 Interior Column Line
-0.1
-0.05
0
0.05
0.1
0 0.01 0.02 0.03 0.04 0.05
Roof Drift Angle
St. D
rift
Ang
le, E
lem
ent P
last
ic D
ef.
Story 5 Drift Beam Pl. - left of col.Story 6 Drift Beam Pl. - right of col.Panel Zone Pl. Def.
(a) Cover Plated Design
ROOF DRIFT vs. STORY DRIFT, ELEM. PL. DEFORMATIONSPushover: SE 9-Story, Spl. Design (RBS); Floor 6 Interior Column Line
-0.1
-0.05
0
0.05
0.1
0 0.01 0.02 0.03 0.04 0.05
Roof Drift Angle
St. D
rift
Ang
le, E
lem
ent P
last
ic D
ef.
Story 5 Drift Beam Pl. - left of col.Story 6 Drift Beam Pl. - right of col.Panel Zone Pl. Def.
(b) Reduced Beam Section (RBS) Design
Figure 5-16 Variation in Story Drift and Element Deformation Demands with Increasing Roof Drift Angle, Seattle 9-Story Post-Northridge Designs; Pushover Analysis
5.2.2.8 Effect of Gravity Frames
For a given story drift, the effect of including gravity frames in the analytical model (M2A versus M2) is expected to be small but not necessarily negligible. The shear attracted by gravity columns will affect the shear transfer to the WSMF columns, and will cause movement of the point of inflection in the column. As Figure 5-7 shows, the column moments at the second floor connection are significantly different between models M2 and M2A, with the moment above the connection approaching its yield value for model M2A. No cases were found in which this change in column moment caused significant changes in behavior.
5.2.2.9 Dispelling a Myth
It is a widely held belief that inelastic behavior of WSMFs is controlled by plastic hinging in beams. This may be the case for new designs (2000 code editions) but is not a general rule for pre-2000 designs. Panel zones often share the plastic deformation demands, and in many code designs it is quite likely that the panel zone plastic shear distortions by far outweigh the beam
FEMA-355C Systems Performance of Chapter 5: Inelastic Seismic Demands for Ductile Steel Moment Frames Subject WSMF Systems with Fully Restrained Connections to Earthquake Ground Shaking
5-24
plastic rotation demands. Thus, for a given story drift, the beam plastic rotation demands for pre-2000 designs are usually smaller, and in many cases much smaller, than is assumed in standard practice. This likely is not the case for RBS designs, in which the beam bending strength, and consequently the panel zone shear demands, are significantly reduced.
5.3 Roof and Story Drift Demands Under Ground Motions of Different Intensity
Roof and story drifts are believed to be the most relevant global demand parameters for WSMFs. Once the drifts are known, element deformation demands can be estimated, as was discussed in Section 5.2.2. Seismic drift demands depend on design decisions and ground motion severity and frequency characteristics. The SAC 3-, 9-, and 20-story structures, which are designed in accordance with standard practice and prevailing code criteria and guidelines (UBC (1994), BOCA (1993), FEMA 267 (1995)), are used here to illustrate basic concepts and to provide representative results that can be used for a performance assessment. The SAC structures are designed for seismic (and wind) conditions in Los Angeles (seismic zone 4), Seattle (seismic zone 3), and Boston (seismic zone 2A). Documentation of the designs of these structures is provided in Appendix B. The behavior and response of these structures is studied by subjecting representative nonlinear analytical models (models M1, M2, and M2A) to sets of ground motions. The observations made and the conclusions drawn in Sections 5.3 to 5.10 are based on the assumption that element inelastic behavior can be represented by nondegrading bilinear hysteretic diagrams with 3% strain hardening. Section 5.11 addresses issues associated with stiffness degradation and strength deterioration.
The SAC structures are representative of WSMF structures with first mode periods in the range of about 1 to 4 seconds. Structures with shorter periods are not investigated.
Various sets of ground motions are used to evaluate seismic demands. In the baseline study, whose results are used in support of the comments made in Sections 5.3 to 5.7, the employed sets of records are representative of site hazards with a probability of exceedence of 50% (50/50), 10% (10/50), and 2% in 50 years (2/50), corresponding to return periods of 72, 475, and 2475 years, respectively. The seismic demands under special ground motions, i.e., near-fault records and soft soil records, are summarized in Section 5.8.
5.3.1 Spectral Characteristics of Sets of Records Used in Baseline Study
Seismic demand predictions obtained from time history analysis need to be evaluated in the context of the ground motions used in the analysis. Comprehensive documentation of the sets of ground motions is contained in Appendix A. The 10/50 and 2/50 sets, and an additional set of 50/50 records for the Los Angeles site, are employed in the baseline study.
Issues related to the ground motion representation, which include record selection (there are mostly pulse-type near-fault records in the LA 2/50 set and several very long strong motion duration records in the Seattle 2/50 set), orientation of components with respect to fault, record scaling, and matching with spectral values, are addressed in Somerville et al. (1997).
Median strength demand (acceleration) and displacement demand spectra of the 50/50, 10/50, and 2/50 sets of records are presented in Figures 5-17 and 5-18. The dispersion of the
Systems Performance of FEMA-355C Steel Moment Frames Subject Chapter 5: Inelastic Seismic Demands for Ductile to Earthquake Ground Shaking WSMF Systems with Fully Restrained Connections
5-25
individual records can be assessed from the graphs presented in Appendix A. The presented spectra are obtained by using 2% viscous damping, which is the damping assumed in the time history analysis of the structures. Superimposed on each graph is the NEHRP’94 design spectrum for the corresponding location and soil type. The NEHRP spectra are for 5% damping, which needs to be considered in evaluating relative severity of the spectra.
Within the period range of primary interest (1 to 4 seconds), the following observations are important in assessing the severity and frequency characteristics of the median spectra. (Figures A.1 to A.14 indicate that these observations may not apply to many of the individual records.) Table 5-1 can be consulted to place the periods of the SAC structures in the context of the spectra.
• For LA and Seattle conditions, the 10/50 spectra are a reasonable representation of the NEHRP’94 design spectra, but only for periods smaller than about 3 seconds.
• For LA and Seattle conditions, the 2/50 spectra exceed the NEHRP’94 spectra by a large amount, except at very long periods.
• The Seattle spectral displacement demands are comparable to the LA demands for the 3-story structure, but they become clearly smaller for the longer period structures. In the long period range (greater than 2.5 seconds), the Seattle spectral displacement demands are about half the demands for LA. It appears that the long duration records generated in the Seattle subduction zone area create relatively smaller long period displacement demands than the short duration near-fault records that dominate the rare LA events.
• All spectra reach a constant displacement plateau at relatively low periods. In these constant displacement regions, the drift demands are expected to be little affected by elastic stiffness variations or inelastic period shifts – unless higher mode effects dominate the response.
• For Boston conditions, the 10/50 spectrum is much below the NEHRP’94 spectrum. In the first mode period range (greater than 1.6 seconds for Boston), this observation applies also to the 2/50 spectrum. The records used for Boston have very little energy content in this period range, which leads to the up-front conclusion that the response of these structures is controlled by higher mode effects.
The great differences in the shape of the NEHRP’94 spectra and the median spectra of the sets of records leads to the observation that the predicted demands are not likely to follow present code design expectations.
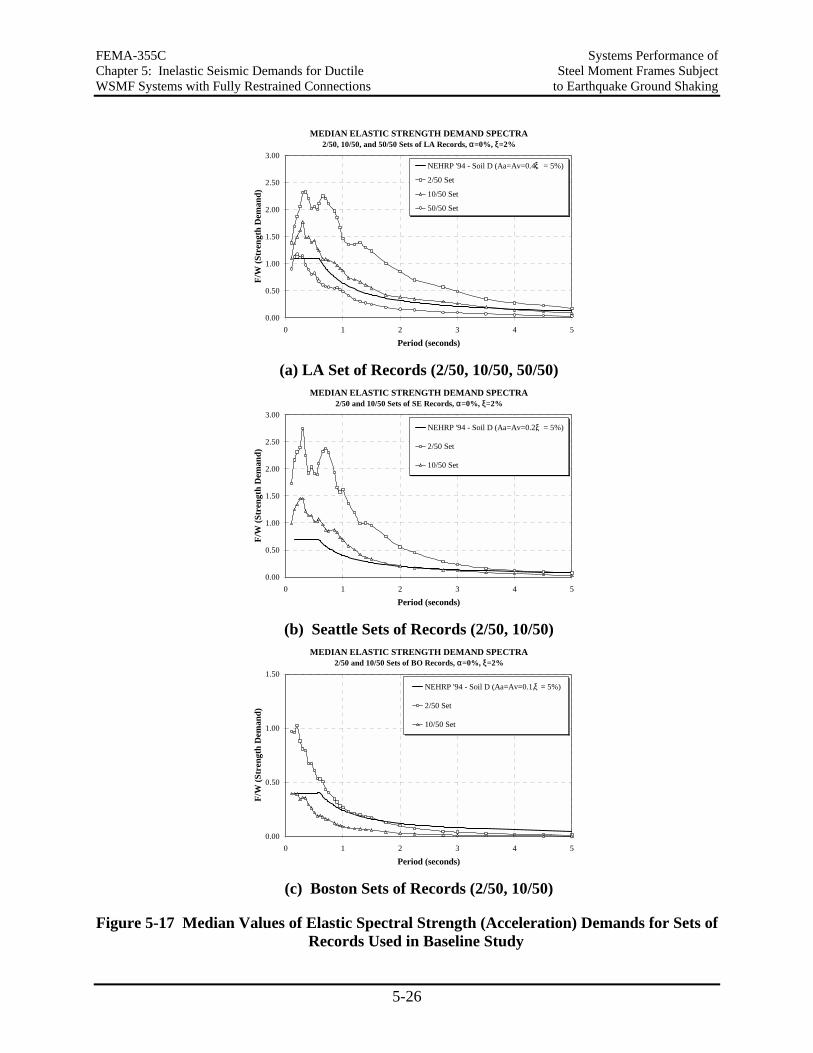
FEMA-355C Systems Performance of Chapter 5: Inelastic Seismic Demands for Ductile Steel Moment Frames Subject WSMF Systems with Fully Restrained Connections to Earthquake Ground Shaking
5-26
MEDIAN ELASTIC STRENGTH DEMAND SPECTRA2/50, 10/50, and 50/50 Sets of LA Records, α=0%, ξ=2%
0.00
0.50
1.00
1.50
2.00
2.50
3.00
0 1 2 3 4 5
Period (seconds)
F/W
(Str
engt
h D
eman
d)
NEHRP '94 - Soil D (Aa=Av=0.4, = 5%)
2/50 Set
10/50 Set
50/50 Set
ξ
(a) LA Set of Records (2/50, 10/50, 50/50)
MEDIAN ELASTIC STRENGTH DEMAND SPECTRA2/50 and 10/50 Sets of SE Records, α=0%, ξ=2%
0.00
0.50
1.00
1.50
2.00
2.50
3.00
0 1 2 3 4 5
Period (seconds)
F/W
(Str
engt
h D
eman
d)
NEHRP '94 - Soil D (Aa=Av=0.2, = 5%)
2/50 Set
10/50 Set
ξ
(b) Seattle Sets of Records (2/50, 10/50)
MEDIAN ELASTIC STRENGTH DEMAND SPECTRA2/50 and 10/50 Sets of BO Records, α=0%, ξ=2%
0.00
0.50
1.00
1.50
0 1 2 3 4 5
Period (seconds)
F/W
(Str
engt
h D
eman
d)
NEHRP '94 - Soil D (Aa=Av=0.1, = 5%)
2/50 Set
10/50 Set
ξ
(c) Boston Sets of Records (2/50, 10/50)
Figure 5-17 Median Values of Elastic Spectral Strength (Acceleration) Demands for Sets of Records Used in Baseline Study
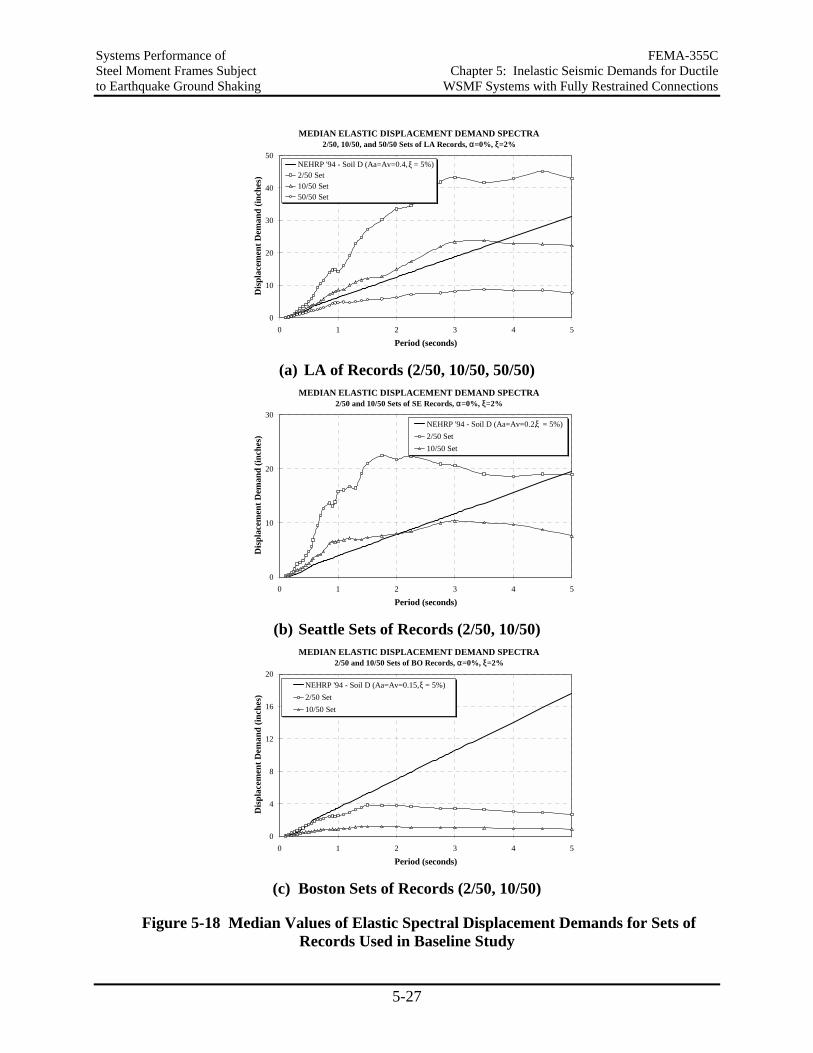
Systems Performance of FEMA-355C Steel Moment Frames Subject Chapter 5: Inelastic Seismic Demands for Ductile to Earthquake Ground Shaking WSMF Systems with Fully Restrained Connections
5-27
MEDIAN ELASTIC DISPLACEMENT DEMAND SPECTRA2/50, 10/50, and 50/50 Sets of LA Records, α=0%, ξ=2%
0
10
20
30
40
50
0 1 2 3 4 5
Period (seconds)
Dis
plac
emen
t Dem
and
(inch
es)
NEHRP '94 - Soil D (Aa=Av=0.4, = 5%)2/50 Set10/50 Set50/50 Set
ξ
(a) LA of Records (2/50, 10/50, 50/50)
MEDIAN ELASTIC DISPLACEMENT DEMAND SPECTRA2/50 and 10/50 Sets of SE Records, α=0%, ξ=2%
0
10
20
30
0 1 2 3 4 5
Period (seconds)
Dis
plac
emen
t Dem
and
(inch
es)
NEHRP '94 - Soil D (Aa=Av=0.2, = 5%)2/50 Set10/50 Set
ξ
(b) Seattle Sets of Records (2/50, 10/50)
MEDIAN ELASTIC DISPLACEMENT DEMAND SPECTRA2/50 and 10/50 Sets of BO Records, α=0%, ξ=2%
0
4
8
12
16
20
0 1 2 3 4 5
Period (seconds)
Dis
plac
emen
t Dem
and
(inch
es)
NEHRP '94 - Soil D (Aa=Av=0.15, = 5%)2/50 Set10/50 Set
ξ
(c) Boston Sets of Records (2/50, 10/50)
Figure 5-18 Median Values of Elastic Spectral Displacement Demands for Sets of Records Used in Baseline Study
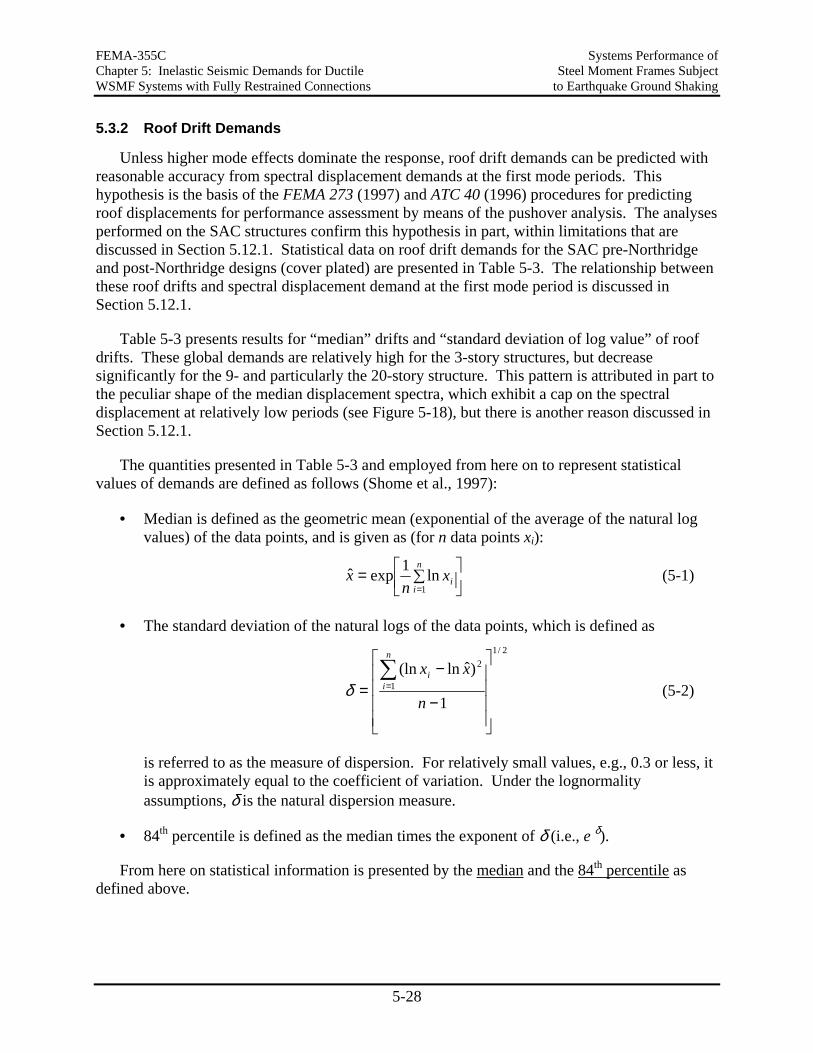
FEMA-355C Systems Performance of Chapter 5: Inelastic Seismic Demands for Ductile Steel Moment Frames Subject WSMF Systems with Fully Restrained Connections to Earthquake Ground Shaking
5-28
5.3.2 Roof Drift Demands
Unless higher mode effects dominate the response, roof drift demands can be predicted with reasonable accuracy from spectral displacement demands at the first mode periods. This hypothesis is the basis of the FEMA 273 (1997) and ATC 40 (1996) procedures for predicting roof displacements for performance assessment by means of the pushover analysis. The analyses performed on the SAC structures confirm this hypothesis in part, within limitations that are discussed in Section 5.12.1. Statistical data on roof drift demands for the SAC pre-Northridge and post-Northridge designs (cover plated) are presented in Table 5-3. The relationship between these roof drifts and spectral displacement demand at the first mode period is discussed in Section 5.12.1.
Table 5-3 presents results for “median” drifts and “standard deviation of log value” of roof drifts. These global demands are relatively high for the 3-story structures, but decrease significantly for the 9- and particularly the 20-story structure. This pattern is attributed in part to the peculiar shape of the median displacement spectra, which exhibit a cap on the spectral displacement at relatively low periods (see Figure 5-18), but there is another reason discussed in Section 5.12.1.
The quantities presented in Table 5-3 and employed from here on to represent statistical values of demands are defined as follows (Shome et al., 1997):
• Median is defined as the geometric mean (exponential of the average of the natural log values) of the data points, and is given as (for n data points xi):
∑==
n
iix
nx
1ln1expˆ (5-1)
• The standard deviation of the natural logs of the data points, which is defined as
2/1
1
2
1
)ˆln(ln
−
−=∑
=
n
xxn
ii
δ (5-2)
is referred to as the measure of dispersion. For relatively small values, e.g., 0.3 or less, it is approximately equal to the coefficient of variation. Under the lognormality assumptions, δ is the natural dispersion measure.
• 84th percentile is defined as the median times the exponent of δ (i.e., e δ).
From here on statistical information is presented by the median and the 84th percentile as defined above.
Systems Performance of FEMA-355C Steel Moment Frames Subject Chapter 5: Inelastic Seismic Demands for Ductile to Earthquake Ground Shaking WSMF Systems with Fully Restrained Connections
5-29
5.3.3 Story Drift Demands
There is wide consensus that, for moment-resisting frames, the interstory drift demand, expressed in terms of the story drift angle δ/h (δ being the interstory displacement, h the height of the story), is the best measure of performance at the story level. (If performance has to do with damage within the structure, then drift components due to foundation rocking should be subtracted. If relationships are to be drawn to element deformations (e.g., plastic rotations in beams), then the drift component due to axial shortening of columns (“flexural drift”) should also be subtracted. The same holds true for nonstructural damage assessment in the line of the WSMF.) The story drift angle is a global parameter in the sense that it can be related to the roof drift angle and therefore to the spectral displacement demand (see Section 5.12.1), and local in the sense that it often provides good estimates of the element force and deformation demands (see Section 5.6). For most WSMF structures, most of the story drift is “shear drift” caused by flexural deformations in beams and columns and shear distortions in the panel zones. The “flexural drift” component due to axial deformations in the columns is usually small, particularly in the inelastic range in which the shear drift components increase due to inelastic deformations but the axial forces in columns change only by small amounts.
An alternative representation of story drift is accomplished by normalizing the story drifts by a yield story drift, which results in story ductility demands. The story ductility provides a rough assessment of the relative demand on plastic deformations, which may be a combination of plastic hinge rotations in beams and columns, and plastic shear distortions in panel zones (assuming that connections are fully restrained and do not undergo inelastic deformations). Because of the normalization, story ductility is a relative measure; it does not provide information on absolute plastic deformation demands. It is not a uniquely defined value because the yield story drift may be defined in different ways and depends on the lateral load pattern. The definition used here is that the yield story drift corresponds to the first significant deviation from a straight line of the story shear–story drift relationship obtained from the lateral load pattern used in the pushover analysis. It needs to be pointed out that this is a static load pattern, and that the dynamic story shears causing the first plastic hinge in a story may differ by about 30% from this pattern. Thus, the story ductility is more of a qualitative measure than a quantitative one.
The observations and conclusions summarized in this section utilize the results from time history analysis of the SAC structures for illustration. The results presented in figures are based on analysis of the M2 models of the pre-Northridge structures, unless noted differently. Figure 5-19 shows median and 84th percentile values of maximum story drifts for the pre-Northridge structures subjected to the ground motion sets summarized in Section 5.3.1. Figure 5-20 shows the same information, but in terms of story ductility demands. The yield drift values used for normalization are obtained from a pushover analysis. In most but not all cases, the pushover analysis did cause yielding in every story. When yielding did not occur (primarily for the LA-20-story structure, where the top seven stories remained elastic), the yield story drift is estimated from the approximate procedure summarized in Section 5.4.1. The yield story drifts vary between 0.007 and 0.013, depending on span, number of stories, location in structure (story), and location of structure (geographic region).
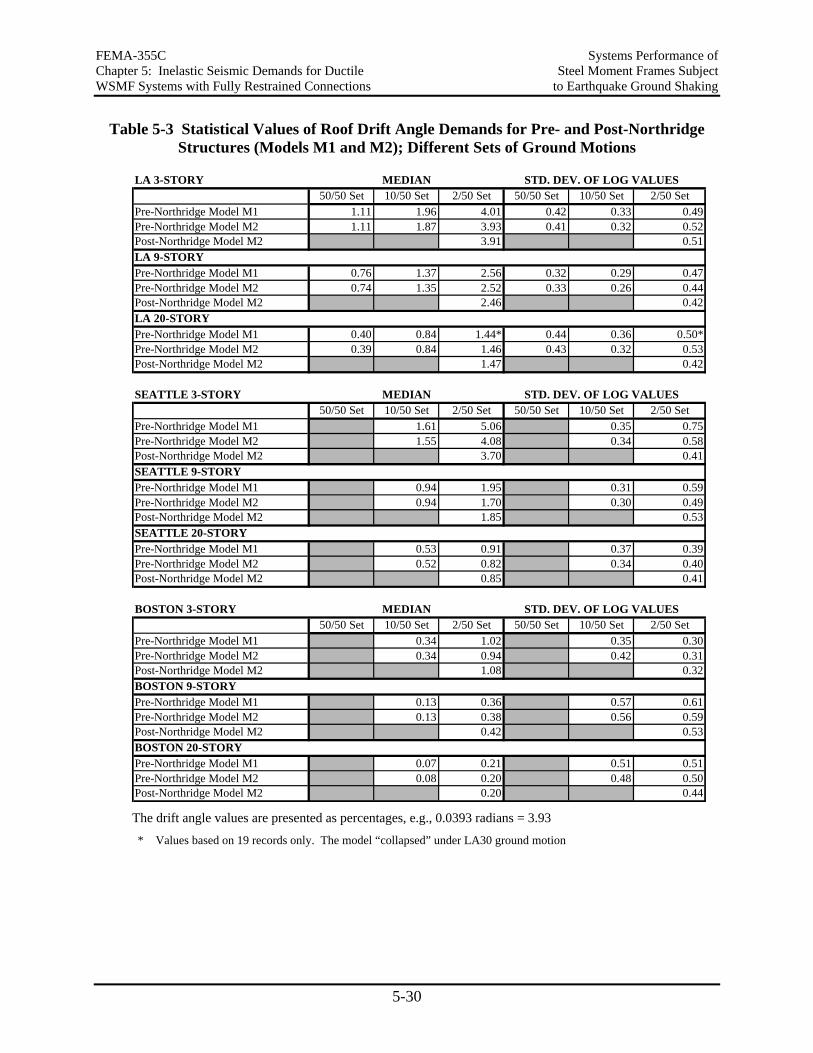
FEMA-355C Systems Performance of Chapter 5: Inelastic Seismic Demands for Ductile Steel Moment Frames Subject WSMF Systems with Fully Restrained Connections to Earthquake Ground Shaking
5-30
Table 5-3 Statistical Values of Roof Drift Angle Demands for Pre- and Post-Northridge Structures (Models M1 and M2); Different Sets of Ground Motions
LA 3-STORY MEDIAN STD. DEV. OF LOG VALUES50/50 Set 10/50 Set 2/50 Set 50/50 Set 10/50 Set 2/50 Set
Pre-Northridge Model M1 1.11 1.96 4.01 0.42 0.33 0.49Pre-Northridge Model M2 1.11 1.87 3.93 0.41 0.32 0.52Post-Northridge Model M2 3.91 0.51LA 9-STORYPre-Northridge Model M1 0.76 1.37 2.56 0.32 0.29 0.47Pre-Northridge Model M2 0.74 1.35 2.52 0.33 0.26 0.44Post-Northridge Model M2 2.46 0.42LA 20-STORYPre-Northridge Model M1 0.40 0.84 1.44* 0.44 0.36 0.50*Pre-Northridge Model M2 0.39 0.84 1.46 0.43 0.32 0.53Post-Northridge Model M2 1.47 0.42
SEATTLE 3-STORY MEDIAN STD. DEV. OF LOG VALUES50/50 Set 10/50 Set 2/50 Set 50/50 Set 10/50 Set 2/50 Set
Pre-Northridge Model M1 1.61 5.06 0.35 0.75Pre-Northridge Model M2 1.55 4.08 0.34 0.58Post-Northridge Model M2 3.70 0.41SEATTLE 9-STORYPre-Northridge Model M1 0.94 1.95 0.31 0.59Pre-Northridge Model M2 0.94 1.70 0.30 0.49Post-Northridge Model M2 1.85 0.53SEATTLE 20-STORYPre-Northridge Model M1 0.53 0.91 0.37 0.39Pre-Northridge Model M2 0.52 0.82 0.34 0.40Post-Northridge Model M2 0.85 0.41
BOSTON 3-STORY MEDIAN STD. DEV. OF LOG VALUES50/50 Set 10/50 Set 2/50 Set 50/50 Set 10/50 Set 2/50 Set
Pre-Northridge Model M1 0.34 1.02 0.35 0.30Pre-Northridge Model M2 0.34 0.94 0.42 0.31Post-Northridge Model M2 1.08 0.32BOSTON 9-STORYPre-Northridge Model M1 0.13 0.36 0.57 0.61Pre-Northridge Model M2 0.13 0.38 0.56 0.59Post-Northridge Model M2 0.42 0.53BOSTON 20-STORYPre-Northridge Model M1 0.07 0.21 0.51 0.51Pre-Northridge Model M2 0.08 0.20 0.48 0.50Post-Northridge Model M2 0.20 0.44 The drift angle values are presented as percentages, e.g., 0.0393 radians = 3.93
* Values based on 19 records only. The model “collapsed” under LA30 ground motion
Systems Performance of FEMA-355C Steel Moment Frames Subject Chapter 5: Inelastic Seismic Demands for Ductile to Earthquake Ground Shaking WSMF Systems with Fully Restrained Connections
5-31
A different way of evaluating story drifts is by normalizing all story drifts by the roof drift, which is the global measure of response to a specific ground motion. Median values of the ratio of story drift to roof drift for the 10/50 and 2/50 ground motion sets are presented in Figure 5-21. These ratios identify the amplification of drifts in the individual stories compared to the roof drift. Specific issues related to story drift are illustrated in Figures 5-22 to 5-33. Figures 5-34 and 5-35 illustrate examples of drift hazard curves, which provide a simple means of assessing the annual hazard of exceeding a specified drift level.
The following general observations and conclusions are relevant in the context of seismic performance. Quantitative information is based on the time history response of the SAC structures, which are regular in plan and elevation, and follow sound but not unique design principles. No extrapolation is attempted to designs that follow different principles or exhibit significant irregularities. No quantitative relevance should be attached to very large drift values obtained in several cases. It is likely that significant deterioration in beam bending strength occurs at plastic rotations in the order of about 3% to 5% (provided that adequate lateral bracing is provided), which corresponds to a story drift of about 4% to 6%. This deterioration is not considered in the results presented in this section.
5.3.3.1 Observations Based on Response of SAC Structures
The story drift and ductility demands of the pre-Northridge structures exhibit the following patterns:
• The demands for the 10/50 ground motions are in line with expectations for well designed structures, presuming that these ground motions are representative of design ground motions. The drift demands are not excessive even though bare frame models are used in the analysis, and the ductility demands are relatively low.
• The demands for the 2/50 ground motions are large but not excessive in the median, but very large at the 84th percentile level for specific structures (all LA structures and the Seattle 3-story structure). The very large 84th percentile demands are due to several very severe ground motions, whose effects are further amplified for the LA 20-story and the Seattle 3-story structures due to severe P-delta effects.
• In general, the median demands are not very different for the LA and Seattle structures, even though these structures are located in regions of different seismicity. The exception is the Seattle 20-story structure, which exhibits smaller demands because the member sizes of its lower stories are controlled by wind design considerations.
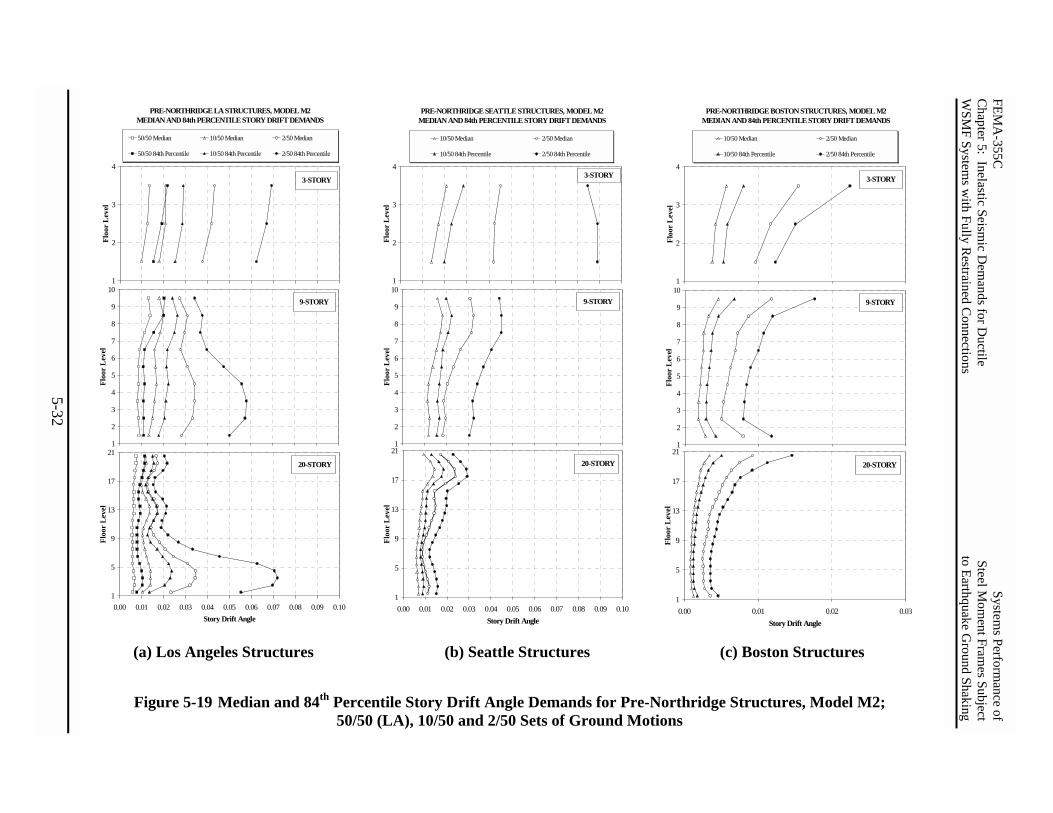
5-32
FEMA
-355C
Systems Perform
ance of C
hapter 5: Inelastic Seismic D
emands for D
uctile Steel M
oment Fram
es Subject W
SMF System
s with Fully R
estrained Connections
to Earthquake Ground Shaking
1
2
3
4
5
6
7
8
9
10
Floo
r L
evel
9-STORY
1
5
9
13
17
21
0.00 0.01 0.02 0.03 0.04 0.05 0.06 0.07 0.08 0.09 0.10Story Drift Angle
Floo
r L
evel
`
20-STORY
PRE-NORTHRIDGE LA STRUCTURES, MODEL M2MEDIAN AND 84th PERCENTILE STORY DRIFT DEMANDS
1
2
3
4
Floo
r L
evel
50/50 Median 10/50 Median 2/50 Median
50/50 84th Percentile 10/50 84th Percentile 2/50 84th Percentile
3-STORY
PRE-NORTHRIDGE SEATTLE STRUCTURES, MODEL M2MEDIAN AND 84th PERCENTILE STORY DRIFT DEMANDS
1
2
3
4
Floo
r L
evel
10/50 Median 2/50 Median
10/50 84th Percentile 2/50 84th Percentile
3-STORY
1
2
3
4
5
6
7
8
9
10
Floo
r L
evel
9-STORY
1
5
9
13
17
21
0.00 0.01 0.02 0.03 0.04 0.05 0.06 0.07 0.08 0.09 0.10Story Drift Angle
Floo
r L
evel
20-STORY
PRE-NORTHRIDGE BOSTON STRUCTURES, MODEL M2MEDIAN AND 84th PERCENTILE STORY DRIFT DEMANDS
1
2
3
4
Floo
r L
evel
10/50 Median 2/50 Median
10/50 84th Percentile 2/50 84th Percentile
3-STORY
1
2
3
4
5
6
7
8
9
10
Floo
r L
evel
9-STORY
1
5
9
13
17
21
0.00 0.01 0.02 0.03Story Drift Angle
Floo
r L
evel
20-STORY
(a) Los Angeles Structures (b) Seattle Structures (c) Boston Structures
Figure 5-19 Median and 84th Percentile Story Drift Angle Demands for Pre-Northridge Structures, Model M2; 50/50 (LA), 10/50 and 2/50 Sets of Ground Motions
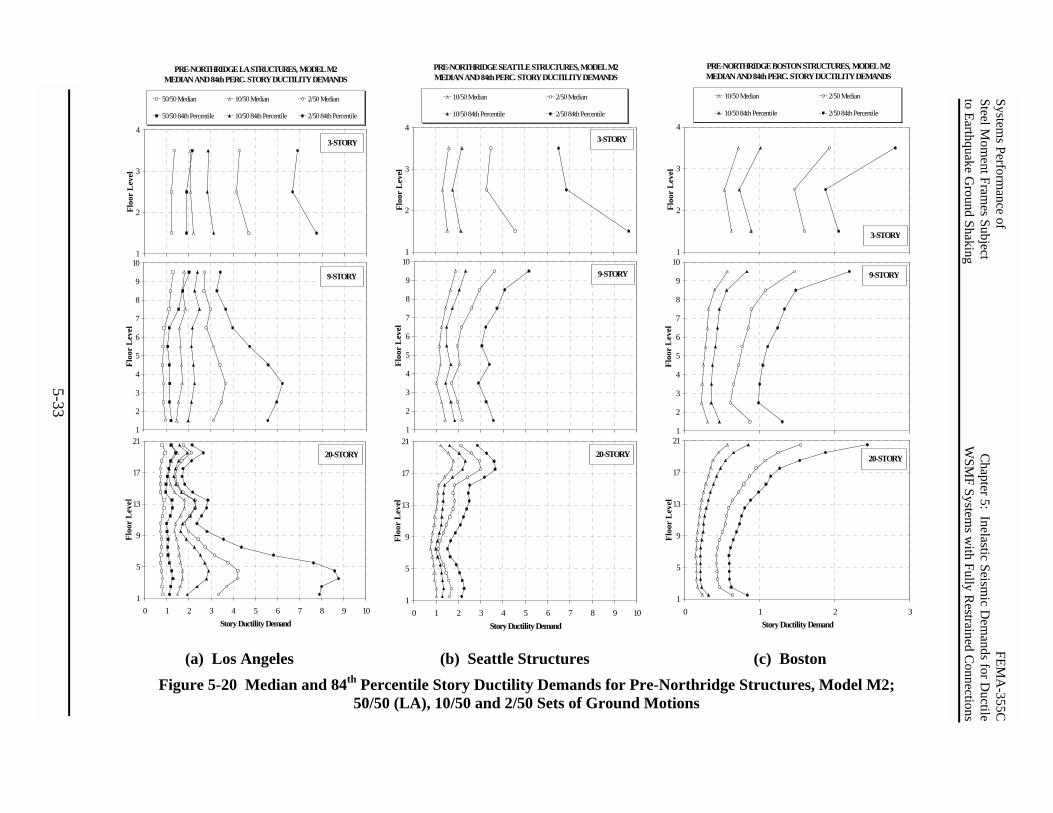
(a) Los Angeles (b) Seattle Structures (c) Boston
Figure 5-20 Median and 84th Percentile Story Ductility Demands for Pre-Northridge Structures, Model M2; 50/50 (LA), 10/50 and 2/50 Sets of Ground Motions
5-33
PRE-NORTHRIDGE SEATTLE STRUCTURES, MODEL M2MEDIAN AND 84th PERC. STORY DUCTILITY DEMANDS
1
2
3
4
Floo
r L
evel
10/50 Median 2/50 Median
10/50 84th Percentile 2/50 84th Percentile
3-STORY
1
2
3
4
5
6
7
8
9
10
Floo
r L
evel
9-STORY
1
5
9
13
17
21
0 1 2 3 4 5 6 7 8 9 10Story Ductility Demand
Floo
r L
evel
20-STORY
PRE-NORTHRIDGE BOSTON STRUCTURES, MODEL M2MEDIAN AND 84th PERC. STORY DUCTILITY DEMANDS
1
2
3
4
Floo
r L
evel
10/50 Median 2/50 Median
10/50 84th Percentile 2/50 84th Percentile
3-STORY
1
2
3
4
5
6
7
8
9
10
Floo
r L
evel
9-STORY
1
5
9
13
17
21
0 1 2 3Story Ductility Demand
Floo
r L
evel
20-STORY
PRE-NORTHRIDGE LA STRUCTURES, MODEL M2MEDIAN AND 84th PERC. STORY DUCTILITY DEMANDS
1
2
3
4Fl
oor
Lev
el
50/50 Median 10/50 Median 2/50 Median
50/50 84th Percentile 10/50 84th Percentile 2/50 84th Percentile
3-STORY
1
2
3
4
5
6
7
8
9
10
Floo
r L
evel
9-STORY
1
5
9
13
17
21
0 1 2 3 4 5 6 7 8 9 10Story Ductility Demand
Floo
r L
evel
20-STORY
Systems Perform
ance of FEM
A-355C
Steel Mom
ent Frames Subject
Chapter 5: Inelastic Seism
ic Dem
ands for Ductile
to Earthquake Ground Shaking
WSM
F Systems w
ith Fully Restrained C
onnections
FEMA-355C Systems Performance of Chapter 5: Inelastic Seismic Demands for Ductile Steel Moment Frames Subject WSMF Systems with Fully Restrained Connections to Earthquake Ground Shaking
5-34
• For the LA and Seattle 3-story structures, the distribution of story drift over the height of the structure is rather uniform. These structures vibrate primarily in the first mode. For the 9-story structures, the distribution over height is also rather uniform although higher mode effects are becoming evident in the Seattle structure. For the LA 20-story structure, the drift distribution over height is also rather uniform for small and moderate ground motions, but a clear drift bulge in the lower stories is evident once the ground motions are sufficiently severe to cause significant P-delta effects. For the Seattle 20-story structure, the drift demands exhibit a clear bulge in the upper stories, where the member sizes are controlled by seismic considerations. The drift demands in the lower stories are relatively small because the member sizes are controlled by wind design considerations.
• In general, the drift demands decrease with the height of the structure, with the 20-story structures showing (relatively) the lowest demands. This does not hold true if the structure is subjected to very severe ground shaking and is affected by high P-delta effects, as is the case for the LA 20-story structure.
• Under the ground motions representing a 2/50 event, the drift angle and ductility demands for the Boston 3-story structure are in the order of 0.01 to 0.02 and 1.5 to 2.5, respectively. These demands may necessitate detailing for ductility.
The Boston 9- and 20-story structures are subjected to ground motions whose spectral displacement at the first mode period is much smaller than that represented by the NEHRP spectrum. As a consequence, the first mode participation for these structures is small. Yielding in the upper stories is observed in many of the 2/50 ground motions due to higher mode effects. This yielding occurs even though the structures have large overstrength, because wind considerations control the design.
5.3.3.2 Distribution of Story Drifts Over Height
The distribution of story drifts over the height of a structure is strongly dependent on the structural and ground motion characteristics. Any attempt to characterize the distribution as a function of structural characteristics alone, or as a function of the ground motion characteristics alone, is misleading. The results of the time history analysis of the SAC structures, and of other studies (e.g., Seneviratna and Krawinkler (1997)), provide evidence to support this statement.
Illustrations of the sensitivity of the distribution of story drift over the height of the structure are provided in Figure 5-21. This figure shows median values of the ratio of maximum story drift to maximum roof drift for the nine pre-Northridge structures and the 10/50 and 2/50 sets of records. The following observations can be made from these figures:
• The distribution over height and the values of the ratio depend strongly on the height (number of stories) of the structure and the geographic region.
• With few exceptions, the distribution over height and the values of the ratio are similar for the 10/50 and 2/50 sets of ground motions in a particular region and for a particular structure, indicating little sensitivity to the severity of the records. The notable exception is the LA 20-story structure, for which the data for the 2/50 set of ground motions show a migration of
Systems Performance of FEMA-355C Steel Moment Frames Subject Chapter 5: Inelastic Seismic Demands for Ductile to Earthquake Ground Shaking WSMF Systems with Fully Restrained Connections
5-35
large drift demands to the bottom of the structure. Two reasons can be quoted for this migration, one being the P-delta effect, which is larger for the more severe ground motions, and the other being the pulse-like nature of many of the 2/50 records.
• For the 3-story structures, the values of the ratio are relatively small; they are close to 1.0 except for the Boston structure, which is more affected by higher mode effects.
• The Boston 9- and 20-story structures exhibit very large ratios of story drift to roof drift near the top of the structure, demonstrating the great importance of higher mode effects generated by the Boston ground motions.
• For all nine structures, the ratio is larger than 1.0 for most or all stories, and in many cases much larger than 1.0. This implies that the story drift angle is larger than the roof drift angle in almost all stories. This has an implication for the pushover analysis, as is discussed in Section 5.12.2.
The great differences in the distributions of the medians of the ratio of story drift to roof drift for the nine structures lead to the important albeit discouraging conclusion that there is no common distribution that can be generalized, neither for a given number of stories nor for a given location. The distribution depends on configuration, design decisions, and on the ground motion characteristics. The sensitivity to ground motion characteristics can be evaluated only through time history analysis. The sensitivity to the design decisions can possibly be evaluated from a static pushover analysis.
5.3.3.3 Ratio of Maximum Story Drift to Roof Drift
There is much evidence that the roof drift in most cases can be predicted with good confidence from spectral displacements (see Section 5.12.1). Presuming that the maximum story drift occurring anywhere in the structure is a relevant measure of performance, this parameter could be predicted if a stable relationship can be found between the ratio of maximum story drift to roof drift. Attempts to predict this value have been made in the past (e.g., Seneviratna and Krawinkler, 1997), and consistent patterns are observed also in the response analysis of the SAC structures.
Figure 5-22 presents median values of the ratio of maximum story drift occurring anywhere in the structure to maximum roof drift for the nine pre-Northridge structures and all sets of ground motions. Measures of dispersion are written on top of the bars. For these structures, the maximum story drift mostly occurs in the upper stories in cases in which the response is greatly affected by higher mode effects, and in the lower stories in cases in which the response is controlled by P-delta effects. There are exceptions, such as in the response of long period structures to pulse-type near-fault ground motions, where the story drift is largest in the upper stories for small ductility demands but migrates to the lower stories if the ductility demands become high (Krawinkler and Alavi, 1998). In the SAC studies, this observation could not be verified because in very few cases did the ductility demand become very high.
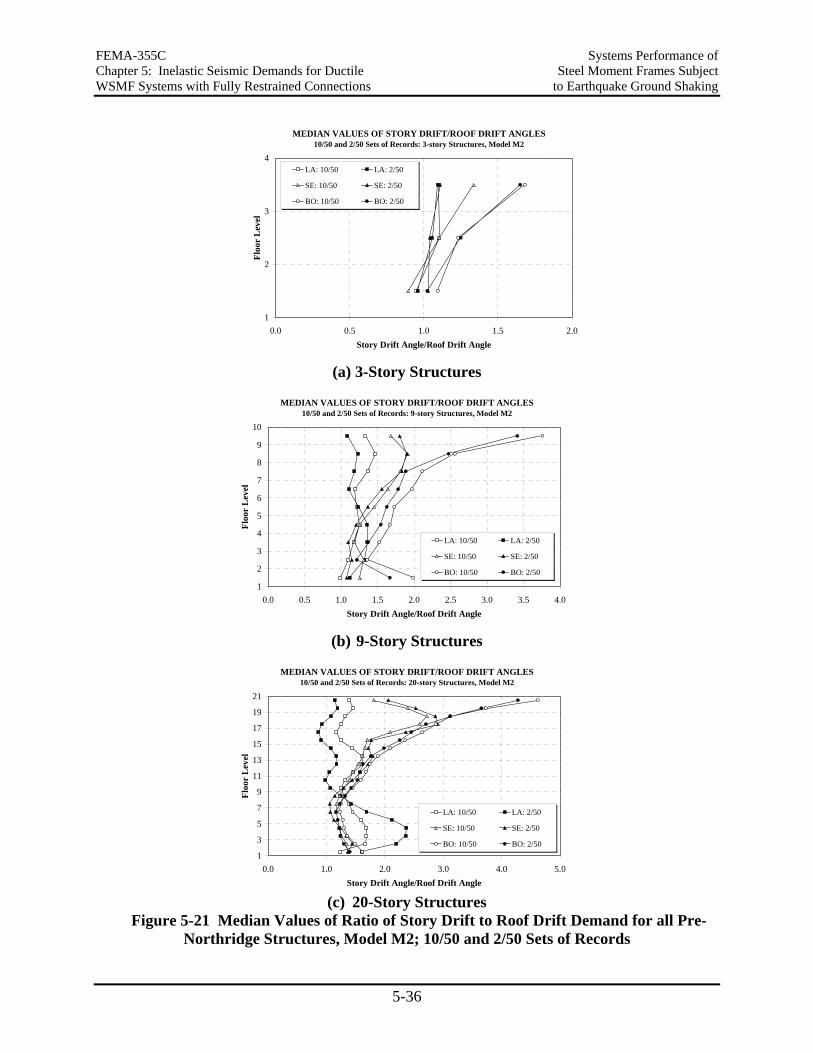
FEMA-355C Systems Performance of Chapter 5: Inelastic Seismic Demands for Ductile Steel Moment Frames Subject WSMF Systems with Fully Restrained Connections to Earthquake Ground Shaking
5-36
MEDIAN VALUES OF STORY DRIFT/ROOF DRIFT ANGLES 10/50 and 2/50 Sets of Records: 3-story Structures, Model M2
1
2
3
4
0.0 0.5 1.0 1.5 2.0Story Drift Angle/Roof Drift Angle
Floo
r L
evel
LA: 10/50 LA: 2/50
SE: 10/50 SE: 2/50
BO: 10/50 BO: 2/50
(a) 3-Story Structures
MEDIAN VALUES OF STORY DRIFT/ROOF DRIFT ANGLES 10/50 and 2/50 Sets of Records: 9-story Structures, Model M2
1
2
3
4
5
6
7
8
9
10
0.0 0.5 1.0 1.5 2.0 2.5 3.0 3.5 4.0Story Drift Angle/Roof Drift Angle
Floo
r L
evel
LA: 10/50 LA: 2/50
SE: 10/50 SE: 2/50
BO: 10/50 BO: 2/50
(b) 9-Story Structures
MEDIAN VALUES OF STORY DRIFT/ROOF DRIFT ANGLES 10/50 and 2/50 Sets of Records: 20-story Structures, Model M2
1
3
5
7
9
11
13
15
17
19
21
0.0 1.0 2.0 3.0 4.0 5.0Story Drift Angle/Roof Drift Angle
Floo
r L
evel
LA: 10/50 LA: 2/50
SE: 10/50 SE: 2/50
BO: 10/50 BO: 2/50
(c) 20-Story Structures
Figure 5-21 Median Values of Ratio of Story Drift to Roof Drift Demand for all Pre-Northridge Structures, Model M2; 10/50 and 2/50 Sets of Records
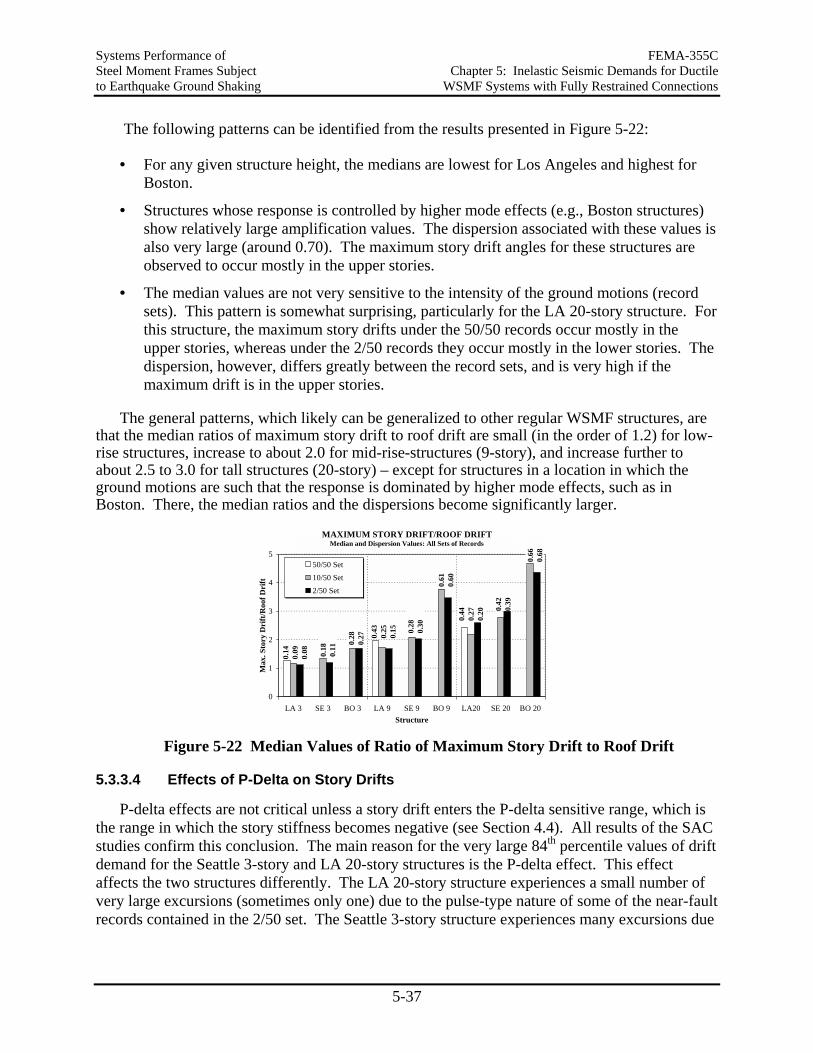
Systems Performance of FEMA-355C Steel Moment Frames Subject Chapter 5: Inelastic Seismic Demands for Ductile to Earthquake Ground Shaking WSMF Systems with Fully Restrained Connections
5-37
The following patterns can be identified from the results presented in Figure 5-22:
• For any given structure height, the medians are lowest for Los Angeles and highest for Boston.
• Structures whose response is controlled by higher mode effects (e.g., Boston structures) show relatively large amplification values. The dispersion associated with these values is also very large (around 0.70). The maximum story drift angles for these structures are observed to occur mostly in the upper stories.
• The median values are not very sensitive to the intensity of the ground motions (record sets). This pattern is somewhat surprising, particularly for the LA 20-story structure. For this structure, the maximum story drifts under the 50/50 records occur mostly in the upper stories, whereas under the 2/50 records they occur mostly in the lower stories. The dispersion, however, differs greatly between the record sets, and is very high if the maximum drift is in the upper stories.
The general patterns, which likely can be generalized to other regular WSMF structures, are that the median ratios of maximum story drift to roof drift are small (in the order of 1.2) for low-rise structures, increase to about 2.0 for mid-rise-structures (9-story), and increase further to about 2.5 to 3.0 for tall structures (20-story) – except for structures in a location in which the ground motions are such that the response is dominated by higher mode effects, such as in Boston. There, the median ratios and the dispersions become significantly larger.
MAXIMUM STORY DRIFT/ROOF DRIFTMedian Values: All Sets of Records: Pre-Northridge, Model M2
0
1
2
3
4
5
LA 3 SE 3 BO 3 LA 9 SE 9 BO 9 LA20 SE 20 BO 20Structure
Max
. Sto
ry D
rift
/Roo
f Dri
ft
50/50 Set10/50 Set2/50 Set
0.14
0.09
0.08
0.43
0.25
0.15
0.44
0.27
0.20
0.18
0.11
0.28
0.27
0.28
0.30
0.61
0.60
0.42
0.39
0.66
0.68
Median and Dispersion Values: All Sets of Records
Figure 5-22 Median Values of Ratio of Maximum Story Drift to Roof Drift
5.3.3.4 Effects of P-Delta on Story Drifts
P-delta effects are not critical unless a story drift enters the P-delta sensitive range, which is the range in which the story stiffness becomes negative (see Section 4.4). All results of the SAC studies confirm this conclusion. The main reason for the very large 84th percentile values of drift demand for the Seattle 3-story and LA 20-story structures is the P-delta effect. This effect affects the two structures differently. The LA 20-story structure experiences a small number of very large excursions (sometimes only one) due to the pulse-type nature of some of the near-fault records contained in the 2/50 set. The Seattle 3-story structure experiences many excursions due
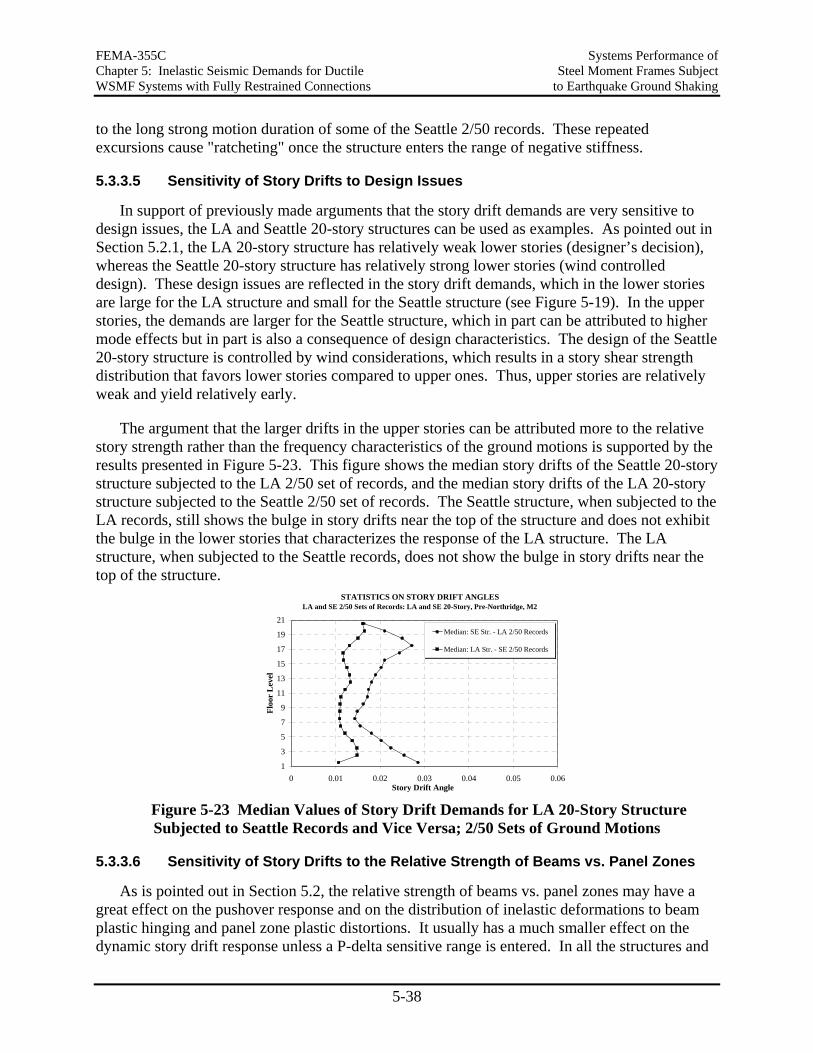
FEMA-355C Systems Performance of Chapter 5: Inelastic Seismic Demands for Ductile Steel Moment Frames Subject WSMF Systems with Fully Restrained Connections to Earthquake Ground Shaking
5-38
to the long strong motion duration of some of the Seattle 2/50 records. These repeated excursions cause "ratcheting" once the structure enters the range of negative stiffness.
5.3.3.5 Sensitivity of Story Drifts to Design Issues
In support of previously made arguments that the story drift demands are very sensitive to design issues, the LA and Seattle 20-story structures can be used as examples. As pointed out in Section 5.2.1, the LA 20-story structure has relatively weak lower stories (designer’s decision), whereas the Seattle 20-story structure has relatively strong lower stories (wind controlled design). These design issues are reflected in the story drift demands, which in the lower stories are large for the LA structure and small for the Seattle structure (see Figure 5-19). In the upper stories, the demands are larger for the Seattle structure, which in part can be attributed to higher mode effects but in part is also a consequence of design characteristics. The design of the Seattle 20-story structure is controlled by wind considerations, which results in a story shear strength distribution that favors lower stories compared to upper ones. Thus, upper stories are relatively weak and yield relatively early.
The argument that the larger drifts in the upper stories can be attributed more to the relative story strength rather than the frequency characteristics of the ground motions is supported by the results presented in Figure 5-23. This figure shows the median story drifts of the Seattle 20-story structure subjected to the LA 2/50 set of records, and the median story drifts of the LA 20-story structure subjected to the Seattle 2/50 set of records. The Seattle structure, when subjected to the LA records, still shows the bulge in story drifts near the top of the structure and does not exhibit the bulge in the lower stories that characterizes the response of the LA structure. The LA structure, when subjected to the Seattle records, does not show the bulge in story drifts near the top of the structure.
STATISTICS ON STORY DRIFT ANGLES LA and SE 2/50 Sets of Records: LA and SE 20-Story, Pre-Northridge, M2
1
3
5
7
9
11
13
15
17
19
21
0 0.01 0.02 0.03 0.04 0.05 0.06Story Drift Angle
Floo
r L
evel
Median: SE Str. - LA 2/50 Records
Median: LA Str. - SE 2/50 Records
Figure 5-23 Median Values of Story Drift Demands for LA 20-Story Structure Subjected to Seattle Records and Vice Versa; 2/50 Sets of Ground Motions
5.3.3.6 Sensitivity of Story Drifts to the Relative Strength of Beams vs. Panel Zones
As is pointed out in Section 5.2, the relative strength of beams vs. panel zones may have a great effect on the pushover response and on the distribution of inelastic deformations to beam plastic hinging and panel zone plastic distortions. It usually has a much smaller effect on the dynamic story drift response unless a P-delta sensitive range is entered. In all the structures and
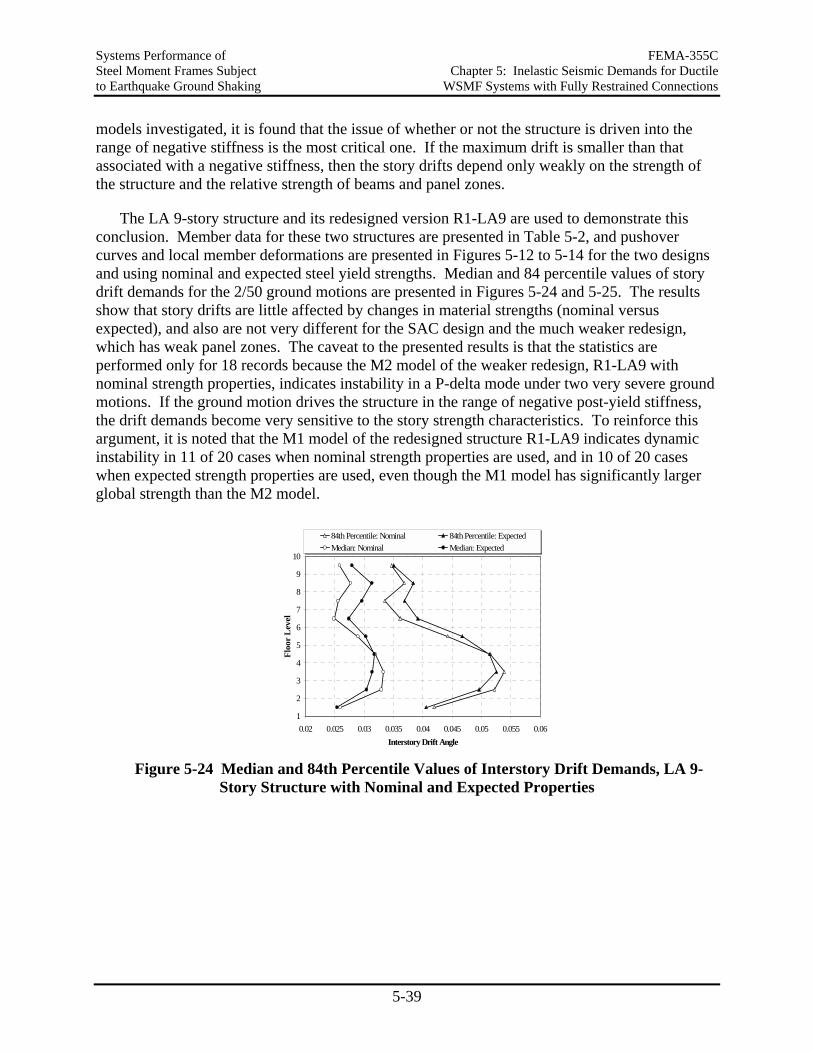
Systems Performance of FEMA-355C Steel Moment Frames Subject Chapter 5: Inelastic Seismic Demands for Ductile to Earthquake Ground Shaking WSMF Systems with Fully Restrained Connections
5-39
models investigated, it is found that the issue of whether or not the structure is driven into the range of negative stiffness is the most critical one. If the maximum drift is smaller than that associated with a negative stiffness, then the story drifts depend only weakly on the strength of the structure and the relative strength of beams and panel zones.
The LA 9-story structure and its redesigned version R1-LA9 are used to demonstrate this conclusion. Member data for these two structures are presented in Table 5-2, and pushover curves and local member deformations are presented in Figures 5-12 to 5-14 for the two designs and using nominal and expected steel yield strengths. Median and 84 percentile values of story drift demands for the 2/50 ground motions are presented in Figures 5-24 and 5-25. The results show that story drifts are little affected by changes in material strengths (nominal versus expected), and also are not very different for the SAC design and the much weaker redesign, which has weak panel zones. The caveat to the presented results is that the statistics are performed only for 18 records because the M2 model of the weaker redesign, R1-LA9 with nominal strength properties, indicates instability in a P-delta mode under two very severe ground motions. If the ground motion drives the structure in the range of negative post-yield stiffness, the drift demands become very sensitive to the story strength characteristics. To reinforce this argument, it is noted that the M1 model of the redesigned structure R1-LA9 indicates dynamic instability in 11 of 20 cases when nominal strength properties are used, and in 10 of 20 cases when expected strength properties are used, even though the M1 model has significantly larger global strength than the M2 model.
1
2
3
4
5
6
7
8
9
10
0.02 0.025 0.03 0.035 0.04 0.045 0.05 0.055 0.06Interstory Drift Angle
Floo
r L
evel
84th Percentile: Nominal 84th Percentile: ExpectedMedian: Nominal Median: Expected
Figure 5-24 Median and 84th Percentile Values of Interstory Drift Demands, LA 9-
Story Structure with Nominal and Expected Properties
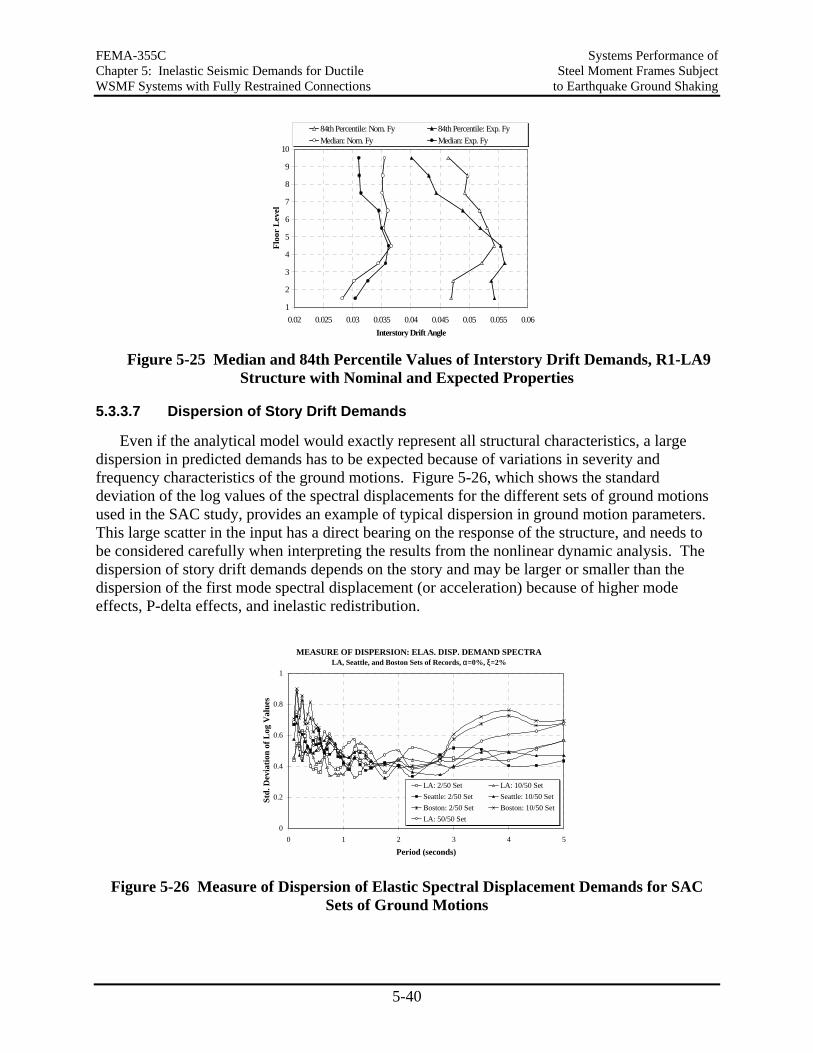
FEMA-355C Systems Performance of Chapter 5: Inelastic Seismic Demands for Ductile Steel Moment Frames Subject WSMF Systems with Fully Restrained Connections to Earthquake Ground Shaking
5-40
1
2
3
4
5
6
7
8
9
10
0.02 0.025 0.03 0.035 0.04 0.045 0.05 0.055 0.06Interstory Drift Angle
Floo
r L
evel
84th Percentile: Nom. Fy 84th Percentile: Exp. FyMedian: Nom. Fy Median: Exp. Fy
Figure 5-25 Median and 84th Percentile Values of Interstory Drift Demands, R1-LA9
Structure with Nominal and Expected Properties
5.3.3.7 Dispersion of Story Drift Demands
Even if the analytical model would exactly represent all structural characteristics, a large dispersion in predicted demands has to be expected because of variations in severity and frequency characteristics of the ground motions. Figure 5-26, which shows the standard deviation of the log values of the spectral displacements for the different sets of ground motions used in the SAC study, provides an example of typical dispersion in ground motion parameters. This large scatter in the input has a direct bearing on the response of the structure, and needs to be considered carefully when interpreting the results from the nonlinear dynamic analysis. The dispersion of story drift demands depends on the story and may be larger or smaller than the dispersion of the first mode spectral displacement (or acceleration) because of higher mode effects, P-delta effects, and inelastic redistribution.
MEASURE OF DISPERSION: ELAS. DISP. DEMAND SPECTRALA, Seattle, and Boston Sets of Records, α=0%, ξ=2%
0
0.2
0.4
0.6
0.8
1
0 1 2 3 4 5
Period (seconds)
Std.
Dev
iatio
n of
Log
Val
ues
LA: 2/50 Set LA: 10/50 SetSeattle: 2/50 Set Seattle: 10/50 SetBoston: 2/50 Set Boston: 10/50 SetLA: 50/50 Set
Figure 5-26 Measure of Dispersion of Elastic Spectral Displacement Demands for SAC Sets of Ground Motions
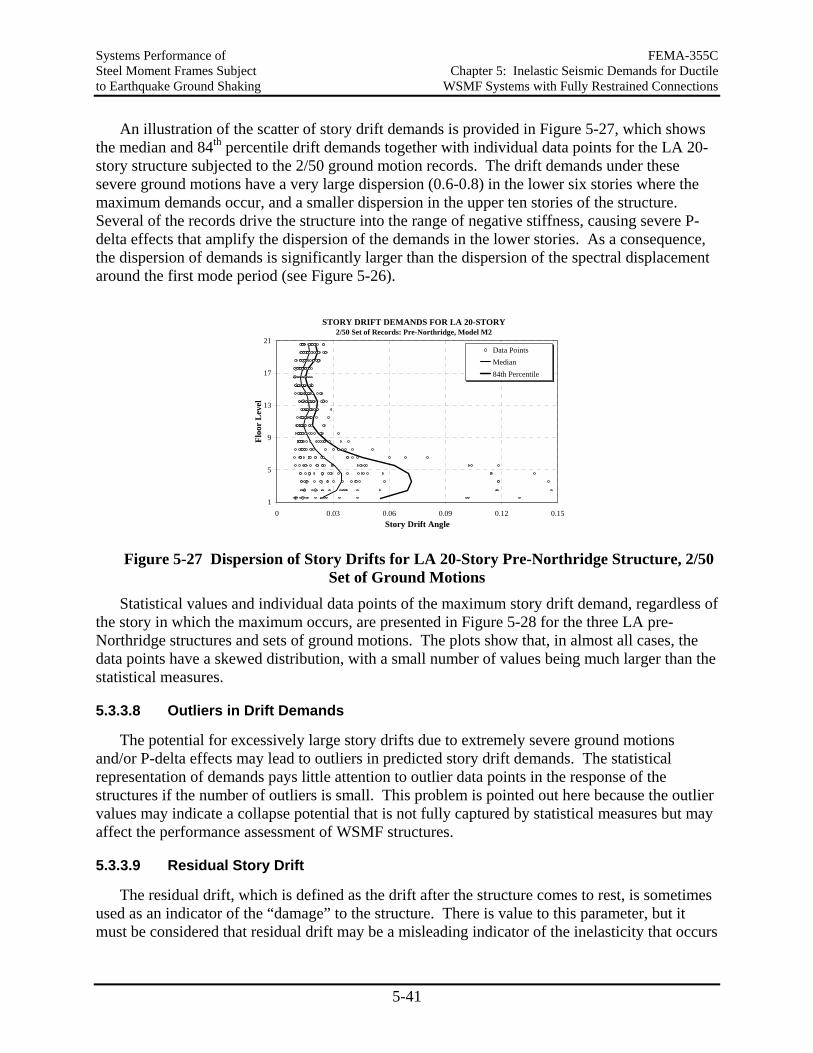
Systems Performance of FEMA-355C Steel Moment Frames Subject Chapter 5: Inelastic Seismic Demands for Ductile to Earthquake Ground Shaking WSMF Systems with Fully Restrained Connections
5-41
An illustration of the scatter of story drift demands is provided in Figure 5-27, which shows the median and 84th percentile drift demands together with individual data points for the LA 20-story structure subjected to the 2/50 ground motion records. The drift demands under these severe ground motions have a very large dispersion (0.6-0.8) in the lower six stories where the maximum demands occur, and a smaller dispersion in the upper ten stories of the structure. Several of the records drive the structure into the range of negative stiffness, causing severe P-delta effects that amplify the dispersion of the demands in the lower stories. As a consequence, the dispersion of demands is significantly larger than the dispersion of the spectral displacement around the first mode period (see Figure 5-26).
STORY DRIFT DEMANDS FOR LA 20-STORY2/50 Set of Records: Pre-Northridge, Model M2
1
5
9
13
17
21
0 0.03 0.06 0.09 0.12 0.15Story Drift Angle
Floo
r L
evel
Data PointsMedian84th Percentile
Figure 5-27 Dispersion of Story Drifts for LA 20-Story Pre-Northridge Structure, 2/50 Set of Ground Motions
Statistical values and individual data points of the maximum story drift demand, regardless of the story in which the maximum occurs, are presented in Figure 5-28 for the three LA pre-Northridge structures and sets of ground motions. The plots show that, in almost all cases, the data points have a skewed distribution, with a small number of values being much larger than the statistical measures.
5.3.3.8 Outliers in Drift Demands
The potential for excessively large story drifts due to extremely severe ground motions and/or P-delta effects may lead to outliers in predicted story drift demands. The statistical representation of demands pays little attention to outlier data points in the response of the structures if the number of outliers is small. This problem is pointed out here because the outlier values may indicate a collapse potential that is not fully captured by statistical measures but may affect the performance assessment of WSMF structures.
5.3.3.9 Residual Story Drift
The residual drift, which is defined as the drift after the structure comes to rest, is sometimes used as an indicator of the “damage” to the structure. There is value to this parameter, but it must be considered that residual drift may be a misleading indicator of the inelasticity that occurs
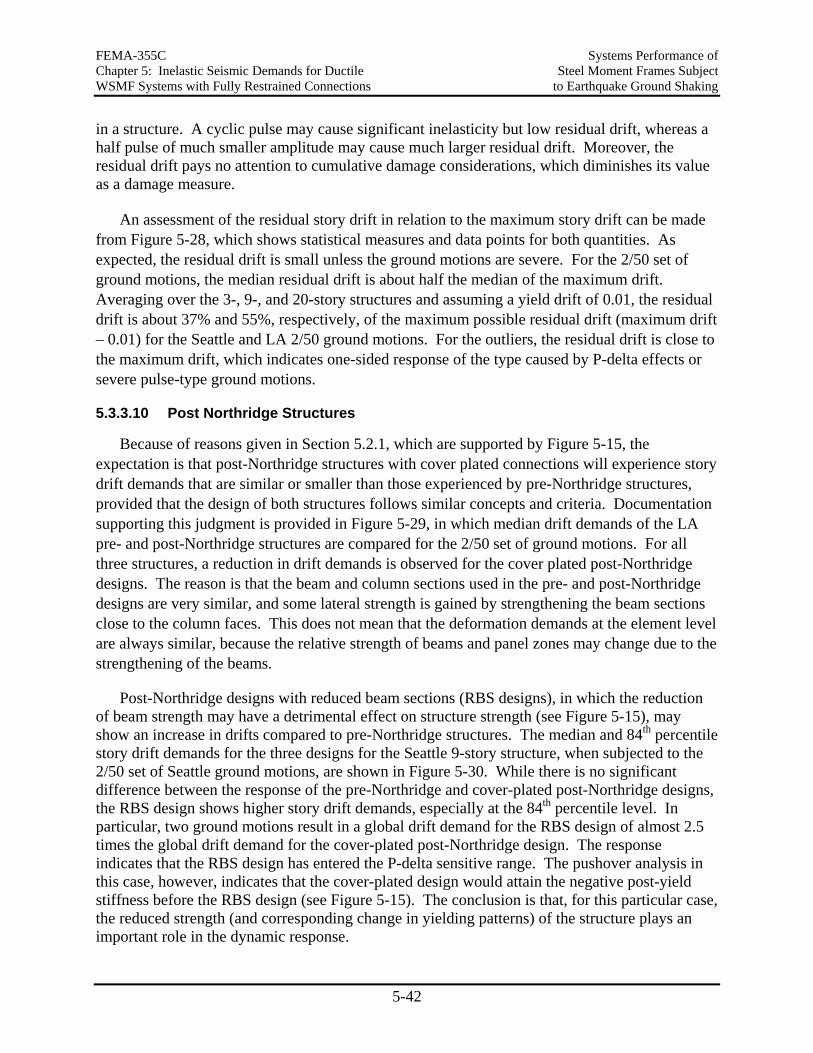
FEMA-355C Systems Performance of Chapter 5: Inelastic Seismic Demands for Ductile Steel Moment Frames Subject WSMF Systems with Fully Restrained Connections to Earthquake Ground Shaking
5-42
in a structure. A cyclic pulse may cause significant inelasticity but low residual drift, whereas a half pulse of much smaller amplitude may cause much larger residual drift. Moreover, the residual drift pays no attention to cumulative damage considerations, which diminishes its value as a damage measure.
An assessment of the residual story drift in relation to the maximum story drift can be made from Figure 5-28, which shows statistical measures and data points for both quantities. As expected, the residual drift is small unless the ground motions are severe. For the 2/50 set of ground motions, the median residual drift is about half the median of the maximum drift. Averaging over the 3-, 9-, and 20-story structures and assuming a yield drift of 0.01, the residual drift is about 37% and 55%, respectively, of the maximum possible residual drift (maximum drift – 0.01) for the Seattle and LA 2/50 ground motions. For the outliers, the residual drift is close to the maximum drift, which indicates one-sided response of the type caused by P-delta effects or severe pulse-type ground motions.
5.3.3.10 Post Northridge Structures
Because of reasons given in Section 5.2.1, which are supported by Figure 5-15, the expectation is that post-Northridge structures with cover plated connections will experience story drift demands that are similar or smaller than those experienced by pre-Northridge structures, provided that the design of both structures follows similar concepts and criteria. Documentation supporting this judgment is provided in Figure 5-29, in which median drift demands of the LA pre- and post-Northridge structures are compared for the 2/50 set of ground motions. For all three structures, a reduction in drift demands is observed for the cover plated post-Northridge designs. The reason is that the beam and column sections used in the pre- and post-Northridge designs are very similar, and some lateral strength is gained by strengthening the beam sections close to the column faces. This does not mean that the deformation demands at the element level are always similar, because the relative strength of beams and panel zones may change due to the strengthening of the beams.
Post-Northridge designs with reduced beam sections (RBS designs), in which the reduction of beam strength may have a detrimental effect on structure strength (see Figure 5-15), may show an increase in drifts compared to pre-Northridge structures. The median and 84th percentile story drift demands for the three designs for the Seattle 9-story structure, when subjected to the 2/50 set of Seattle ground motions, are shown in Figure 5-30. While there is no significant difference between the response of the pre-Northridge and cover-plated post-Northridge designs, the RBS design shows higher story drift demands, especially at the 84th percentile level. In particular, two ground motions result in a global drift demand for the RBS design of almost 2.5 times the global drift demand for the cover-plated post-Northridge design. The response indicates that the RBS design has entered the P-delta sensitive range. The pushover analysis in this case, however, indicates that the cover-plated design would attain the negative post-yield stiffness before the RBS design (see Figure 5-15). The conclusion is that, for this particular case, the reduced strength (and corresponding change in yielding patterns) of the structure plays an important role in the dynamic response.
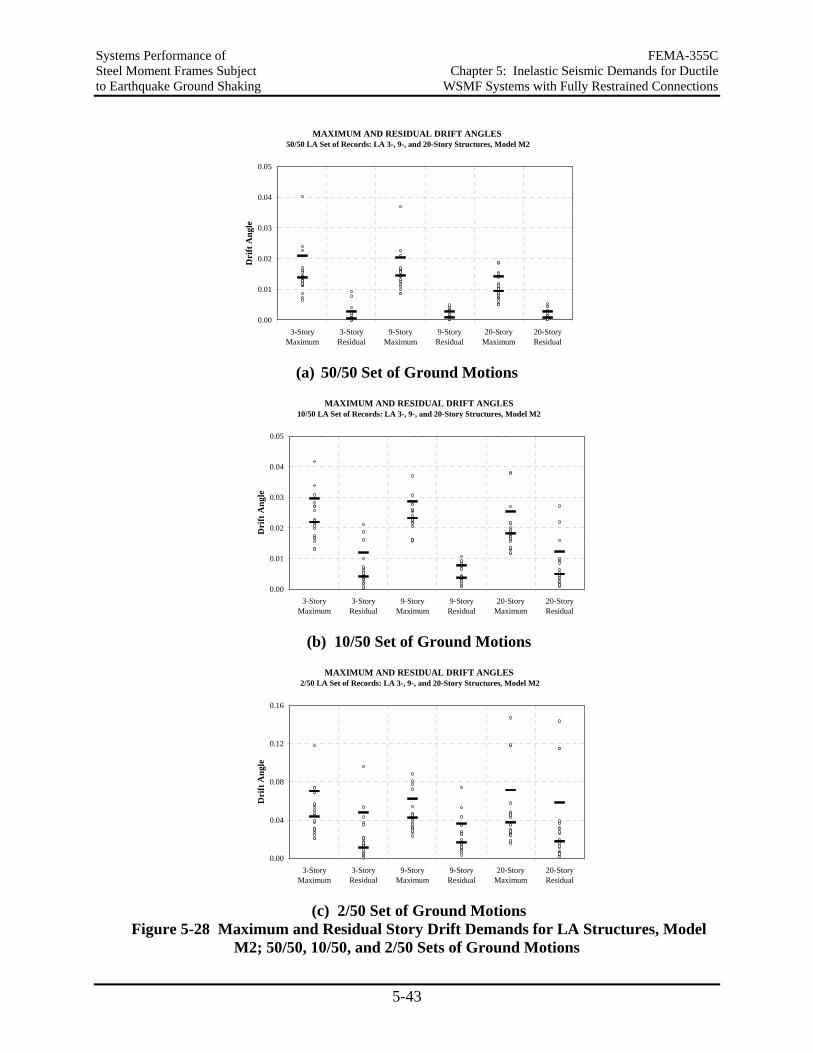
Systems Performance of FEMA-355C Steel Moment Frames Subject Chapter 5: Inelastic Seismic Demands for Ductile to Earthquake Ground Shaking WSMF Systems with Fully Restrained Connections
5-43
MAXIMUM AND RESIDUAL DRIFT ANGLES 50/50 LA Set of Records: LA 3-, 9-, and 20-Story Structures, Model M2
0.00
0.01
0.02
0.03
0.04
0.05
3-StoryMaximum
3-StoryResidual
9-StoryMaximum
9-StoryResidual
20-StoryMaximum
20-StoryResidual
Dri
ft A
ngle
(a) 50/50 Set of Ground Motions
MAXIMUM AND RESIDUAL DRIFT ANGLES10/50 LA Set of Records: LA 3-, 9-, and 20-Story Structures, Model M2
0.00
0.01
0.02
0.03
0.04
0.05
3-StoryMaximum
3-StoryResidual
9-StoryMaximum
9-StoryResidual
20-StoryMaximum
20-StoryResidual
Dri
ft A
ngle
(b) 10/50 Set of Ground Motions
MAXIMUM AND RESIDUAL DRIFT ANGLES 2/50 LA Set of Records: LA 3-, 9-, and 20-Story Structures, Model M2
0.00
0.04
0.08
0.12
0.16
3-StoryMaximum
3-StoryResidual
9-StoryMaximum
9-StoryResidual
20-StoryMaximum
20-StoryResidual
Dri
ft A
ngle
(c) 2/50 Set of Ground Motions
Figure 5-28 Maximum and Residual Story Drift Demands for LA Structures, Model M2; 50/50, 10/50, and 2/50 Sets of Ground Motions
FEMA-355C Systems Performance of Chapter 5: Inelastic Seismic Demands for Ductile Steel Moment Frames Subject WSMF Systems with Fully Restrained Connections to Earthquake Ground Shaking
5-44
MEDIAN VALUES FOR STORY DRIFT ANGLES 2/50, 10/50, and 50/50 Sets of LA Records: LA 3-Story
1
2
3
4
0 0.01 0.02 0.03 0.04 0.05 0.06Story Drift Angle
Floo
r L
evel
Pre-N M1: 2/50 Set Pre-N M1: 10/50 Set Pre-N M1: 50/50 SetPre-N M2: 2/50 Set Pre-N M2: 10/50 Set Pre-N M2: 50/50 SetPost-N M2: 2/50 Set
(a) 3-Story Structure
MEDIAN VALUES FOR STORY DRIFT ANGLES 2/50, 10/50, and 50/50 Sets of LA Records: LA 9-Story
1
2
3
4
5
6
7
8
9
10
0 0.01 0.02 0.03 0.04 0.05 0.06Story Drift Angle
Floo
r L
evel
Pre-N M1: 2/50 Set
Pre-N M2: 2/50 Set
Post-N M2: 2/50 Set
Pre-N M1: 10/50 Set
Pre-N M2: 10/50 Set
Pre-N M1: 50/50 Set
Pre-N M2: 50/50 Set
(b) 9-Story Structure
MEDIAN VALUES FOR STORY DRIFT ANGLES 2/50, 10/50, and 50/50 Sets of LA Records: LA 20-Story
1
3
5
7
9
11
13
15
17
19
21
0 0.01 0.02 0.03 0.04 0.05 0.06Story Drift Angle
Floo
r L
evel
Pre-N M1: 2/50 Set
Pre-N M2: 2/50 Set
Post-N M2: 2/50 Set
Pre-N M1: 10/50 Set
Pre-N M2: 10/50 Set
Pre-N M1: 50/50 Set
Pre-N M2: 50/50 Set
Based on 19 Records(excludes LA30; collapse)
(c) 20-Story Structure
Figure 5-29 Median Values of Story Drift Demands for LA Pre- and Post-Northridge Structures, Models M1 and M2; 50/50, 10/50, and 2/50 Sets of Ground Motions
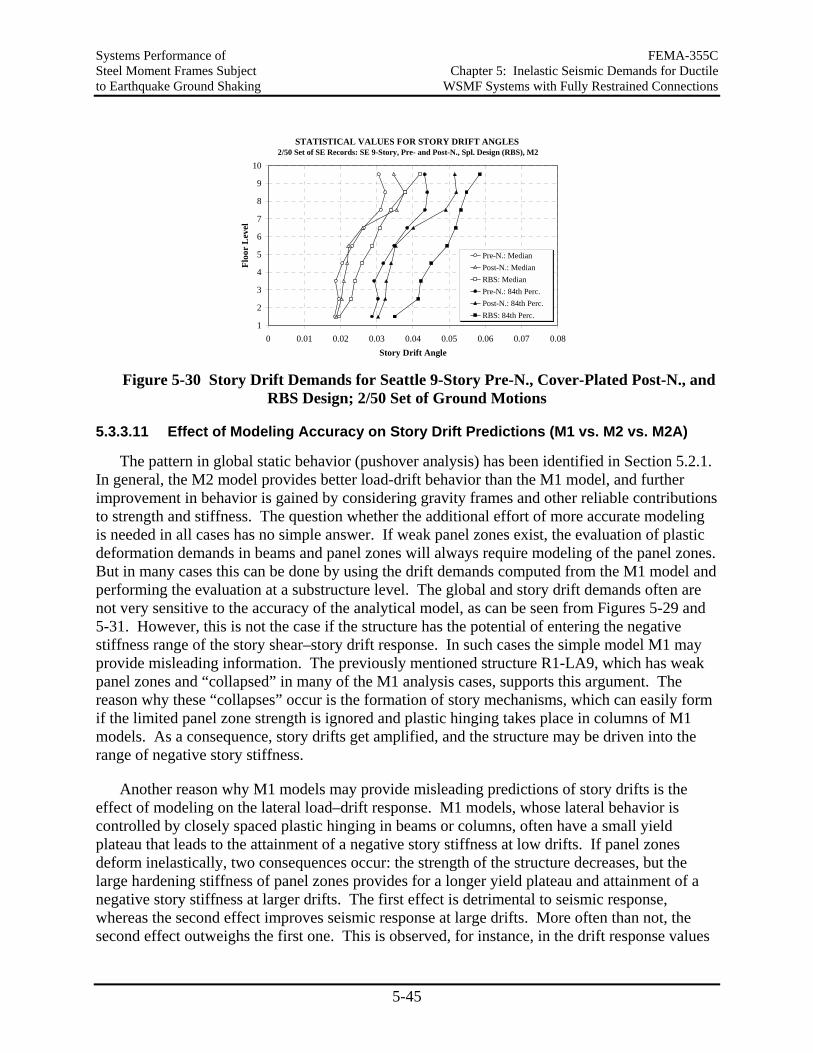
Systems Performance of FEMA-355C Steel Moment Frames Subject Chapter 5: Inelastic Seismic Demands for Ductile to Earthquake Ground Shaking WSMF Systems with Fully Restrained Connections
5-45
STATISTICAL VALUES FOR STORY DRIFT ANGLES 2/50 Set of SE Records: SE 9-Story, Pre- and Post-N., Spl. Design (RBS), M2
1
2
3
4
5
6
7
8
9
10
0 0.01 0.02 0.03 0.04 0.05 0.06 0.07 0.08Story Drift Angle
Floo
r L
evel
Pre-N.: MedianPost-N.: MedianRBS: MedianPre-N.: 84th Perc.Post-N.: 84th Perc.RBS: 84th Perc.
Figure 5-30 Story Drift Demands for Seattle 9-Story Pre-N., Cover-Plated Post-N., and
RBS Design; 2/50 Set of Ground Motions
5.3.3.11 Effect of Modeling Accuracy on Story Drift Predictions (M1 vs. M2 vs. M2A)
The pattern in global static behavior (pushover analysis) has been identified in Section 5.2.1. In general, the M2 model provides better load-drift behavior than the M1 model, and further improvement in behavior is gained by considering gravity frames and other reliable contributions to strength and stiffness. The question whether the additional effort of more accurate modeling is needed in all cases has no simple answer. If weak panel zones exist, the evaluation of plastic deformation demands in beams and panel zones will always require modeling of the panel zones. But in many cases this can be done by using the drift demands computed from the M1 model and performing the evaluation at a substructure level. The global and story drift demands often are not very sensitive to the accuracy of the analytical model, as can be seen from Figures 5-29 and 5-31. However, this is not the case if the structure has the potential of entering the negative stiffness range of the story shear–story drift response. In such cases the simple model M1 may provide misleading information. The previously mentioned structure R1-LA9, which has weak panel zones and “collapsed” in many of the M1 analysis cases, supports this argument. The reason why these “collapses” occur is the formation of story mechanisms, which can easily form if the limited panel zone strength is ignored and plastic hinging takes place in columns of M1 models. As a consequence, story drifts get amplified, and the structure may be driven into the range of negative story stiffness.
Another reason why M1 models may provide misleading predictions of story drifts is the effect of modeling on the lateral load–drift response. M1 models, whose lateral behavior is controlled by closely spaced plastic hinging in beams or columns, often have a small yield plateau that leads to the attainment of a negative story stiffness at low drifts. If panel zones deform inelastically, two consequences occur: the strength of the structure decreases, but the large hardening stiffness of panel zones provides for a longer yield plateau and attainment of a negative story stiffness at larger drifts. The first effect is detrimental to seismic response, whereas the second effect improves seismic response at large drifts. More often than not, the second effect outweighs the first one. This is observed, for instance, in the drift response values
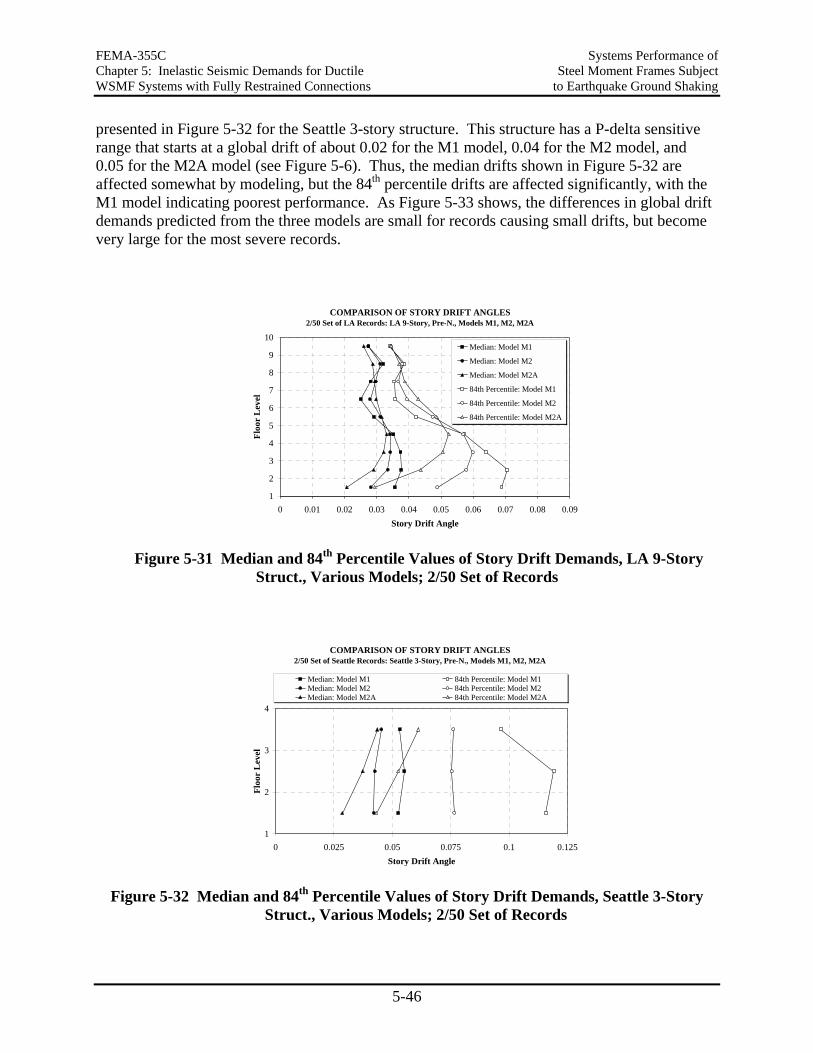
FEMA-355C Systems Performance of Chapter 5: Inelastic Seismic Demands for Ductile Steel Moment Frames Subject WSMF Systems with Fully Restrained Connections to Earthquake Ground Shaking
5-46
presented in Figure 5-32 for the Seattle 3-story structure. This structure has a P-delta sensitive range that starts at a global drift of about 0.02 for the M1 model, 0.04 for the M2 model, and 0.05 for the M2A model (see Figure 5-6). Thus, the median drifts shown in Figure 5-32 are affected somewhat by modeling, but the 84th percentile drifts are affected significantly, with the M1 model indicating poorest performance. As Figure 5-33 shows, the differences in global drift demands predicted from the three models are small for records causing small drifts, but become very large for the most severe records.
COMPARISON OF STORY DRIFT ANGLES 2/50 Set of LA Records: LA 9-Story, Pre-N., Models M1, M2, M2A
1
2
3
4
5
6
7
8
9
10
0 0.01 0.02 0.03 0.04 0.05 0.06 0.07 0.08 0.09Story Drift Angle
Floo
r L
evel
Median: Model M1
Median: Model M2
Median: Model M2A
84th Percentile: Model M1
84th Percentile: Model M2
84th Percentile: Model M2A
Figure 5-31 Median and 84th Percentile Values of Story Drift Demands, LA 9-Story Struct., Various Models; 2/50 Set of Records
COMPARISON OF STORY DRIFT ANGLES 2/50 Set of Seattle Records: Seattle 3-Story, Pre-N., Models M1, M2, M2A
1
2
3
4
0 0.025 0.05 0.075 0.1 0.125Story Drift Angle
Floo
r L
evel
Median: Model M1 84th Percentile: Model M1Median: Model M2 84th Percentile: Model M2Median: Model M2A 84th Percentile: Model M2A
Figure 5-32 Median and 84th Percentile Values of Story Drift Demands, Seattle 3-Story Struct., Various Models; 2/50 Set of Records
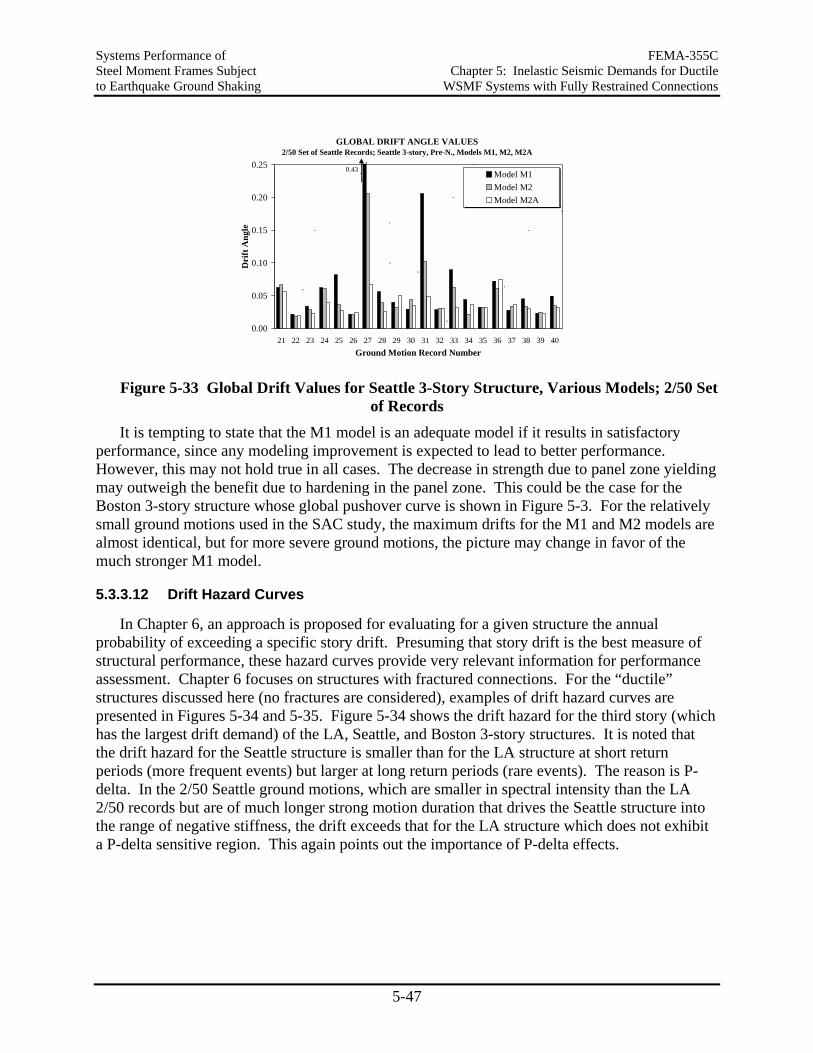
Systems Performance of FEMA-355C Steel Moment Frames Subject Chapter 5: Inelastic Seismic Demands for Ductile to Earthquake Ground Shaking WSMF Systems with Fully Restrained Connections
5-47
GLOBAL DRIFT ANGLE VALUES2/50 Set of Seattle Records; Seattle 3-story, Pre-N., Models M1, M2, M2A
0.00
0.05
0.10
0.15
0.20
0.25
21 22 23 24 25 26 27 28 29 30 31 32 33 34 35 36 37 38 39 40Ground Motion Record Number
Dri
ft A
ngle
Model M1Model M2Model M2A
0.43
Figure 5-33 Global Drift Values for Seattle 3-Story Structure, Various Models; 2/50 Set of Records
It is tempting to state that the M1 model is an adequate model if it results in satisfactory performance, since any modeling improvement is expected to lead to better performance. However, this may not hold true in all cases. The decrease in strength due to panel zone yielding may outweigh the benefit due to hardening in the panel zone. This could be the case for the Boston 3-story structure whose global pushover curve is shown in Figure 5-3. For the relatively small ground motions used in the SAC study, the maximum drifts for the M1 and M2 models are almost identical, but for more severe ground motions, the picture may change in favor of the much stronger M1 model.
5.3.3.12 Drift Hazard Curves
In Chapter 6, an approach is proposed for evaluating for a given structure the annual probability of exceeding a specific story drift. Presuming that story drift is the best measure of structural performance, these hazard curves provide very relevant information for performance assessment. Chapter 6 focuses on structures with fractured connections. For the “ductile” structures discussed here (no fractures are considered), examples of drift hazard curves are presented in Figures 5-34 and 5-35. Figure 5-34 shows the drift hazard for the third story (which has the largest drift demand) of the LA, Seattle, and Boston 3-story structures. It is noted that the drift hazard for the Seattle structure is smaller than for the LA structure at short return periods (more frequent events) but larger at long return periods (rare events). The reason is P-delta. In the 2/50 Seattle ground motions, which are smaller in spectral intensity than the LA 2/50 records but are of much longer strong motion duration that drives the Seattle structure into the range of negative stiffness, the drift exceeds that for the LA structure which does not exhibit a P-delta sensitive region. This again points out the importance of P-delta effects.
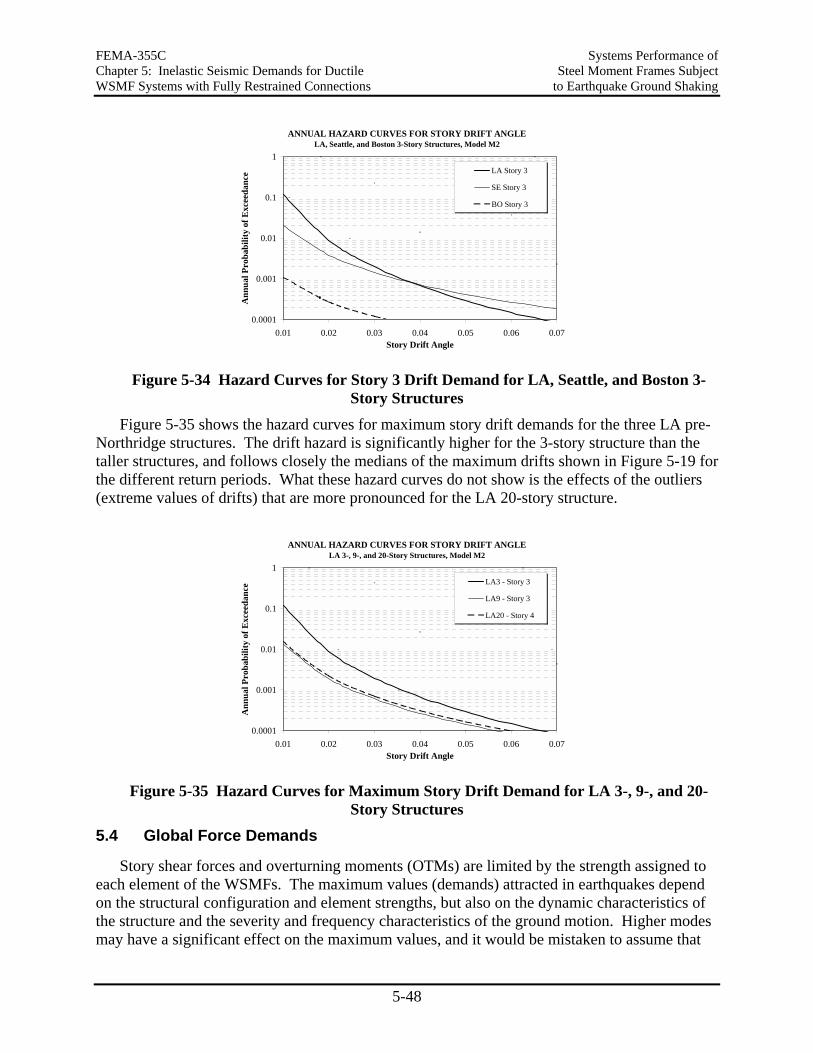
FEMA-355C Systems Performance of Chapter 5: Inelastic Seismic Demands for Ductile Steel Moment Frames Subject WSMF Systems with Fully Restrained Connections to Earthquake Ground Shaking
5-48
ANNUAL HAZARD CURVES FOR STORY DRIFT ANGLELA, Seattle, and Boston 3-Story Structures, Model M2
0.0001
0.001
0.01
0.1
1
0.01 0.02 0.03 0.04 0.05 0.06 0.07Story Drift Angle
Ann
ual P
roba
bilit
y of
Exc
eeda
nce LA Story 3
SE Story 3
BO Story 3
Figure 5-34 Hazard Curves for Story 3 Drift Demand for LA, Seattle, and Boston 3-Story Structures
Figure 5-35 shows the hazard curves for maximum story drift demands for the three LA pre-Northridge structures. The drift hazard is significantly higher for the 3-story structure than the taller structures, and follows closely the medians of the maximum drifts shown in Figure 5-19 for the different return periods. What these hazard curves do not show is the effects of the outliers (extreme values of drifts) that are more pronounced for the LA 20-story structure.
ANNUAL HAZARD CURVES FOR STORY DRIFT ANGLELA 3-, 9-, and 20-Story Structures, Model M2
0.0001
0.001
0.01
0.1
1
0.01 0.02 0.03 0.04 0.05 0.06 0.07Story Drift Angle
Ann
ual P
roba
bilit
y of
Exc
eeda
nce LA3 - Story 3
LA9 - Story 3
LA20 - Story 4
Figure 5-35 Hazard Curves for Maximum Story Drift Demand for LA 3-, 9-, and 20-Story Structures
5.4 Global Force Demands
Story shear forces and overturning moments (OTMs) are limited by the strength assigned to each element of the WSMFs. The maximum values (demands) attracted in earthquakes depend on the structural configuration and element strengths, but also on the dynamic characteristics of the structure and the severity and frequency characteristics of the ground motion. Higher modes may have a significant effect on the maximum values, and it would be mistaken to assume that
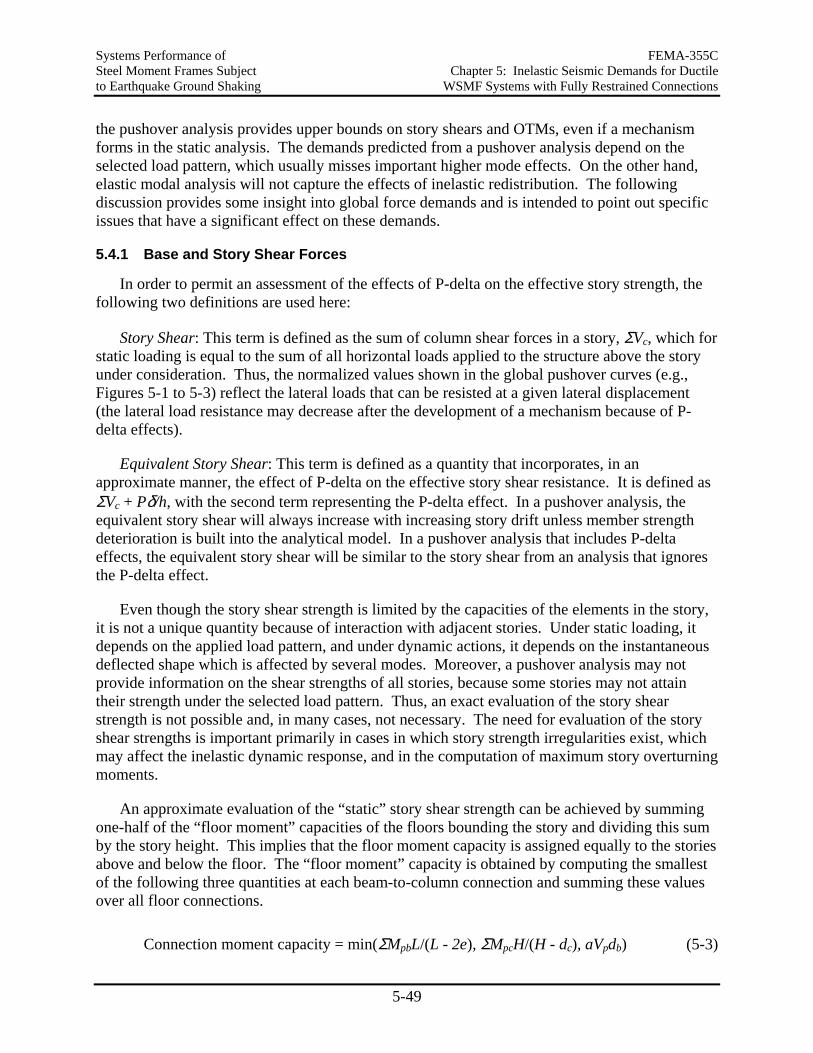
Systems Performance of FEMA-355C Steel Moment Frames Subject Chapter 5: Inelastic Seismic Demands for Ductile to Earthquake Ground Shaking WSMF Systems with Fully Restrained Connections
5-49
the pushover analysis provides upper bounds on story shears and OTMs, even if a mechanism forms in the static analysis. The demands predicted from a pushover analysis depend on the selected load pattern, which usually misses important higher mode effects. On the other hand, elastic modal analysis will not capture the effects of inelastic redistribution. The following discussion provides some insight into global force demands and is intended to point out specific issues that have a significant effect on these demands.
5.4.1 Base and Story Shear Forces
In order to permit an assessment of the effects of P-delta on the effective story strength, the following two definitions are used here:
Story Shear: This term is defined as the sum of column shear forces in a story, ΣVc, which for static loading is equal to the sum of all horizontal loads applied to the structure above the story under consideration. Thus, the normalized values shown in the global pushover curves (e.g., Figures 5-1 to 5-3) reflect the lateral loads that can be resisted at a given lateral displacement (the lateral load resistance may decrease after the development of a mechanism because of P-delta effects).
Equivalent Story Shear: This term is defined as a quantity that incorporates, in an approximate manner, the effect of P-delta on the effective story shear resistance. It is defined as ΣVc + Pδ/h, with the second term representing the P-delta effect. In a pushover analysis, the equivalent story shear will always increase with increasing story drift unless member strength deterioration is built into the analytical model. In a pushover analysis that includes P-delta effects, the equivalent story shear will be similar to the story shear from an analysis that ignores the P-delta effect.
Even though the story shear strength is limited by the capacities of the elements in the story, it is not a unique quantity because of interaction with adjacent stories. Under static loading, it depends on the applied load pattern, and under dynamic actions, it depends on the instantaneous deflected shape which is affected by several modes. Moreover, a pushover analysis may not provide information on the shear strengths of all stories, because some stories may not attain their strength under the selected load pattern. Thus, an exact evaluation of the story shear strength is not possible and, in many cases, not necessary. The need for evaluation of the story shear strengths is important primarily in cases in which story strength irregularities exist, which may affect the inelastic dynamic response, and in the computation of maximum story overturning moments.
An approximate evaluation of the “static” story shear strength can be achieved by summing one-half of the “floor moment” capacities of the floors bounding the story and dividing this sum by the story height. This implies that the floor moment capacity is assigned equally to the stories above and below the floor. The “floor moment” capacity is obtained by computing the smallest of the following three quantities at each beam-to-column connection and summing these values over all floor connections.
Connection moment capacity = min(ΣMpbL/(L - 2e), ΣMpcH/(H - dc), aVpdb) (5-3)
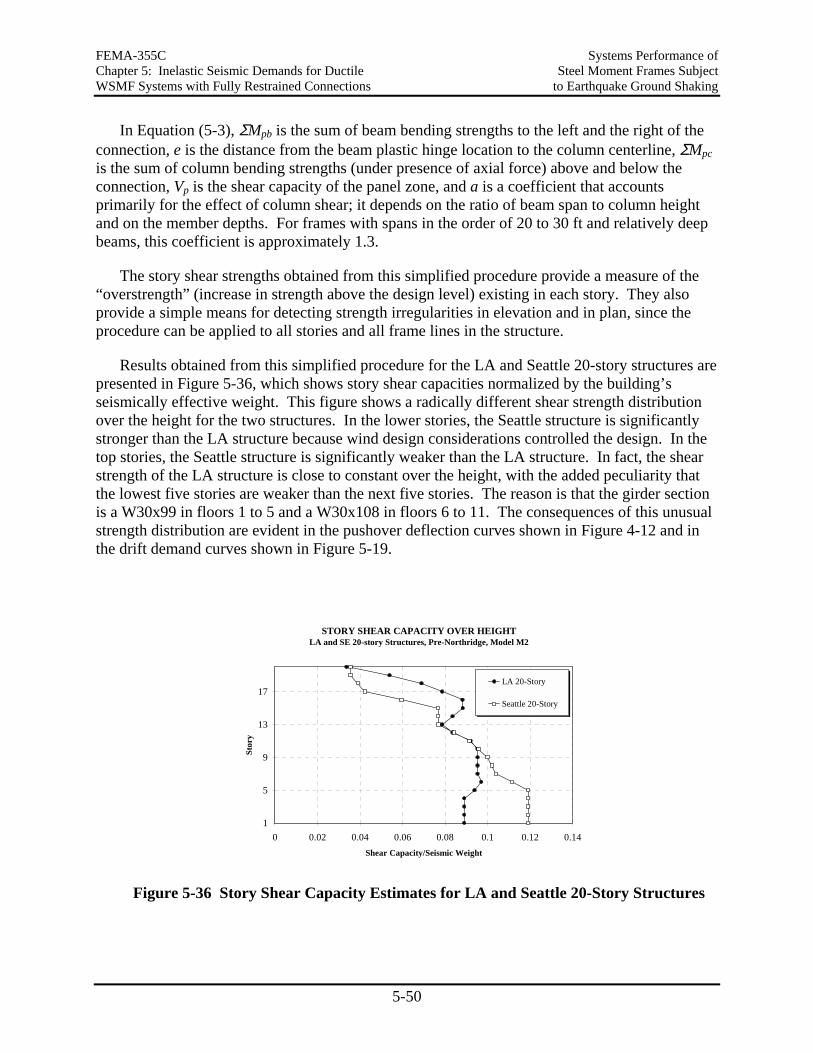
FEMA-355C Systems Performance of Chapter 5: Inelastic Seismic Demands for Ductile Steel Moment Frames Subject WSMF Systems with Fully Restrained Connections to Earthquake Ground Shaking
5-50
In Equation (5-3), ΣMpb is the sum of beam bending strengths to the left and the right of the connection, e is the distance from the beam plastic hinge location to the column centerline, ΣMpc is the sum of column bending strengths (under presence of axial force) above and below the connection, Vp is the shear capacity of the panel zone, and a is a coefficient that accounts primarily for the effect of column shear; it depends on the ratio of beam span to column height and on the member depths. For frames with spans in the order of 20 to 30 ft and relatively deep beams, this coefficient is approximately 1.3.
The story shear strengths obtained from this simplified procedure provide a measure of the “overstrength” (increase in strength above the design level) existing in each story. They also provide a simple means for detecting strength irregularities in elevation and in plan, since the procedure can be applied to all stories and all frame lines in the structure.
Results obtained from this simplified procedure for the LA and Seattle 20-story structures are presented in Figure 5-36, which shows story shear capacities normalized by the building’s seismically effective weight. This figure shows a radically different shear strength distribution over the height for the two structures. In the lower stories, the Seattle structure is significantly stronger than the LA structure because wind design considerations controlled the design. In the top stories, the Seattle structure is significantly weaker than the LA structure. In fact, the shear strength of the LA structure is close to constant over the height, with the added peculiarity that the lowest five stories are weaker than the next five stories. The reason is that the girder section is a W30x99 in floors 1 to 5 and a W30x108 in floors 6 to 11. The consequences of this unusual strength distribution are evident in the pushover deflection curves shown in Figure 4-12 and in the drift demand curves shown in Figure 5-19.
STORY SHEAR CAPACITY OVER HEIGHTLA and SE 20-story Structures, Pre-Northridge, Model M2
1
5
9
13
17
0 0.02 0.04 0.06 0.08 0.1 0.12 0.14Shear Capacity/Seismic Weight
Stor
y
LA 20-Story
Seattle 20-Story
Figure 5-36 Story Shear Capacity Estimates for LA and Seattle 20-Story Structures
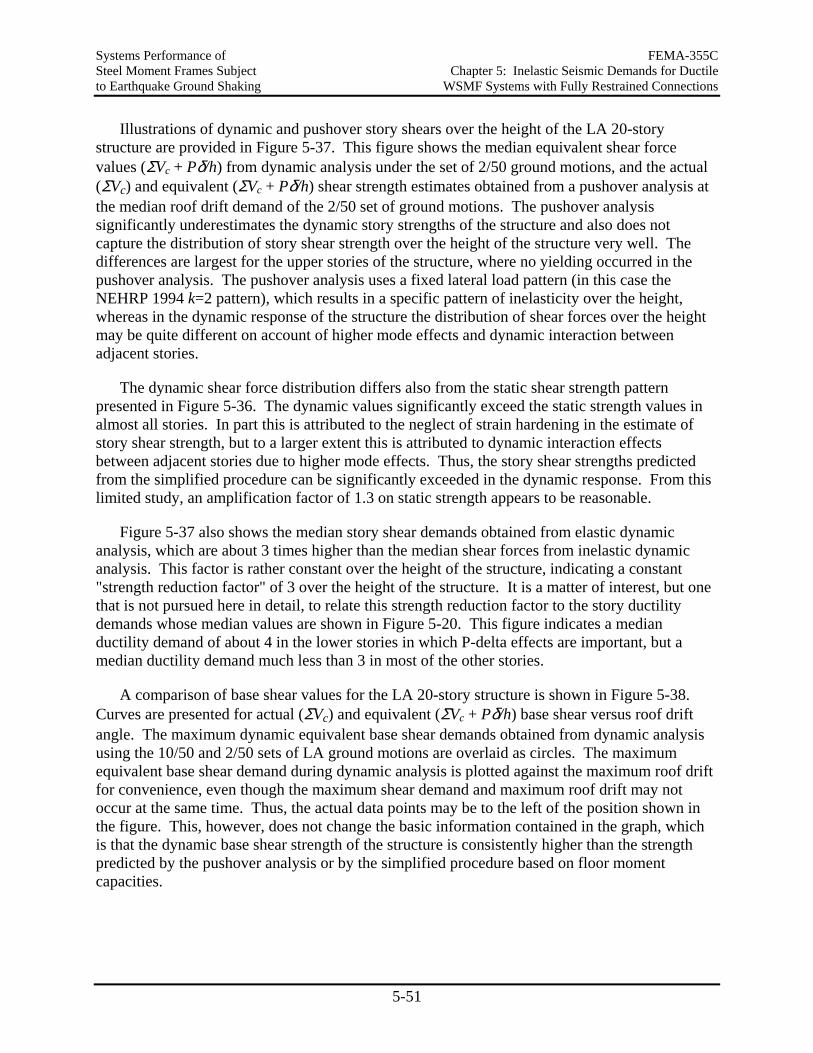
Systems Performance of FEMA-355C Steel Moment Frames Subject Chapter 5: Inelastic Seismic Demands for Ductile to Earthquake Ground Shaking WSMF Systems with Fully Restrained Connections
5-51
Illustrations of dynamic and pushover story shears over the height of the LA 20-story structure are provided in Figure 5-37. This figure shows the median equivalent shear force values (ΣVc + Pδ/h) from dynamic analysis under the set of 2/50 ground motions, and the actual (ΣVc) and equivalent (ΣVc + Pδ/h) shear strength estimates obtained from a pushover analysis at the median roof drift demand of the 2/50 set of ground motions. The pushover analysis significantly underestimates the dynamic story strengths of the structure and also does not capture the distribution of story shear strength over the height of the structure very well. The differences are largest for the upper stories of the structure, where no yielding occurred in the pushover analysis. The pushover analysis uses a fixed lateral load pattern (in this case the NEHRP 1994 k=2 pattern), which results in a specific pattern of inelasticity over the height, whereas in the dynamic response of the structure the distribution of shear forces over the height may be quite different on account of higher mode effects and dynamic interaction between adjacent stories.
The dynamic shear force distribution differs also from the static shear strength pattern presented in Figure 5-36. The dynamic values significantly exceed the static strength values in almost all stories. In part this is attributed to the neglect of strain hardening in the estimate of story shear strength, but to a larger extent this is attributed to dynamic interaction effects between adjacent stories due to higher mode effects. Thus, the story shear strengths predicted from the simplified procedure can be significantly exceeded in the dynamic response. From this limited study, an amplification factor of 1.3 on static strength appears to be reasonable.
Figure 5-37 also shows the median story shear demands obtained from elastic dynamic analysis, which are about 3 times higher than the median shear forces from inelastic dynamic analysis. This factor is rather constant over the height of the structure, indicating a constant "strength reduction factor" of 3 over the height of the structure. It is a matter of interest, but one that is not pursued here in detail, to relate this strength reduction factor to the story ductility demands whose median values are shown in Figure 5-20. This figure indicates a median ductility demand of about 4 in the lower stories in which P-delta effects are important, but a median ductility demand much less than 3 in most of the other stories.
A comparison of base shear values for the LA 20-story structure is shown in Figure 5-38. Curves are presented for actual (ΣVc) and equivalent (ΣVc + Pδ/h) base shear versus roof drift angle. The maximum dynamic equivalent base shear demands obtained from dynamic analysis using the 10/50 and 2/50 sets of LA ground motions are overlaid as circles. The maximum equivalent base shear demand during dynamic analysis is plotted against the maximum roof drift for convenience, even though the maximum shear demand and maximum roof drift may not occur at the same time. Thus, the actual data points may be to the left of the position shown in the figure. This, however, does not change the basic information contained in the graph, which is that the dynamic base shear strength of the structure is consistently higher than the strength predicted by the pushover analysis or by the simplified procedure based on floor moment capacities.
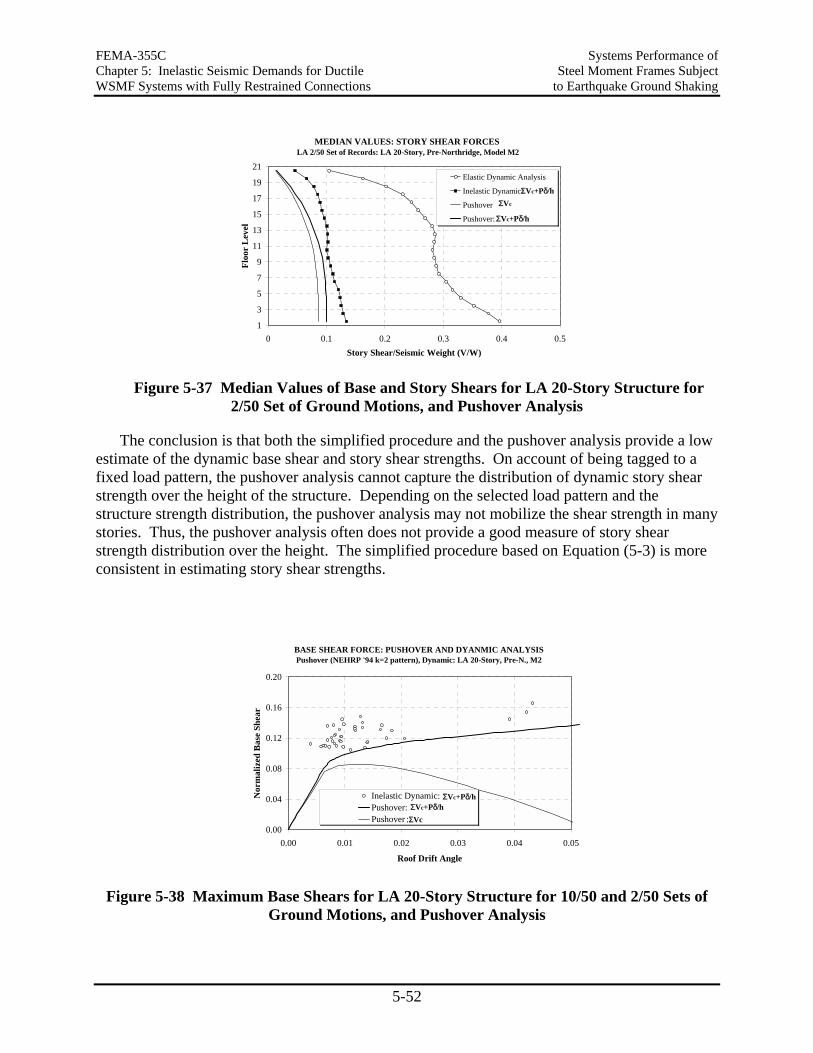
FEMA-355C Systems Performance of Chapter 5: Inelastic Seismic Demands for Ductile Steel Moment Frames Subject WSMF Systems with Fully Restrained Connections to Earthquake Ground Shaking
5-52
MEDIAN VALUES: STORY SHEAR FORCES LA 2/50 Set of Records: LA 20-Story, Pre-Northridge, Model M2
1
3
5
7
9
11
13
15
17
19
21
0 0.1 0.2 0.3 0.4 0.5Story Shear/Seismic Weight (V/W)
Floo
r L
evel
Elastic Dynamic Analysis
Inelastic Dynamic:
Pushover
Pushover:
ΣVc+Pδ/h
ΣVc+Pδ/h
ΣVc
Figure 5-37 Median Values of Base and Story Shears for LA 20-Story Structure for 2/50 Set of Ground Motions, and Pushover Analysis
The conclusion is that both the simplified procedure and the pushover analysis provide a low estimate of the dynamic base shear and story shear strengths. On account of being tagged to a fixed load pattern, the pushover analysis cannot capture the distribution of dynamic story shear strength over the height of the structure. Depending on the selected load pattern and the structure strength distribution, the pushover analysis may not mobilize the shear strength in many stories. Thus, the pushover analysis often does not provide a good measure of story shear strength distribution over the height. The simplified procedure based on Equation (5-3) is more consistent in estimating story shear strengths.
BASE SHEAR FORCE: PUSHOVER AND DYANMIC ANALYSIS Pushover (NEHRP '94 k=2 pattern), Dynamic: LA 20-Story, Pre-N., M2
0.00
0.04
0.08
0.12
0.16
0.20
0.00 0.01 0.02 0.03 0.04 0.05
Roof Drift Angle
Nor
mal
ized
Bas
e Sh
ear
Inelastic Dynamic:Pushover: Pushover
ΣVc+Pδ/hΣVc+Pδ/h
:ΣVc
Figure 5-38 Maximum Base Shears for LA 20-Story Structure for 10/50 and 2/50 Sets of Ground Motions, and Pushover Analysis
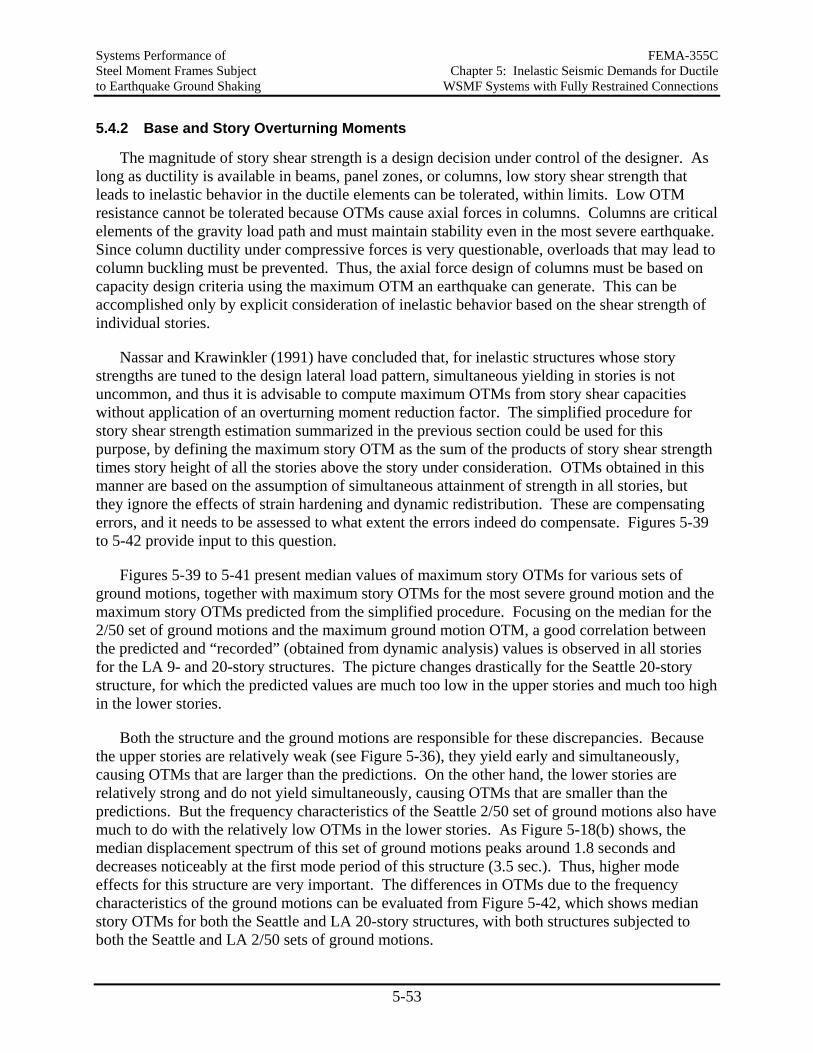
Systems Performance of FEMA-355C Steel Moment Frames Subject Chapter 5: Inelastic Seismic Demands for Ductile to Earthquake Ground Shaking WSMF Systems with Fully Restrained Connections
5-53
5.4.2 Base and Story Overturning Moments
The magnitude of story shear strength is a design decision under control of the designer. As long as ductility is available in beams, panel zones, or columns, low story shear strength that leads to inelastic behavior in the ductile elements can be tolerated, within limits. Low OTM resistance cannot be tolerated because OTMs cause axial forces in columns. Columns are critical elements of the gravity load path and must maintain stability even in the most severe earthquake. Since column ductility under compressive forces is very questionable, overloads that may lead to column buckling must be prevented. Thus, the axial force design of columns must be based on capacity design criteria using the maximum OTM an earthquake can generate. This can be accomplished only by explicit consideration of inelastic behavior based on the shear strength of individual stories.
Nassar and Krawinkler (1991) have concluded that, for inelastic structures whose story strengths are tuned to the design lateral load pattern, simultaneous yielding in stories is not uncommon, and thus it is advisable to compute maximum OTMs from story shear capacities without application of an overturning moment reduction factor. The simplified procedure for story shear strength estimation summarized in the previous section could be used for this purpose, by defining the maximum story OTM as the sum of the products of story shear strength times story height of all the stories above the story under consideration. OTMs obtained in this manner are based on the assumption of simultaneous attainment of strength in all stories, but they ignore the effects of strain hardening and dynamic redistribution. These are compensating errors, and it needs to be assessed to what extent the errors indeed do compensate. Figures 5-39 to 5-42 provide input to this question.
Figures 5-39 to 5-41 present median values of maximum story OTMs for various sets of ground motions, together with maximum story OTMs for the most severe ground motion and the maximum story OTMs predicted from the simplified procedure. Focusing on the median for the 2/50 set of ground motions and the maximum ground motion OTM, a good correlation between the predicted and “recorded” (obtained from dynamic analysis) values is observed in all stories for the LA 9- and 20-story structures. The picture changes drastically for the Seattle 20-story structure, for which the predicted values are much too low in the upper stories and much too high in the lower stories.
Both the structure and the ground motions are responsible for these discrepancies. Because the upper stories are relatively weak (see Figure 5-36), they yield early and simultaneously, causing OTMs that are larger than the predictions. On the other hand, the lower stories are relatively strong and do not yield simultaneously, causing OTMs that are smaller than the predictions. But the frequency characteristics of the Seattle 2/50 set of ground motions also have much to do with the relatively low OTMs in the lower stories. As Figure 5-18(b) shows, the median displacement spectrum of this set of ground motions peaks around 1.8 seconds and decreases noticeably at the first mode period of this structure (3.5 sec.). Thus, higher mode effects for this structure are very important. The differences in OTMs due to the frequency characteristics of the ground motions can be evaluated from Figure 5-42, which shows median story OTMs for both the Seattle and LA 20-story structures, with both structures subjected to both the Seattle and LA 2/50 sets of ground motions.
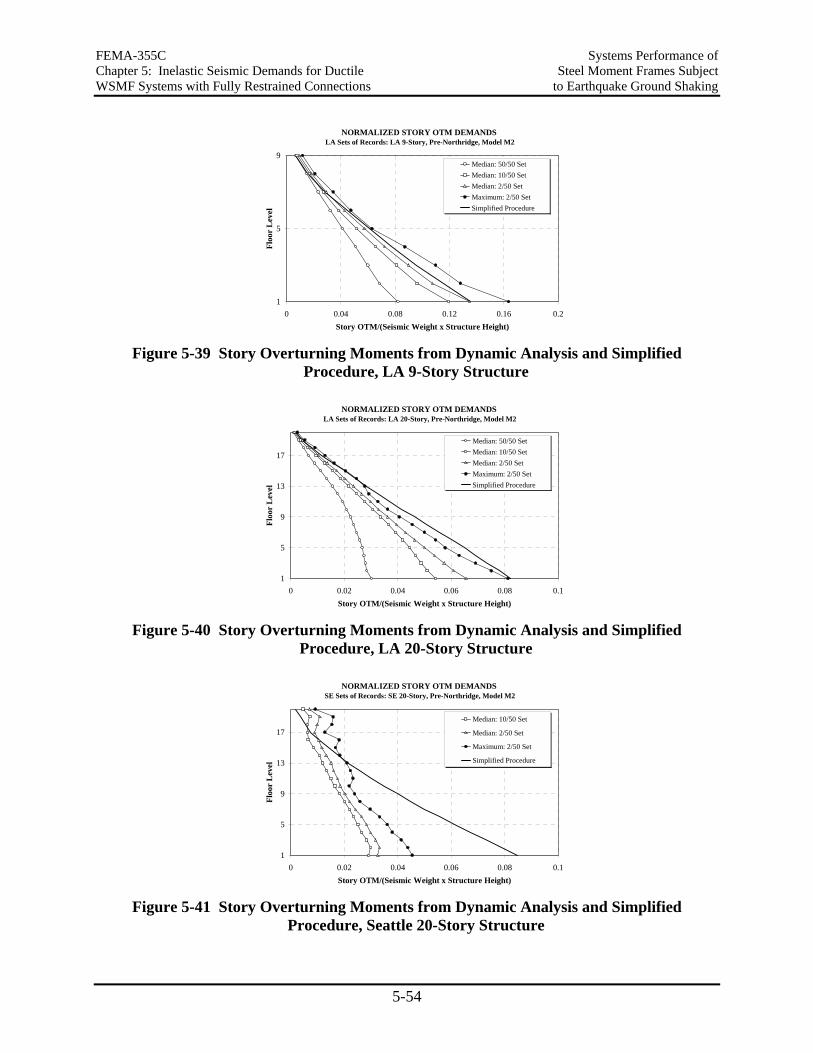
FEMA-355C Systems Performance of Chapter 5: Inelastic Seismic Demands for Ductile Steel Moment Frames Subject WSMF Systems with Fully Restrained Connections to Earthquake Ground Shaking
5-54
NORMALIZED STORY OTM DEMANDS LA Sets of Records: LA 9-Story, Pre-Northridge, Model M2
1
5
9
0 0.04 0.08 0.12 0.16 0.2Story OTM/(Seismic Weight x Structure Height)
Floo
r L
evel
Median: 50/50 SetMedian: 10/50 SetMedian: 2/50 SetMaximum: 2/50 SetSimplified Procedure
Figure 5-39 Story Overturning Moments from Dynamic Analysis and Simplified
Procedure, LA 9-Story Structure
NORMALIZED STORY OTM DEMANDS LA Sets of Records: LA 20-Story, Pre-Northridge, Model M2
1
5
9
13
17
0 0.02 0.04 0.06 0.08 0.1Story OTM/(Seismic Weight x Structure Height)
Floo
r L
evel
Median: 50/50 SetMedian: 10/50 SetMedian: 2/50 SetMaximum: 2/50 SetSimplified Procedure
Figure 5-40 Story Overturning Moments from Dynamic Analysis and Simplified
Procedure, LA 20-Story Structure
NORMALIZED STORY OTM DEMANDS SE Sets of Records: SE 20-Story, Pre-Northridge, Model M2
1
5
9
13
17
0 0.02 0.04 0.06 0.08 0.1Story OTM/(Seismic Weight x Structure Height)
Floo
r L
evel
Median: 10/50 Set
Median: 2/50 Set
Maximum: 2/50 Set
Simplified Procedure
Figure 5-41 Story Overturning Moments from Dynamic Analysis and Simplified
Procedure, Seattle 20-Story Structure
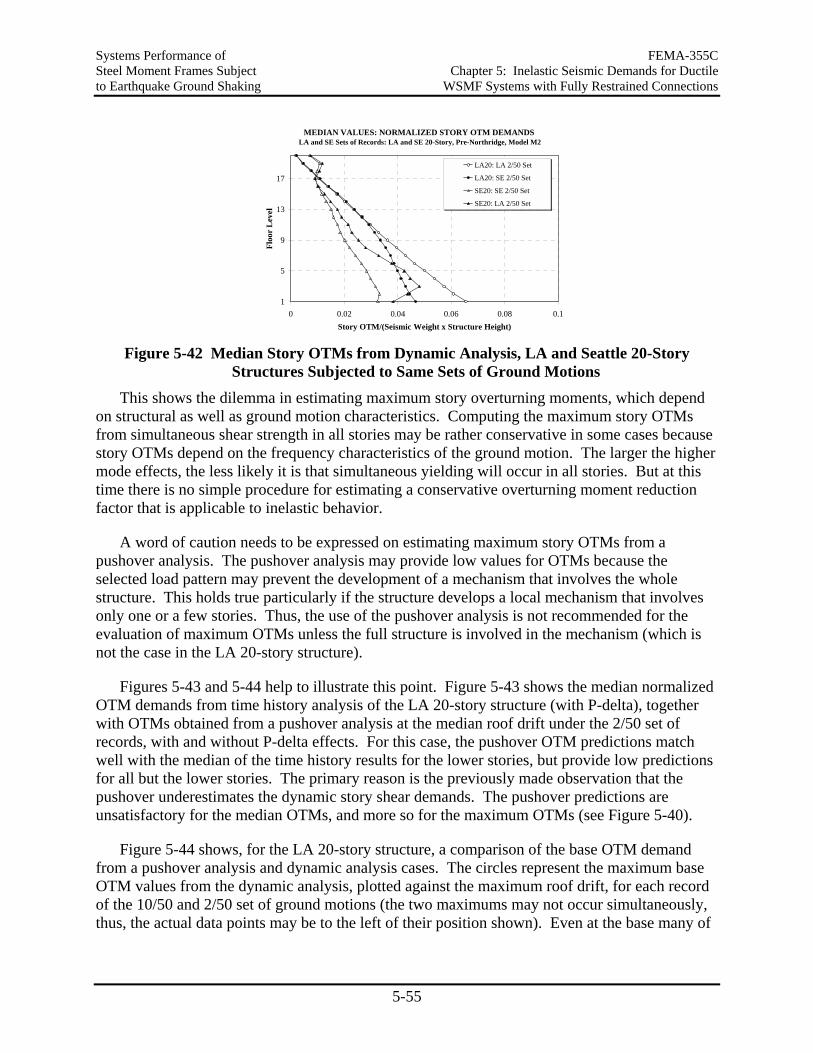
Systems Performance of FEMA-355C Steel Moment Frames Subject Chapter 5: Inelastic Seismic Demands for Ductile to Earthquake Ground Shaking WSMF Systems with Fully Restrained Connections
5-55
MEDIAN VALUES: NORMALIZED STORY OTM DEMANDS LA and SE Sets of Records: LA and SE 20-Story, Pre-Northridge, Model M2
1
5
9
13
17
0 0.02 0.04 0.06 0.08 0.1Story OTM/(Seismic Weight x Structure Height)
Floo
r L
evel
LA20: LA 2/50 Set
LA20: SE 2/50 Set
SE20: SE 2/50 Set
SE20: LA 2/50 Set
Figure 5-42 Median Story OTMs from Dynamic Analysis, LA and Seattle 20-Story
Structures Subjected to Same Sets of Ground Motions
This shows the dilemma in estimating maximum story overturning moments, which depend on structural as well as ground motion characteristics. Computing the maximum story OTMs from simultaneous shear strength in all stories may be rather conservative in some cases because story OTMs depend on the frequency characteristics of the ground motion. The larger the higher mode effects, the less likely it is that simultaneous yielding will occur in all stories. But at this time there is no simple procedure for estimating a conservative overturning moment reduction factor that is applicable to inelastic behavior.
A word of caution needs to be expressed on estimating maximum story OTMs from a pushover analysis. The pushover analysis may provide low values for OTMs because the selected load pattern may prevent the development of a mechanism that involves the whole structure. This holds true particularly if the structure develops a local mechanism that involves only one or a few stories. Thus, the use of the pushover analysis is not recommended for the evaluation of maximum OTMs unless the full structure is involved in the mechanism (which is not the case in the LA 20-story structure).
Figures 5-43 and 5-44 help to illustrate this point. Figure 5-43 shows the median normalized OTM demands from time history analysis of the LA 20-story structure (with P-delta), together with OTMs obtained from a pushover analysis at the median roof drift under the 2/50 set of records, with and without P-delta effects. For this case, the pushover OTM predictions match well with the median of the time history results for the lower stories, but provide low predictions for all but the lower stories. The primary reason is the previously made observation that the pushover underestimates the dynamic story shear demands. The pushover predictions are unsatisfactory for the median OTMs, and more so for the maximum OTMs (see Figure 5-40).
Figure 5-44 shows, for the LA 20-story structure, a comparison of the base OTM demand from a pushover analysis and dynamic analysis cases. The circles represent the maximum base OTM values from the dynamic analysis, plotted against the maximum roof drift, for each record of the 10/50 and 2/50 set of ground motions (the two maximums may not occur simultaneously, thus, the actual data points may be to the left of their position shown). Even at the base many of
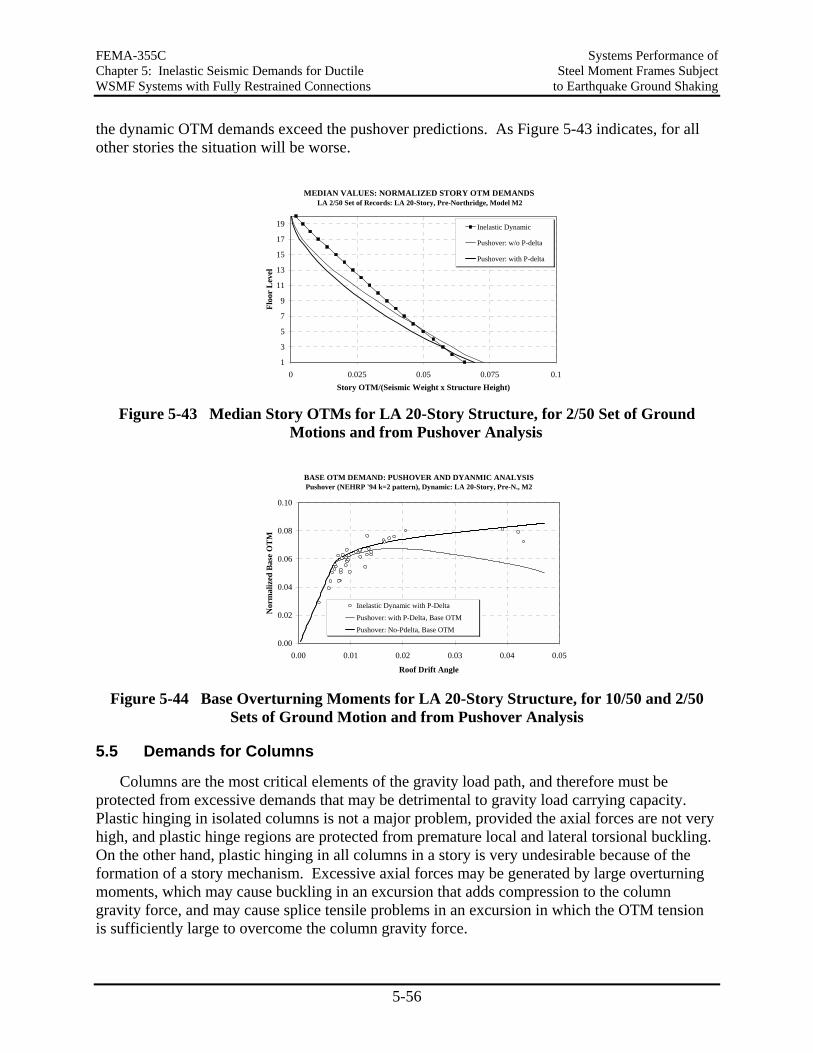
FEMA-355C Systems Performance of Chapter 5: Inelastic Seismic Demands for Ductile Steel Moment Frames Subject WSMF Systems with Fully Restrained Connections to Earthquake Ground Shaking
5-56
the dynamic OTM demands exceed the pushover predictions. As Figure 5-43 indicates, for all other stories the situation will be worse.
MEDIAN VALUES: NORMALIZED STORY OTM DEMANDS LA 2/50 Set of Records: LA 20-Story, Pre-Northridge, Model M2
1
3
5
7
9
11
13
15
17
19
0 0.025 0.05 0.075 0.1Story OTM/(Seismic Weight x Structure Height)
Floo
r L
evel
Inelastic Dynamic
Pushover: w/o P-delta
Pushover: with P-delta
Figure 5-43 Median Story OTMs for LA 20-Story Structure, for 2/50 Set of Ground
Motions and from Pushover Analysis
BASE OTM DEMAND: PUSHOVER AND DYANMIC ANALYSIS Pushover (NEHRP '94 k=2 pattern), Dynamic: LA 20-Story, Pre-N., M2
0.00
0.02
0.04
0.06
0.08
0.10
0.00 0.01 0.02 0.03 0.04 0.05
Roof Drift Angle
Nor
mal
ized
Bas
e O
TM
Inelastic Dynamic with P-Delta
Pushover: with P-Delta, Base OTM
Pushover: No-Pdelta, Base OTM
Figure 5-44 Base Overturning Moments for LA 20-Story Structure, for 10/50 and 2/50
Sets of Ground Motion and from Pushover Analysis
5.5 Demands for Columns
Columns are the most critical elements of the gravity load path, and therefore must be protected from excessive demands that may be detrimental to gravity load carrying capacity. Plastic hinging in isolated columns is not a major problem, provided the axial forces are not very high, and plastic hinge regions are protected from premature local and lateral torsional buckling. On the other hand, plastic hinging in all columns in a story is very undesirable because of the formation of a story mechanism. Excessive axial forces may be generated by large overturning moments, which may cause buckling in an excursion that adds compression to the column gravity force, and may cause splice tensile problems in an excursion in which the OTM tension is sufficiently large to overcome the column gravity force.
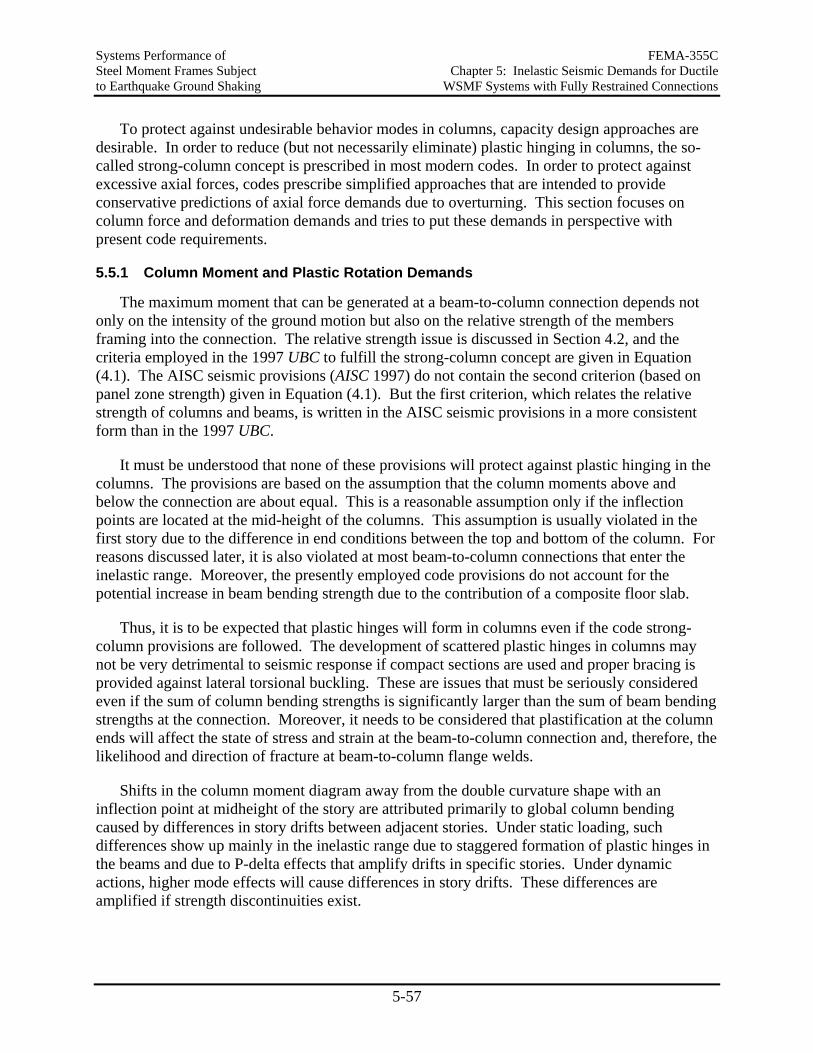
Systems Performance of FEMA-355C Steel Moment Frames Subject Chapter 5: Inelastic Seismic Demands for Ductile to Earthquake Ground Shaking WSMF Systems with Fully Restrained Connections
5-57
To protect against undesirable behavior modes in columns, capacity design approaches are desirable. In order to reduce (but not necessarily eliminate) plastic hinging in columns, the so-called strong-column concept is prescribed in most modern codes. In order to protect against excessive axial forces, codes prescribe simplified approaches that are intended to provide conservative predictions of axial force demands due to overturning. This section focuses on column force and deformation demands and tries to put these demands in perspective with present code requirements.
5.5.1 Column Moment and Plastic Rotation Demands
The maximum moment that can be generated at a beam-to-column connection depends not only on the intensity of the ground motion but also on the relative strength of the members framing into the connection. The relative strength issue is discussed in Section 4.2, and the criteria employed in the 1997 UBC to fulfill the strong-column concept are given in Equation (4.1). The AISC seismic provisions (AISC 1997) do not contain the second criterion (based on panel zone strength) given in Equation (4.1). But the first criterion, which relates the relative strength of columns and beams, is written in the AISC seismic provisions in a more consistent form than in the 1997 UBC.
It must be understood that none of these provisions will protect against plastic hinging in the columns. The provisions are based on the assumption that the column moments above and below the connection are about equal. This is a reasonable assumption only if the inflection points are located at the mid-height of the columns. This assumption is usually violated in the first story due to the difference in end conditions between the top and bottom of the column. For reasons discussed later, it is also violated at most beam-to-column connections that enter the inelastic range. Moreover, the presently employed code provisions do not account for the potential increase in beam bending strength due to the contribution of a composite floor slab.
Thus, it is to be expected that plastic hinges will form in columns even if the code strong-column provisions are followed. The development of scattered plastic hinges in columns may not be very detrimental to seismic response if compact sections are used and proper bracing is provided against lateral torsional buckling. These are issues that must be seriously considered even if the sum of column bending strengths is significantly larger than the sum of beam bending strengths at the connection. Moreover, it needs to be considered that plastification at the column ends will affect the state of stress and strain at the beam-to-column connection and, therefore, the likelihood and direction of fracture at beam-to-column flange welds.
Shifts in the column moment diagram away from the double curvature shape with an inflection point at midheight of the story are attributed primarily to global column bending caused by differences in story drifts between adjacent stories. Under static loading, such differences show up mainly in the inelastic range due to staggered formation of plastic hinges in the beams and due to P-delta effects that amplify drifts in specific stories. Under dynamic actions, higher mode effects will cause differences in story drifts. These differences are amplified if strength discontinuities exist.
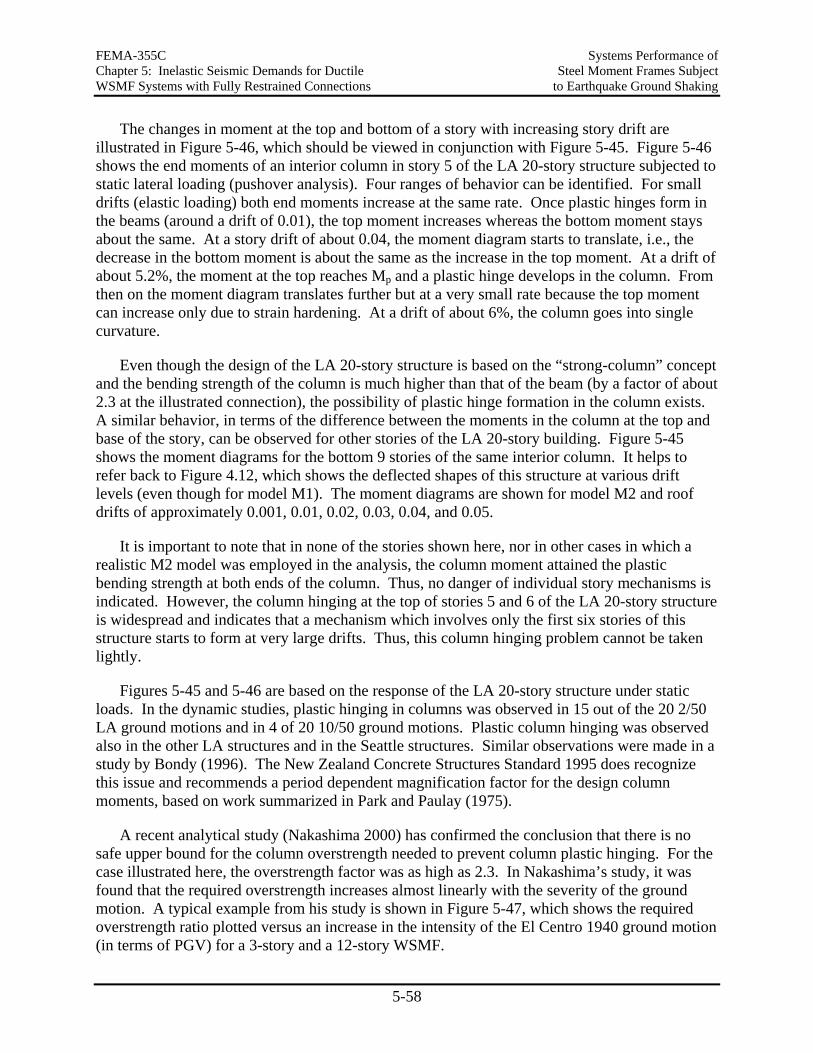
FEMA-355C Systems Performance of Chapter 5: Inelastic Seismic Demands for Ductile Steel Moment Frames Subject WSMF Systems with Fully Restrained Connections to Earthquake Ground Shaking
5-58
The changes in moment at the top and bottom of a story with increasing story drift are illustrated in Figure 5-46, which should be viewed in conjunction with Figure 5-45. Figure 5-46 shows the end moments of an interior column in story 5 of the LA 20-story structure subjected to static lateral loading (pushover analysis). Four ranges of behavior can be identified. For small drifts (elastic loading) both end moments increase at the same rate. Once plastic hinges form in the beams (around a drift of 0.01), the top moment increases whereas the bottom moment stays about the same. At a story drift of about 0.04, the moment diagram starts to translate, i.e., the decrease in the bottom moment is about the same as the increase in the top moment. At a drift of about 5.2%, the moment at the top reaches Mp and a plastic hinge develops in the column. From then on the moment diagram translates further but at a very small rate because the top moment can increase only due to strain hardening. At a drift of about 6%, the column goes into single curvature.
Even though the design of the LA 20-story structure is based on the “strong-column” concept and the bending strength of the column is much higher than that of the beam (by a factor of about 2.3 at the illustrated connection), the possibility of plastic hinge formation in the column exists. A similar behavior, in terms of the difference between the moments in the column at the top and base of the story, can be observed for other stories of the LA 20-story building. Figure 5-45 shows the moment diagrams for the bottom 9 stories of the same interior column. It helps to refer back to Figure 4.12, which shows the deflected shapes of this structure at various drift levels (even though for model M1). The moment diagrams are shown for model M2 and roof drifts of approximately 0.001, 0.01, 0.02, 0.03, 0.04, and 0.05.
It is important to note that in none of the stories shown here, nor in other cases in which a realistic M2 model was employed in the analysis, the column moment attained the plastic bending strength at both ends of the column. Thus, no danger of individual story mechanisms is indicated. However, the column hinging at the top of stories 5 and 6 of the LA 20-story structure is widespread and indicates that a mechanism which involves only the first six stories of this structure starts to form at very large drifts. Thus, this column hinging problem cannot be taken lightly.
Figures 5-45 and 5-46 are based on the response of the LA 20-story structure under static loads. In the dynamic studies, plastic hinging in columns was observed in 15 out of the 20 2/50 LA ground motions and in 4 of 20 10/50 ground motions. Plastic column hinging was observed also in the other LA structures and in the Seattle structures. Similar observations were made in a study by Bondy (1996). The New Zealand Concrete Structures Standard 1995 does recognize this issue and recommends a period dependent magnification factor for the design column moments, based on work summarized in Park and Paulay (1975).
A recent analytical study (Nakashima 2000) has confirmed the conclusion that there is no safe upper bound for the column overstrength needed to prevent column plastic hinging. For the case illustrated here, the overstrength factor was as high as 2.3. In Nakashima’s study, it was found that the required overstrength increases almost linearly with the severity of the ground motion. A typical example from his study is shown in Figure 5-47, which shows the required overstrength ratio plotted versus an increase in the intensity of the El Centro 1940 ground motion (in terms of PGV) for a 3-story and a 12-story WSMF.
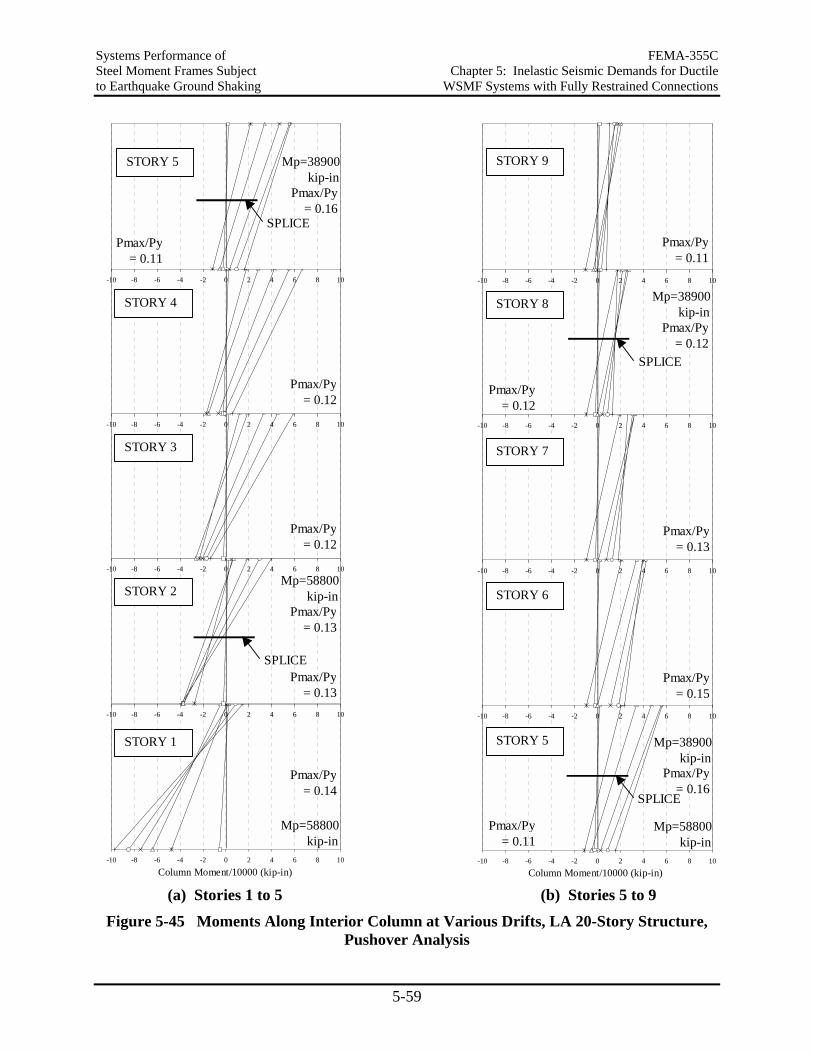
Systems Performance of FEMA-355C Steel Moment Frames Subject Chapter 5: Inelastic Seismic Demands for Ductile to Earthquake Ground Shaking WSMF Systems with Fully Restrained Connections
5-59
(a) Stories 1 to 5 (b) Stories 5 to 9
Figure 5-45 Moments Along Interior Column at Various Drifts, LA 20-Story Structure, Pushover Analysis
Column Moment/10000 (kip-in)-10 -8 -6 -4 -2 0 2 4 6 8 10
-10 -8 -6 -4 -2 0 2 4 6 8 10
-10 -8 -6 -4 -2 0 2 4 6 8 10
-10 -8 -6 -4 -2 0 2 4 6 8 10
-10 -8 -6 -4 -2 0 2 4 6 8 10
SPLICE
Mp=58800 kip-in
STORY 1
SPLICE
STORY 2
STORY 3
STORY 4
STORY 5
Mp=58800 kip-in
Mp=38900 kip-in
Pmax/Py = 0.14
Pmax/Py = 0.13
Pmax/Py = 0.13
Pmax/Py = 0.12
Pmax/Py = 0.12
Pmax/Py = 0.11
Pmax/Py = 0.16
-10 -8 -6 -4 -2 0 2 4 6 8 10
-10 -8 -6 -4 -2 0 2 4 6 8 10
-10 -8 -6 -4 -2 0 2 4 6 8 10
-10 -8 -6 -4 -2 0 2 4 6 8 10
-10 -8 -6 -4 -2 0 2 4 6 8 10
Column Moment/10000 (kip-in)
Mp=58800 kip-in
SPLICE
Mp=38900 kip-in
STORY 5
STORY 6
STORY 7
STORY 8
STORY 9
SPLICE
Mp=38900 kip-in
Pmax/Py = 0.11
Pmax/Py = 0.16
Pmax/Py = 0.15
Pmax/Py = 0.13
Pmax/Py = 0.12
Pmax/Py = 0.12
Pmax/Py = 0.11
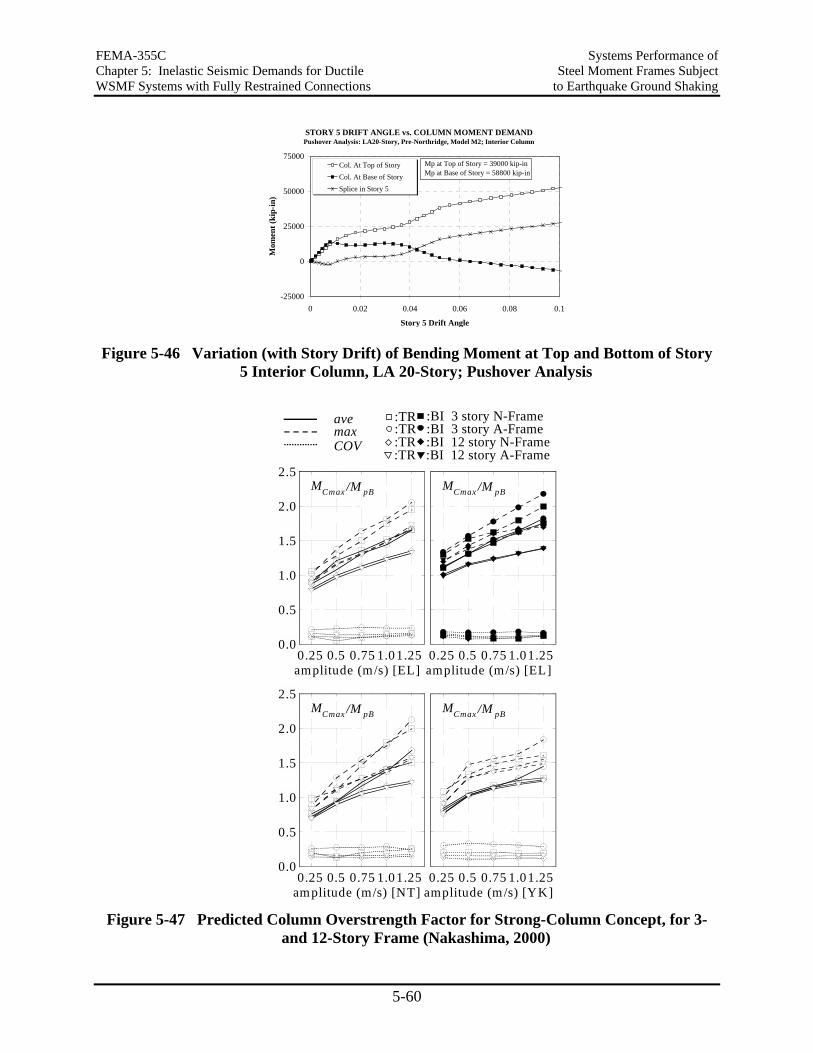
FEMA-355C Systems Performance of Chapter 5: Inelastic Seismic Demands for Ductile Steel Moment Frames Subject WSMF Systems with Fully Restrained Connections to Earthquake Ground Shaking
5-60
STORY 5 DRIFT ANGLE vs. COLUMN MOMENT DEMANDPushover Analysis: LA20-Story, Pre-Northridge, Model M2; Interior Column
-25000
0
25000
50000
75000
0 0.02 0.04 0.06 0.08 0.1
Story 5 Drift Angle
Mom
ent (
kip-
in)
Col. At Top of StoryCol. At Base of StorySplice in Story 5
Mp at Top of Story = 39000 kip-inMp at Base of Story = 58800 kip-in
Figure 5-46 Variation (with Story Drift) of Bending Moment at Top and Bottom of Story
5 Interior Column, LA 20-Story; Pushover Analysis
0. 2 5 0 . 5 0 . 7 5 1 1 . 2 5
amplitude (m/s) [EL]0.25 0.5 0.75 1.01.25
MCmax /M pB
0.0
0.5
1.0
1.5
2.0
2.5
0 . 2 5 0 . 5 0 . 7 5 1 1 . 2 5
amplitude (m/s) [EL]0.25 0.5 0.75 1.01.25
MCmax /M pB
0.0
0.5
1.0
1.5
2.0
2.5
0 . 2 5 0 . 5 0 . 7 5 1 1 . 2 5
amplitude (m/s) [NT]0.25 0.5 0.75 1.01.25
MCmax /M pB
0. 2 5 0 . 5 0 . 7 5 1 1 . 2 5
amplitude (m/s) [YK]0.25 0.5 0.75 1.01.25
MCmax /M pB
avemaxCOV
:TR :BI 3 story N-Frame:TR :BI 3 story A-Frame:TR :BI 12 story N-Frame
:BI 12 story A-Frame:TR
Figure 5-47 Predicted Column Overstrength Factor for Strong-Column Concept, for 3-
and 12-Story Frame (Nakashima, 2000)
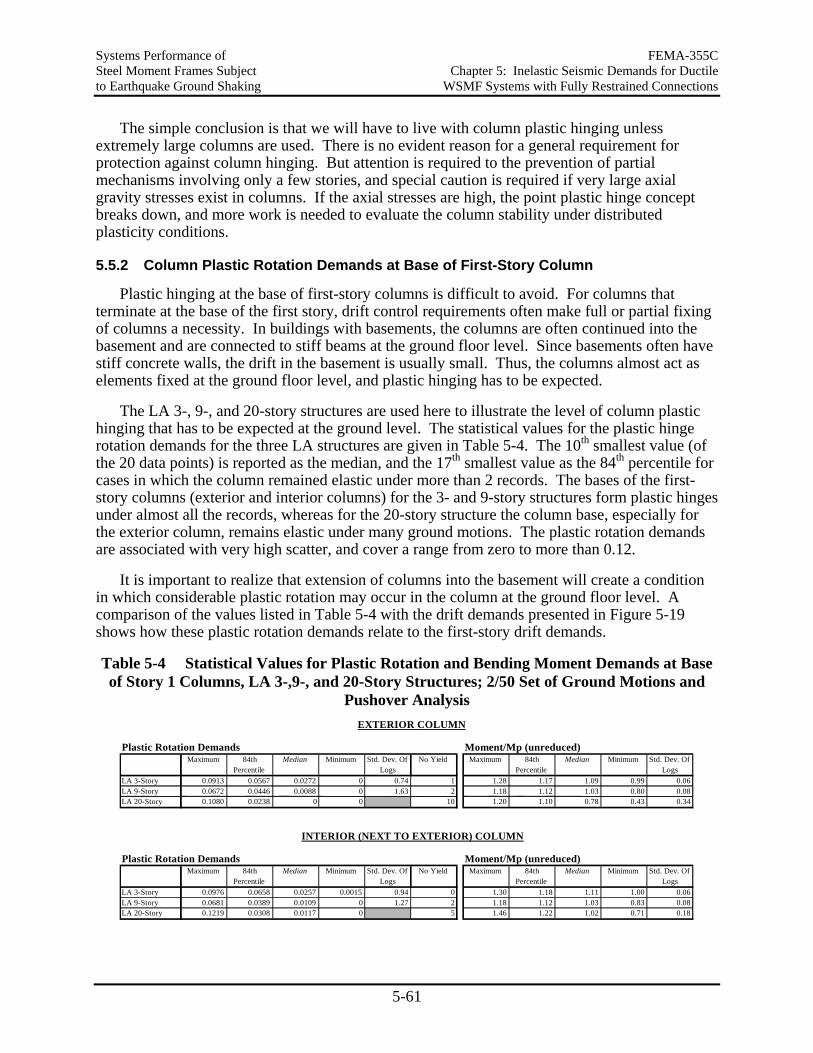
Systems Performance of FEMA-355C Steel Moment Frames Subject Chapter 5: Inelastic Seismic Demands for Ductile to Earthquake Ground Shaking WSMF Systems with Fully Restrained Connections
5-61
The simple conclusion is that we will have to live with column plastic hinging unless extremely large columns are used. There is no evident reason for a general requirement for protection against column hinging. But attention is required to the prevention of partial mechanisms involving only a few stories, and special caution is required if very large axial gravity stresses exist in columns. If the axial stresses are high, the point plastic hinge concept breaks down, and more work is needed to evaluate the column stability under distributed plasticity conditions.
5.5.2 Column Plastic Rotation Demands at Base of First-Story Column
Plastic hinging at the base of first-story columns is difficult to avoid. For columns that terminate at the base of the first story, drift control requirements often make full or partial fixing of columns a necessity. In buildings with basements, the columns are often continued into the basement and are connected to stiff beams at the ground floor level. Since basements often have stiff concrete walls, the drift in the basement is usually small. Thus, the columns almost act as elements fixed at the ground floor level, and plastic hinging has to be expected.
The LA 3-, 9-, and 20-story structures are used here to illustrate the level of column plastic hinging that has to be expected at the ground level. The statistical values for the plastic hinge rotation demands for the three LA structures are given in Table 5-4. The 10th smallest value (of the 20 data points) is reported as the median, and the 17th smallest value as the 84th percentile for cases in which the column remained elastic under more than 2 records. The bases of the first-story columns (exterior and interior columns) for the 3- and 9-story structures form plastic hinges under almost all the records, whereas for the 20-story structure the column base, especially for the exterior column, remains elastic under many ground motions. The plastic rotation demands are associated with very high scatter, and cover a range from zero to more than 0.12.
It is important to realize that extension of columns into the basement will create a condition in which considerable plastic rotation may occur in the column at the ground floor level. A comparison of the values listed in Table 5-4 with the drift demands presented in Figure 5-19 shows how these plastic rotation demands relate to the first-story drift demands.
Table 5-4 Statistical Values for Plastic Rotation and Bending Moment Demands at Base of Story 1 Columns, LA 3-,9-, and 20-Story Structures; 2/50 Set of Ground Motions and
Pushover Analysis
Plastic Rotation Demands Moment/Mp (unreduced)
LA 3-Story 0.0913 0.0567 0.0272 0 0.74 1 1.28 1.17 1.09 0.99 0.06LA 9-Story 0.0672 0.0446 0.0088 0 1.63 2 1.18 1.12 1.03 0.80 0.08LA 20-Story 0.1080 0.0238 0 0 10 1.20 1.10 0.78 0.43 0.34
Plastic Rotation Demands Moment/Mp (unreduced)
LA 3-Story 0.0976 0.0658 0.0257 0.0015 0.94 0 1.30 1.18 1.11 1.00 0.06LA 9-Story 0.0681 0.0389 0.0109 0 1.27 2 1.18 1.12 1.03 0.83 0.08LA 20-Story 0.1219 0.0308 0.0117 0 5 1.46 1.22 1.02 0.71 0.18
Std. Dev. Of Logs
INTERIOR (NEXT TO EXTERIOR) COLUMN
EXTERIOR COLUMN
Maximum 84th Percentile
Median Minimum Maximum 84th Percentile
Median Minimum Std. Dev. Of Logs
No Yield
Std. Dev. Of Logs
Minimum Std. Dev. Of Logs
No Yield Maximum 84th Percentile
Median Minimum Maximum 84th Percentile
Median
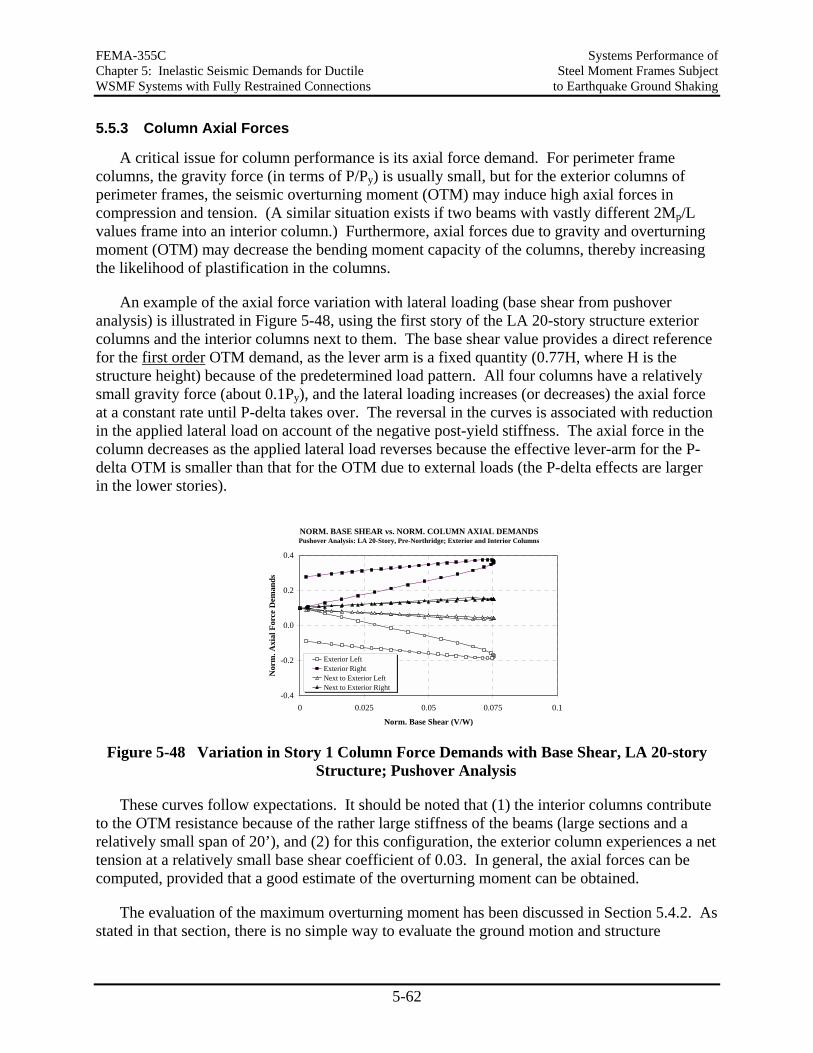
FEMA-355C Systems Performance of Chapter 5: Inelastic Seismic Demands for Ductile Steel Moment Frames Subject WSMF Systems with Fully Restrained Connections to Earthquake Ground Shaking
5-62
5.5.3 Column Axial Forces
A critical issue for column performance is its axial force demand. For perimeter frame columns, the gravity force (in terms of P/Py) is usually small, but for the exterior columns of perimeter frames, the seismic overturning moment (OTM) may induce high axial forces in compression and tension. (A similar situation exists if two beams with vastly different 2Mp/L values frame into an interior column.) Furthermore, axial forces due to gravity and overturning moment (OTM) may decrease the bending moment capacity of the columns, thereby increasing the likelihood of plastification in the columns.
An example of the axial force variation with lateral loading (base shear from pushover analysis) is illustrated in Figure 5-48, using the first story of the LA 20-story structure exterior columns and the interior columns next to them. The base shear value provides a direct reference for the first order OTM demand, as the lever arm is a fixed quantity (0.77H, where H is the structure height) because of the predetermined load pattern. All four columns have a relatively small gravity force (about 0.1Py), and the lateral loading increases (or decreases) the axial force at a constant rate until P-delta takes over. The reversal in the curves is associated with reduction in the applied lateral load on account of the negative post-yield stiffness. The axial force in the column decreases as the applied lateral load reverses because the effective lever-arm for the P-delta OTM is smaller than that for the OTM due to external loads (the P-delta effects are larger in the lower stories).
NORM. BASE SHEAR vs. NORM. COLUMN AXIAL DEMANDSPushover Analysis: LA 20-Story, Pre-Northridge; Exterior and Interior Columns
-0.4
-0.2
0.0
0.2
0.4
0 0.025 0.05 0.075 0.1
Norm. Base Shear (V/W)
Nor
m. A
xial
For
ce D
eman
ds
Exterior LeftExterior RightNext to Exterior LeftNext to Exterior Right
Figure 5-48 Variation in Story 1 Column Force Demands with Base Shear, LA 20-story
Structure; Pushover Analysis
These curves follow expectations. It should be noted that (1) the interior columns contribute to the OTM resistance because of the rather large stiffness of the beams (large sections and a relatively small span of 20’), and (2) for this configuration, the exterior column experiences a net tension at a relatively small base shear coefficient of 0.03. In general, the axial forces can be computed, provided that a good estimate of the overturning moment can be obtained.
The evaluation of the maximum overturning moment has been discussed in Section 5.4.2. As stated in that section, there is no simple way to evaluate the ground motion and structure
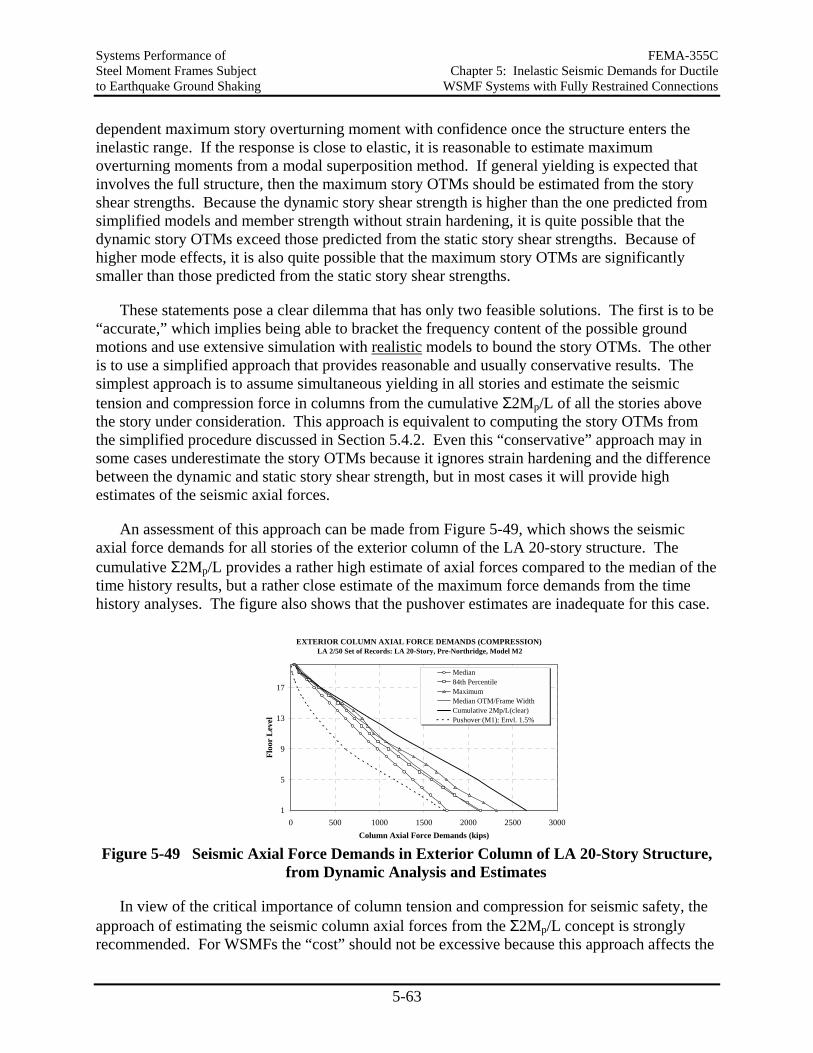
Systems Performance of FEMA-355C Steel Moment Frames Subject Chapter 5: Inelastic Seismic Demands for Ductile to Earthquake Ground Shaking WSMF Systems with Fully Restrained Connections
5-63
dependent maximum story overturning moment with confidence once the structure enters the inelastic range. If the response is close to elastic, it is reasonable to estimate maximum overturning moments from a modal superposition method. If general yielding is expected that involves the full structure, then the maximum story OTMs should be estimated from the story shear strengths. Because the dynamic story shear strength is higher than the one predicted from simplified models and member strength without strain hardening, it is quite possible that the dynamic story OTMs exceed those predicted from the static story shear strengths. Because of higher mode effects, it is also quite possible that the maximum story OTMs are significantly smaller than those predicted from the static story shear strengths.
These statements pose a clear dilemma that has only two feasible solutions. The first is to be “accurate,” which implies being able to bracket the frequency content of the possible ground motions and use extensive simulation with realistic models to bound the story OTMs. The other is to use a simplified approach that provides reasonable and usually conservative results. The simplest approach is to assume simultaneous yielding in all stories and estimate the seismic tension and compression force in columns from the cumulative Σ2Mp/L of all the stories above the story under consideration. This approach is equivalent to computing the story OTMs from the simplified procedure discussed in Section 5.4.2. Even this “conservative” approach may in some cases underestimate the story OTMs because it ignores strain hardening and the difference between the dynamic and static story shear strength, but in most cases it will provide high estimates of the seismic axial forces.
An assessment of this approach can be made from Figure 5-49, which shows the seismic axial force demands for all stories of the exterior column of the LA 20-story structure. The cumulative Σ2Mp/L provides a rather high estimate of axial forces compared to the median of the time history results, but a rather close estimate of the maximum force demands from the time history analyses. The figure also shows that the pushover estimates are inadequate for this case.
EXTERIOR COLUMN AXIAL FORCE DEMANDS (COMPRESSION) LA 2/50 Set of Records: LA 20-Story, Pre-Northridge, Model M2
1
5
9
13
17
0 500 1000 1500 2000 2500 3000Column Axial Force Demands (kips)
Floo
r L
evel
Median84th PercentileMaximumMedian OTM/Frame WidthCumulative 2Mp/L(clear)Pushover (M1): Envl. 1.5%
Figure 5-49 Seismic Axial Force Demands in Exterior Column of LA 20-Story Structure,
from Dynamic Analysis and Estimates
In view of the critical importance of column tension and compression for seismic safety, the approach of estimating the seismic column axial forces from the Σ2Mp/L concept is strongly recommended. For WSMFs the “cost” should not be excessive because this approach affects the
FEMA-355C Systems Performance of Chapter 5: Inelastic Seismic Demands for Ductile Steel Moment Frames Subject WSMF Systems with Fully Restrained Connections to Earthquake Ground Shaking
5-64
compression and tension (splice) design of only a few columns. Unless the frames are very slender (an undesirable condition because it implies few bays), the size of the column likely will not be much affected compared to present code design, which requires large column sizes because of the strong-column requirement and drift limitations. Moreover, the presently employed code overstrength factor for column axial force of 0.4R (1997 UBC) or 3.0 (1997 AISC) exceeds this recommendation in many cases.
Two additional issues are recommended for consideration. First, for buildings responding primarily in the first mode, simultaneous yielding in all stories is very likely, and strain hardening and dynamic story shear strength may significantly increase the story OTMs. Thus, it is recommended to increase the Σ2Mp/L axial force by a factor greater than 1.0 for low-rise buildings. This factor, f, could be
f = 1.35 – 0.05n > 1.0 (5-4)
where n is the number of stories. This factor will become 1.0 for n > 7.
Recommendations made by others go the other way and focus on a reduction factor to be applied to the Σ2Mp/L seismic force. A New Zealand recommendation (MacRae (1999)) is to use a reduction factor of
f = 1.0 – 0.015n > 0.7 (5-5)
The writer does not recommend such a reduction factor without a case specific study. The results presented here have shown that, in many cases, this reduction will lead to low estimates of axial force demands. Considering the potentially severe consequences of column buckling, the probability of attaining the buckling load should be kept small. A reduction (if to be applied at all) depends on structural and ground motion characteristics. Even the results presented in MacRae (1999) show that this equation may produce low estimates. This is illustrated in Figure 5-75, presented in Section 5.8 as part of the discussion on the effects of ground motion characteristics. This figure shows a plot of this equation together with median data points for different sets of records for the LA 20-story structure. Even the medians exceed the reduction factor for near-fault and soft soil ground motions.
Secondly, columns are also subjected to vertical accelerations. In the study by MacRae et al. (2000) it was found that vertical accelerations can increase column axial forces considerably (see Section 5.9.2). This increase (or decrease possibly causing tension) applies to moment frame as well as gravity columns. Recommendations for estimating these additional axial forces are presented in Section 5.9.2.
5.5.4 Moment and Axial Force Demands at Column Splices
Column splices need to provide shear, moment, and axial force transfer. Of much concern is the combined bending moment and tensile force transfer because of the extensive use of partial penetration groove welds. Tests have shown that splices of this type may fracture in a brittle mode if the weld capacity is exceeded (Bruneau et al. (1987), Bruneau and Mahin (1990a),
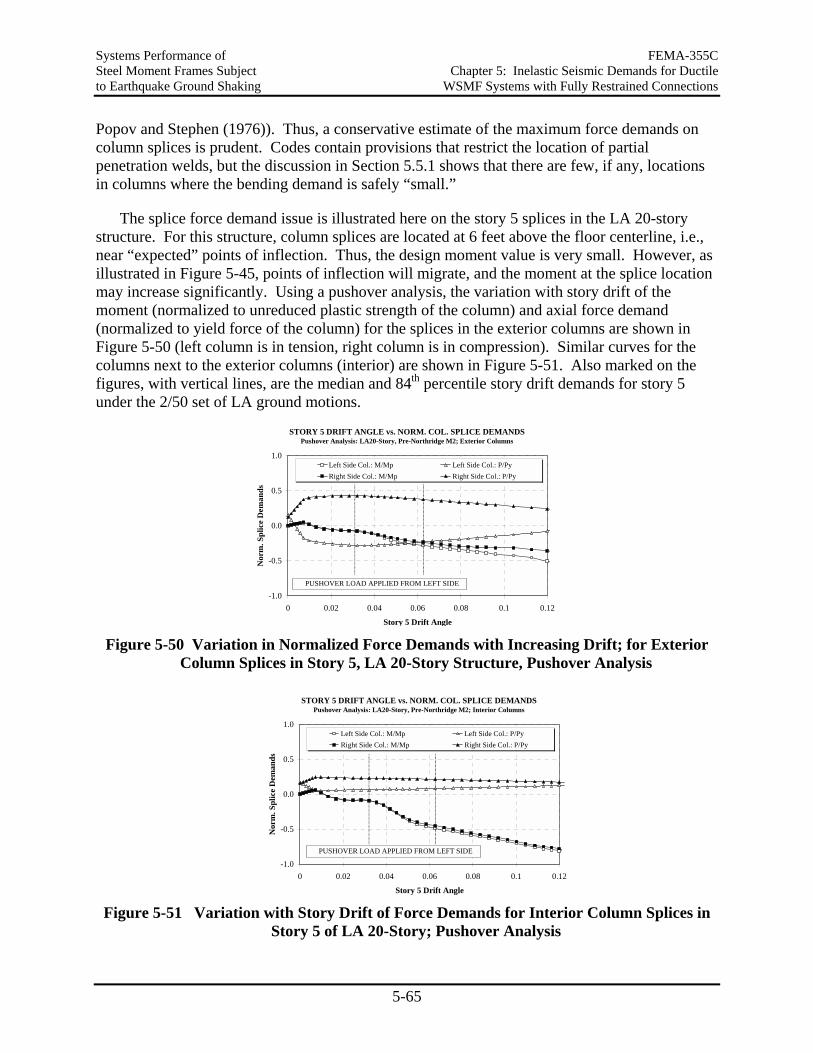
Systems Performance of FEMA-355C Steel Moment Frames Subject Chapter 5: Inelastic Seismic Demands for Ductile to Earthquake Ground Shaking WSMF Systems with Fully Restrained Connections
5-65
Popov and Stephen (1976)). Thus, a conservative estimate of the maximum force demands on column splices is prudent. Codes contain provisions that restrict the location of partial penetration welds, but the discussion in Section 5.5.1 shows that there are few, if any, locations in columns where the bending demand is safely “small.”
The splice force demand issue is illustrated here on the story 5 splices in the LA 20-story structure. For this structure, column splices are located at 6 feet above the floor centerline, i.e., near “expected” points of inflection. Thus, the design moment value is very small. However, as illustrated in Figure 5-45, points of inflection will migrate, and the moment at the splice location may increase significantly. Using a pushover analysis, the variation with story drift of the moment (normalized to unreduced plastic strength of the column) and axial force demand (normalized to yield force of the column) for the splices in the exterior columns are shown in Figure 5-50 (left column is in tension, right column is in compression). Similar curves for the columns next to the exterior columns (interior) are shown in Figure 5-51. Also marked on the figures, with vertical lines, are the median and 84th percentile story drift demands for story 5 under the 2/50 set of LA ground motions.
STORY 5 DRIFT ANGLE vs. NORM. COL. SPLICE DEMANDSPushover Analysis: LA20-Story, Pre-Northridge M2; Exterior Columns
-1.0
-0.5
0.0
0.5
1.0
0 0.02 0.04 0.06 0.08 0.1 0.12
Story 5 Drift Angle
Nor
m. S
plic
e D
eman
ds
Left Side Col.: M/Mp Left Side Col.: P/PyRight Side Col.: M/Mp Right Side Col.: P/Py
PUSHOVER LOAD APPLIED FROM LEFT SIDE
Figure 5-50 Variation in Normalized Force Demands with Increasing Drift; for Exterior
Column Splices in Story 5, LA 20-Story Structure, Pushover Analysis
STORY 5 DRIFT ANGLE vs. NORM. COL. SPLICE DEMANDSPushover Analysis: LA20-Story, Pre-Northridge M2; Interior Columns
-1.0
-0.5
0.0
0.5
1.0
0 0.02 0.04 0.06 0.08 0.1 0.12
Story 5 Drift Angle
Nor
m. S
plic
e D
eman
ds
Left Side Col.: M/Mp Left Side Col.: P/PyRight Side Col.: M/Mp Right Side Col.: P/Py
PUSHOVER LOAD APPLIED FROM LEFT SIDE
Figure 5-51 Variation with Story Drift of Force Demands for Interior Column Splices in
Story 5 of LA 20-Story; Pushover Analysis
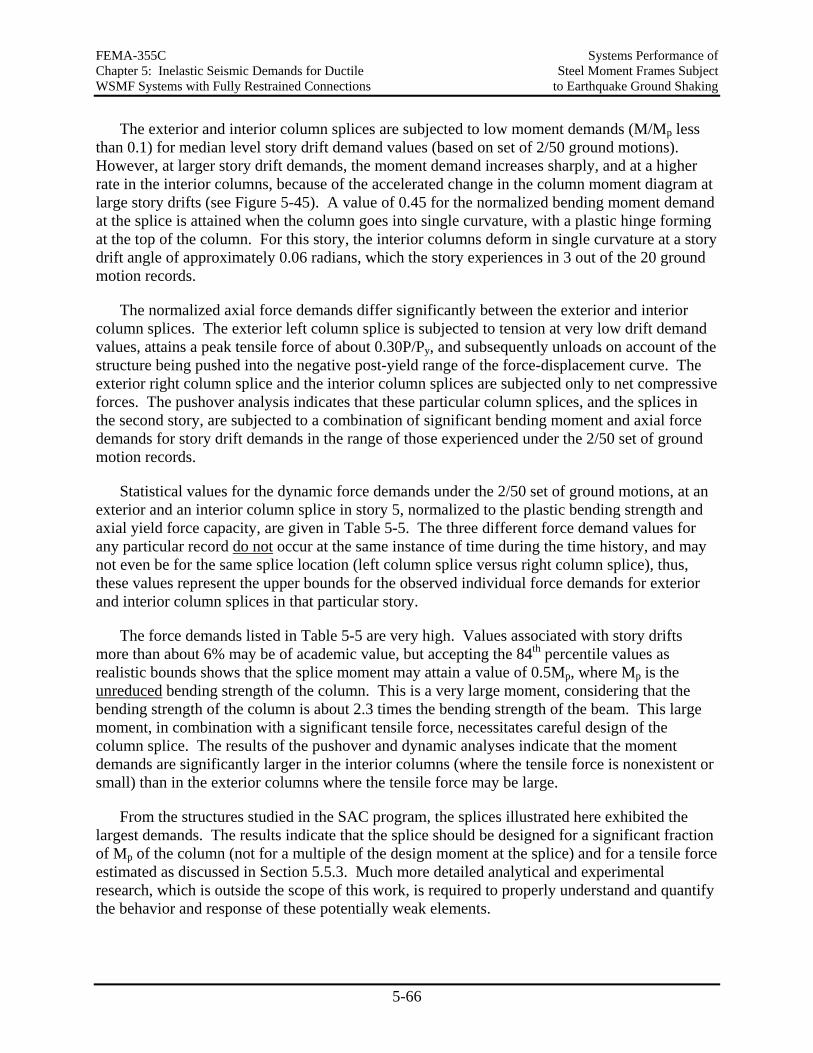
FEMA-355C Systems Performance of Chapter 5: Inelastic Seismic Demands for Ductile Steel Moment Frames Subject WSMF Systems with Fully Restrained Connections to Earthquake Ground Shaking
5-66
The exterior and interior column splices are subjected to low moment demands (M/Mp less than 0.1) for median level story drift demand values (based on set of 2/50 ground motions). However, at larger story drift demands, the moment demand increases sharply, and at a higher rate in the interior columns, because of the accelerated change in the column moment diagram at large story drifts (see Figure 5-45). A value of 0.45 for the normalized bending moment demand at the splice is attained when the column goes into single curvature, with a plastic hinge forming at the top of the column. For this story, the interior columns deform in single curvature at a story drift angle of approximately 0.06 radians, which the story experiences in 3 out of the 20 ground motion records.
The normalized axial force demands differ significantly between the exterior and interior column splices. The exterior left column splice is subjected to tension at very low drift demand values, attains a peak tensile force of about 0.30P/Py, and subsequently unloads on account of the structure being pushed into the negative post-yield range of the force-displacement curve. The exterior right column splice and the interior column splices are subjected only to net compressive forces. The pushover analysis indicates that these particular column splices, and the splices in the second story, are subjected to a combination of significant bending moment and axial force demands for story drift demands in the range of those experienced under the 2/50 set of ground motion records.
Statistical values for the dynamic force demands under the 2/50 set of ground motions, at an exterior and an interior column splice in story 5, normalized to the plastic bending strength and axial yield force capacity, are given in Table 5-5. The three different force demand values for any particular record do not occur at the same instance of time during the time history, and may not even be for the same splice location (left column splice versus right column splice), thus, these values represent the upper bounds for the observed individual force demands for exterior and interior column splices in that particular story.
The force demands listed in Table 5-5 are very high. Values associated with story drifts more than about 6% may be of academic value, but accepting the 84th percentile values as realistic bounds shows that the splice moment may attain a value of 0.5Mp, where Mp is the unreduced bending strength of the column. This is a very large moment, considering that the bending strength of the column is about 2.3 times the bending strength of the beam. This large moment, in combination with a significant tensile force, necessitates careful design of the column splice. The results of the pushover and dynamic analyses indicate that the moment demands are significantly larger in the interior columns (where the tensile force is nonexistent or small) than in the exterior columns where the tensile force may be large.
From the structures studied in the SAC program, the splices illustrated here exhibited the largest demands. The results indicate that the splice should be designed for a significant fraction of Mp of the column (not for a multiple of the design moment at the splice) and for a tensile force estimated as discussed in Section 5.5.3. Much more detailed analytical and experimental research, which is outside the scope of this work, is required to properly understand and quantify the behavior and response of these potentially weak elements.
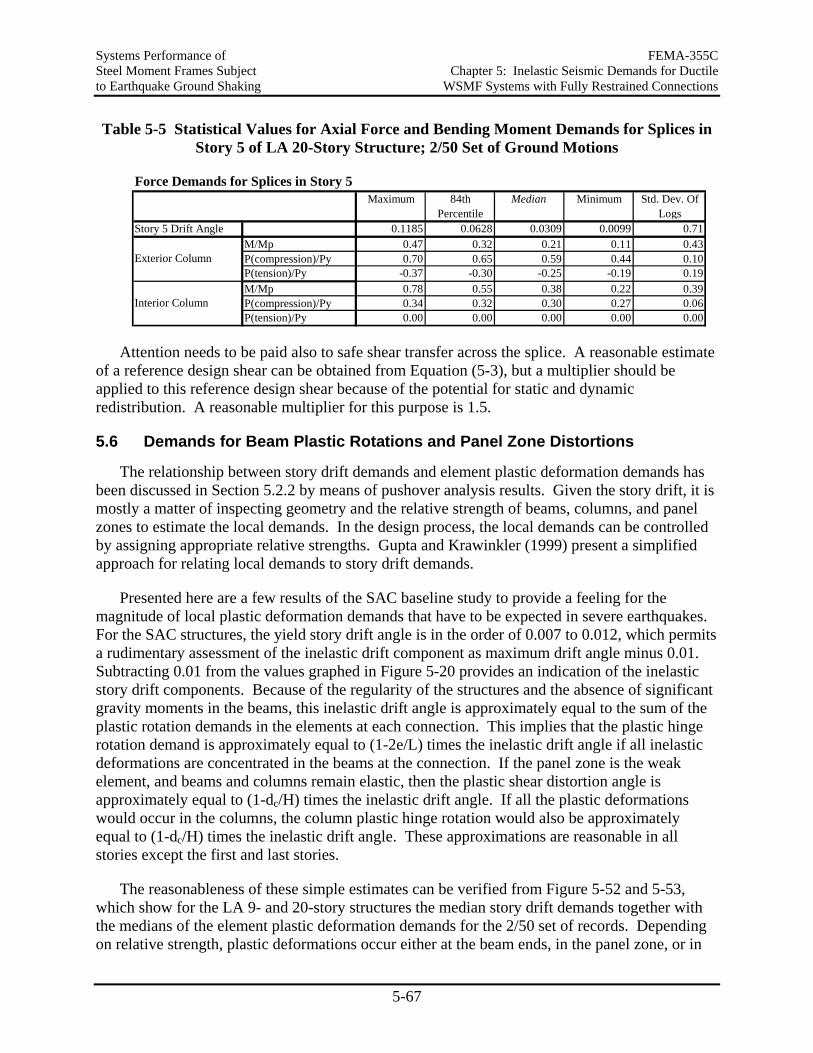
Systems Performance of FEMA-355C Steel Moment Frames Subject Chapter 5: Inelastic Seismic Demands for Ductile to Earthquake Ground Shaking WSMF Systems with Fully Restrained Connections
5-67
Table 5-5 Statistical Values for Axial Force and Bending Moment Demands for Splices in Story 5 of LA 20-Story Structure; 2/50 Set of Ground Motions
Force Demands for Splices in Story 5
Story 5 Drift Angle 0.1185 0.0628 0.0309 0.0099 0.71M/Mp 0.47 0.32 0.21 0.11 0.43P(compression)/Py 0.70 0.65 0.59 0.44 0.10P(tension)/Py -0.37 -0.30 -0.25 -0.19 0.19M/Mp 0.78 0.55 0.38 0.22 0.39P(compression)/Py 0.34 0.32 0.30 0.27 0.06P(tension)/Py 0.00 0.00 0.00 0.00 0.00
Minimum Std. Dev. Of Logs
Exterior Column
Interior Column
Maximum 84th Percentile
Median
Attention needs to be paid also to safe shear transfer across the splice. A reasonable estimate of a reference design shear can be obtained from Equation (5-3), but a multiplier should be applied to this reference design shear because of the potential for static and dynamic redistribution. A reasonable multiplier for this purpose is 1.5.
5.6 Demands for Beam Plastic Rotations and Panel Zone Distortions
The relationship between story drift demands and element plastic deformation demands has been discussed in Section 5.2.2 by means of pushover analysis results. Given the story drift, it is mostly a matter of inspecting geometry and the relative strength of beams, columns, and panel zones to estimate the local demands. In the design process, the local demands can be controlled by assigning appropriate relative strengths. Gupta and Krawinkler (1999) present a simplified approach for relating local demands to story drift demands.
Presented here are a few results of the SAC baseline study to provide a feeling for the magnitude of local plastic deformation demands that have to be expected in severe earthquakes. For the SAC structures, the yield story drift angle is in the order of 0.007 to 0.012, which permits a rudimentary assessment of the inelastic drift component as maximum drift angle minus 0.01. Subtracting 0.01 from the values graphed in Figure 5-20 provides an indication of the inelastic story drift components. Because of the regularity of the structures and the absence of significant gravity moments in the beams, this inelastic drift angle is approximately equal to the sum of the plastic rotation demands in the elements at each connection. This implies that the plastic hinge rotation demand is approximately equal to (1-2e/L) times the inelastic drift angle if all inelastic deformations are concentrated in the beams at the connection. If the panel zone is the weak element, and beams and columns remain elastic, then the plastic shear distortion angle is approximately equal to (1-dc/H) times the inelastic drift angle. If all the plastic deformations would occur in the columns, the column plastic hinge rotation would also be approximately equal to (1-dc/H) times the inelastic drift angle. These approximations are reasonable in all stories except the first and last stories.
The reasonableness of these simple estimates can be verified from Figure 5-52 and 5-53, which show for the LA 9- and 20-story structures the median story drift demands together with the medians of the element plastic deformation demands for the 2/50 set of records. Depending on relative strength, plastic deformations occur either at the beam ends, in the panel zone, or in
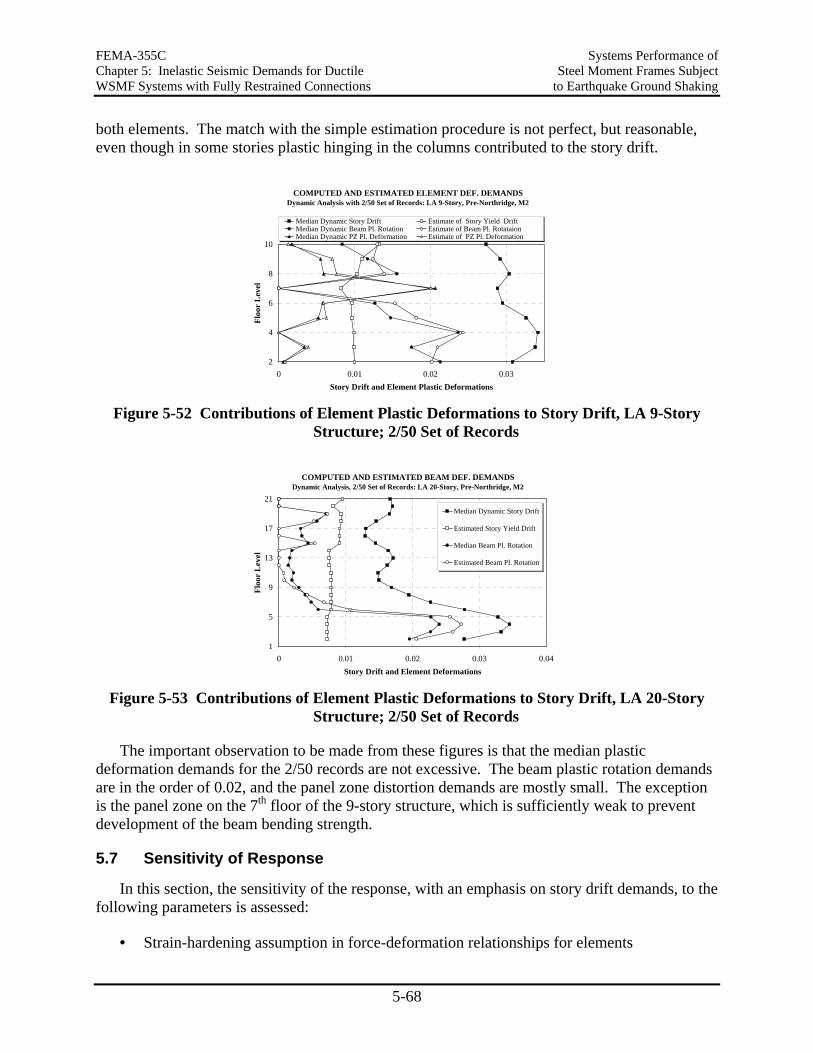
FEMA-355C Systems Performance of Chapter 5: Inelastic Seismic Demands for Ductile Steel Moment Frames Subject WSMF Systems with Fully Restrained Connections to Earthquake Ground Shaking
5-68
both elements. The match with the simple estimation procedure is not perfect, but reasonable, even though in some stories plastic hinging in the columns contributed to the story drift.
COMPUTED AND ESTIMATED ELEMENT DEF. DEMANDS Dynamic Analysis with 2/50 Set of Records: LA 9-Story, Pre-Northridge, M2
2
4
6
8
10
0 0.01 0.02 0.03Story Drift and Element Plastic Deformations
Floo
r L
evel
Median Dynamic Story Drift Estimate of Story Yield DriftMedian Dynamic Beam Pl. Rotation Estimate of Beam Pl. RotataionMedian Dynamic PZ Pl. Deformation Estimate of PZ Pl. Deformation
Figure 5-52 Contributions of Element Plastic Deformations to Story Drift, LA 9-Story
Structure; 2/50 Set of Records
COMPUTED AND ESTIMATED BEAM DEF. DEMANDS Dynamic Analysis, 2/50 Set of Records: LA 20-Story, Pre-Northridge, M2
1
5
9
13
17
21
0 0.01 0.02 0.03 0.04Story Drift and Element Deformations
Floo
r L
evel
Median Dynamic Story Drift
Estimated Story Yield Drift
Median Beam Pl. Rotation
Estimated Beam Pl. Rotation
Figure 5-53 Contributions of Element Plastic Deformations to Story Drift, LA 20-Story
Structure; 2/50 Set of Records
The important observation to be made from these figures is that the median plastic deformation demands for the 2/50 records are not excessive. The beam plastic rotation demands are in the order of 0.02, and the panel zone distortion demands are mostly small. The exception is the panel zone on the 7th floor of the 9-story structure, which is sufficiently weak to prevent development of the beam bending strength.
5.7 Sensitivity of Response
In this section, the sensitivity of the response, with an emphasis on story drift demands, to the following parameters is assessed:
• Strain-hardening assumption in force-deformation relationships for elements
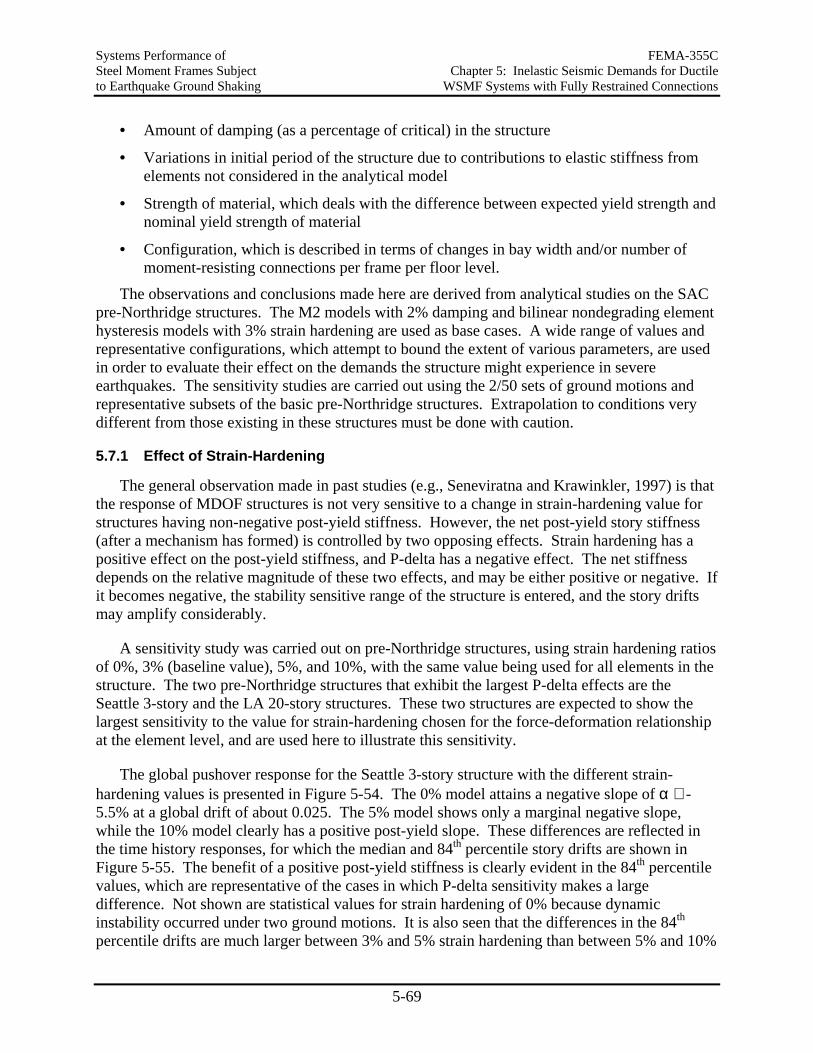
Systems Performance of FEMA-355C Steel Moment Frames Subject Chapter 5: Inelastic Seismic Demands for Ductile to Earthquake Ground Shaking WSMF Systems with Fully Restrained Connections
5-69
• Amount of damping (as a percentage of critical) in the structure
• Variations in initial period of the structure due to contributions to elastic stiffness from elements not considered in the analytical model
• Strength of material, which deals with the difference between expected yield strength and nominal yield strength of material
• Configuration, which is described in terms of changes in bay width and/or number of moment-resisting connections per frame per floor level.
The observations and conclusions made here are derived from analytical studies on the SAC pre-Northridge structures. The M2 models with 2% damping and bilinear nondegrading element hysteresis models with 3% strain hardening are used as base cases. A wide range of values and representative configurations, which attempt to bound the extent of various parameters, are used in order to evaluate their effect on the demands the structure might experience in severe earthquakes. The sensitivity studies are carried out using the 2/50 sets of ground motions and representative subsets of the basic pre-Northridge structures. Extrapolation to conditions very different from those existing in these structures must be done with caution.
5.7.1 Effect of Strain-Hardening
The general observation made in past studies (e.g., Seneviratna and Krawinkler, 1997) is that the response of MDOF structures is not very sensitive to a change in strain-hardening value for structures having non-negative post-yield stiffness. However, the net post-yield story stiffness (after a mechanism has formed) is controlled by two opposing effects. Strain hardening has a positive effect on the post-yield stiffness, and P-delta has a negative effect. The net stiffness depends on the relative magnitude of these two effects, and may be either positive or negative. If it becomes negative, the stability sensitive range of the structure is entered, and the story drifts may amplify considerably.
A sensitivity study was carried out on pre-Northridge structures, using strain hardening ratios of 0%, 3% (baseline value), 5%, and 10%, with the same value being used for all elements in the structure. The two pre-Northridge structures that exhibit the largest P-delta effects are the Seattle 3-story and the LA 20-story structures. These two structures are expected to show the largest sensitivity to the value for strain-hardening chosen for the force-deformation relationship at the element level, and are used here to illustrate this sensitivity.
The global pushover response for the Seattle 3-story structure with the different strain-hardening values is presented in Figure 5-54. The 0% model attains a negative slope of α ≅ -5.5% at a global drift of about 0.025. The 5% model shows only a marginal negative slope, while the 10% model clearly has a positive post-yield slope. These differences are reflected in the time history responses, for which the median and 84th percentile story drifts are shown in Figure 5-55. The benefit of a positive post-yield stiffness is clearly evident in the 84th percentile values, which are representative of the cases in which P-delta sensitivity makes a large difference. Not shown are statistical values for strain hardening of 0% because dynamic instability occurred under two ground motions. It is also seen that the differences in the 84th percentile drifts are much larger between 3% and 5% strain hardening than between 5% and 10%
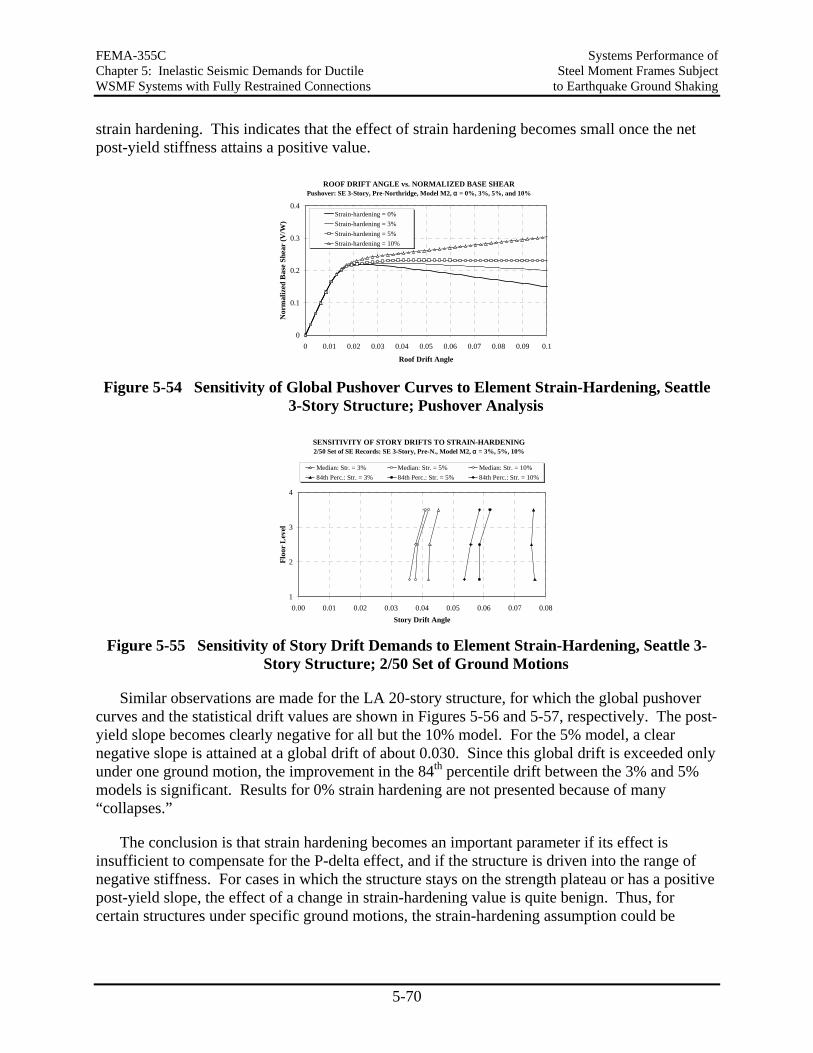
FEMA-355C Systems Performance of Chapter 5: Inelastic Seismic Demands for Ductile Steel Moment Frames Subject WSMF Systems with Fully Restrained Connections to Earthquake Ground Shaking
5-70
strain hardening. This indicates that the effect of strain hardening becomes small once the net post-yield stiffness attains a positive value.
ROOF DRIFT ANGLE vs. NORMALIZED BASE SHEARPushover: SE 3-Story, Pre-Northridge, Model M2, α = 0%, 3%, 5%, and 10%
0
0.1
0.2
0.3
0.4
0 0.01 0.02 0.03 0.04 0.05 0.06 0.07 0.08 0.09 0.1
Roof Drift Angle
Nor
mal
ized
Bas
e Sh
ear
(V/W
)
Strain-hardening = 0%Strain-hardening = 3%Strain-hardening = 5%Strain-hardening = 10%
Figure 5-54 Sensitivity of Global Pushover Curves to Element Strain-Hardening, Seattle
3-Story Structure; Pushover Analysis
SENSITIVITY OF STORY DRIFTS TO STRAIN-HARDENING 2/50 Set of SE Records: SE 3-Story, Pre-N., Model M2, α = 3%, 5%, 10%
1
2
3
4
0.00 0.01 0.02 0.03 0.04 0.05 0.06 0.07 0.08Story Drift Angle
Floo
r L
evel
Median: Str. = 3% Median: Str. = 5% Median: Str. = 10%84th Perc.: Str. = 3% 84th Perc.: Str. = 5% 84th Perc.: Str. = 10%
Figure 5-55 Sensitivity of Story Drift Demands to Element Strain-Hardening, Seattle 3-
Story Structure; 2/50 Set of Ground Motions
Similar observations are made for the LA 20-story structure, for which the global pushover curves and the statistical drift values are shown in Figures 5-56 and 5-57, respectively. The post-yield slope becomes clearly negative for all but the 10% model. For the 5% model, a clear negative slope is attained at a global drift of about 0.030. Since this global drift is exceeded only under one ground motion, the improvement in the 84th percentile drift between the 3% and 5% models is significant. Results for 0% strain hardening are not presented because of many “collapses.”
The conclusion is that strain hardening becomes an important parameter if its effect is insufficient to compensate for the P-delta effect, and if the structure is driven into the range of negative stiffness. For cases in which the structure stays on the strength plateau or has a positive post-yield slope, the effect of a change in strain-hardening value is quite benign. Thus, for certain structures under specific ground motions, the strain-hardening assumption could be
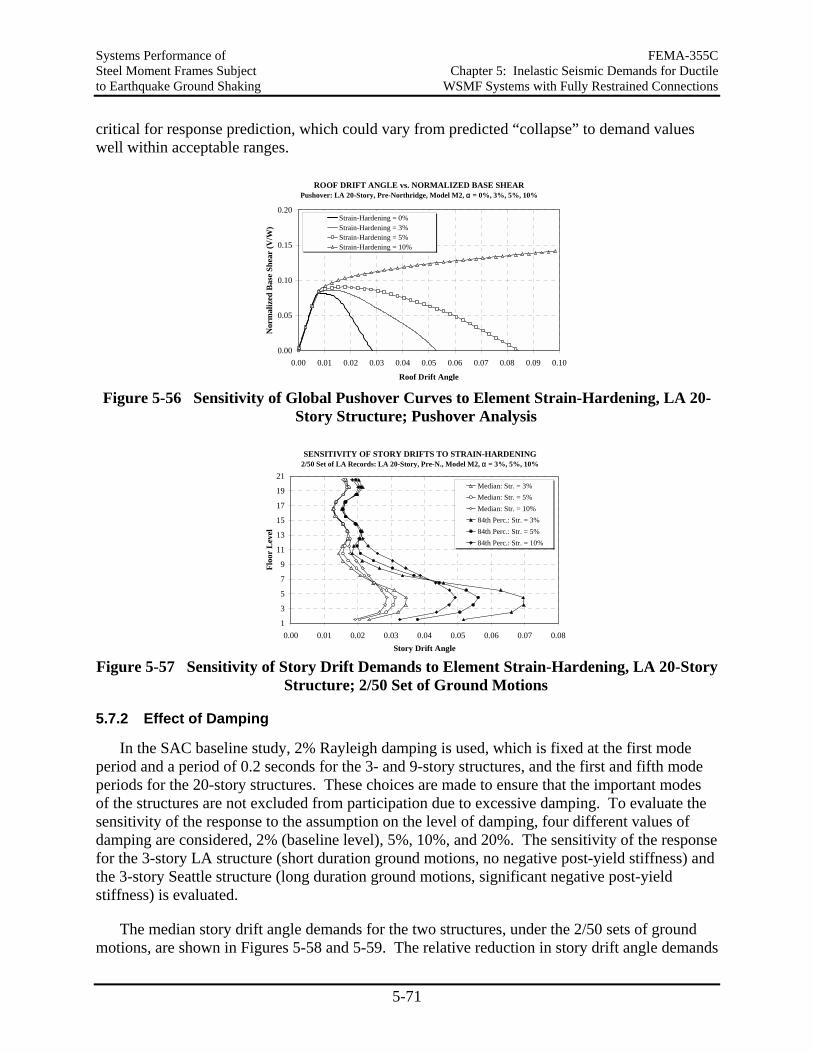
Systems Performance of FEMA-355C Steel Moment Frames Subject Chapter 5: Inelastic Seismic Demands for Ductile to Earthquake Ground Shaking WSMF Systems with Fully Restrained Connections
5-71
critical for response prediction, which could vary from predicted “collapse” to demand values well within acceptable ranges.
ROOF DRIFT ANGLE vs. NORMALIZED BASE SHEARPushover: LA 20-Story, Pre-Northridge, Model M2, α = 0%, 3%, 5%, 10%
0.00
0.05
0.10
0.15
0.20
0.00 0.01 0.02 0.03 0.04 0.05 0.06 0.07 0.08 0.09 0.10
Roof Drift Angle
Nor
mal
ized
Bas
e Sh
ear
(V/W
)
Strain-Hardening = 0%Strain-Hardening = 3%Strain-Hardening = 5%Strain-Hardening = 10%
Figure 5-56 Sensitivity of Global Pushover Curves to Element Strain-Hardening, LA 20-
Story Structure; Pushover Analysis
SENSITIVITY OF STORY DRIFTS TO STRAIN-HARDENING 2/50 Set of LA Records: LA 20-Story, Pre-N., Model M2, α = 3%, 5%, 10%
1
3
5
7
9
11
13
15
17
19
21
0.00 0.01 0.02 0.03 0.04 0.05 0.06 0.07 0.08Story Drift Angle
Floo
r L
evel
Median: Str. = 3%Median: Str. = 5%Median: Str. = 10%84th Perc.: Str. = 3%84th Perc.: Str. = 5%84th Perc.: Str. = 10%
Figure 5-57 Sensitivity of Story Drift Demands to Element Strain-Hardening, LA 20-Story
Structure; 2/50 Set of Ground Motions
5.7.2 Effect of Damping
In the SAC baseline study, 2% Rayleigh damping is used, which is fixed at the first mode period and a period of 0.2 seconds for the 3- and 9-story structures, and the first and fifth mode periods for the 20-story structures. These choices are made to ensure that the important modes of the structures are not excluded from participation due to excessive damping. To evaluate the sensitivity of the response to the assumption on the level of damping, four different values of damping are considered, 2% (baseline level), 5%, 10%, and 20%. The sensitivity of the response for the 3-story LA structure (short duration ground motions, no negative post-yield stiffness) and the 3-story Seattle structure (long duration ground motions, significant negative post-yield stiffness) is evaluated.
The median story drift angle demands for the two structures, under the 2/50 sets of ground motions, are shown in Figures 5-58 and 5-59. The relative reduction in story drift angle demands
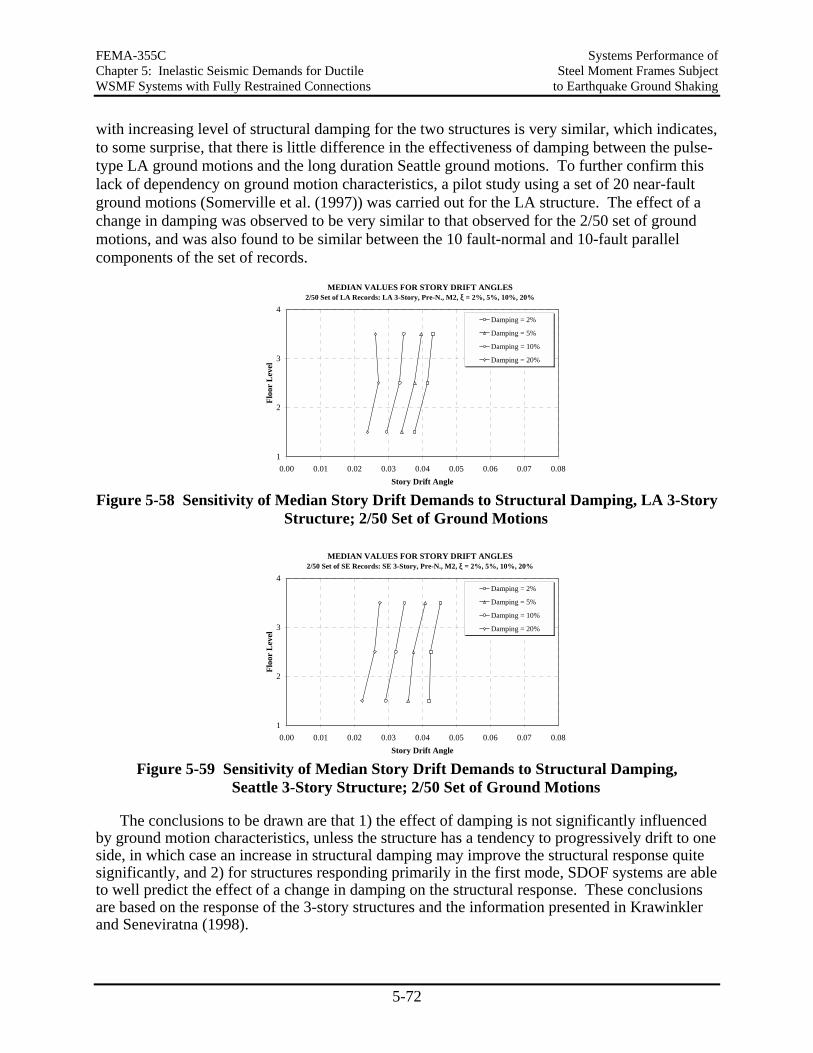
FEMA-355C Systems Performance of Chapter 5: Inelastic Seismic Demands for Ductile Steel Moment Frames Subject WSMF Systems with Fully Restrained Connections to Earthquake Ground Shaking
5-72
with increasing level of structural damping for the two structures is very similar, which indicates, to some surprise, that there is little difference in the effectiveness of damping between the pulse-type LA ground motions and the long duration Seattle ground motions. To further confirm this lack of dependency on ground motion characteristics, a pilot study using a set of 20 near-fault ground motions (Somerville et al. (1997)) was carried out for the LA structure. The effect of a change in damping was observed to be very similar to that observed for the 2/50 set of ground motions, and was also found to be similar between the 10 fault-normal and 10-fault parallel components of the set of records.
MEDIAN VALUES FOR STORY DRIFT ANGLES 2/50 Set of LA Records: LA 3-Story, Pre-N., M2, ξ = 2%, 5%, 10%, 20%
1
2
3
4
0.00 0.01 0.02 0.03 0.04 0.05 0.06 0.07 0.08Story Drift Angle
Floo
r L
evel
Damping = 2%
Damping = 5%
Damping = 10%
Damping = 20%
Figure 5-58 Sensitivity of Median Story Drift Demands to Structural Damping, LA 3-Story
Structure; 2/50 Set of Ground Motions
MEDIAN VALUES FOR STORY DRIFT ANGLES 2/50 Set of SE Records: SE 3-Story, Pre-N., M2, ξ = 2%, 5%, 10%, 20%
1
2
3
4
0.00 0.01 0.02 0.03 0.04 0.05 0.06 0.07 0.08Story Drift Angle
Floo
r L
evel
Damping = 2%
Damping = 5%
Damping = 10%
Damping = 20%
Figure 5-59 Sensitivity of Median Story Drift Demands to Structural Damping,
Seattle 3-Story Structure; 2/50 Set of Ground Motions
The conclusions to be drawn are that 1) the effect of damping is not significantly influenced by ground motion characteristics, unless the structure has a tendency to progressively drift to one side, in which case an increase in structural damping may improve the structural response quite significantly, and 2) for structures responding primarily in the first mode, SDOF systems are able to well predict the effect of a change in damping on the structural response. These conclusions are based on the response of the 3-story structures and the information presented in Krawinkler and Seneviratna (1998).
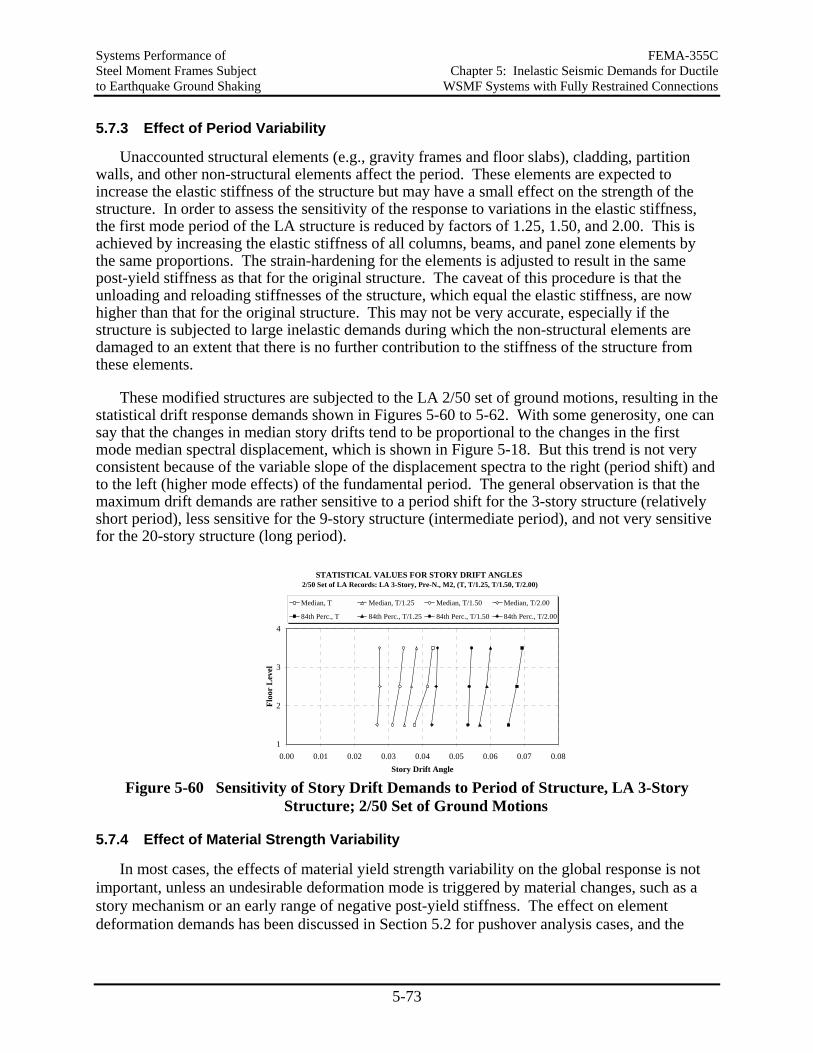
Systems Performance of FEMA-355C Steel Moment Frames Subject Chapter 5: Inelastic Seismic Demands for Ductile to Earthquake Ground Shaking WSMF Systems with Fully Restrained Connections
5-73
5.7.3 Effect of Period Variability
Unaccounted structural elements (e.g., gravity frames and floor slabs), cladding, partition walls, and other non-structural elements affect the period. These elements are expected to increase the elastic stiffness of the structure but may have a small effect on the strength of the structure. In order to assess the sensitivity of the response to variations in the elastic stiffness, the first mode period of the LA structure is reduced by factors of 1.25, 1.50, and 2.00. This is achieved by increasing the elastic stiffness of all columns, beams, and panel zone elements by the same proportions. The strain-hardening for the elements is adjusted to result in the same post-yield stiffness as that for the original structure. The caveat of this procedure is that the unloading and reloading stiffnesses of the structure, which equal the elastic stiffness, are now higher than that for the original structure. This may not be very accurate, especially if the structure is subjected to large inelastic demands during which the non-structural elements are damaged to an extent that there is no further contribution to the stiffness of the structure from these elements.
These modified structures are subjected to the LA 2/50 set of ground motions, resulting in the statistical drift response demands shown in Figures 5-60 to 5-62. With some generosity, one can say that the changes in median story drifts tend to be proportional to the changes in the first mode median spectral displacement, which is shown in Figure 5-18. But this trend is not very consistent because of the variable slope of the displacement spectra to the right (period shift) and to the left (higher mode effects) of the fundamental period. The general observation is that the maximum drift demands are rather sensitive to a period shift for the 3-story structure (relatively short period), less sensitive for the 9-story structure (intermediate period), and not very sensitive for the 20-story structure (long period).
STATISTICAL VALUES FOR STORY DRIFT ANGLES
2/50 Set of LA Records: LA 3-Story, Pre-N., M2, (T, T/1.25, T/1.50, T/2.00)
1
2
3
4
0.00 0.01 0.02 0.03 0.04 0.05 0.06 0.07 0.08Story Drift Angle
Floo
r L
evel
Median, T Median, T/1.25 Median, T/1.50 Median, T/2.00
84th Perc., T 84th Perc., T/1.25 84th Perc., T/1.50 84th Perc., T/2.00
Figure 5-60 Sensitivity of Story Drift Demands to Period of Structure, LA 3-Story
Structure; 2/50 Set of Ground Motions
5.7.4 Effect of Material Strength Variability
In most cases, the effects of material yield strength variability on the global response is not important, unless an undesirable deformation mode is triggered by material changes, such as a story mechanism or an early range of negative post-yield stiffness. The effect on element deformation demands has been discussed in Section 5.2 for pushover analysis cases, and the
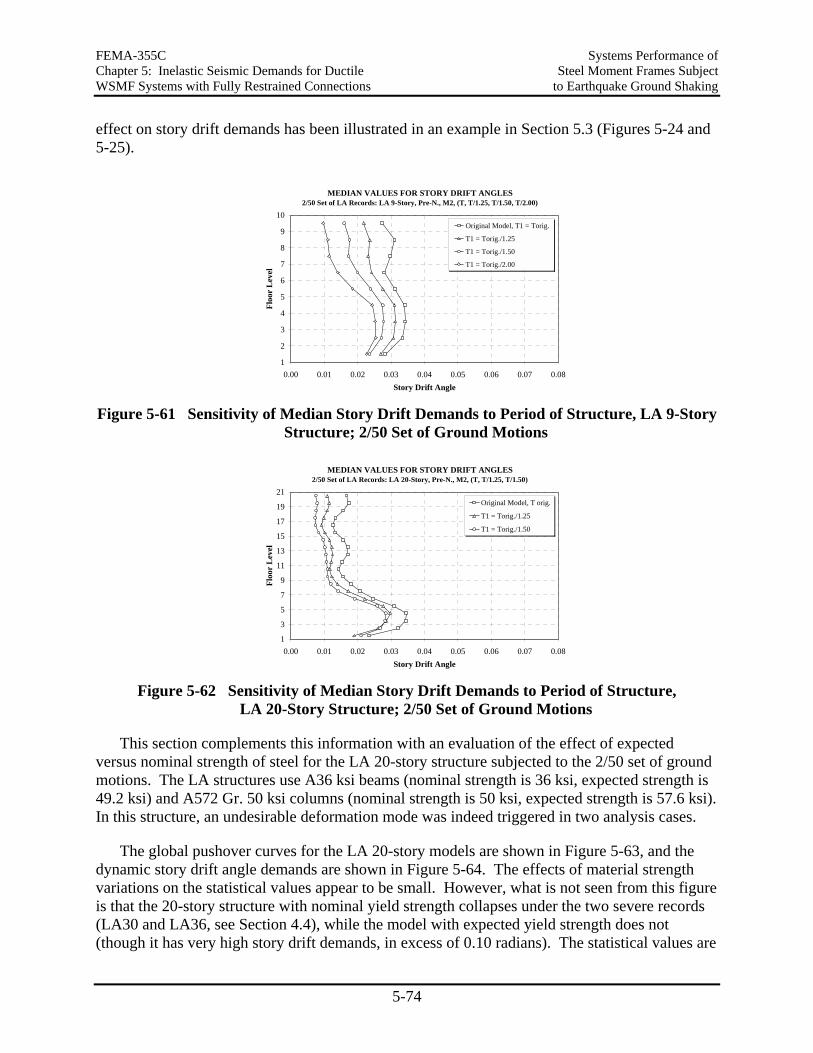
FEMA-355C Systems Performance of Chapter 5: Inelastic Seismic Demands for Ductile Steel Moment Frames Subject WSMF Systems with Fully Restrained Connections to Earthquake Ground Shaking
5-74
effect on story drift demands has been illustrated in an example in Section 5.3 (Figures 5-24 and 5-25).
MEDIAN VALUES FOR STORY DRIFT ANGLES 2/50 Set of LA Records: LA 9-Story, Pre-N., M2, (T, T/1.25, T/1.50, T/2.00)
1
2
3
4
5
6
7
8
9
10
0.00 0.01 0.02 0.03 0.04 0.05 0.06 0.07 0.08Story Drift Angle
Floo
r L
evel
Original Model, T1 = Torig.
T1 = Torig./1.25
T1 = Torig./1.50
T1 = Torig./2.00
Figure 5-61 Sensitivity of Median Story Drift Demands to Period of Structure, LA 9-Story
Structure; 2/50 Set of Ground Motions
MEDIAN VALUES FOR STORY DRIFT ANGLES 2/50 Set of LA Records: LA 20-Story, Pre-N., M2, (T, T/1.25, T/1.50)
1
3
5
7
9
11
13
15
17
19
21
0.00 0.01 0.02 0.03 0.04 0.05 0.06 0.07 0.08Story Drift Angle
Floo
r L
evel
Original Model, T orig.
T1 = Torig./1.25
T1 = Torig./1.50
Figure 5-62 Sensitivity of Median Story Drift Demands to Period of Structure,
LA 20-Story Structure; 2/50 Set of Ground Motions
This section complements this information with an evaluation of the effect of expected versus nominal strength of steel for the LA 20-story structure subjected to the 2/50 set of ground motions. The LA structures use A36 ksi beams (nominal strength is 36 ksi, expected strength is 49.2 ksi) and A572 Gr. 50 ksi columns (nominal strength is 50 ksi, expected strength is 57.6 ksi). In this structure, an undesirable deformation mode was indeed triggered in two analysis cases.
The global pushover curves for the LA 20-story models are shown in Figure 5-63, and the dynamic story drift angle demands are shown in Figure 5-64. The effects of material strength variations on the statistical values appear to be small. However, what is not seen from this figure is that the 20-story structure with nominal yield strength collapses under the two severe records (LA30 and LA36, see Section 4.4), while the model with expected yield strength does not (though it has very high story drift demands, in excess of 0.10 radians). The statistical values are
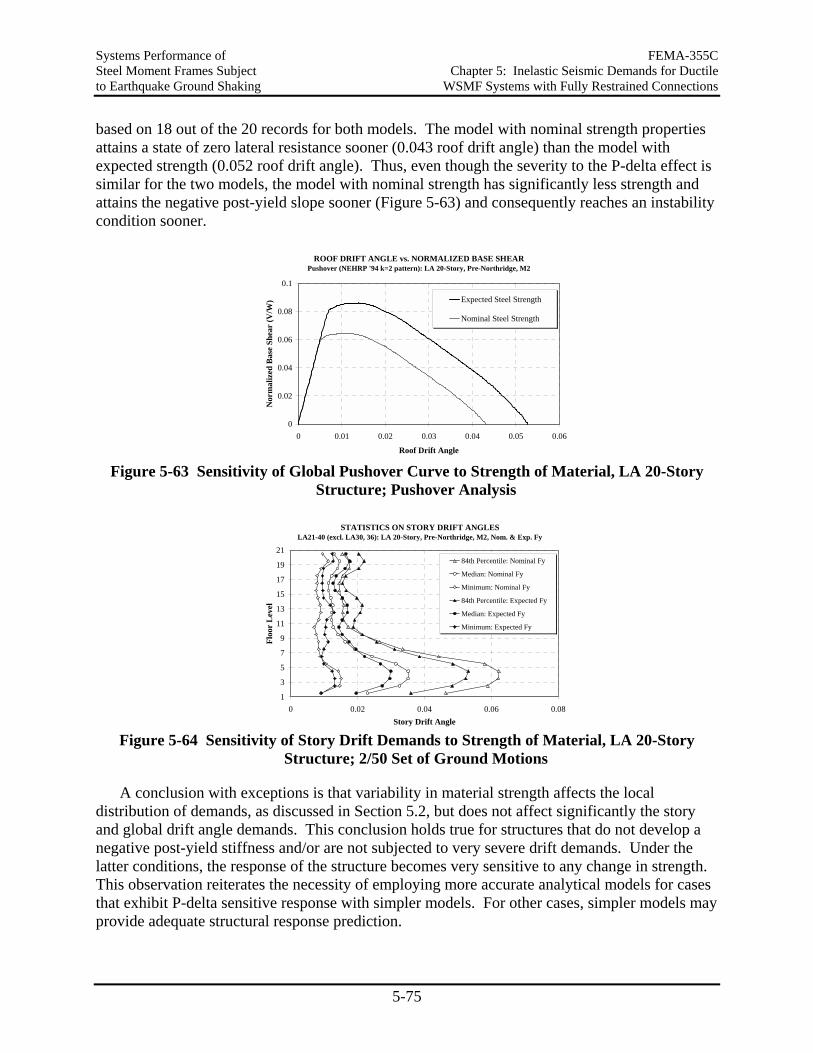
Systems Performance of FEMA-355C Steel Moment Frames Subject Chapter 5: Inelastic Seismic Demands for Ductile to Earthquake Ground Shaking WSMF Systems with Fully Restrained Connections
5-75
based on 18 out of the 20 records for both models. The model with nominal strength properties attains a state of zero lateral resistance sooner (0.043 roof drift angle) than the model with expected strength (0.052 roof drift angle). Thus, even though the severity to the P-delta effect is similar for the two models, the model with nominal strength has significantly less strength and attains the negative post-yield slope sooner (Figure 5-63) and consequently reaches an instability condition sooner.
ROOF DRIFT ANGLE vs. NORMALIZED BASE SHEARPushover (NEHRP '94 k=2 pattern): LA 20-Story, Pre-Northridge, M2
0
0.02
0.04
0.06
0.08
0.1
0 0.01 0.02 0.03 0.04 0.05 0.06
Roof Drift Angle
Nor
mal
ized
Bas
e Sh
ear
(V/W
) Expected Steel Strength
Nominal Steel Strength
Figure 5-63 Sensitivity of Global Pushover Curve to Strength of Material, LA 20-Story
Structure; Pushover Analysis
STATISTICS ON STORY DRIFT ANGLES LA21-40 (excl. LA30, 36): LA 20-Story, Pre-Northridge, M2, Nom. & Exp. Fy
1
3
5
7
9
11
13
15
17
19
21
0 0.02 0.04 0.06 0.08Story Drift Angle
Floo
r L
evel
84th Percentile: Nominal Fy
Median: Nominal Fy
Minimum: Nominal Fy
84th Percentile: Expected Fy
Median: Expected Fy
Minimum: Expected Fy
Figure 5-64 Sensitivity of Story Drift Demands to Strength of Material, LA 20-Story
Structure; 2/50 Set of Ground Motions
A conclusion with exceptions is that variability in material strength affects the local distribution of demands, as discussed in Section 5.2, but does not affect significantly the story and global drift angle demands. This conclusion holds true for structures that do not develop a negative post-yield stiffness and/or are not subjected to very severe drift demands. Under the latter conditions, the response of the structure becomes very sensitive to any change in strength. This observation reiterates the necessity of employing more accurate analytical models for cases that exhibit P-delta sensitive response with simpler models. For other cases, simpler models may provide adequate structural response prediction.
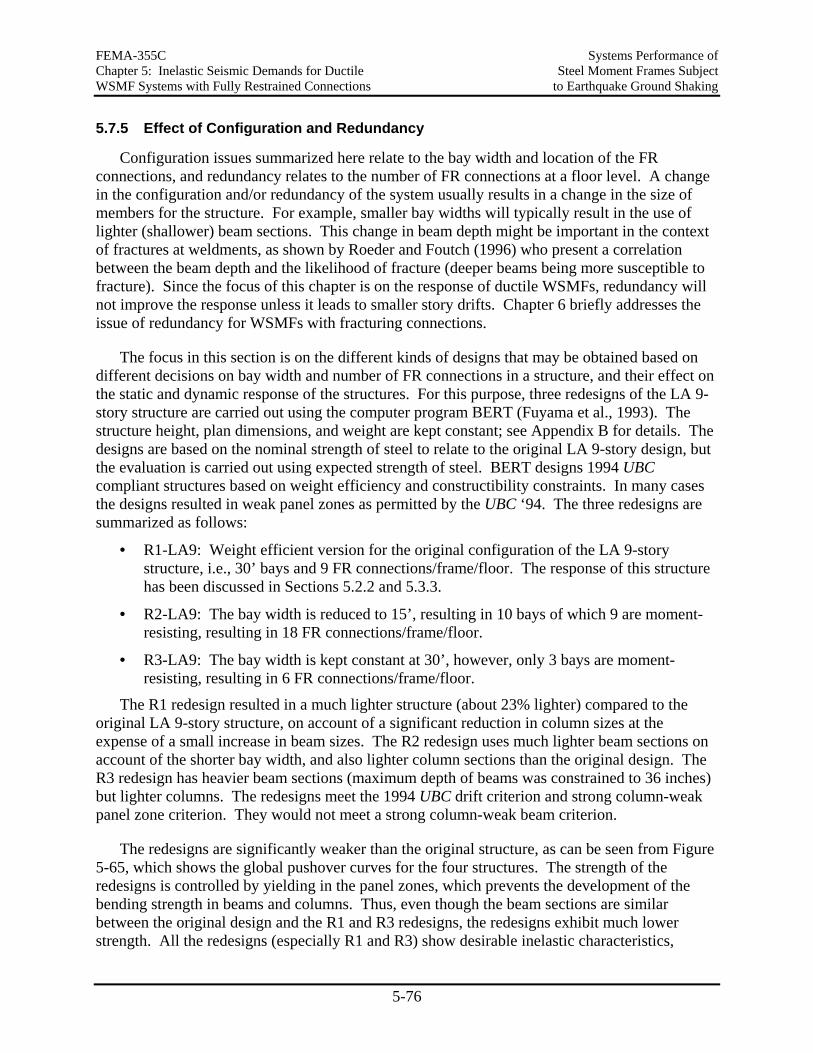
FEMA-355C Systems Performance of Chapter 5: Inelastic Seismic Demands for Ductile Steel Moment Frames Subject WSMF Systems with Fully Restrained Connections to Earthquake Ground Shaking
5-76
5.7.5 Effect of Configuration and Redundancy
Configuration issues summarized here relate to the bay width and location of the FR connections, and redundancy relates to the number of FR connections at a floor level. A change in the configuration and/or redundancy of the system usually results in a change in the size of members for the structure. For example, smaller bay widths will typically result in the use of lighter (shallower) beam sections. This change in beam depth might be important in the context of fractures at weldments, as shown by Roeder and Foutch (1996) who present a correlation between the beam depth and the likelihood of fracture (deeper beams being more susceptible to fracture). Since the focus of this chapter is on the response of ductile WSMFs, redundancy will not improve the response unless it leads to smaller story drifts. Chapter 6 briefly addresses the issue of redundancy for WSMFs with fracturing connections.
The focus in this section is on the different kinds of designs that may be obtained based on different decisions on bay width and number of FR connections in a structure, and their effect on the static and dynamic response of the structures. For this purpose, three redesigns of the LA 9-story structure are carried out using the computer program BERT (Fuyama et al., 1993). The structure height, plan dimensions, and weight are kept constant; see Appendix B for details. The designs are based on the nominal strength of steel to relate to the original LA 9-story design, but the evaluation is carried out using expected strength of steel. BERT designs 1994 UBC compliant structures based on weight efficiency and constructibility constraints. In many cases the designs resulted in weak panel zones as permitted by the UBC ‘94. The three redesigns are summarized as follows:
• R1-LA9: Weight efficient version for the original configuration of the LA 9-story structure, i.e., 30’ bays and 9 FR connections/frame/floor. The response of this structure has been discussed in Sections 5.2.2 and 5.3.3.
• R2-LA9: The bay width is reduced to 15’, resulting in 10 bays of which 9 are moment-resisting, resulting in 18 FR connections/frame/floor.
• R3-LA9: The bay width is kept constant at 30’, however, only 3 bays are moment-resisting, resulting in 6 FR connections/frame/floor.
The R1 redesign resulted in a much lighter structure (about 23% lighter) compared to the original LA 9-story structure, on account of a significant reduction in column sizes at the expense of a small increase in beam sizes. The R2 redesign uses much lighter beam sections on account of the shorter bay width, and also lighter column sections than the original design. The R3 redesign has heavier beam sections (maximum depth of beams was constrained to 36 inches) but lighter columns. The redesigns meet the 1994 UBC drift criterion and strong column-weak panel zone criterion. They would not meet a strong column-weak beam criterion.
The redesigns are significantly weaker than the original structure, as can be seen from Figure 5-65, which shows the global pushover curves for the four structures. The strength of the redesigns is controlled by yielding in the panel zones, which prevents the development of the bending strength in beams and columns. Thus, even though the beam sections are similar between the original design and the R1 and R3 redesigns, the redesigns exhibit much lower strength. All the redesigns (especially R1 and R3) show desirable inelastic characteristics,
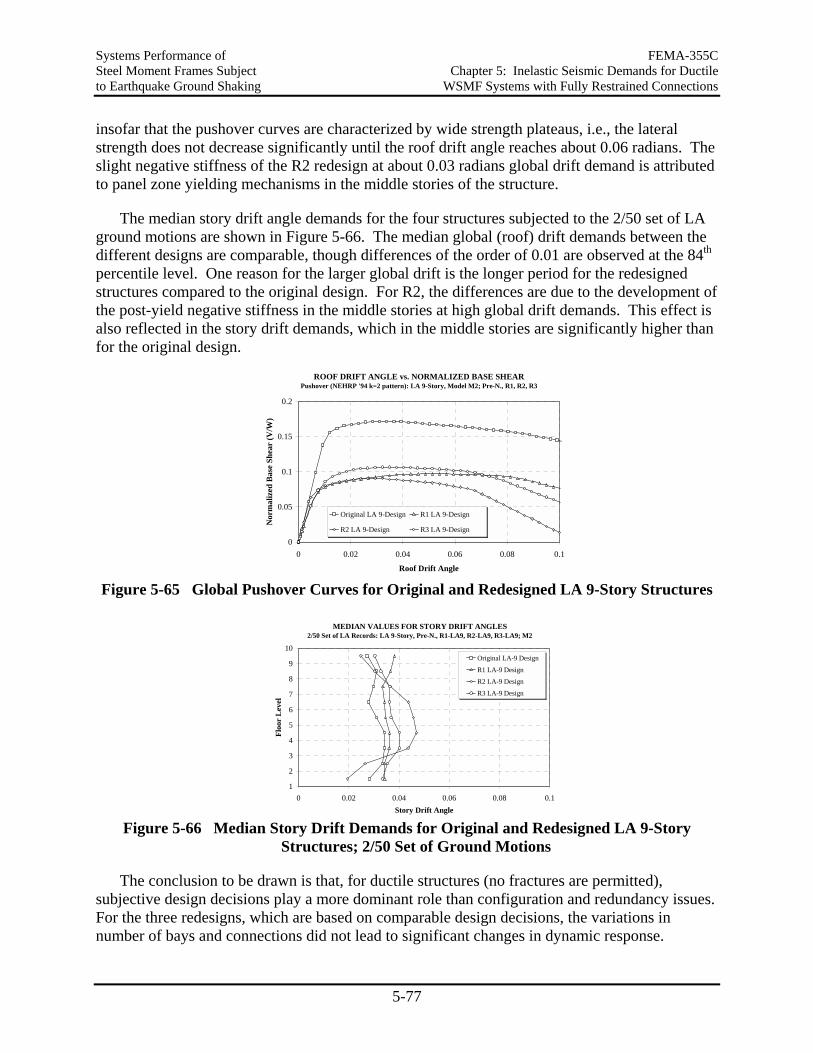
Systems Performance of FEMA-355C Steel Moment Frames Subject Chapter 5: Inelastic Seismic Demands for Ductile to Earthquake Ground Shaking WSMF Systems with Fully Restrained Connections
5-77
insofar that the pushover curves are characterized by wide strength plateaus, i.e., the lateral strength does not decrease significantly until the roof drift angle reaches about 0.06 radians. The slight negative stiffness of the R2 redesign at about 0.03 radians global drift demand is attributed to panel zone yielding mechanisms in the middle stories of the structure.
The median story drift angle demands for the four structures subjected to the 2/50 set of LA ground motions are shown in Figure 5-66. The median global (roof) drift demands between the different designs are comparable, though differences of the order of 0.01 are observed at the 84th percentile level. One reason for the larger global drift is the longer period for the redesigned structures compared to the original design. For R2, the differences are due to the development of the post-yield negative stiffness in the middle stories at high global drift demands. This effect is also reflected in the story drift demands, which in the middle stories are significantly higher than for the original design.
ROOF DRIFT ANGLE vs. NORMALIZED BASE SHEARPushover (NEHRP '94 k=2 pattern): LA 9-Story, Model M2; Pre-N., R1, R2, R3
0
0.05
0.1
0.15
0.2
0 0.02 0.04 0.06 0.08 0.1
Roof Drift Angle
Nor
mal
ized
Bas
e Sh
ear
(V/W
)
Original LA 9-Design R1 LA 9-Design
R2 LA 9-Design R3 LA 9-Design
Figure 5-65 Global Pushover Curves for Original and Redesigned LA 9-Story Structures
MEDIAN VALUES FOR STORY DRIFT ANGLES 2/50 Set of LA Records: LA 9-Story, Pre-N., R1-LA9, R2-LA9, R3-LA9; M2
1
2
3
4
5
6
7
8
9
10
0 0.02 0.04 0.06 0.08 0.1Story Drift Angle
Floo
r L
evel
Original LA-9 Design
R1 LA-9 Design
R2 LA-9 Design
R3 LA-9 Design
Figure 5-66 Median Story Drift Demands for Original and Redesigned LA 9-Story
Structures; 2/50 Set of Ground Motions
The conclusion to be drawn is that, for ductile structures (no fractures are permitted), subjective design decisions play a more dominant role than configuration and redundancy issues. For the three redesigns, which are based on comparable design decisions, the variations in number of bays and connections did not lead to significant changes in dynamic response.
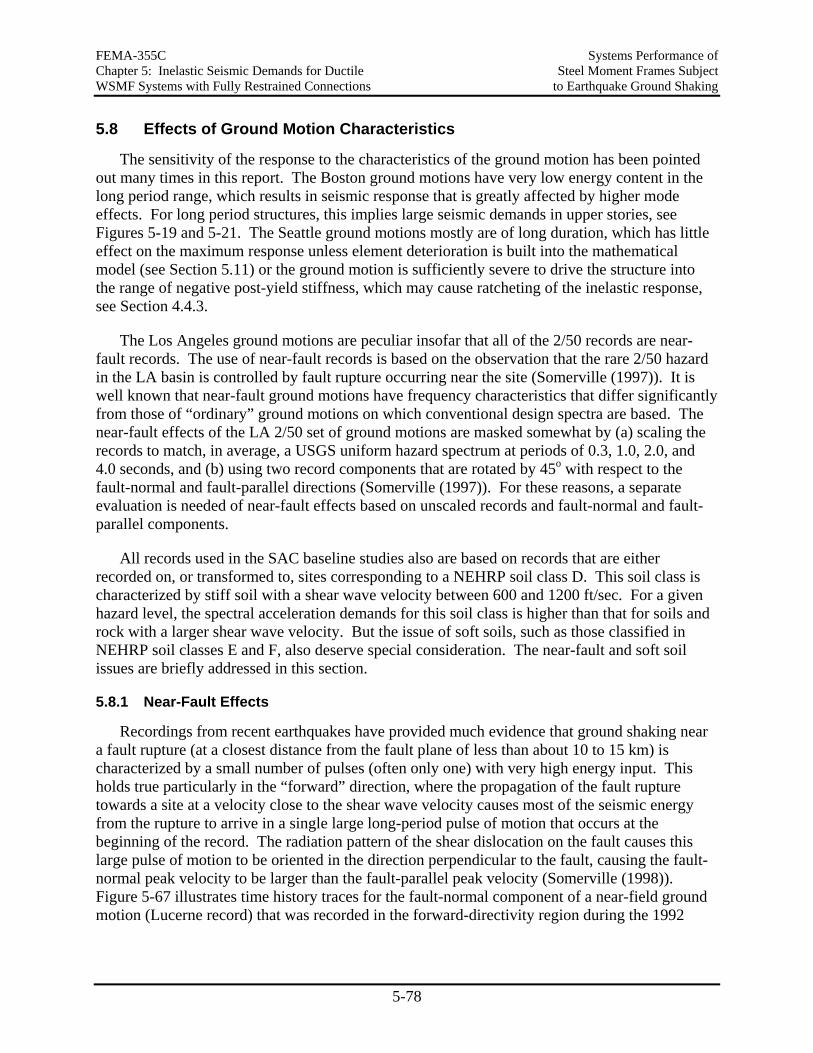
FEMA-355C Systems Performance of Chapter 5: Inelastic Seismic Demands for Ductile Steel Moment Frames Subject WSMF Systems with Fully Restrained Connections to Earthquake Ground Shaking
5-78
5.8 Effects of Ground Motion Characteristics
The sensitivity of the response to the characteristics of the ground motion has been pointed out many times in this report. The Boston ground motions have very low energy content in the long period range, which results in seismic response that is greatly affected by higher mode effects. For long period structures, this implies large seismic demands in upper stories, see Figures 5-19 and 5-21. The Seattle ground motions mostly are of long duration, which has little effect on the maximum response unless element deterioration is built into the mathematical model (see Section 5.11) or the ground motion is sufficiently severe to drive the structure into the range of negative post-yield stiffness, which may cause ratcheting of the inelastic response, see Section 4.4.3.
The Los Angeles ground motions are peculiar insofar that all of the 2/50 records are near-fault records. The use of near-fault records is based on the observation that the rare 2/50 hazard in the LA basin is controlled by fault rupture occurring near the site (Somerville (1997)). It is well known that near-fault ground motions have frequency characteristics that differ significantly from those of “ordinary” ground motions on which conventional design spectra are based. The near-fault effects of the LA 2/50 set of ground motions are masked somewhat by (a) scaling the records to match, in average, a USGS uniform hazard spectrum at periods of 0.3, 1.0, 2.0, and 4.0 seconds, and (b) using two record components that are rotated by 45o with respect to the fault-normal and fault-parallel directions (Somerville (1997)). For these reasons, a separate evaluation is needed of near-fault effects based on unscaled records and fault-normal and fault-parallel components.
All records used in the SAC baseline studies also are based on records that are either recorded on, or transformed to, sites corresponding to a NEHRP soil class D. This soil class is characterized by stiff soil with a shear wave velocity between 600 and 1200 ft/sec. For a given hazard level, the spectral acceleration demands for this soil class is higher than that for soils and rock with a larger shear wave velocity. But the issue of soft soils, such as those classified in NEHRP soil classes E and F, also deserve special consideration. The near-fault and soft soil issues are briefly addressed in this section.
5.8.1 Near-Fault Effects
Recordings from recent earthquakes have provided much evidence that ground shaking near a fault rupture (at a closest distance from the fault plane of less than about 10 to 15 km) is characterized by a small number of pulses (often only one) with very high energy input. This holds true particularly in the “forward” direction, where the propagation of the fault rupture towards a site at a velocity close to the shear wave velocity causes most of the seismic energy from the rupture to arrive in a single large long-period pulse of motion that occurs at the beginning of the record. The radiation pattern of the shear dislocation on the fault causes this large pulse of motion to be oriented in the direction perpendicular to the fault, causing the fault-normal peak velocity to be larger than the fault-parallel peak velocity (Somerville (1998)). Figure 5-67 illustrates time history traces for the fault-normal component of a near-field ground motion (Lucerne record) that was recorded in the forward-directivity region during the 1992
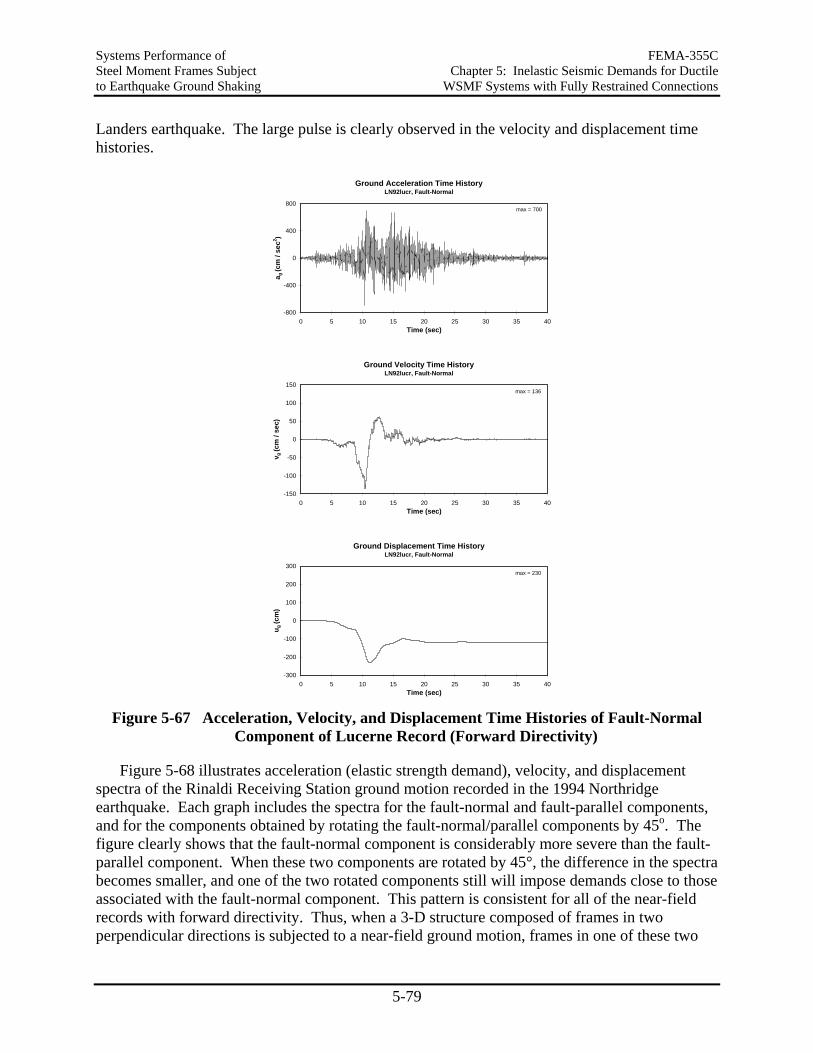
Systems Performance of FEMA-355C Steel Moment Frames Subject Chapter 5: Inelastic Seismic Demands for Ductile to Earthquake Ground Shaking WSMF Systems with Fully Restrained Connections
5-79
Landers earthquake. The large pulse is clearly observed in the velocity and displacement time histories.
Ground Acceleration Time HistoryLN92lucr, Fault-Normal
-800
-400
0
400
800
0 5 10 15 20 25 30 35 40Time (sec)
a g (c
m /
sec2 )
max = 700
Ground Velocity Time HistoryLN92lucr, Fault-Normal
-150
-100
-50
0
50
100
150
0 5 10 15 20 25 30 35 40Time (sec)
v g (c
m /
sec)
max = 136
Ground Displacement Time HistoryLN92lucr, Fault-Normal
-300
-200
-100
0
100
200
300
0 5 10 15 20 25 30 35 40Time (sec)
u g (c
m)
max = 230
Figure 5-67 Acceleration, Velocity, and Displacement Time Histories of Fault-Normal
Component of Lucerne Record (Forward Directivity)
Figure 5-68 illustrates acceleration (elastic strength demand), velocity, and displacement spectra of the Rinaldi Receiving Station ground motion recorded in the 1994 Northridge earthquake. Each graph includes the spectra for the fault-normal and fault-parallel components, and for the components obtained by rotating the fault-normal/parallel components by 45o. The figure clearly shows that the fault-normal component is considerably more severe than the fault-parallel component. When these two components are rotated by 45°, the difference in the spectra becomes smaller, and one of the two rotated components still will impose demands close to those associated with the fault-normal component. This pattern is consistent for all of the near-field records with forward directivity. Thus, when a 3-D structure composed of frames in two perpendicular directions is subjected to a near-field ground motion, frames in one of these two
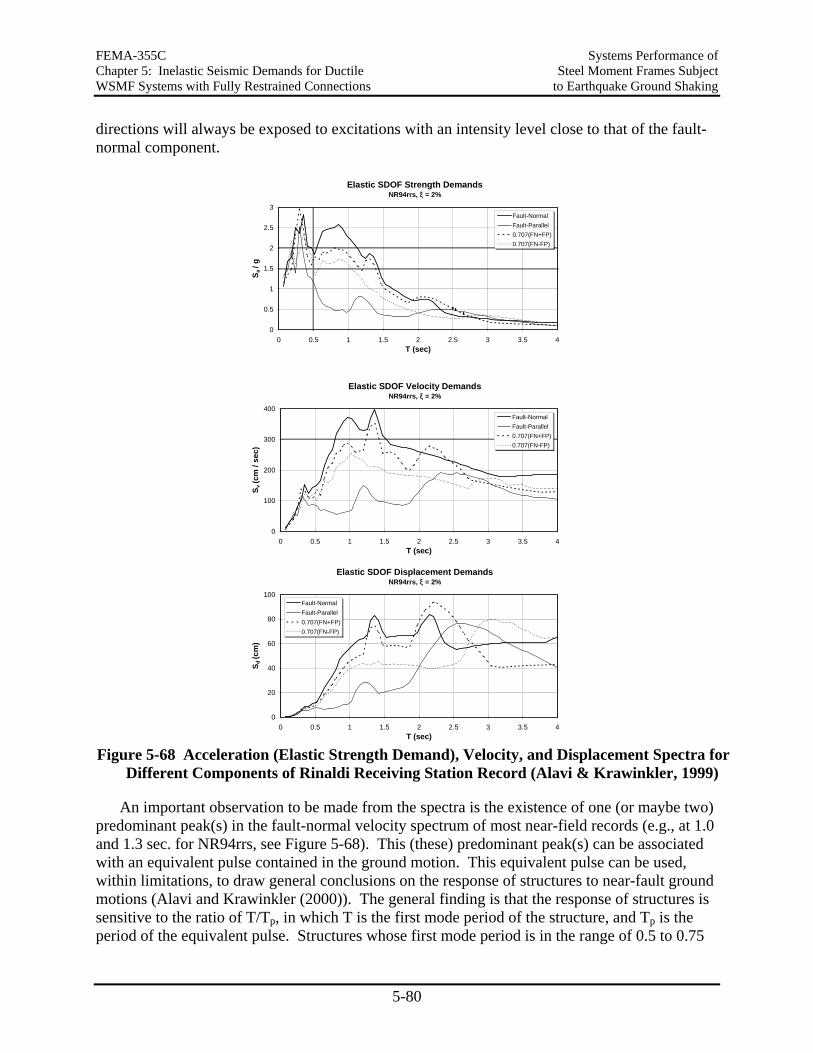
FEMA-355C Systems Performance of Chapter 5: Inelastic Seismic Demands for Ductile Steel Moment Frames Subject WSMF Systems with Fully Restrained Connections to Earthquake Ground Shaking
5-80
directions will always be exposed to excitations with an intensity level close to that of the fault-normal component.
Elastic SDOF Strength DemandsNR94rrs, ξ = 2%
0
0.5
1
1.5
2
2.5
3
0 0.5 1 1.5 2 2.5 3 3.5 4T (sec)
S a /
g
Fault-NormalFault-Parallel0.707(FN+FP)0.707(FN-FP)
Elastic SDOF Velocity DemandsNR94rrs, ξ = 2%
0
100
200
300
400
0 0.5 1 1.5 2 2.5 3 3.5 4T (sec)
S v (c
m /
sec)
Fault-NormalFault-Parallel0.707(FN+FP)0.707(FN-FP)
Elastic SDOF Displacement DemandsNR94rrs, ξ = 2%
0
20
40
60
80
100
0 0.5 1 1.5 2 2.5 3 3.5 4T (sec)
S d (c
m)
Fault-NormalFault-Parallel0.707(FN+FP)0.707(FN-FP)
Figure 5-68 Acceleration (Elastic Strength Demand), Velocity, and Displacement Spectra for
Different Components of Rinaldi Receiving Station Record (Alavi & Krawinkler, 1999)
An important observation to be made from the spectra is the existence of one (or maybe two) predominant peak(s) in the fault-normal velocity spectrum of most near-field records (e.g., at 1.0 and 1.3 sec. for NR94rrs, see Figure 5-68). This (these) predominant peak(s) can be associated with an equivalent pulse contained in the ground motion. This equivalent pulse can be used, within limitations, to draw general conclusions on the response of structures to near-fault ground motions (Alavi and Krawinkler (2000)). The general finding is that the response of structures is sensitive to the ratio of T/Tp, in which T is the first mode period of the structure, and Tp is the period of the equivalent pulse. Structures whose first mode period is in the range of 0.5 to 0.75
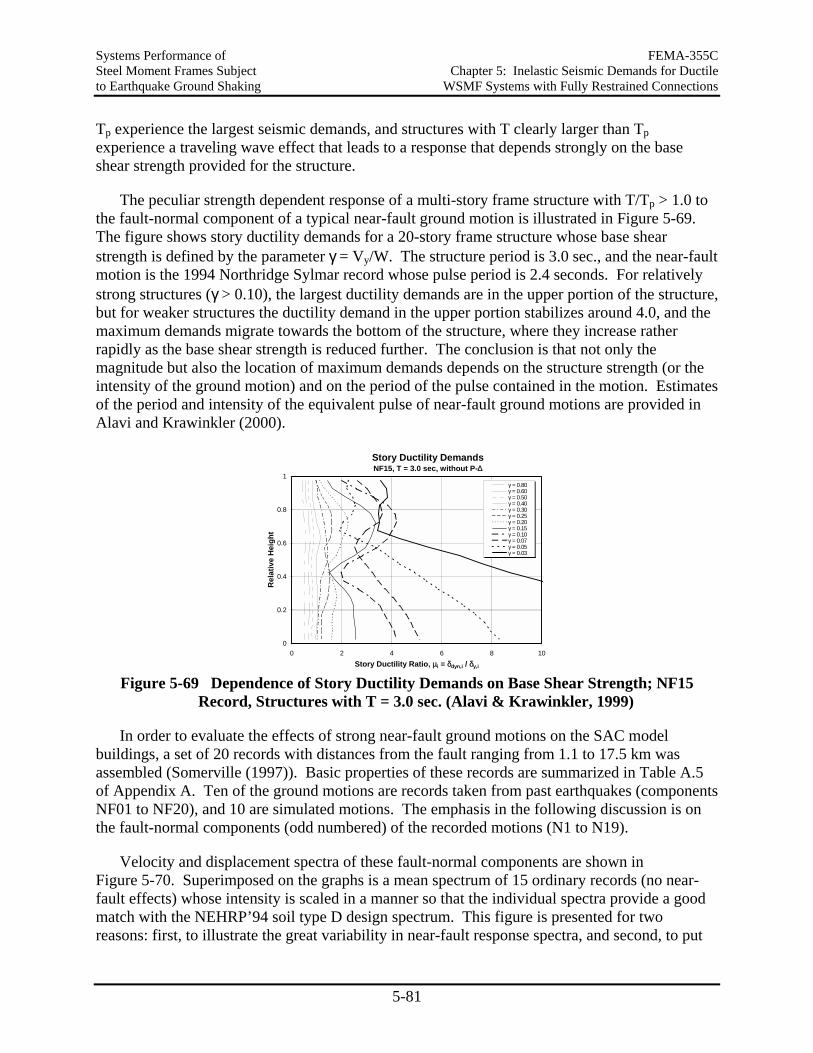
Systems Performance of FEMA-355C Steel Moment Frames Subject Chapter 5: Inelastic Seismic Demands for Ductile to Earthquake Ground Shaking WSMF Systems with Fully Restrained Connections
5-81
Tp experience the largest seismic demands, and structures with T clearly larger than Tp experience a traveling wave effect that leads to a response that depends strongly on the base shear strength provided for the structure.
The peculiar strength dependent response of a multi-story frame structure with T/Tp > 1.0 to the fault-normal component of a typical near-fault ground motion is illustrated in Figure 5-69. The figure shows story ductility demands for a 20-story frame structure whose base shear strength is defined by the parameter γ = Vy/W. The structure period is 3.0 sec., and the near-fault motion is the 1994 Northridge Sylmar record whose pulse period is 2.4 seconds. For relatively strong structures (γ > 0.10), the largest ductility demands are in the upper portion of the structure, but for weaker structures the ductility demand in the upper portion stabilizes around 4.0, and the maximum demands migrate towards the bottom of the structure, where they increase rather rapidly as the base shear strength is reduced further. The conclusion is that not only the magnitude but also the location of maximum demands depends on the structure strength (or the intensity of the ground motion) and on the period of the pulse contained in the motion. Estimates of the period and intensity of the equivalent pulse of near-fault ground motions are provided in Alavi and Krawinkler (2000).
Story Ductility DemandsNF15, T = 3.0 sec, without P-∆
0
0.2
0.4
0.6
0.8
1
0 2 4 6 8 10Story Ductility Ratio, µi = δdyn,i / δy,i
Rel
ativ
e H
eigh
t
γ = 0.80γ = 0.60γ = 0.50γ = 0.40γ = 0.30γ = 0.25γ = 0.20γ = 0.15γ = 0.10γ = 0.07γ = 0.05γ = 0.03
Figure 5-69 Dependence of Story Ductility Demands on Base Shear Strength; NF15
Record, Structures with T = 3.0 sec. (Alavi & Krawinkler, 1999)
In order to evaluate the effects of strong near-fault ground motions on the SAC model buildings, a set of 20 records with distances from the fault ranging from 1.1 to 17.5 km was assembled (Somerville (1997)). Basic properties of these records are summarized in Table A.5 of Appendix A. Ten of the ground motions are records taken from past earthquakes (components NF01 to NF20), and 10 are simulated motions. The emphasis in the following discussion is on the fault-normal components (odd numbered) of the recorded motions (N1 to N19).
Velocity and displacement spectra of these fault-normal components are shown in Figure 5-70. Superimposed on the graphs is a mean spectrum of 15 ordinary records (no near-fault effects) whose intensity is scaled in a manner so that the individual spectra provide a good match with the NEHRP’94 soil type D design spectrum. This figure is presented for two reasons: first, to illustrate the great variability in near-fault response spectra, and second, to put
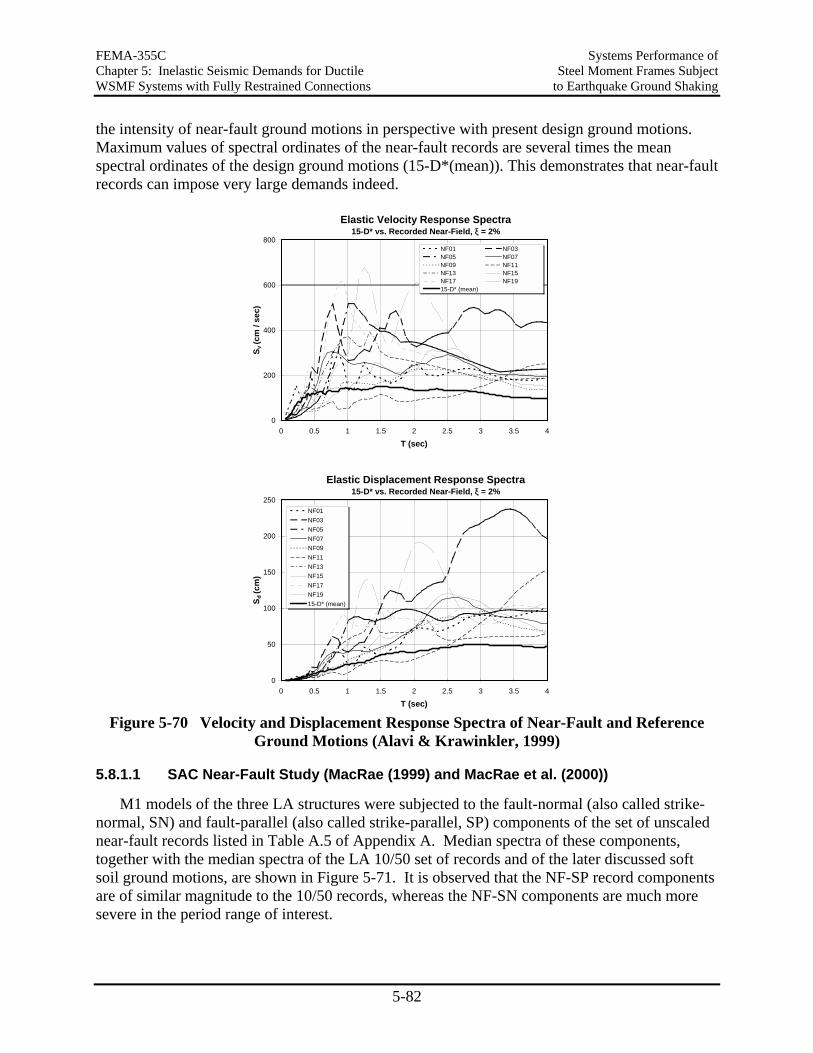
FEMA-355C Systems Performance of Chapter 5: Inelastic Seismic Demands for Ductile Steel Moment Frames Subject WSMF Systems with Fully Restrained Connections to Earthquake Ground Shaking
5-82
the intensity of near-fault ground motions in perspective with present design ground motions. Maximum values of spectral ordinates of the near-fault records are several times the mean spectral ordinates of the design ground motions (15-D*(mean)). This demonstrates that near-fault records can impose very large demands indeed.
Elastic Velocity Response Spectra 15-D* vs. Recorded Near-Field, ξ = 2%
0
200
400
600
800
0 0.5 1 1.5 2 2.5 3 3.5 4
T (sec)
S v (c
m /
sec)
NF01 NF03NF05 NF07NF09 NF11NF13 NF15NF17 NF1915-D* (mean)
Elastic Displacement Response Spectra 15-D* vs. Recorded Near-Field, ξ = 2%
0
50
100
150
200
250
0 0.5 1 1.5 2 2.5 3 3.5 4
T (sec)
S d (c
m)
NF01NF03NF05NF07NF09NF11NF13NF15NF17NF1915-D* (mean)
Figure 5-70 Velocity and Displacement Response Spectra of Near-Fault and Reference
Ground Motions (Alavi & Krawinkler, 1999)
5.8.1.1 SAC Near-Fault Study (MacRae (1999) and MacRae et al. (2000))
M1 models of the three LA structures were subjected to the fault-normal (also called strike-normal, SN) and fault-parallel (also called strike-parallel, SP) components of the set of unscaled near-fault records listed in Table A.5 of Appendix A. Median spectra of these components, together with the median spectra of the LA 10/50 set of records and of the later discussed soft soil ground motions, are shown in Figure 5-71. It is observed that the NF-SP record components are of similar magnitude to the 10/50 records, whereas the NF-SN components are much more severe in the period range of interest.
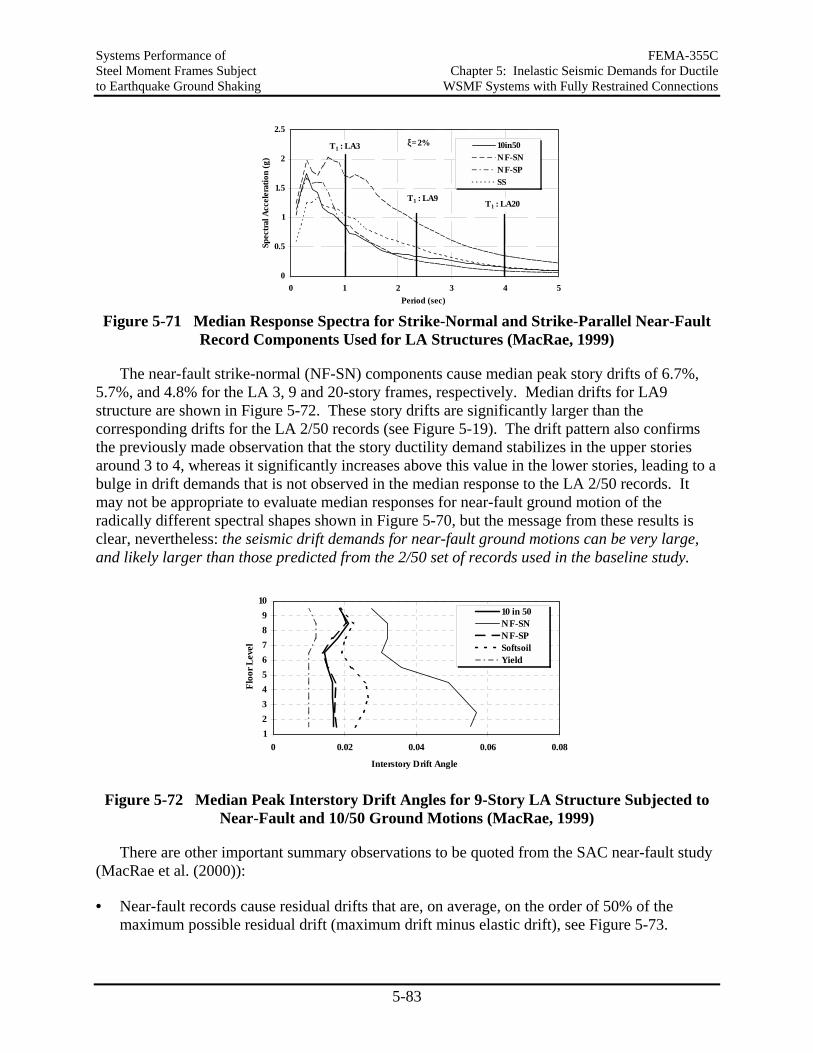
Systems Performance of FEMA-355C Steel Moment Frames Subject Chapter 5: Inelastic Seismic Demands for Ductile to Earthquake Ground Shaking WSMF Systems with Fully Restrained Connections
5-83
0
0.5
1
1.5
2
2.5
0 1 2 3 4 5Period (sec)
Spec
tral A
ccel
erat
ion
(g)
10in50NF-SNNF-SPSS
T1 : LA9 T1 : LA20
T1 : LA3 ξ=2%
Figure 5-71 Median Response Spectra for Strike-Normal and Strike-Parallel Near-Fault
Record Components Used for LA Structures (MacRae, 1999)
The near-fault strike-normal (NF-SN) components cause median peak story drifts of 6.7%, 5.7%, and 4.8% for the LA 3, 9 and 20-story frames, respectively. Median drifts for LA9 structure are shown in Figure 5-72. These story drifts are significantly larger than the corresponding drifts for the LA 2/50 records (see Figure 5-19). The drift pattern also confirms the previously made observation that the story ductility demand stabilizes in the upper stories around 3 to 4, whereas it significantly increases above this value in the lower stories, leading to a bulge in drift demands that is not observed in the median response to the LA 2/50 records. It may not be appropriate to evaluate median responses for near-fault ground motion of the radically different spectral shapes shown in Figure 5-70, but the message from these results is clear, nevertheless: the seismic drift demands for near-fault ground motions can be very large, and likely larger than those predicted from the 2/50 set of records used in the baseline study.
123456789
10
0 0.02 0.04 0.06 0.08
Interstory Drift Angle
Floo
r Lev
el
10 in 50NF-SNNF-SPSoftsoilYield
Figure 5-72 Median Peak Interstory Drift Angles for 9-Story LA Structure Subjected to
Near-Fault and 10/50 Ground Motions (MacRae, 1999)
There are other important summary observations to be quoted from the SAC near-fault study (MacRae et al. (2000)):
• Near-fault records cause residual drifts that are, on average, on the order of 50% of the maximum possible residual drift (maximum drift minus elastic drift), see Figure 5-73.
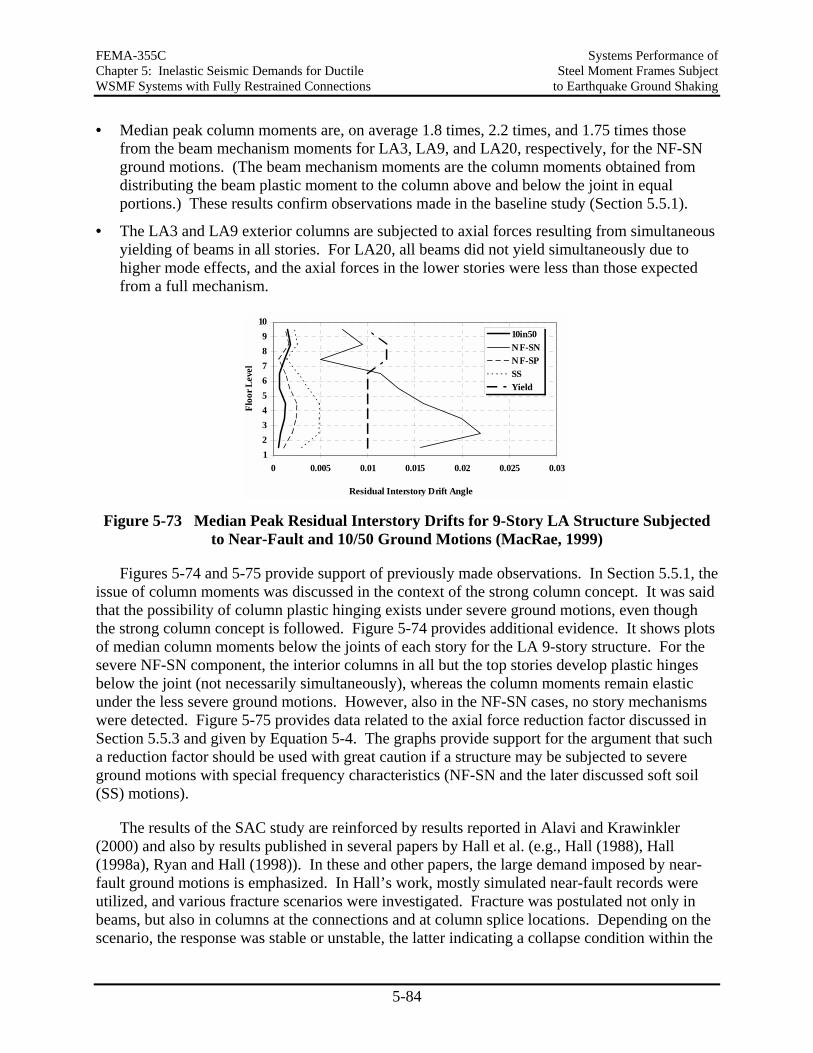
FEMA-355C Systems Performance of Chapter 5: Inelastic Seismic Demands for Ductile Steel Moment Frames Subject WSMF Systems with Fully Restrained Connections to Earthquake Ground Shaking
5-84
• Median peak column moments are, on average 1.8 times, 2.2 times, and 1.75 times those from the beam mechanism moments for LA3, LA9, and LA20, respectively, for the NF-SN ground motions. (The beam mechanism moments are the column moments obtained from distributing the beam plastic moment to the column above and below the joint in equal portions.) These results confirm observations made in the baseline study (Section 5.5.1).
• The LA3 and LA9 exterior columns are subjected to axial forces resulting from simultaneous yielding of beams in all stories. For LA20, all beams did not yield simultaneously due to higher mode effects, and the axial forces in the lower stories were less than those expected from a full mechanism.
123456789
10
0 0.005 0.01 0.015 0.02 0.025 0.03
Residual Interstory Drift Angle
Floo
r Lev
el
10in50NF-SNNF-SPSSYield
Figure 5-73 Median Peak Residual Interstory Drifts for 9-Story LA Structure Subjected
to Near-Fault and 10/50 Ground Motions (MacRae, 1999)
Figures 5-74 and 5-75 provide support of previously made observations. In Section 5.5.1, the issue of column moments was discussed in the context of the strong column concept. It was said that the possibility of column plastic hinging exists under severe ground motions, even though the strong column concept is followed. Figure 5-74 provides additional evidence. It shows plots of median column moments below the joints of each story for the LA 9-story structure. For the severe NF-SN component, the interior columns in all but the top stories develop plastic hinges below the joint (not necessarily simultaneously), whereas the column moments remain elastic under the less severe ground motions. However, also in the NF-SN cases, no story mechanisms were detected. Figure 5-75 provides data related to the axial force reduction factor discussed in Section 5.5.3 and given by Equation 5-4. The graphs provide support for the argument that such a reduction factor should be used with great caution if a structure may be subjected to severe ground motions with special frequency characteristics (NF-SN and the later discussed soft soil (SS) motions).
The results of the SAC study are reinforced by results reported in Alavi and Krawinkler (2000) and also by results published in several papers by Hall et al. (e.g., Hall (1988), Hall (1998a), Ryan and Hall (1998)). In these and other papers, the large demand imposed by near-fault ground motions is emphasized. In Hall’s work, mostly simulated near-fault records were utilized, and various fracture scenarios were investigated. Fracture was postulated not only in beams, but also in columns at the connections and at column splice locations. Depending on the scenario, the response was stable or unstable, the latter indicating a collapse condition within the
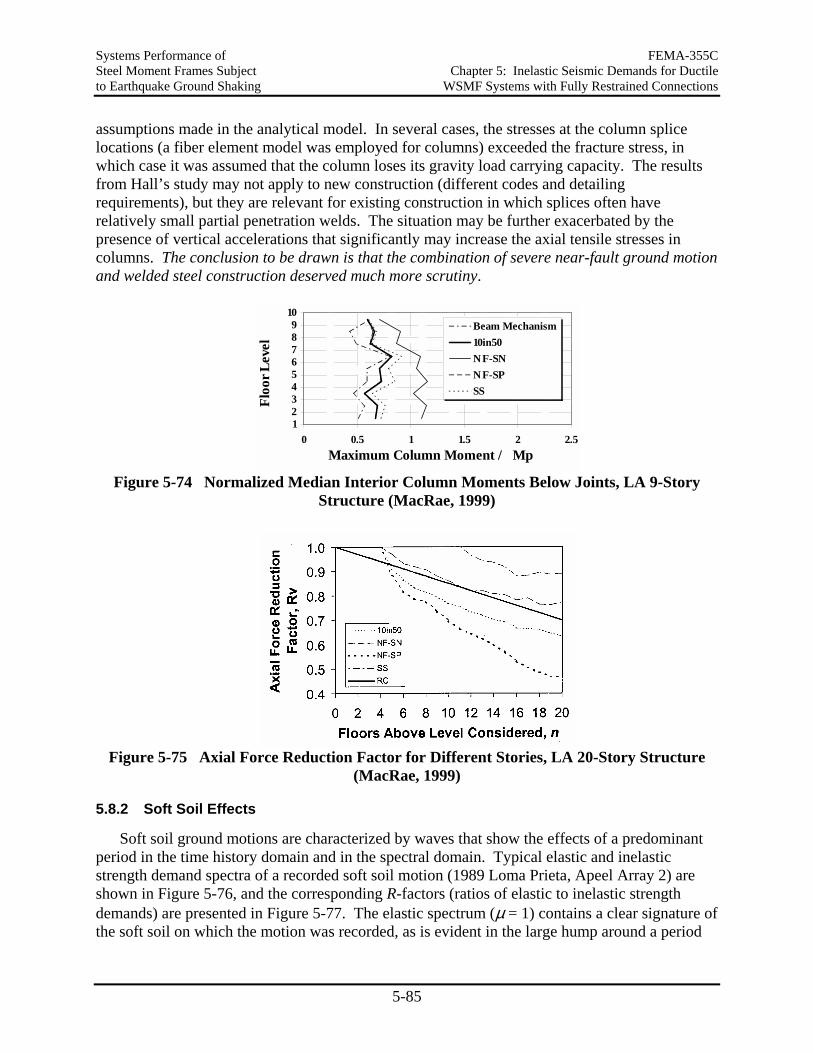
Systems Performance of FEMA-355C Steel Moment Frames Subject Chapter 5: Inelastic Seismic Demands for Ductile to Earthquake Ground Shaking WSMF Systems with Fully Restrained Connections
5-85
assumptions made in the analytical model. In several cases, the stresses at the column splice locations (a fiber element model was employed for columns) exceeded the fracture stress, in which case it was assumed that the column loses its gravity load carrying capacity. The results from Hall’s study may not apply to new construction (different codes and detailing requirements), but they are relevant for existing construction in which splices often have relatively small partial penetration welds. The situation may be further exacerbated by the presence of vertical accelerations that significantly may increase the axial tensile stresses in columns. The conclusion to be drawn is that the combination of severe near-fault ground motion and welded steel construction deserved much more scrutiny.
123456789
10
0 0.5 1 1.5 2 2.5Maximum Column Moment / Mp
Floo
r Lev
el
Beam Mechanism10in50NF-SNNF-SPSS
Figure 5-74 Normalized Median Interior Column Moments Below Joints, LA 9-Story
Structure (MacRae, 1999)
Figure 5-75 Axial Force Reduction Factor for Different Stories, LA 20-Story Structure
(MacRae, 1999)
5.8.2 Soft Soil Effects
Soft soil ground motions are characterized by waves that show the effects of a predominant period in the time history domain and in the spectral domain. Typical elastic and inelastic strength demand spectra of a recorded soft soil motion (1989 Loma Prieta, Apeel Array 2) are shown in Figure 5-76, and the corresponding R-factors (ratios of elastic to inelastic strength demands) are presented in Figure 5-77. The elastic spectrum (µ = 1) contains a clear signature of the soft soil on which the motion was recorded, as is evident in the large hump around a period
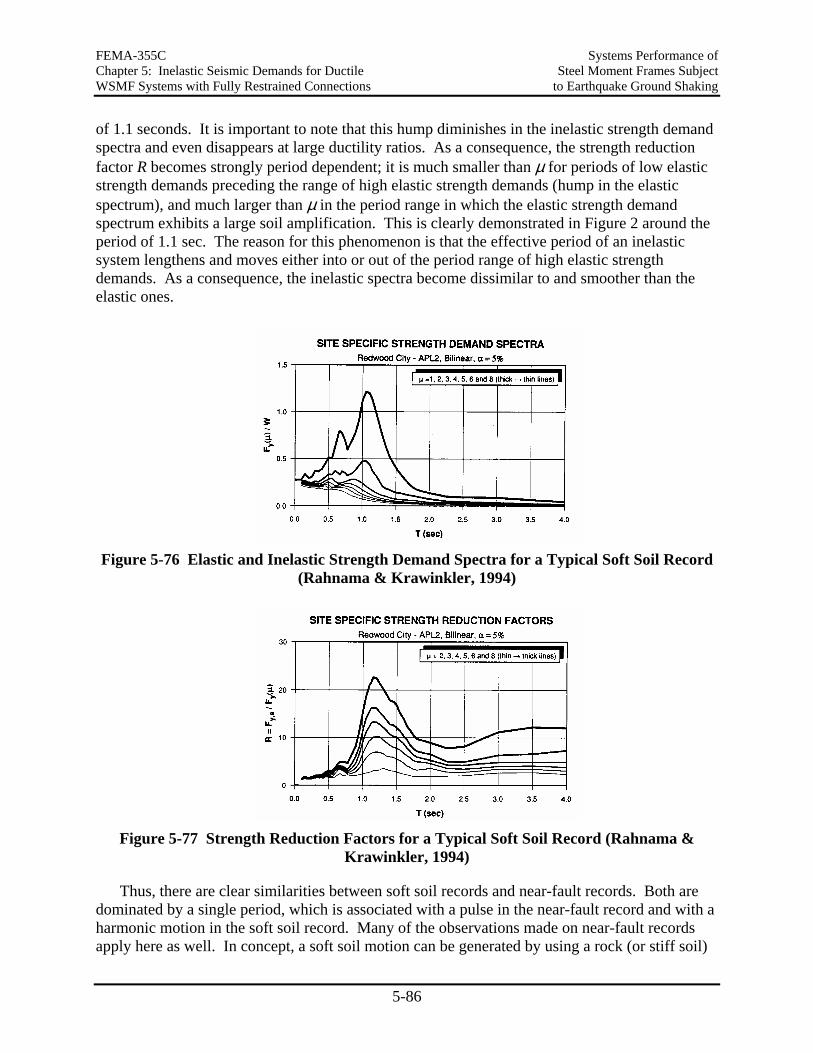
FEMA-355C Systems Performance of Chapter 5: Inelastic Seismic Demands for Ductile Steel Moment Frames Subject WSMF Systems with Fully Restrained Connections to Earthquake Ground Shaking
5-86
of 1.1 seconds. It is important to note that this hump diminishes in the inelastic strength demand spectra and even disappears at large ductility ratios. As a consequence, the strength reduction factor R becomes strongly period dependent; it is much smaller than µ for periods of low elastic strength demands preceding the range of high elastic strength demands (hump in the elastic spectrum), and much larger than µ in the period range in which the elastic strength demand spectrum exhibits a large soil amplification. This is clearly demonstrated in Figure 2 around the period of 1.1 sec. The reason for this phenomenon is that the effective period of an inelastic system lengthens and moves either into or out of the period range of high elastic strength demands. As a consequence, the inelastic spectra become dissimilar to and smoother than the elastic ones.
Figure 5-76 Elastic and Inelastic Strength Demand Spectra for a Typical Soft Soil Record
(Rahnama & Krawinkler, 1994)
Figure 5-77 Strength Reduction Factors for a Typical Soft Soil Record (Rahnama &
Krawinkler, 1994)
Thus, there are clear similarities between soft soil records and near-fault records. Both are dominated by a single period, which is associated with a pulse in the near-fault record and with a harmonic motion in the soft soil record. Many of the observations made on near-fault records apply here as well. In concept, a soft soil motion can be generated by using a rock (or stiff soil)
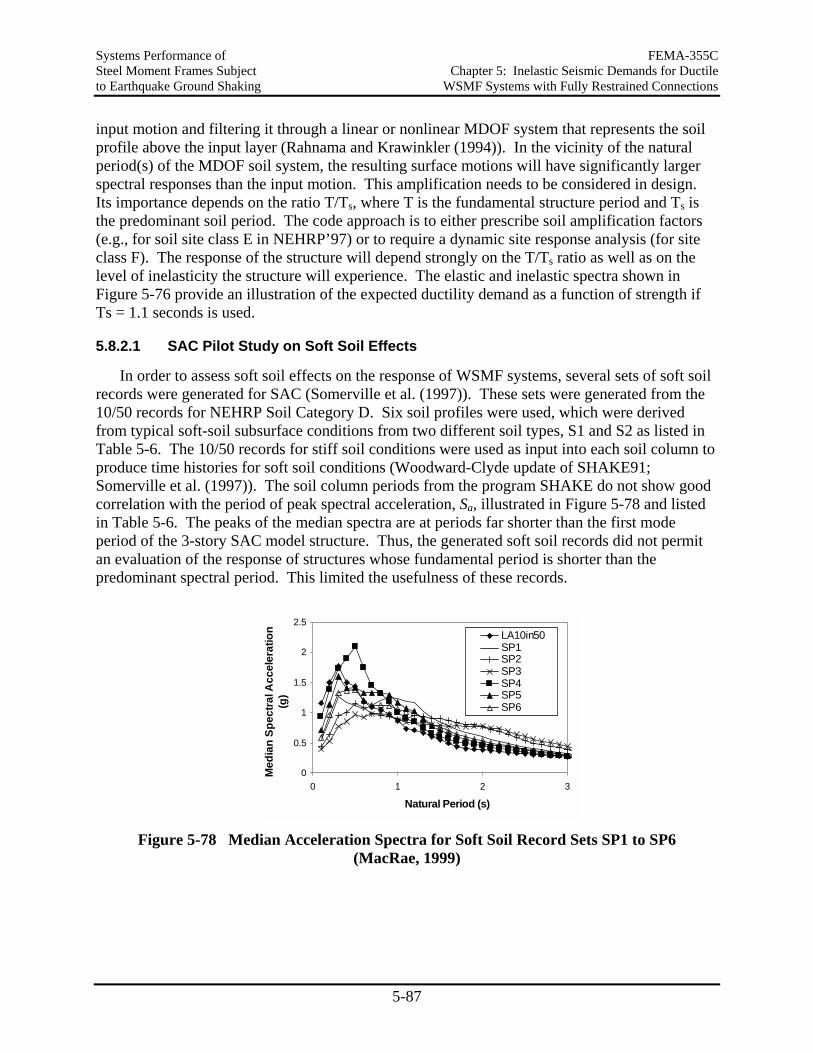
Systems Performance of FEMA-355C Steel Moment Frames Subject Chapter 5: Inelastic Seismic Demands for Ductile to Earthquake Ground Shaking WSMF Systems with Fully Restrained Connections
5-87
input motion and filtering it through a linear or nonlinear MDOF system that represents the soil profile above the input layer (Rahnama and Krawinkler (1994)). In the vicinity of the natural period(s) of the MDOF soil system, the resulting surface motions will have significantly larger spectral responses than the input motion. This amplification needs to be considered in design. Its importance depends on the ratio T/Ts, where T is the fundamental structure period and Ts is the predominant soil period. The code approach is to either prescribe soil amplification factors (e.g., for soil site class E in NEHRP’97) or to require a dynamic site response analysis (for site class F). The response of the structure will depend strongly on the T/Ts ratio as well as on the level of inelasticity the structure will experience. The elastic and inelastic spectra shown in Figure 5-76 provide an illustration of the expected ductility demand as a function of strength if Ts = 1.1 seconds is used.
5.8.2.1 SAC Pilot Study on Soft Soil Effects
In order to assess soft soil effects on the response of WSMF systems, several sets of soft soil records were generated for SAC (Somerville et al. (1997)). These sets were generated from the 10/50 records for NEHRP Soil Category D. Six soil profiles were used, which were derived from typical soft-soil subsurface conditions from two different soil types, S1 and S2 as listed in Table 5-6. The 10/50 records for stiff soil conditions were used as input into each soil column to produce time histories for soft soil conditions (Woodward-Clyde update of SHAKE91; Somerville et al. (1997)). The soil column periods from the program SHAKE do not show good correlation with the period of peak spectral acceleration, Sa, illustrated in Figure 5-78 and listed in Table 5-6. The peaks of the median spectra are at periods far shorter than the first mode period of the 3-story SAC model structure. Thus, the generated soft soil records did not permit an evaluation of the response of structures whose fundamental period is shorter than the predominant spectral period. This limited the usefulness of these records.
0
0.5
1
1.5
2
2.5
0 1 2 3
Natural Period (s)
Med
ian
Spec
tral A
ccel
erat
ion
(g)
LA10in50SP1SP2SP3SP4SP5SP6
Figure 5-78 Median Acceleration Spectra for Soft Soil Record Sets SP1 to SP6
(MacRae, 1999)
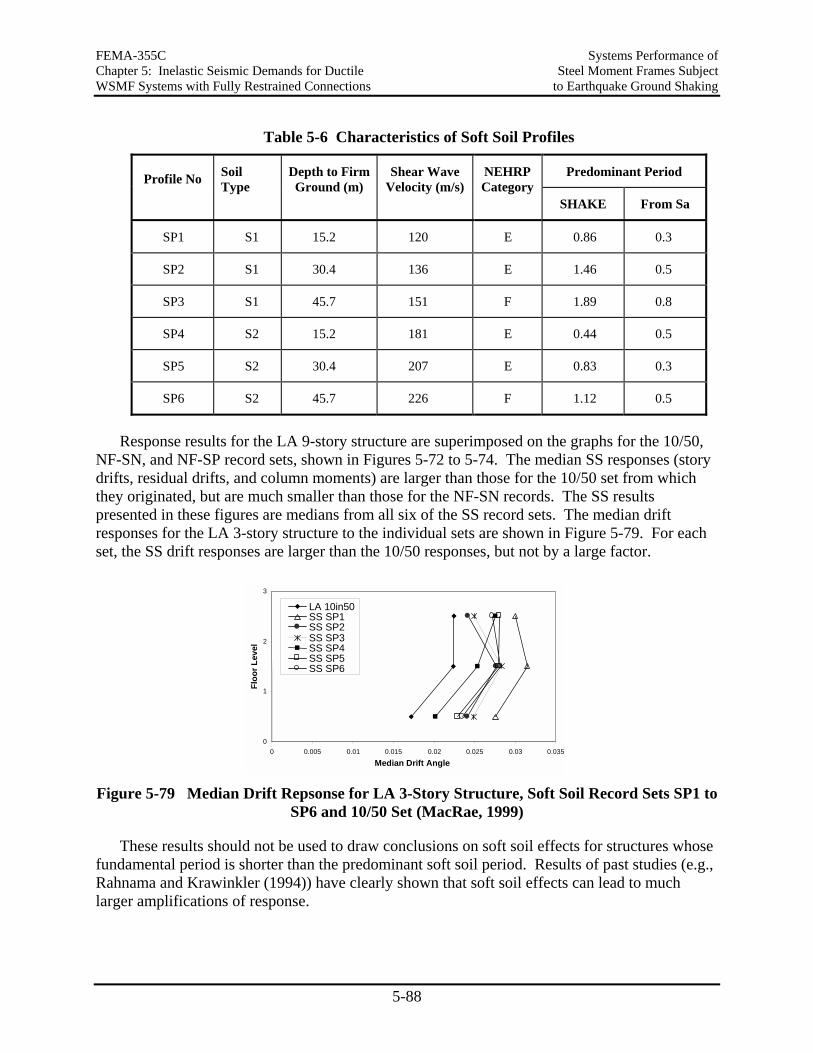
FEMA-355C Systems Performance of Chapter 5: Inelastic Seismic Demands for Ductile Steel Moment Frames Subject WSMF Systems with Fully Restrained Connections to Earthquake Ground Shaking
5-88
Table 5-6 Characteristics of Soft Soil Profiles
Predominant Period Profile No Soil
Type Depth to Firm Ground (m)
Shear Wave Velocity (m/s)
NEHRPCategory
SHAKE From Sa
SP1 S1 15.2 120 E 0.86 0.3
SP2 S1 30.4 136 E 1.46 0.5
SP3 S1 45.7 151 F 1.89 0.8
SP4 S2 15.2 181 E 0.44 0.5
SP5 S2 30.4 207 E 0.83 0.3
SP6 S2 45.7 226 F 1.12 0.5
Response results for the LA 9-story structure are superimposed on the graphs for the 10/50, NF-SN, and NF-SP record sets, shown in Figures 5-72 to 5-74. The median SS responses (story drifts, residual drifts, and column moments) are larger than those for the 10/50 set from which they originated, but are much smaller than those for the NF-SN records. The SS results presented in these figures are medians from all six of the SS record sets. The median drift responses for the LA 3-story structure to the individual sets are shown in Figure 5-79. For each set, the SS drift responses are larger than the 10/50 responses, but not by a large factor.
0
1
2
3
0 0.005 0.01 0.015 0.02 0.025 0.03 0.035
Median Drift Angle
Floo
r Lev
el
LA 10in50SS SP1SS SP2SS SP3SS SP4SS SP5SS SP6
Figure 5-79 Median Drift Repsonse for LA 3-Story Structure, Soft Soil Record Sets SP1 to
SP6 and 10/50 Set (MacRae, 1999)
These results should not be used to draw conclusions on soft soil effects for structures whose fundamental period is shorter than the predominant soft soil period. Results of past studies (e.g., Rahnama and Krawinkler (1994)) have clearly shown that soft soil effects can lead to much larger amplifications of response.
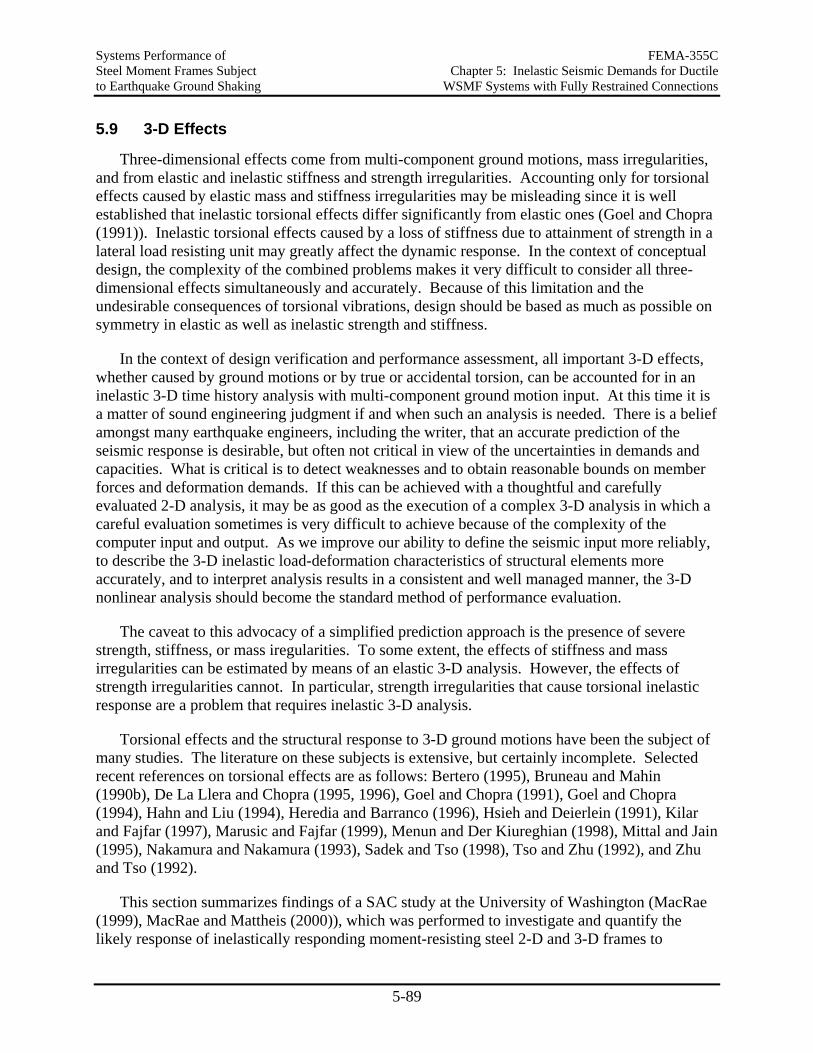
Systems Performance of FEMA-355C Steel Moment Frames Subject Chapter 5: Inelastic Seismic Demands for Ductile to Earthquake Ground Shaking WSMF Systems with Fully Restrained Connections
5-89
5.9 3-D Effects
Three-dimensional effects come from multi-component ground motions, mass irregularities, and from elastic and inelastic stiffness and strength irregularities. Accounting only for torsional effects caused by elastic mass and stiffness irregularities may be misleading since it is well established that inelastic torsional effects differ significantly from elastic ones (Goel and Chopra (1991)). Inelastic torsional effects caused by a loss of stiffness due to attainment of strength in a lateral load resisting unit may greatly affect the dynamic response. In the context of conceptual design, the complexity of the combined problems makes it very difficult to consider all three-dimensional effects simultaneously and accurately. Because of this limitation and the undesirable consequences of torsional vibrations, design should be based as much as possible on symmetry in elastic as well as inelastic strength and stiffness.
In the context of design verification and performance assessment, all important 3-D effects, whether caused by ground motions or by true or accidental torsion, can be accounted for in an inelastic 3-D time history analysis with multi-component ground motion input. At this time it is a matter of sound engineering judgment if and when such an analysis is needed. There is a belief amongst many earthquake engineers, including the writer, that an accurate prediction of the seismic response is desirable, but often not critical in view of the uncertainties in demands and capacities. What is critical is to detect weaknesses and to obtain reasonable bounds on member forces and deformation demands. If this can be achieved with a thoughtful and carefully evaluated 2-D analysis, it may be as good as the execution of a complex 3-D analysis in which a careful evaluation sometimes is very difficult to achieve because of the complexity of the computer input and output. As we improve our ability to define the seismic input more reliably, to describe the 3-D inelastic load-deformation characteristics of structural elements more accurately, and to interpret analysis results in a consistent and well managed manner, the 3-D nonlinear analysis should become the standard method of performance evaluation.
The caveat to this advocacy of a simplified prediction approach is the presence of severe strength, stiffness, or mass iregularities. To some extent, the effects of stiffness and mass irregularities can be estimated by means of an elastic 3-D analysis. However, the effects of strength irregularities cannot. In particular, strength irregularities that cause torsional inelastic response are a problem that requires inelastic 3-D analysis.
Torsional effects and the structural response to 3-D ground motions have been the subject of many studies. The literature on these subjects is extensive, but certainly incomplete. Selected recent references on torsional effects are as follows: Bertero (1995), Bruneau and Mahin (1990b), De La Llera and Chopra (1995, 1996), Goel and Chopra (1991), Goel and Chopra (1994), Hahn and Liu (1994), Heredia and Barranco (1996), Hsieh and Deierlein (1991), Kilar and Fajfar (1997), Marusic and Fajfar (1999), Menun and Der Kiureghian (1998), Mittal and Jain (1995), Nakamura and Nakamura (1993), Sadek and Tso (1998), Tso and Zhu (1992), and Zhu and Tso (1992).
This section summarizes findings of a SAC study at the University of Washington (MacRae (1999), MacRae and Mattheis (2000)), which was performed to investigate and quantify the likely response of inelastically responding moment-resisting steel 2-D and 3-D frames to
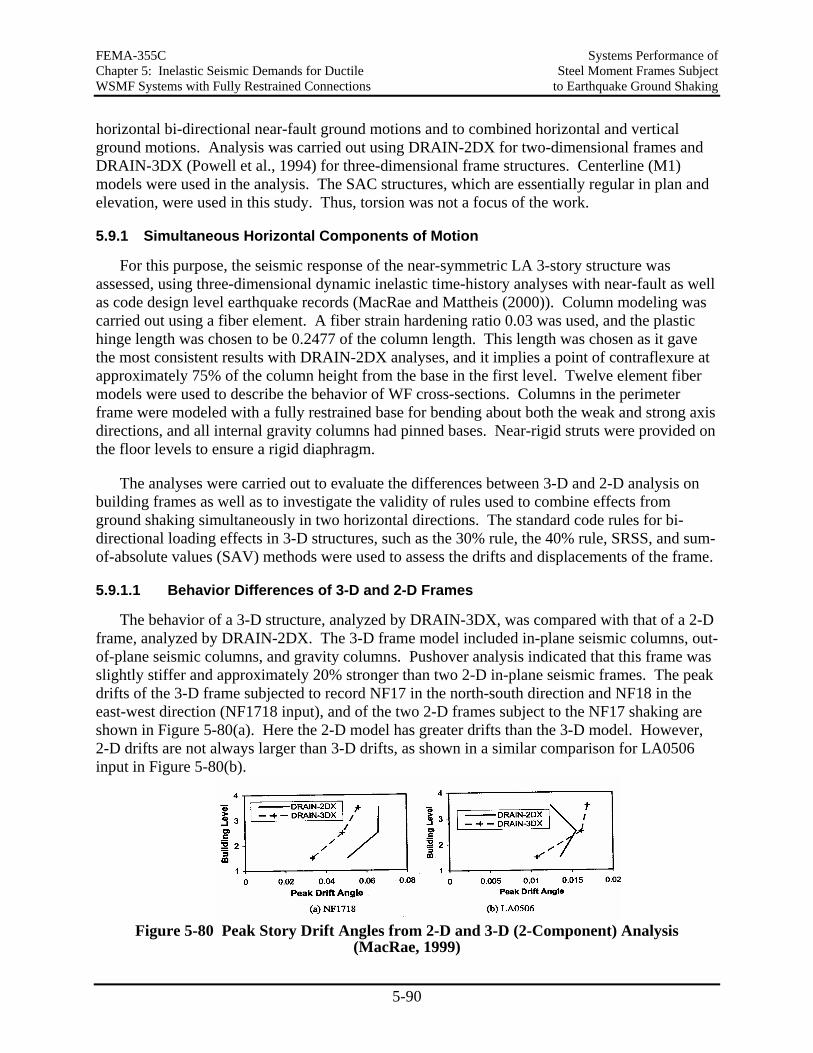
FEMA-355C Systems Performance of Chapter 5: Inelastic Seismic Demands for Ductile Steel Moment Frames Subject WSMF Systems with Fully Restrained Connections to Earthquake Ground Shaking
5-90
horizontal bi-directional near-fault ground motions and to combined horizontal and vertical ground motions. Analysis was carried out using DRAIN-2DX for two-dimensional frames and DRAIN-3DX (Powell et al., 1994) for three-dimensional frame structures. Centerline (M1) models were used in the analysis. The SAC structures, which are essentially regular in plan and elevation, were used in this study. Thus, torsion was not a focus of the work.
5.9.1 Simultaneous Horizontal Components of Motion
For this purpose, the seismic response of the near-symmetric LA 3-story structure was assessed, using three-dimensional dynamic inelastic time-history analyses with near-fault as well as code design level earthquake records (MacRae and Mattheis (2000)). Column modeling was carried out using a fiber element. A fiber strain hardening ratio 0.03 was used, and the plastic hinge length was chosen to be 0.2477 of the column length. This length was chosen as it gave the most consistent results with DRAIN-2DX analyses, and it implies a point of contraflexure at approximately 75% of the column height from the base in the first level. Twelve element fiber models were used to describe the behavior of WF cross-sections. Columns in the perimeter frame were modeled with a fully restrained base for bending about both the weak and strong axis directions, and all internal gravity columns had pinned bases. Near-rigid struts were provided on the floor levels to ensure a rigid diaphragm.
The analyses were carried out to evaluate the differences between 3-D and 2-D analysis on building frames as well as to investigate the validity of rules used to combine effects from ground shaking simultaneously in two horizontal directions. The standard code rules for bi-directional loading effects in 3-D structures, such as the 30% rule, the 40% rule, SRSS, and sum-of-absolute values (SAV) methods were used to assess the drifts and displacements of the frame.
5.9.1.1 Behavior Differences of 3-D and 2-D Frames
The behavior of a 3-D structure, analyzed by DRAIN-3DX, was compared with that of a 2-D frame, analyzed by DRAIN-2DX. The 3-D frame model included in-plane seismic columns, out-of-plane seismic columns, and gravity columns. Pushover analysis indicated that this frame was slightly stiffer and approximately 20% stronger than two 2-D in-plane seismic frames. The peak drifts of the 3-D frame subjected to record NF17 in the north-south direction and NF18 in the east-west direction (NF1718 input), and of the two 2-D frames subject to the NF17 shaking are shown in Figure 5-80(a). Here the 2-D model has greater drifts than the 3-D model. However, 2-D drifts are not always larger than 3-D drifts, as shown in a similar comparison for LA0506 input in Figure 5-80(b).
Figure 5-80 Peak Story Drift Angles from 2-D and 3-D (2-Component) Analysis
(MacRae, 1999)
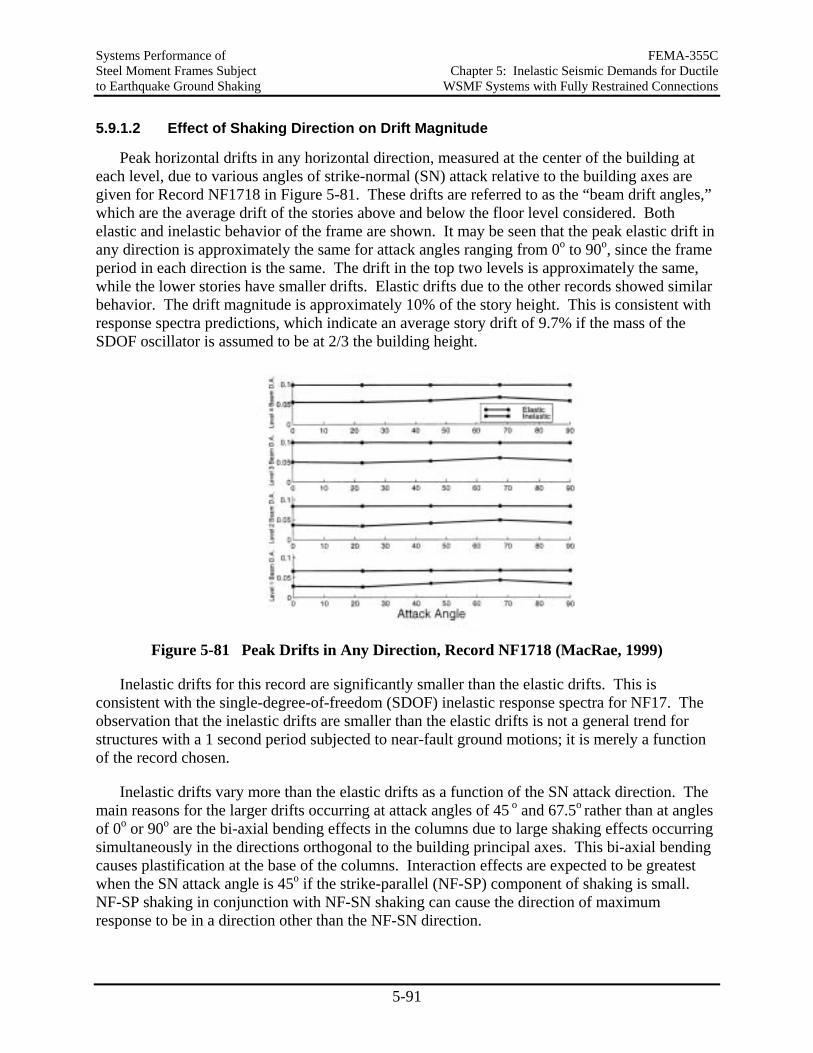
Systems Performance of FEMA-355C Steel Moment Frames Subject Chapter 5: Inelastic Seismic Demands for Ductile to Earthquake Ground Shaking WSMF Systems with Fully Restrained Connections
5-91
5.9.1.2 Effect of Shaking Direction on Drift Magnitude
Peak horizontal drifts in any horizontal direction, measured at the center of the building at each level, due to various angles of strike-normal (SN) attack relative to the building axes are given for Record NF1718 in Figure 5-81. These drifts are referred to as the “beam drift angles,” which are the average drift of the stories above and below the floor level considered. Both elastic and inelastic behavior of the frame are shown. It may be seen that the peak elastic drift in any direction is approximately the same for attack angles ranging from 0o to 90o, since the frame period in each direction is the same. The drift in the top two levels is approximately the same, while the lower stories have smaller drifts. Elastic drifts due to the other records showed similar behavior. The drift magnitude is approximately 10% of the story height. This is consistent with response spectra predictions, which indicate an average story drift of 9.7% if the mass of the SDOF oscillator is assumed to be at 2/3 the building height.
Figure 5-81 Peak Drifts in Any Direction, Record NF1718 (MacRae, 1999)
Inelastic drifts for this record are significantly smaller than the elastic drifts. This is consistent with the single-degree-of-freedom (SDOF) inelastic response spectra for NF17. The observation that the inelastic drifts are smaller than the elastic drifts is not a general trend for structures with a 1 second period subjected to near-fault ground motions; it is merely a function of the record chosen.
Inelastic drifts vary more than the elastic drifts as a function of the SN attack direction. The main reasons for the larger drifts occurring at attack angles of 45 o and 67.5o rather than at angles of 0o or 90o are the bi-axial bending effects in the columns due to large shaking effects occurring simultaneously in the directions orthogonal to the building principal axes. This bi-axial bending causes plastification at the base of the columns. Interaction effects are expected to be greatest when the SN attack angle is 45o if the strike-parallel (NF-SP) component of shaking is small. NF-SP shaking in conjunction with NF-SN shaking can cause the direction of maximum response to be in a direction other than the NF-SN direction.
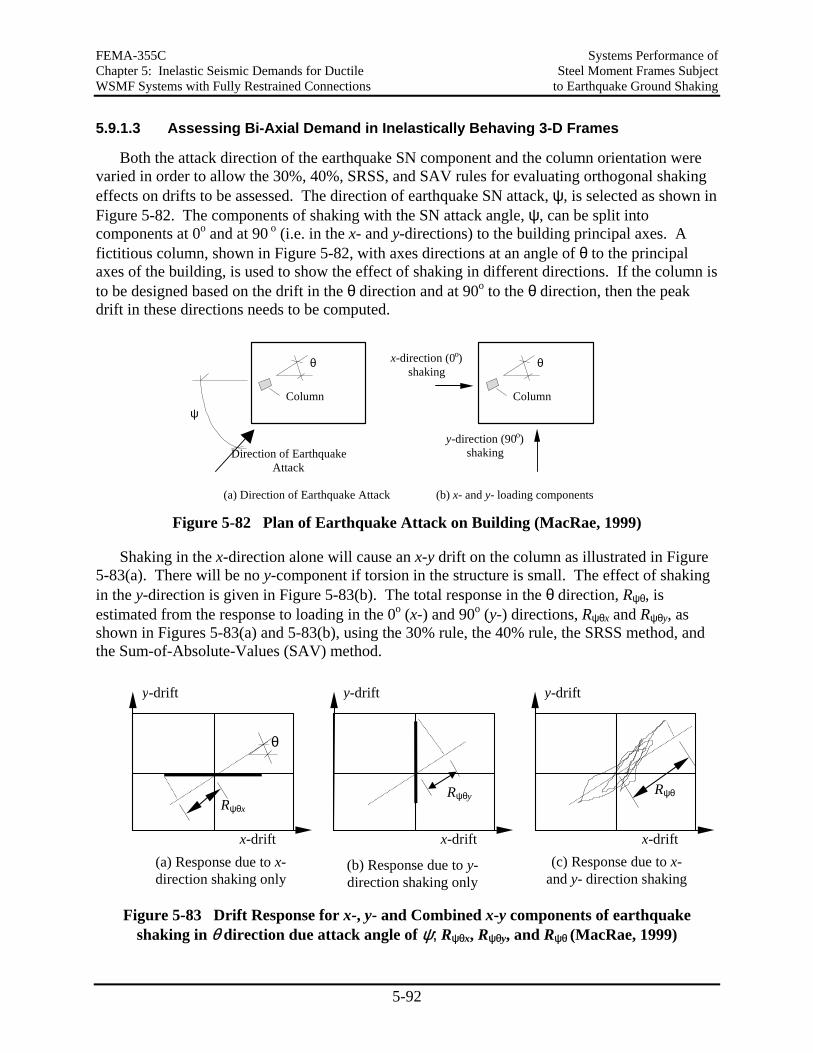
FEMA-355C Systems Performance of Chapter 5: Inelastic Seismic Demands for Ductile Steel Moment Frames Subject WSMF Systems with Fully Restrained Connections to Earthquake Ground Shaking
5-92
5.9.1.3 Assessing Bi-Axial Demand in Inelastically Behaving 3-D Frames
Both the attack direction of the earthquake SN component and the column orientation were varied in order to allow the 30%, 40%, SRSS, and SAV rules for evaluating orthogonal shaking effects on drifts to be assessed. The direction of earthquake SN attack, ψ, is selected as shown in Figure 5-82. The components of shaking with the SN attack angle, ψ, can be split into components at 0o and at 90 o (i.e. in the x- and y-directions) to the building principal axes. A fictitious column, shown in Figure 5-82, with axes directions at an angle of θ to the principal axes of the building, is used to show the effect of shaking in different directions. If the column is to be designed based on the drift in the θ direction and at 90o to the θ direction, then the peak drift in these directions needs to be computed.
ψ
Direction of EarthquakeAttack
θ
Column
(a) Direction of Earthquake Attack
θ
Column
x-direction (0o)shaking
y-direction (90o)shaking
(b) x- and y- loading components Figure 5-82 Plan of Earthquake Attack on Building (MacRae, 1999)
Shaking in the x-direction alone will cause an x-y drift on the column as illustrated in Figure 5-83(a). There will be no y-component if torsion in the structure is small. The effect of shaking in the y-direction is given in Figure 5-83(b). The total response in the θ direction, Rψθ, is estimated from the response to loading in the 0o (x-) and 90o (y-) directions, Rψθx and Rψθy, as shown in Figures 5-83(a) and 5-83(b), using the 30% rule, the 40% rule, the SRSS method, and the Sum-of-Absolute-Values (SAV) method.
x-drift
y-drift
(b) Response due to y-direction shaking only
Rψθy
x-drift
y-drift
(c) Response due to x-and y- direction shaking
Rψθ
x-drift
y-drift
(a) Response due to x-direction shaking only
θ
Rψθx
Figure 5-83 Drift Response for x-, y- and Combined x-y components of earthquake
shaking in θ direction due attack angle of ψ; Rψθx, Rψθy, and Rψθ (MacRae, 1999)
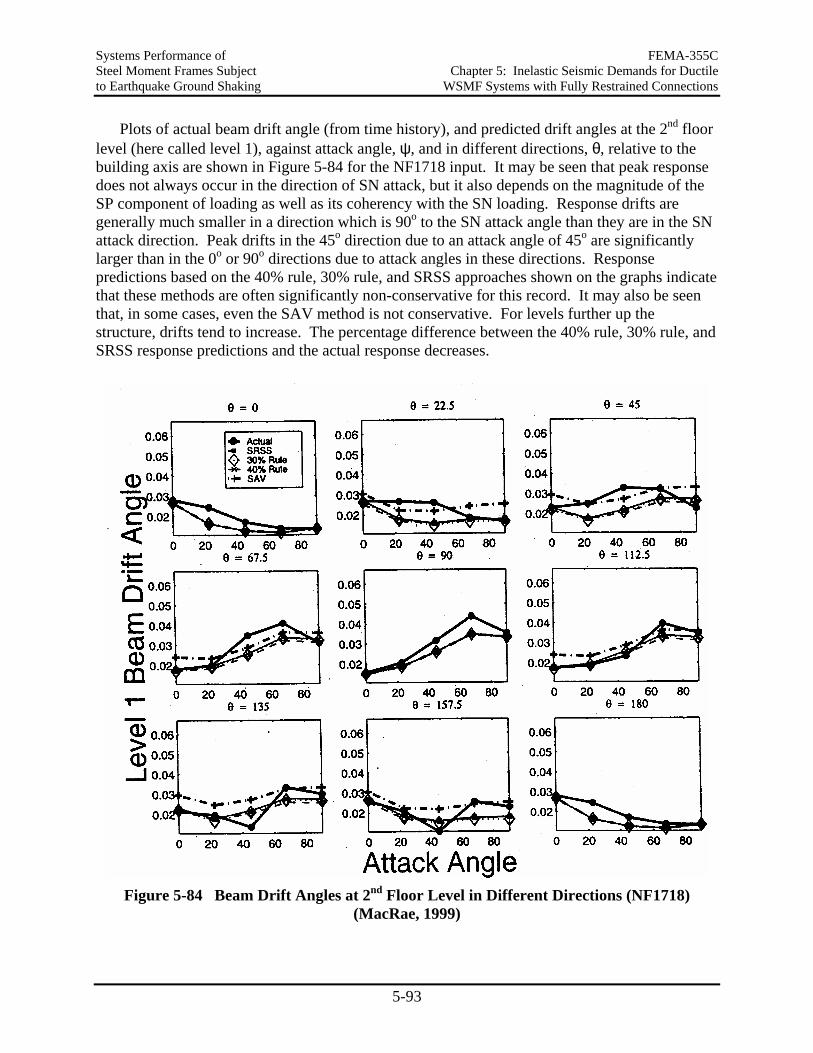
Systems Performance of FEMA-355C Steel Moment Frames Subject Chapter 5: Inelastic Seismic Demands for Ductile to Earthquake Ground Shaking WSMF Systems with Fully Restrained Connections
5-93
Plots of actual beam drift angle (from time history), and predicted drift angles at the 2nd floor level (here called level 1), against attack angle, ψ, and in different directions, θ, relative to the building axis are shown in Figure 5-84 for the NF1718 input. It may be seen that peak response does not always occur in the direction of SN attack, but it also depends on the magnitude of the SP component of loading as well as its coherency with the SN loading. Response drifts are generally much smaller in a direction which is 90o to the SN attack angle than they are in the SN attack direction. Peak drifts in the 45o direction due to an attack angle of 45o are significantly larger than in the 0o or 90o directions due to attack angles in these directions. Response predictions based on the 40% rule, 30% rule, and SRSS approaches shown on the graphs indicate that these methods are often significantly non-conservative for this record. It may also be seen that, in some cases, even the SAV method is not conservative. For levels further up the structure, drifts tend to increase. The percentage difference between the 40% rule, 30% rule, and SRSS response predictions and the actual response decreases.
Figure 5-84 Beam Drift Angles at 2nd Floor Level in Different Directions (NF1718)
(MacRae, 1999)
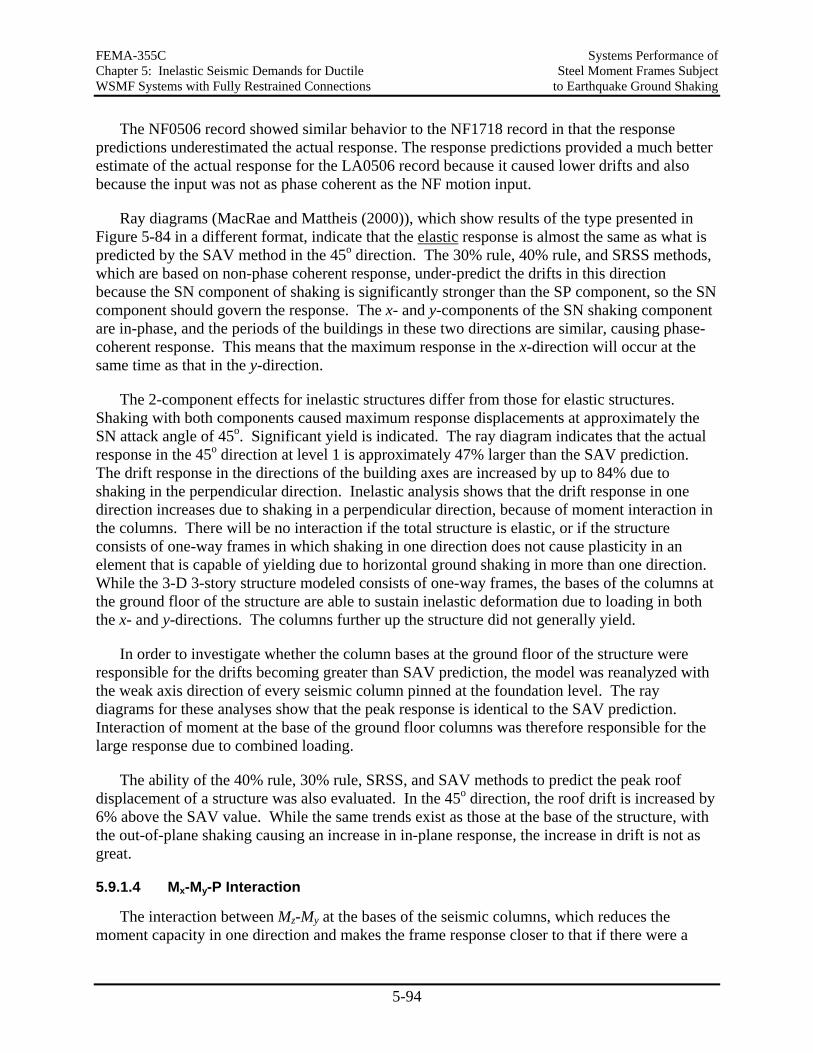
FEMA-355C Systems Performance of Chapter 5: Inelastic Seismic Demands for Ductile Steel Moment Frames Subject WSMF Systems with Fully Restrained Connections to Earthquake Ground Shaking
5-94
The NF0506 record showed similar behavior to the NF1718 record in that the response predictions underestimated the actual response. The response predictions provided a much better estimate of the actual response for the LA0506 record because it caused lower drifts and also because the input was not as phase coherent as the NF motion input.
Ray diagrams (MacRae and Mattheis (2000)), which show results of the type presented in Figure 5-84 in a different format, indicate that the elastic response is almost the same as what is predicted by the SAV method in the 45o direction. The 30% rule, 40% rule, and SRSS methods, which are based on non-phase coherent response, under-predict the drifts in this direction because the SN component of shaking is significantly stronger than the SP component, so the SN component should govern the response. The x- and y-components of the SN shaking component are in-phase, and the periods of the buildings in these two directions are similar, causing phase-coherent response. This means that the maximum response in the x-direction will occur at the same time as that in the y-direction.
The 2-component effects for inelastic structures differ from those for elastic structures. Shaking with both components caused maximum response displacements at approximately the SN attack angle of 45o. Significant yield is indicated. The ray diagram indicates that the actual response in the 45o direction at level 1 is approximately 47% larger than the SAV prediction. The drift response in the directions of the building axes are increased by up to 84% due to shaking in the perpendicular direction. Inelastic analysis shows that the drift response in one direction increases due to shaking in a perpendicular direction, because of moment interaction in the columns. There will be no interaction if the total structure is elastic, or if the structure consists of one-way frames in which shaking in one direction does not cause plasticity in an element that is capable of yielding due to horizontal ground shaking in more than one direction. While the 3-D 3-story structure modeled consists of one-way frames, the bases of the columns at the ground floor of the structure are able to sustain inelastic deformation due to loading in both the x- and y-directions. The columns further up the structure did not generally yield.
In order to investigate whether the column bases at the ground floor of the structure were responsible for the drifts becoming greater than SAV prediction, the model was reanalyzed with the weak axis direction of every seismic column pinned at the foundation level. The ray diagrams for these analyses show that the peak response is identical to the SAV prediction. Interaction of moment at the base of the ground floor columns was therefore responsible for the large response due to combined loading.
The ability of the 40% rule, 30% rule, SRSS, and SAV methods to predict the peak roof displacement of a structure was also evaluated. In the 45o direction, the roof drift is increased by 6% above the SAV value. While the same trends exist as those at the base of the structure, with the out-of-plane shaking causing an increase in in-plane response, the increase in drift is not as great.
5.9.1.4 Mx-My-P Interaction
The interaction between Mz-My at the bases of the seismic columns, which reduces the moment capacity in one direction and makes the frame response closer to that if there were a
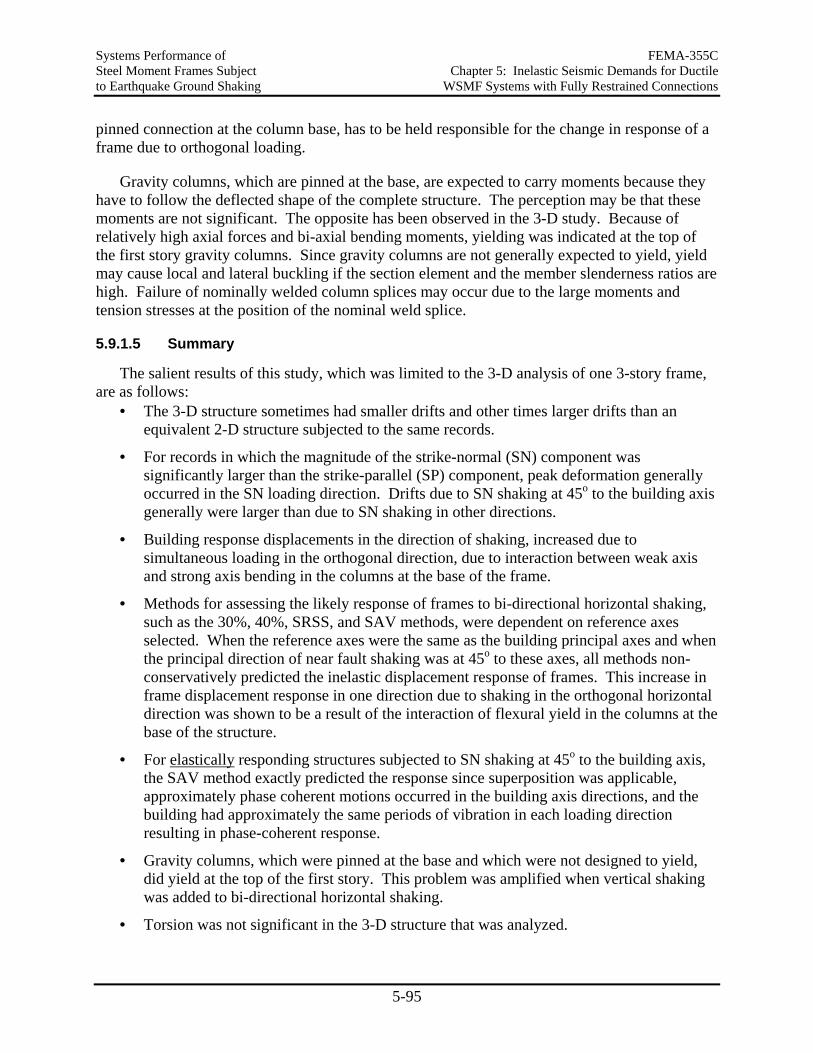
Systems Performance of FEMA-355C Steel Moment Frames Subject Chapter 5: Inelastic Seismic Demands for Ductile to Earthquake Ground Shaking WSMF Systems with Fully Restrained Connections
5-95
pinned connection at the column base, has to be held responsible for the change in response of a frame due to orthogonal loading.
Gravity columns, which are pinned at the base, are expected to carry moments because they have to follow the deflected shape of the complete structure. The perception may be that these moments are not significant. The opposite has been observed in the 3-D study. Because of relatively high axial forces and bi-axial bending moments, yielding was indicated at the top of the first story gravity columns. Since gravity columns are not generally expected to yield, yield may cause local and lateral buckling if the section element and the member slenderness ratios are high. Failure of nominally welded column splices may occur due to the large moments and tension stresses at the position of the nominal weld splice.
5.9.1.5 Summary
The salient results of this study, which was limited to the 3-D analysis of one 3-story frame, are as follows:
• The 3-D structure sometimes had smaller drifts and other times larger drifts than an equivalent 2-D structure subjected to the same records.
• For records in which the magnitude of the strike-normal (SN) component was significantly larger than the strike-parallel (SP) component, peak deformation generally occurred in the SN loading direction. Drifts due to SN shaking at 45o to the building axis generally were larger than due to SN shaking in other directions.
• Building response displacements in the direction of shaking, increased due to simultaneous loading in the orthogonal direction, due to interaction between weak axis and strong axis bending in the columns at the base of the frame.
• Methods for assessing the likely response of frames to bi-directional horizontal shaking, such as the 30%, 40%, SRSS, and SAV methods, were dependent on reference axes selected. When the reference axes were the same as the building principal axes and when the principal direction of near fault shaking was at 45o to these axes, all methods non-conservatively predicted the inelastic displacement response of frames. This increase in frame displacement response in one direction due to shaking in the orthogonal horizontal direction was shown to be a result of the interaction of flexural yield in the columns at the base of the structure.
• For elastically responding structures subjected to SN shaking at 45o to the building axis, the SAV method exactly predicted the response since superposition was applicable, approximately phase coherent motions occurred in the building axis directions, and the building had approximately the same periods of vibration in each loading direction resulting in phase-coherent response.
• Gravity columns, which were pinned at the base and which were not designed to yield, did yield at the top of the first story. This problem was amplified when vertical shaking was added to bi-directional horizontal shaking.
• Torsion was not significant in the 3-D structure that was analyzed.
FEMA-355C Systems Performance of Chapter 5: Inelastic Seismic Demands for Ductile Steel Moment Frames Subject WSMF Systems with Fully Restrained Connections to Earthquake Ground Shaking
5-96
5.9.2 Vertical Component of Motion
The effects of vertical shaking was evaluated for the LA 3-, 9-, and 20-story structures (MacRae et al. (2000)). Analyses were carried out on 2-D models of the 9- and 20-story structures and 3-D models of the 3-story structure. The near-fault ground motions were used in this study. The median vertical acceleration response spectrum for these records, based on 2% damping, is shown in Figure 5-85, together with the vertical first mode period of the LA structures. As can be seen, spectral accelerations greater than 1g are indicated for the 9- and 20-story structures.
0
0.5
1
1.5
2
0 0.05 0.1 0.15 0.2Period (s)
Spec
tral A
ccel
erat
ion
(g)
LA3
LA9 LA20
Figure 5-85 Median Vertical Acceleration Response Spectrum for NF Ground Motions
(MacRae, 1999)
The SRSS method of combining axial force effects due to horizontal and vertical shaking generally underestimated the actual response by about 5% because SRSS is based on the assumption of elastic behavior. If the response is inelastic due to beam yielding, then the axial force due to horizontal shaking is limited as shown in Figure 5-86 and the possibility of axial loads from horizontal and vertical shaking being near their peaks simultaneously is increased. The SAV estimate is always greater than the NF-SN-V Actual axial force.
Time
Column Axial Force due toVertical Ground Shaking
Time
Column Axial Force due toHorizontal Ground Shaking andGravity Load
Gravity Axial ForceMax. Axial Force
Elastic BehaviorInelastic Behavior
Figure 5-86 Effect of Horizontal and Vertical Shaking on Column Response
(MacRae, 1999)
Internal seismic column axial forces did not change much with lateral shaking since the seismic shears in the beams on both side of these columns cancelled out. However, they did
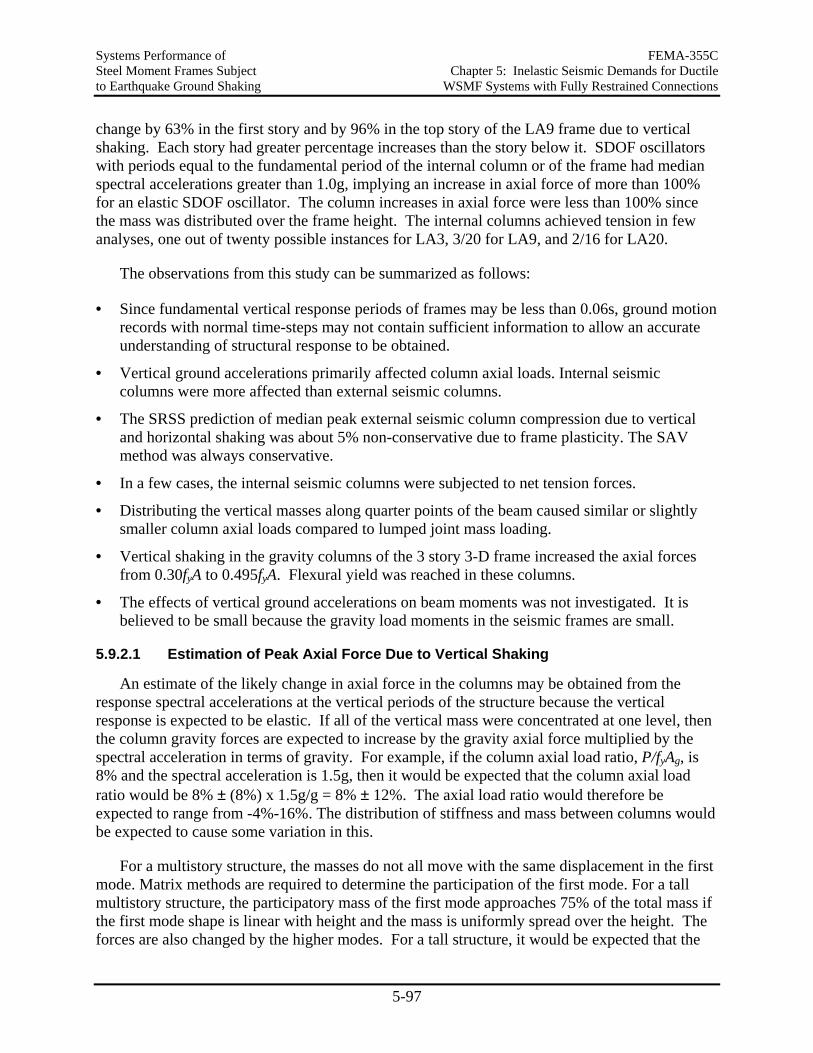
Systems Performance of FEMA-355C Steel Moment Frames Subject Chapter 5: Inelastic Seismic Demands for Ductile to Earthquake Ground Shaking WSMF Systems with Fully Restrained Connections
5-97
change by 63% in the first story and by 96% in the top story of the LA9 frame due to vertical shaking. Each story had greater percentage increases than the story below it. SDOF oscillators with periods equal to the fundamental period of the internal column or of the frame had median spectral accelerations greater than 1.0g, implying an increase in axial force of more than 100% for an elastic SDOF oscillator. The column increases in axial force were less than 100% since the mass was distributed over the frame height. The internal columns achieved tension in few analyses, one out of twenty possible instances for LA3, 3/20 for LA9, and 2/16 for LA20.
The observations from this study can be summarized as follows:
• Since fundamental vertical response periods of frames may be less than 0.06s, ground motion records with normal time-steps may not contain sufficient information to allow an accurate understanding of structural response to be obtained.
• Vertical ground accelerations primarily affected column axial loads. Internal seismic columns were more affected than external seismic columns.
• The SRSS prediction of median peak external seismic column compression due to vertical and horizontal shaking was about 5% non-conservative due to frame plasticity. The SAV method was always conservative.
• In a few cases, the internal seismic columns were subjected to net tension forces.
• Distributing the vertical masses along quarter points of the beam caused similar or slightly smaller column axial loads compared to lumped joint mass loading.
• Vertical shaking in the gravity columns of the 3 story 3-D frame increased the axial forces from 0.30fyA to 0.495fyA. Flexural yield was reached in these columns.
• The effects of vertical ground accelerations on beam moments was not investigated. It is believed to be small because the gravity load moments in the seismic frames are small.
5.9.2.1 Estimation of Peak Axial Force Due to Vertical Shaking
An estimate of the likely change in axial force in the columns may be obtained from the response spectral accelerations at the vertical periods of the structure because the vertical response is expected to be elastic. If all of the vertical mass were concentrated at one level, then the column gravity forces are expected to increase by the gravity axial force multiplied by the spectral acceleration in terms of gravity. For example, if the column axial load ratio, P/fyAg, is 8% and the spectral acceleration is 1.5g, then it would be expected that the column axial load ratio would be 8% ± (8%) x 1.5g/g = 8% ± 12%. The axial load ratio would therefore be expected to range from -4%-16%. The distribution of stiffness and mass between columns would be expected to cause some variation in this.
For a multistory structure, the masses do not all move with the same displacement in the first mode. Matrix methods are required to determine the participation of the first mode. For a tall multistory structure, the participatory mass of the first mode approaches 75% of the total mass if the first mode shape is linear with height and the mass is uniformly spread over the height. The forces are also changed by the higher modes. For a tall structure, it would be expected that the

FEMA-355C Systems Performance of Chapter 5: Inelastic Seismic Demands for Ductile Steel Moment Frames Subject WSMF Systems with Fully Restrained Connections to Earthquake Ground Shaking
5-98
accelerations in the most highly loaded columns at the base of the structure would be at least 75% of those from the SDOF spectral accelerations. For actual structures, this value may vary.
5.10 Post-Northridge Structures
The performance of the 3-, 9-, and 20-story post-Northridge structures with cover plate connections, as well as those with RBS designs, has been summarized together with pre-Northridge structures in Sections 5.2.2 and 5.3.3. Only summary observations are presented here.
5.10.1 Structures with Cover Plate Connections
The global static (pushover) and dynamic responses of post-Northridge structures do not differ much from those of pre-Northridge structures. They are somewhat stronger because of the reinforced portions of beams Figures 5-1 and 5-2), and the story drift demands are slightly smaller (Figure 5-29). By the time story drifts are converted to beam plastic hinge rotations, it comes out in a wash, because for a given drift the plastic hinge, rotations are larger for post-Northridge structures (because the plastic hinge is further away from the column centerline).
No specific issues were found with post-Northridge structures that would render their response significantly different from that of pre-Northridge structures – provided that all elements and connections are ductile and are designed according to similar concepts.
The trade-offs between pre- and cover plated post-Northridge structures come at the connection level. Cover plated connections are expected to fracture at larger story drifts, but they may cause significant deterioration in the beam response because of reduced effectiveness of lateral support at the plastic hinge location. This deterioration will affect drift demands, as is discussed in Section 5.11.
It must be noted that the post-Northridge design selected by the design engineers has long fallen out of favor, and the cover plated connection is not a pre-qualified connection in the SAC Guidelines. But designs with pre-qualified welded flange plate connections are expected to behave similar to those with cover plate connections, which should render the results presented here useful to the reader.
5.10.2 Reduced Beam Sections
Post-Northridge designs with reduced beam sections (RBSs) behave somewhat different from cover plate designs. They likely are weaker than pre-Northridge designs because stiffness requirements may demand similar (or equal) member sizes, but the localized beam section reduction will decrease the strength (see Figure 5-15). Consequently, the story drift demands may be larger (Figure 5-30), and the local member deformation demands may grow accordingly. The increase in story drift in RBS connections is not negligible and deserves attention. Pre-Northridge and cover plated post-Northridge designs rely on overstrength attributable to stiffness requirements. Shaving material from beam flanges at discrete sections will have a small effect on the lateral stiffness, but may have a large effect on the lateral strength. Thus, the overstrength may be reduced significantly. Everything else being equal, this is not a desirable consequence,
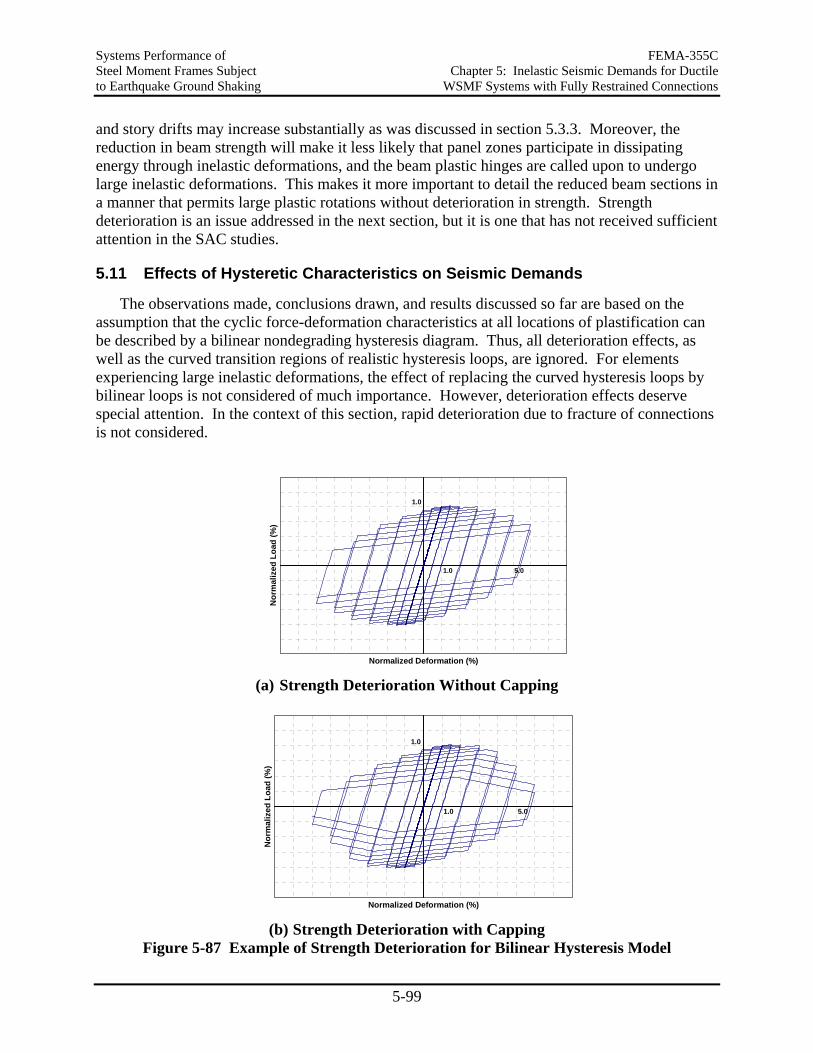
Systems Performance of FEMA-355C Steel Moment Frames Subject Chapter 5: Inelastic Seismic Demands for Ductile to Earthquake Ground Shaking WSMF Systems with Fully Restrained Connections
5-99
and story drifts may increase substantially as was discussed in section 5.3.3. Moreover, the reduction in beam strength will make it less likely that panel zones participate in dissipating energy through inelastic deformations, and the beam plastic hinges are called upon to undergo large inelastic deformations. This makes it more important to detail the reduced beam sections in a manner that permits large plastic rotations without deterioration in strength. Strength deterioration is an issue addressed in the next section, but it is one that has not received sufficient attention in the SAC studies.
5.11 Effects of Hysteretic Characteristics on Seismic Demands
The observations made, conclusions drawn, and results discussed so far are based on the assumption that the cyclic force-deformation characteristics at all locations of plastification can be described by a bilinear nondegrading hysteresis diagram. Thus, all deterioration effects, as well as the curved transition regions of realistic hysteresis loops, are ignored. For elements experiencing large inelastic deformations, the effect of replacing the curved hysteresis loops by bilinear loops is not considered of much importance. However, deterioration effects deserve special attention. In the context of this section, rapid deterioration due to fracture of connections is not considered.
Normalized Deformation (%)
Nor
mal
ized
Loa
d (%
)
1.0
1.0 5.0
(a) Strength Deterioration Without Capping
Normalized Deformation (%)
Nor
mal
ized
Loa
d (%
)
1.0
1.0 5.0
(b) Strength Deterioration with Capping
Figure 5-87 Example of Strength Deterioration for Bilinear Hysteresis Model
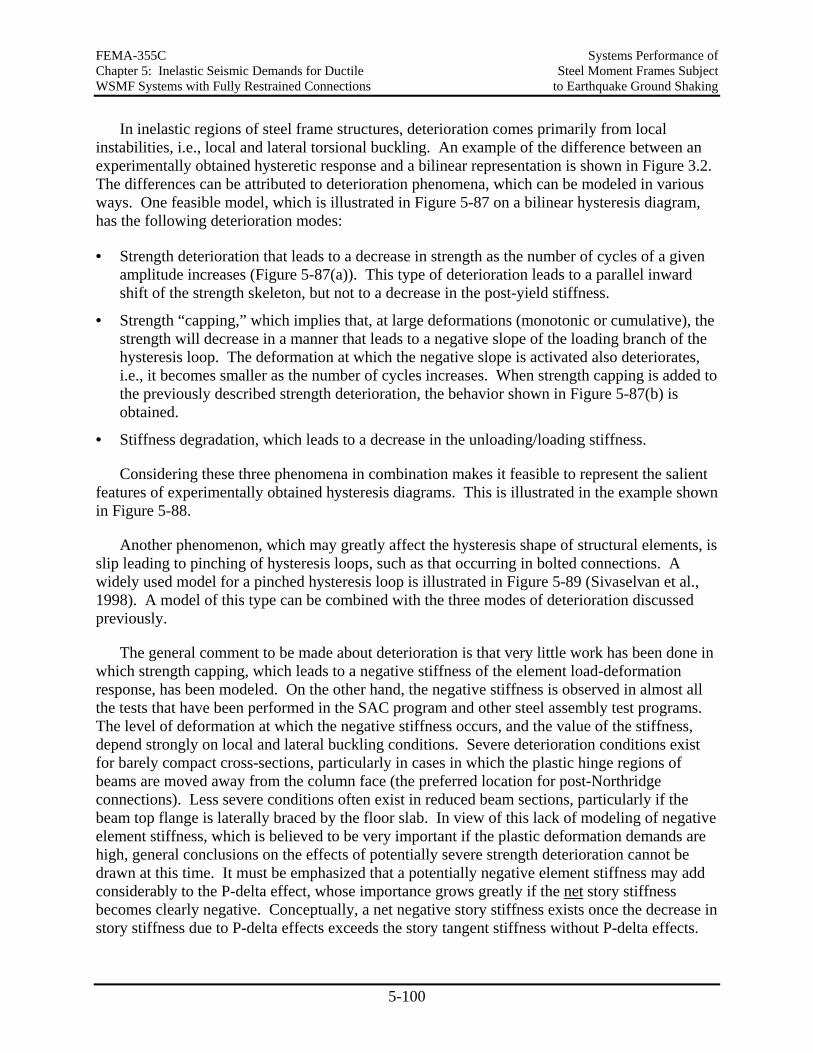
FEMA-355C Systems Performance of Chapter 5: Inelastic Seismic Demands for Ductile Steel Moment Frames Subject WSMF Systems with Fully Restrained Connections to Earthquake Ground Shaking
5-100
In inelastic regions of steel frame structures, deterioration comes primarily from local instabilities, i.e., local and lateral torsional buckling. An example of the difference between an experimentally obtained hysteretic response and a bilinear representation is shown in Figure 3.2. The differences can be attributed to deterioration phenomena, which can be modeled in various ways. One feasible model, which is illustrated in Figure 5-87 on a bilinear hysteresis diagram, has the following deterioration modes:
• Strength deterioration that leads to a decrease in strength as the number of cycles of a given amplitude increases (Figure 5-87(a)). This type of deterioration leads to a parallel inward shift of the strength skeleton, but not to a decrease in the post-yield stiffness.
• Strength “capping,” which implies that, at large deformations (monotonic or cumulative), the strength will decrease in a manner that leads to a negative slope of the loading branch of the hysteresis loop. The deformation at which the negative slope is activated also deteriorates, i.e., it becomes smaller as the number of cycles increases. When strength capping is added to the previously described strength deterioration, the behavior shown in Figure 5-87(b) is obtained.
• Stiffness degradation, which leads to a decrease in the unloading/loading stiffness.
Considering these three phenomena in combination makes it feasible to represent the salient features of experimentally obtained hysteresis diagrams. This is illustrated in the example shown in Figure 5-88.
Another phenomenon, which may greatly affect the hysteresis shape of structural elements, is slip leading to pinching of hysteresis loops, such as that occurring in bolted connections. A widely used model for a pinched hysteresis loop is illustrated in Figure 5-89 (Sivaselvan et al., 1998). A model of this type can be combined with the three modes of deterioration discussed previously.
The general comment to be made about deterioration is that very little work has been done in which strength capping, which leads to a negative stiffness of the element load-deformation response, has been modeled. On the other hand, the negative stiffness is observed in almost all the tests that have been performed in the SAC program and other steel assembly test programs. The level of deformation at which the negative stiffness occurs, and the value of the stiffness, depend strongly on local and lateral buckling conditions. Severe deterioration conditions exist for barely compact cross-sections, particularly in cases in which the plastic hinge regions of beams are moved away from the column face (the preferred location for post-Northridge connections). Less severe conditions often exist in reduced beam sections, particularly if the beam top flange is laterally braced by the floor slab. In view of this lack of modeling of negative element stiffness, which is believed to be very important if the plastic deformation demands are high, general conclusions on the effects of potentially severe strength deterioration cannot be drawn at this time. It must be emphasized that a potentially negative element stiffness may add considerably to the P-delta effect, whose importance grows greatly if the net story stiffness becomes clearly negative. Conceptually, a net negative story stiffness exists once the decrease in story stiffness due to P-delta effects exceeds the story tangent stiffness without P-delta effects.
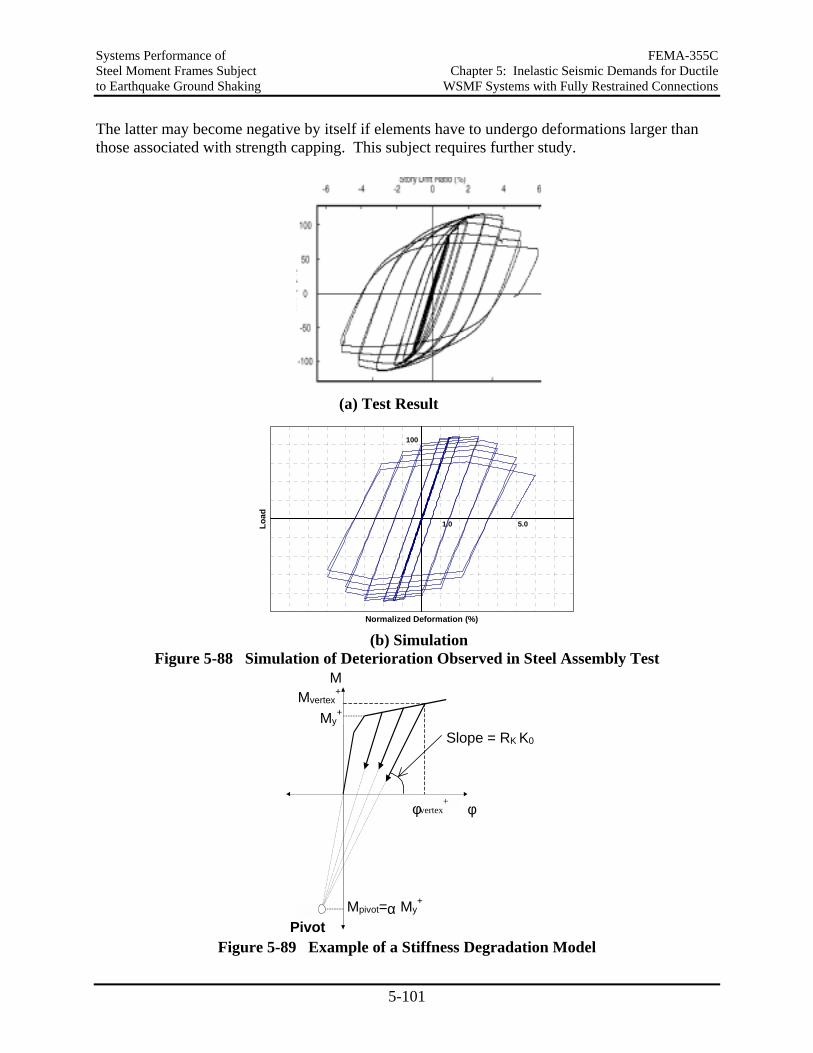
Systems Performance of FEMA-355C Steel Moment Frames Subject Chapter 5: Inelastic Seismic Demands for Ductile to Earthquake Ground Shaking WSMF Systems with Fully Restrained Connections
5-101
The latter may become negative by itself if elements have to undergo deformations larger than those associated with strength capping. This subject requires further study.
(a) Test Result
Normalized Deformation (%)
Load
100
1.0 5.0
(b) Simulation
Figure 5-88 Simulation of Deterioration Observed in Steel Assembly Test
φ
M
My+
Mpivot=α My+
Pivot
Slope = RK K0
Mvertex+
φvertex+
Figure 5-89 Example of a Stiffness Degradation Model
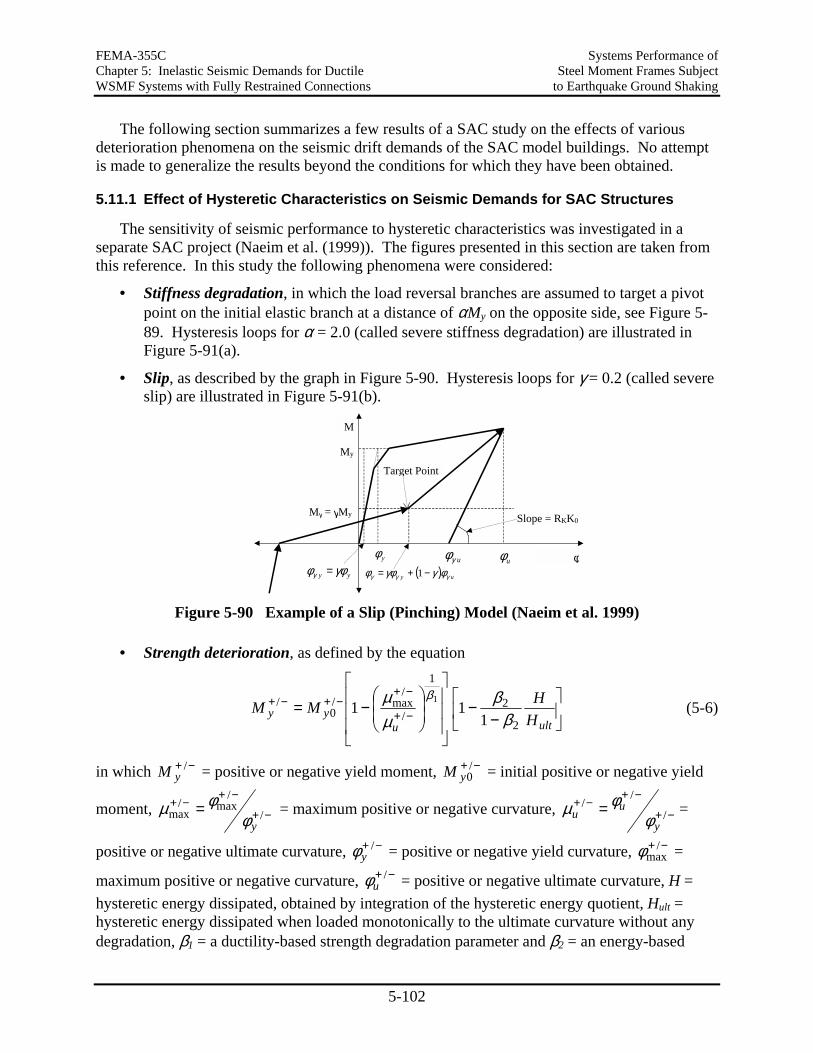
FEMA-355C Systems Performance of Chapter 5: Inelastic Seismic Demands for Ductile Steel Moment Frames Subject WSMF Systems with Fully Restrained Connections to Earthquake Ground Shaking
5-102
The following section summarizes a few results of a SAC study on the effects of various deterioration phenomena on the seismic drift demands of the SAC model buildings. No attempt is made to generalize the results beyond the conditions for which they have been obtained.
5.11.1 Effect of Hysteretic Characteristics on Seismic Demands for SAC Structures
The sensitivity of seismic performance to hysteretic characteristics was investigated in a separate SAC project (Naeim et al. (1999)). The figures presented in this section are taken from this reference. In this study the following phenomena were considered:
• Stiffness degradation, in which the load reversal branches are assumed to target a pivot point on the initial elastic branch at a distance of αMy on the opposite side, see Figure 5-89. Hysteresis loops for α = 2.0 (called severe stiffness degradation) are illustrated in Figure 5-91(a).
• Slip, as described by the graph in Figure 5-90. Hysteresis loops for γ = 0.2 (called severe slip) are illustrated in Figure 5-91(b).
φ
M
My
uγφ uφyφ
yy γφφγ = ( ) uy γγγ φγγφφ −+= 1
Slope = RKK0Mγ = γMy
Target Point
Figure 5-90 Example of a Slip (Pinching) Model (Naeim et al. 1999)
• Strength deterioration, as defined by the equation
−
−
−= −+
−+−+−+
ultuyy H
HMM2
2
1
/
/max/
0/
111
1
ββ
µµ β
(5-6)
in which −+ /yM = positive or negative yield moment, −+ /
0yM = initial positive or negative yield
moment, −+
−+−+ = /
/max/
maxyφ
φµ = maximum positive or negative curvature, −+
−+−+ = /
//
y
uu φ
φµ =
positive or negative ultimate curvature, −+ /yφ = positive or negative yield curvature, −+ /
maxφ =
maximum positive or negative curvature, −+ /uφ = positive or negative ultimate curvature, H =
hysteretic energy dissipated, obtained by integration of the hysteretic energy quotient, Hult = hysteretic energy dissipated when loaded monotonically to the ultimate curvature without any degradation, β1 = a ductility-based strength degradation parameter and β2 = an energy-based
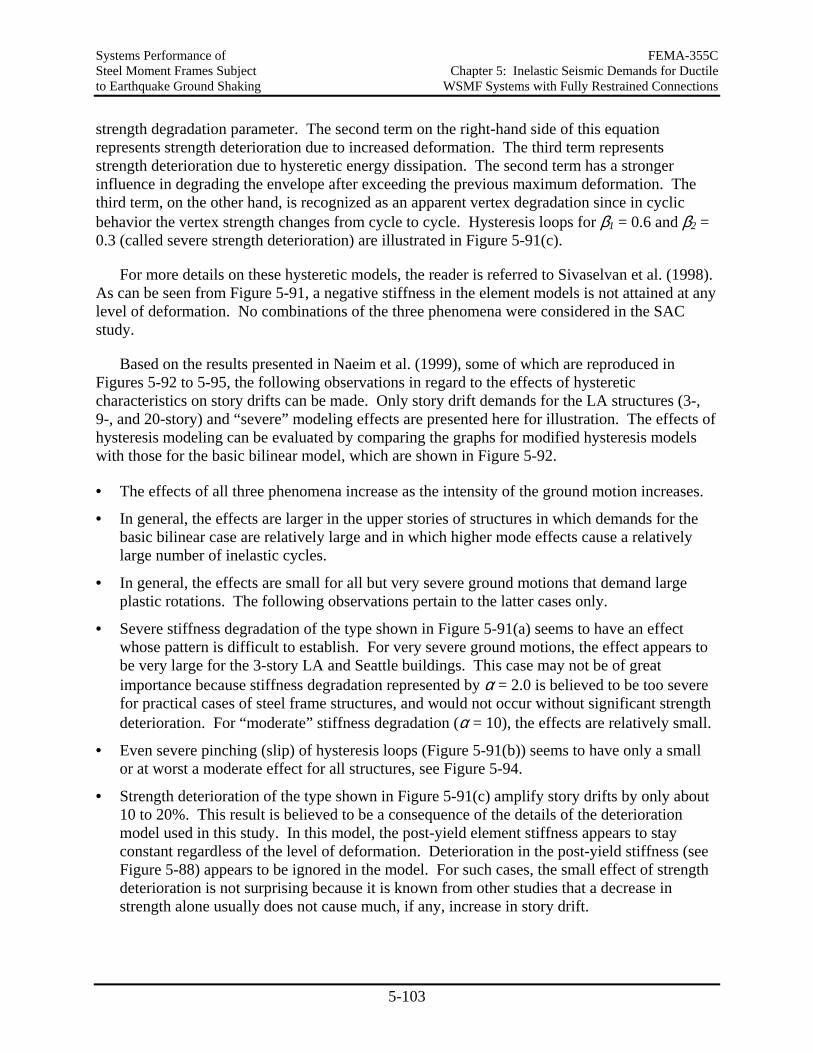
Systems Performance of FEMA-355C Steel Moment Frames Subject Chapter 5: Inelastic Seismic Demands for Ductile to Earthquake Ground Shaking WSMF Systems with Fully Restrained Connections
5-103
strength degradation parameter. The second term on the right-hand side of this equation represents strength deterioration due to increased deformation. The third term represents strength deterioration due to hysteretic energy dissipation. The second term has a stronger influence in degrading the envelope after exceeding the previous maximum deformation. The third term, on the other hand, is recognized as an apparent vertex degradation since in cyclic behavior the vertex strength changes from cycle to cycle. Hysteresis loops for β1 = 0.6 and β2 = 0.3 (called severe strength deterioration) are illustrated in Figure 5-91(c).
For more details on these hysteretic models, the reader is referred to Sivaselvan et al. (1998). As can be seen from Figure 5-91, a negative stiffness in the element models is not attained at any level of deformation. No combinations of the three phenomena were considered in the SAC study.
Based on the results presented in Naeim et al. (1999), some of which are reproduced in Figures 5-92 to 5-95, the following observations in regard to the effects of hysteretic characteristics on story drifts can be made. Only story drift demands for the LA structures (3-, 9-, and 20-story) and “severe” modeling effects are presented here for illustration. The effects of hysteresis modeling can be evaluated by comparing the graphs for modified hysteresis models with those for the basic bilinear model, which are shown in Figure 5-92.
• The effects of all three phenomena increase as the intensity of the ground motion increases.
• In general, the effects are larger in the upper stories of structures in which demands for the basic bilinear case are relatively large and in which higher mode effects cause a relatively large number of inelastic cycles.
• In general, the effects are small for all but very severe ground motions that demand large plastic rotations. The following observations pertain to the latter cases only.
• Severe stiffness degradation of the type shown in Figure 5-91(a) seems to have an effect whose pattern is difficult to establish. For very severe ground motions, the effect appears to be very large for the 3-story LA and Seattle buildings. This case may not be of great importance because stiffness degradation represented by α = 2.0 is believed to be too severe for practical cases of steel frame structures, and would not occur without significant strength deterioration. For “moderate” stiffness degradation (α = 10), the effects are relatively small.
• Even severe pinching (slip) of hysteresis loops (Figure 5-91(b)) seems to have only a small or at worst a moderate effect for all structures, see Figure 5-94.
• Strength deterioration of the type shown in Figure 5-91(c) amplify story drifts by only about 10 to 20%. This result is believed to be a consequence of the details of the deterioration model used in this study. In this model, the post-yield element stiffness appears to stay constant regardless of the level of deformation. Deterioration in the post-yield stiffness (see Figure 5-88) appears to be ignored in the model. For such cases, the small effect of strength deterioration is not surprising because it is known from other studies that a decrease in strength alone usually does not cause much, if any, increase in story drift.
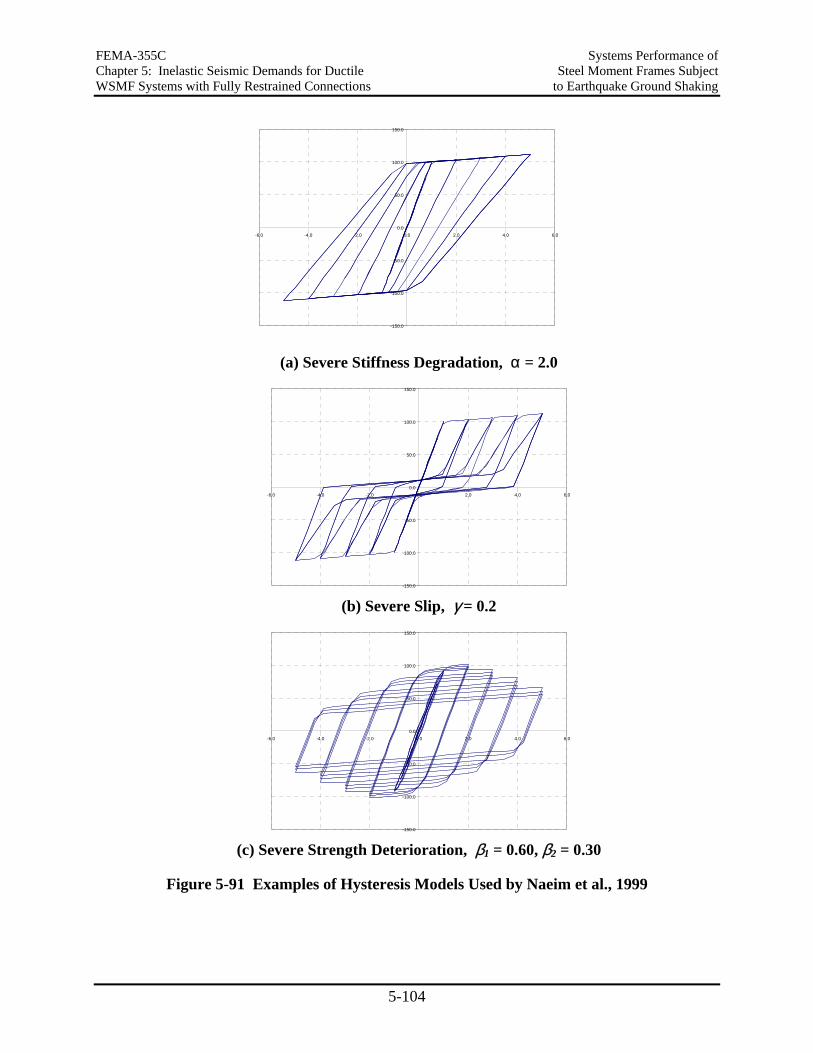
FEMA-355C Systems Performance of Chapter 5: Inelastic Seismic Demands for Ductile Steel Moment Frames Subject WSMF Systems with Fully Restrained Connections to Earthquake Ground Shaking
5-104
-150.0
-100.0
-50.0
0.0
50.0
100.0
150.0
-6.0 -4.0 -2.0 0.0 2.0 4.0 6.0
(a) Severe Stiffness Degradation, α = 2.0
-150.0
-100.0
-50.0
0.0
50.0
100.0
150.0
-6.0 -4.0 -2.0 0.0 2.0 4.0 6.0
(b) Severe Slip, γ = 0.2
-150.0
-100.0
-50.0
0.0
50.0
100.0
150.0
-6.0 -4.0 -2.0 0.0 2.0 4.0 6.0
(c) Severe Strength Deterioration, β1 = 0.60, β2 = 0.30
Figure 5-91 Examples of Hysteresis Models Used by Naeim et al., 1999
Systems Performance of FEMA-355C Steel Moment Frames Subject Chapter 5: Inelastic Seismic Demands for Ductile to Earthquake Ground Shaking WSMF Systems with Fully Restrained Connections
5-105
1
2
3
4
Floo
r L
evel
10/50 Median 2/50 Median10/50 84th Percentile 2/50 84th Percentile
3-STORY
1
2
3
4
5
6
7
8
9
10
Floo
r L
evel
9-STORY
1
3
5
7
9
11
13
15
17
19
21
0.00 0.01 0.02 0.03 0.04 0.05 0.06 0.07 0.08 0.09Story Drift Angle
Floo
r L
evel
20-STORY
Figure 5-92 Story Drift Demands for Bilinear LA Structures (Naeim et al. 1999)
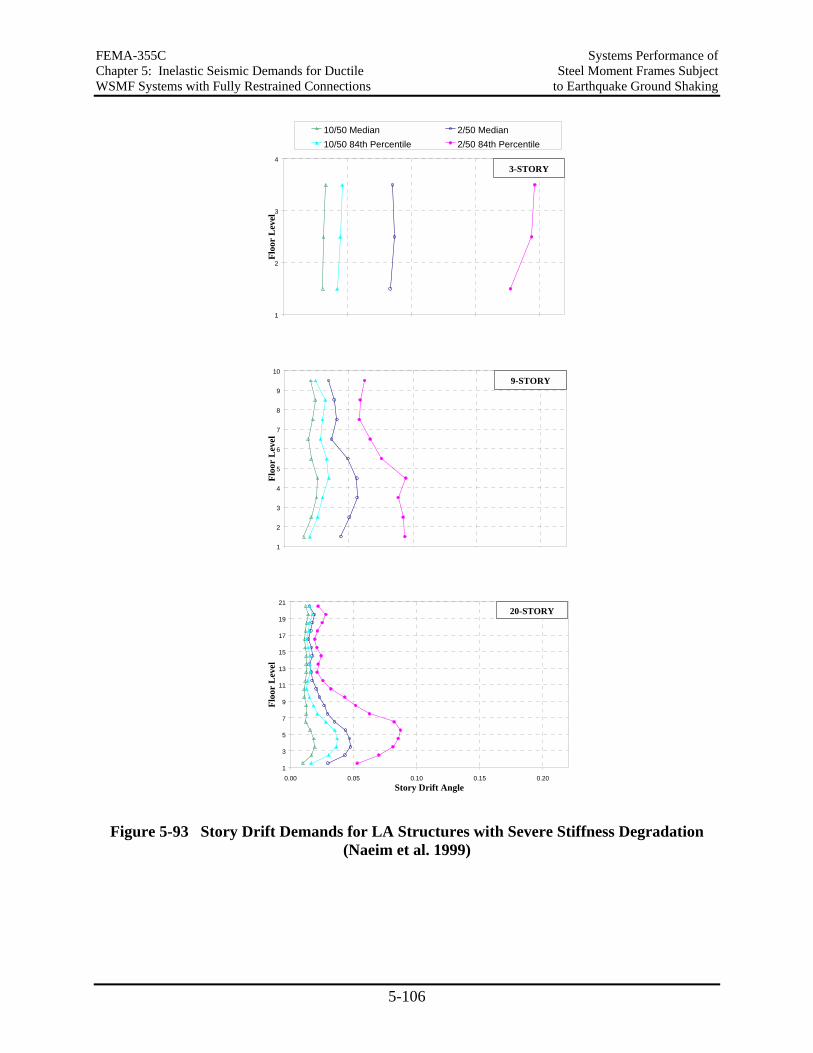
FEMA-355C Systems Performance of Chapter 5: Inelastic Seismic Demands for Ductile Steel Moment Frames Subject WSMF Systems with Fully Restrained Connections to Earthquake Ground Shaking
5-106
1
2
3
4
Floo
r L
evel
10/50 Median 2/50 Median10/50 84th Percentile 2/50 84th Percentile
3-STORY
1
2
3
4
5
6
7
8
9
10
Floo
r L
evel
9-STORY
1
3
5
7
9
11
13
15
17
19
21
0.00 0.05 0.10 0.15 0.20Story Drift Angle
Floo
r L
evel
20-STORY
Figure 5-93 Story Drift Demands for LA Structures with Severe Stiffness Degradation (Naeim et al. 1999)
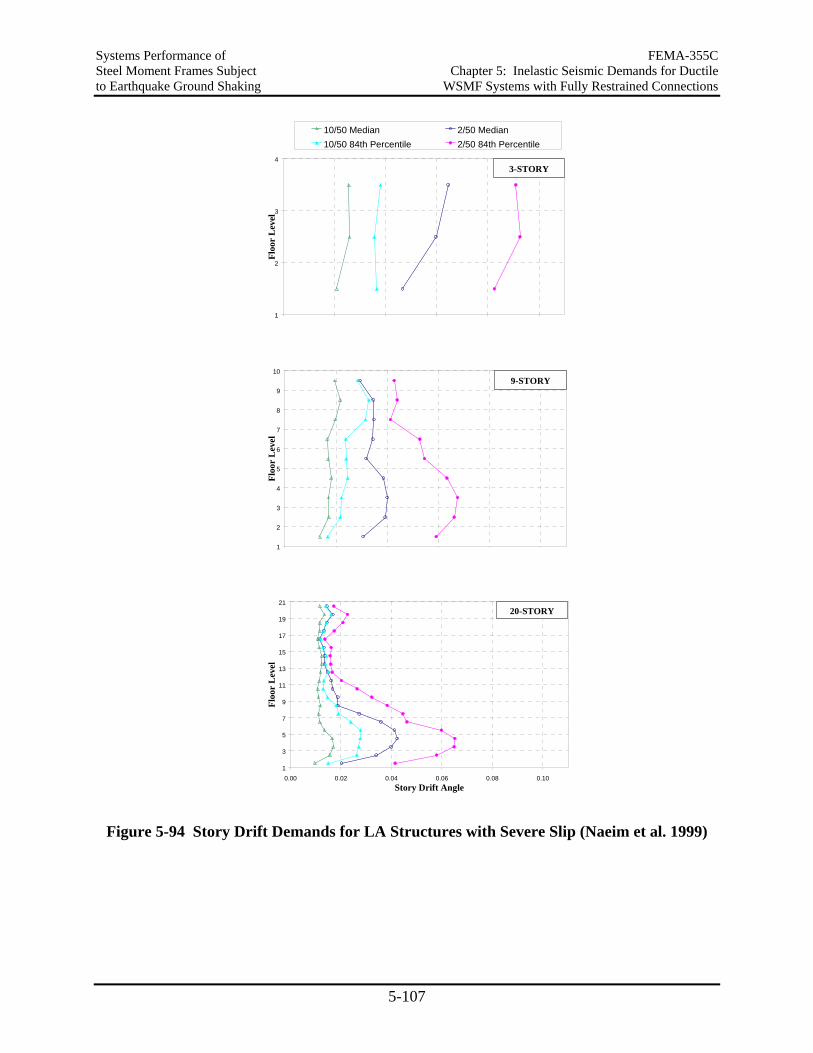
Systems Performance of FEMA-355C Steel Moment Frames Subject Chapter 5: Inelastic Seismic Demands for Ductile to Earthquake Ground Shaking WSMF Systems with Fully Restrained Connections
5-107
1
2
3
4
Floo
r L
evel
10/50 Median 2/50 Median10/50 84th Percentile 2/50 84th Percentile
3-STORY
1
2
3
4
5
6
7
8
9
10
Floo
r L
evel
9-STORY
1
3
5
7
9
11
13
15
17
19
21
0.00 0.02 0.04 0.06 0.08 0.10Story Drift Angle
Floo
r L
evel
20-STORY
Figure 5-94 Story Drift Demands for LA Structures with Severe Slip (Naeim et al. 1999)
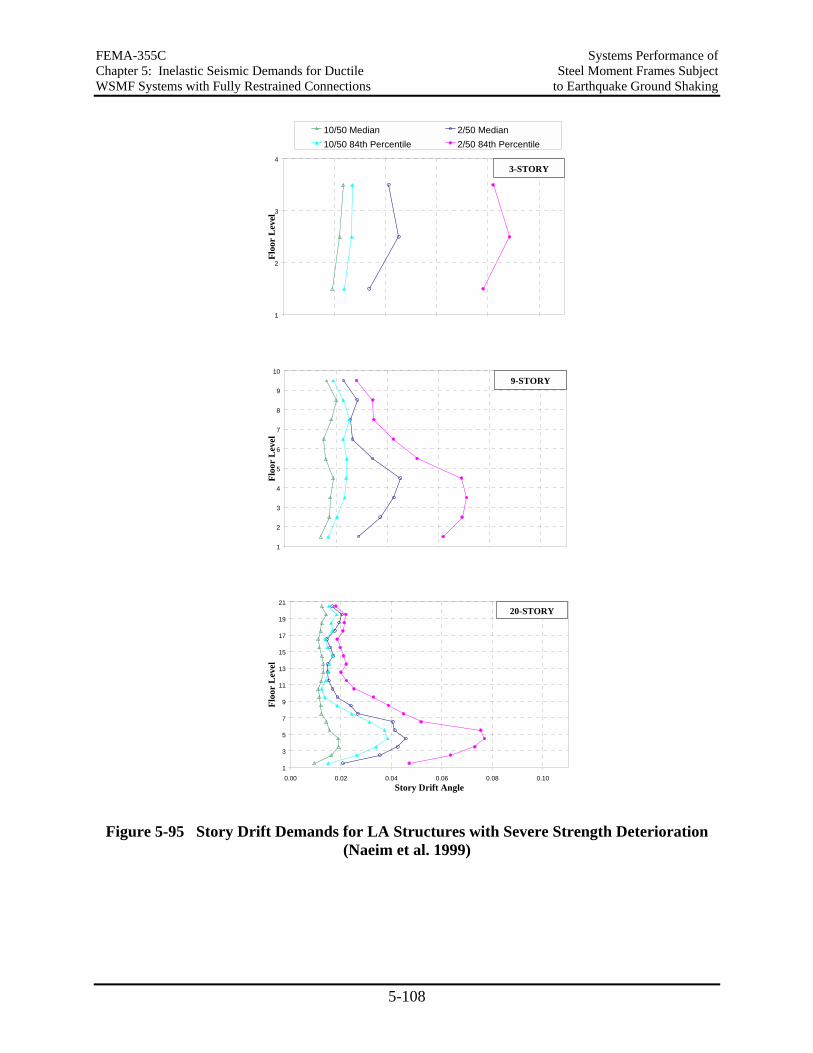
FEMA-355C Systems Performance of Chapter 5: Inelastic Seismic Demands for Ductile Steel Moment Frames Subject WSMF Systems with Fully Restrained Connections to Earthquake Ground Shaking
5-108
1
2
3
4
Floo
r L
evel
10/50 Median 2/50 Median10/50 84th Percentile 2/50 84th Percentile
3-STORY
1
2
3
4
5
6
7
8
9
10
Floo
r L
evel
9-STORY
1
3
5
7
9
11
13
15
17
19
21
0.00 0.02 0.04 0.06 0.08 0.10Story Drift Angle
Floo
r L
evel
20-STORY
Figure 5-95 Story Drift Demands for LA Structures with Severe Strength Deterioration (Naeim et al. 1999)
Systems Performance of FEMA-355C Steel Moment Frames Subject Chapter 5: Inelastic Seismic Demands for Ductile to Earthquake Ground Shaking WSMF Systems with Fully Restrained Connections
5-109
5.11.2 Summary Assessment of the Effect of Hysteretic Characteristics on Seismic Demands
The author of this report feels obliged to add his personal assessment of deterioration effects to the results presented here. This assessment is based on judgment as well as results obtained in many analytical studies.
1. Degradation of the elastic loading/unloading stiffness is not believed to be of primary concern for WSMFs. This degradation is caused by phenomena that can cause significant strength deterioration, in which case the effects of the latter may outweigh those of the former.
2. Pinching of element hysteresis loops, caused by slip in bolts or other gap opening/closing phenomena (e.g., plate buckling/tension reversals) is believed to have, on average, relatively small effects on seismic drift demands. This is confirmed by the study summarized in Section 5.11.1. However, the writer is aware of several cases in which significant amplification of story drifts due to pinching is observed under specific ground motions. Thus, the issue is not fully resolved and deserves further study.
3. Strength deterioration is a phenomenon that has not been investigated in sufficient detail to permit the deduction of definite conclusions. The major problem is not the deterioration of the type illustrated in Figure 5-91(c), but that of the type illustrated in Figure 5-88, in which a deterioration of the post-yield stiffness is evident. Such a deterioration will compound the P-delta problem, and may be the source of dynamic instability under very severe shaking, such as near-fault ground motions or ground motions of long strong motion duration. Associated with this type of deterioration might be potentially large permanent out-of plane distortions of beams or columns, which become an economic performance issue.
4. Stiffness degradation, pinching, and strength deterioration often occur in combinations. Very little is known about the effects of combined degradation/deterioration modes.
5. The safety assessment of WSMF structures in the SAC Guidelines is based on the Incremental Dynamic Analysis, in which the intensity of the ground motion is increased until dynamic instability occurs. This approach is a great advancement in performance-based earthquake engineering, and deserves advocacy by all. But it must be recognized that the estimated structure capacity depends on the accuracy of element modeling at very large inelastic deformations. It is likely that severe strength deterioration of the type illustrated in Figure 5-88 will occur at and below such deformation levels. Ignoring this deterioration may lead to an overestimation of the structure capacity. At this time it is not known how large these effects are. They may be benign for regular, strong, and well detailed structures, but likely are not benign for structures in which inelastic deformations are concentrated in one or few stories. Additional research on this subject is urgently needed, particularly before the IDA approach is adopted for other types of structures in which strength deterioration may occur at relatively small inelastic deformations.
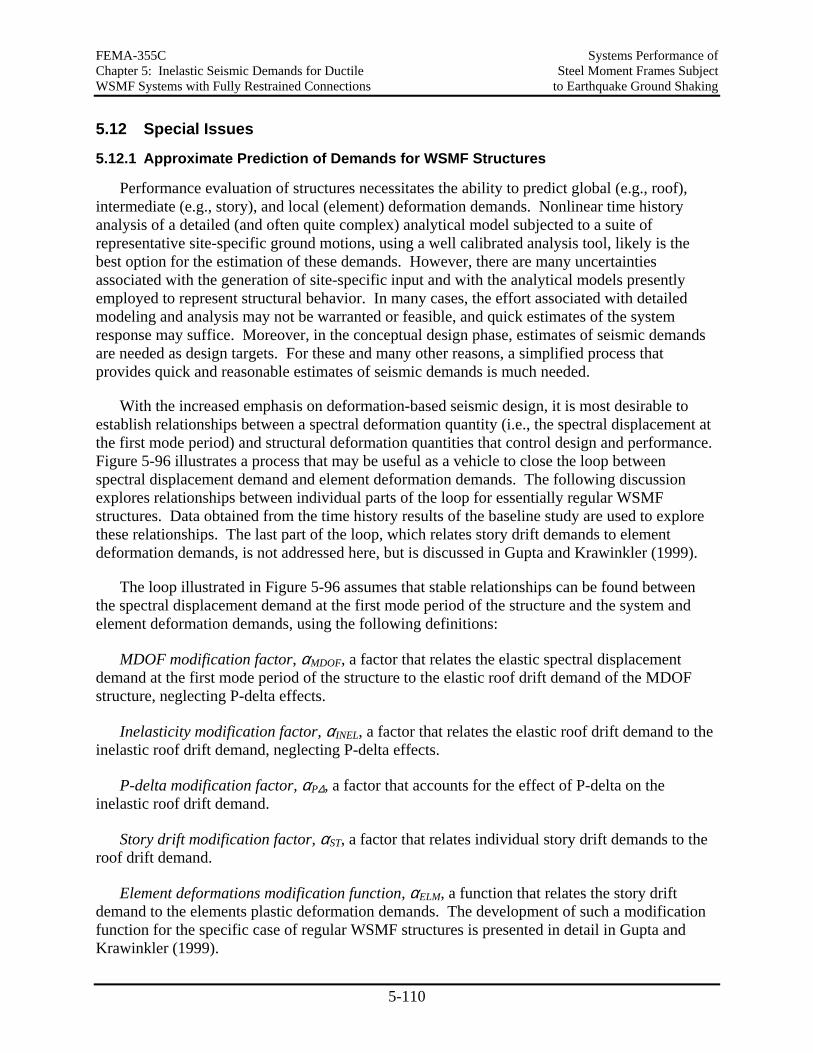
FEMA-355C Systems Performance of Chapter 5: Inelastic Seismic Demands for Ductile Steel Moment Frames Subject WSMF Systems with Fully Restrained Connections to Earthquake Ground Shaking
5-110
5.12 Special Issues
5.12.1 Approximate Prediction of Demands for WSMF Structures
Performance evaluation of structures necessitates the ability to predict global (e.g., roof), intermediate (e.g., story), and local (element) deformation demands. Nonlinear time history analysis of a detailed (and often quite complex) analytical model subjected to a suite of representative site-specific ground motions, using a well calibrated analysis tool, likely is the best option for the estimation of these demands. However, there are many uncertainties associated with the generation of site-specific input and with the analytical models presently employed to represent structural behavior. In many cases, the effort associated with detailed modeling and analysis may not be warranted or feasible, and quick estimates of the system response may suffice. Moreover, in the conceptual design phase, estimates of seismic demands are needed as design targets. For these and many other reasons, a simplified process that provides quick and reasonable estimates of seismic demands is much needed.
With the increased emphasis on deformation-based seismic design, it is most desirable to establish relationships between a spectral deformation quantity (i.e., the spectral displacement at the first mode period) and structural deformation quantities that control design and performance. Figure 5-96 illustrates a process that may be useful as a vehicle to close the loop between spectral displacement demand and element deformation demands. The following discussion explores relationships between individual parts of the loop for essentially regular WSMF structures. Data obtained from the time history results of the baseline study are used to explore these relationships. The last part of the loop, which relates story drift demands to element deformation demands, is not addressed here, but is discussed in Gupta and Krawinkler (1999).
The loop illustrated in Figure 5-96 assumes that stable relationships can be found between the spectral displacement demand at the first mode period of the structure and the system and element deformation demands, using the following definitions:
MDOF modification factor, αMDOF, a factor that relates the elastic spectral displacement demand at the first mode period of the structure to the elastic roof drift demand of the MDOF structure, neglecting P-delta effects.
Inelasticity modification factor, αINEL, a factor that relates the elastic roof drift demand to the inelastic roof drift demand, neglecting P-delta effects.
P-delta modification factor, αP∆, a factor that accounts for the effect of P-delta on the inelastic roof drift demand.
Story drift modification factor, αST, a factor that relates individual story drift demands to the roof drift demand.
Element deformations modification function, αELM, a function that relates the story drift demand to the elements plastic deformation demands. The development of such a modification function for the specific case of regular WSMF structures is presented in detail in Gupta and Krawinkler (1999).
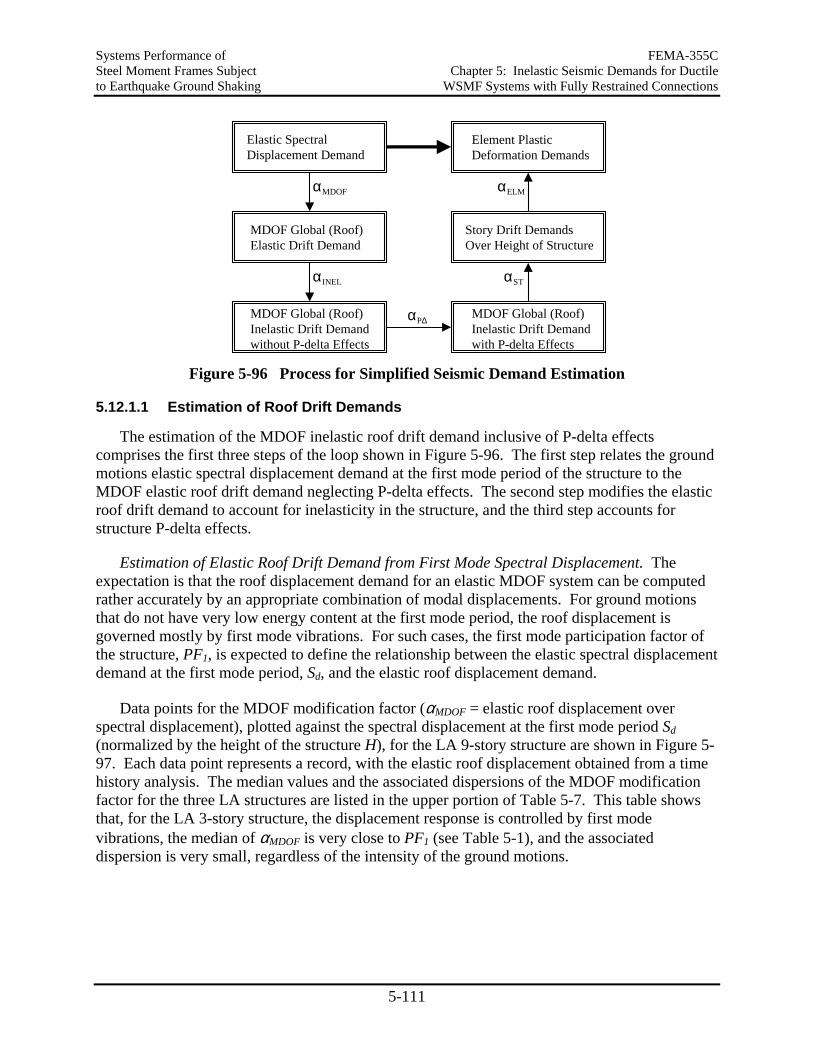
Systems Performance of FEMA-355C Steel Moment Frames Subject Chapter 5: Inelastic Seismic Demands for Ductile to Earthquake Ground Shaking WSMF Systems with Fully Restrained Connections
5-111
Elastic Spectral Displacement Demand
αMDOF
MDOF Global (Roof) Elastic Drift Demand
αINEL
MDOF Global (Roof) Inelastic Drift Demandwithout P-delta Effects
MDOF Global (Roof) Inelastic Drift Demandwith P-delta Effects
αP∆
αST
Story Drift DemandsOver Height of Structure
Element PlasticDeformation Demands
αELM
Figure 5-96 Process for Simplified Seismic Demand Estimation
5.12.1.1 Estimation of Roof Drift Demands
The estimation of the MDOF inelastic roof drift demand inclusive of P-delta effects comprises the first three steps of the loop shown in Figure 5-96. The first step relates the ground motions elastic spectral displacement demand at the first mode period of the structure to the MDOF elastic roof drift demand neglecting P-delta effects. The second step modifies the elastic roof drift demand to account for inelasticity in the structure, and the third step accounts for structure P-delta effects.
Estimation of Elastic Roof Drift Demand from First Mode Spectral Displacement. The expectation is that the roof displacement demand for an elastic MDOF system can be computed rather accurately by an appropriate combination of modal displacements. For ground motions that do not have very low energy content at the first mode period, the roof displacement is governed mostly by first mode vibrations. For such cases, the first mode participation factor of the structure, PF1, is expected to define the relationship between the elastic spectral displacement demand at the first mode period, Sd, and the elastic roof displacement demand.
Data points for the MDOF modification factor (αMDOF = elastic roof displacement over spectral displacement), plotted against the spectral displacement at the first mode period Sd (normalized by the height of the structure H), for the LA 9-story structure are shown in Figure 5-97. Each data point represents a record, with the elastic roof displacement obtained from a time history analysis. The median values and the associated dispersions of the MDOF modification factor for the three LA structures are listed in the upper portion of Table 5-7. This table shows that, for the LA 3-story structure, the displacement response is controlled by first mode vibrations, the median of αMDOF is very close to PF1 (see Table 5-1), and the associated dispersion is very small, regardless of the intensity of the ground motions.
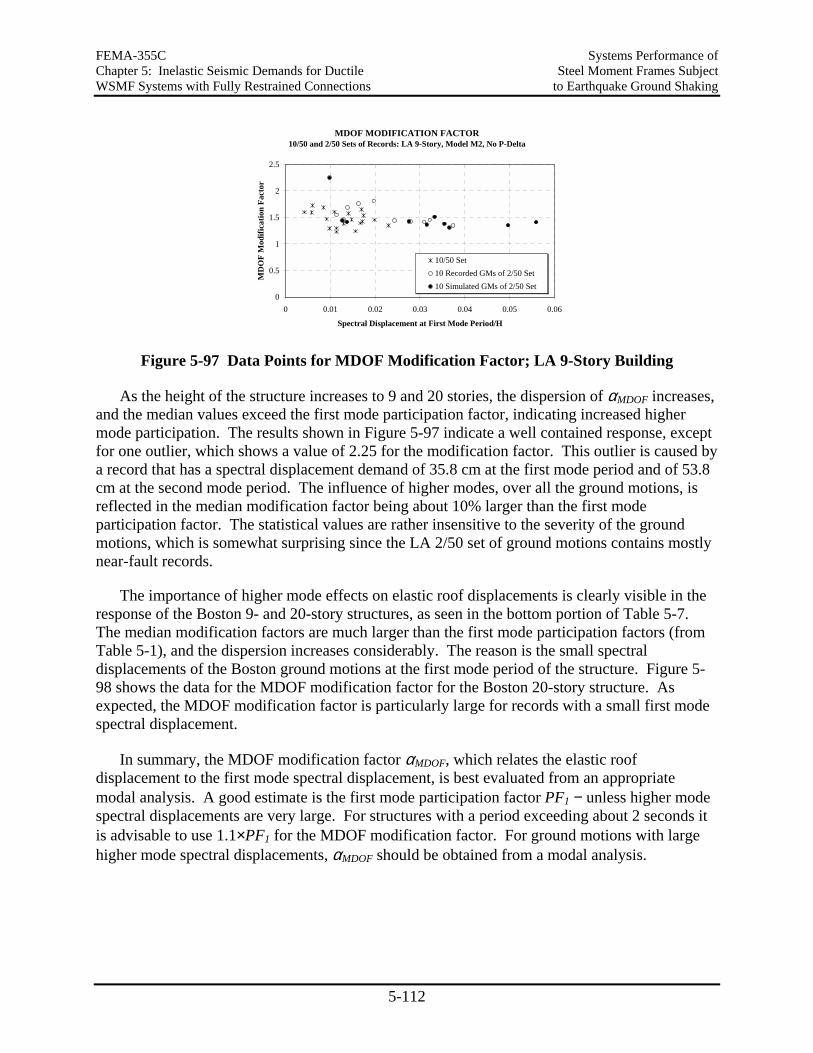
FEMA-355C Systems Performance of Chapter 5: Inelastic Seismic Demands for Ductile Steel Moment Frames Subject WSMF Systems with Fully Restrained Connections to Earthquake Ground Shaking
5-112
MDOF MODIFICATION FACTOR10/50 and 2/50 Sets of Records: LA 9-Story, Model M2, No P-Delta
0
0.5
1
1.5
2
2.5
0 0.01 0.02 0.03 0.04 0.05 0.06
Spectral Displacement at First Mode Period/H
MD
OF
Mod
ifica
tion
Fact
or10/50 Set10 Recorded GMs of 2/50 Set10 Simulated GMs of 2/50 Set
Figure 5-97 Data Points for MDOF Modification Factor; LA 9-Story Building
As the height of the structure increases to 9 and 20 stories, the dispersion of αMDOF increases, and the median values exceed the first mode participation factor, indicating increased higher mode participation. The results shown in Figure 5-97 indicate a well contained response, except for one outlier, which shows a value of 2.25 for the modification factor. This outlier is caused by a record that has a spectral displacement demand of 35.8 cm at the first mode period and of 53.8 cm at the second mode period. The influence of higher modes, over all the ground motions, is reflected in the median modification factor being about 10% larger than the first mode participation factor. The statistical values are rather insensitive to the severity of the ground motions, which is somewhat surprising since the LA 2/50 set of ground motions contains mostly near-fault records.
The importance of higher mode effects on elastic roof displacements is clearly visible in the response of the Boston 9- and 20-story structures, as seen in the bottom portion of Table 5-7. The median modification factors are much larger than the first mode participation factors (from Table 5-1), and the dispersion increases considerably. The reason is the small spectral displacements of the Boston ground motions at the first mode period of the structure. Figure 5-98 shows the data for the MDOF modification factor for the Boston 20-story structure. As expected, the MDOF modification factor is particularly large for records with a small first mode spectral displacement.
In summary, the MDOF modification factor αMDOF, which relates the elastic roof displacement to the first mode spectral displacement, is best evaluated from an appropriate modal analysis. A good estimate is the first mode participation factor PF1 − unless higher mode spectral displacements are very large. For structures with a period exceeding about 2 seconds it is advisable to use 1.1×PF1 for the MDOF modification factor. For ground motions with large higher mode spectral displacements, αMDOF should be obtained from a modal analysis.
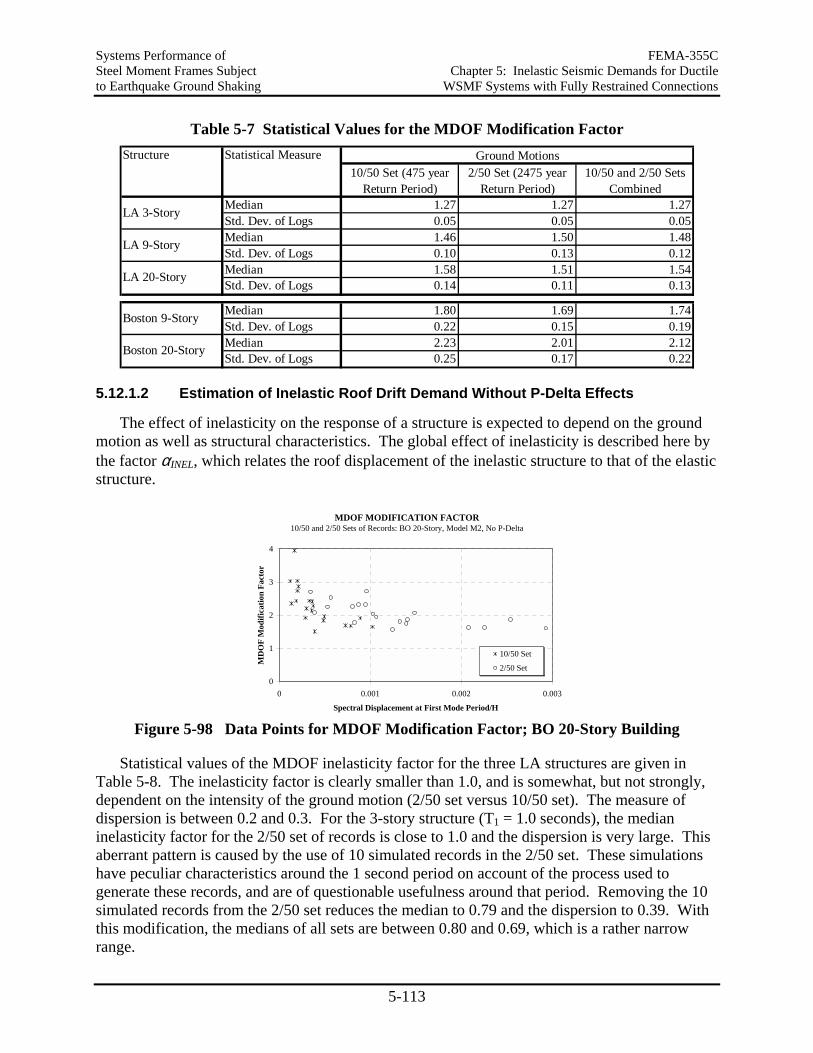
Systems Performance of FEMA-355C Steel Moment Frames Subject Chapter 5: Inelastic Seismic Demands for Ductile to Earthquake Ground Shaking WSMF Systems with Fully Restrained Connections
5-113
Table 5-7 Statistical Values for the MDOF Modification Factor
Median 1.27 1.27 1.27Std. Dev. of Logs 0.05 0.05 0.05Median 1.46 1.50 1.48Std. Dev. of Logs 0.10 0.13 0.12Median 1.58 1.51 1.54Std. Dev. of Logs 0.14 0.11 0.13
Median 1.80 1.69 1.74Std. Dev. of Logs 0.22 0.15 0.19Median 2.23 2.01 2.12Std. Dev. of Logs 0.25 0.17 0.22
Structure Statistical Measure Ground Motions
LA 3-Story
LA 9-Story
LA 20-Story
Boston 9-Story
Boston 20-Story
10/50 Set (475 year Return Period)
2/50 Set (2475 year Return Period)
10/50 and 2/50 Sets Combined
5.12.1.2 Estimation of Inelastic Roof Drift Demand Without P-Delta Effects
The effect of inelasticity on the response of a structure is expected to depend on the ground motion as well as structural characteristics. The global effect of inelasticity is described here by the factor αINEL, which relates the roof displacement of the inelastic structure to that of the elastic structure.
MDOF MODIFICATION FACTOR10/50 and 2/50 Sets of Records: BO 20-Story, Model M2, No P-Delta
0
1
2
3
4
0 0.001 0.002 0.003
Spectral Displacement at First Mode Period/H
MD
OF
Mod
ifica
tion
Fact
or
10/50 Set
2/50 Set
Figure 5-98 Data Points for MDOF Modification Factor; BO 20-Story Building
Statistical values of the MDOF inelasticity factor for the three LA structures are given in Table 5-8. The inelasticity factor is clearly smaller than 1.0, and is somewhat, but not strongly, dependent on the intensity of the ground motion (2/50 set versus 10/50 set). The measure of dispersion is between 0.2 and 0.3. For the 3-story structure (T1 = 1.0 seconds), the median inelasticity factor for the 2/50 set of records is close to 1.0 and the dispersion is very large. This aberrant pattern is caused by the use of 10 simulated records in the 2/50 set. These simulations have peculiar characteristics around the 1 second period on account of the process used to generate these records, and are of questionable usefulness around that period. Removing the 10 simulated records from the 2/50 set reduces the median to 0.79 and the dispersion to 0.39. With this modification, the medians of all sets are between 0.80 and 0.69, which is a rather narrow range.
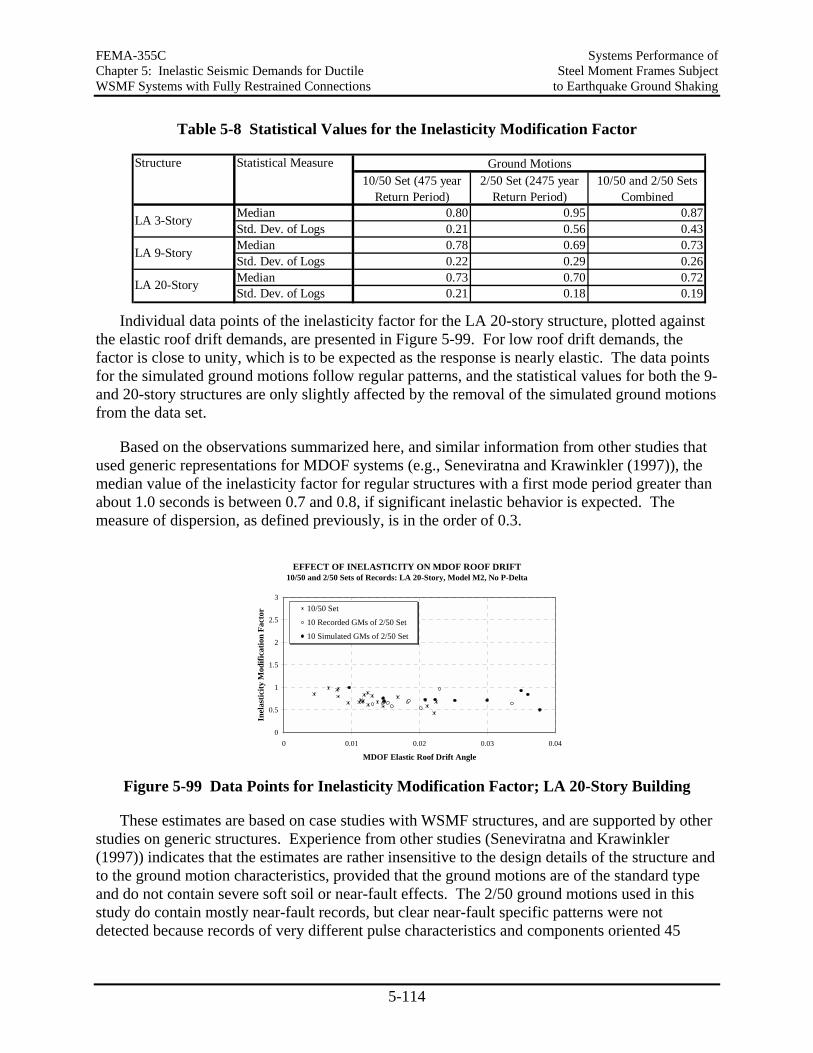
FEMA-355C Systems Performance of Chapter 5: Inelastic Seismic Demands for Ductile Steel Moment Frames Subject WSMF Systems with Fully Restrained Connections to Earthquake Ground Shaking
5-114
Table 5-8 Statistical Values for the Inelasticity Modification Factor
Median 0.80 0.95 0.87Std. Dev. of Logs 0.21 0.56 0.43Median 0.78 0.69 0.73Std. Dev. of Logs 0.22 0.29 0.26Median 0.73 0.70 0.72Std. Dev. of Logs 0.21 0.18 0.19
Structure Statistical Measure Ground Motions10/50 and 2/50 Sets
Combined2/50 Set (2475 year
Return Period)10/50 Set (475 year
Return Period)
LA 3-Story
LA 9-Story
LA 20-Story
Individual data points of the inelasticity factor for the LA 20-story structure, plotted against the elastic roof drift demands, are presented in Figure 5-99. For low roof drift demands, the factor is close to unity, which is to be expected as the response is nearly elastic. The data points for the simulated ground motions follow regular patterns, and the statistical values for both the 9- and 20-story structures are only slightly affected by the removal of the simulated ground motions from the data set.
Based on the observations summarized here, and similar information from other studies that used generic representations for MDOF systems (e.g., Seneviratna and Krawinkler (1997)), the median value of the inelasticity factor for regular structures with a first mode period greater than about 1.0 seconds is between 0.7 and 0.8, if significant inelastic behavior is expected. The measure of dispersion, as defined previously, is in the order of 0.3.
EFFECT OF INELASTICITY ON MDOF ROOF DRIFT10/50 and 2/50 Sets of Records: LA 20-Story, Model M2, No P-Delta
0
0.5
1
1.5
2
2.5
3
0 0.01 0.02 0.03 0.04
MDOF Elastic Roof Drift Angle
Inel
astic
ity M
odifi
catio
n Fa
ctor 10/50 Set
10 Recorded GMs of 2/50 Set
10 Simulated GMs of 2/50 Set
Figure 5-99 Data Points for Inelasticity Modification Factor; LA 20-Story Building
These estimates are based on case studies with WSMF structures, and are supported by other studies on generic structures. Experience from other studies (Seneviratna and Krawinkler (1997)) indicates that the estimates are rather insensitive to the design details of the structure and to the ground motion characteristics, provided that the ground motions are of the standard type and do not contain severe soft soil or near-fault effects. The 2/50 ground motions used in this study do contain mostly near-fault records, but clear near-fault specific patterns were not detected because records of very different pulse characteristics and components oriented 45
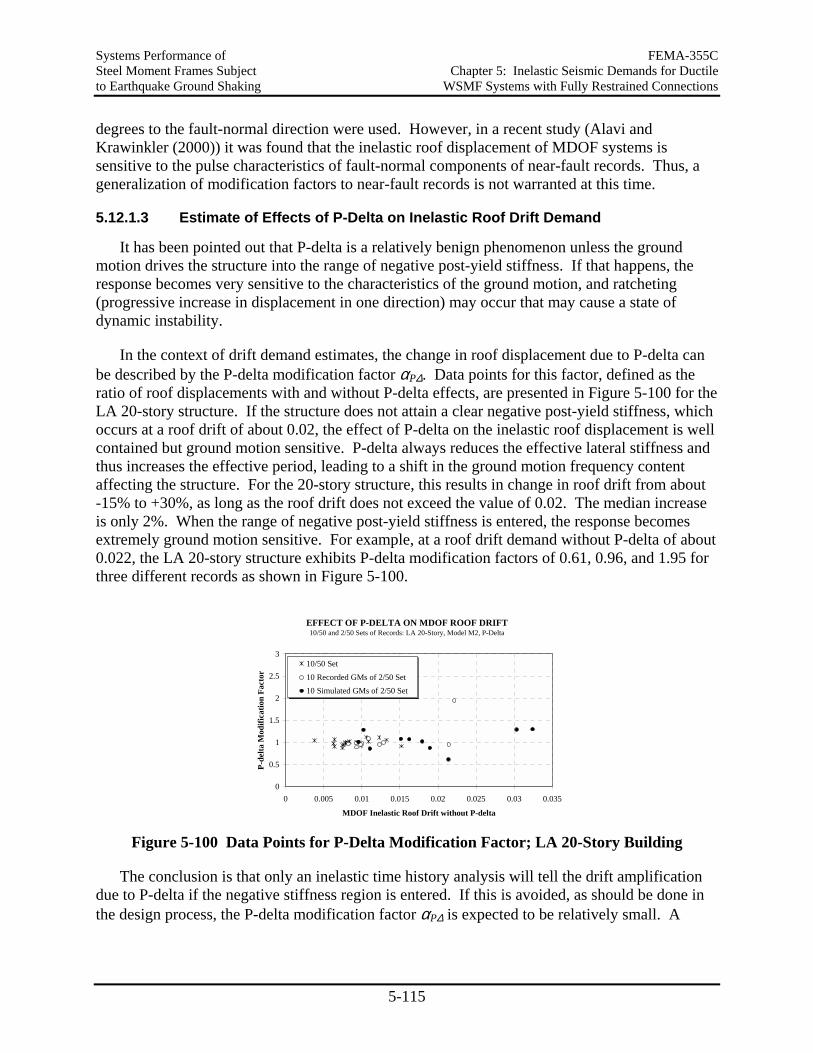
Systems Performance of FEMA-355C Steel Moment Frames Subject Chapter 5: Inelastic Seismic Demands for Ductile to Earthquake Ground Shaking WSMF Systems with Fully Restrained Connections
5-115
degrees to the fault-normal direction were used. However, in a recent study (Alavi and Krawinkler (2000)) it was found that the inelastic roof displacement of MDOF systems is sensitive to the pulse characteristics of fault-normal components of near-fault records. Thus, a generalization of modification factors to near-fault records is not warranted at this time.
5.12.1.3 Estimate of Effects of P-Delta on Inelastic Roof Drift Demand
It has been pointed out that P-delta is a relatively benign phenomenon unless the ground motion drives the structure into the range of negative post-yield stiffness. If that happens, the response becomes very sensitive to the characteristics of the ground motion, and ratcheting (progressive increase in displacement in one direction) may occur that may cause a state of dynamic instability.
In the context of drift demand estimates, the change in roof displacement due to P-delta can be described by the P-delta modification factor αP∆. Data points for this factor, defined as the ratio of roof displacements with and without P-delta effects, are presented in Figure 5-100 for the LA 20-story structure. If the structure does not attain a clear negative post-yield stiffness, which occurs at a roof drift of about 0.02, the effect of P-delta on the inelastic roof displacement is well contained but ground motion sensitive. P-delta always reduces the effective lateral stiffness and thus increases the effective period, leading to a shift in the ground motion frequency content affecting the structure. For the 20-story structure, this results in change in roof drift from about -15% to +30%, as long as the roof drift does not exceed the value of 0.02. The median increase is only 2%. When the range of negative post-yield stiffness is entered, the response becomes extremely ground motion sensitive. For example, at a roof drift demand without P-delta of about 0.022, the LA 20-story structure exhibits P-delta modification factors of 0.61, 0.96, and 1.95 for three different records as shown in Figure 5-100.
EFFECT OF P-DELTA ON MDOF ROOF DRIFT10/50 and 2/50 Sets of Records: LA 20-Story, Model M2, P-Delta
0
0.5
1
1.5
2
2.5
3
0 0.005 0.01 0.015 0.02 0.025 0.03 0.035
MDOF Inelastic Roof Drift without P-delta
P-de
lta M
odifi
catio
n Fa
ctor
10/50 Set10 Recorded GMs of 2/50 Set10 Simulated GMs of 2/50 Set
Figure 5-100 Data Points for P-Delta Modification Factor; LA 20-Story Building
The conclusion is that only an inelastic time history analysis will tell the drift amplification due to P-delta if the negative stiffness region is entered. If this is avoided, as should be done in the design process, the P-delta modification factor αP∆ is expected to be relatively small. A
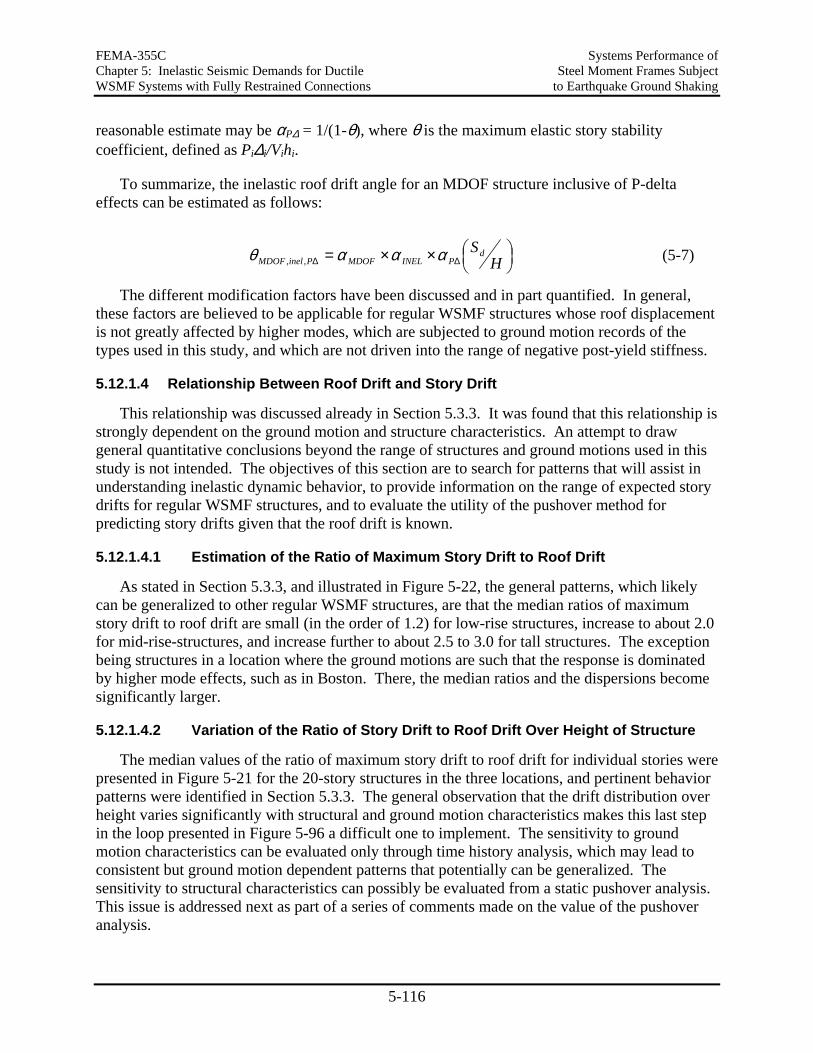
FEMA-355C Systems Performance of Chapter 5: Inelastic Seismic Demands for Ductile Steel Moment Frames Subject WSMF Systems with Fully Restrained Connections to Earthquake Ground Shaking
5-116
reasonable estimate may be αP∆ = 1/(1-θ), where θ is the maximum elastic story stability coefficient, defined as Pi∆i/Vihi.
To summarize, the inelastic roof drift angle for an MDOF structure inclusive of P-delta effects can be estimated as follows:
,,
××= ∆∆ H
SdPINELMDOFPinelMDOF αααθ (5-7)
The different modification factors have been discussed and in part quantified. In general, these factors are believed to be applicable for regular WSMF structures whose roof displacement is not greatly affected by higher modes, which are subjected to ground motion records of the types used in this study, and which are not driven into the range of negative post-yield stiffness.
5.12.1.4 Relationship Between Roof Drift and Story Drift
This relationship was discussed already in Section 5.3.3. It was found that this relationship is strongly dependent on the ground motion and structure characteristics. An attempt to draw general quantitative conclusions beyond the range of structures and ground motions used in this study is not intended. The objectives of this section are to search for patterns that will assist in understanding inelastic dynamic behavior, to provide information on the range of expected story drifts for regular WSMF structures, and to evaluate the utility of the pushover method for predicting story drifts given that the roof drift is known.
5.12.1.4.1 Estimation of the Ratio of Maximum Story Drift to Roof Drift
As stated in Section 5.3.3, and illustrated in Figure 5-22, the general patterns, which likely can be generalized to other regular WSMF structures, are that the median ratios of maximum story drift to roof drift are small (in the order of 1.2) for low-rise structures, increase to about 2.0 for mid-rise-structures, and increase further to about 2.5 to 3.0 for tall structures. The exception being structures in a location where the ground motions are such that the response is dominated by higher mode effects, such as in Boston. There, the median ratios and the dispersions become significantly larger.
5.12.1.4.2 Variation of the Ratio of Story Drift to Roof Drift Over Height of Structure
The median values of the ratio of maximum story drift to roof drift for individual stories were presented in Figure 5-21 for the 20-story structures in the three locations, and pertinent behavior patterns were identified in Section 5.3.3. The general observation that the drift distribution over height varies significantly with structural and ground motion characteristics makes this last step in the loop presented in Figure 5-96 a difficult one to implement. The sensitivity to ground motion characteristics can be evaluated only through time history analysis, which may lead to consistent but ground motion dependent patterns that potentially can be generalized. The sensitivity to structural characteristics can possibly be evaluated from a static pushover analysis. This issue is addressed next as part of a series of comments made on the value of the pushover analysis.
Systems Performance of FEMA-355C Steel Moment Frames Subject Chapter 5: Inelastic Seismic Demands for Ductile to Earthquake Ground Shaking WSMF Systems with Fully Restrained Connections
5-117
5.12.2 Value of Pushover Analysis
The static pushover analysis has been used extensively in this report to identify (and often quantify) behavior characteristics. Its shortcomings, which have to do primarily with the inability to quantify higher mode effects and find multiple weaknesses in the structure, have been pointed out. This section is concerned more with issues that can be addressed by a pushover analysis rather than with its shortcomings.
A static pushover analysis often is used to evaluate the seismic performance of structures. The presently practiced process is to predict a target displacement, push the structure under a predetermined or adaptive load pattern to this target displacement, and compare the element or story force and deformation demands computed at the target displacement to available capacities. Implicit in this process is the assumption that the element and story demands computed at the target displacement are reasonable surrogates of the maximum demands experienced by the structure in the “design earthquake.”
There are several issues of concern in this process. One is the ability to predict with reasonable accuracy the roof displacement caused by the design ground motion. Based on information in the literature, and confirmed in this study for regular WSMF structures, this can be achieved with good confidence provided that the roof displacement is controlled by the first mode, and the P-delta sensitive range is not entered. Another concern is the ability to predict maximum dynamic story drift demands over the height at a given target displacement. This issue is addressed later. The third concern is the validity of using the roof displacement caused by the design ground motion as the target displacement. This concern is addressed next.
As stated earlier and as shown in Figure 5-21, for all nine structures the median ratios of maximum story drift to roof drift are larger than 1.0 for most or all stories, and in many cases much larger than 1.0. The reason is that maximum story drifts do not occur simultaneously in all stories. Thus, the sum of maximum story displacements is always larger than the roof displacement. If the pushover is to capture all maximum story drifts over the height of the structure, then the target displacement should be amplified by the ratio of the sum of maximum story displacements to maximum roof displacement.
Table 5-9 presents approximations of the median values of this ratio for the nine structures and all sets of ground motions. For the 3-story LA and Seattle structures, this amplification factor is small, but for all other structures it is significant. It is particularly large for structures that are dominated by higher mode effects. To some degree this factor is compensated for in the FEMA 273 nonlinear static analysis approach by assigning a value of 1.0 (in place of a lower value, such as about 0.75) to the inelasticity factor in the estimate of the target displacement, but for structures with large higher mode effects, this compensation is insufficient. This is one of several reasons why the pushover analysis will provide questionable estimates of drift demands for structures with important higher mode effects.
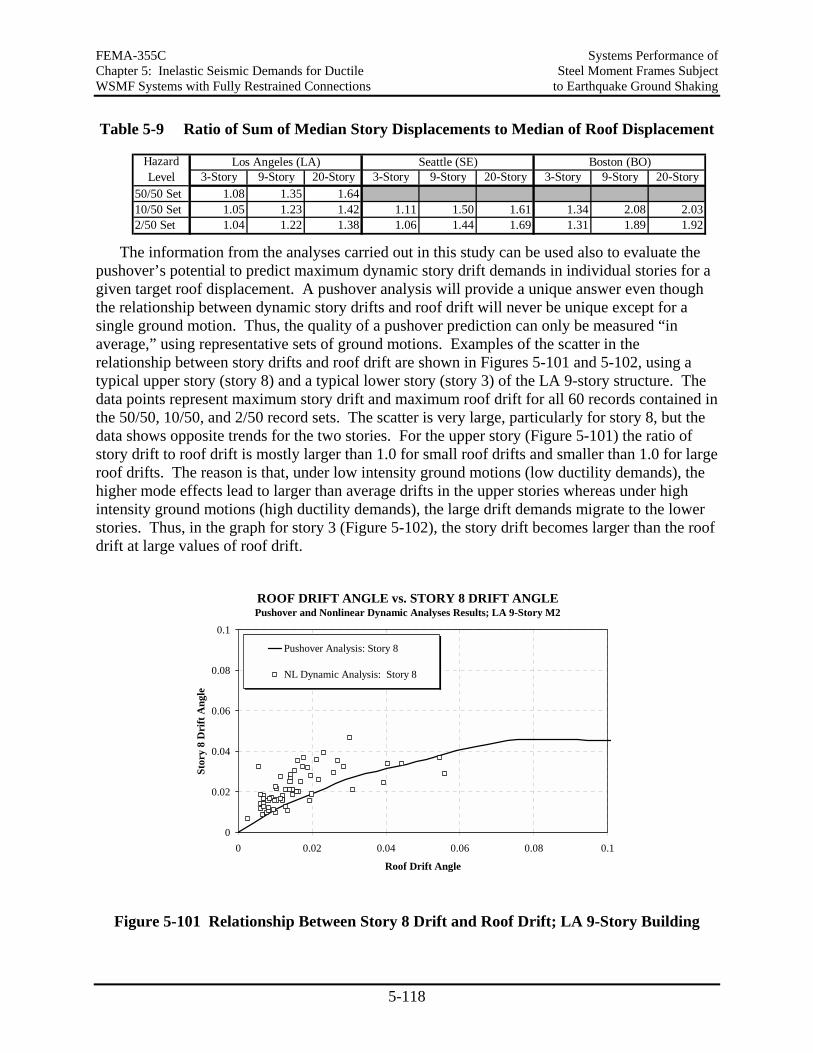
FEMA-355C Systems Performance of Chapter 5: Inelastic Seismic Demands for Ductile Steel Moment Frames Subject WSMF Systems with Fully Restrained Connections to Earthquake Ground Shaking
5-118
Table 5-9 Ratio of Sum of Median Story Displacements to Median of Roof Displacement
3-Story 9-Story 20-Story 3-Story 9-Story 20-Story 3-Story 9-Story 20-Story50/50 Set 1.08 1.35 1.6410/50 Set 1.05 1.23 1.42 1.11 1.50 1.61 1.34 2.08 2.032/50 Set 1.04 1.22 1.38 1.06 1.44 1.69 1.31 1.89 1.92
Seattle (SE) Boston (BO)Hazard Level
Los Angeles (LA)
The information from the analyses carried out in this study can be used also to evaluate the
pushover’s potential to predict maximum dynamic story drift demands in individual stories for a given target roof displacement. A pushover analysis will provide a unique answer even though the relationship between dynamic story drifts and roof drift will never be unique except for a single ground motion. Thus, the quality of a pushover prediction can only be measured “in average,” using representative sets of ground motions. Examples of the scatter in the relationship between story drifts and roof drift are shown in Figures 5-101 and 5-102, using a typical upper story (story 8) and a typical lower story (story 3) of the LA 9-story structure. The data points represent maximum story drift and maximum roof drift for all 60 records contained in the 50/50, 10/50, and 2/50 record sets. The scatter is very large, particularly for story 8, but the data shows opposite trends for the two stories. For the upper story (Figure 5-101) the ratio of story drift to roof drift is mostly larger than 1.0 for small roof drifts and smaller than 1.0 for large roof drifts. The reason is that, under low intensity ground motions (low ductility demands), the higher mode effects lead to larger than average drifts in the upper stories whereas under high intensity ground motions (high ductility demands), the large drift demands migrate to the lower stories. Thus, in the graph for story 3 (Figure 5-102), the story drift becomes larger than the roof drift at large values of roof drift.
ROOF DRIFT ANGLE vs. STORY 8 DRIFT ANGLEPushover and Nonlinear Dynamic Analyses Results; LA 9-Story M2
0
0.02
0.04
0.06
0.08
0.1
0 0.02 0.04 0.06 0.08 0.1
Roof Drift Angle
Stor
y 8
Dri
ft A
ngle
Pushover Analysis: Story 8
NL Dynamic Analysis: Story 8
Figure 5-101 Relationship Between Story 8 Drift and Roof Drift; LA 9-Story Building
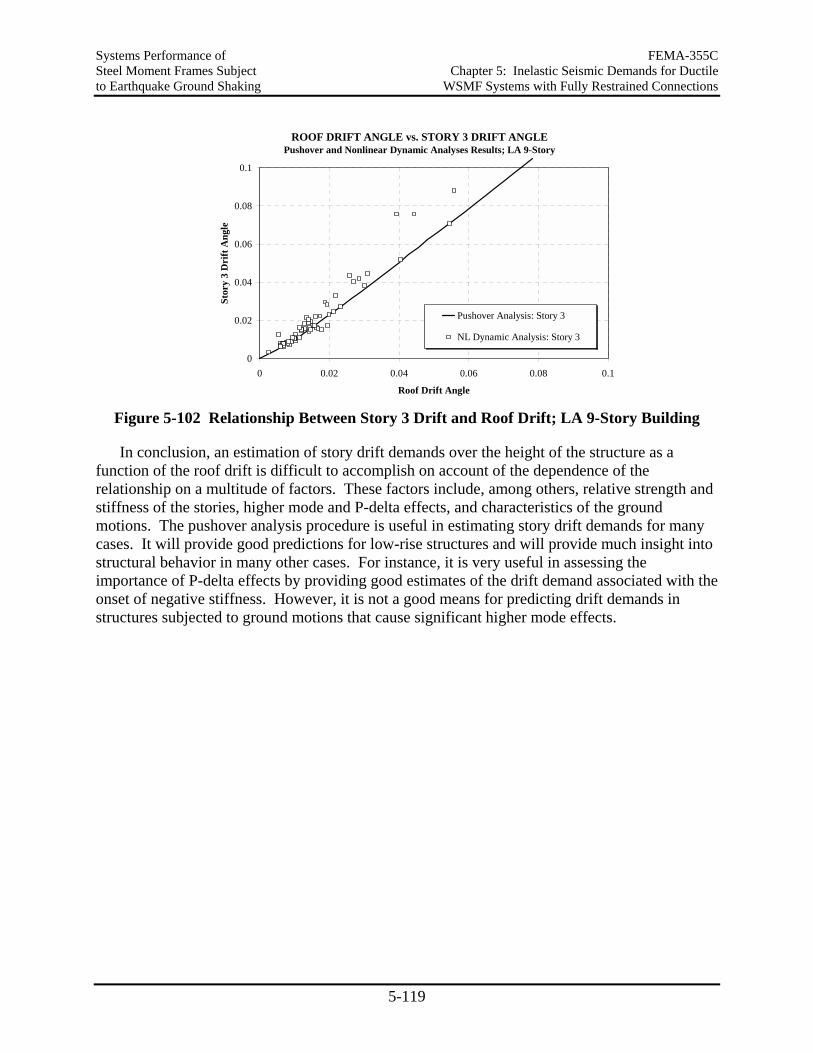
Systems Performance of FEMA-355C Steel Moment Frames Subject Chapter 5: Inelastic Seismic Demands for Ductile to Earthquake Ground Shaking WSMF Systems with Fully Restrained Connections
5-119
ROOF DRIFT ANGLE vs. STORY 3 DRIFT ANGLEPushover and Nonlinear Dynamic Analyses Results; LA 9-Story
0
0.02
0.04
0.06
0.08
0.1
0 0.02 0.04 0.06 0.08 0.1
Roof Drift Angle
Stor
y 3
Dri
ft A
ngle
Pushover Analysis: Story 3
NL Dynamic Analysis: Story 3
Figure 5-102 Relationship Between Story 3 Drift and Roof Drift; LA 9-Story Building
In conclusion, an estimation of story drift demands over the height of the structure as a function of the roof drift is difficult to accomplish on account of the dependence of the relationship on a multitude of factors. These factors include, among others, relative strength and stiffness of the stories, higher mode and P-delta effects, and characteristics of the ground motions. The pushover analysis procedure is useful in estimating story drift demands for many cases. It will provide good predictions for low-rise structures and will provide much insight into structural behavior in many other cases. For instance, it is very useful in assessing the importance of P-delta effects by providing good estimates of the drift demand associated with the onset of negative stiffness. However, it is not a good means for predicting drift demands in structures subjected to ground motions that cause significant higher mode effects.
Systems Performance of FEMA-355C Steel Moment Frames Subject Chapter 6: Behavior of Frames to Earthquake Ground Shaking with Pre-Northridge Connections
6-1
6. BEHAVIOR OF FRAMES WITH PRE-NORTHRIDGE CONNECTIONS
6.1 Introduction
This chapter focuses on the evaluation of the effects of connection fractures on the response and safety of WSMF structures with pre-Northridge connections. Procedures proposed and results obtained in a SAC study performed at Stanford University (Cornell and Luco (1999), Luco and Cornell (1998a, 1998b, 2000)) are summarized here. Most of the text and figures presented in this chapter are reproduced from these references.
The chapter describes a methodology for evaluating the effects of connection fractures on story drift demands, summarizes case studies on these effects for the SAC model buildings, considering various fracture scenarios with fractures occurring only in beams or fractures occurring in both beams and columns, and presents a preliminary methodology for the safety evaluation of structures. In a much expanded format, this methodology has become the basis for the structural reliability approach advocated in the SAC Guidelines.
6.2 Analytical Modeling of Fractured Connections
Several models have been proposed for modeling the deterioration caused at beam or column ends by fractures at the welds connecting the beam flanges to the column flange. One model for representing deterioration at beam ends has been described in Section 3.1.1. A curvilinear model is proposed in Maison and Kasai (1997). The model used in the Stanford study is that incorporated by Foutch and Shih (1996) in the computer program DRAIN-2DX. This model, which is shown in Figure 6-1, is described here in more detail because it forms the basis for the results presented in this chapter for structures with fractured connections.
6.2.1 Beam Flange Fractures
The fracture element is actually a rotational spring that is placed at each end of an elastic beam in order to emulate plastic hinging (point plasticity) and fracture. The moment-rotation hysteretic behavior of the fracture element mimics that seen in full-scale laboratory tests of moment-resisting beam-column connections which experience top and/or bottom beam flange fracture.
Experimental test results (SAC, 1996), as well as field inspections of moment-resisting connections damaged by the Northridge earthquake, suggest that a brittle connection may fracture before reaching its nominal plastic moment, Mp. An example moment-rotation (M-θ) hysteresis for a fracture element demonstrating pre-yield, or “early,” or “premature,” fracture of the bottom beam flange is shown in Figure 6-1(a).
For a brittle connection which does not fracture “early,” fracture is assumed to occur at a pre-specified plastic rotation, θf. The fracture element is used to capture inelastic behavior only, and therefore the total rotation of the fracture element is equivalent to the plastic rotation of the connection. Before fracture, the moment-rotation hysteretic behavior of the element is rigid-plastic with strain hardening, as for a ductile connection. An example hysteresis for a fracture
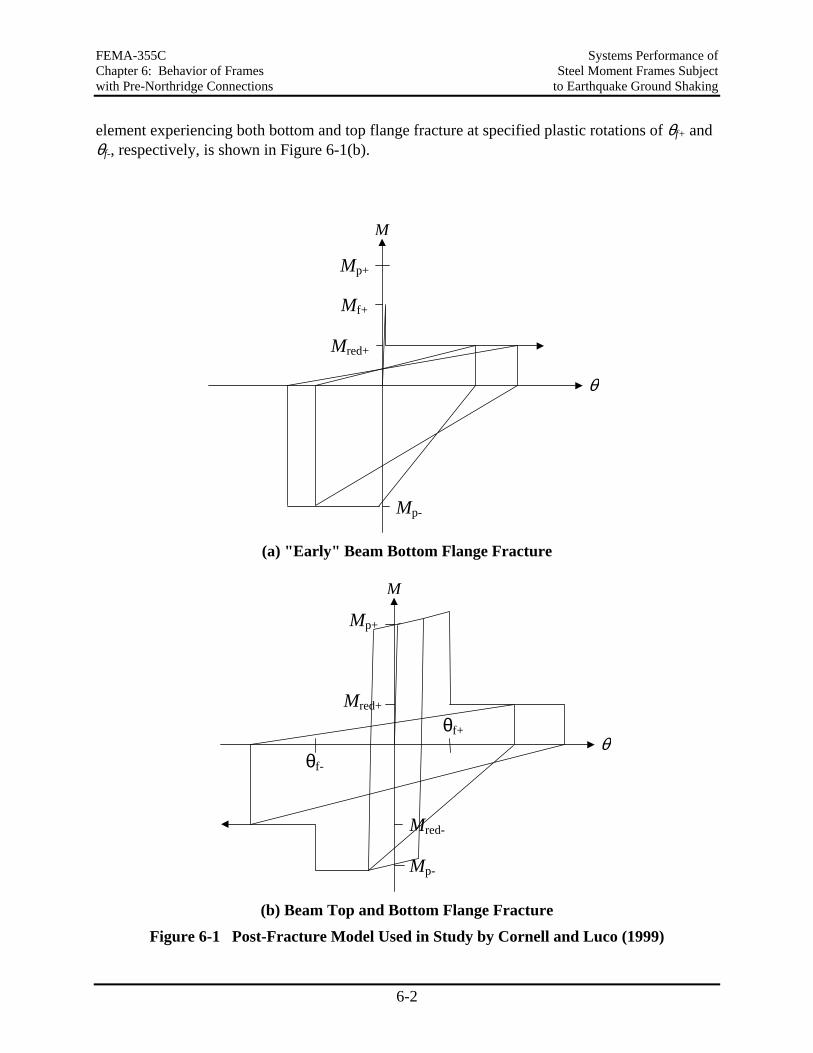
FEMA-355C Systems Performance of Chapter 6: Behavior of Frames Steel Moment Frames Subject with Pre-Northridge Connections to Earthquake Ground Shaking
6-2
element experiencing both bottom and top flange fracture at specified plastic rotations of θf+ and θf-, respectively, is shown in Figure 6-1(b).
Mf+
Mp+
Mred+
Mp-
θ
M
(a) "Early" Beam Bottom Flange Fracture
θf+
Mp+
Mred+
Mp-
θ
M
θf-
Mred-
(b) Beam Top and Bottom Flange Fracture
Figure 6-1 Post-Fracture Model Used in Study by Cornell and Luco (1999)
Systems Performance of FEMA-355C Steel Moment Frames Subject Chapter 6: Behavior of Frames to Earthquake Ground Shaking with Pre-Northridge Connections
6-3
As seen in Figure 6-1, associated with fracture is a drop in strength to some percentage of Mp (i.e., Mred / Mp). However, as shown in Figure 6-1(a) for the bottom flange fracture only case, this drop in strength only takes effect when the fractured flange is “in tension.” Full strength is assumed to be maintained when the fractured flange is in compression, although no strain hardening is allowed after the first fracture (top or bottom flange). Also note that after the first fracture, the hysteretic behavior becomes peak-oriented, amounting to a reduction in stiffness as well. 6.2.2 Column Fractures
A more difficult problem is the modeling of fracture into and across columns. Hall (1998a) used a fiber model in which individual fibers fracture at a prescribed stress (or strain) level. Once all fibers have fractured, the column is assumed to resist neither moment, axial force (tension or compression), nor shear force. In the Stanford study, fracture into the column flange (and web) above and below a panel zone area is incorporated into the analysis model using rotational springs placed at the ends of columns above and below every moment-resisting connection. The rotational springs used to capture column fracture behave differently than those used to emulate beam flange fracture. As detailed below, changes to the DRAIN-2DX Element #10 were implemented in order to incorporate the desired column fracture behavior.
Column fracture is assumed to be “triggered” by an adjacent beam flange connection. This follows the idea that fracture is initiated in the beam flange weld, but can either propagate through the beam flange/web or across the column flange/web. If column fracture is not “triggered,” the rotational springs at the ends of a column act rigidly, with (effectively) infinite strength. Any plastic hinging at the column ends, therefore, is captured by the inelastic beam/column element used to model the columns, which accounts for P-M interaction. In other words, unless column fracture is “triggered,” the “column springs” have no effect on the strength or stiffness of the columns.
If column fracture is “triggered” the column springs become rigid-perfectly plastic with a reduced moment strength. This moment strength, Mred,col, (in both “positive” and “negative” bending) is assumed to be some small fraction (i.e. 10% or 20%) of the plastic moment of the column, Mp,col.
As already mentioned, column fracture is actually “triggered” by the rotational beam springs used to model plastic hinging and fracture at a beam-column connection. When a beam spring designated as a column fracture “trigger” reaches the maximum plastic rotation (or fraction of Mp for “early” fracturing beam connections) at which it would normally fracture its top or bottom beam flange, it instead triggers column fracture in the column spring above or below the connection (bottom beam flange triggers column fracture below the connection, top flange above). Meanwhile, the beam spring which acts as a column fracture “trigger” remains ductile, reflecting the scenario in which a crack has propagated into the column flange/web instead of the beam flange/web.
Since we cannot predict when fracture will propagate into a connected column (instead of the connected beam) the locations of column fracture “triggers” are randomly simulated assuming that the probability that a connection fracture will propagate into the column flange/web rather
FEMA-355C Systems Performance of Chapter 6: Behavior of Frames Steel Moment Frames Subject with Pre-Northridge Connections to Earthquake Ground Shaking
6-4
than the adjacent beam flange/web is a certain percentage (e.g., 25%). This amounts to randomly designating approximately 25% of the beam flange connections (bottom and/or top) as column fracture “triggers.” Note that the same procedure was used to designate “early” (i.e., pre-yield) fracturing connections.
All described beam and column flange fracture models are simplifications of reality to various degrees. They were developed and implemented at a time when only few test results were available. In retrospect, the models could be improved by explicitly considering slab participation and accounting more realistically for local deterioration phenomena such as delayed crack closure in the presence of web yielding or web bolt slip or fracture. The simplifications in the model used in this study likely did affect the predicted drift demands, but are not believed to substantially change the general conclusions.
6.3 Effects of Beam Flange Connection Fractures on Drift Demands
A central portion of the SAC program is the investigation of the effects of fractured connections on the seismic behavior of WSMF structures. In this context it is assumed that the story drift demand is a relevant parameter for assessing the effects of fractures on seismic performance. Performance may be concerned with various limit states, ranging from incipient damage to incipient collapse. The issue of collapse safety is addressed specifically in Section 6.6.
This section is concerned with the effects of fractures that lead to a separation of either the beam bottom flange only (BFO cases) or a separation of both beam top and bottom flanges (TBF cases). The beam flange fracture model described in Section 6.2 is utilized to define the deterioration of the beam properties at the connection. The case of fractures propagating into and across the column flange is treated separately in Section 6.4. The write-up in this section is an abbreviated version of the reference Luco and Cornell (2000). More detailed information can be found in Cornell and Luco (1999).
6.3.1 Approach
Nonlinear dynamic analyses are carried out for the SAC model structures with “brittle” connections subjected to the SAC ground motions at two different probability levels (10/50 and 2/50). Story drift demand statistics for the model structures with “brittle” connections (connections that may fracture) are compared to those for the model structures with “ductile” connections (connections are not permitted to fracture). The sensitivities of story drift demands to variations in the fracture parameters are explored.
Lacking a practical theoretical model that can accurately predict beam-column connection fracture, an empirical analysis model for brittle connection behavior is employed. Despite extensive testing and analysis, there remains major uncertainty associated with when and why a given connection will experience fracture and how fracture adversely affects the strength and stiffness of a connection. Thus, values for the parameters defining the brittle connection model, which are based on still limited experimental results, are varied, and the corresponding sensitivities of the structural drift response studied.
Systems Performance of FEMA-355C Steel Moment Frames Subject Chapter 6: Behavior of Frames to Earthquake Ground Shaking with Pre-Northridge Connections
6-5
For this study, the maximum (over all stories) peak story drift angle (denoted as θmax) is used as a convenient scalar demand measure that characterizes the collapse-level drift response. Likewise, average (over the stories) peak story drift angle (denoted as θave) is a scalar demand measure which may correlate well with the overall damage level for a structure. In addition to θmax and θave, the spatial variation of peak story drift angle demands (denoted as θi for story i) is used to compare the seismic response for each structure modeled with brittle versus ductile connections. Note that the ratio of θmax to θave is a measure of the spatial concentration of large θi values.
Rather than comparing the brittle versus ductile case seismic drift demands for the forty SAC earthquake records on a record-to-record basis, drift demand statistics for the 10/50 and 2/50 sets of ground motions are calculated. Specifically, the “median” and the “1-sigma level” statistics for the drift demands (θmax, θave, or θi) resulting from the twenty earthquake records at each probability level are examined. The “median” is estimated here typically by the geometric mean, or equivalently the exponential of the average of the natural logs of the data. The “1-sigma level” is estimated here in most cases by the median multiplied by the exponential of the standard deviation of the natural logs of the data.
Each of the symmetric SAC buildings is represented analytically by a two-dimensional (DRAIN-2DX) model of one of its exterior moment-resisting frames. P-∆ effects are accounted for during the analyses, as are column P-M interaction and column end plastic hinging. Simple centerline (M1) models of the buildings are analyzed, rather than explicitly modeling the panel zones, since the interaction between large panel zone deformations and beam-to-column connection fracture had not been sufficiently studied. Unless this interaction is properly accounted for, weak panel zones could (unrealistically) inhibit connection fracture by limiting demands in the connected beam. Since panel zones are not explicitly modeled, total (beam plus panel zone) plastic rotations observed at fracture in laboratory tests are used to calibrate the plastic rotation fracture capacity discussed below.
6.3.1.1 Approach for Sensitivity Studies
Due to the random nature of brittle connection behavior and the uncertainties that arise from limited test data, it is important to study the sensitivities of the seismic drift response of the model structures to variations in each of the fracture parameters. By doing so, a better understanding of the possible effects of connection fractures is developed. To study the sensitivity of the seismic drift response for a model structure with brittle connections to variations in the fracture parameter values, a “star” design method is employed. “Base case” values of the fracture parameters are designated, which represent the best estimates for average values of the fracture parameters. One parameter at a time, extreme but plausible values of the fracture parameter are adopted. Intermediate values of the parameter are considered only if significant changes in the seismic drift response (with respect to the base case) are observed.
6.3.2 Beam Bottom Flange Connection Fractures Only (BFO Cases)
Consistent with field and laboratory observations, which saw relatively few fractures of the top beam-flange connection, an early project decision was made to consider as a base case only
FEMA-355C Systems Performance of Chapter 6: Behavior of Frames Steel Moment Frames Subject with Pre-Northridge Connections to Earthquake Ground Shaking
6-6
the potential of bottom beam-flange connection fracture. Subsequently, attention was focused on the possibility of both top and bottom beam-flange connection fracture.
Base Case Fracture Model Parameters. To account for the possibility of pre-yield fracture of the bottom beam-flange connection, it is assumed that the probability, p, of any particular connection fracturing “early” is 25% in the base case. Thus, it is anticipated that approximately 25% of the connections in the model structures will experience early fracture of the bottom beam-flange. The precise locations of these early fracturing connections are assigned randomly, assuming mutual independence of the connection locations. Through simulation, a different spatial distribution, or pattern, of early fracturing connections is designated for each earthquake record used in dynamic analysis, rather than running multiple simulations for each record. Since the record-to-record variability of the drift response is much larger than the variability associated with different patterns of early fracturing connections, this simulation scheme is warranted (Cornell and Luco (1999), Maison and Bonowitz (1999)). The connections which fracture early are set to fracture at 75% of Mp in positive bending.
For the approximately 75% of all connections which do not fracture early in the base case, fracture of the bottom beam-flange is postulated to occur when the plastic rotation in positive bending (bottom flange in tension) reaches θf+ = 0.015 radians. Thus, the average plastic rotation capacity of all the connections, including those which fracture early, is only ~0.01. This average value of plastic rotation capacity compares well to the total (beam plus panel zone) plastic rotations at fracture observed in SAC Phase I laboratory tests (SAC (1996)).
Once fracture occurs (early or not), for the base case the positive moment capacity is reduced to 30% of Mp, whereas the connection retains its full moment capacity in negative bending.
6.3.2.1 Brittle Base Case Results for LA 9-Story Structure
Although results for all six LA and Seattle model structures are used to develop general conclusions, detailed results are provided for only the LA 9-story model structure; a brief summary of the results for the other model structures is also included.
6.3.2.1.1 θmax and θave Statistics
The median and 1-sigma level θmax and θave for the 10/50 and 2/50 ground motions are given in Table 6-1 for the LA 9-story model structure with ductile connections and with brittle base connections. Also listed in the table are the percentage increases in maxθ and aveθ from the ductile case to the brittle base case, which indicate that base case connection fractures have a small effect on the story drift demand statistics for this model structure. It is important to note, however, that the percentage increases in the story drift response statistics are larger at higher drift levels (e.g., at larger story drift demands in the ductile case). These results are intuitive, since one would expect more connections to fracture when the story drifts are larger and hence a larger effect relative to the ductile case.
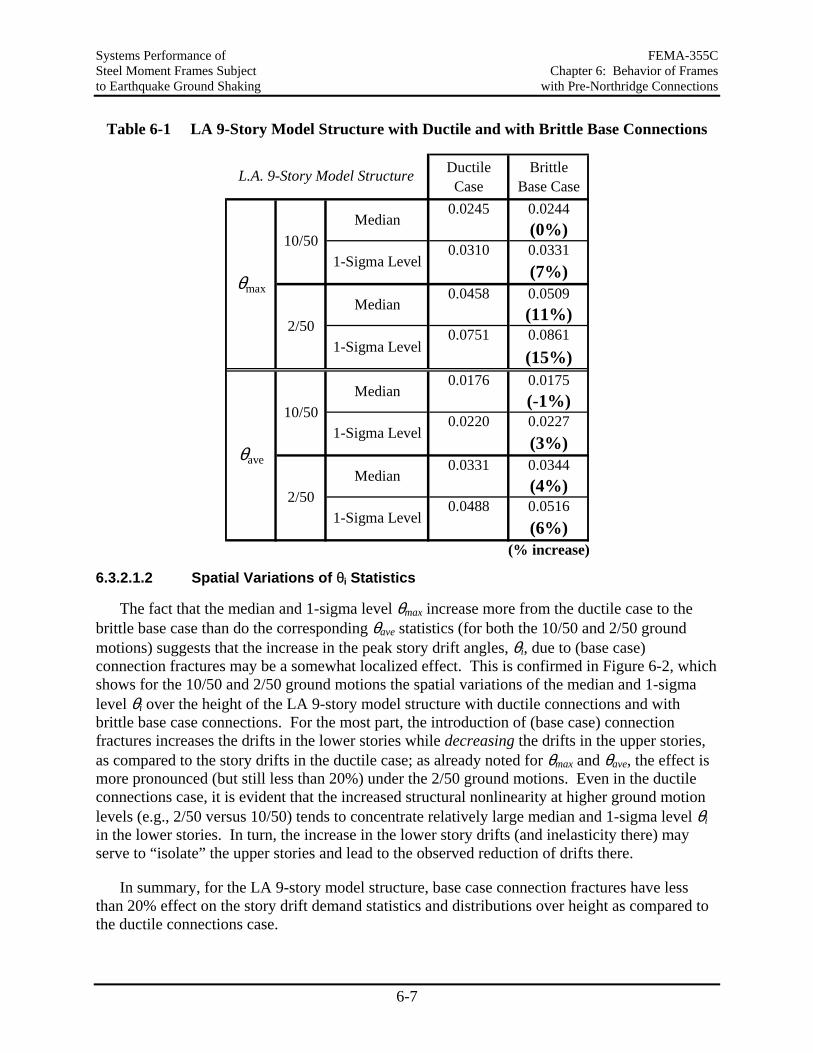
Systems Performance of FEMA-355C Steel Moment Frames Subject Chapter 6: Behavior of Frames to Earthquake Ground Shaking with Pre-Northridge Connections
6-7
Table 6-1 LA 9-Story Model Structure with Ductile and with Brittle Base Connections
Ductile BrittleCase Base Case
0.0245 0.0244(0%)
0.0310 0.0331(7%)
0.0458 0.0509(11%)
0.0751 0.0861(15%)
0.0176 0.0175(-1%)
0.0220 0.0227(3%)
0.0331 0.0344(4%)
0.0488 0.0516(6%)
(% increase)
Median
1-Sigma Level
Median
1-Sigma Level
Median
1-Sigma Level
Median
1-Sigma Level
10/50
θave
θmax
2/50
10/50
2/50
L.A. 9-Story Model Structure
6.3.2.1.2 Spatial Variations of θi Statistics
The fact that the median and 1-sigma level θmax increase more from the ductile case to the brittle base case than do the corresponding θave statistics (for both the 10/50 and 2/50 ground motions) suggests that the increase in the peak story drift angles, θi, due to (base case) connection fractures may be a somewhat localized effect. This is confirmed in Figure 6-2, which shows for the 10/50 and 2/50 ground motions the spatial variations of the median and 1-sigma level θi over the height of the LA 9-story model structure with ductile connections and with brittle base case connections. For the most part, the introduction of (base case) connection fractures increases the drifts in the lower stories while decreasing the drifts in the upper stories, as compared to the story drifts in the ductile case; as already noted for θmax and θave, the effect is more pronounced (but still less than 20%) under the 2/50 ground motions. Even in the ductile connections case, it is evident that the increased structural nonlinearity at higher ground motion levels (e.g., 2/50 versus 10/50) tends to concentrate relatively large median and 1-sigma level θi in the lower stories. In turn, the increase in the lower story drifts (and inelasticity there) may serve to “isolate” the upper stories and lead to the observed reduction of drifts there.
In summary, for the LA 9-story model structure, base case connection fractures have less than 20% effect on the story drift demand statistics and distributions over height as compared to the ductile connections case.
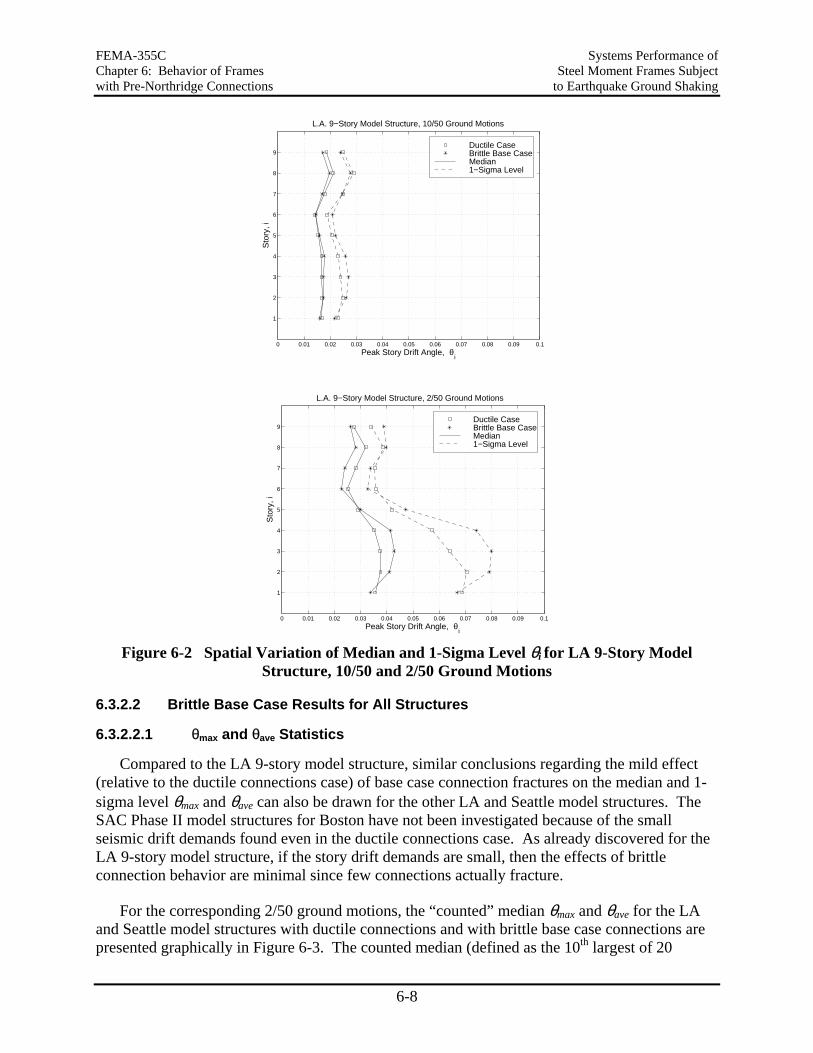
FEMA-355C Systems Performance of Chapter 6: Behavior of Frames Steel Moment Frames Subject with Pre-Northridge Connections to Earthquake Ground Shaking
6-8
0 0.01 0.02 0.03 0.04 0.05 0.06 0.07 0.08 0.09 0.1
1
2
3
4
5
6
7
8
9
L.A. 9−Story Model Structure, 2/50 Ground Motions
Peak Story Drift Angle, θi
Sto
ry, i
Ductile Case Brittle Base CaseMedian 1−Sigma Level
Figure 6-2 Spatial Variation of Median and 1-Sigma Level θi for LA 9-Story Model
Structure, 10/50 and 2/50 Ground Motions
6.3.2.2 Brittle Base Case Results for All Structures
6.3.2.2.1 θmax and θave Statistics
Compared to the LA 9-story model structure, similar conclusions regarding the mild effect (relative to the ductile connections case) of base case connection fractures on the median and 1-sigma level θmax and θave can also be drawn for the other LA and Seattle model structures. The SAC Phase II model structures for Boston have not been investigated because of the small seismic drift demands found even in the ductile connections case. As already discovered for the LA 9-story model structure, if the story drift demands are small, then the effects of brittle connection behavior are minimal since few connections actually fracture.
For the corresponding 2/50 ground motions, the “counted” median θmax and θave for the LA and Seattle model structures with ductile connections and with brittle base case connections are presented graphically in Figure 6-3. The counted median (defined as the 10th largest of 20
0 0.01 0.02 0.03 0.04 0.05 0.06 0.07 0.08 0.09 0.1
1
2
3
4
5
6
7
8
9
L.A. 9−Story Model Structure, 10/50 Ground Motions
Peak Story Drift Angle, θi
Sto
ry, i
Ductile Case Brittle Base CaseMedian 1−Sigma Level
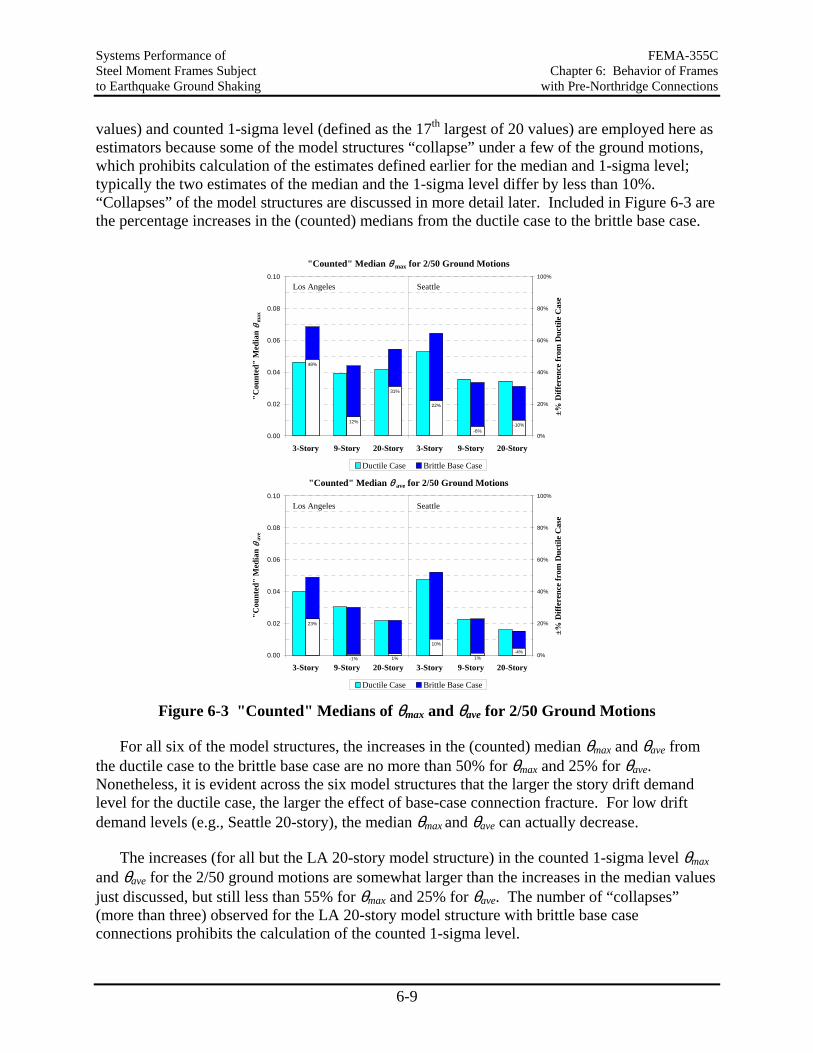
Systems Performance of FEMA-355C Steel Moment Frames Subject Chapter 6: Behavior of Frames to Earthquake Ground Shaking with Pre-Northridge Connections
6-9
values) and counted 1-sigma level (defined as the 17th largest of 20 values) are employed here as estimators because some of the model structures “collapse” under a few of the ground motions, which prohibits calculation of the estimates defined earlier for the median and 1-sigma level; typically the two estimates of the median and the 1-sigma level differ by less than 10%. “Collapses” of the model structures are discussed in more detail later. Included in Figure 6-3 are the percentage increases in the (counted) medians from the ductile case to the brittle base case.
"Counted" Median θ max for 2/50 Ground Motions
48%
12%
31%
22%
-10%-6%
0.00
0.02
0.04
0.06
0.08
0.10
3-Story 9-Story 20-Story 3-Story 9-Story 20-Story
"Cou
nted
" M
edia
n θ
max
0%
20%
40%
60%
80%
100%
±% D
iffer
ence
from
Duc
tile
Cas
e
Ductile Case Brittle Base Case
Los Angeles Seattle
"Counted" Median θ ave for 2/50 Ground Motions
23%
10%
-4%1%1%-1%0.00
0.02
0.04
0.06
0.08
0.10
3-Story 9-Story 20-Story 3-Story 9-Story 20-Story
"Cou
nted
" M
edia
n θ
ave
0%
20%
40%
60%
80%
100%
±% D
iffer
ence
from
Duc
tile
Cas
e
Ductile Case Brittle Base Case
Los Angeles Seattle
Figure 6-3 "Counted" Medians of θmax and θave for 2/50 Ground Motions
For all six of the model structures, the increases in the (counted) median θmax and θave from the ductile case to the brittle base case are no more than 50% for θmax and 25% for θave. Nonetheless, it is evident across the six model structures that the larger the story drift demand level for the ductile case, the larger the effect of base-case connection fracture. For low drift demand levels (e.g., Seattle 20-story), the median θmax and θave can actually decrease.
The increases (for all but the LA 20-story model structure) in the counted 1-sigma level θmax and θave for the 2/50 ground motions are somewhat larger than the increases in the median values just discussed, but still less than 55% for θmax and 25% for θave. The number of “collapses” (more than three) observed for the LA 20-story model structure with brittle base case connections prohibits the calculation of the counted 1-sigma level.
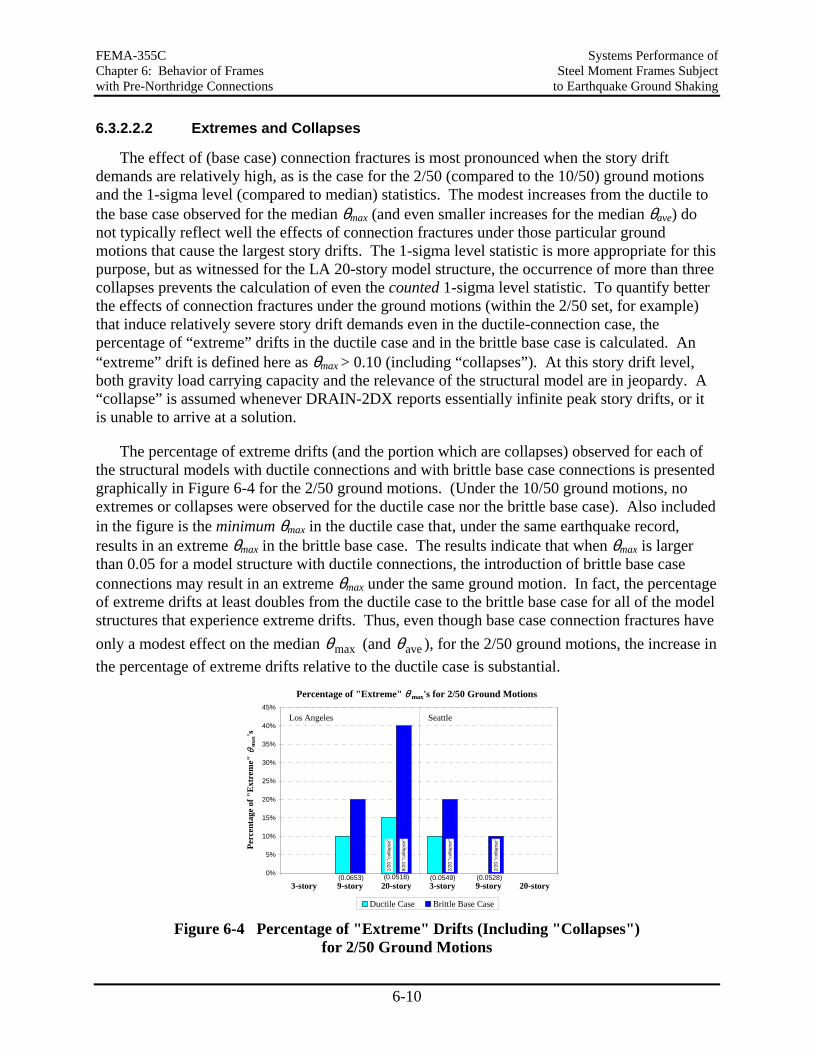
FEMA-355C Systems Performance of Chapter 6: Behavior of Frames Steel Moment Frames Subject with Pre-Northridge Connections to Earthquake Ground Shaking
6-10
6.3.2.2.2 Extremes and Collapses
The effect of (base case) connection fractures is most pronounced when the story drift demands are relatively high, as is the case for the 2/50 (compared to the 10/50) ground motions and the 1-sigma level (compared to median) statistics. The modest increases from the ductile to the base case observed for the median θmax (and even smaller increases for the median θave) do not typically reflect well the effects of connection fractures under those particular ground motions that cause the largest story drifts. The 1-sigma level statistic is more appropriate for this purpose, but as witnessed for the LA 20-story model structure, the occurrence of more than three collapses prevents the calculation of even the counted 1-sigma level statistic. To quantify better the effects of connection fractures under the ground motions (within the 2/50 set, for example) that induce relatively severe story drift demands even in the ductile-connection case, the percentage of “extreme” drifts in the ductile case and in the brittle base case is calculated. An “extreme” drift is defined here as θmax > 0.10 (including “collapses”). At this story drift level, both gravity load carrying capacity and the relevance of the structural model are in jeopardy. A “collapse” is assumed whenever DRAIN-2DX reports essentially infinite peak story drifts, or it is unable to arrive at a solution.
The percentage of extreme drifts (and the portion which are collapses) observed for each of the structural models with ductile connections and with brittle base case connections is presented graphically in Figure 6-4 for the 2/50 ground motions. (Under the 10/50 ground motions, no extremes or collapses were observed for the ductile case nor the brittle base case). Also included in the figure is the minimum θmax in the ductile case that, under the same earthquake record, results in an extreme θmax in the brittle base case. The results indicate that when θmax is larger than 0.05 for a model structure with ductile connections, the introduction of brittle base case connections may result in an extreme θmax under the same ground motion. In fact, the percentage of extreme drifts at least doubles from the ductile case to the brittle base case for all of the model structures that experience extreme drifts. Thus, even though base case connection fractures have only a modest effect on the median maxθ (and aveθ ), for the 2/50 ground motions, the increase in the percentage of extreme drifts relative to the ductile case is substantial.
Percentage of "Extreme" θ max's for 2/50 Ground Motions
(0.0549) (0.0528)(0.0518)(0.0653)
1/20
"col
laps
e"
2/20
"col
laps
e"
2/20
"col
laps
e"
8/20
"col
laps
e"
0%
5%
10%
15%
20%
25%
30%
35%
40%
45%
3-story 9-story 20-story 3-story 9-story 20-story
Perc
enta
ge o
f "E
xtre
me"
θm
ax's
Ductile Case Brittle Base Case
Los Angeles Seattle
Figure 6-4 Percentage of "Extreme" Drifts (Including "Collapses")
for 2/50 Ground Motions
Systems Performance of FEMA-355C Steel Moment Frames Subject Chapter 6: Behavior of Frames to Earthquake Ground Shaking with Pre-Northridge Connections
6-11
6.3.2.2.3 Summary of Brittle Base Case Results
In general, for the brittle base case, the effects of connection fractures on the story drift demands (relative to the ductile case) are perhaps less than one might have anticipated. Recall, however, that only bottom beam-flange fracture is permitted for the base case, and a connection is presumed to retain its full strength when the fractured bottom flange is in compression. Thus, at any one instant, at most one-half of the beam connections in a story will reflect the 70% strength loss associated with base case fracture. Apparently, the case of bottom flange fracture only appears to be not overwhelming, at least for the ground motions levels considered here. The potential of top beam-flange fracture in addition to bottom flange fracture is considered later.
6.3.2.3 Results of Sensitivity Studies
Although the base case described above may have represented best the empirical data available at the time, the actual values of the various parameters that define the fracture model are uncertain and likely random (i.e., vary among like connections). Thus it is important to evaluate the sensitivity of the seismic drift response to variations in the parameters of the fracture model. For the most part, the sensitivity studies are performed using the LA 9-story model structure, occasionally confirming with results for the LA 3-story model structure. The sensitivity of story drift demands to each parameter of the fracture model is judged primarily by comparing the median and 1-sigma level θmax (under the 10/50 and 2/50 ground motions) obtained for the base case to those for the case with the parameter of interest varied.
6.3.2.3.1 Sensitivity to Early Fractures
For the base case, the probability, p, of a connection experiencing “early” (i.e., pre-yield) fracture of the bottom beam-flange was taken to be 25%. As a sensitivity exercise, a “perturbed” base case model with p=75% is considered, which implies that approximately 75% of the beam bottom flanges will fracture early (i.e., at 75% of the yield moment, Mp). The increase in p is found to have almost no effect on the story drift demands. The resulting differences in the median and 1-sigma level θmax for both the 10/50 and 2/50 ground motions are at most 2% for the LA 9-story model structure, and less than 15% for the LA 3-story model structure. For the LA 9-story model structure, the total number of bottom beam-flange fractures on average doubles when p is increased from 25% to 75%, yet the story drift demands change very little, perhaps due to the limited loss in strength associated with BFO fracture. Note that the average plastic rotation capacity for the “perturbed” base case with p=75% is ~0.002 radians. Given the insensitivity to p, the sensitivity of the story drift demands to the percentage of Mp+ at which early fracture occurs was not investigated.
To examine the sensitivity of the story drift demands to clustering of connections which fracture early, two deterministic “worst-case” patterns of early fracturing connections are considered for the LA 9-story model structure. Recall that θmax occurs in the upper stories (8th-9th) for most of the 10/50 ground motions and in the lower stories (2nd-3rd) for most of the 2/50 ground motions. Hence, for the two sensitivity cases, the approximately 25% of a total of 90 connections that fracture early in the base case are all positioned in first one and then the other of these two regions.
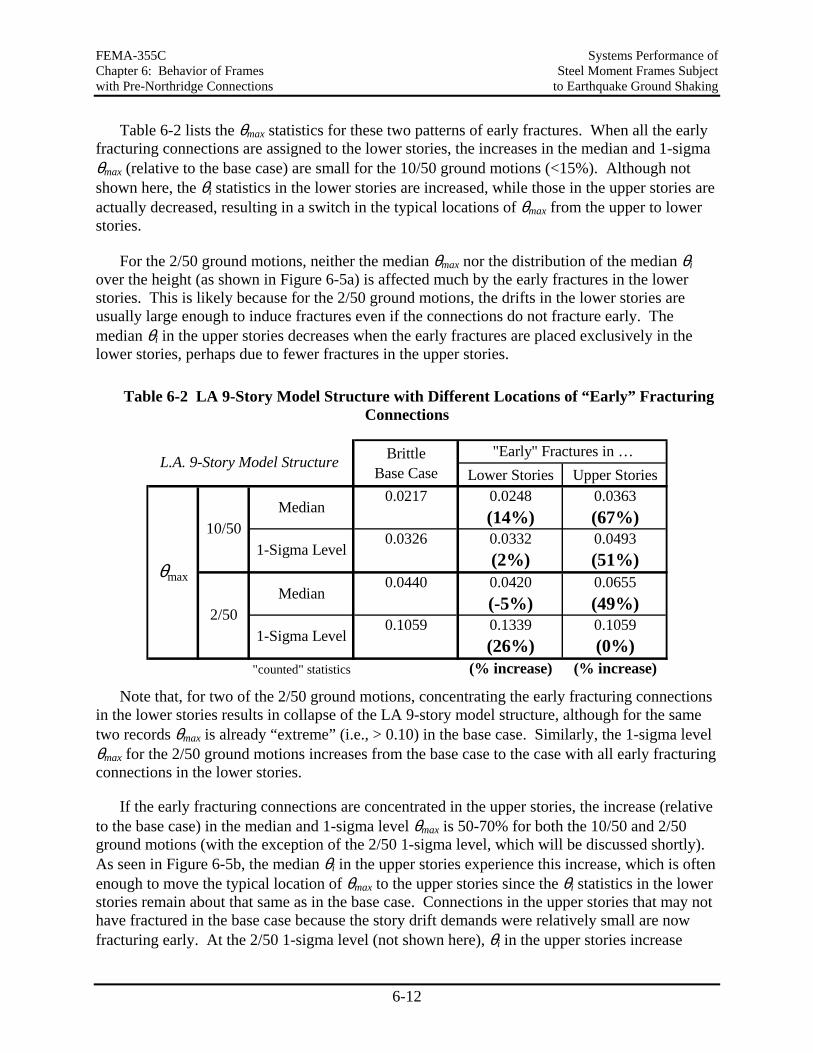
FEMA-355C Systems Performance of Chapter 6: Behavior of Frames Steel Moment Frames Subject with Pre-Northridge Connections to Earthquake Ground Shaking
6-12
Table 6-2 lists the θmax statistics for these two patterns of early fractures. When all the early fracturing connections are assigned to the lower stories, the increases in the median and 1-sigma θmax (relative to the base case) are small for the 10/50 ground motions (<15%). Although not shown here, the θi statistics in the lower stories are increased, while those in the upper stories are actually decreased, resulting in a switch in the typical locations of θmax from the upper to lower stories.
For the 2/50 ground motions, neither the median θmax nor the distribution of the median θi over the height (as shown in Figure 6-5a) is affected much by the early fractures in the lower stories. This is likely because for the 2/50 ground motions, the drifts in the lower stories are usually large enough to induce fractures even if the connections do not fracture early. The median θi in the upper stories decreases when the early fractures are placed exclusively in the lower stories, perhaps due to fewer fractures in the upper stories.
Table 6-2 LA 9-Story Model Structure with Different Locations of “Early” Fracturing Connections
BrittleBase Case Lower Stories Upper Stories
0.0217 0.0248 0.0363(14%) (67%)
0.0326 0.0332 0.0493(2%) (51%)
0.0440 0.0420 0.0655(-5%) (49%)
0.1059 0.1339 0.1059(26%) (0%)
"counted" statistics (% increase) (% increase)
"Early" Fractures in …
θmax
10/50
2/50
Median
1-Sigma Level
Median
1-Sigma Level
L.A. 9-Story Model Structure
Note that, for two of the 2/50 ground motions, concentrating the early fracturing connections
in the lower stories results in collapse of the LA 9-story model structure, although for the same two records θmax is already “extreme” (i.e., > 0.10) in the base case. Similarly, the 1-sigma level θmax for the 2/50 ground motions increases from the base case to the case with all early fracturing connections in the lower stories.
If the early fracturing connections are concentrated in the upper stories, the increase (relative to the base case) in the median and 1-sigma level θmax is 50-70% for both the 10/50 and 2/50 ground motions (with the exception of the 2/50 1-sigma level, which will be discussed shortly). As seen in Figure 6-5b, the median θi in the upper stories experience this increase, which is often enough to move the typical location of θmax to the upper stories since the θi statistics in the lower stories remain about that same as in the base case. Connections in the upper stories that may not have fractured in the base case because the story drift demands were relatively small are now fracturing early. At the 2/50 1-sigma level (not shown here), θi in the upper stories increase
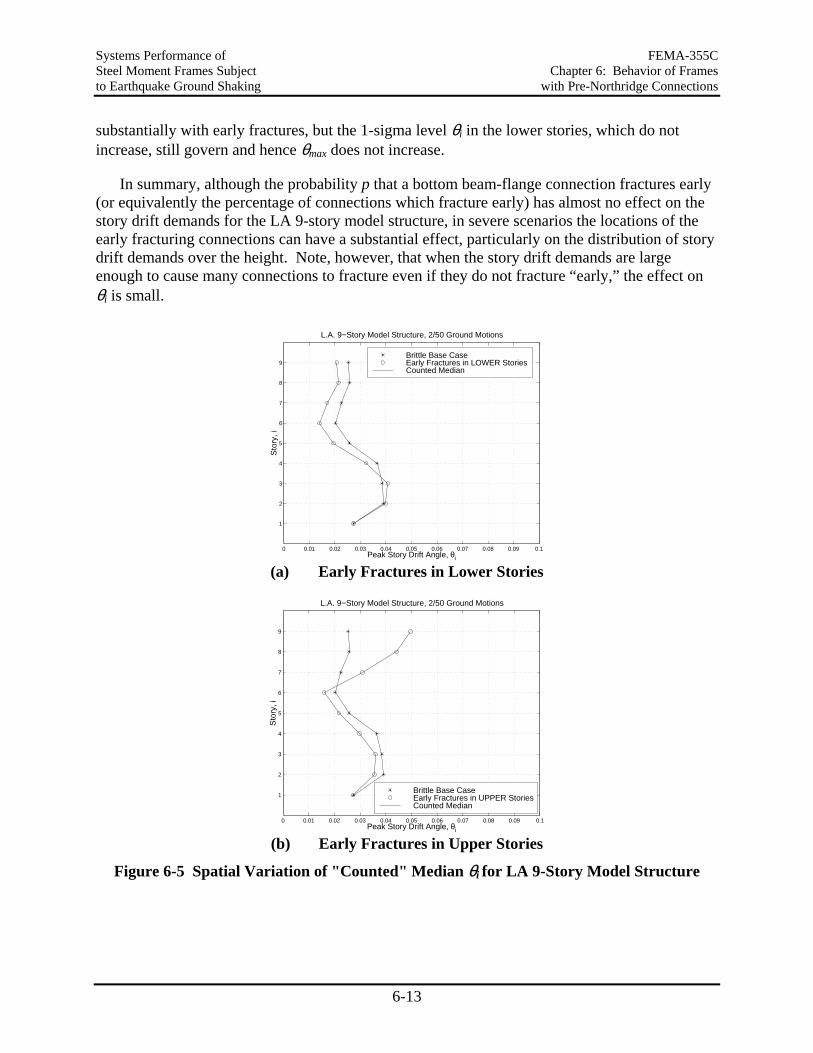
Systems Performance of FEMA-355C Steel Moment Frames Subject Chapter 6: Behavior of Frames to Earthquake Ground Shaking with Pre-Northridge Connections
6-13
substantially with early fractures, but the 1-sigma level θi in the lower stories, which do not increase, still govern and hence θmax does not increase.
In summary, although the probability p that a bottom beam-flange connection fractures early (or equivalently the percentage of connections which fracture early) has almost no effect on the story drift demands for the LA 9-story model structure, in severe scenarios the locations of the early fracturing connections can have a substantial effect, particularly on the distribution of story drift demands over the height. Note, however, that when the story drift demands are large enough to cause many connections to fracture even if they do not fracture “early,” the effect on θi is small.
0 0.01 0.02 0.03 0.04 0.05 0.06 0.07 0.08 0.09 0.1
1
2
3
4
5
6
7
8
9
L.A. 9−Story Model Structure, 2/50 Ground Motions
Peak Story Drift Angle, θi
Sto
ry, i
Brittle Base CaseEarly Fractures in LOWER StoriesCounted Median
(a) Early Fractures in Lower Stories
0 0.01 0.02 0.03 0.04 0.05 0.06 0.07 0.08 0.09 0.1
1
2
3
4
5
6
7
8
9
L.A. 9−Story Model Structure, 2/50 Ground Motions
Peak Story Drift Angle, θi
Sto
ry, i
Brittle Base CaseEarly Fractures in UPPER StoriesCounted Median
(b) Early Fractures in Upper Stories
Figure 6-5 Spatial Variation of "Counted" Median θi for LA 9-Story Model Structure
FEMA-355C Systems Performance of Chapter 6: Behavior of Frames Steel Moment Frames Subject with Pre-Northridge Connections to Earthquake Ground Shaking
6-14
6.3.2.3.2 Sensitivity to Plastic Rotation Capacity, θf+
Two extreme but plausible values of θf+, one lower and one higher than the base case value of 0.015 were considered, namely 0.005 and 0.03.
With θf+ = 0.005, more bottom flange fractures are expected than in the base case, but the resulting median and 1-sigma level θmax demands are increased by less than 15% for the LA 9-story model structure, as well as for the LA 3-story model structure. Note that for the “perturbed” base case with θf+ = 0.005, the average plastic rotation capacity, accounting for the connections that fracture early, is ~0.003 radians, which is close to that for the perturbed base case with p=75% (i.e., ~0.002 radians). In both cases the increases in the median and 1-sigma level θmax relative to the base case are relatively small.
With θf+ = 0.03, fewer bottom flange fractures are expected than in the base case. However, it is conceivable that by delaying connection fractures until the peak story drift demands are large, the sudden drop in strength due to fracture could have an increased effect. Nevertheless, results for the LA 9-story model structure indicate that the median and 1-sigma level θmax for the 10/50 and 2/50 ground motions decrease with the increase in θf+ to 0.03, but by less than 10%.
6.3.2.3.3 Sensitivity to Residual Moment Strength, Mred+
For the base case, the residual (positive) moment strength after fracture, Mred+, is estimated as 30% of Mp+. When a reduced Mred+ /Mp+ of 10% is considered, the counted median and 1-sigma level θmax are increased by less than 20% for the 10/50 and 2/50 ground motions and the LA 9-story model structure. A single collapse occurs when Mred+ /Mp+ = 10%, but it is under a ground motion which causes an extreme drift (θmax >10%) in the base case.
6.3.2.3.4 Summary of Results of Sensitivity Studies
The story drift demands (in particular θmax) for the LA 9-story model structure with brittle connections exhibit little sensitivity to variations from the base case of the parameters defining the connection fracture model. This lack of sensitivity is not unexpected considering that even the introduction of brittle base case connections has less than a 50% effect on the median θmax relative to the ductile connections case. Song and Ellingwood (1998), who also have studied the bottom beam-flange fracture case, found similar insensitivity.
Even though the values of each of the fracture model parameters are uncertain (due to limited testing) and likely random (vary from connection to connection), the insensitivity of the story drift demands to variations in these parameters from the base case suggests that it is unlikely worth the effort to randomize the base case fracture parameter values, especially in light of the relatively large record-to-record variability. This conclusion is confirmed by Song and Ellingwood (1998) as well as Maison and Bonowitz (1999). The plastic rotation capacity associated with beam top flange connection fracture, on the other hand, will be found to be an influential addition to the base case model that might well warrant randomization.
Systems Performance of FEMA-355C Steel Moment Frames Subject Chapter 6: Behavior of Frames to Earthquake Ground Shaking with Pre-Northridge Connections
6-15
6.3.3 Beam Top and Bottom Flange Connection Fractures (TBF Cases)
If only the potential for bottom beam-flange connection fractures is modeled, the limited drop in strength experienced by each story may explain why connection fractures have a less-than-anticipated effect on the seismic story drift demands. Thus the possibility of both beam top and bottom flange fractures is important to consider. Unfortunately, field and laboratory evidence for top flange connection fractures is sparse. In the field, the inspection of beam top flanges is often hindered by the presence of a slab. Until recently, most laboratory tests of full-scale beam-column connections did not include a slab, neglecting its potential effects on fracture of the top beam-flange. In addition, most experiments were stopped after fracture of the first, usually bottom, beam flange. Faced with the lack of empirical data that can be used to estimate the plastic rotation capacity for fracture of the beam top flange, θf-, several plausible values are considered. The remainder of the fracture model parameters retain the same values as used in the bottom flange fracture base case.
It is generally believed that the plastic rotation capacity for connection fracture is (on average) larger for the beam top flange than for the bottom flange (or in other words, larger in negative bending than in positive bending). In particular, the presence of a slab is thought to delay fracture of the top flange. As a “pessimistic” case, the same plastic rotation capacity is assigned in both negative and positive bending (i.e., θf- = θf+ = 0.015 radians); the possibility of “early” (i.e., pre-yield) fracture of the top flange is not considered, however. A few laboratory test results of full-scale beam-column connections with a slab obtained during this study from the University of Michigan led to the consideration of θf- = 0.03 radians as a sensitivity case. Lastly, an “optimistic” top-flange plastic rotation capacity of 0.045 radians is also considered. For all three of the different values of θf- considered, the residual moment strength of the connection in negative bending after fracture of the top flange is assumed to be 30% of Mp; the same value is used (in the base case) after fracture of the bottom flange.
Following the form of the presentation of the BFO base case, first the seismic drift responses for the LA 9-story model structure with connections that can fracture at both the top and bottom flanges are examined in some detail. In particular, the θmax and θi statistics are reported, as well as the percentages of “extreme” θmax values and “collapses.” Results for the other SAC model structures are then summarized as more general conclusions are drawn.
6.3.3.1 TBF Connection Fracture Results for LA 9-Story Structure
6.3.3.1.1 θmax Statistics
The (counted) median θmax for the LA 9-story model structure with TBF brittle connections subjected to the 10/50 and 2/50 ground motions are listed in Table 6-3. The BFO base-case results are included for comparison, and the percentage increases in the medians from the BFO base case to the three TBF cases are emphasized.
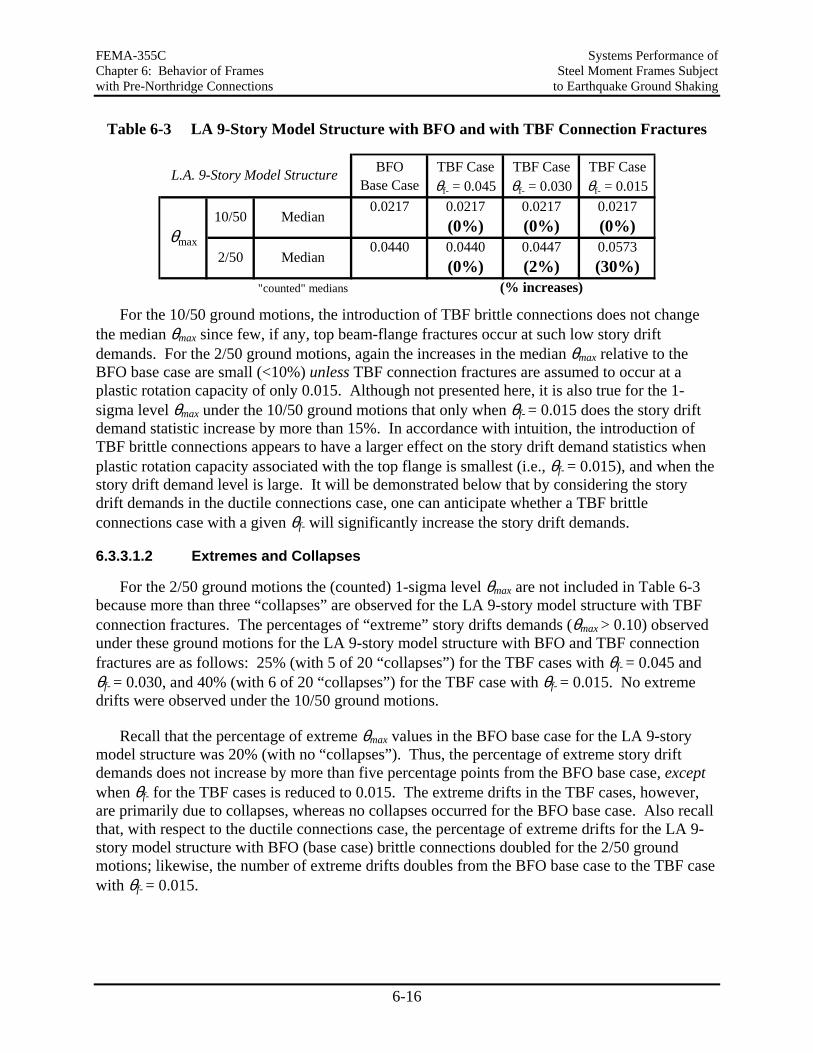
FEMA-355C Systems Performance of Chapter 6: Behavior of Frames Steel Moment Frames Subject with Pre-Northridge Connections to Earthquake Ground Shaking
6-16
Table 6-3 LA 9-Story Model Structure with BFO and with TBF Connection Fractures
BFO TBF Case TBF Case TBF CaseBase Case θf- = 0.045 θf- = 0.030 θf- = 0.015
0.0217 0.0217 0.0217 0.0217(0%) (0%) (0%)
0.0440 0.0440 0.0447 0.0573(0%) (2%) (30%)
"counted" medians (% increases)
θmax
10/50 Median
2/50 Median
L.A. 9-Story Model Structure
For the 10/50 ground motions, the introduction of TBF brittle connections does not change
the median θmax since few, if any, top beam-flange fractures occur at such low story drift demands. For the 2/50 ground motions, again the increases in the median θmax relative to the BFO base case are small (<10%) unless TBF connection fractures are assumed to occur at a plastic rotation capacity of only 0.015. Although not presented here, it is also true for the 1-sigma level θmax under the 10/50 ground motions that only when θf- = 0.015 does the story drift demand statistic increase by more than 15%. In accordance with intuition, the introduction of TBF brittle connections appears to have a larger effect on the story drift demand statistics when plastic rotation capacity associated with the top flange is smallest (i.e., θf- = 0.015), and when the story drift demand level is large. It will be demonstrated below that by considering the story drift demands in the ductile connections case, one can anticipate whether a TBF brittle connections case with a given θf- will significantly increase the story drift demands.
6.3.3.1.2 Extremes and Collapses
For the 2/50 ground motions the (counted) 1-sigma level θmax are not included in Table 6-3 because more than three “collapses” are observed for the LA 9-story model structure with TBF connection fractures. The percentages of “extreme” story drifts demands (θmax > 0.10) observed under these ground motions for the LA 9-story model structure with BFO and TBF connection fractures are as follows: 25% (with 5 of 20 “collapses”) for the TBF cases with θf- = 0.045 and θf- = 0.030, and 40% (with 6 of 20 “collapses”) for the TBF case with θf- = 0.015. No extreme drifts were observed under the 10/50 ground motions.
Recall that the percentage of extreme θmax values in the BFO base case for the LA 9-story model structure was 20% (with no “collapses”). Thus, the percentage of extreme story drift demands does not increase by more than five percentage points from the BFO base case, except when θf- for the TBF cases is reduced to 0.015. The extreme drifts in the TBF cases, however, are primarily due to collapses, whereas no collapses occurred for the BFO base case. Also recall that, with respect to the ductile connections case, the percentage of extreme drifts for the LA 9-story model structure with BFO (base case) brittle connections doubled for the 2/50 ground motions; likewise, the number of extreme drifts doubles from the BFO base case to the TBF case with θf- = 0.015.
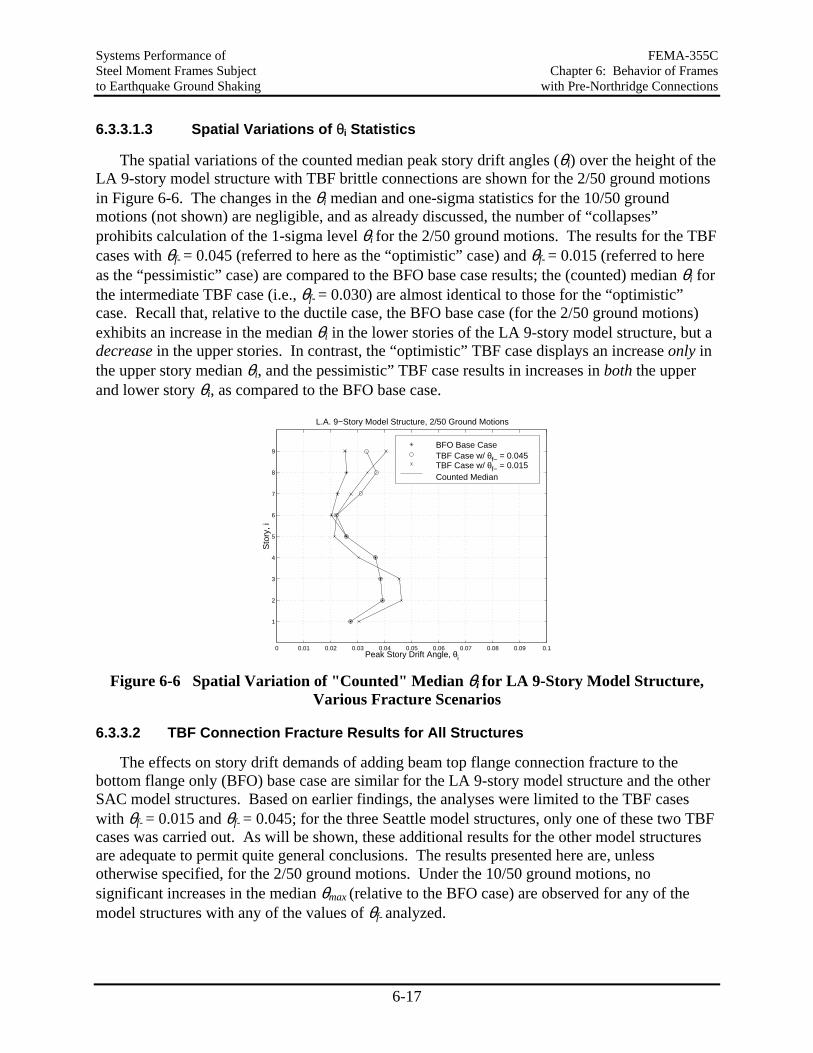
Systems Performance of FEMA-355C Steel Moment Frames Subject Chapter 6: Behavior of Frames to Earthquake Ground Shaking with Pre-Northridge Connections
6-17
6.3.3.1.3 Spatial Variations of θi Statistics
The spatial variations of the counted median peak story drift angles (θi) over the height of the LA 9-story model structure with TBF brittle connections are shown for the 2/50 ground motions in Figure 6-6. The changes in the θi median and one-sigma statistics for the 10/50 ground motions (not shown) are negligible, and as already discussed, the number of “collapses” prohibits calculation of the 1-sigma level θi for the 2/50 ground motions. The results for the TBF cases with θf- = 0.045 (referred to here as the “optimistic” case) and θf- = 0.015 (referred to here as the “pessimistic” case) are compared to the BFO base case results; the (counted) median θi for the intermediate TBF case (i.e., θf- = 0.030) are almost identical to those for the “optimistic” case. Recall that, relative to the ductile case, the BFO base case (for the 2/50 ground motions) exhibits an increase in the median θi in the lower stories of the LA 9-story model structure, but a decrease in the upper stories. In contrast, the “optimistic” TBF case displays an increase only in the upper story median θi, and the pessimistic” TBF case results in increases in both the upper and lower story θi, as compared to the BFO base case.
0 0.01 0.02 0.03 0.04 0.05 0.06 0.07 0.08 0.09 0.1
1
2
3
4
5
6
7
8
9
L.A. 9−Story Model Structure, 2/50 Ground Motions
Peak Story Drift Angle, θi
Sto
ry, i
BFO Base CaseTBF Case w/ θf− = 0.045TBF Case w/ θf− = 0.015Counted Median
Figure 6-6 Spatial Variation of "Counted" Median θi for LA 9-Story Model Structure,
Various Fracture Scenarios
6.3.3.2 TBF Connection Fracture Results for All Structures
The effects on story drift demands of adding beam top flange connection fracture to the bottom flange only (BFO) base case are similar for the LA 9-story model structure and the other SAC model structures. Based on earlier findings, the analyses were limited to the TBF cases with θf- = 0.015 and θf- = 0.045; for the three Seattle model structures, only one of these two TBF cases was carried out. As will be shown, these additional results for the other model structures are adequate to permit quite general conclusions. The results presented here are, unless otherwise specified, for the 2/50 ground motions. Under the 10/50 ground motions, no significant increases in the median θmax (relative to the BFO case) are observed for any of the model structures with any of the values of θf- analyzed.
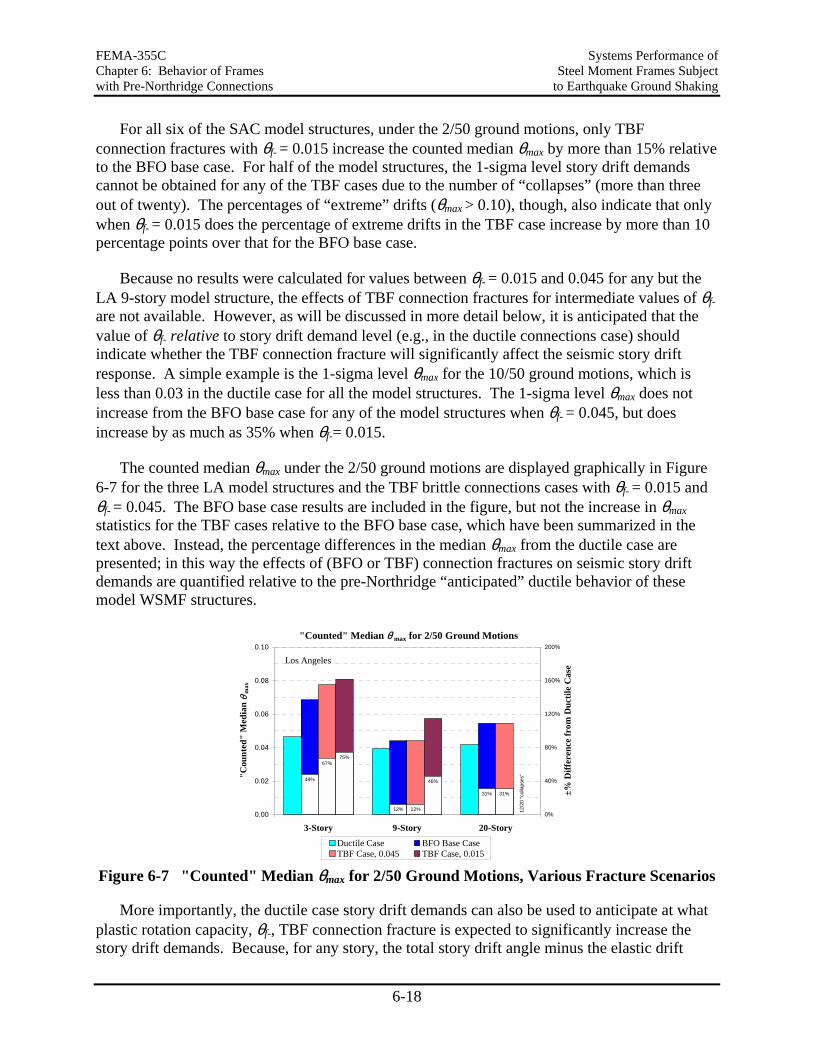
FEMA-355C Systems Performance of Chapter 6: Behavior of Frames Steel Moment Frames Subject with Pre-Northridge Connections to Earthquake Ground Shaking
6-18
For all six of the SAC model structures, under the 2/50 ground motions, only TBF connection fractures with θf- = 0.015 increase the counted median θmax by more than 15% relative to the BFO base case. For half of the model structures, the 1-sigma level story drift demands cannot be obtained for any of the TBF cases due to the number of “collapses” (more than three out of twenty). The percentages of “extreme” drifts (θmax > 0.10), though, also indicate that only when θf- = 0.015 does the percentage of extreme drifts in the TBF case increase by more than 10 percentage points over that for the BFO base case.
Because no results were calculated for values between θf- = 0.015 and 0.045 for any but the LA 9-story model structure, the effects of TBF connection fractures for intermediate values of θf- are not available. However, as will be discussed in more detail below, it is anticipated that the value of θf- relative to story drift demand level (e.g., in the ductile connections case) should indicate whether the TBF connection fracture will significantly affect the seismic story drift response. A simple example is the 1-sigma level θmax for the 10/50 ground motions, which is less than 0.03 in the ductile case for all the model structures. The 1-sigma level θmax does not increase from the BFO base case for any of the model structures when θf- = 0.045, but does increase by as much as 35% when θf-= 0.015.
The counted median θmax under the 2/50 ground motions are displayed graphically in Figure 6-7 for the three LA model structures and the TBF brittle connections cases with θf- = 0.015 and θf- = 0.045. The BFO base case results are included in the figure, but not the increase in θmax statistics for the TBF cases relative to the BFO base case, which have been summarized in the text above. Instead, the percentage differences in the median θmax from the ductile case are presented; in this way the effects of (BFO or TBF) connection fractures on seismic story drift demands are quantified relative to the pre-Northridge “anticipated” ductile behavior of these model WSMF structures.
"Counted" Median θ max for 2/50 Ground Motions
48%
12%
31%
67%
12%
31%
75%
46%
12/2
0 "c
olla
pses
"
0.00
0.02
0.04
0.06
0.08
0.10
3-Story 9-Story 20-Story
"Cou
nted
" M
edia
n θ
max
0%
40%
80%
120%
160%
200%
±% D
iffer
ence
from
Duc
tile
Cas
e
Ductile Case BFO Base CaseTBF Case, 0.045 TBF Case, 0.015
Los Angeles
Figure 6-7 "Counted" Median θmax for 2/50 Ground Motions, Various Fracture Scenarios
More importantly, the ductile case story drift demands can also be used to anticipate at what plastic rotation capacity, θf-, TBF connection fracture is expected to significantly increase the story drift demands. Because, for any story, the total story drift angle minus the elastic drift
Systems Performance of FEMA-355C Steel Moment Frames Subject Chapter 6: Behavior of Frames to Earthquake Ground Shaking with Pre-Northridge Connections
6-19
angle tends to be a good indicator of the connection plastic rotation demands (Gupta and Krawinkler, 1999), multiple TBF connection fractures can be expected when the story drift angle demands exceed about θf- + 0.01, recognizing that elastic story drifts are typically about 0.01. For example, since the median θmax under the 2/50 ground motions for the LA 9-story model structure (refer to Figure 6-7) is approximately 0.05, many TBF connection fractures are not likely to occur unless θf- is less than 0.04. Indeed, the TBF case with θf- = 0.045 shows no increase in the median θmax relative to the BFO base case; on the other hand, for the TBF case with θf- = 0.015, the increase in the median θmax relative to the BFO base case is approximately 30%. The same is true for the (P-∆ sensitive) LA 20-story model structure, which also has a median θmax of approximately 0.05 in the ductile case; however, in the TBF case with θf- = 0.015 the counted median θmax, or the 10th smallest among the 20 ground motions, is a “collapse.” For the LA 3-story model structure, the median θmax only increases by approximately 20% when θf- (= 0.015) is less than the ductile case median θmax (= 0.046) minus 0.01. Note, however, that the BFO base case story drift demands themselves represent a 48% increase from the ductile case, and apparently the model structure is relatively resistant to “collapse.” Thus, while the proposal appears to predict the onset of important TBF connection fracture effects on story drift demands, it cannot predict the magnitude of the increases.
6.3.3.3 Summary of TBF Connection Fracture Results
It has been observed that top-beam-flange connection fractures, in addition to bottom-flange fractures, can increase the median θmax from the ductile connections case by 75% or more if the plastic rotation capacity associated with top flange fracture is sufficiently low, and the ground motion levels are sufficiently high. The value of θf- for which the median θmax is expected to increase by more than 15% with respect to the bottom flange only (BFO) fracture base case depends on the story-drift demand level, which can be inferred from the results for the more conventional ductile-connection model of the WSMF structures. Also, with relatively small values of θf- compared to the story drift demands, the percentage of “extreme” story drifts can double relative to the BFO base case results, such that extreme story drifts are observed for as many as 60% of the 2/50 ground motions; otherwise, the percentage of extreme drifts remains about the same as that for the BFO base case.
Thus, under larger ground motions, the estimated story drifts in WSMF structures with fracturing connections may be very sensitive to the value of θf-. Ongoing field, test, and analytical research should permit greatly improved estimates of this parameter in the future. It is anticipated that, when better parameter information becomes available, the results here will remain useful in estimating the effects of fracture on drift demands.
6.3.4 Conclusions on Effects of Beam Flange Connection Fractures
To summarize the effects of beam flange connection fractures on the story drift demands for the SAC model structures, it is convenient to consider three subsets of the ground motions: “mild,” “moderate,” and “rogue.” These subsets consist of different earthquake records for different structures and, although the boundaries between the subsets are not crisp, they are useful descriptively.
FEMA-355C Systems Performance of Chapter 6: Behavior of Frames Steel Moment Frames Subject with Pre-Northridge Connections to Earthquake Ground Shaking
6-20
For mild ground motions (e.g., the 10/50 ground motions), the anticipated (median) effects of bottom flange only (BFO) or top and bottom flange (TBF) connection fractures on the story drift response are minimal primarily because the demands are not large enough to induce more than a few fractures. For example, since the ductile-case median θmax for the 10/50 ground motions is less than 0.025 for all the model structures, even the TBF case with θf- = 0.015 (when available) has less than a 10% effect on the median story drift demands.
Under moderate ground motions (e.g., most of the 2/50 ground motions), BFO base case (or even the “perturbed” base case) connection fractures have a relatively small (i.e., <50% with respect to the ductile case) effect on the median θmax demands. The effect is also small for the TBF cases, unless the plastic rotation capacity associated with top flange fracture is smaller (by approximately 0.01 elastic drift) than the story drift demands in the ductile connection case. In this situation, a significant number of top flange fractures can be expected, and the story drift demands may increase significantly.
Lastly, when subjected to “rogue” earthquake records, namely the subset of the records that causes relatively large story drifts in the ductile case, even the model structures with BFO brittle connections may experience extreme story drifts (i.e., θmax > 0.10) or collapses. Clearly the TBF cases will also experience extreme drifts, but the percentage of extreme drifts increases little until the more pessimistic TBF parameter-value cases are considered (e.g., θf- = 0.015). Thus, as for the mild ground motions, the effect of connection fractures is not significantly different for the BFO and TBF cases; in effect, it is only for the moderate ground motions that the BFO case and the TBF cases (with their different plastic rotation capacities) have different effects on the story drift response.
6.3.5 Effect of Interior Frames; The M1+ Model
All of the SAC model structures considered suffered “collapses” or extreme (>10%) maximum story drift angles under some fraction of the 2/50 ground motions when TBF (θf- = 0.015) connection fractures were incorporated into the model. In fact, half of the model structures experienced extreme drifts even in the ductile case, and half of the model structures experienced “collapses” with BFO base case connection fractures. As discussed in Chapter 5, the effect of improved analytical modeling can be significant for such extreme cases, to the extent that “collapse” of the simple centerline model (referred to as model “M1”) may be “saved” by improved modeling. To check whether connection fractures will still lead to “collapses” or extreme drifts when an improved analytical model is used, “M1+” models of several of the SAC structures with connection fractures were analyzed.
In particular, the “M1+” model accounts for the strength and stiffness of interior gravity frames and shear connections. The interior gravity frames are included via a single “equivalent bay.” Shear connections are modeled with rotational beam-connection springs, which become perfectly plastic at a rotation of 2% and a moment equal to 20% of the beam plastic moment (Mp,beam) in positive bending, and at a rotation of 1% and moment of 10% of Mp,beam in negative bending. The larger moment strength assigned in positive bending reflects the contribution of the slab in compression. The M1+ is similar to the M1A model summarized in Section 3.5.1.
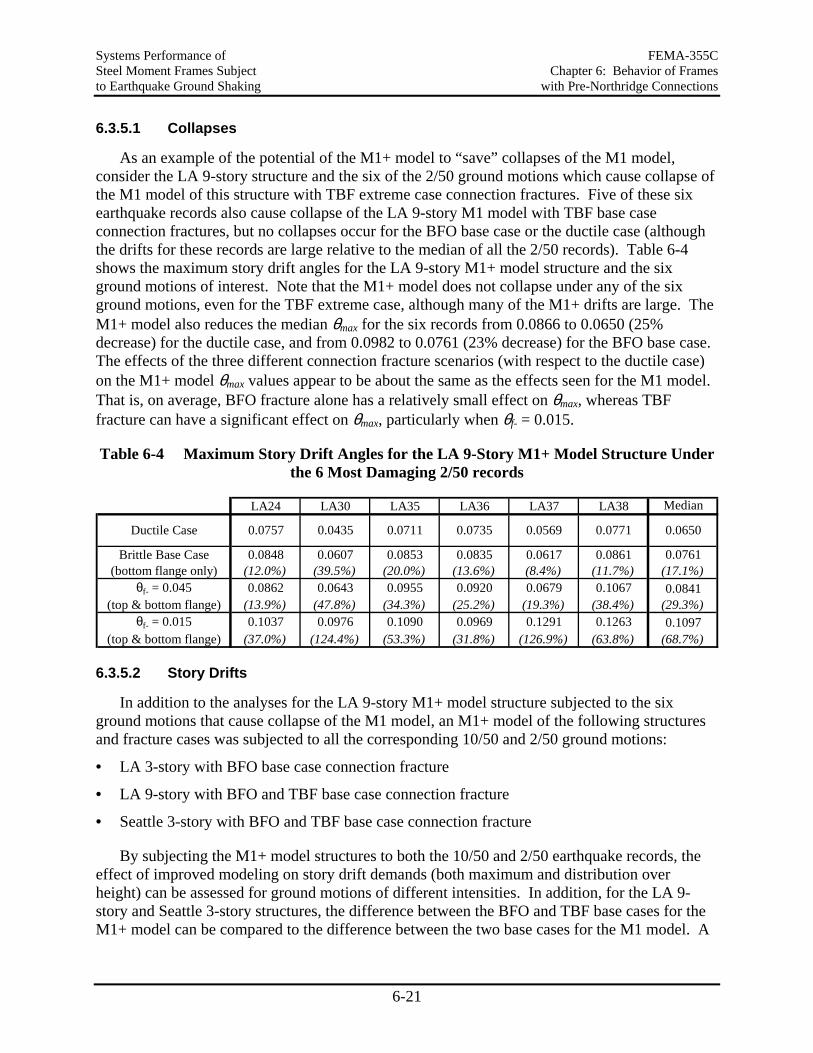
Systems Performance of FEMA-355C Steel Moment Frames Subject Chapter 6: Behavior of Frames to Earthquake Ground Shaking with Pre-Northridge Connections
6-21
6.3.5.1 Collapses
As an example of the potential of the M1+ model to “save” collapses of the M1 model, consider the LA 9-story structure and the six of the 2/50 ground motions which cause collapse of the M1 model of this structure with TBF extreme case connection fractures. Five of these six earthquake records also cause collapse of the LA 9-story M1 model with TBF base case connection fractures, but no collapses occur for the BFO base case or the ductile case (although the drifts for these records are large relative to the median of all the 2/50 records). Table 6-4 shows the maximum story drift angles for the LA 9-story M1+ model structure and the six ground motions of interest. Note that the M1+ model does not collapse under any of the six ground motions, even for the TBF extreme case, although many of the M1+ drifts are large. The M1+ model also reduces the median θmax for the six records from 0.0866 to 0.0650 (25% decrease) for the ductile case, and from 0.0982 to 0.0761 (23% decrease) for the BFO base case. The effects of the three different connection fracture scenarios (with respect to the ductile case) on the M1+ model θmax values appear to be about the same as the effects seen for the M1 model. That is, on average, BFO fracture alone has a relatively small effect on θmax, whereas TBF fracture can have a significant effect on θmax, particularly when θf- = 0.015.
Table 6-4 Maximum Story Drift Angles for the LA 9-Story M1+ Model Structure Under the 6 Most Damaging 2/50 records
LA24 LA30 LA35 LA36 LA37 LA38 Median
Brittle Base Case 0.0848 0.0607 0.0853 0.0835 0.0617 0.0861 0.0761(bottom flange only) (12.0%) (39.5%) (20.0%) (13.6%) (8.4%) (11.7%) (17.1%)
θf- = 0.045 0.0862 0.0643 0.0955 0.0920 0.0679 0.1067 0.0841(top & bottom flange) (13.9%) (47.8%) (34.3%) (25.2%) (19.3%) (38.4%) (29.3%)
θf- = 0.015 0.1037 0.0976 0.1090 0.0969 0.1291 0.1263 0.1097(top & bottom flange) (37.0%) (124.4%) (53.3%) (31.8%) (126.9%) (63.8%) (68.7%)
Ductile Case 0.0757 0.0435 0.0711 0.0735 0.0569 0.0771 0.0650
6.3.5.2 Story Drifts
In addition to the analyses for the LA 9-story M1+ model structure subjected to the six ground motions that cause collapse of the M1 model, an M1+ model of the following structures and fracture cases was subjected to all the corresponding 10/50 and 2/50 ground motions:
• LA 3-story with BFO base case connection fracture
• LA 9-story with BFO and TBF base case connection fracture
• Seattle 3-story with BFO and TBF base case connection fracture
By subjecting the M1+ model structures to both the 10/50 and 2/50 earthquake records, the effect of improved modeling on story drift demands (both maximum and distribution over height) can be assessed for ground motions of different intensities. In addition, for the LA 9-story and Seattle 3-story structures, the difference between the BFO and TBF base cases for the M1+ model can be compared to the difference between the two base cases for the M1 model. A
FEMA-355C Systems Performance of Chapter 6: Behavior of Frames Steel Moment Frames Subject with Pre-Northridge Connections to Earthquake Ground Shaking
6-22
summary of the θmax statistics for the M1+ model structures, as compared to the M1 model results, is provided in Table 6-5, from which the following conclusions can be drawn (in Tables 6-5 to 6-8, two statistical values are reported; the first one being the computed value and the second one (in parentheses) being the counted value):
• For the 10/50 ground motions and the median and 1-sigma levels θmax’s, the difference between the M1+ and M1 models is small (<10%).
• Also for the 10/50 records, the BFO and TBF base cases are almost identical (in terms of the median and 1-sigma level θmax’s), regardless of whether the M1 or M1+ model is used.
• For the 2/50 ground motions and the M1 model, the difference between the BFO and TBF base case is again small for the (counted) median θmax, but the number of collapses prohibits calculation of the 1-sigma level θmax.
• The M1+ model yields no collapses under the 2/50 (or 10/50) ground motions, and hence it can be seen that the difference between the BFO and TBF base cases is small for both the median and 1-sigma level θmax.
• For the 2/50 records, the decrease in the median θmax from the M1 model to the M1+ model is about 10%. At the 1-sigma level, the M1+ model θmax is nearly 20% less than M1 model θmax (when the number of M1 model collapses are few enough to at least find the counted 1-sigma level θmax).
• Most significantly, the M1+ model reduces the M1 model “extreme” drifts (i.e., θmax >0.10), in almost all cases to drifts less than 0.10. The exceptions are 3 M1 model “collapses” which are reduced to “extreme” drifts by the M1+ model (for LA 9 TBF base case, and SE 3 BFO and TBF base cases).
We conclude that the more realistic M1+ model has a major (beneficial) effect on the extreme drift cases or "rogue" records (only), and not on the "body" of the records that establish the median and (usually) the 1-sigma level drifts. But, until conditions (either rare ground motion probability levels or pessimistic fracture model assumptions, or both) are such that the drifts levels associated with these fractiles are collapse threatening, it is just these extreme drift, rogue record cases that are of most concern. Clearly then the modeling of interior frames is critical to an accurate prediction of these important extreme drifts, and therefore most likely critical to accurate prediction of the likelihood of the WSMF collapse threat (with or without fracturing connections). At a minimum, extreme drifts predicted by M1 models should be "adjusted" in some way to reflect gravity frames. Without this leavening, the M1 model predictions of extreme drifts may be taken out of context.
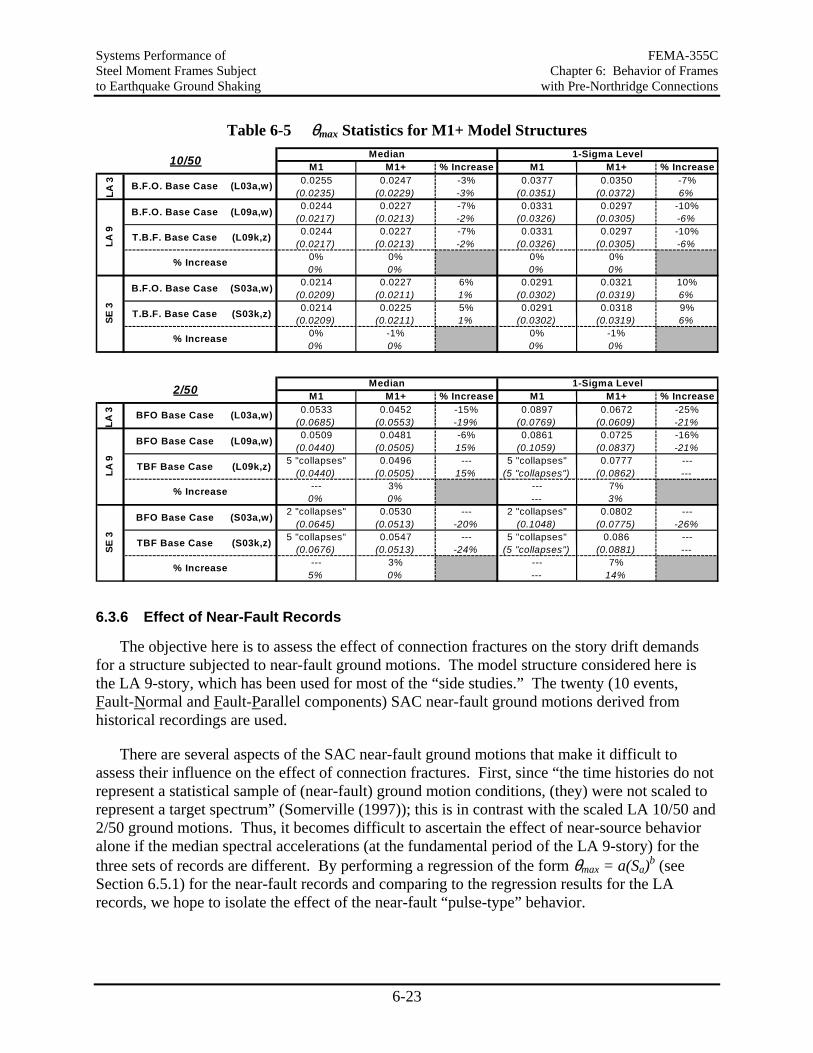
Systems Performance of FEMA-355C Steel Moment Frames Subject Chapter 6: Behavior of Frames to Earthquake Ground Shaking with Pre-Northridge Connections
6-23
Table 6-5 θmax Statistics for M1+ Model Structures
M1 M1+ % Increase M1 M1+ % Increase0.0255 0.0247 -3% 0.0377 0.0350 -7%
(0.0235) (0.0229) -3% (0.0351) (0.0372) 6% 0.0244 0.0227 -7% 0.0331 0.0297 -10%
(0.0217) (0.0213) -2% (0.0326) (0.0305) -6% 0.0244 0.0227 -7% 0.0331 0.0297 -10%
(0.0217) (0.0213) -2% (0.0326) (0.0305) -6% 0% 0% 0% 0% 0% 0% 0% 0%
0.0214 0.0227 6% 0.0291 0.0321 10% (0.0209) (0.0211) 1% (0.0302) (0.0319) 6% 0.0214 0.0225 5% 0.0291 0.0318 9%
(0.0209) (0.0211) 1% (0.0302) (0.0319) 6% 0% -1% 0% -1% 0% 0% 0% 0%
M1 M1+ % Increase M1 M1+ % Increase0.0533 0.0452 -15% 0.0897 0.0672 -25%
(0.0685) (0.0553) -19% (0.0769) (0.0609) -21% 0.0509 0.0481 -6% 0.0861 0.0725 -16%
(0.0440) (0.0505) 15% (0.1059) (0.0837) -21% 5 "collapses" 0.0496 --- 5 "collapses" 0.0777 ---
(0.0440) (0.0505) 15% (5 "collapses") (0.0862) --- --- 3% --- 7%
0% 0% --- 3% 2 "collapses" 0.0530 --- 2 "collapses" 0.0802 ---
(0.0645) (0.0513) -20% (0.1048) (0.0775) -26% 5 "collapses" 0.0547 --- 5 "collapses" 0.086 ---
(0.0676) (0.0513) -24% (5 "collapses") (0.0881) --- --- 3% --- 7%
5% 0% --- 14%
(S03k,z)
% Increase
B.F.O. Base Case
B.F.O. Base Case
% Increase
B.F.O. Base Case
T.B.F. Base Case
(L03a,w)
(L09a,w)
(L09k,z)
(S03a,w)
1-Sigma Level 10/50
2/50 Median 1-Sigma Level
LA 3
LA
9
SE 3
Median
T.B.F. Base Case
LA 9
BFO Base Case (L09a,w)
TBF Base Case (L09k,z)
% Increase
SE 3
BFO Base Case (S03a,w)
TBF Base Case (S03k,z)
% Increase
LA 3
BFO Base Case (L03a,w)
6.3.6 Effect of Near-Fault Records
The objective here is to assess the effect of connection fractures on the story drift demands for a structure subjected to near-fault ground motions. The model structure considered here is the LA 9-story, which has been used for most of the “side studies.” The twenty (10 events, Fault-Normal and Fault-Parallel components) SAC near-fault ground motions derived from historical recordings are used.
There are several aspects of the SAC near-fault ground motions that make it difficult to assess their influence on the effect of connection fractures. First, since “the time histories do not represent a statistical sample of (near-fault) ground motion conditions, (they) were not scaled to represent a target spectrum” (Somerville (1997)); this is in contrast with the scaled LA 10/50 and 2/50 ground motions. Thus, it becomes difficult to ascertain the effect of near-source behavior alone if the median spectral accelerations (at the fundamental period of the LA 9-story) for the three sets of records are different. By performing a regression of the form θmax = a(Sa)b (see Section 6.5.1) for the near-fault records and comparing to the regression results for the LA records, we hope to isolate the effect of the near-fault “pulse-type” behavior.
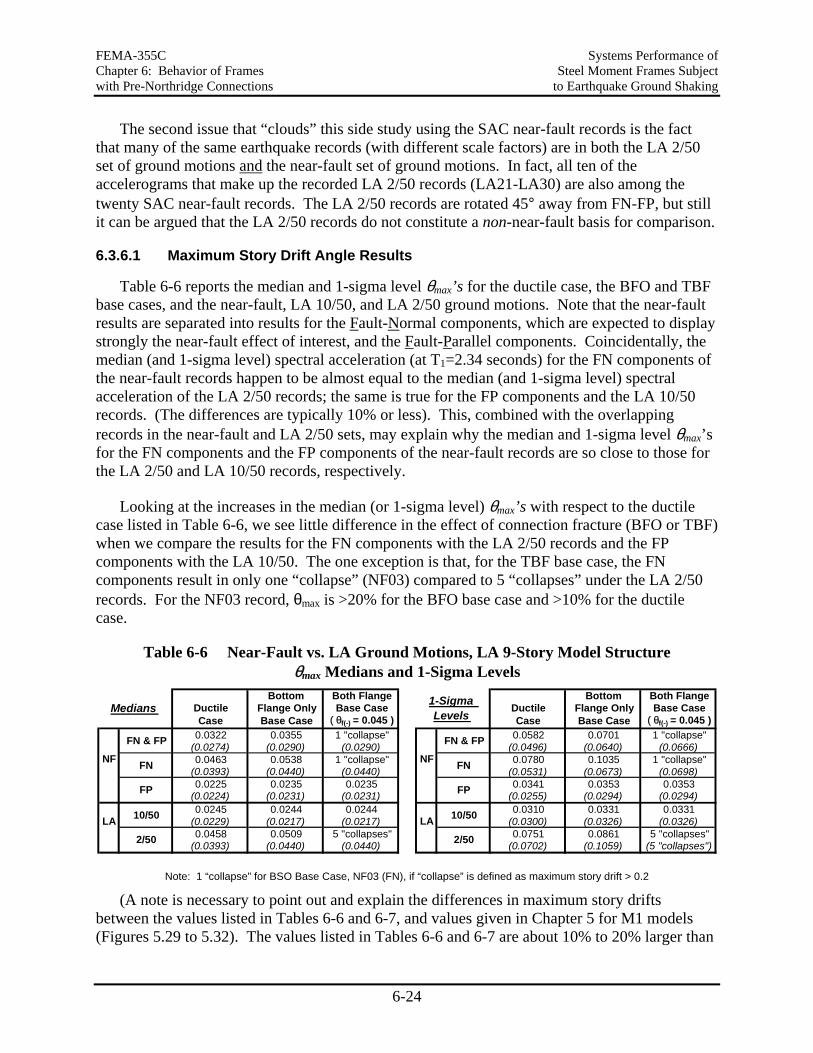
FEMA-355C Systems Performance of Chapter 6: Behavior of Frames Steel Moment Frames Subject with Pre-Northridge Connections to Earthquake Ground Shaking
6-24
The second issue that “clouds” this side study using the SAC near-fault records is the fact that many of the same earthquake records (with different scale factors) are in both the LA 2/50 set of ground motions and the near-fault set of ground motions. In fact, all ten of the accelerograms that make up the recorded LA 2/50 records (LA21-LA30) are also among the twenty SAC near-fault records. The LA 2/50 records are rotated 45° away from FN-FP, but still it can be argued that the LA 2/50 records do not constitute a non-near-fault basis for comparison.
6.3.6.1 Maximum Story Drift Angle Results
Table 6-6 reports the median and 1-sigma level θmax’s for the ductile case, the BFO and TBF base cases, and the near-fault, LA 10/50, and LA 2/50 ground motions. Note that the near-fault results are separated into results for the Fault-Normal components, which are expected to display strongly the near-fault effect of interest, and the Fault-Parallel components. Coincidentally, the median (and 1-sigma level) spectral acceleration (at T1=2.34 seconds) for the FN components of the near-fault records happen to be almost equal to the median (and 1-sigma level) spectral acceleration of the LA 2/50 records; the same is true for the FP components and the LA 10/50 records. (The differences are typically 10% or less). This, combined with the overlapping records in the near-fault and LA 2/50 sets, may explain why the median and 1-sigma level θmax’s for the FN components and the FP components of the near-fault records are so close to those for the LA 2/50 and LA 10/50 records, respectively.
Looking at the increases in the median (or 1-sigma level) θmax’s with respect to the ductile case listed in Table 6-6, we see little difference in the effect of connection fracture (BFO or TBF) when we compare the results for the FN components with the LA 2/50 records and the FP components with the LA 10/50. The one exception is that, for the TBF base case, the FN components result in only one “collapse” (NF03) compared to 5 “collapses” under the LA 2/50 records. For the NF03 record, θmax is >20% for the BFO base case and >10% for the ductile case.
Table 6-6 Near-Fault vs. LA Ground Motions, LA 9-Story Model Structure θmax Medians and 1-Sigma Levels
Bottom Both FlangeDuctile Flange Only Base CaseCase Base Case ( θf(-) = 0.045 )
0.0322 0.0355 1 "collapse"(0.0274) (0.0290) (0.0290)0.0463 0.0538 1 "collapse"
(0.0393) (0.0440) (0.0440)0.0225 0.0235 0.0235
(0.0224) (0.0231) (0.0231)0.0245 0.0244 0.0244
(0.0229) (0.0217) (0.0217)0.0458 0.0509 5 "collapses"
(0.0393) (0.0440) (0.0440)
LA2/50
FP
10/50
Medians
NFFN & FP
FN
Bottom Both FlangeDuctile Flange Only Base CaseCase Base Case ( θf(-) = 0.045 )
0.0582 0.0701 1 "collapse"(0.0496) (0.0640) (0.0666)0.0780 0.1035 1 "collapse"
(0.0531) (0.0673) (0.0698)0.0341 0.0353 0.0353
(0.0255) (0.0294) (0.0294)0.0310 0.0331 0.0331
(0.0300) (0.0326) (0.0326)0.0751 0.0861 5 "collapses"
(0.0702) (0.1059) (5 "collapses")
1-SigmaLevels
10/50
2/50
LA
NFFN & FP
FN
FP
Note: 1 “collapse” for BSO Base Case, NF03 (FN), if “collapse” is defined as maximum story drift > 0.2
(A note is necessary to point out and explain the differences in maximum story drifts between the values listed in Tables 6-6 and 6-7, and values given in Chapter 5 for M1 models (Figures 5.29 to 5.32). The values listed in Tables 6-6 and 6-7 are about 10% to 20% larger than
Systems Performance of FEMA-355C Steel Moment Frames Subject Chapter 6: Behavior of Frames to Earthquake Ground Shaking with Pre-Northridge Connections
6-25
the corresponding maximum of the medians of the drift demands in individual stories as shown in the referenced figures. The explanation is that θmax, as defined in this chapter, is the maximum story drift occurring anywhere in the structure under a particular record. Different records will cause maximum drift in different stories, and for this reason the statistical values of θmax are larger than the statistical values for any one story.)
Although figures are not included in this report, the distribution over height of peak story drift angles was seen to be about the same for the FN near-fault records and the LA 2/50 records, as well as for the FP near-fault records and the LA 10/50 records, for all three of the fracture scenarios considered (ductile, BFO, and TBF base cases).
6.3.6.2 Conclusions Based on LA 9-Story Structure
For comparable ground motion intensity, as measured by the Sa at the first mode period (T1), the effect of connection fracture on the story drift demands appears to be about the same for the SAC near-fault (specifically the FN component) ground motions and the SAC LA 2/50 ground motions. Unfortunately, a comparison of the story drift demand results for these two particular sets of records does not lend itself to drawing conclusions about the effect of connection fracture for near-fault versus non-near-fault ground motions in general.
6.3.7 Effects of Redundancy
In order to study the effects of “redundancy,” the three redesigns of the SAC LA 9-story model structure (see Section 5.7.5 and Figure B.4 of Appendix B) are analyzed. The three redesigns (referred to as “R1,” “R2,” and “R3”) have the same number of stories, total height, and total width as the SAC LA 9, but different numbers of moment-resisting bays.
For ductile behavior (no fractures) it was found that redundancy by itself has a small effect on story drift demands (Section 5.7.5). Based on simple structural system reliability theory, in the face of the large record-to-record variability in response, we don’t expect the effect of having more/fewer moment-resisting bays, alone, to be significant. However, when connection fracture is considered, the fact that increasing the number of moment-resisting bays (or the “redundancy”) also tends to decrease the beam depths, may have a direct effect in the brittle connection case. Studies (Roeder and Foutch (1996)) suggest that there is a significant correlation between beam depth and connection ductility, or in other words, the plastic rotation at which connection fracture occurs. It is primarily the effect of reduced beam depths, and the corresponding increase in plastic rotation capacity before fracture, that we wish to study with the three redesigns of LA 9.
Nevertheless, since the “R1” and “R3” redesigns have about the same beam depths (mostly 36”), their results can be compared to assess separately the effect of having more moment-resisting connections per floor (although the difference, 9 versus 6 M.R. connections per floor, is small). The “R2” redesign, on the other hand, has twice as many moment-resisting connections as the “R1” redesign and, as a result, significantly smaller beam depths (mostly 27” and 24”). Thus the “R2” and “R1” redesigns can be compared to assess the effect of both the increased number of M.R. bays and the reduced beam depths. To assess the effect of reduced beam depths alone, which effectively increase the plastic rotation capacity against fracture, we may look back
FEMA-355C Systems Performance of Chapter 6: Behavior of Frames Steel Moment Frames Subject with Pre-Northridge Connections to Earthquake Ground Shaking
6-26
at the parameter variations on θf+ and θf-. Recall that we found little effect with respect to θf+, but a potentially larger effect for θf-.
6.3.7.1 Modeling Assumptions
The three redesigns of the LA 9 model structure are analyzed assuming (1) ductile connections, (2) bottom flange only fractures with base case parameters (BFO base case), and (3) top and bottom flange fracture with base case parameters (TBF base case). The only difference between the BFO and TBF base cases for the redesigned models and the SAC LA 9 model lies in the plastic rotation capacity assumed for the bottom and top flanges. Instead of assuming that all non-“early” (i.e., pre-yield) fracturing connections will fracture at plastic rotations of θf+ = 0.015 and θf- = 0.045 in the bottom and top flanges, respectively, both these fracture rotations are assigned according to beam depth. The plastic rotation capacities for different beam depths are estimated using a figure obtained from a paper by (Bonowitz and Maison (1998)), shown in Figure 6-8. Essentially following the Roeder relationship shown in the figure (note that the Roeder and FEMA labels in the legend are flipped) between plastic rotation capacity and beam depth, we assume the following relationship for bottom flange fracture:
θφ+∗ = 0.005 + (36”−db)/3" ∗ 0.005 (6−1)
Thus a plastic rotation capacity for the bottom flange of 0.015 corresponds to a beam depth of 30”, 0.005 for 36”, and 0.025 for 24”, etc. Note that the value used for this non-“early” plastic rotation capacity for all the beam connections in the SAC LA 9 building, which in fact has many 36” deep beams, is 0.015, versus 0.005 for 36” deep beams here. Allowing for the 25% “early” fractures and looking at the total elastic and plastic rotation, the difference in average values is more like 0.02 versus 0.01, or in plastic rotation terms about 0.01 versus 0.00, which are numbers that might be compared with the data points shown in Figure 6-8.
For the plastic rotation capacity of a top flange, we make an assumption which is consistent with those made for the SAC LA 9 and the BFO and TBF base cases, that is,
θφ− = θφ+∗ + 0.03 (6−2)
where θf+* is the plastic rotation capacity of the bottom flange assuming it does not fracture
“early” (i.e., 0.015 for the SAC LA 9). This rule yields a value of θf- = 0.035 for 36” deep beams, for example. The base case number of “early” fracturing connections (i.e., p=25%) is maintained for all the redesigns.
As for the analysis of the SAC LA 9 structure, simple center-line models (i.e., M1) of the three redesigns are used for analysis. However, unlike the SAC LA 9, the redesigned column and beam sections often do not satisfy the strong column-weak beam condition because the redesigns were forced to satisfy either the strong column-weak beam or weak panel zone condition (UBC’1994). Since the panel zones are not part of the M1 model, the redesigns may experience a significant amount of column yielding, which was not generally observed for the SAC LA 9 (except at the ground level). Column yielding for the redesigns of the LA 9 would likely “shield” the beams from experiencing large plastic rotations and fractures, making it
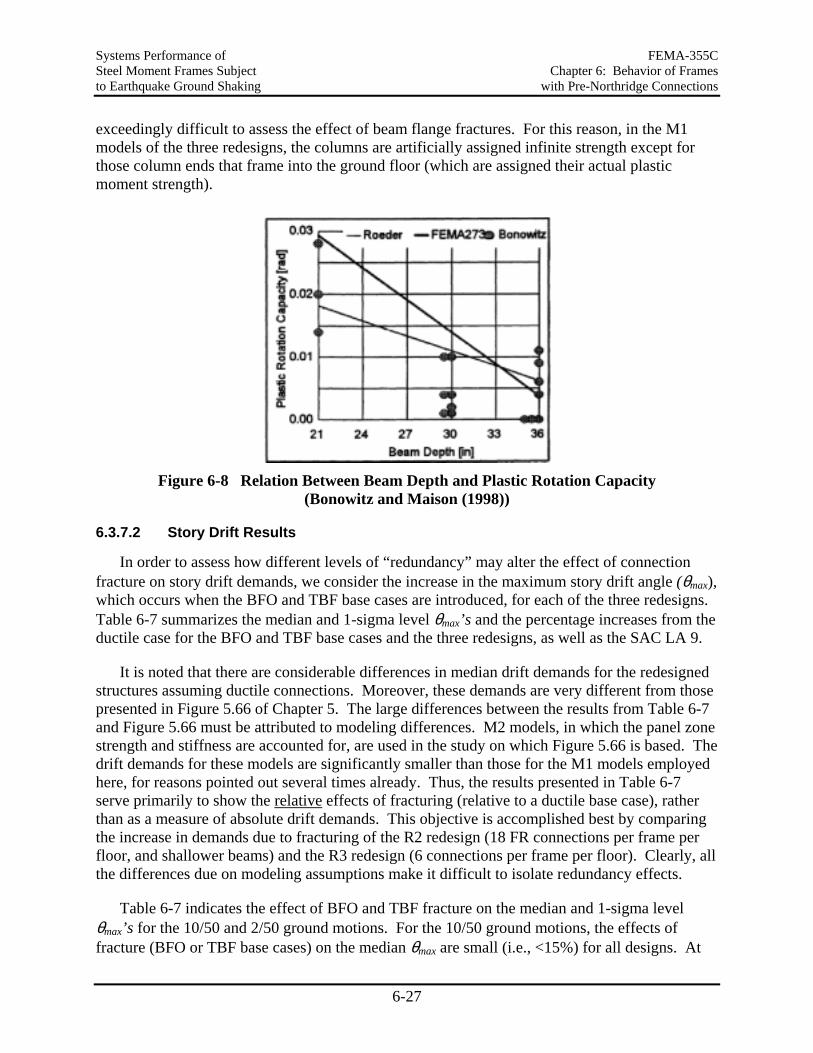
Systems Performance of FEMA-355C Steel Moment Frames Subject Chapter 6: Behavior of Frames to Earthquake Ground Shaking with Pre-Northridge Connections
6-27
exceedingly difficult to assess the effect of beam flange fractures. For this reason, in the M1 models of the three redesigns, the columns are artificially assigned infinite strength except for those column ends that frame into the ground floor (which are assigned their actual plastic moment strength).
Figure 6-8 Relation Between Beam Depth and Plastic Rotation Capacity
(Bonowitz and Maison (1998))
6.3.7.2 Story Drift Results
In order to assess how different levels of “redundancy” may alter the effect of connection fracture on story drift demands, we consider the increase in the maximum story drift angle (θmax), which occurs when the BFO and TBF base cases are introduced, for each of the three redesigns. Table 6-7 summarizes the median and 1-sigma level θmax’s and the percentage increases from the ductile case for the BFO and TBF base cases and the three redesigns, as well as the SAC LA 9.
It is noted that there are considerable differences in median drift demands for the redesigned structures assuming ductile connections. Moreover, these demands are very different from those presented in Figure 5.66 of Chapter 5. The large differences between the results from Table 6-7 and Figure 5.66 must be attributed to modeling differences. M2 models, in which the panel zone strength and stiffness are accounted for, are used in the study on which Figure 5.66 is based. The drift demands for these models are significantly smaller than those for the M1 models employed here, for reasons pointed out several times already. Thus, the results presented in Table 6-7 serve primarily to show the relative effects of fracturing (relative to a ductile base case), rather than as a measure of absolute drift demands. This objective is accomplished best by comparing the increase in demands due to fracturing of the R2 redesign (18 FR connections per frame per floor, and shallower beams) and the R3 redesign (6 connections per frame per floor). Clearly, all the differences due on modeling assumptions make it difficult to isolate redundancy effects.
Table 6-7 indicates the effect of BFO and TBF fracture on the median and 1-sigma level θmax’s for the 10/50 and 2/50 ground motions. For the 10/50 ground motions, the effects of fracture (BFO or TBF base cases) on the median θmax are small (i.e., <15%) for all designs. At
FEMA-355C Systems Performance of Chapter 6: Behavior of Frames Steel Moment Frames Subject with Pre-Northridge Connections to Earthquake Ground Shaking
6-28
the 1-sigma level, the increase in θmax is about 10% for the R2 redesign, and 35% for the R3 redesign. The relatively small increase for the R2 redesign, however, is influenced by its relatively small drift in the ductile case.
For the 2/50 ground motions, the increase in the numerical value of the median θmax from the ductile case to the BFO and TBF base cases is still quite small (<~20%). However, this picture likely is distorted by the large number of collapses under the 2/50 records. For the most part, there are too many “collapses” to calculate (or count) the 1-sigma level θmax. The number of collapses are listed in Table 6-7. The numbers are large, with some favoritism towards the more redundant R2 design (smaller beam sections) compared to the other redesigns. But then again, the smaller number may be due to the smaller drift demands of the ductile R2 case.
The conclusion is that there is no clear evidence in this study for or against a “redundancy effect.” Either the effect is being masked by other issues, or it is not a major effect, or a more cleverly designed study is needed to isolate the phenomenon (or all of the above).
6.4 Effects of Column Fractures on Drift Demands
Most commonly, fracture of a welded moment-resisting connection leads to separation of the beam flange (and possibly the beam web) from the column. However, fracture propagating into the column flange (and sometimes the web) has also been observed. The reduction in moment capacity associated with a column fracture may be larger than that for beam flange fracture, given the absence of a slab and the presence of an axial force in the column. Thus, the possibility of column fractures needs to be considered despite the lack of test data that can be used to estimate when column fracture will occur and how a column will behave after fracture.
The analysis model used here to emulate column fracture is described in Section 6.2. In brief, it is probably conservative in some respects and non-conservative in others.
The effect of column fracture is studied using the LA 9-story structure, comparing the results for the model structure with column fracture potential to the otherwise identical cases with only beam flange fractures. It is important to note that the total number of fractures (beam flange + column) is expected to remain nearly constant because a beam flange that has been designated as a “trigger” of column fracture (see Section 6.2 for explanation) is itself no longer allowed to fracture. It is assumed that there is a 25% probability that a beam flange will act as a column fracture trigger.
6.4.1 Bottom Flange Fractures Only
Since only bottom beam flanges are allowed to fracture in this case, only bottom beam flanges will act as “triggers,” and only column fractures below a connection (i.e., at the top of a column in a story) can occur. In the BFO base case, the residual column moment strength (Mred,col) is taken as 20% of Mp,col. The case where Mred,col is 10% of Mp,col is also considered.
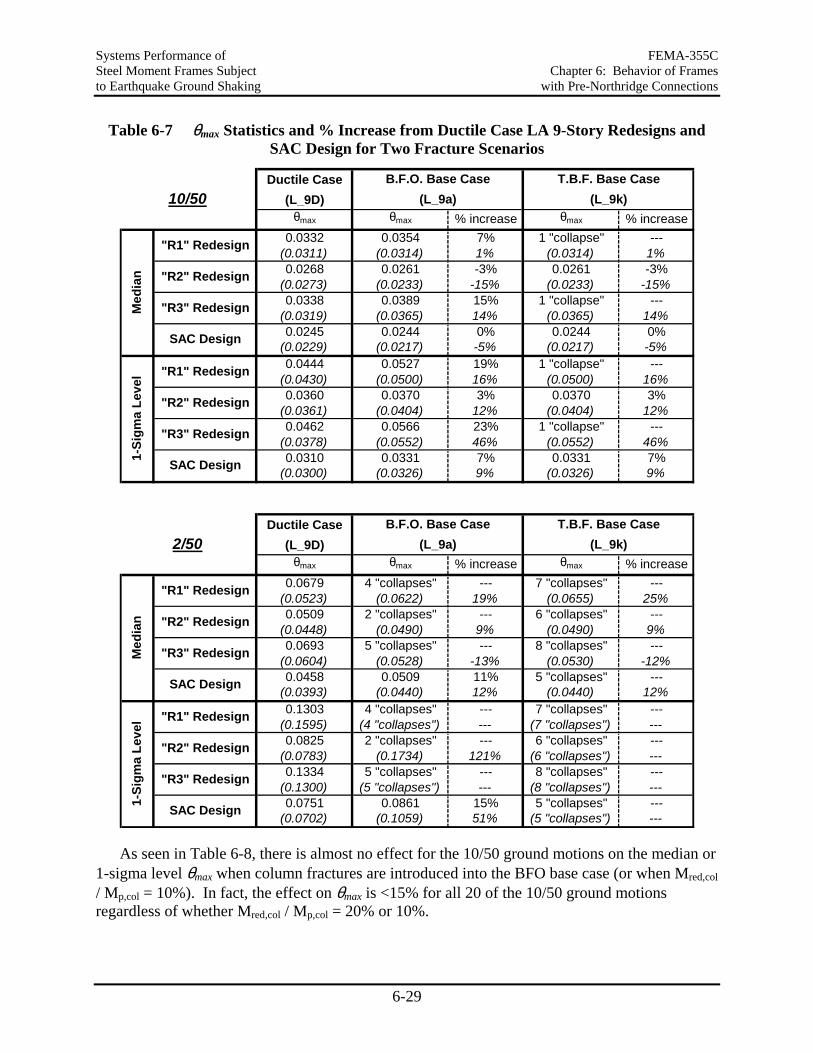
Systems Performance of FEMA-355C Steel Moment Frames Subject Chapter 6: Behavior of Frames to Earthquake Ground Shaking with Pre-Northridge Connections
6-29
Table 6-7 θmax Statistics and % Increase from Ductile Case LA 9-Story Redesigns and SAC Design for Two Fracture Scenarios
Ductile Case(L_9D)
θmax θmax % increase θmax % increase0.0332 0.0354 7% 1 "collapse" ---
(0.0311) (0.0314) 1% (0.0314) 1%0.0268 0.0261 -3% 0.0261 -3%
(0.0273) (0.0233) -15% (0.0233) -15%0.0338 0.0389 15% 1 "collapse" ---
(0.0319) (0.0365) 14% (0.0365) 14%0.0245 0.0244 0% 0.0244 0%
(0.0229) (0.0217) -5% (0.0217) -5%0.0444 0.0527 19% 1 "collapse" ---
(0.0430) (0.0500) 16% (0.0500) 16%0.0360 0.0370 3% 0.0370 3%
(0.0361) (0.0404) 12% (0.0404) 12%0.0462 0.0566 23% 1 "collapse" ---
(0.0378) (0.0552) 46% (0.0552) 46%0.0310 0.0331 7% 0.0331 7%
(0.0300) (0.0326) 9% (0.0326) 9%
Ductile Case(L_9D)
θmax θmax % increase θmax % increase0.0679 4 "collapses" --- 7 "collapses" ---
(0.0523) (0.0622) 19% (0.0655) 25%0.0509 2 "collapses" --- 6 "collapses" ---
(0.0448) (0.0490) 9% (0.0490) 9%0.0693 5 "collapses" --- 8 "collapses" ---
(0.0604) (0.0528) -13% (0.0530) -12%0.0458 0.0509 11% 5 "collapses" ---
(0.0393) (0.0440) 12% (0.0440) 12%0.1303 4 "collapses" --- 7 "collapses" ---
(0.1595) (4 "collapses") --- (7 "collapses") ---0.0825 2 "collapses" --- 6 "collapses" ---
(0.0783) (0.1734) 121% (6 "collapses") ---0.1334 5 "collapses" --- 8 "collapses" ---
(0.1300) (5 "collapses") --- (8 "collapses") ---0.0751 0.0861 15% 5 "collapses" ---
(0.0702) (0.1059) 51% (5 "collapses") ---
B.F.O. Base Case
Med
ian
T.B.F. Base Case(L_9a) (L_9k)
"R2" Redesign
1-Si
gma
Leve
l
10/50
"R1" Redesign
"R2" Redesign
"R3" Redesign
SAC Design
"R1" Redesign
"R3" Redesign
SAC Design
Med
ian
"R1" Redesign
"R2" Redesign
"R3" Redesign
SAC Design
"R1" Redesign
"R2" Redesign
"R3" Redesign
1-Si
gma
Leve
l
SAC Design
2/50B.F.O. Base Case T.B.F. Base Case
(L_9a) (L_9k)
As seen in Table 6-8, there is almost no effect for the 10/50 ground motions on the median or 1-sigma level θmax when column fractures are introduced into the BFO base case (or when Mred,col / Mp,col = 10%). In fact, the effect on θmax is <15% for all 20 of the 10/50 ground motions regardless of whether Mred,col / Mp,col = 20% or 10%.
FEMA-355C Systems Performance of Chapter 6: Behavior of Frames Steel Moment Frames Subject with Pre-Northridge Connections to Earthquake Ground Shaking
6-30
For the 2/50 ground motions and the base case, again there is <10% increase in the θmax median and 1-sigma level due to the addition of column fractures. The model with column fracture “collapses” for one of the records (LA24), but even with only beam fractures, the θmax response for this record is “extreme” (>10% drift). For another 2/50 record (LA38), the θmax response becomes “extreme” when column fracture is introduced, but for all other records the increase in θmax is <15%.
Even when Mred,col is reduced to 10% of Mp,col, the effect of column fractures on the median θmax for the 2/50 earthquake records is <10%. The 1-sigma level θmax in this case increases by ~35%, indicating some effect on the extremes. In addition to the “collapse” which occurred in the base case (LA24), this model also “collapses” under the LA38 record, which produced a θmax response in the beam fracture only case of <10%.
In summary, the introduction of column fractures into the BFO base case has virtually no effect on the median θmax response and a relatively small effect on the 1-sigma level θmax for the 2/50 records even when Mred,col / Mp,col = 10%. For a few more extreme ground motions, however, introducing column fractures led to “collapse” of the M1 model.
6.4.2 Top and Bottom Flange Fractures
In this case, when both top and bottom beam flanges may fracture, column fracture above and/or below a connection may be triggered. In fact, a single (two-flange) beam spring may trigger column fracture above and/or below a connection. In addition to the TBF base case for which top flange fracture (or triggering of column fracture) is assumed to occur at a maximum plastic rotation of θf- = 0.045, the cases of θf- = 0.030 and θf- = 0.015 are also considered. For all of these TBF cases, Mred,col / Mp,col = 20%.
As for the BFO cases, the introduction of column fractures has little effect on the θmax response for the 10/50 ground motions, as shown in Table 6-8. The 1-sigma level θmax actually decreases by ~10-15% when column fractures are introduced and θf- = 0.015, which reflects the fact that the largest change in the θmax response for the 10/50 records is a 35% decrease (LA17).
Likewise, for the 2/50 ground motions, the median θmax response is nearly unchanged when column fractures are incorporated into the structural model. The number of “collapses” of the model with or without column fractures prohibits any calculation (or counting) of the 1-sigma level θmax for the 2/50 records. For the most part, we also see the same number of “collapses” of the models with or without column fractures. For the worst top flange fracture case (θf- = 0.015), one “collapse” (LA37) of the model with only beam flange fractures is actually “saved” by the addition of column fractures, resulting in a θmax of ~9%. Similarly, for two other 2/50 records (LA21 & LA27), “extreme” (>10%) θmax’s for the beam flange fracture only model are reduced by 40% and 50%. On the other hand, for the LA25 record, θmax is increased by more than 100% to an “extreme” (>10%) value.
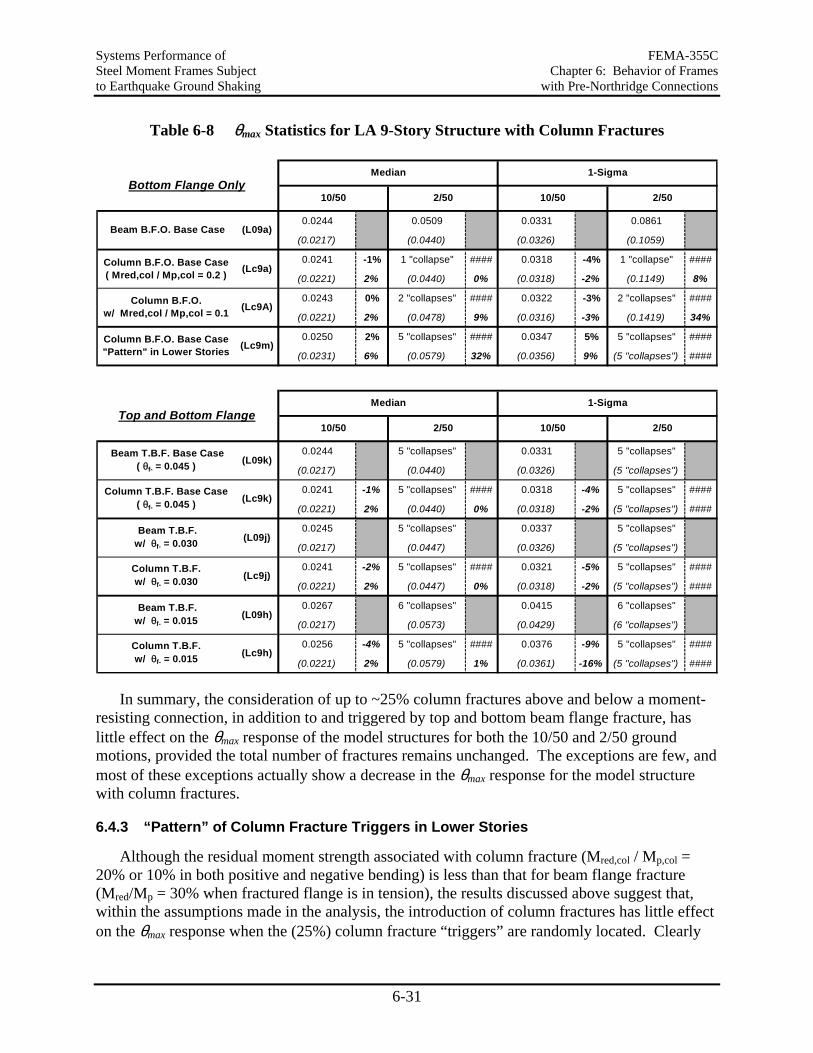
Systems Performance of FEMA-355C Steel Moment Frames Subject Chapter 6: Behavior of Frames to Earthquake Ground Shaking with Pre-Northridge Connections
6-31
Table 6-8 θmax Statistics for LA 9-Story Structure with Column Fractures
0.0244 0.0509 0.0331 0.0861
(0.0217) (0.0440) (0.0326) (0.1059)
0.0241 -1% 1 "collapse" #### 0.0318 -4% 1 "collapse" ####
(0.0221) 2% (0.0440) 0% (0.0318) -2% (0.1149) 8%
0.0243 0% 2 "collapses" #### 0.0322 -3% 2 "collapses" ####
(0.0221) 2% (0.0478) 9% (0.0316) -3% (0.1419) 34%
0.0250 2% 5 "collapses" #### 0.0347 5% 5 "collapses" ####
(0.0231) 6% (0.0579) 32% (0.0356) 9% (5 "collapses") ####
0.0244 5 "collapses" 0.0331 5 "collapses"
(0.0217) (0.0440) (0.0326) (5 "collapses")
0.0241 -1% 5 "collapses" #### 0.0318 -4% 5 "collapses" ####
(0.0221) 2% (0.0440) 0% (0.0318) -2% (5 "collapses") ####
0.0245 5 "collapses" 0.0337 5 "collapses"
(0.0217) (0.0447) (0.0326) (5 "collapses")
0.0241 -2% 5 "collapses" #### 0.0321 -5% 5 "collapses" ####
(0.0221) 2% (0.0447) 0% (0.0318) -2% (5 "collapses") ####
0.0267 6 "collapses" 0.0415 6 "collapses"
(0.0217) (0.0573) (0.0429) (6 "collapses")
0.0256 -4% 5 "collapses" #### 0.0376 -9% 5 "collapses" ####
(0.0221) 2% (0.0579) 1% (0.0361) -16% (5 "collapses") ####
Median 1-Sigma
10/50 2/50 10/50 2/50
Median
10/50 2/50
1-Sigma
10/50 2/50Bottom Flange Only
Beam B.F.O. Base Case
Column B.F.O. Base Case ( Mred,col / Mp,col = 0.2 )
Column B.F.O. Base Case "Pattern" in Lower Stories
(L09a)
(Lc9a)
(Lc9m)
Beam T.B.F. w/ θf- = 0.030
Beam T.B.F. Base Case ( θf- = 0.045 ) (L09k)
Column B.F.O. w/ Mred,col / Mp,col = 0.1 (Lc9A)
Top and Bottom Flange
(L09j)
Column T.B.F. w/ θf- = 0.015 (Lc9h)
Column T.B.F. Base Case ( θf- = 0.045 ) (Lc9k)
Column T.B.F. w/ θf- = 0.030 (Lc9j)
Beam T.B.F. w/ θf- = 0.015 (L09h)
In summary, the consideration of up to ~25% column fractures above and below a moment-resisting connection, in addition to and triggered by top and bottom beam flange fracture, has little effect on the θmax response of the model structures for both the 10/50 and 2/50 ground motions, provided the total number of fractures remains unchanged. The exceptions are few, and most of these exceptions actually show a decrease in the θmax response for the model structure with column fractures.
6.4.3 “Pattern” of Column Fracture Triggers in Lower Stories
Although the residual moment strength associated with column fracture (Mred,col / Mp,col = 20% or 10% in both positive and negative bending) is less than that for beam flange fracture (Mred/Mp = 30% when fractured flange is in tension), the results discussed above suggest that, within the assumptions made in the analysis, the introduction of column fractures has little effect on the θmax response when the (25%) column fracture “triggers” are randomly located. Clearly
FEMA-355C Systems Performance of Chapter 6: Behavior of Frames Steel Moment Frames Subject with Pre-Northridge Connections to Earthquake Ground Shaking
6-32
though, when column fractures are introduced, the potential for forming a story mechanism (column fracture at the top and bottom of every column in a story) exists. With only beam flange fractures, the fracture of every beam on a floor (or floors above and below a story) can only result in an effectively larger story height.
To consider a “worst-case” scenario in which several (or all) of the column ends in a single story fracture, a deterministic “pattern” of column fracture “triggers” in the lower stories is considered for the BFO base case. The total number of bottom beam flange “triggers” (i.e., ~25% of the total number of bottom beam flanges) is kept the same as the randomly located “triggers” case, but now all the “triggers” are placed in the lower stories (1st-4th). Note that, for interior connections, only one of the two bottom beam flanges adjacent to the column below the joint will actually trigger column fracture. Since beam flanges which are designated as “triggers” are forced to remain ductile, only one of the bottom beam flanges adjacent to a column is designated as a “trigger” so that beam flange fractures may still occur in the lower stories.
From Table 6-8 we see that, as usual, the effect of this “pattern” of column fracture “triggers” is small compared to the beam flange fracture base case for the 10/50 ground motions. This is likely because few column fractures actually occur.
For the 2/50 ground motions, however, the θmax median increases by 30% for the model with column fractures in the lower stories. Also, five “collapses” (too many to count the 1-sigma level θmax) and three “extremes” (θmax > 10%) are observed. (For the BFO base case without column fractures, only four “extreme” θmax responses and no “collapses” resulted.)
In summary, if many column fractures are concentrated in a few stories, the effect can be substantial, as witnessed for at least 4 of the 2/50 ground motions. It is interesting to note the effect of a “pattern” of column fracture triggers appears to be larger than the effect of a “pattern” of bottom beam flange “early” fractures (discussed previously), for the 2/50 ground motions. For the “pattern” of “early” fracturing beam flanges (and the 2/50 records), the θmax median was almost unchanged from the BFO base case, and only 2 “collapses” and 2 “extreme” θmax’s were recorded. For the 10/50 earthquake records, however, the effect of “early” fracturing beam flanges in the lower stories is somewhat larger than that of column fractures in the lower stories, since the “early” beam flanges will fracture at lower drifts.
6.4.4 Conclusions Based on LA 9-Story
Except for perhaps a few 2/50 ground motions, the effect of column fractures on the maximum story drift angles (θmax) is small when the column fracture “triggers” are randomly located within a model structure. When a deterministic worst-case “pattern” of column fractures in the lower stories is considered, the effect is larger on the median θmax (30% increase) and results in twice as many “collapses” or “extremes” (θmax > 10%) compared to the model structure with only beam flange fractures.
The results discussed here are obtained under the assumption that fractured columns maintain some bending capacity and full shear and axial force capacity. This may not be the case if column fractures propagate all the way across a section, as has been observed in a few cases.
Systems Performance of FEMA-355C Steel Moment Frames Subject Chapter 6: Behavior of Frames to Earthquake Ground Shaking with Pre-Northridge Connections
6-33
The study by Hall (1998a), in which such columns are removed from the analysis model, indicates that, under these assumptions, column fractures may pose a collapse hazard.
We conclude that there may well be a need for further field study of the potential for clustering of column fractures. This should probably be coupled with a more rigorous (fiber) model of column fracturing and even a testing program.
6.5 Methodology for Evaluation of Effects of Connection Fractures in a Probabilistic Format
The methodology summarized here is based on the premise that a relevant measure for the assessment of damage at important performance levels is available. The approach can be applied to any measure, but is illustrated here with the assumption that story drift is an adequate measure. The emphasis is on assessing the effect of connection fractures on the maximum story drift occurring anywhere in the structure. Story drift is expressed by a drift demand hazard curve, which describes the annual probability of exceeding a specific drift. Such drift hazard curves can be obtained from nonlinear time history analysis of model structures. The effects of connection fractures on drift can be assessed by computing these hazard curves for “ductile” structures (no fractures permitted) and “brittle” structures (with specified fracture scenarios) and evaluating the differences. A procedure for computing drift hazard curves is presented, and then demonstrated for a three-story WSMF building with ductile and brittle connections. The write-up is mostly reproduced from Luco and Cornell (1998a), and supporting information can be found in Cornell and Luco (1999).
6.5.1 Procedure for Computing Drift Hazard Curves
The procedure described here can be implemented for any local or global demand parameter, but here it is presented for evaluating the drift demand hazard. The annual probability that the drift demand exceeds the drift capacity (or the probability of failure, for short) is discussed in Section 6.6. The procedure combines an existing site hazard curve for spectral acceleration with drift response results from nonlinear dynamic analyses of a structure subjected to several ground motions at different levels of intensity (as measured by spectral acceleration at the first mode period), to arrive at a drift demand hazard curve. More specifically, the annual probability of exceeding any specified drift demand, and the drift demand associated with a particular exceedance probability, can be computed. As discussed in Section 6.6, if estimates can be obtained of the median drift capacity and the dispersion of drift capacity, the annual probability of failure (i.e., the probability that the drift demand exceeds the drift capacity when the drift capacity is regarded as a random variable), and the “design spectral acceleration” corresponding to a target probability of failure, can also be computed.
6.5.1.1 Spectral Acceleration Hazard
An existing site hazard curve for spectral acceleration provides the probability of exceeding any particular spectral acceleration, for a given period and damping ratio. The elastic spectral acceleration at the fundamental period of the structure is used since it is usually an effective structure-specific measure of ground motion intensity for predicting the nonlinear response of buildings (like the three-story WSMF considered later). An “effective” intensity measure for
FEMA-355C Systems Performance of Chapter 6: Behavior of Frames Steel Moment Frames Subject with Pre-Northridge Connections to Earthquake Ground Shaking
6-34
earthquake records is one for which the record-to-record dispersion of the drift response given the intensity level is relatively small, and for which a hazard analysis is available. The particular choice of ground motion intensity measure, however, is not critical to the procedure. Commonly, hazard curves for spectral accelerations, Sa, are expressed in the form
kaa SkSH −= 0)( (6−3)
6.5.1.2 Relationship between Spectral Acceleration and Drift
The median relationship between spectral acceleration and drift is established by performing nonlinear dynamic analyses of the model structure for numerous ground motions at different levels of intensity (as measured by spectral acceleration). The spectral acceleration (e.g., at the fundamental period of the model structure) for each ground motion is simply obtained from its elastic response spectrum. The response of the structure subjected to each earthquake record provides the corresponding drift. For a set of spectral acceleration versus drift data points, a regression (or “least squares fit”) of the form
baSa=δ̂ (6−4)
where δ̂ is the median drift response and aS is the spectral acceleration, provides the necessary relationship between spectral acceleration and median drift. The exponent b in Equation 6-4 is included to capture “softening” or “hardening” of the nonlinear relationship between spectral acceleration and median drift. Also note that a regression of the form given in Equation 6-4 is equivalent to a linear regression of the log of drift on the log of spectral acceleration. The dispersion of the drift response, given the spectral acceleration, is calculated as the mean squared deviation of the (spectral acceleration versus drift) data points from the regression fit.
The drift quantity used for regression could be the maximum drift in any particular story, or the maximum drift of all stories. Unless noted differently, in this chapter the latter definition is used.
6.5.1.3 Drift Demand Hazard
Once the median relationship between spectral acceleration and drift (i.e., the median drift given spectral acceleration), and the dispersion of drift given spectral acceleration are known, the spectral acceleration hazard curve can be used to create a drift demand hazard curve. Under certain simplifying assumptions (Cornell, 1996), the probability of exceeding any specified drift demand, δ′ , can be calculated in closed analytical form as
( ) [ ] ( )1faS CSHPH
a⋅=′>≡′ ′δ
δ δδδ (6−5)
where ( )xHaS is the spectral acceleration hazard (or mean annual frequency of exceeding x), δ′
aS
is the spectral acceleration corresponding to δ ′ (i.e., the inverse of the median relationship
Systems Performance of FEMA-355C Steel Moment Frames Subject Chapter 6: Behavior of Frames to Earthquake Ground Shaking with Pre-Northridge Connections
6-35
between spectral acceleration and drift), and 1f
C is a correction factor which accounts for the
dispersion in drift given spectral acceleration. δ′aS and
1fC are calculated as
b
a aS
1
′
=′ δδ (6−6)
22
|)ln(2
1
21 bk
faSeC δσ⋅
= (6−7)
where a and b are the regression coefficients from Equation 6-2, k is the log-log slope of the spectral acceleration hazard curve (fit near the spectral acceleration of interest), and
aS)|ln(δσ is the “COV” of drift given spectral acceleration. (In this report, the “COV” (also referred to as the dispersion) is defined as the standard deviation of the natural logarithms of the data, which is approximately equal to the conventional coefficient of variation (i.e., the standard deviation divided by the mean) for values less than 0.3.)
The drift hazard curve can also be read to determine the drift demand corresponding to a prescribed probability level. Alternatively, the drift demand associated with a particular annual probability of exceedance, P0, can be calculated explicitly using the formula
3
00
fS C
PaP ⋅= δδ (6−8)
where 0PaSδ is the median drift corresponding to 0P
aS , which is the spectral acceleration associated with the prescribed annual probability of exceedance. As in Equation (6-3),
3fC is a
correction factor that accounts for the dispersion in drift given spectral acceleration, and is calculated as
bk
faSeC
2|)ln(
3
21
δσ⋅= (6−9)
Equation 6-6 provides, in effect, the “load” factor that should be applied to the spectral acceleration at a given exceedance probability level in order to find the drift demand at that probability level, recognizing the dispersion in nonlinear structural responses given the ground motion intensity (i.e., spectral acceleration).
6.5.2 Numerical Example
The procedure presented above for determining the drift demand hazard is now demonstrated for a three-story WSMF model structure. In order to quantify the effects of brittle connection behavior on the demands, the procedure is carried out for the model structure with brittle connections and with ductile connections. For this example, the basic drift demand parameter considered is the maximum story drift angle over all stories, denoted as θmax. Also, the elastic spectral acceleration at the fundamental period of the model structure (1.03 seconds) for a
FEMA-355C Systems Performance of Chapter 6: Behavior of Frames Steel Moment Frames Subject with Pre-Northridge Connections to Earthquake Ground Shaking
6-36
damping ratio of 2% (the damping ratio used for dynamic analysis) is used as the structure-specific measure of ground motion intensity, and is denoted as Sa.
Ground Motions. Thirty of the SAC Phase II ground motions for Los Angeles at the 10% in 50 years and 2% in 50 years probability levels are used for analysis. The twenty 10% in 50 years earthquake records (LA01-LA20) and the ten 2% in 50 years earthquake records (LA21-LA30) are recorded ground motions which have been scaled to match, in a minimum weighted least squares residual sense, the 1997 USGS mapped spectral values at four periods, namely 0.3, 1.0, 2.0, and 4.0 seconds (Somerville et al. (1997))).
Model Structure. The structure evaluated in this example is that of the LA 3-story building designed according to pre-Northridge practices. A two-dimensional centerline model (M1) of one of the building’s perimeter moment-resisting frames is used for analysis. Brittle connections are incorporated into the model with the “fracture element” described in Section 6.2. The BFO base case conditions summarized in Section 6.3.2 are employed.
For each earthquake record used for dynamic analysis, a different, random spatial distribution of “early” fracturing connections is simulated assuming mutual independence of the connections. Thus, for the thirty ground motions considered in this example, thirty different model structures (or realizations of the model structure) are analyzed. This simulation technique is utilized in lieu of simulating several different model structures for each record in order to minimize the number of analyses. A check verifies that the analysis of a different spatial distribution of “early” fracturing connections for each earthquake does not (a) bias the median θmax response, (b) significantly alter the estimate of the dispersion in response (i.e., the “COV” of θmax given Sa), or (c) significantly change the regression of θmax on Sa (Cornell and Luco (1999)).
Spectral Acceleration Hazard. For this example, a spectral acceleration hazard curve of the form
( ) kaaS SkSH
a
−= 0 (6−3, repeated)
is obtained simply by fitting a line (in log-log scale) to the points defined by the two annual exceedance probabilities and the corresponding median spectral accelerations, for the two sets of SAC ground motions. In this case, the log-log slope of the spectral acceleration hazard curve is simply –k (= –3.03 for this example). The hazard curve utilized in this example, as well as the two points used to obtain it, are shown in Figure 6-9. Note that since the two median spectral accelerations (at the fundamental period of the model structure) are for a damping ratio of 2%, the simple hazard curve used here is for a damping ratio of 2% rather than for the 5% value typically reported by USGS. Also, the SAC earthquake records, and hence the simple hazard curve created for this example, were modified to reflect a firm soil site rather than the soft rock site used as a basis by USGS (Somerville et al. (1997)).
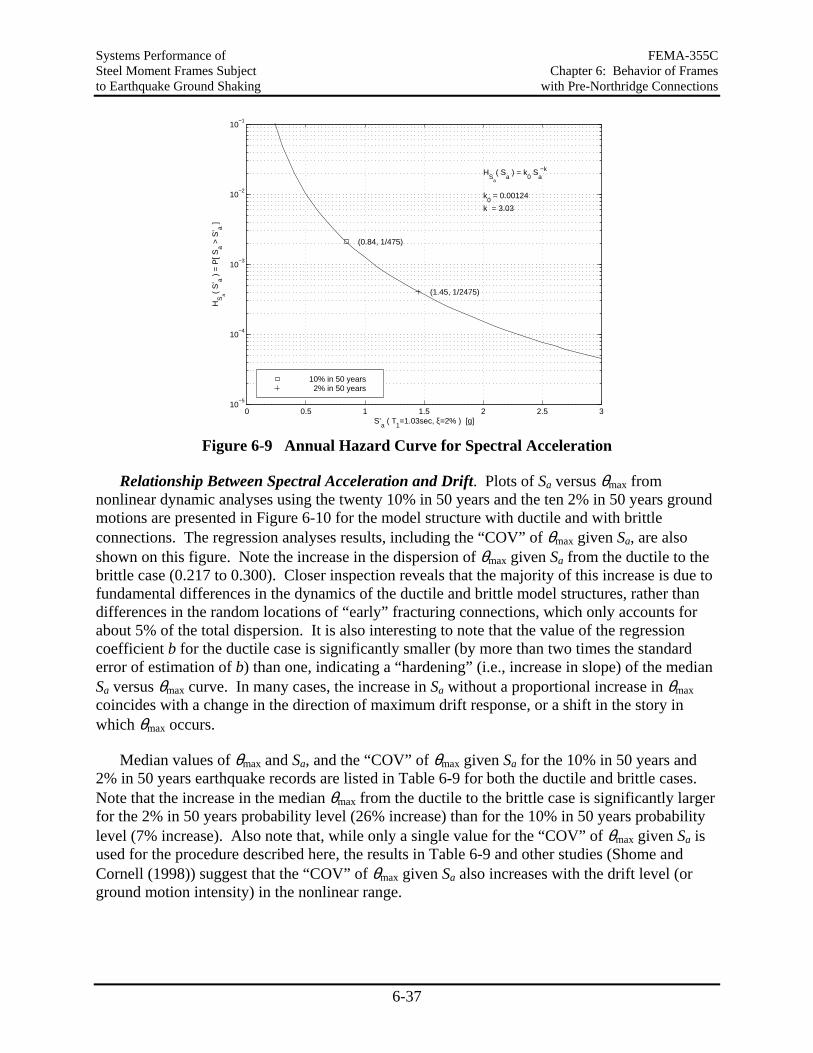
Systems Performance of FEMA-355C Steel Moment Frames Subject Chapter 6: Behavior of Frames to Earthquake Ground Shaking with Pre-Northridge Connections
6-37
0 0.5 1 1.5 2 2.5 310
−5
10−4
10−3
10−2
10−1
S’a ( T
1=1.03sec, ξ=2% ) [g]
HS
a( S
’ a ) =
P[ S
a > S
’ a ]
HS
a
( Sa ) = k
0 S
a −k
k
0 = 0.00124
k = 3.03
(0.84, 1/475)
(1.45, 1/2475)
10% in 50 years 2% in 50 years
Figure 6-9 Annual Hazard Curve for Spectral Acceleration
Relationship Between Spectral Acceleration and Drift. Plots of Sa versus θmax from nonlinear dynamic analyses using the twenty 10% in 50 years and the ten 2% in 50 years ground motions are presented in Figure 6-10 for the model structure with ductile and with brittle connections. The regression analyses results, including the “COV” of θmax given Sa, are also shown on this figure. Note the increase in the dispersion of θmax given Sa from the ductile to the brittle case (0.217 to 0.300). Closer inspection reveals that the majority of this increase is due to fundamental differences in the dynamics of the ductile and brittle model structures, rather than differences in the random locations of “early” fracturing connections, which only accounts for about 5% of the total dispersion. It is also interesting to note that the value of the regression coefficient b for the ductile case is significantly smaller (by more than two times the standard error of estimation of b) than one, indicating a “hardening” (i.e., increase in slope) of the median Sa versus θmax curve. In many cases, the increase in Sa without a proportional increase in θmax coincides with a change in the direction of maximum drift response, or a shift in the story in which θmax occurs.
Median values of θmax and Sa, and the “COV” of θmax given Sa for the 10% in 50 years and 2% in 50 years earthquake records are listed in Table 6-9 for both the ductile and brittle cases. Note that the increase in the median θmax from the ductile to the brittle case is significantly larger for the 2% in 50 years probability level (26% increase) than for the 10% in 50 years probability level (7% increase). Also note that, while only a single value for the “COV” of θmax given Sa is used for the procedure described here, the results in Table 6-9 and other studies (Shome and Cornell (1998)) suggest that the “COV” of θmax given Sa also increases with the drift level (or ground motion intensity) in the nonlinear range.
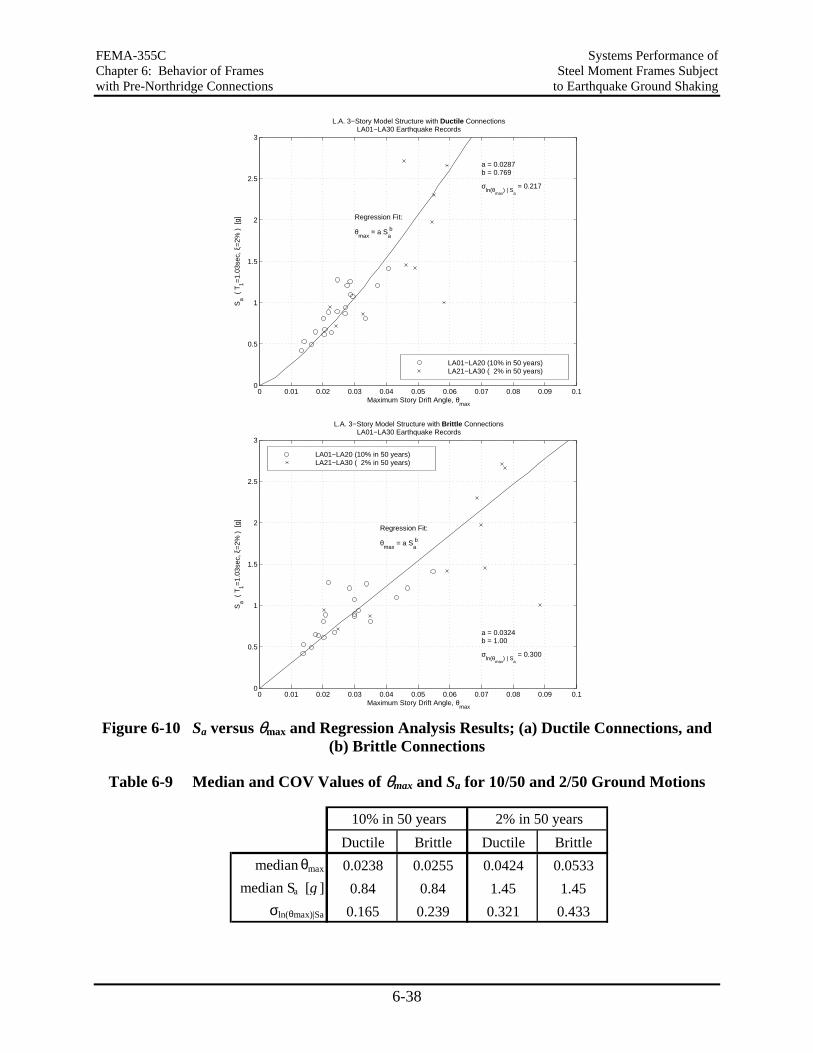
FEMA-355C Systems Performance of Chapter 6: Behavior of Frames Steel Moment Frames Subject with Pre-Northridge Connections to Earthquake Ground Shaking
6-38
0 0.01 0.02 0.03 0.04 0.05 0.06 0.07 0.08 0.09 0.10
0.5
1
1.5
2
2.5
3
L.A. 3−Story Model Structure with Ductile Connections LA01−LA30 Earthquake Records
Maximum Story Drift Angle, θmax
Sa (
T1=
1.03
sec,
ξ=
2% )
[g]
a = 0.0287 b = 0.769 σ
ln(θmax
) | Sa
= 0.217
Regression Fit: θ
max = a S
a b
LA01−LA20 (10% in 50 years) LA21−LA30 ( 2% in 50 years)
0 0.01 0.02 0.03 0.04 0.05 0.06 0.07 0.08 0.09 0.10
0.5
1
1.5
2
2.5
3
L.A. 3−Story Model Structure with Brittle Connections LA01−LA30 Earthquake Records
Maximum Story Drift Angle, θmax
Sa (
T1=
1.03
sec,
ξ=
2% )
[g]
a = 0.0324 b = 1.00 σ
ln(θmax
) | Sa
= 0.300
Regression Fit: θ
max = a S
a b
LA01−LA20 (10% in 50 years) LA21−LA30 ( 2% in 50 years)
Figure 6-10 Sa versus θmax and Regression Analysis Results; (a) Ductile Connections, and
(b) Brittle Connections
Table 6-9 Median and COV Values of θmax and Sa for 10/50 and 2/50 Ground Motions
Ductile Brittle Ductile Brittlemedian θmax 0.0238 0.0255 0.0424 0.0533
median Sa [g ] 0.84 0.84 1.45 1.45σln(θmax)|Sa 0.165 0.239 0.321 0.433
10% in 50 years 2% in 50 years
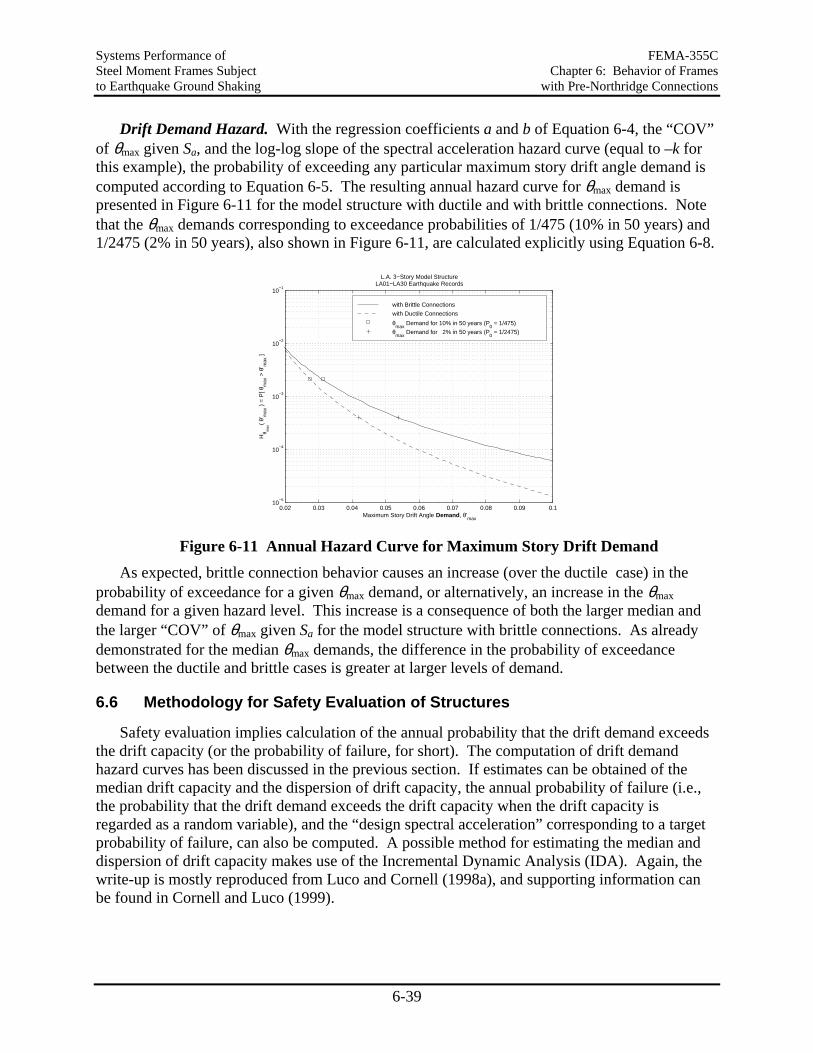
Systems Performance of FEMA-355C Steel Moment Frames Subject Chapter 6: Behavior of Frames to Earthquake Ground Shaking with Pre-Northridge Connections
6-39
Drift Demand Hazard. With the regression coefficients a and b of Equation 6-4, the “COV” of θmax given Sa, and the log-log slope of the spectral acceleration hazard curve (equal to –k for this example), the probability of exceeding any particular maximum story drift angle demand is computed according to Equation 6-5. The resulting annual hazard curve for θmax demand is presented in Figure 6-11 for the model structure with ductile and with brittle connections. Note that the θmax demands corresponding to exceedance probabilities of 1/475 (10% in 50 years) and 1/2475 (2% in 50 years), also shown in Figure 6-11, are calculated explicitly using Equation 6-8.
0.02 0.03 0.04 0.05 0.06 0.07 0.08 0.09 0.110
−5
10−4
10−3
10−2
10−1
L.A. 3−Story Model StructureLA01−LA30 Earthquake Records
Maximum Story Drift Angle Demand, θ’max
Hθ m
ax
( θ’
max
) =
P[ θ
max
> θ
’ max
]
with Brittle Connections
with Ductile Connections
θmax
Demand for 10% in 50 years (P0 = 1/475)
θmax
Demand for 2% in 50 years (P0 = 1/2475)
Figure 6-11 Annual Hazard Curve for Maximum Story Drift Demand As expected, brittle connection behavior causes an increase (over the ductile case) in the
probability of exceedance for a given θmax demand, or alternatively, an increase in the θmax demand for a given hazard level. This increase is a consequence of both the larger median and the larger “COV” of θmax given Sa for the model structure with brittle connections. As already demonstrated for the median θmax demands, the difference in the probability of exceedance between the ductile and brittle cases is greater at larger levels of demand.
6.6 Methodology for Safety Evaluation of Structures
Safety evaluation implies calculation of the annual probability that the drift demand exceeds the drift capacity (or the probability of failure, for short). The computation of drift demand hazard curves has been discussed in the previous section. If estimates can be obtained of the median drift capacity and the dispersion of drift capacity, the annual probability of failure (i.e., the probability that the drift demand exceeds the drift capacity when the drift capacity is regarded as a random variable), and the “design spectral acceleration” corresponding to a target probability of failure, can also be computed. A possible method for estimating the median and dispersion of drift capacity makes use of the Incremental Dynamic Analysis (IDA). Again, the write-up is mostly reproduced from Luco and Cornell (1998a), and supporting information can be found in Cornell and Luco (1999).
FEMA-355C Systems Performance of Chapter 6: Behavior of Frames Steel Moment Frames Subject with Pre-Northridge Connections to Earthquake Ground Shaking
6-40
6.6.1 Collapse Limit State Probability
If the drift capacity for a structure is regarded as a random variable, the annual probability that the drift demand exceeds the drift capacity (i.e., the probability of failure) can be calculated using the equation
[ ] ( )2
ˆfaS
capacitydemandf CSHPP
capacity
a⋅=>≡ δδδ (6−10)
where capacity
aS δ̂ is the spectral acceleration corresponding to the median drift capacity, and 2fC is
a correction factor which accounts for both the dispersion in drift demand given spectral acceleration and the dispersion in drift capacity.
capacity
aS δ̂ and 2fC are calculated as
bcapacity
a aS
capacity
1
ˆ ˆ
= δδ (6−11)
22
)ln(2
|)ln(2
2
21 bk
f
capacityaS
eC
+⋅
=δδ σσ
(6−12)
where )ln( capacityδσ is the “COV” of drift capacity. Clearly, in order to calculate the probability of
failure, the median and dispersion of the drift capacity must be estimated; this issue is discussed in the following subsection.
Analogous to calculating the drift demand corresponding to a particular annual probability of exceedance, the “design spectral acceleration” associated with a particular probability of failure (i.e., probability that the drift demand exceeds the drift capacity), fP′ , can be computed using the equation
4f
Pa
designa CSS f ⋅= ′ (6−13)
where fPaS ′ is the spectral acceleration corresponding to an annual exceedance probability of fP′
(from an elastic spectral acceleration hazard curve), and 4fC is a correction factor which
accounts for both the dispersion in drift demand given spectral acceleration and the dispersion in drift capacity. The correction factor
4fC is calculated as
22
)ln(2
|)ln(
4
21 bk
f
capacityaS
eC
+⋅
=δδ σσ
(6−14)
If a proposed structural design is “deterministically” analyzed for this design spectral acceleration (Wen and Foutch (1997)), and the resulting drift demand does not exceed the
Systems Performance of FEMA-355C Steel Moment Frames Subject Chapter 6: Behavior of Frames to Earthquake Ground Shaking with Pre-Northridge Connections
6-41
median drift capacity, then the failure probability for the structural design does not exceed the target failure probability.
6.6.2 Incremental Dynamic Analyses (IDAs)
For some drift parameters, the drift capacity for a model structure may be difficult to identify. Such is the case for maximum story drift angle (over all stories), which is the basic demand parameter employed by SAC and is used for the numerical example presented here. SAC has decided to use “Incremental Dynamic Analyses” (IDAs) of the structure, subjected to several earthquake records, to characterize the maximum story drift angle capacity against collapse. A single IDA entails performing multiple nonlinear dynamic analyses for a model structure subjected to an earthquake record, which is incrementally scaled. The result is an IDA curve that relates the scale factor for the earthquake record and the drift response of the model structure. From the IDA curve, the maximum story drift angle limit corresponding to the transition point when the analytical response of the model structure becomes “unstable” (i.e., when the dynamic drift response increases drastically for a relatively small increase in ground motion intensity), or when the apparent “stiffness” (i.e., the slope of the IDA curve) decreases radically, may be used as a measure of the maximum story drift angle capacity. It is important to note that this “dynamic capacity” is different, in concept, than a static story drift angle capacity. With several estimates (from IDA curves for several earthquake records) of the maximum story drift angle capacity, the median and dispersion of the maximum story drift angle capacity, and hence the probability of failure for the model structure, can be calculated.
The IDA, which pushes the structure to very large inelastic drifts, relies on the ability to model inelastic behavior with sufficient accuracy to represent all important phenomena at these large drifts. This includes modeling of important deterioration phenomena, should they occur before these drifts are attained. The following example models fractured connections, but does not account for other deterioration phenomena discussed in Section 5.11.
6.6.3 Numerical Example
This illustrative example is a continuation of the example used in Section 6.5.2, using the LA 3-story model structure.
Collapse Limit State Probability. In order to calculate the annual probability that the θmax demand exceeds the θmax capacity for the model structure (i.e., the probability of failure), the median θmax capacity and the “COV” of the θmax capacity must be estimated. An attempt to identify the maximum story drift angle capacity against collapse using IDAs is detailed later. As an alternative, the probability of failure is calculated according to Equation 6-10 for a range of median θmax capacities (0.025 to 0.10) and two values of θmax capacity “COV” (0.10 and 0.40). A value of 0.025 for the median θmax capacity may be regarded as a lower bound that approximates the static story drift angle capacity; that is, an elastic drift angle of approximately 0.01 and an inelastic drift angle of 0.015 (assuming that the inelastic drift angle is equal to the plastic rotation in the beam-column connections before fracture). The upper bound median θmax capacity of 0.10 merely corresponds to the story drift angle after which the credibility of the
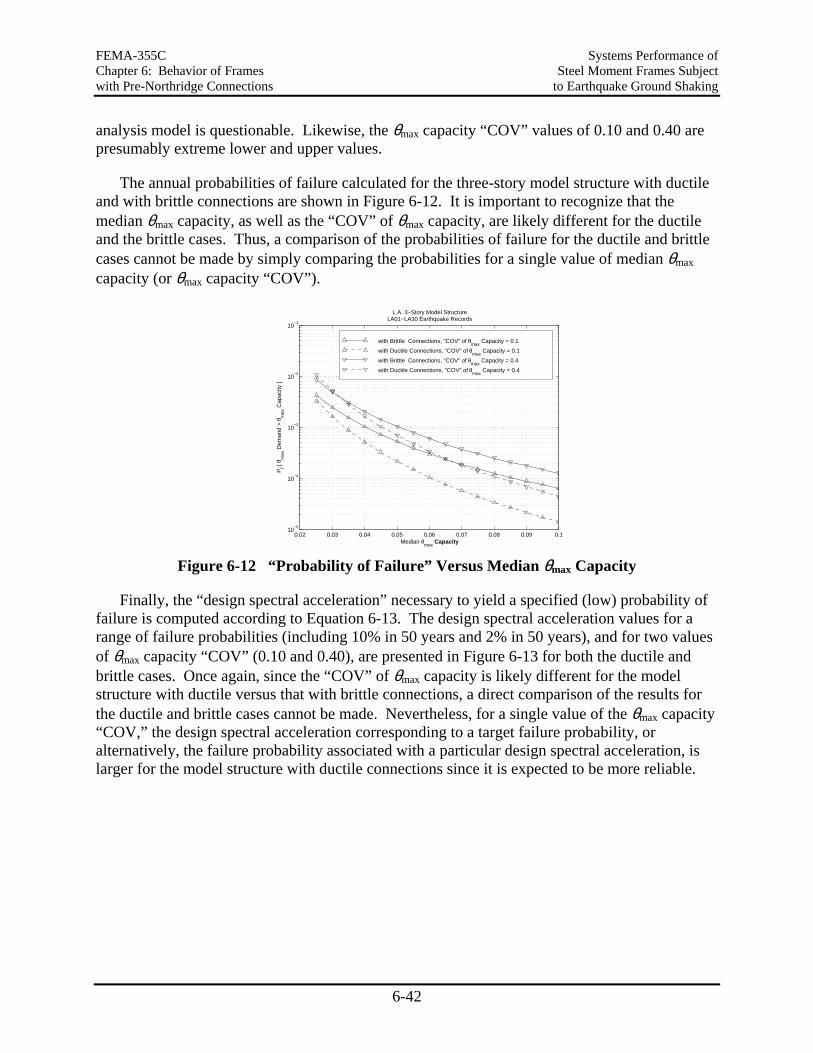
FEMA-355C Systems Performance of Chapter 6: Behavior of Frames Steel Moment Frames Subject with Pre-Northridge Connections to Earthquake Ground Shaking
6-42
analysis model is questionable. Likewise, the θmax capacity “COV” values of 0.10 and 0.40 are presumably extreme lower and upper values.
The annual probabilities of failure calculated for the three-story model structure with ductile and with brittle connections are shown in Figure 6-12. It is important to recognize that the median θmax capacity, as well as the “COV” of θmax capacity, are likely different for the ductile and the brittle cases. Thus, a comparison of the probabilities of failure for the ductile and brittle cases cannot be made by simply comparing the probabilities for a single value of median θmax capacity (or θmax capacity “COV”).
0.02 0.03 0.04 0.05 0.06 0.07 0.08 0.09 0.110
−5
10−4
10−3
10−2
10−1
L.A. 3−Story Model StructureLA01−LA30 Earthquake Records
Median θmax
Capacity
Pf [
θ max
Dem
and
> θ
max
Cap
acity
]
with Brittle Connections, "COV" of θmax
Capacity = 0.1
with Ductile Connections, "COV" of θmax
Capacity = 0.1
with Brittle Connections, "COV" of θmax
Capacity = 0.4
with Ductile Connections, "COV" of θmax
Capacity = 0.4
Figure 6-12 “Probability of Failure” Versus Median θmax Capacity
Finally, the “design spectral acceleration” necessary to yield a specified (low) probability of failure is computed according to Equation 6-13. The design spectral acceleration values for a range of failure probabilities (including 10% in 50 years and 2% in 50 years), and for two values of θmax capacity “COV” (0.10 and 0.40), are presented in Figure 6-13 for both the ductile and brittle cases. Once again, since the “COV” of θmax capacity is likely different for the model structure with ductile versus that with brittle connections, a direct comparison of the results for the ductile and brittle cases cannot be made. Nevertheless, for a single value of the θmax capacity “COV,” the design spectral acceleration corresponding to a target failure probability, or alternatively, the failure probability associated with a particular design spectral acceleration, is larger for the model structure with ductile connections since it is expected to be more reliable.
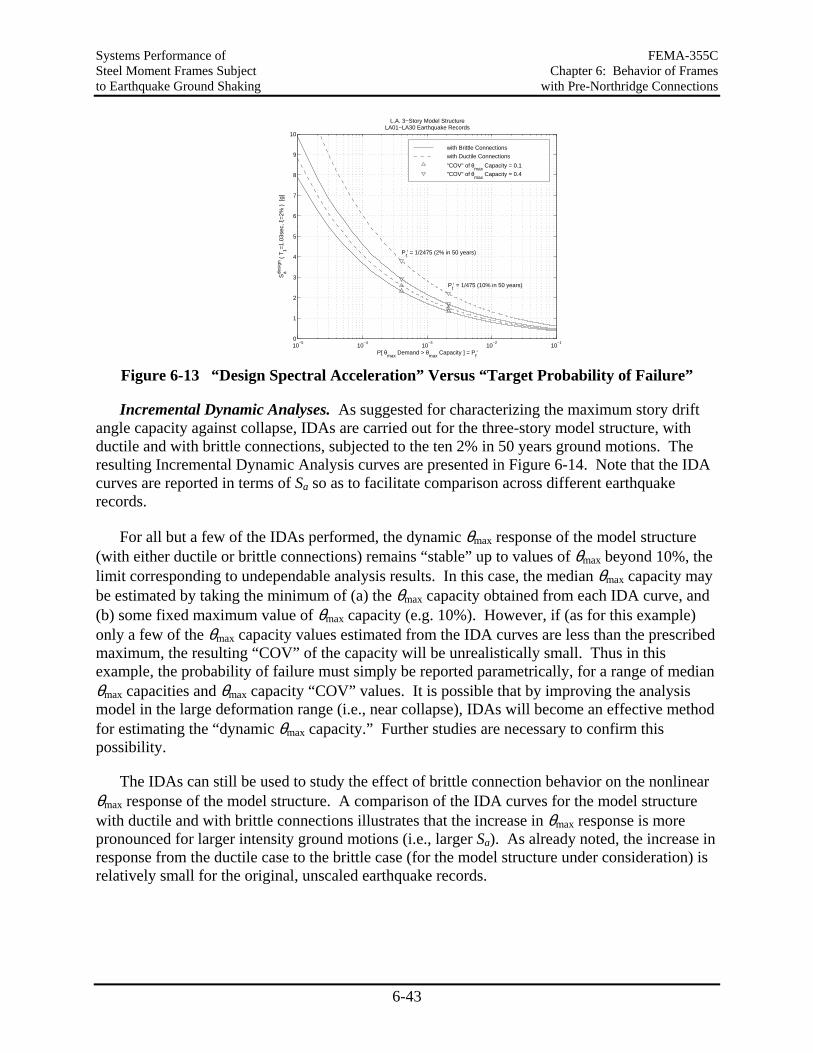
Systems Performance of FEMA-355C Steel Moment Frames Subject Chapter 6: Behavior of Frames to Earthquake Ground Shaking with Pre-Northridge Connections
6-43
10−5
10−4
10−3
10−2
10−1
0
1
2
3
4
5
6
7
8
9
10
L.A. 3−Story Model StructureLA01−LA30 Earthquake Records
P[ θmax
Demand > θmax
Capacity ] = Pf’
Sade
sign
( T
1=1.
03se
c, ξ
=2%
) [
g]P
f’ = 1/475 (10% in 50 years)
Pf’ = 1/2475 (2% in 50 years)
with Brittle Connections
with Ductile Connections
"COV" of θmax
Capacity = 0.1
"COV" of θmax
Capacity = 0.4
Figure 6-13 “Design Spectral Acceleration” Versus “Target Probability of Failure”
Incremental Dynamic Analyses. As suggested for characterizing the maximum story drift angle capacity against collapse, IDAs are carried out for the three-story model structure, with ductile and with brittle connections, subjected to the ten 2% in 50 years ground motions. The resulting Incremental Dynamic Analysis curves are presented in Figure 6-14. Note that the IDA curves are reported in terms of Sa so as to facilitate comparison across different earthquake records.
For all but a few of the IDAs performed, the dynamic θmax response of the model structure (with either ductile or brittle connections) remains “stable” up to values of θmax beyond 10%, the limit corresponding to undependable analysis results. In this case, the median θmax capacity may be estimated by taking the minimum of (a) the θmax capacity obtained from each IDA curve, and (b) some fixed maximum value of θmax capacity (e.g. 10%). However, if (as for this example) only a few of the θmax capacity values estimated from the IDA curves are less than the prescribed maximum, the resulting “COV” of the capacity will be unrealistically small. Thus in this example, the probability of failure must simply be reported parametrically, for a range of median θmax capacities and θmax capacity “COV” values. It is possible that by improving the analysis model in the large deformation range (i.e., near collapse), IDAs will become an effective method for estimating the “dynamic θmax capacity.” Further studies are necessary to confirm this possibility.
The IDAs can still be used to study the effect of brittle connection behavior on the nonlinear θmax response of the model structure. A comparison of the IDA curves for the model structure with ductile and with brittle connections illustrates that the increase in θmax response is more pronounced for larger intensity ground motions (i.e., larger Sa). As already noted, the increase in response from the ductile case to the brittle case (for the model structure under consideration) is relatively small for the original, unscaled earthquake records.
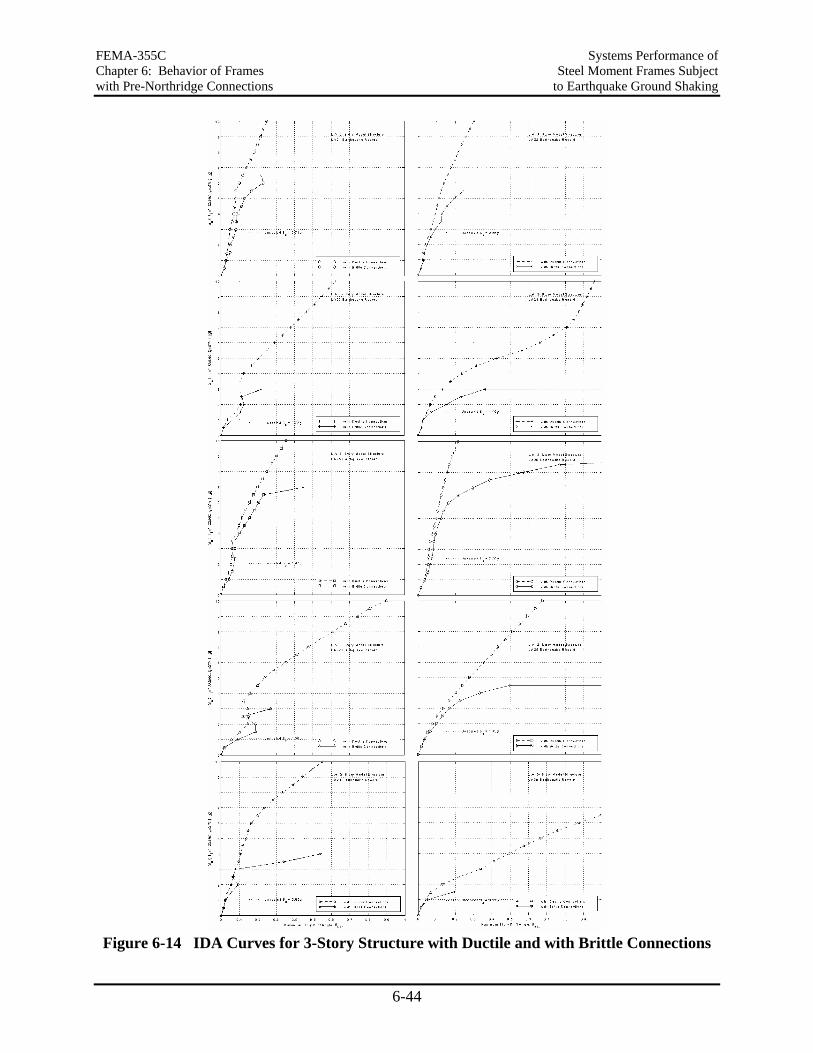
FEMA-355C Systems Performance of Chapter 6: Behavior of Frames Steel Moment Frames Subject with Pre-Northridge Connections to Earthquake Ground Shaking
6-44
Figure 6-14 IDA Curves for 3-Story Structure with Ductile and with Brittle Connections
Systems Performance of FEMA-355C Steel Moment Frames Subject Chapter 7: Frames with to Earthquake Ground Shaking Partially Restrained Connections
7-1
7. FRAMES WITH PARTIALLY RESTRAINED CONNECTIONS
Partially restrained (PR) connections are used extensively in regions of low seismicity. Their use in regions of high seismicity is limited because of code constraints and the use of a much smaller R (or Rw) factor than is employed for special moment-resisting frames with welded connections. The Northridge experience with welded connections has raised the question to what extent well designed and detailed PR connections can be used in regions of high seismicity and to what extent it is necessary to penalize frames with PR connections through the use of a smaller R factor in the design for strength.
The state of knowledge on the behavior of PR connections and on the seismic response of frames with such connections has improved considerably during the last decade (e.g., references in Section 2.4, and Leon (1995), Leon et al. (1996,) Leon (1997), Leon (1998)). Several experimental studies on frame subassemblies with PR connections have been carried out recently and are summarized in Roeder (2000). This chapter is concerned with analytical modeling and an assessment of the system response of frame structures with PR connections. The discussion is based on two studies carried out within the SAC program, which are summarized in Section 7.2.1.
7.1 Modeling of Strength and Stiffness Properties of PR Connections
PR connections come in great variations. Examples of a top and seat angle and a T-stub connection are shown in Figure 7-1. Other options are composite PR connections in which the floor slab (with appropriate reinforcement) takes over the function of force transfer between the beam top flange and the column, or end plate connections in which the relative rotation between beam and column is sufficiently large to merit consideration in performance prediction. The cyclic response of PR connections varies with connection type and geometry, but is usually of a “pinched” hysteretic nature of the type shown in Figure 7-2 for a T-stub connection. The pinching usually comes from slip in bolts and/or local plastic deformations such as plastic hinging of a connection plate element.
Analysis of frames with PR connections requires the explicit modeling of the strength and stiffness properties of PR connections. This can be achieved by means of a series of springs that represent behavior of the individual parts of a connection (Leon (1995)), or by means of a single rotational spring that represents the global moment-rotation behavior of the connection. The latter is more common and is deemed to be adequate (even though it disregards specific deformation modes such as axial extension and shear deformation) provided that sufficient experimental evidence is available to construct hysteresis rules that incorporate all salient features of the connection moment-rotation response.
One of the difficulties in analytical modeling of frames with PR connections is the decision on the necessary complexity of the connection model. “Necessary” implies that only those characteristics need to be simulated that have a consequential effect on the system response. In most cases this implies a representative “elastic” stiffness, a strain hardening stiffness, a relatively simple rule that represents pinching, and, if necessary, a rule that accounts for
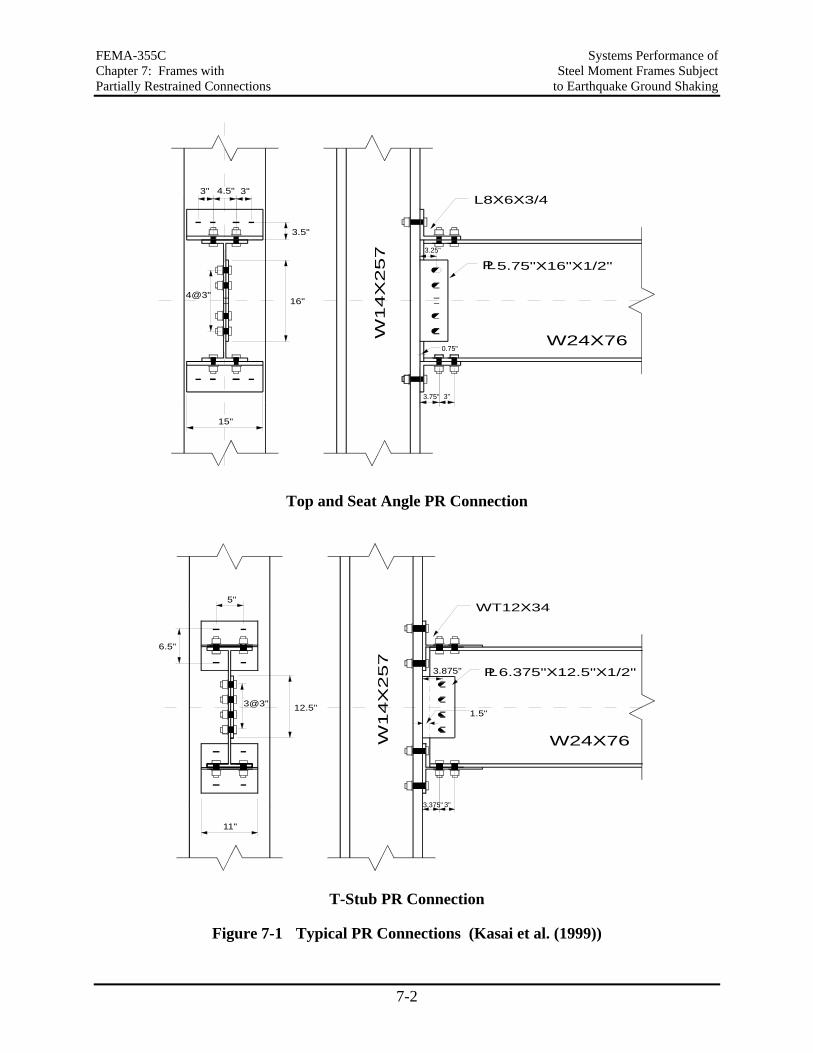
FEMA-355C Systems Performance of Chapter 7: Frames with Steel Moment Frames Subject Partially Restrained Connections to Earthquake Ground Shaking
7-2
16"
W14X
257
4@3"
15"
4.5"3"
3.5"
3"
W24X76
3.75" 3"
0.75"
5.75"X16"X1/2"
L8X6X3/4
3.25"
PL
Top and Seat Angle PR Connection
W14X
257
11"
12.5"3@3"
6.5"
5"
W24X76
1.5"
3.375" 3"
6.375"X12.5"X1/2"
WT12X34
3.875" PL
T-Stub PR Connection
Figure 7-1 Typical PR Connections (Kasai et al. (1999))
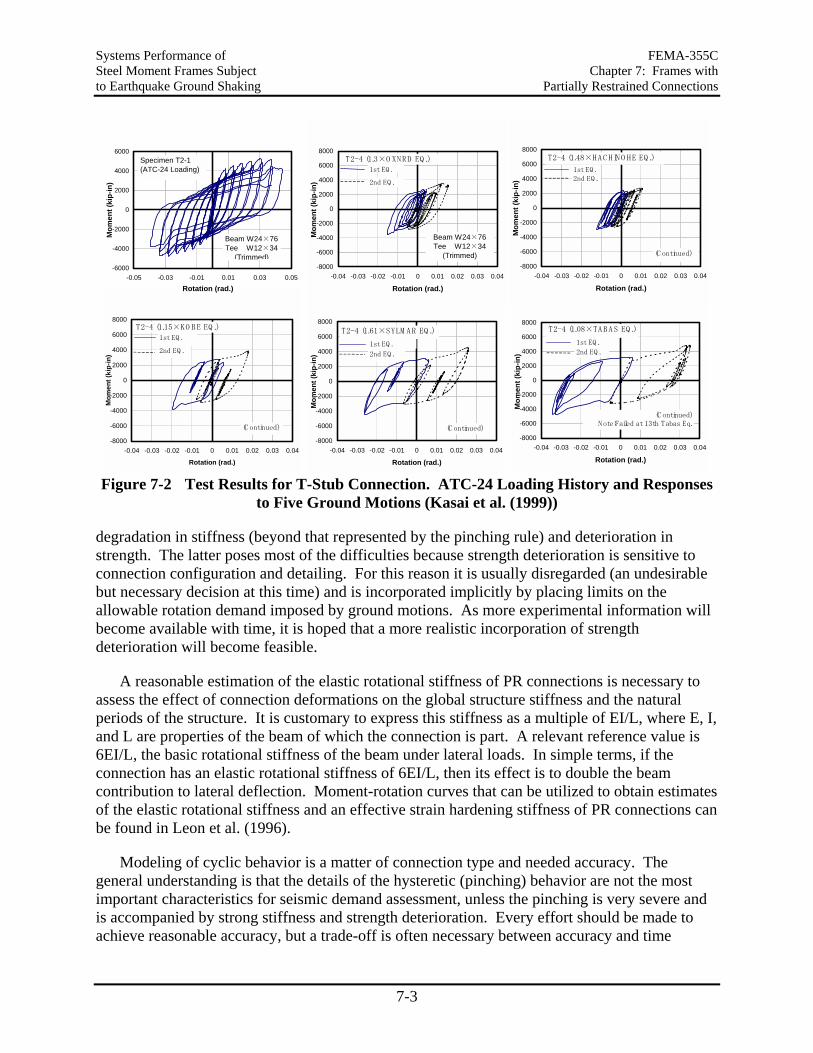
Systems Performance of FEMA-355C Steel Moment Frames Subject Chapter 7: Frames with to Earthquake Ground Shaking Partially Restrained Connections
7-3
-8000
-6000
-4000
-2000
0
2000
4000
6000
8000
-0.04 -0.03 -0.02 -0.01 0 0.01 0.02 0.03 0.04
Rotation (rad.)
Mom
ent (
kip-
in)
T2-4 (1.15×KO BE EQ .)
2nd EQ .
1st EQ .
(C ontinued)
-8000
-6000
-4000
-2000
0
2000
4000
6000
8000
-0.04 -0.03 -0.02 -0.01 0 0.01 0.02 0.03 0.04
Rotation (rad.)
Mom
ent (
kip-
in)
T2-4 (1.08×TABAS EQ .)
2nd EQ .
1st EQ .
(C ontinued)Note:Failed at 13th Tabas Eq.
-6000
-4000
-2000
0
2000
4000
6000
-0.05 -0.03 -0.01 0.01 0.03 0.05Rotation (rad.)
Mom
ent (
kip-
in)
Specimen T2-1(ATC-24 Loading)
Beam W24×76Tee W12×34
(Trimmed)
-8000
-6000
-4000
-2000
0
2000
4000
6000
8000
-0.04 -0.03 -0.02 -0.01 0 0.01 0.02 0.03 0.04
Rotation (rad.)
Mom
ent (
kip-
in)
T2-4 (1.61×SYLM AR EQ .)
2nd EQ .
1st EQ .
(C ontinued)
-8000
-6000
-4000
-2000
0
2000
4000
6000
8000
-0.04 -0.03 -0.02 -0.01 0 0.01 0.02 0.03 0.04
Rotation (rad.)
Mom
ent (
kip-
in)
(C ontinued)
T2-4 (1.48×HAC HINO HE EQ .)
2nd EQ .1st EQ .
-8000
-6000
-4000
-2000
0
2000
4000
6000
8000
-0.04 -0.03 -0.02 -0.01 0 0.01 0.02 0.03 0.04
Rotation (rad.)
Mom
ent (
kip-
in)
T2-4 (1.3×O XNRD EQ .)
2nd EQ .
1st EQ .
Beam W24×76Tee W12×34
(Trimmed)
Figure 7-2 Test Results for T-Stub Connection. ATC-24 Loading History and Responses
to Five Ground Motions (Kasai et al. (1999))
degradation in stiffness (beyond that represented by the pinching rule) and deterioration in strength. The latter poses most of the difficulties because strength deterioration is sensitive to connection configuration and detailing. For this reason it is usually disregarded (an undesirable but necessary decision at this time) and is incorporated implicitly by placing limits on the allowable rotation demand imposed by ground motions. As more experimental information will become available with time, it is hoped that a more realistic incorporation of strength deterioration will become feasible.
A reasonable estimation of the elastic rotational stiffness of PR connections is necessary to assess the effect of connection deformations on the global structure stiffness and the natural periods of the structure. It is customary to express this stiffness as a multiple of EI/L, where E, I, and L are properties of the beam of which the connection is part. A relevant reference value is 6EI/L, the basic rotational stiffness of the beam under lateral loads. In simple terms, if the connection has an elastic rotational stiffness of 6EI/L, then its effect is to double the beam contribution to lateral deflection. Moment-rotation curves that can be utilized to obtain estimates of the elastic rotational stiffness and an effective strain hardening stiffness of PR connections can be found in Leon et al. (1996).
Modeling of cyclic behavior is a matter of connection type and needed accuracy. The general understanding is that the details of the hysteretic (pinching) behavior are not the most important characteristics for seismic demand assessment, unless the pinching is very severe and is accompanied by strong stiffness and strength deterioration. Every effort should be made to achieve reasonable accuracy, but a trade-off is often necessary between accuracy and time
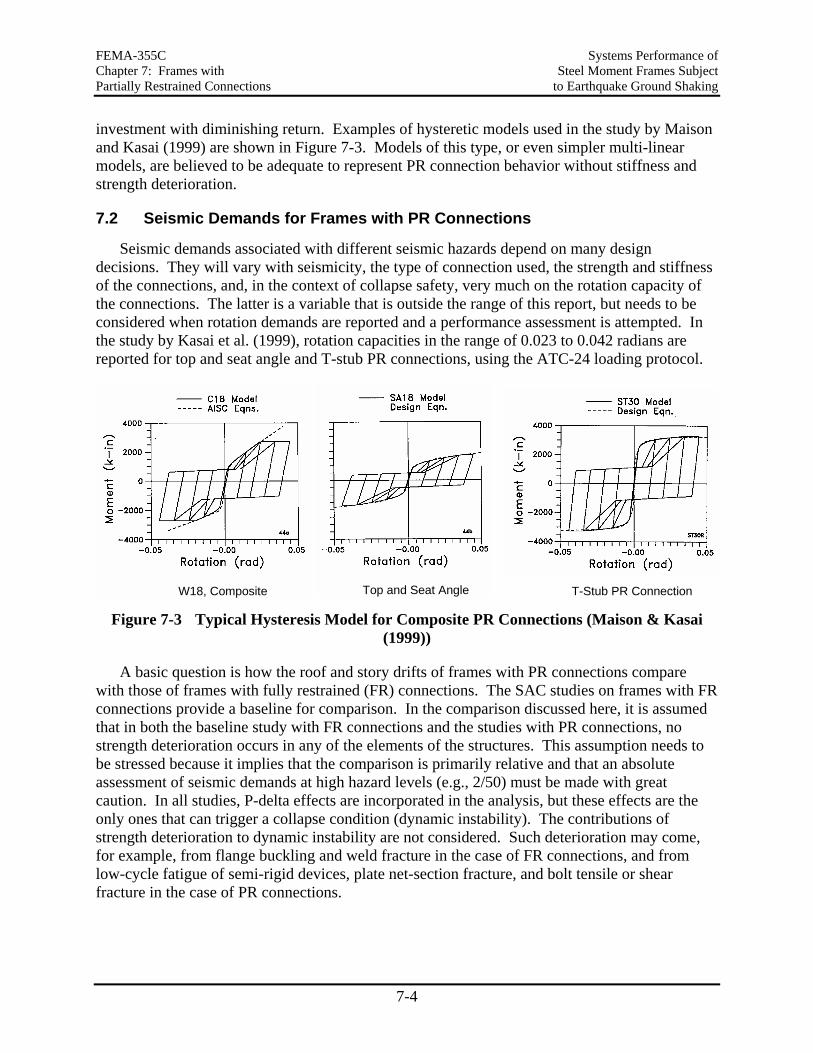
FEMA-355C Systems Performance of Chapter 7: Frames with Steel Moment Frames Subject Partially Restrained Connections to Earthquake Ground Shaking
7-4
investment with diminishing return. Examples of hysteretic models used in the study by Maison and Kasai (1999) are shown in Figure 7-3. Models of this type, or even simpler multi-linear models, are believed to be adequate to represent PR connection behavior without stiffness and strength deterioration.
7.2 Seismic Demands for Frames with PR Connections
Seismic demands associated with different seismic hazards depend on many design decisions. They will vary with seismicity, the type of connection used, the strength and stiffness of the connections, and, in the context of collapse safety, very much on the rotation capacity of the connections. The latter is a variable that is outside the range of this report, but needs to be considered when rotation demands are reported and a performance assessment is attempted. In the study by Kasai et al. (1999), rotation capacities in the range of 0.023 to 0.042 radians are reported for top and seat angle and T-stub PR connections, using the ATC-24 loading protocol.
W18, Composite T-Stub PR ConnectionTop and Seat Angle
Figure 7-3 Typical Hysteresis Model for Composite PR Connections (Maison & Kasai (1999))
A basic question is how the roof and story drifts of frames with PR connections compare with those of frames with fully restrained (FR) connections. The SAC studies on frames with FR connections provide a baseline for comparison. In the comparison discussed here, it is assumed that in both the baseline study with FR connections and the studies with PR connections, no strength deterioration occurs in any of the elements of the structures. This assumption needs to be stressed because it implies that the comparison is primarily relative and that an absolute assessment of seismic demands at high hazard levels (e.g., 2/50) must be made with great caution. In all studies, P-delta effects are incorporated in the analysis, but these effects are the only ones that can trigger a collapse condition (dynamic instability). The contributions of strength deterioration to dynamic instability are not considered. Such deterioration may come, for example, from flange buckling and weld fracture in the case of FR connections, and from low-cycle fatigue of semi-rigid devices, plate net-section fracture, and bolt tensile or shear fracture in the case of PR connections.
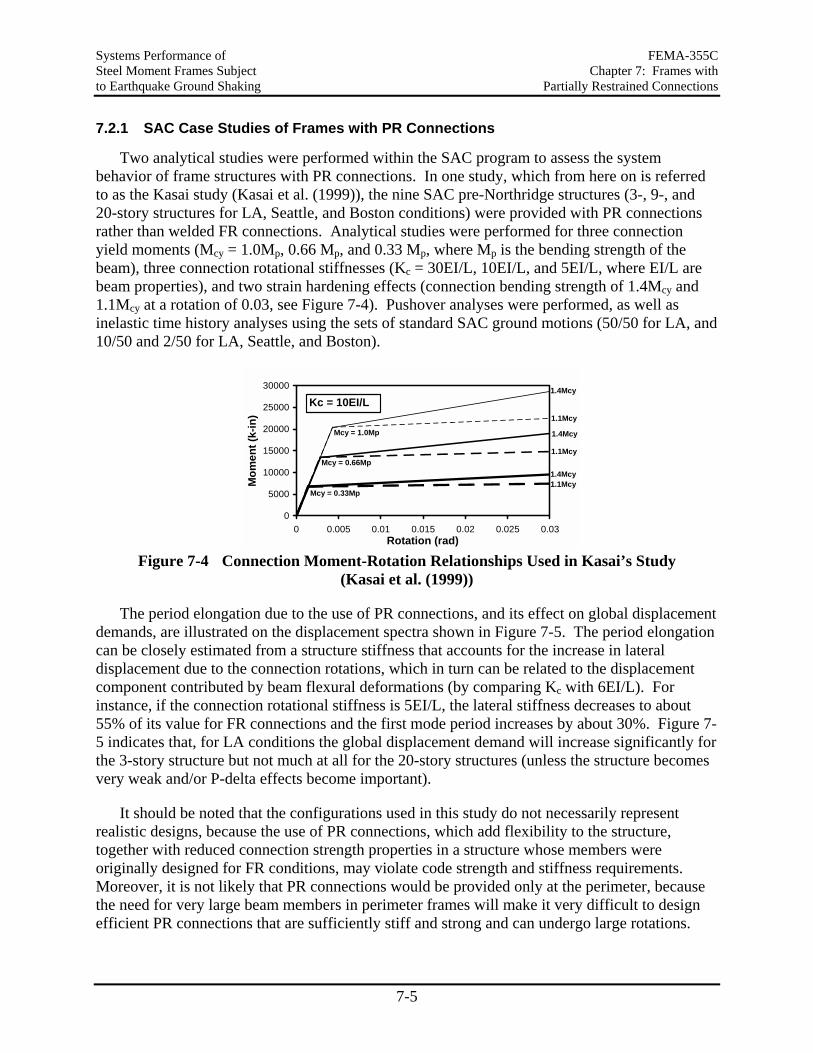
Systems Performance of FEMA-355C Steel Moment Frames Subject Chapter 7: Frames with to Earthquake Ground Shaking Partially Restrained Connections
7-5
7.2.1 SAC Case Studies of Frames with PR Connections
Two analytical studies were performed within the SAC program to assess the system behavior of frame structures with PR connections. In one study, which from here on is referred to as the Kasai study (Kasai et al. (1999)), the nine SAC pre-Northridge structures (3-, 9-, and 20-story structures for LA, Seattle, and Boston conditions) were provided with PR connections rather than welded FR connections. Analytical studies were performed for three connection yield moments (Mcy = 1.0Mp, 0.66 Mp, and 0.33 Mp, where Mp is the bending strength of the beam), three connection rotational stiffnesses (Kc = 30EI/L, 10EI/L, and 5EI/L, where EI/L are beam properties), and two strain hardening effects (connection bending strength of 1.4Mcy and 1.1Mcy at a rotation of 0.03, see Figure 7-4). Pushover analyses were performed, as well as inelastic time history analyses using the sets of standard SAC ground motions (50/50 for LA, and 10/50 and 2/50 for LA, Seattle, and Boston).
1.4Mcy
1.1Mcy
Mcy = 1.0Mp 1.4Mcy
Mcy = 0.66Mp1.1Mcy
1.4Mcy
Mcy = 0.33Mp1.1Mcy
0
5000
10000
15000
20000
25000
30000
0 0.005 0.01 0.015 0.02 0.025 0.03Rotation (rad)
Mom
ent (
k-in
)
Kc = 10EI/L
Figure 7-4 Connection Moment-Rotation Relationships Used in Kasai’s Study
(Kasai et al. (1999))
The period elongation due to the use of PR connections, and its effect on global displacement demands, are illustrated on the displacement spectra shown in Figure 7-5. The period elongation can be closely estimated from a structure stiffness that accounts for the increase in lateral displacement due to the connection rotations, which in turn can be related to the displacement component contributed by beam flexural deformations (by comparing Kc with 6EI/L). For instance, if the connection rotational stiffness is 5EI/L, the lateral stiffness decreases to about 55% of its value for FR connections and the first mode period increases by about 30%. Figure 7-5 indicates that, for LA conditions the global displacement demand will increase significantly for the 3-story structure but not much at all for the 20-story structures (unless the structure becomes very weak and/or P-delta effects become important).
It should be noted that the configurations used in this study do not necessarily represent realistic designs, because the use of PR connections, which add flexibility to the structure, together with reduced connection strength properties in a structure whose members were originally designed for FR conditions, may violate code strength and stiffness requirements. Moreover, it is not likely that PR connections would be provided only at the perimeter, because the need for very large beam members in perimeter frames will make it very difficult to design efficient PR connections that are sufficiently stiff and strong and can undergo large rotations.
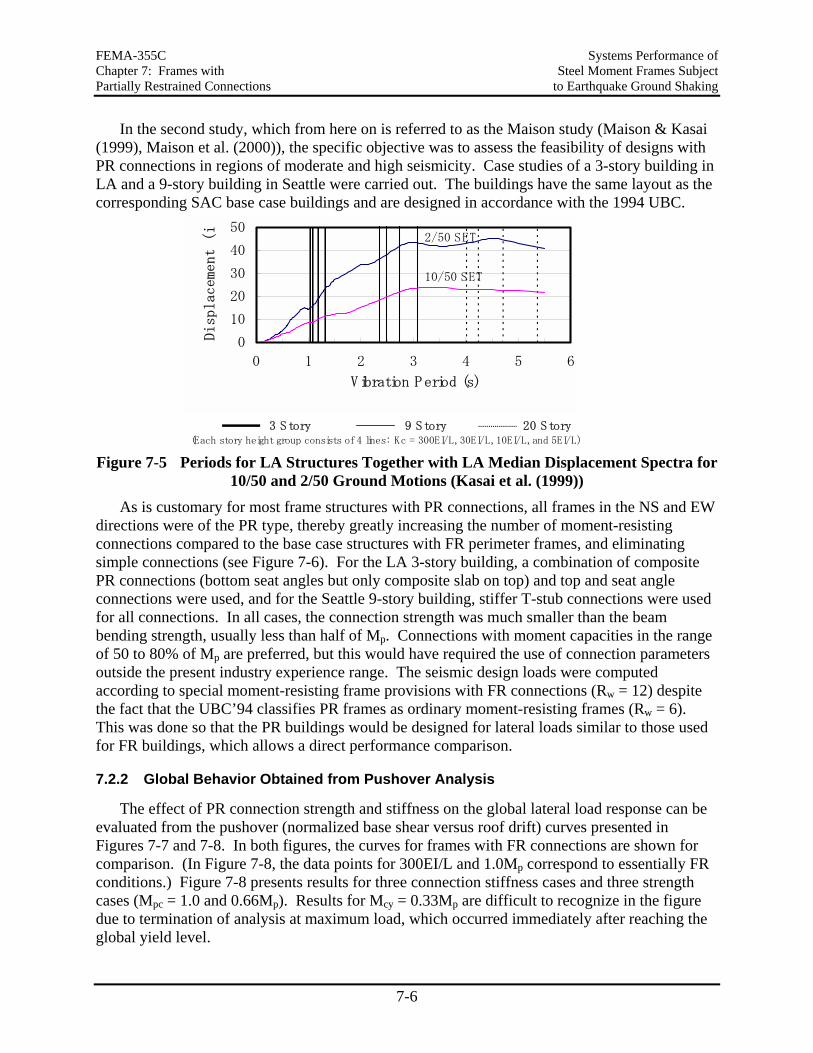
FEMA-355C Systems Performance of Chapter 7: Frames with Steel Moment Frames Subject Partially Restrained Connections to Earthquake Ground Shaking
7-6
In the second study, which from here on is referred to as the Maison study (Maison & Kasai (1999), Maison et al. (2000)), the specific objective was to assess the feasibility of designs with PR connections in regions of moderate and high seismicity. Case studies of a 3-story building in LA and a 9-story building in Seattle were carried out. The buildings have the same layout as the corresponding SAC base case buildings and are designed in accordance with the 1994 UBC.
3 Story 9 Story 20 Story (Each story height group consists of 4 lines: Kc = 300EI/L, 30EI/L, 10EI/L, and 5EI/L)
0
10
20
30
40
50
0 1 2 3 4 5 6
Vibration Period (s)
Displacement (i
10/50 SET
2/50 SET
Figure 7-5 Periods for LA Structures Together with LA Median Displacement Spectra for
10/50 and 2/50 Ground Motions (Kasai et al. (1999)) As is customary for most frame structures with PR connections, all frames in the NS and EW
directions were of the PR type, thereby greatly increasing the number of moment-resisting connections compared to the base case structures with FR perimeter frames, and eliminating simple connections (see Figure 7-6). For the LA 3-story building, a combination of composite PR connections (bottom seat angles but only composite slab on top) and top and seat angle connections were used, and for the Seattle 9-story building, stiffer T-stub connections were used for all connections. In all cases, the connection strength was much smaller than the beam bending strength, usually less than half of Mp. Connections with moment capacities in the range of 50 to 80% of Mp are preferred, but this would have required the use of connection parameters outside the present industry experience range. The seismic design loads were computed according to special moment-resisting frame provisions with FR connections (Rw = 12) despite the fact that the UBC’94 classifies PR frames as ordinary moment-resisting frames (Rw = 6). This was done so that the PR buildings would be designed for lateral loads similar to those used for FR buildings, which allows a direct performance comparison.
7.2.2 Global Behavior Obtained from Pushover Analysis
The effect of PR connection strength and stiffness on the global lateral load response can be evaluated from the pushover (normalized base shear versus roof drift) curves presented in Figures 7-7 and 7-8. In both figures, the curves for frames with FR connections are shown for comparison. (In Figure 7-8, the data points for 300EI/L and 1.0Mp correspond to essentially FR conditions.) Figure 7-8 presents results for three connection stiffness cases and three strength cases (Mpc = 1.0 and 0.66Mp). Results for Mcy = 0.33Mp are difficult to recognize in the figure due to termination of analysis at maximum load, which occurred immediately after reaching the global yield level.
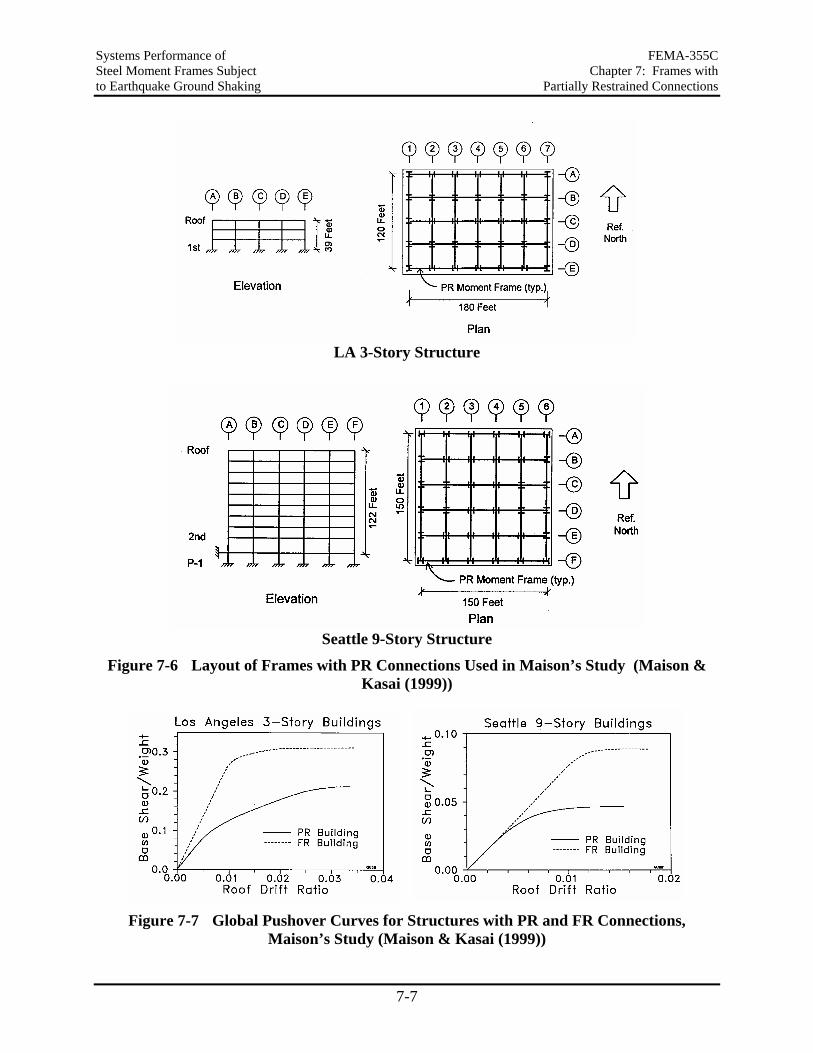
Systems Performance of FEMA-355C Steel Moment Frames Subject Chapter 7: Frames with to Earthquake Ground Shaking Partially Restrained Connections
7-7
LA 3-Story Structure
Seattle 9-Story Structure
Figure 7-6 Layout of Frames with PR Connections Used in Maison’s Study (Maison & Kasai (1999))
Figure 7-7 Global Pushover Curves for Structures with PR and FR Connections, Maison’s Study (Maison & Kasai (1999))
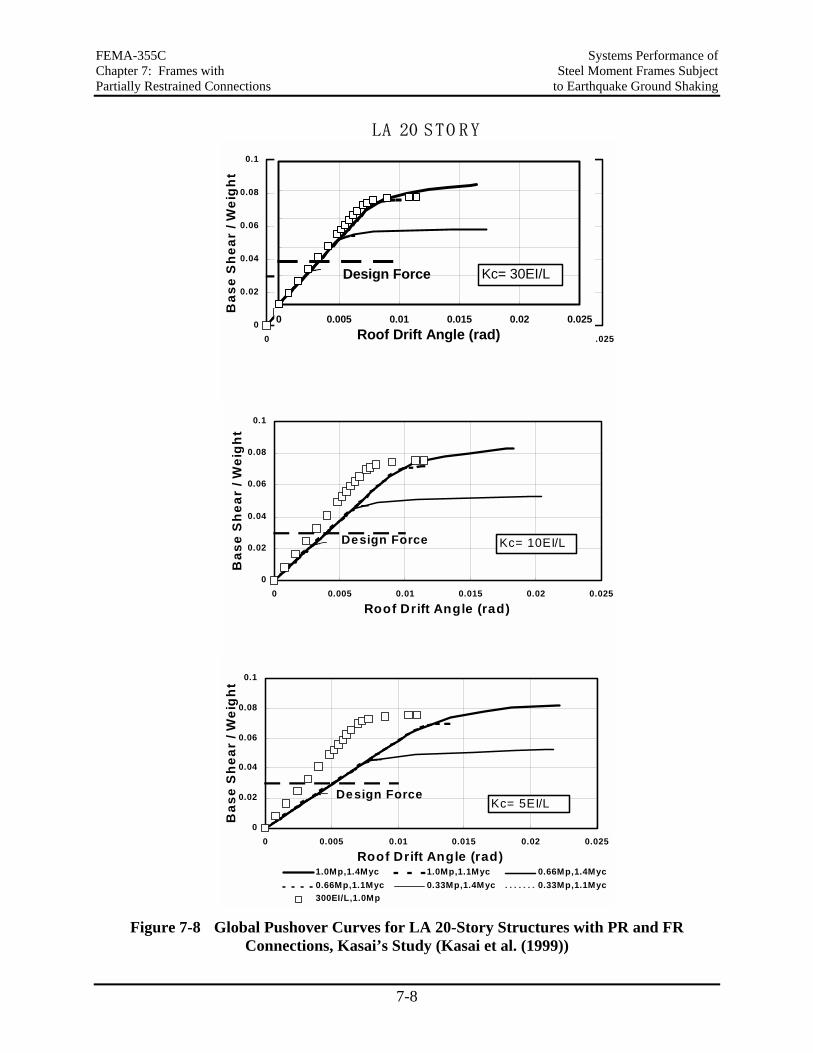
FEMA-355C Systems Performance of Chapter 7: Frames with Steel Moment Frames Subject Partially Restrained Connections to Earthquake Ground Shaking
7-8
0
0.02
0.04
0.06
0.08
0.1
0 0.005 0.01 0.015 0.02 0.025
Roof Drift Angle (rad)
Bas
e S
hear
/ W
eigh
t
Kc= 30EI/LDesign Force
0
0.02
0.04
0.06
0.08
0.1
0 0.005 0.01 0.015 0.02 0.025
Roof Drift Angle (rad)
Bas
e S
hear
/ W
eigh
t
Design Force Kc= 10EI/L
0
0.02
0.04
0.06
0.08
0.1
0 0.005 0.01 0.015 0.02 0.025
Roof Drift Angle (rad)
Bas
e S
hear
/ W
eigh
t
1.0Mp,1.4Myc 1.0Mp,1.1Myc 0.66Mp,1.4Myc0.66Mp,1.1Myc 0.33Mp,1.4Myc 0.33Mp,1.1Myc300EI/L,1.0Mp
Design ForceKc= 5EI/L
LA 20 STO RY
0 0.005 0.01 0.015 0.02 0.025Roof Drift Angle (rad)
Kc= 30EI/LDesign Force
Figure 7-8 Global Pushover Curves for LA 20-Story Structures with PR and FR
Connections, Kasai’s Study (Kasai et al. (1999))
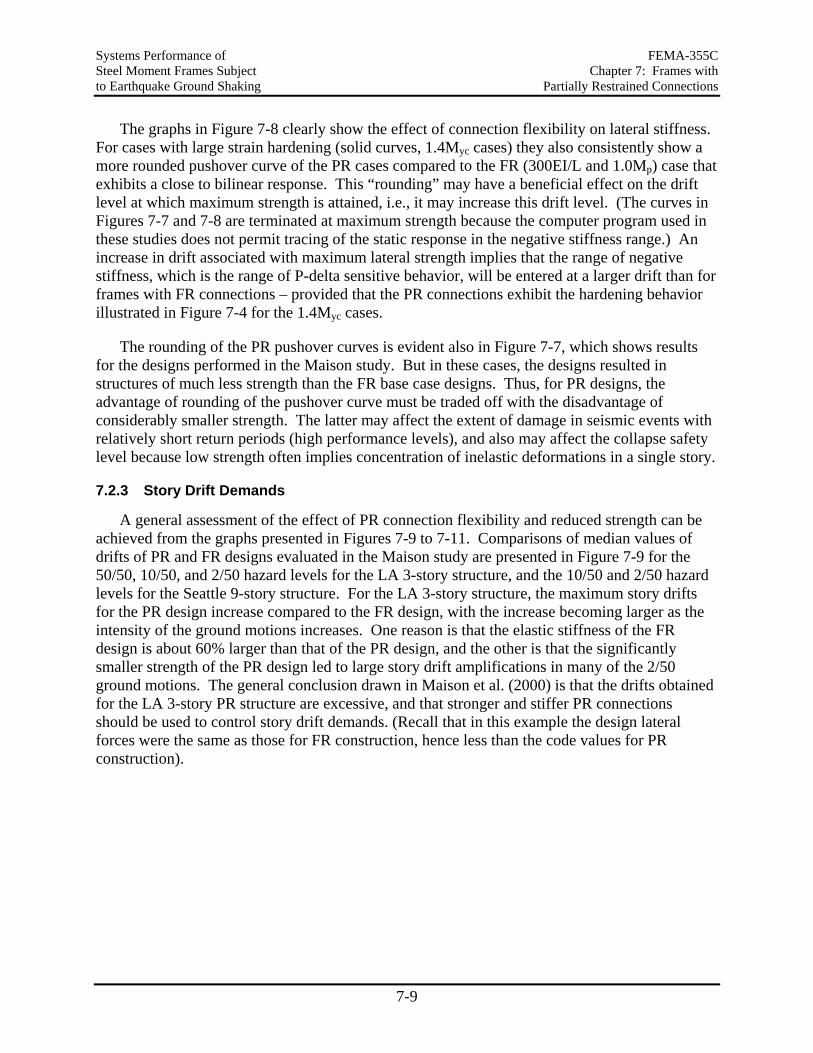
Systems Performance of FEMA-355C Steel Moment Frames Subject Chapter 7: Frames with to Earthquake Ground Shaking Partially Restrained Connections
7-9
The graphs in Figure 7-8 clearly show the effect of connection flexibility on lateral stiffness. For cases with large strain hardening (solid curves, 1.4Myc cases) they also consistently show a more rounded pushover curve of the PR cases compared to the FR (300EI/L and 1.0Mp) case that exhibits a close to bilinear response. This “rounding” may have a beneficial effect on the drift level at which maximum strength is attained, i.e., it may increase this drift level. (The curves in Figures 7-7 and 7-8 are terminated at maximum strength because the computer program used in these studies does not permit tracing of the static response in the negative stiffness range.) An increase in drift associated with maximum lateral strength implies that the range of negative stiffness, which is the range of P-delta sensitive behavior, will be entered at a larger drift than for frames with FR connections – provided that the PR connections exhibit the hardening behavior illustrated in Figure 7-4 for the 1.4Myc cases.
The rounding of the PR pushover curves is evident also in Figure 7-7, which shows results for the designs performed in the Maison study. But in these cases, the designs resulted in structures of much less strength than the FR base case designs. Thus, for PR designs, the advantage of rounding of the pushover curve must be traded off with the disadvantage of considerably smaller strength. The latter may affect the extent of damage in seismic events with relatively short return periods (high performance levels), and also may affect the collapse safety level because low strength often implies concentration of inelastic deformations in a single story.
7.2.3 Story Drift Demands
A general assessment of the effect of PR connection flexibility and reduced strength can be achieved from the graphs presented in Figures 7-9 to 7-11. Comparisons of median values of drifts of PR and FR designs evaluated in the Maison study are presented in Figure 7-9 for the 50/50, 10/50, and 2/50 hazard levels for the LA 3-story structure, and the 10/50 and 2/50 hazard levels for the Seattle 9-story structure. For the LA 3-story structure, the maximum story drifts for the PR design increase compared to the FR design, with the increase becoming larger as the intensity of the ground motions increases. One reason is that the elastic stiffness of the FR design is about 60% larger than that of the PR design, and the other is that the significantly smaller strength of the PR design led to large story drift amplifications in many of the 2/50 ground motions. The general conclusion drawn in Maison et al. (2000) is that the drifts obtained for the LA 3-story PR structure are excessive, and that stronger and stiffer PR connections should be used to control story drift demands. (Recall that in this example the design lateral forces were the same as those for FR construction, hence less than the code values for PR construction).
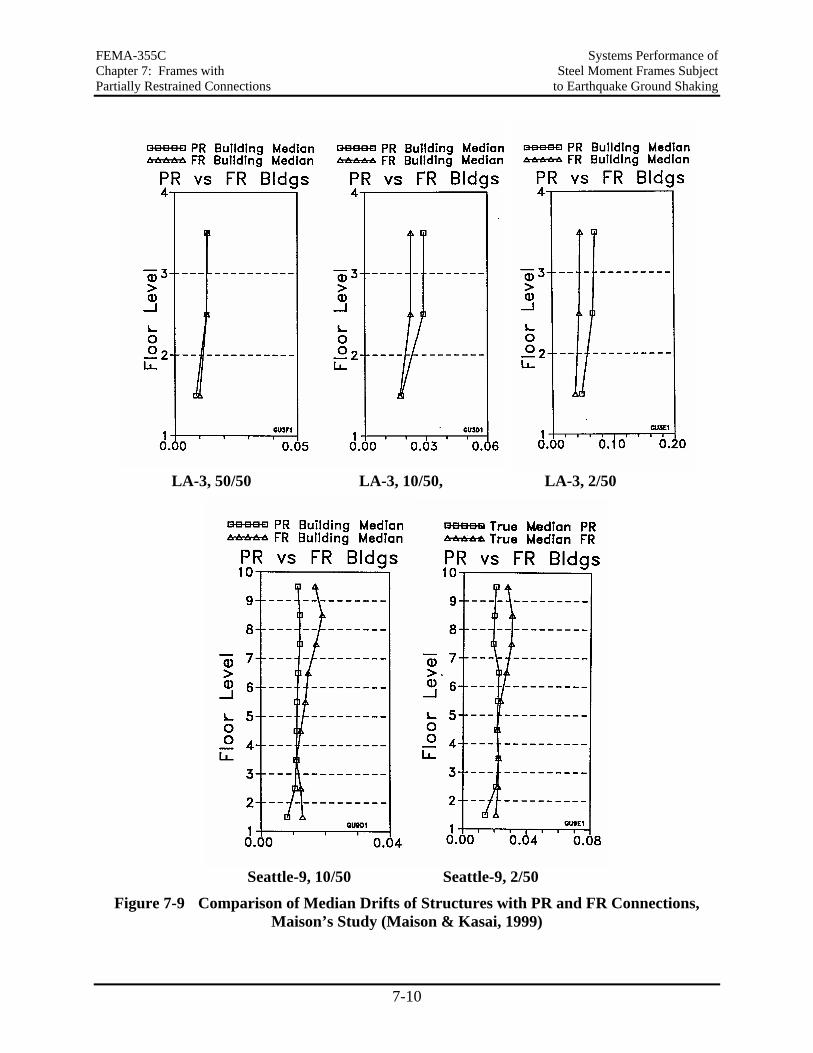
FEMA-355C Systems Performance of Chapter 7: Frames with Steel Moment Frames Subject Partially Restrained Connections to Earthquake Ground Shaking
7-10
LA-3, 50/50 LA-3, 10/50, LA-3, 2/50
Seattle-9, 10/50 Seattle-9, 2/50
Figure 7-9 Comparison of Median Drifts of Structures with PR and FR Connections, Maison’s Study (Maison & Kasai, 1999)
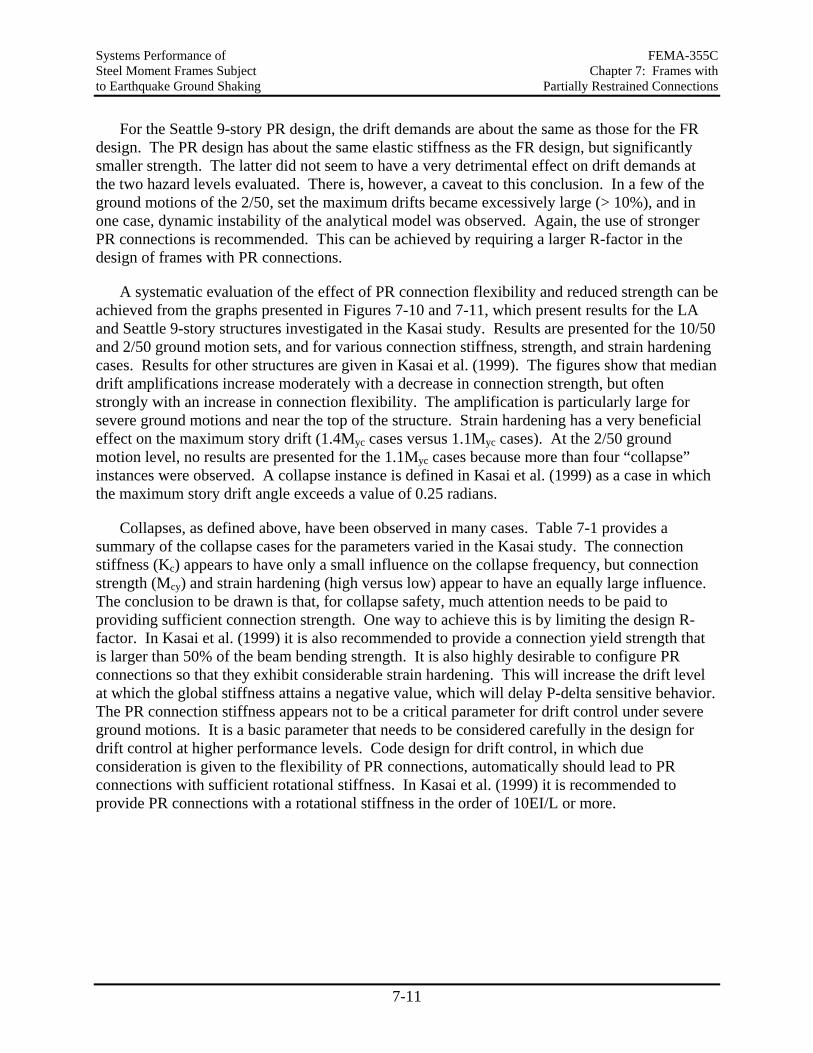
Systems Performance of FEMA-355C Steel Moment Frames Subject Chapter 7: Frames with to Earthquake Ground Shaking Partially Restrained Connections
7-11
For the Seattle 9-story PR design, the drift demands are about the same as those for the FR design. The PR design has about the same elastic stiffness as the FR design, but significantly smaller strength. The latter did not seem to have a very detrimental effect on drift demands at the two hazard levels evaluated. There is, however, a caveat to this conclusion. In a few of the ground motions of the 2/50, set the maximum drifts became excessively large (> 10%), and in one case, dynamic instability of the analytical model was observed. Again, the use of stronger PR connections is recommended. This can be achieved by requiring a larger R-factor in the design of frames with PR connections.
A systematic evaluation of the effect of PR connection flexibility and reduced strength can be achieved from the graphs presented in Figures 7-10 and 7-11, which present results for the LA and Seattle 9-story structures investigated in the Kasai study. Results are presented for the 10/50 and 2/50 ground motion sets, and for various connection stiffness, strength, and strain hardening cases. Results for other structures are given in Kasai et al. (1999). The figures show that median drift amplifications increase moderately with a decrease in connection strength, but often strongly with an increase in connection flexibility. The amplification is particularly large for severe ground motions and near the top of the structure. Strain hardening has a very beneficial effect on the maximum story drift (1.4Myc cases versus 1.1Myc cases). At the 2/50 ground motion level, no results are presented for the 1.1Myc cases because more than four “collapse” instances were observed. A collapse instance is defined in Kasai et al. (1999) as a case in which the maximum story drift angle exceeds a value of 0.25 radians.
Collapses, as defined above, have been observed in many cases. Table 7-1 provides a summary of the collapse cases for the parameters varied in the Kasai study. The connection stiffness (Kc) appears to have only a small influence on the collapse frequency, but connection strength (Mcy) and strain hardening (high versus low) appear to have an equally large influence. The conclusion to be drawn is that, for collapse safety, much attention needs to be paid to providing sufficient connection strength. One way to achieve this is by limiting the design R-factor. In Kasai et al. (1999) it is also recommended to provide a connection yield strength that is larger than 50% of the beam bending strength. It is also highly desirable to configure PR connections so that they exhibit considerable strain hardening. This will increase the drift level at which the global stiffness attains a negative value, which will delay P-delta sensitive behavior. The PR connection stiffness appears not to be a critical parameter for drift control under severe ground motions. It is a basic parameter that needs to be considered carefully in the design for drift control at higher performance levels. Code design for drift control, in which due consideration is given to the flexibility of PR connections, automatically should lead to PR connections with sufficient rotational stiffness. In Kasai et al. (1999) it is recommended to provide PR connections with a rotational stiffness in the order of 10EI/L or more.
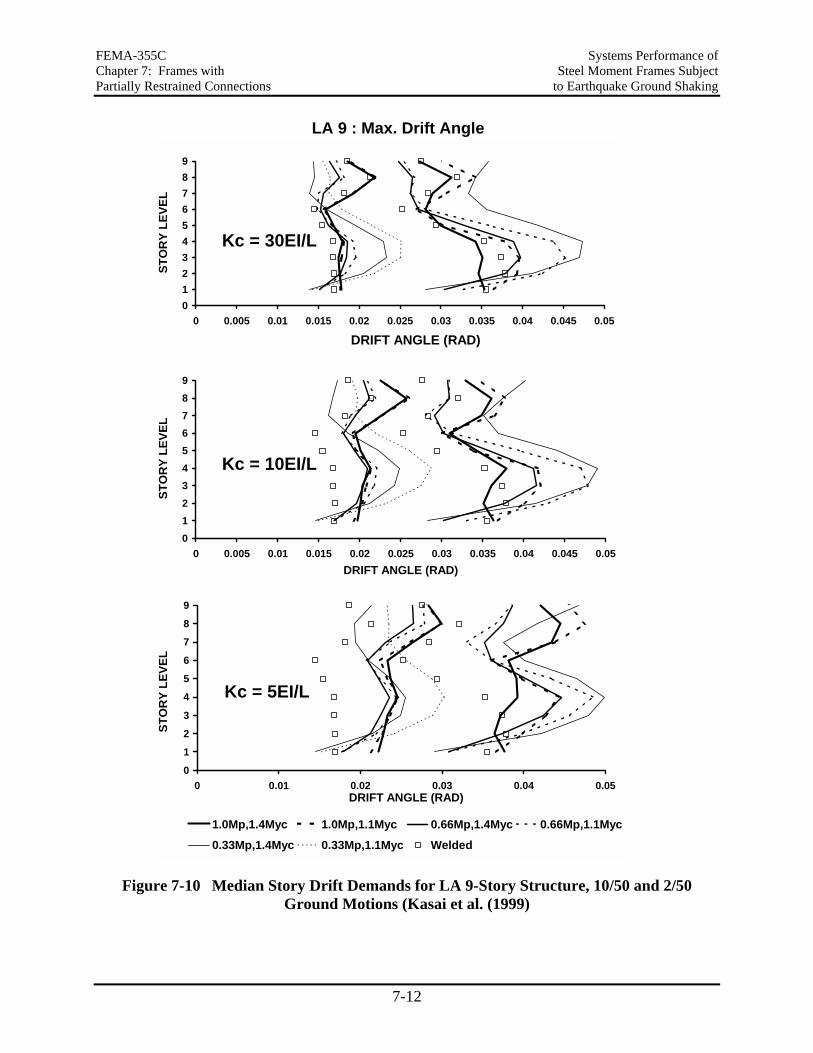
FEMA-355C Systems Performance of Chapter 7: Frames with Steel Moment Frames Subject Partially Restrained Connections to Earthquake Ground Shaking
7-12
LA 9 : Max. Drift Angle
Kc = 30EI/L
0123456789
0 0.005 0.01 0.015 0.02 0.025 0.03 0.035 0.04 0.045 0.05
DRIFT ANGLE (RAD)
STO
RY
LEVE
L
Kc = 10EI/L
0123456789
0 0.005 0.01 0.015 0.02 0.025 0.03 0.035 0.04 0.045 0.05DRIFT ANGLE (RAD)
STO
RY
LEVE
L
Kc = 5EI/L
0123
456789
0 0.01 0.02 0.03 0.04 0.05DRIFT ANGLE (RAD)
STO
RY
LEVE
L
1 0Mp 1 4Mcy01231.0Mp,1.4Myc 1.0Mp,1.1Myc 0.66Mp,1.4Myc 0.66Mp,1.1Myc
0.33Mp,1.4Myc 0.33Mp,1.1Myc Welded
Figure 7-10 Median Story Drift Demands for LA 9-Story Structure, 10/50 and 2/50 Ground Motions (Kasai et al. (1999)
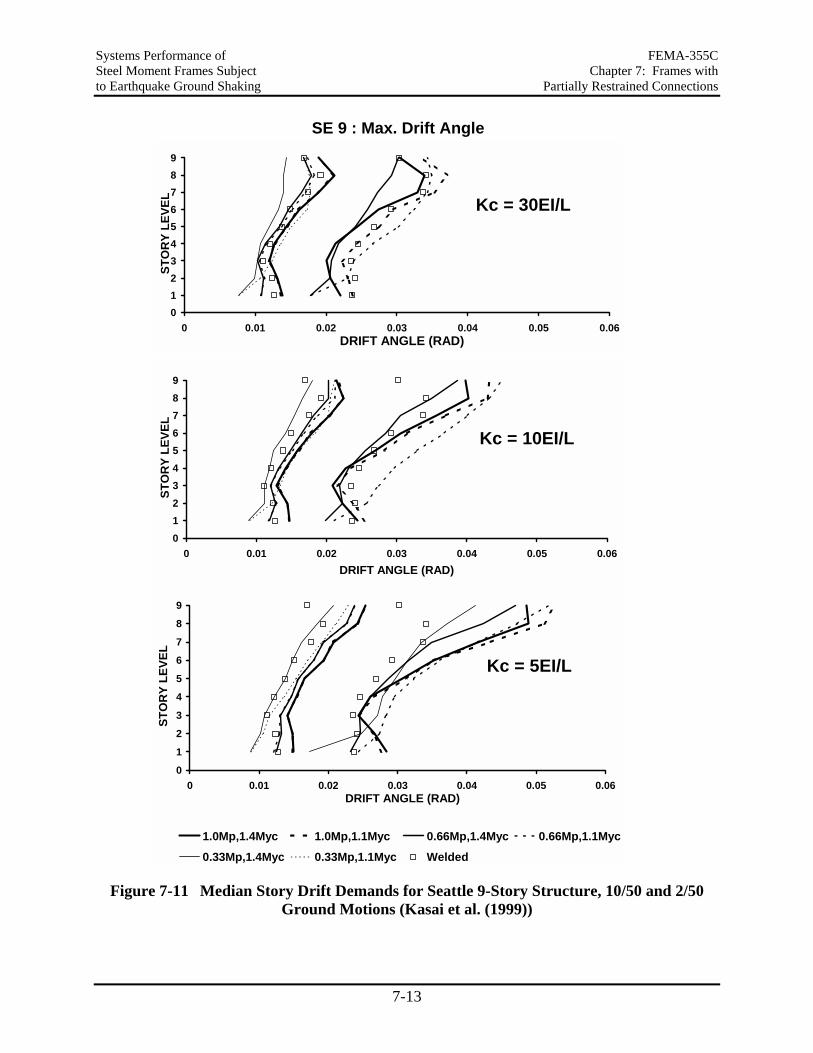
Systems Performance of FEMA-355C Steel Moment Frames Subject Chapter 7: Frames with to Earthquake Ground Shaking Partially Restrained Connections
7-13
SE 9 : Max. Drift Angle
Kc = 30EI/L
0123456789
0 0.01 0.02 0.03 0.04 0.05 0.06DRIFT ANGLE (RAD)
STO
RY
LEVE
L
Kc = 10EI/L
0123456789
0 0.01 0.02 0.03 0.04 0.05 0.06DRIFT ANGLE (RAD)
STO
RY
LEVE
L
Kc = 5EI/L
0123
456789
0 0.01 0.02 0.03 0.04 0.05 0.06DRIFT ANGLE (RAD)
STO
RY
LEVE
L
1.0Mp,1.0
1
2
31.0Mp,1.4Myc 1.0Mp,1.1Myc 0.66Mp,1.4Myc 0.66Mp,1.1Myc0.33Mp,1.4Myc 0.33Mp,1.1Myc Welded
Figure 7-11 Median Story Drift Demands for Seattle 9-Story Structure, 10/50 and 2/50 Ground Motions (Kasai et al. (1999))
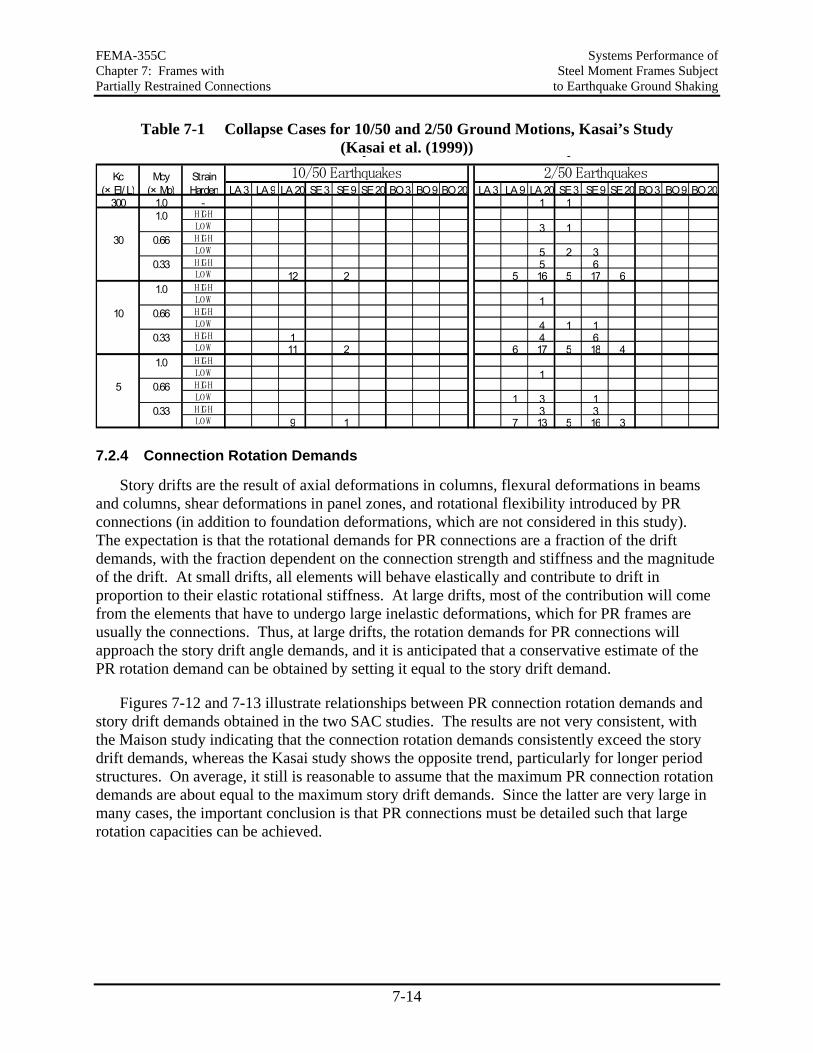
FEMA-355C Systems Performance of Chapter 7: Frames with Steel Moment Frames Subject Partially Restrained Connections to Earthquake Ground Shaking
7-14
Table 7-1 Collapse Cases for 10/50 and 2/50 Ground Motions, Kasai’s Study (Kasai et al. (1999))
Kc Mcy Strain 10/50 Earthquakes 2/50 Earthquakes(× EI/ L) (× Mp) Harden LA 3 LA 9 LA 20 SE 3 SE 9 SE 20 BO 3 BO 9 BO 20 LA 3 LA 9 LA 20 SE 3 SE 9 SE 20 BO 3 BO 9 BO 20
300 1.0 - 1 11.0 HIGH
LOW 3 130 0.66 HIGH
LOW 5 2 30.33 HIGH 5 6
LOW 12 2 5 16 5 17 61.0 HIGH
LOW 110 0.66 HIGH
LOW 4 1 10.33 HIGH 1 4 6
LOW 11 2 6 17 5 18 41.0 HIGH
LOW 15 0.66 HIGH
LOW 1 3 10.33 HIGH 3 3
LOW 9 1 7 13 5 16 3
p q
7.2.4 Connection Rotation Demands
Story drifts are the result of axial deformations in columns, flexural deformations in beams and columns, shear deformations in panel zones, and rotational flexibility introduced by PR connections (in addition to foundation deformations, which are not considered in this study). The expectation is that the rotational demands for PR connections are a fraction of the drift demands, with the fraction dependent on the connection strength and stiffness and the magnitude of the drift. At small drifts, all elements will behave elastically and contribute to drift in proportion to their elastic rotational stiffness. At large drifts, most of the contribution will come from the elements that have to undergo large inelastic deformations, which for PR frames are usually the connections. Thus, at large drifts, the rotation demands for PR connections will approach the story drift angle demands, and it is anticipated that a conservative estimate of the PR rotation demand can be obtained by setting it equal to the story drift demand.
Figures 7-12 and 7-13 illustrate relationships between PR connection rotation demands and story drift demands obtained in the two SAC studies. The results are not very consistent, with the Maison study indicating that the connection rotation demands consistently exceed the story drift demands, whereas the Kasai study shows the opposite trend, particularly for longer period structures. On average, it still is reasonable to assume that the maximum PR connection rotation demands are about equal to the maximum story drift demands. Since the latter are very large in many cases, the important conclusion is that PR connections must be detailed such that large rotation capacities can be achieved.
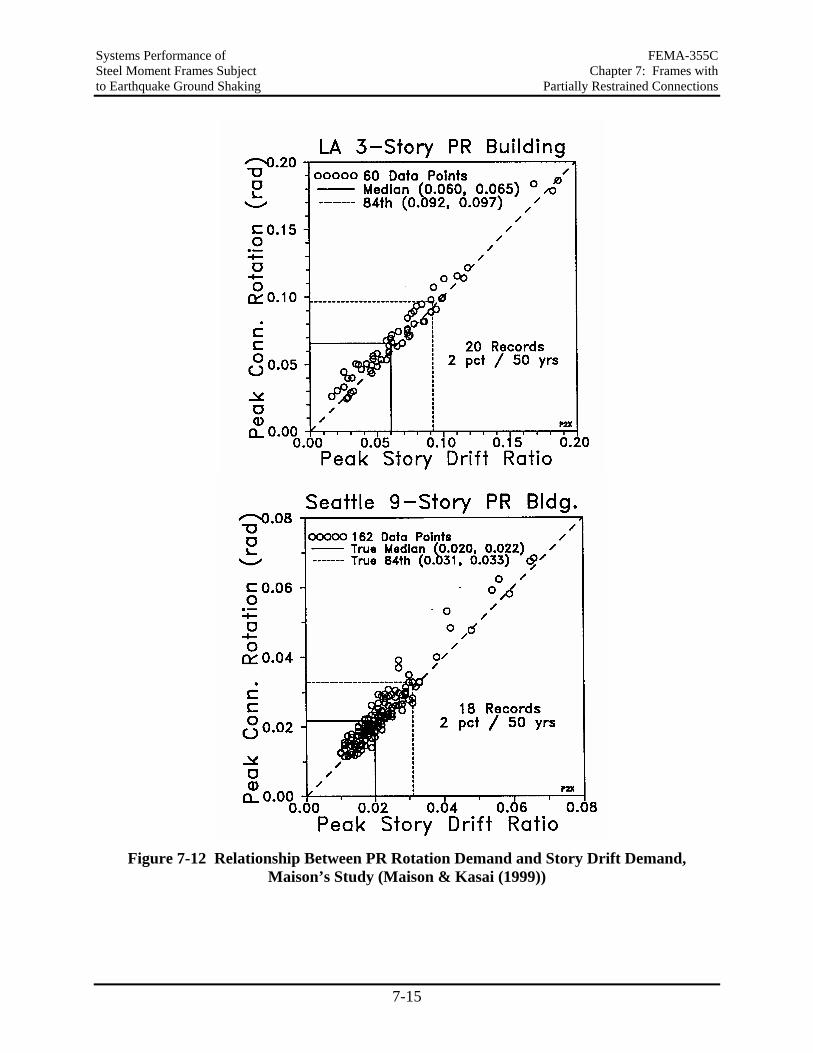
Systems Performance of FEMA-355C Steel Moment Frames Subject Chapter 7: Frames with to Earthquake Ground Shaking Partially Restrained Connections
7-15
Figure 7-12 Relationship Between PR Rotation Demand and Story Drift Demand, Maison’s Study (Maison & Kasai (1999))
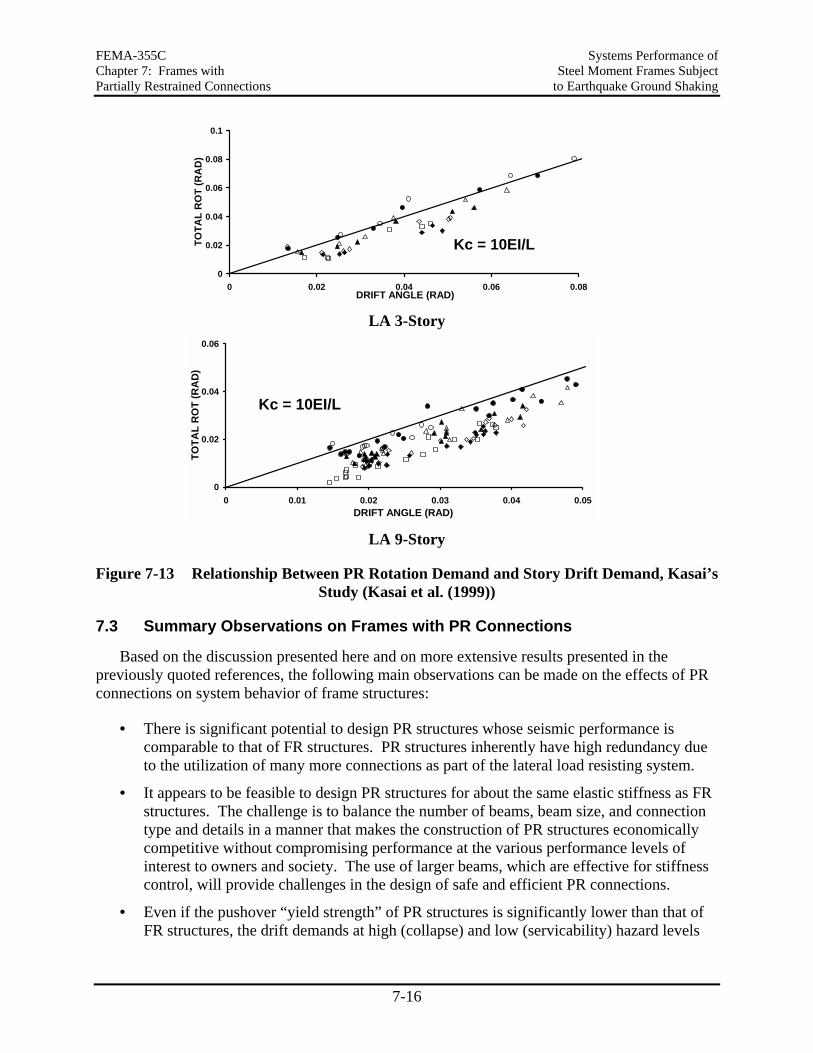
FEMA-355C Systems Performance of Chapter 7: Frames with Steel Moment Frames Subject Partially Restrained Connections to Earthquake Ground Shaking
7-16
Kc = 10EI/L
0
0.02
0.04
0.06
0.08
0.1
0 0.02 0.04 0.06 0.08DRIFT ANGLE (RAD)
TOTA
L R
OT
(RA
D)
LA 3-Story
Kc = 10EI/L
0
0.02
0.04
0.06
0 0.01 0.02 0.03 0.04 0.05DRIFT ANGLE (RAD)
TOTA
L R
OT
(RA
D)
LA 9-Story
Figure 7-13 Relationship Between PR Rotation Demand and Story Drift Demand, Kasai’s Study (Kasai et al. (1999))
7.3 Summary Observations on Frames with PR Connections
Based on the discussion presented here and on more extensive results presented in the previously quoted references, the following main observations can be made on the effects of PR connections on system behavior of frame structures:
• There is significant potential to design PR structures whose seismic performance is comparable to that of FR structures. PR structures inherently have high redundancy due to the utilization of many more connections as part of the lateral load resisting system.
• It appears to be feasible to design PR structures for about the same elastic stiffness as FR structures. The challenge is to balance the number of beams, beam size, and connection type and details in a manner that makes the construction of PR structures economically competitive without compromising performance at the various performance levels of interest to owners and society. The use of larger beams, which are effective for stiffness control, will provide challenges in the design of safe and efficient PR connections.
• Even if the pushover “yield strength” of PR structures is significantly lower than that of FR structures, the drift demands at high (collapse) and low (servicability) hazard levels
Systems Performance of FEMA-355C Steel Moment Frames Subject Chapter 7: Frames with to Earthquake Ground Shaking Partially Restrained Connections
7-17
mostly are comparable to those of FR structures. However, low strength structures subjected to extreme ground motions may experience concentrations of drift demands in one or more stories, which in turn may lead to P-delta sensitive behavior.
• At a low hazard level (50/50 in LA), the low strength of PR structures may lead to notable plastic rotation demands. However, these demands are concentrated in the PR connections, which should be able to tolerate limited plastic demands without the need for repair.
• The plastic rotation demands for PR connections are usually larger than those for FR connections (even if the drift demands are the same), and may be very large during very severe events. This calls for careful deformation-based design of PR connections and for extensive testing of such connections (particularly for deep beams).
• The design of PR structures requires much attention to issues that are of less concern in FR structures. The plastic rotation capacity of PR connections is very sensitive to design detailing. The rotation demands will depend on the connection strength, whose relationship to the beam bending strength is one of the basic variables in PR design.
• In many aspects, PR structures behave differently than FR structures, and their seismic response depends on many more parameters. Selected issues that deserve special consideration are the following:
− Column restraint depends on connection stiffness, which in turn affects stability considerations and requires special attention in the design process (Maison et al. (2000)).
− Because of higher mode effects and dynamic redistribution, story shears obtained in a time history analysis may be a multiple of the story shear “capacities” obtained from the static pushover analysis. This is illustrated in Figure 7-14, which shows pushover and time history values of story shears for the Seattle 9-story structure studied by Maison. Consequently, the column moments can also be quite different from those assumed in the design process. This affects the design of columns and column splices.
− It was also found that, in a few cases, the story drifts of PR structures become much larger than those of FR structures, and that dynamic instability was approached in a case in which the FR structure exhibited stable behavior. This observation serves as a reminder that every structure is a special case, and that all generalizations have to be put into the context within which they are made.
In conclusion, PR structures show much promise as feasible systems in regions of high seismicity, but there are many issues that need to be better understood to provide confidence in their design that is comparable to that for FR designs (provided that connection fractures are prevented in the latter).
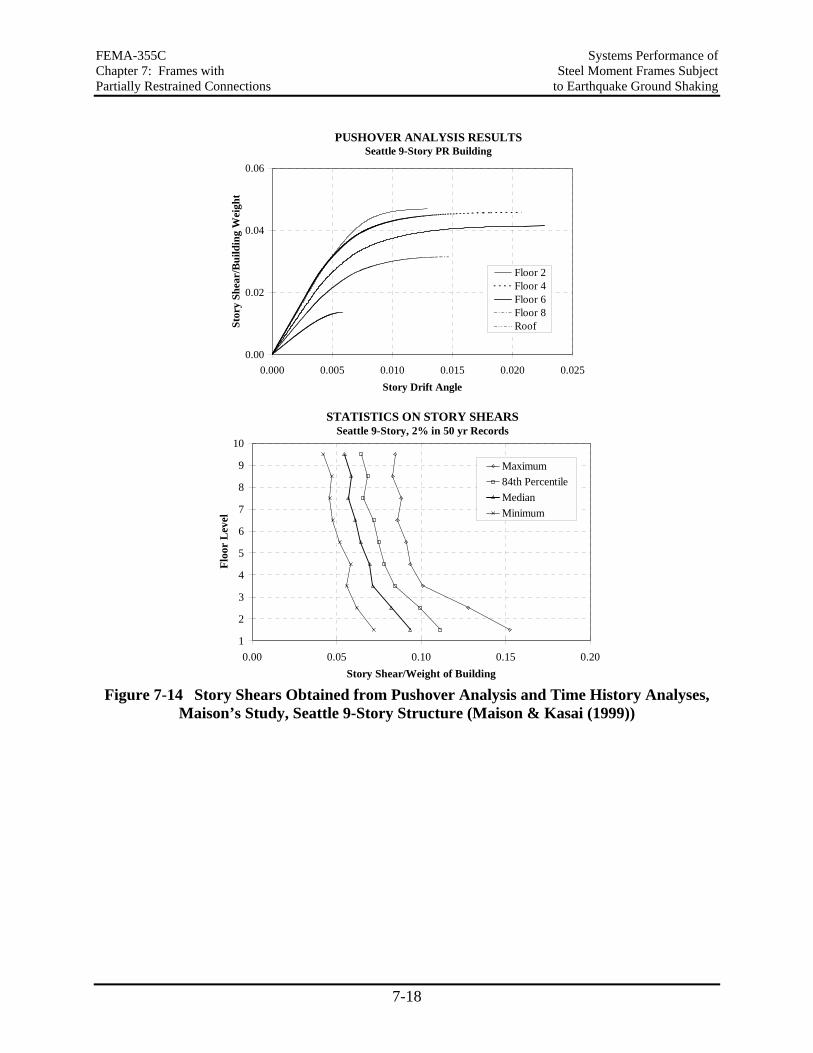
FEMA-355C Systems Performance of Chapter 7: Frames with Steel Moment Frames Subject Partially Restrained Connections to Earthquake Ground Shaking
7-18
PUSHOVER ANALYSIS RESULTSSeattle 9-Story PR Building
0.00
0.02
0.04
0.06
0.000 0.005 0.010 0.015 0.020 0.025Story Drift Angle
Stor
y Sh
ear/
Bui
ldin
g W
eigh
t
Floor 2Floor 4Floor 6Floor 8Roof
STATISTICS ON STORY SHEARSSeattle 9-Story, 2% in 50 yr Records
1
2
3
4
5
6
7
8
9
10
0.00 0.05 0.10 0.15 0.20Story Shear/Weight of Building
Floo
r L
evel
Maximum84th PercentileMedianMinimum
Figure 7-14 Story Shears Obtained from Pushover Analysis and Time History Analyses,
Maison’s Study, Seattle 9-Story Structure (Maison & Kasai (1999))
Systems Performance of FEMA-355C Steel Moment Frames Subject Chapter 8 to Earthquake Ground Shaking Summary and Conclusions
8-1
8. SUMMARY AND CONCLUSIONS
The primary objective of this report is to communicate an understanding of the critical issues controlling the performance of steel moment-resisting frame structures at different levels of seismic hazard. Behavior characteristics at the element level are utilized to study system behavior and response through a detailed seismic demand evaluation for a multitude of steel moment-resisting frame structures, which are representative of typical buildings and design practices in the U.S. Suites of ground motions representative of the seismicity of different geographic locations are used for demand and performance evaluation of the WSMF structures. This evaluation provides information on the expected demands for existing typical structures as well as for structures being designed using new connection types that will reduce the likelihood of weld fractures. A chapter is devoted to the performance prediction of structures whose connections have the potential to fracture under various scenarios. A methodology for collapse safety evaluation, which can be applied to structures with or without fracturing connections, is discussed.
Conclusions have been presented throughout this report, and only a few of them are summarized next.
8.1 Analytical Modeling
The global response can be significantly affected by modeling assumptions at the structure level (e.g., inclusion of gravity columns, floor slab effects, shear connections, etc.). This holds true especially for cases in which a change in basic mechanism occurs (e.g., development of a weak story) due to a change in structure modeling, or if the structure is driven into the range of negative post-yield stiffness. For specific cases, the computed response may vary from predicted “collapse” to a response well within “acceptable” limits, depending on the assumptions made in the analytical model.
Approximations in analytical modeling, such as in the centerline model M1, may result in a erroneous evaluation of the seismic demands at the element level, and in some cases at the system level. In most - but not all – cases, the use of the centerline model overestimates global (roof and story) drift demands. If weak panel zones exist, the global lateral strength of the structure may be significantly reduced, and the basic mechanism may change. In such cases, it is not unlikely that the centerline model will significantly underestimate drifts compared to a model that considers panel zone strength and stiffness.
The element deformation demands may by greatly affected by the choice of the analytical model. A model that ignores panel zone deformations will concentrate all deformation demands in the beams or the column. The use of cover-plated beam flanges, which move the plastic hinge away from the face of the column, induces additional forces on the panel zone due to the shear at the plastic hinge location working on the distance between the plastic hinge and the face of the column. This reinforces the need for an analytical model that includes panel zones (unless panel zones are designed as “strong” elements).
FEMA-355C Systems Performance of Chapter 8 Steel Moment Frames Subject Summary and Conclusions to Earthquake Ground Shaking
8-2
Analytical models for the panel zone can be developed from standard rotational spring elements, which are available in most nonlinear analysis programs.
8.2 Element Behavior Issues
The distribution of deformation demands between the elements at a typical connection is sensitive to a host of factors, including subjective design decisions (choice of member sections, choice of weak element at connection), material strength, and choice of basic connection types (standard pre-Northridge connection, cover-plated beam flange connection, or reduced beam section). Depending on these factors, the plastic deformation demands at a connection may be concentrated entirely in the beams or panel zones, or may be distributed amongst the elements at the connection, including the column. The expectation that beams attract most of the plastic deformation demands does not hold true in many cases, even at the exterior column line of the structure.
Distribution of demands between elements at a connection may vary not only between different designs, but also within the same design. The influence of the distribution of element deformation demands at the connection level on the system response is, however, not very significant in most cases. The exceptions are cases in which a change in choice of connection properties results in a significant change in global structural properties. For example, the reduced beam section design has a significantly lower strength and is driven to very large drift demands under two ground motions of the 2/50 set of records.
The level of plastic rotation in the beams, for cases in which the beams are the weak elements at the connection, is approximately equal to the story plastic drift angle demand. However, this holds true only if the initial gravity moments in the WSMF beams are small. For cases in which the panel zones are the weak elements, the plastic shear distortion angle in the panel zone is approximately 20-30% higher than the story plastic drift angle demand.
The presently employed “strong-column” concept may not prevent the development of plastic hinges in the columns, even when the strength of the column is significantly higher than the strength of the weak element at the connection. The bending moment diagram for the column may change significantly after yielding of beams at a connection. This is due to the additional demands imposed on the column on account of global bending of the column in the deformed shape of the structure. The formation of plastic hinges in the columns was observed for many ground motions for the LA and Seattle 9- and 20-story structures. The change in moment distribution over the height of the column is amplified when severe discontinuities exist between the story drift demands in adjacent stories.
Significant plastic deformation demands have to be expected at the base of the columns at the ground floor level. This holds true for columns that are fixed at the ground floor level, and also for columns that continue into a basement.
Significant axial force demands (compressive and tensile) have to be expected in the exterior columns of tall structures due to large overturning moments for the structure. These high axial forces need to be considered in the design against column buckling. They also may significantly
Systems Performance of FEMA-355C Steel Moment Frames Subject Chapter 8 to Earthquake Ground Shaking Summary and Conclusions
8-3
reduce the bending moment capacity of the columns, increasing the potential for plastic hinge development.
Column splices may be subjected to axial tensile force and large bending moment demands. Partial penetration welds, which can be a source of brittle failure, should be avoided.
8.3 System Behavior Issues
The bare steel moment-resisting frames for WSMF structures designed in accordance with 1994 codes are very flexible, with first mode periods of 1.0 to 1.9 seconds for the 3-story structures, 2.2 to 3.3 seconds for the 9-story structures, and 3.0 to 4.0 seconds for the 20-story structures. These periods are significantly higher than those estimated using code equations.
Wind design may control strength and stiffness of tall structures. For instance, the strength of the Boston 20-story structure is more than 50% higher than that of the LA structure. All structures show significant overstrength with respect to the allowable stress (or LRFD) design level.
Structure P-delta effects may greatly influence the response due to the development of a negative post-yield stiffness in specific stories of the structure. P-delta stability is a serious concern if flexible structures are subjected to very severe ground motions, such as near-fault or strong long-duration ground motions. The response of a structure, if sensitive to P-delta effects, is strongly influenced by modeling assumptions, especially those assumptions that result in a delay or acceleration of the development of a negative post-yield story stiffness. A potential solution to the P-delta problem exists in the form of a flexible secondary system (such as gravity columns with sufficient strength and stiffness) that add to the stiffness of the structure after the primary system has yielded, thereby widening the stable strength plateau region of the pushover curve.
Elastic analysis is found to be unreliable in identifying P-delta sensitive situations. The stories in which a negative post-yield stiffness may develop, and the associated drift limits, cannot be captured by an elastic analysis.
The use of the widely used stability coefficient is inadequate to safeguard against the formation of a negative post-yield stiffness in the structures. P-delta effects have to be assessed based on an inelastic representation for the structure. The value of the stability coefficient coupled with the appropriate strain-hardening value for the elements, however, provides a preliminary indication of the importance of the P-delta effect.
Configuration (changing bay width and/or beam size) and redundancy (changing the number of moment-resisting connections) by themselves have a benign effect on the response of structures without fractured connections, other than effects attributed to basic design differences (strength, stiffness). Since elements at a floor level experience similar levels of plastic deformation demands (provided that gravity moments are small), the effect of redundancy or change in beam depths will not be significant, unless the strength or deformation capacity of elements or connections changes.
FEMA-355C Systems Performance of Chapter 8 Steel Moment Frames Subject Summary and Conclusions to Earthquake Ground Shaking
8-4
Three-dimensional effects have not been found to be very strong for the essentially symmetric structures investigated in the SAC studies. Concerns are the biaxial bending effect in columns (due to 2-directional horizontal excitations) and the increased axial column loads due to vertical shaking. The latter can be evaluated rather accurately.
Deterioration in strength (and stiffness) of the portions of the structure that will undergo significant cyclic inelastic deformations (mostly the plastic hinge regions) may have a significant effect on the collapse potential of WSMF structures. This issue needs to be studied in more detail, particularly in view of the emerging approach to evaluate collapse safety by means of an Incremental Dynamic Analysis (IDA).
The statistical values of global and story drift angle demands for the post-Northridge structures with cover-plated connections are similar to the demands for the pre-Northridge structures. Some differences under particular records are observed due to differences in design details, with the demands being somewhat lower for the post-Northridge structures.
The designs using reduced beam sections (RBS) have lower strength than comparable pre-Northridge designs. The pre-Northridge designs often can be modified to an RBS design without changing member sections, as the designs are stiffness controlled and have significant overstrength. The element deformation demands are primarily concentrated in the beam plastic hinge locations, since the demands on the panel zones become smaller. For most records, the global and story drift demands are somewhat larger than those for pre-Northridge designs.
8.4 Global Strength Issues
The nonlinear static (pushover) analysis provides low estimates of the base and story shear strengths compared to values recorded in nonlinear dynamic analyses. This is on account of the pushover analysis being tagged to a fixed load pattern that does not consider higher mode effects.
Maximum overturning moments vary widely dependent on structural properties (not just the height) and ground motion frequency characteristics. A reasonable, and in most cases conservative, estimate of the maximum overturning moment can be achieved from integrating the mechanism shear strength diagram over the height of the structure. Equation 5.3 provides a means to compute these story shear strength values. The use of overturning moment reduction factors is discouraged.
In an estimation of maximum overturning moments from the pushover analysis, two compensating errors occur. The story shears are underestimated, but the lever arm of the lateral loads usually is overestimated. For the structures studied, this compensation has resulted in reasonable estimates of the overturning moments close to the bottom of the structures, when the maximum moments from the pushover analysis are compared to the maximum moments from the time history analyses. This observation cannot be generalized, and the pushover overturning moment should not be used to estimate maximum dynamic OTMs if the pushover results in mechanisms that involve only one or few stories.
Systems Performance of FEMA-355C Steel Moment Frames Subject Chapter 8 to Earthquake Ground Shaking Summary and Conclusions
8-5
8.5 Effects of Ground Motion Characteristics
Near-fault ground motions (at a site whose closest distance to the fault plane is less than about 10 to 15 km) have pulse-like characteristics. For this reason, their effect on structural response depends strongly on the relative value of structure period to pulse period. Standard analysis procedures based on uniform hazard spectra will miss critical aspects of the response to near-fault ground motions. From the perspective of collapse safety, a reliable evaluation of the structural performance to near-fault ground motions is critical because the hazard in many urban areas (e.g., Los Angeles Area and San Francisco Bay Area) is dominated by near-fault phenomena. More work needs to be done to solve the near-fault problem.
Soft soil ground motions are in concept not much different from near-fault ground motions, just that a single pulse is replaced by a harmonic motion. Thus, the cumulative damage potential is larger for soft soil motions. Since soft soils modify ground motions in a manner that leads to large amplification around the predominant soil period, their effect on structural response will again depend on the relative value of structure period to predominant soil period.
8.6 Effects of Connection Fractures on Response and Safety
By definition, a fractured connection constitutes damage. A fracture will always lead to a decrease in strength and stiffness of the structure. This does not mean that it always will bring the structure closer to collapse. A decrease in strength does not necessarily lead to an increase in story drift. Neither does a decrease in stiffness, although it is likely to do so because, at a lengthened period, the spectral displacement usually (but not always) increases. Thus, there is no single statement that can assess the consequences of connection fracturing on safety.
Chapter 6 provides insight into this complex problem, and proposes a methodology that can be used for a safety evaluation of structures. The methodology is believed to be rigorous, but its implementation depends on our ability to forecast critical ground motions and to model all structural characteristics that significantly affect the response at large inelastic deformations, in particular the moment or deformation level at which connections fracture and the deteriorating properties of components at fracturing connections, and of all components that have to undergo large plastic deformations.
8.7 Behavior of Frames with PR Connections
There is significant potential to design PR structures whose seismic performance is comparable to that of FR structures. It appears to be feasible to design PR structures for about the same elastic stiffness as FR structures. The challenge is to balance the number of beams, beam size, and connection type and details in a manner that makes the construction of PR structures economically competitive without compromising performance at the various performance levels of interest to owners and society. The use of larger beams, which are effective for stiffness control, will provide challenges in the design of safe and efficient PR connections.
The plastic rotation demands for PR connections are usually larger than those for FR connections (even if the drift demands are the same), and may be very large during very severe
FEMA-355C Systems Performance of Chapter 8 Steel Moment Frames Subject Summary and Conclusions to Earthquake Ground Shaking
8-6
events. This calls for careful deformation-based design of PR connections and for extensive testing of such connections (particularly for deep beams).
The design of PR structures requires much attention to issues that are of less concern in FR structures. Selected issues that deserve special consideration are the following:
• Column restraint depends on connection stiffness, which in turn affects stability considerations and requires special attention in the design process.
• Because of higher mode effects and dynamic redistribution, story shears obtained in a time history analysis may be a multiple of the story shear “capacities” obtained from the static pushover analysis. Consequently, the column moments can also be quite different from those assumed in the design process. This affects the design of columns and of column splices.
In selected cases, the story drifts of PR structures can become much larger than those of FR structures. This observation serves as a reminder that every structure is a special case and that all generalizations have to be put into the context within which they are made.
PR structures show much promise as feasible systems in regions of high seismicity, but there are many issues that need to be better understood to provide confidence in their design that is comparable to that for FR designs (provided that connection fractures are prevented in the latter).
Systems Performance of FEMA-355C Steel Moment Frames Subject Appendix A to Earthquake Ground Shaking SAC Ground Motions
A-1
Appendix A. SAC GROUND MOTIONS
A.1 Description of Sets of Ground Motions
Sets of ground motions representative of different hazard levels have been assembled for the three geographic locations (Los Angeles, Seattle, and Boston) as part of the SAC steel research project (Somerville et al. (1997)). The basic sets consist of recorded and simulated ground motions and represent return periods of 475 years (10% probability of being exceeded in 50 years; referred to as the 10/50 sets), and 2475 years (2% probability of being exceeded in 50 years; referred to as the 2/50 sets). In addition, the Los Angeles structures are also subjected to a set representative of a 72 year return period (50% probability of being exceeded in 50 years; referred to as the 50/50 set). Each set of ground motions consists of 20 time histories; 10 ground motions each with two orthogonal components. The individual components of all the records have been rotated to 45o degrees with respect to the fault in order to minimize directivity effects.
The ground motions are scaled (the same scaling factor is used for the two components of a ground motion) such that, on average, their spectral values match with a least square error fit to the United States Geological Survey’s (USGS) mapped values at 0.3, 1.0, and 2.0 seconds, and an additional predicted value at 4.0 seconds (Somerville et al. (1997)). The weights ascribed to the four period points are 0.1 at the 0.3 second period point and 0.3 for the other three period points. The target spectra provided by USGS are for the SB/SC soil type boundaries, which have been modified to be representative for soil type SD (stiff soil - measured shear wave velocity between 600 to 1200 ft/sec). Details concerning the modification factors used to transform the target response spectra to be representative of soil type SD, and the scaling factors used for the individual ground motions are given in Somerville et al. (1997). The target response spectra values for soil type SD are reproduced in Table A-1. Tables A-2 to A-4 provide basic information for the individual earthquake records constituting the different sets of ground motions for Los Angeles, Seattle, and Boston, respectively. The duration of the ground motion records, given in Tables A-2 to A-4, signifies the total length of the time history. The entire length of the time history is used for analysis, i.e., the time history is not curtailed to reflect only the strong motion duration of the record.
Additional sets of records were generated for near-fault and soft soil conditions. These sets are also described in Somerville et al. (1997). Table A-5 presents basic information on the near-fault records.
A.2 Spectral Characteristics of Ground Motions
Median acceleration and displacement spectra for the basic sets of ground motions are shown in Figures 5.17 and 5.18, respectively (for 2% damping). An idea of the relative seismic hazard in the different regions can be obtained from these figures.
The acceleration (elastic strength demand) and displacement spectra for the individual ground motions constituting the basic sets of ground motions are shown in Figures A-1 to A-6 for Los Angeles, Figures A-7 to A-10 for Seattle, and Figures A-11 to A-14 for Boston.
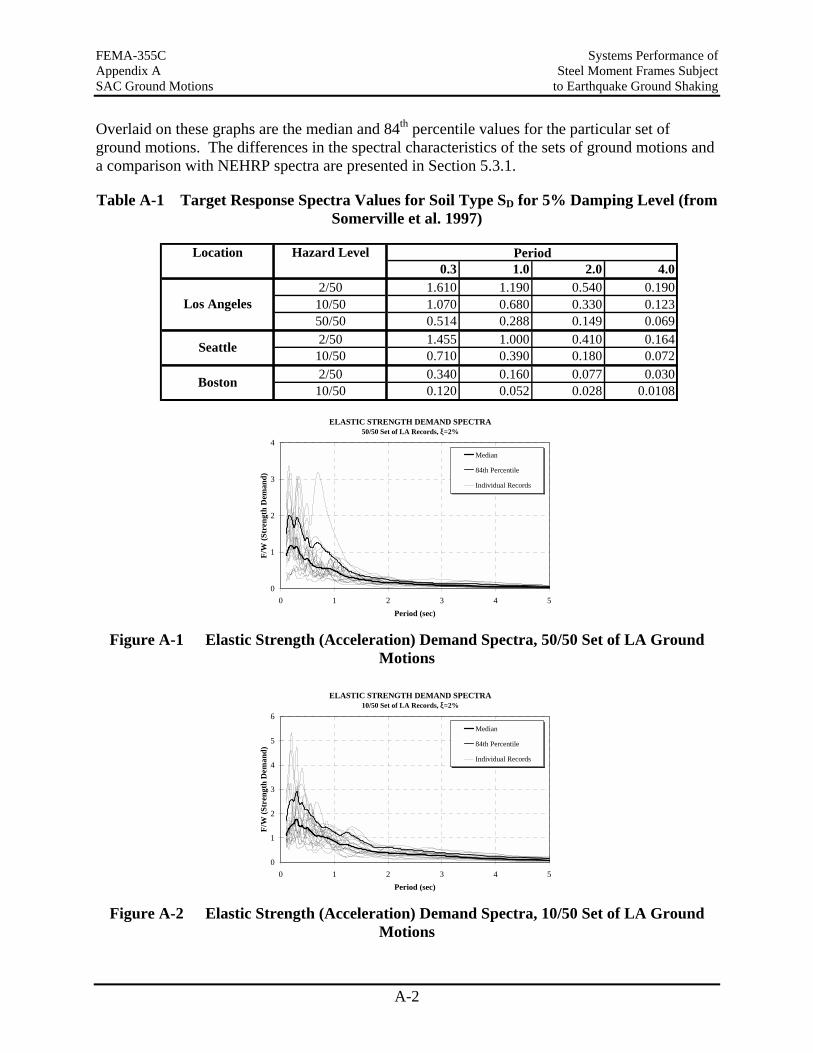
FEMA-355C Systems Performance of Appendix A Steel Moment Frames Subject SAC Ground Motions to Earthquake Ground Shaking
A-2
Overlaid on these graphs are the median and 84th percentile values for the particular set of ground motions. The differences in the spectral characteristics of the sets of ground motions and a comparison with NEHRP spectra are presented in Section 5.3.1.
Table A-1 Target Response Spectra Values for Soil Type SD for 5% Damping Level (from Somerville et al. 1997)
Location Hazard Level0.3 1.0 2.0 4.0
2/50 1.610 1.190 0.540 0.19010/50 1.070 0.680 0.330 0.12350/50 0.514 0.288 0.149 0.0692/50 1.455 1.000 0.410 0.164
10/50 0.710 0.390 0.180 0.0722/50 0.340 0.160 0.077 0.030
10/50 0.120 0.052 0.028 0.0108
Period
Los Angeles
Seattle
Boston
ELASTIC STRENGTH DEMAND SPECTRA50/50 Set of LA Records, ξ=2%
0
1
2
3
4
0 1 2 3 4 5Period (sec)
F/W
(Str
engt
h D
eman
d)
Median
84th Percentile
Individual Records
Figure A-1 Elastic Strength (Acceleration) Demand Spectra, 50/50 Set of LA Ground
Motions
ELASTIC STRENGTH DEMAND SPECTRA10/50 Set of LA Records, ξ=2%
0
1
2
3
4
5
6
0 1 2 3 4 5Period (sec)
F/W
(Str
engt
h D
eman
d)
Median
84th Percentile
Individual Records
Figure A-2 Elastic Strength (Acceleration) Demand Spectra, 10/50 Set of LA Ground
Motions
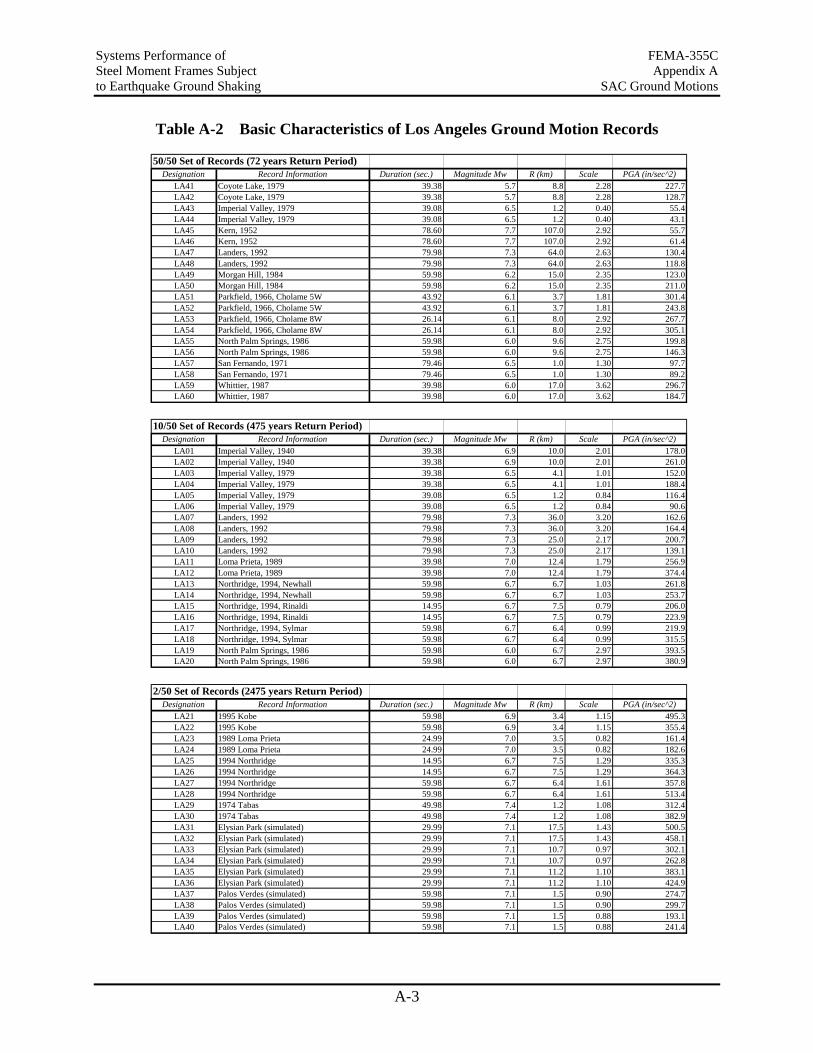
Systems Performance of FEMA-355C Steel Moment Frames Subject Appendix A to Earthquake Ground Shaking SAC Ground Motions
A-3
Table A-2 Basic Characteristics of Los Angeles Ground Motion Records
50/50 Set of Records (72 years Return Period)Designation Record Information Duration (sec.) Magnitude Mw R (km) Scale PGA (in/sec^2)
LA41 Coyote Lake, 1979 39.38 5.7 8.8 2.28 227.7LA42 Coyote Lake, 1979 39.38 5.7 8.8 2.28 128.7LA43 Imperial Valley, 1979 39.08 6.5 1.2 0.40 55.4LA44 Imperial Valley, 1979 39.08 6.5 1.2 0.40 43.1LA45 Kern, 1952 78.60 7.7 107.0 2.92 55.7LA46 Kern, 1952 78.60 7.7 107.0 2.92 61.4LA47 Landers, 1992 79.98 7.3 64.0 2.63 130.4LA48 Landers, 1992 79.98 7.3 64.0 2.63 118.8LA49 Morgan Hill, 1984 59.98 6.2 15.0 2.35 123.0LA50 Morgan Hill, 1984 59.98 6.2 15.0 2.35 211.0LA51 Parkfield, 1966, Cholame 5W 43.92 6.1 3.7 1.81 301.4LA52 Parkfield, 1966, Cholame 5W 43.92 6.1 3.7 1.81 243.8LA53 Parkfield, 1966, Cholame 8W 26.14 6.1 8.0 2.92 267.7LA54 Parkfield, 1966, Cholame 8W 26.14 6.1 8.0 2.92 305.1LA55 North Palm Springs, 1986 59.98 6.0 9.6 2.75 199.8LA56 North Palm Springs, 1986 59.98 6.0 9.6 2.75 146.3LA57 San Fernando, 1971 79.46 6.5 1.0 1.30 97.7LA58 San Fernando, 1971 79.46 6.5 1.0 1.30 89.2LA59 Whittier, 1987 39.98 6.0 17.0 3.62 296.7LA60 Whittier, 1987 39.98 6.0 17.0 3.62 184.7
10/50 Set of Records (475 years Return Period)Designation Record Information Duration (sec.) Magnitude Mw R (km) Scale PGA (in/sec^2)
LA01 Imperial Valley, 1940 39.38 6.9 10.0 2.01 178.0LA02 Imperial Valley, 1940 39.38 6.9 10.0 2.01 261.0LA03 Imperial Valley, 1979 39.38 6.5 4.1 1.01 152.0LA04 Imperial Valley, 1979 39.38 6.5 4.1 1.01 188.4LA05 Imperial Valley, 1979 39.08 6.5 1.2 0.84 116.4LA06 Imperial Valley, 1979 39.08 6.5 1.2 0.84 90.6LA07 Landers, 1992 79.98 7.3 36.0 3.20 162.6LA08 Landers, 1992 79.98 7.3 36.0 3.20 164.4LA09 Landers, 1992 79.98 7.3 25.0 2.17 200.7LA10 Landers, 1992 79.98 7.3 25.0 2.17 139.1LA11 Loma Prieta, 1989 39.98 7.0 12.4 1.79 256.9LA12 Loma Prieta, 1989 39.98 7.0 12.4 1.79 374.4LA13 Northridge, 1994, Newhall 59.98 6.7 6.7 1.03 261.8LA14 Northridge, 1994, Newhall 59.98 6.7 6.7 1.03 253.7LA15 Northridge, 1994, Rinaldi 14.95 6.7 7.5 0.79 206.0LA16 Northridge, 1994, Rinaldi 14.95 6.7 7.5 0.79 223.9LA17 Northridge, 1994, Sylmar 59.98 6.7 6.4 0.99 219.9LA18 Northridge, 1994, Sylmar 59.98 6.7 6.4 0.99 315.5LA19 North Palm Springs, 1986 59.98 6.0 6.7 2.97 393.5LA20 North Palm Springs, 1986 59.98 6.0 6.7 2.97 380.9
2/50 Set of Records (2475 years Return Period)Designation Record Information Duration (sec.) Magnitude Mw R (km) Scale PGA (in/sec^2)
LA21 1995 Kobe 59.98 6.9 3.4 1.15 495.3LA22 1995 Kobe 59.98 6.9 3.4 1.15 355.4LA23 1989 Loma Prieta 24.99 7.0 3.5 0.82 161.4LA24 1989 Loma Prieta 24.99 7.0 3.5 0.82 182.6LA25 1994 Northridge 14.95 6.7 7.5 1.29 335.3LA26 1994 Northridge 14.95 6.7 7.5 1.29 364.3LA27 1994 Northridge 59.98 6.7 6.4 1.61 357.8LA28 1994 Northridge 59.98 6.7 6.4 1.61 513.4LA29 1974 Tabas 49.98 7.4 1.2 1.08 312.4LA30 1974 Tabas 49.98 7.4 1.2 1.08 382.9LA31 Elysian Park (simulated) 29.99 7.1 17.5 1.43 500.5LA32 Elysian Park (simulated) 29.99 7.1 17.5 1.43 458.1LA33 Elysian Park (simulated) 29.99 7.1 10.7 0.97 302.1LA34 Elysian Park (simulated) 29.99 7.1 10.7 0.97 262.8LA35 Elysian Park (simulated) 29.99 7.1 11.2 1.10 383.1LA36 Elysian Park (simulated) 29.99 7.1 11.2 1.10 424.9LA37 Palos Verdes (simulated) 59.98 7.1 1.5 0.90 274.7LA38 Palos Verdes (simulated) 59.98 7.1 1.5 0.90 299.7LA39 Palos Verdes (simulated) 59.98 7.1 1.5 0.88 193.1LA40 Palos Verdes (simulated) 59.98 7.1 1.5 0.88 241.4
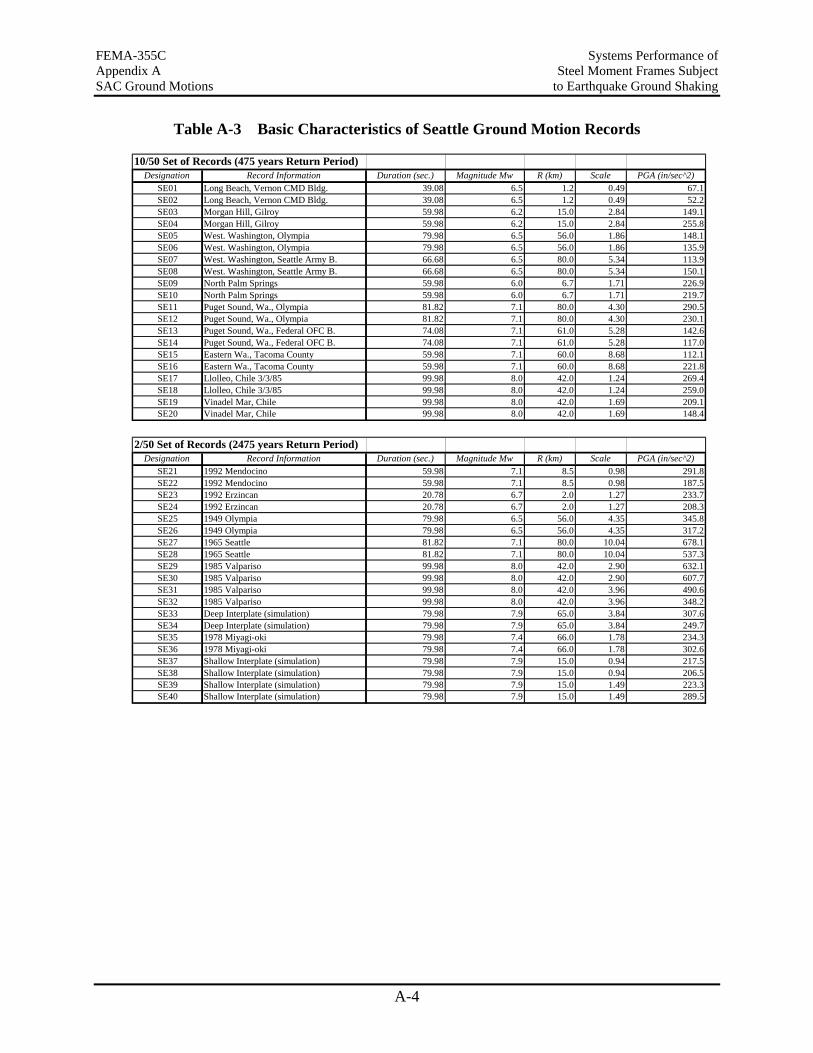
FEMA-355C Systems Performance of Appendix A Steel Moment Frames Subject SAC Ground Motions to Earthquake Ground Shaking
A-4
Table A-3 Basic Characteristics of Seattle Ground Motion Records
10/50 Set of Records (475 years Return Period)Designation Record Information Duration (sec.) Magnitude Mw R (km) Scale PGA (in/sec^2)
SE01 Long Beach, Vernon CMD Bldg. 39.08 6.5 1.2 0.49 67.1SE02 Long Beach, Vernon CMD Bldg. 39.08 6.5 1.2 0.49 52.2SE03 Morgan Hill, Gilroy 59.98 6.2 15.0 2.84 149.1SE04 Morgan Hill, Gilroy 59.98 6.2 15.0 2.84 255.8SE05 West. Washington, Olympia 79.98 6.5 56.0 1.86 148.1SE06 West. Washington, Olympia 79.98 6.5 56.0 1.86 135.9SE07 West. Washington, Seattle Army B. 66.68 6.5 80.0 5.34 113.9SE08 West. Washington, Seattle Army B. 66.68 6.5 80.0 5.34 150.1SE09 North Palm Springs 59.98 6.0 6.7 1.71 226.9SE10 North Palm Springs 59.98 6.0 6.7 1.71 219.7SE11 Puget Sound, Wa., Olympia 81.82 7.1 80.0 4.30 290.5SE12 Puget Sound, Wa., Olympia 81.82 7.1 80.0 4.30 230.1SE13 Puget Sound, Wa., Federal OFC B. 74.08 7.1 61.0 5.28 142.6SE14 Puget Sound, Wa., Federal OFC B. 74.08 7.1 61.0 5.28 117.0SE15 Eastern Wa., Tacoma County 59.98 7.1 60.0 8.68 112.1SE16 Eastern Wa., Tacoma County 59.98 7.1 60.0 8.68 221.8SE17 Llolleo, Chile 3/3/85 99.98 8.0 42.0 1.24 269.4SE18 Llolleo, Chile 3/3/85 99.98 8.0 42.0 1.24 259.0SE19 Vinadel Mar, Chile 99.98 8.0 42.0 1.69 209.1SE20 Vinadel Mar, Chile 99.98 8.0 42.0 1.69 148.4
2/50 Set of Records (2475 years Return Period)Designation Record Information Duration (sec.) Magnitude Mw R (km) Scale PGA (in/sec^2)
SE21 1992 Mendocino 59.98 7.1 8.5 0.98 291.8SE22 1992 Mendocino 59.98 7.1 8.5 0.98 187.5SE23 1992 Erzincan 20.78 6.7 2.0 1.27 233.7SE24 1992 Erzincan 20.78 6.7 2.0 1.27 208.3SE25 1949 Olympia 79.98 6.5 56.0 4.35 345.8SE26 1949 Olympia 79.98 6.5 56.0 4.35 317.2SE27 1965 Seattle 81.82 7.1 80.0 10.04 678.1SE28 1965 Seattle 81.82 7.1 80.0 10.04 537.3SE29 1985 Valpariso 99.98 8.0 42.0 2.90 632.1SE30 1985 Valpariso 99.98 8.0 42.0 2.90 607.7SE31 1985 Valpariso 99.98 8.0 42.0 3.96 490.6SE32 1985 Valpariso 99.98 8.0 42.0 3.96 348.2SE33 Deep Interplate (simulation) 79.98 7.9 65.0 3.84 307.6SE34 Deep Interplate (simulation) 79.98 7.9 65.0 3.84 249.7SE35 1978 Miyagi-oki 79.98 7.4 66.0 1.78 234.3SE36 1978 Miyagi-oki 79.98 7.4 66.0 1.78 302.6SE37 Shallow Interplate (simulation) 79.98 7.9 15.0 0.94 217.5SE38 Shallow Interplate (simulation) 79.98 7.9 15.0 0.94 206.5SE39 Shallow Interplate (simulation) 79.98 7.9 15.0 1.49 223.3SE40 Shallow Interplate (simulation) 79.98 7.9 15.0 1.49 289.5
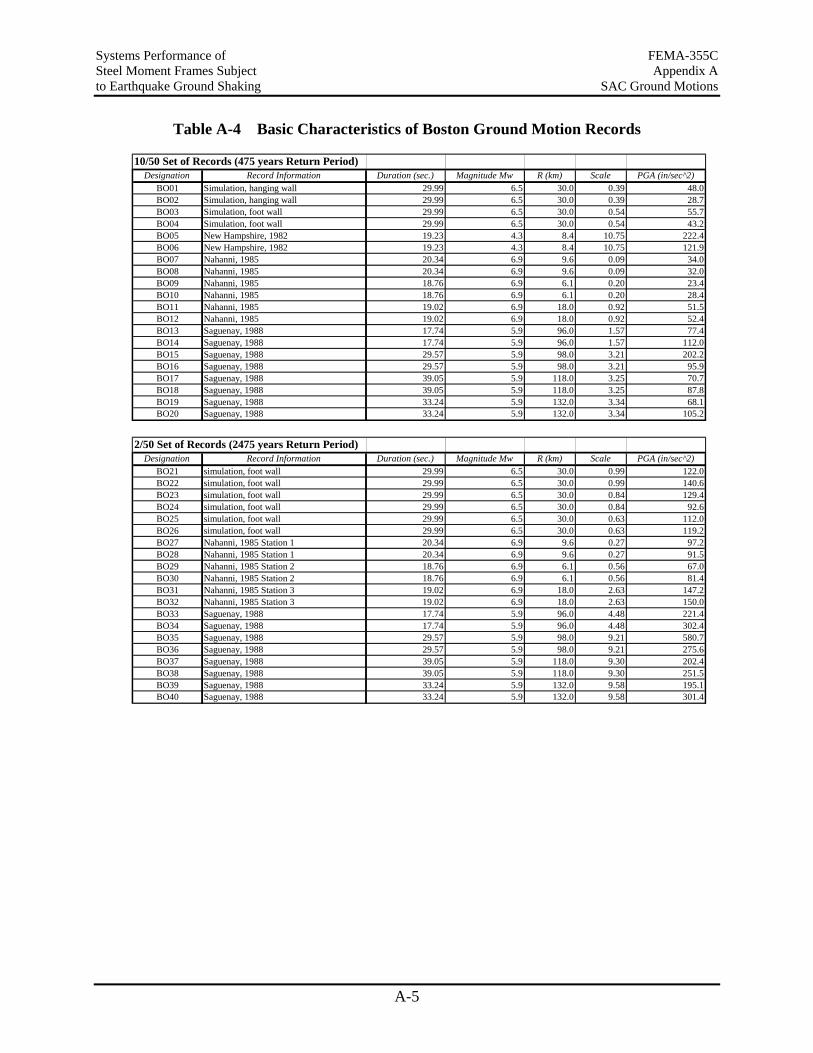
Systems Performance of FEMA-355C Steel Moment Frames Subject Appendix A to Earthquake Ground Shaking SAC Ground Motions
A-5
Table A-4 Basic Characteristics of Boston Ground Motion Records
10/50 Set of Records (475 years Return Period)Designation Record Information Duration (sec.) Magnitude Mw R (km) Scale PGA (in/sec^2)
BO01 Simulation, hanging wall 29.99 6.5 30.0 0.39 48.0BO02 Simulation, hanging wall 29.99 6.5 30.0 0.39 28.7BO03 Simulation, foot wall 29.99 6.5 30.0 0.54 55.7BO04 Simulation, foot wall 29.99 6.5 30.0 0.54 43.2BO05 New Hampshire, 1982 19.23 4.3 8.4 10.75 222.4BO06 New Hampshire, 1982 19.23 4.3 8.4 10.75 121.9BO07 Nahanni, 1985 20.34 6.9 9.6 0.09 34.0BO08 Nahanni, 1985 20.34 6.9 9.6 0.09 32.0BO09 Nahanni, 1985 18.76 6.9 6.1 0.20 23.4BO10 Nahanni, 1985 18.76 6.9 6.1 0.20 28.4BO11 Nahanni, 1985 19.02 6.9 18.0 0.92 51.5BO12 Nahanni, 1985 19.02 6.9 18.0 0.92 52.4BO13 Saguenay, 1988 17.74 5.9 96.0 1.57 77.4BO14 Saguenay, 1988 17.74 5.9 96.0 1.57 112.0BO15 Saguenay, 1988 29.57 5.9 98.0 3.21 202.2BO16 Saguenay, 1988 29.57 5.9 98.0 3.21 95.9BO17 Saguenay, 1988 39.05 5.9 118.0 3.25 70.7BO18 Saguenay, 1988 39.05 5.9 118.0 3.25 87.8BO19 Saguenay, 1988 33.24 5.9 132.0 3.34 68.1BO20 Saguenay, 1988 33.24 5.9 132.0 3.34 105.2
2/50 Set of Records (2475 years Return Period)Designation Record Information Duration (sec.) Magnitude Mw R (km) Scale PGA (in/sec^2)
BO21 simulation, foot wall 29.99 6.5 30.0 0.99 122.0BO22 simulation, foot wall 29.99 6.5 30.0 0.99 140.6BO23 simulation, foot wall 29.99 6.5 30.0 0.84 129.4BO24 simulation, foot wall 29.99 6.5 30.0 0.84 92.6BO25 simulation, foot wall 29.99 6.5 30.0 0.63 112.0BO26 simulation, foot wall 29.99 6.5 30.0 0.63 119.2BO27 Nahanni, 1985 Station 1 20.34 6.9 9.6 0.27 97.2BO28 Nahanni, 1985 Station 1 20.34 6.9 9.6 0.27 91.5BO29 Nahanni, 1985 Station 2 18.76 6.9 6.1 0.56 67.0BO30 Nahanni, 1985 Station 2 18.76 6.9 6.1 0.56 81.4BO31 Nahanni, 1985 Station 3 19.02 6.9 18.0 2.63 147.2BO32 Nahanni, 1985 Station 3 19.02 6.9 18.0 2.63 150.0BO33 Saguenay, 1988 17.74 5.9 96.0 4.48 221.4BO34 Saguenay, 1988 17.74 5.9 96.0 4.48 302.4BO35 Saguenay, 1988 29.57 5.9 98.0 9.21 580.7BO36 Saguenay, 1988 29.57 5.9 98.0 9.21 275.6BO37 Saguenay, 1988 39.05 5.9 118.0 9.30 202.4BO38 Saguenay, 1988 39.05 5.9 118.0 9.30 251.5BO39 Saguenay, 1988 33.24 5.9 132.0 9.58 195.1BO40 Saguenay, 1988 33.24 5.9 132.0 9.58 301.4
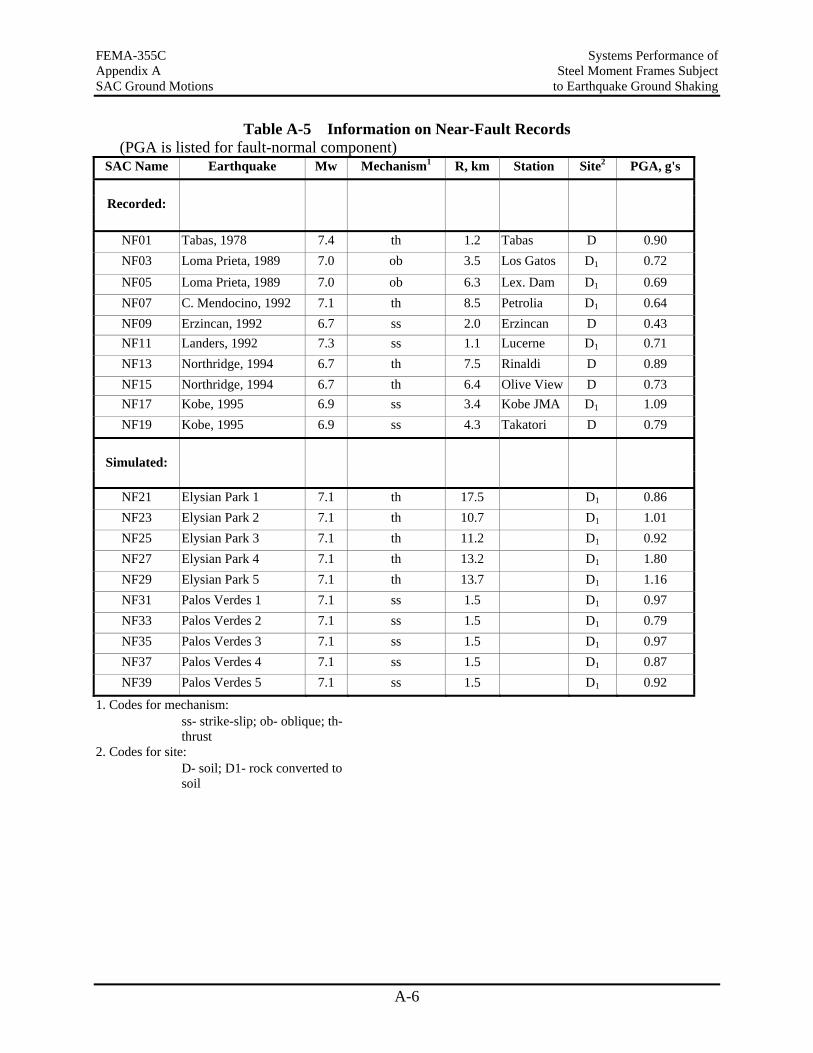
FEMA-355C Systems Performance of Appendix A Steel Moment Frames Subject SAC Ground Motions to Earthquake Ground Shaking
A-6
Table A-5 Information on Near-Fault Records (PGA is listed for fault-normal component)
SAC Name Earthquake Mw Mechanism1 R, km Station Site2 PGA, g's
Recorded:
NF01 Tabas, 1978 7.4 th 1.2 Tabas D 0.90 NF03 Loma Prieta, 1989 7.0 ob 3.5 Los Gatos D1 0.72 NF05 Loma Prieta, 1989 7.0 ob 6.3 Lex. Dam D1 0.69 NF07 C. Mendocino, 1992 7.1 th 8.5 Petrolia D1 0.64 NF09 Erzincan, 1992 6.7 ss 2.0 Erzincan D 0.43 NF11 Landers, 1992 7.3 ss 1.1 Lucerne D1 0.71 NF13 Northridge, 1994 6.7 th 7.5 Rinaldi D 0.89 NF15 Northridge, 1994 6.7 th 6.4 Olive View D 0.73 NF17 Kobe, 1995 6.9 ss 3.4 Kobe JMA D1 1.09 NF19 Kobe, 1995 6.9 ss 4.3 Takatori D 0.79
Simulated:
NF21 Elysian Park 1 7.1 th 17.5 D1 0.86 NF23 Elysian Park 2 7.1 th 10.7 D1 1.01 NF25 Elysian Park 3 7.1 th 11.2 D1 0.92 NF27 Elysian Park 4 7.1 th 13.2 D1 1.80 NF29 Elysian Park 5 7.1 th 13.7 D1 1.16 NF31 Palos Verdes 1 7.1 ss 1.5 D1 0.97 NF33 Palos Verdes 2 7.1 ss 1.5 D1 0.79 NF35 Palos Verdes 3 7.1 ss 1.5 D1 0.97 NF37 Palos Verdes 4 7.1 ss 1.5 D1 0.87 NF39 Palos Verdes 5 7.1 ss 1.5 D1 0.92
1. Codes for mechanism: ss- strike-slip; ob- oblique; th- thrust
2. Codes for site: D- soil; D1- rock converted to soil
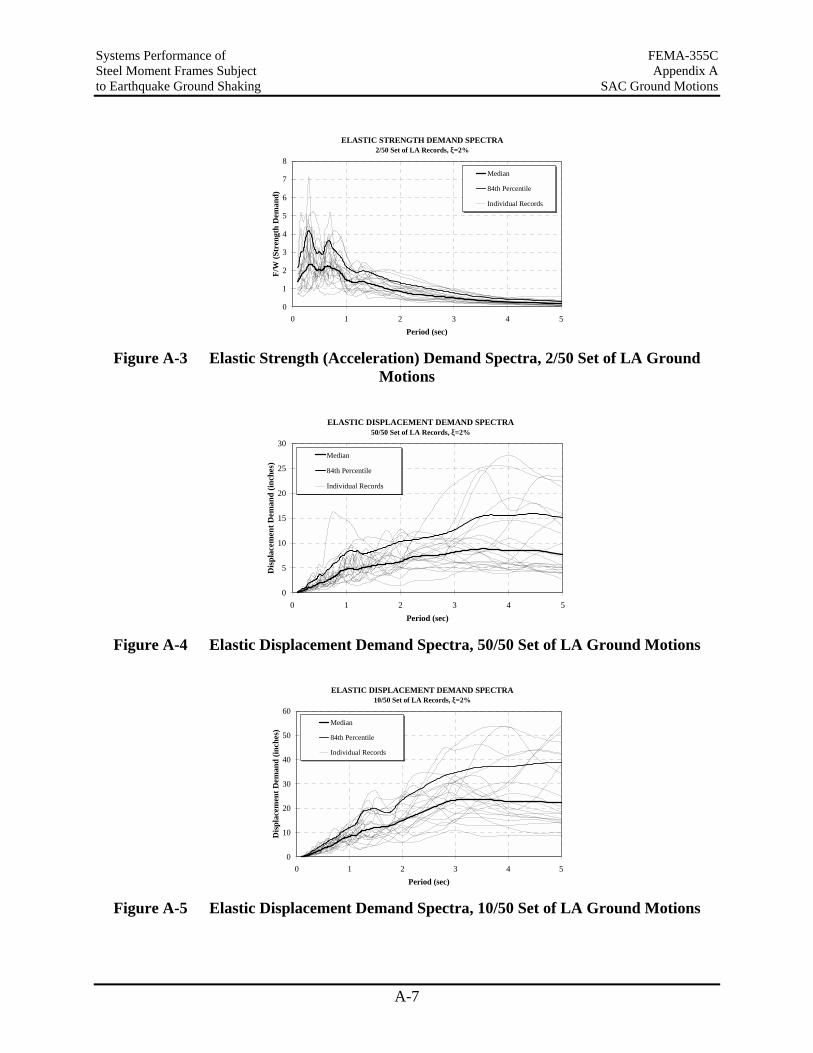
Systems Performance of FEMA-355C Steel Moment Frames Subject Appendix A to Earthquake Ground Shaking SAC Ground Motions
A-7
ELASTIC STRENGTH DEMAND SPECTRA2/50 Set of LA Records, ξ=2%
0
1
2
3
4
5
6
7
8
0 1 2 3 4 5Period (sec)
F/W
(Str
engt
h D
eman
d)
Median
84th Percentile
Individual Records
Figure A-3 Elastic Strength (Acceleration) Demand Spectra, 2/50 Set of LA Ground
Motions
ELASTIC DISPLACEMENT DEMAND SPECTRA50/50 Set of LA Records, ξ=2%
0
5
10
15
20
25
30
0 1 2 3 4 5Period (sec)
Dis
plac
emen
t Dem
and
(inch
es)
Median
84th Percentile
Individual Records
Figure A-4 Elastic Displacement Demand Spectra, 50/50 Set of LA Ground Motions
ELASTIC DISPLACEMENT DEMAND SPECTRA10/50 Set of LA Records, ξ=2%
0
10
20
30
40
50
60
0 1 2 3 4 5Period (sec)
Dis
plac
emen
t Dem
and
(inch
es)
Median
84th Percentile
Individual Records
Figure A-5 Elastic Displacement Demand Spectra, 10/50 Set of LA Ground Motions
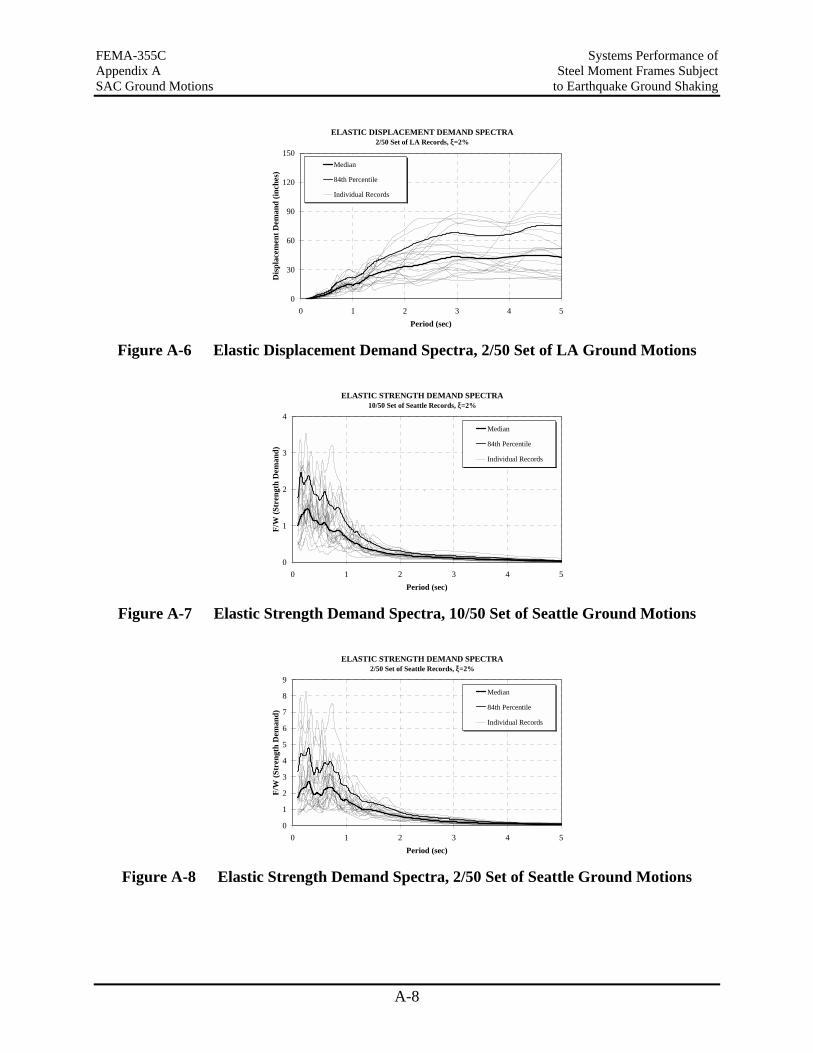
FEMA-355C Systems Performance of Appendix A Steel Moment Frames Subject SAC Ground Motions to Earthquake Ground Shaking
A-8
ELASTIC DISPLACEMENT DEMAND SPECTRA2/50 Set of LA Records, ξ=2%
0
30
60
90
120
150
0 1 2 3 4 5Period (sec)
Dis
plac
emen
t Dem
and
(inch
es)
Median
84th Percentile
Individual Records
Figure A-6 Elastic Displacement Demand Spectra, 2/50 Set of LA Ground Motions
ELASTIC STRENGTH DEMAND SPECTRA10/50 Set of Seattle Records, ξ=2%
0
1
2
3
4
0 1 2 3 4 5Period (sec)
F/W
(Str
engt
h D
eman
d)
Median
84th Percentile
Individual Records
`
Figure A-7 Elastic Strength Demand Spectra, 10/50 Set of Seattle Ground Motions
ELASTIC STRENGTH DEMAND SPECTRA2/50 Set of Seattle Records, ξ=2%
0
1
2
3
4
5
6
7
8
9
0 1 2 3 4 5Period (sec)
F/W
(Str
engt
h D
eman
d)
Median
84th Percentile
Individual Records
Figure A-8 Elastic Strength Demand Spectra, 2/50 Set of Seattle Ground Motions
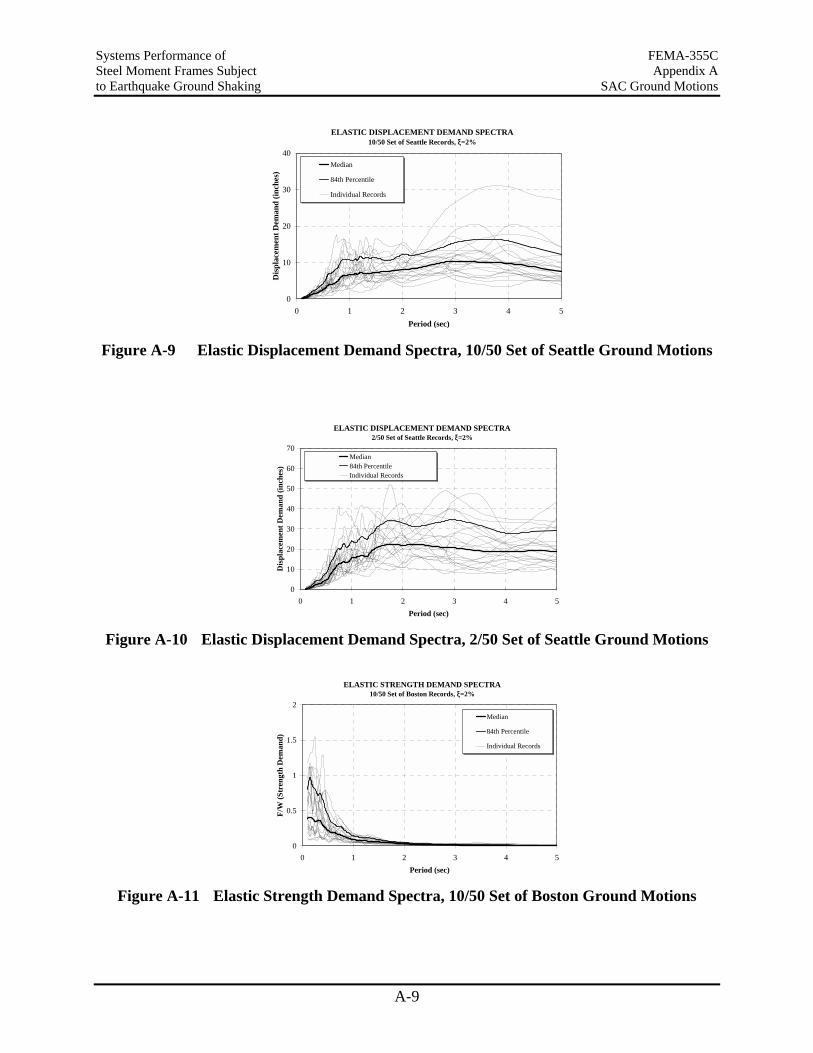
Systems Performance of FEMA-355C Steel Moment Frames Subject Appendix A to Earthquake Ground Shaking SAC Ground Motions
A-9
ELASTIC DISPLACEMENT DEMAND SPECTRA10/50 Set of Seattle Records, ξ=2%
0
10
20
30
40
0 1 2 3 4 5Period (sec)
Dis
plac
emen
t Dem
and
(inch
es)
Median
84th Percentile
Individual Records
Figure A-9 Elastic Displacement Demand Spectra, 10/50 Set of Seattle Ground Motions
ELASTIC DISPLACEMENT DEMAND SPECTRA2/50 Set of Seattle Records, ξ=2%
0
10
20
30
40
50
60
70
0 1 2 3 4 5Period (sec)
Dis
plac
emen
t Dem
and
(inch
es)
Median84th PercentileIndividual Records
Figure A-10 Elastic Displacement Demand Spectra, 2/50 Set of Seattle Ground Motions
ELASTIC STRENGTH DEMAND SPECTRA10/50 Set of Boston Records, ξ=2%
0
0.5
1
1.5
2
0 1 2 3 4 5Period (sec)
F/W
(Str
engt
h D
eman
d)
Median
84th Percentile
Individual Records
Figure A-11 Elastic Strength Demand Spectra, 10/50 Set of Boston Ground Motions
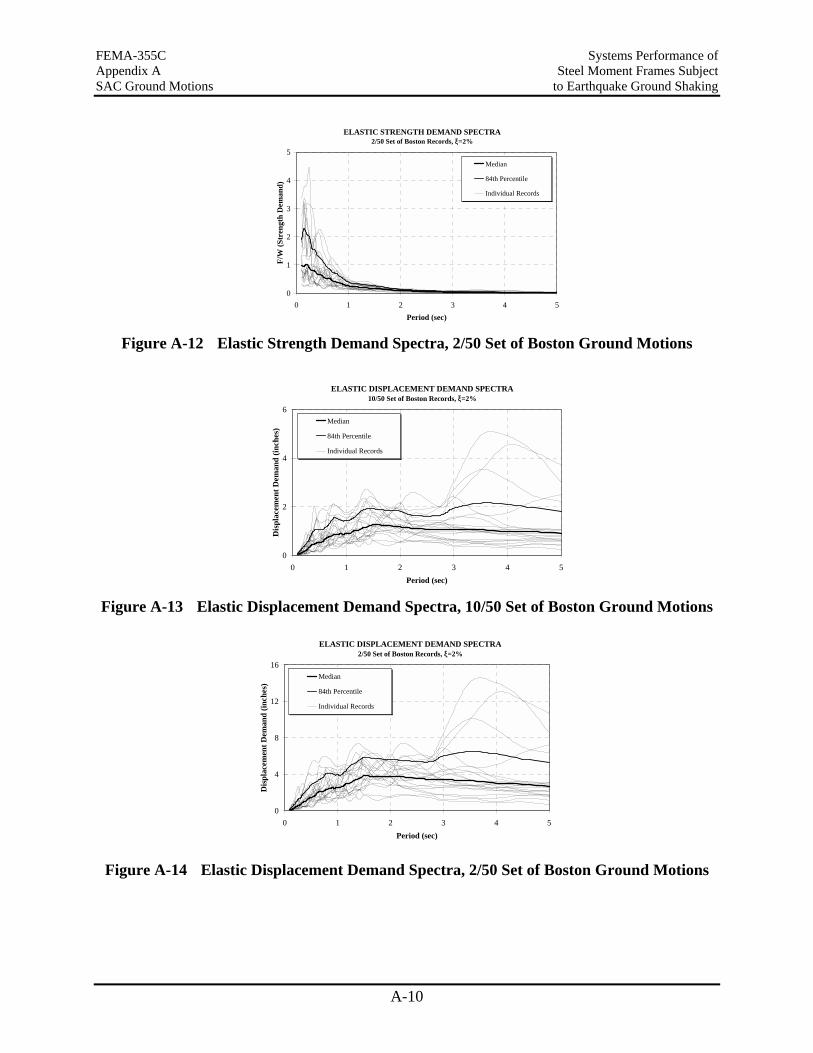
FEMA-355C Systems Performance of Appendix A Steel Moment Frames Subject SAC Ground Motions to Earthquake Ground Shaking
A-10
ELASTIC STRENGTH DEMAND SPECTRA2/50 Set of Boston Records, ξ=2%
0
1
2
3
4
5
0 1 2 3 4 5Period (sec)
F/W
(Str
engt
h D
eman
d)
Median
84th Percentile
Individual Records
Figure A-12 Elastic Strength Demand Spectra, 2/50 Set of Boston Ground Motions
ELASTIC DISPLACEMENT DEMAND SPECTRA10/50 Set of Boston Records, ξ=2%
0
2
4
6
0 1 2 3 4 5Period (sec)
Dis
plac
emen
t Dem
and
(inch
es)
Median
84th Percentile
Individual Records
Figure A-13 Elastic Displacement Demand Spectra, 10/50 Set of Boston Ground Motions
ELASTIC DISPLACEMENT DEMAND SPECTRA2/50 Set of Boston Records, ξ=2%
0
4
8
12
16
0 1 2 3 4 5Period (sec)
Dis
plac
emen
t Dem
and
(inch
es)
Median
84th Percentile
Individual Records
Figure A-14 Elastic Displacement Demand Spectra, 2/50 Set of Boston Ground Motions
Systems Performance of FEMA-355C Steel Moment Frames Subject Appendix B to Earthquake Ground Shaking The SAC Model Buildings
B-1
Appendix B. THE SAC MODEL BUILDINGS
B.1 Description of Buildings and Basic Loading Conditions
As part of the SAC steel project, three consulting firms were commissioned to perform code designs for 3-, 9-, and 20-story model buildings, following the local code requirements for the following three cities: Los Angeles (UBC 1994), Seattle (UBC 1994), and Boston (BOCA 1993). All prevailing code requirements for gravity, wind, and seismic design needed to be considered. The buildings were to be designed as standard office buildings situated on stiff soil (soil type S2 as per UBC ’94 and BOCA ’93 definitions).
The floor plans and elevations for the buildings were preset, as shown in Figure B-1. The shaded area indicates the penthouse location. Gravity frame columns are located only below the penthouse in the 20-story buildings, resulting in two bays of 40 feet bounding a 20-foot bay in the gravity frames. The column bases in the 3-story buildings are considered as fixed. The 9-story buildings have a single-level basement, and the 20-story buildings have a 2-level basement. The buildings were required to conform to a drift limit of h/400, where “h” is the story height. The loading information provided was the following:
Steel framing: as designed
Floors and Roof: 3 inch metal decking with 2.5 inches of normal weight concrete fill and fireproofing
Roofing: 7 psf average
Ceilings/Flooring: 3 psf average, including fireproofing
Mech./Electrical: 7 psf average for all floors, additionally 40 psf over penthouse area for equipment
Partitions: as per code requirements (10 psf for seismic load, 20 psf for gravity design)
Exterior Wall: 25 psf of wall surface average, including any penthouses. Assume 2 feet from perimeter column lines to edge of building envelope. Include 42 inch parapet at main roof level, none at penthouse roof.
Live Load: typical code values for office occupancy (50 psf everywhere)
Wind Load: as per code requirements, assuming congested area (exposure B as per UBC ’94 definition)
Seismic Load: as per code requirements.
Based on this basic information, the consulting firms were asked to carry out three types of structural designs:
1. Pre-Northridge Designs: These designs were based on design practices prevalent before the Northridge earthquake, i.e., without consideration of the FEMA 267 (1995) document. These designs had the standard beam-to-column welded connection details.

FEMA-355C Systems Performance of Appendix B Steel Moment Frames Subject The SAC Model Buildings to Earthquake Ground Shaking
B-2
2. Post-Northridge Designs: These designs were to additionally conform to the provisions of FEMA 267 (1995). The designers decided on the use of cover-plated beam flanges in order to move the location of the plastic hinge in the beam away from the face of the column.
3. Special Designs: Two types of special designs were carried out for the 9-story post-Northridge structures in all three geographic locations. The first special design involved the use of reduced beam sections, while the other design involved the use of a higher strength steel (A913) for the columns.
Thus, the basic definitions for the buildings were kept constant between the different regions, but no other constraints concerning the design of the buildings (e.g., number of moment-resisting connections, choice of member sections, etc.) were imposed. The buildings so designed can be considered as being representative of typical steel moment frame structures in the three geographic locations, designed according to either pre- or post-Northridge design practice.
All three design offices selected perimeter moment-resisting frames as the structural system. In all cases the design of the moment frames in the two orthogonal directions was either identical or very similar, thus, only half of the structure is considered in the analysis. The ordinary difference between the NS and East-West (EW) direction comes from the difference in gravity load effects on account of the orientation of the gravity beams and sub-beams. Both the beams and sub-beams are oriented in the NS direction. However, as the gravity loading on the girders of the perimeter WSMFs is small and has almost negligible effect on the seismic response, the decision to analyze the structure only in the NS direction is justified.
The loading used for the analysis of the frames is based on the details given before, which result in the following floor load distribution (steel weight is assumed as 13 psf for all designs):
Floor dead load for weight calculations: 96 psf
Floor dead load for mass calculations: 86 psf
Roof dead load excluding penthouse: 83 psf
Penthouse dead load: 116 psf
Reduced live load per floor and for roof: 20 psf
Cladding and parapet loads are based on the surface area of the structures. Based on these loading definitions, the seismic mass for the structures is as follows (the values are for the entire structure):
3-story Structures:
Roof: 70.90 kips-sec2/ft
Floor 3 and Floor 2: 65.53 kips-sec2/ft
9-story Structures:
Roof: 73.10 kips-sec2/ft
Floor 9 to Floor 3: 67.86 kips-sec2/ft
Systems Performance of FEMA-355C Steel Moment Frames Subject Appendix B to Earthquake Ground Shaking The SAC Model Buildings
B-3
Floor 2: 69.04 kips-sec2/ft
20-story Structures:
Roof: 40.06 kips-sec2/ft
Floor 20 to Floor 3: 37.76 kips-sec2/ft
Floor 2: 38.63 kips-sec2/ft
The design details (member sections, doubler plates, design basis, etc.) for the different structures are summarized in the following sections.
B.2 Los Angeles (LA) Structures
The lateral load design of all LA structures was controlled by seismic load considerations. The location of the moment-resisting frames is shown by the bold lines in Figure B-2. All the columns in the perimeter moment frames bend about the strong axis. The strong axis of the gravity frame columns is oriented in the NS direction.
In the 9-story building, one of the exterior bays has only one moment-resisting connection to avoid bi-axial bending in the corner column. In the 20-story buildings, all the exterior connections are moment-resisting connections, and box columns are used at the corners to resist bi-axial bending. The design yield strength of the beams and girders is 36 ksi and of the columns is 50 ksi. Most of the girder sizes are controlled by drift rather than strength considerations. The sections used in the NS frames of the pre-Northridge and post-Northridge designs are summarized in Table B-1.
Panel zone doubler plates have been used to conform to the minimum panel zone shear strength code requirement. The thickness for the doubler plates are shown in Table B-1. The first number represents the thickness of the doubler plate for the exterior columns, while the second number represents the thickness of the doubler plates for the interior columns of the WSMF. The doubler plates have the same nominal yield strength as the columns.
In the post-Northridge designs, cover plates are welded to the top and bottom of the girder flanges. The dimensions of the cover plates used are given in Table B-2. “W1” denotes the width of the top cover plate next to the column face, and “T1” denotes the thickness of the top cover plate. The top cover plate extends for a length of 18 inches from the face of the column and ends with a width of 3 inches with uniform tapering from the face of the column to the end of the cover plate. The bottom cover plate is rectangular in shape with a width of “W2” and a thickness of “T2.” The cover plates have the same nominal yield strength as the girders.
Addition of cover plates to girder flanges increases the stiffness of the girders. The increase is, however, not large enough to induce a major change in the global properties of the structure (see Table 5.1) and hence the member sections in the pre- and post-Northridge designs are very similar. Some small differences observed in the member properties in some parts of the building, can be explained as follows:
FEMA-355C Systems Performance of Appendix B Steel Moment Frames Subject The SAC Model Buildings to Earthquake Ground Shaking
B-4
1. The designer specified A36 steel for beams and girders in the pre-Northridge design, while using Dual Grade A36 Gr. 50 steel for the post-Northridge design. As the dual grade steel has a higher nominal yield strength (50 ksi as against 36 ksi for A36), the gravity beams, and to some extent, the WSMF girder sizes could be reduced. (The expected yield strength of the both the steel types is, however, very close, and a common value of 49.2 ksi is used in the analysis in this work.)
2. The increase in girder moment at the face of the column may be responsible for the use of slightly heavier column sections in some locations, to maintain the strong-column-weak- girder concept.
Based on the member properties of the pre- and post-Northridge structures, the global response of same height structures is expected to be similar. Differences are expected at the local level, i.e., in the distribution of demands between the beam, panel zone, and the column.
B.3 Seattle (SE) Structures
The design of the Seattle 3- and 9-story structures was governed by seismic loads, however, the design of the 20-story structure was controlled by wind loads (based on a wind speed of 80 mph). The wind design base shear for the 20-story structure is almost identical to the seismic design base shear for the LA 20-story structure, resulting in the stiffness of the two structures being similar (see Table 5.1). A572 Gr. 50 (nominal yield strength of 50 ksi, expected yield strength 57.6 ksi) steel has been used for all column, beam and girder sections in all Seattle designs.
The position of the moment-resisting frames is shown by the bold lines in Figure B-3. The strong axis of the gravity frame columns is oriented in the NS direction. The layout of the moment-resisting frame is observed to be slightly different from the layout of the MR frames for the LA buildings. The member sections for the pre-Northridge design, post-Northridge design, and the design employing reduced beam sections (RBS) are given in Table B-3.
The dimensions of the cover plates used for the post-Northridge designs are given in Table B-4, where “L” denotes the length of the cover plate, “W” the width, and “T” the thickness. The bottom cover plate has a rectangular cross section. The top cover plate has a width equal to “W1” at the face of the column, maintains this width for 2-1/2 inches from the column face, and then tapers uniformly to a width of 3-1/2 inches at the end of the cover plate.
The choice of the girder sections in the post-Northridge designs was influenced by detailing considerations; the length of the cover plate is taken as half the depth of the girder, and the thickness equal to the girder flange thickness (or 1/8th inch thicker for the top cover plate). This criterion resulted in the selection of girders which are typically shallower with wider, thicker flanges. In order to offset the additional demand generated at the column due to movement of the plastic hinge away from the face of the column, the column sizes were increased in the post-Northridge designs. The increased demands also resulted in the use of thicker doubler plates for the panel zones. The global stiffness of the pre- and post-Northridge designs is almost identical, again indicating that the change in design criteria is likely to affect only the local distribution of demands at the connections.
Systems Performance of FEMA-355C Steel Moment Frames Subject Appendix B to Earthquake Ground Shaking The SAC Model Buildings
B-5
The requirement of limiting the weld stress at the beam-to-column complete penetration weld to 40 ksi, resulted in the use of cover plates even in the reduced beam section design. The cover plate dimensions for the design employing the reduced beam section details are given in Table B-5. For all post-Northridge and RBS designs, the cover plates are of the same yield strength as the girders. The doubler plates have the same yield strength as the columns.
The cover plate geometry is similar to the geometry used in the post-Northridge designs, with the exception of the end of the cover plate being 3 inches wide instead of 3-1/2 inches wide. The geometry of the reduced beam section is given in Table B-6. The designers used a curved cutout pattern for the reduced beam section utilizing the maximum allowable flange reduction of 50%. The RBS starts at a distance of L minus 0.5L(RBS) from the face of the column and extends for a length of L(RBS). The minimum width of W(RBS) is at the midsection of the RBS.
The RBS design has member sizes that are similar to those of the pre-Northridge design, in most areas. The only major difference observed is in the use of lighter sections for the exterior columns in the RBS design, due to a reduction in the maximum force demand transferred from the beam onto the column. Again, the global characteristics of the different designs are similar, and differences in response are expected primarily at the local level.
B.4 Boston (BO) Structures
The location of the moment-resisting connections in the Boston 3- and 20-story structures is identical to the location of the MR connections in the Seattle 3- and 20-story structures (see Figure B-3). The placement of the MR connections in the 9-story structure is identical to the placement in the LA 9-story structure (see Figure B-2). The strong axis of the gravity frame columns is oriented in the NS direction. The design of the 3-story structure is controlled by seismic loads, while the designs for the 9- and 20-story structures are wind controlled designs. The member sections for the pre- and post-Northridge designs are given in Table B-7. A572 Gr. 50 steel has been used for both beams and columns in the Boston designs.
The dimensions for the cover plates used in the Boston post-Northridge designs are given in Table B-8. “T” stands for the thickness of the plates, and “L” for the length of the plates. The top cover plates have a width equal to “W1” at the face of the column, maintain this width for 2 inches from the column face, and then taper uniformly to a width of “W2.” The bottom cover plate has a rectangular cross section with a width of “W.”
There are striking differences between the pre- and post-Northridge designs for Boston. Boston lies in seismic Zone 2A, thus the pre-Northridge designs are not required to comply with specific panel zone strength requirements or the strong column criterion, which are binding in seismic Zones 3 and 4. The post-Northridge designs, however, have to comply with both a minimum panel zone shear strength requirement as well as the strong column concept, in accordance with FEMA 267 (1995), thereby resulting in the use of significantly heavier column sections and extensive use of doubler plates.
FEMA-355C Systems Performance of Appendix B Steel Moment Frames Subject The SAC Model Buildings to Earthquake Ground Shaking
B-6
B.5 Redesigned LA 9-Story Structures
Three redesigns of the LA pre-Northridge 9-story structure were carried out using the computer program BERT (Building Engineering Reasoning Tool) developed by Fuyama et al. (1993). The program performs code compliant designs with an emphasis on reducing weight but paying attention to constructability. Beams and girders were designed using A36 steel, while A 572 Gr. 50 steel was used for the design of columns. The floor plans for the three redesigns (designated as R1-, R2-, and R3-LA9), showing the changes in bay width and/or the number of moment-resisting connections per floor with respect to the original LA 9-story design, are shown in Figure B-4. The member sections for the redesigns are given in Table B-9. Only the NS moment-resisting frame sections are shown.
For the original configuration redesign (R1-LA9), a significant reduction in column sizes is observed at the cost of a small increase in girder sizes. This reduction in the column sizes is primarily on account of the strong column criterion being satisfied on the basis of the strong column-weak panel zone concept rather than the strong column-weak girder concept. The R2 redesign has lighter girder sections on account of the reduced span of the beams. The R3 redesign has heavier girders but lighter columns as compared to the original LA pre-Northridge structure. The three redesigns conform to the code drift requirements, and satisfy the minimum panel zone shear strength requirement as well as the strong column criterion (in many cases through weak panel zones).
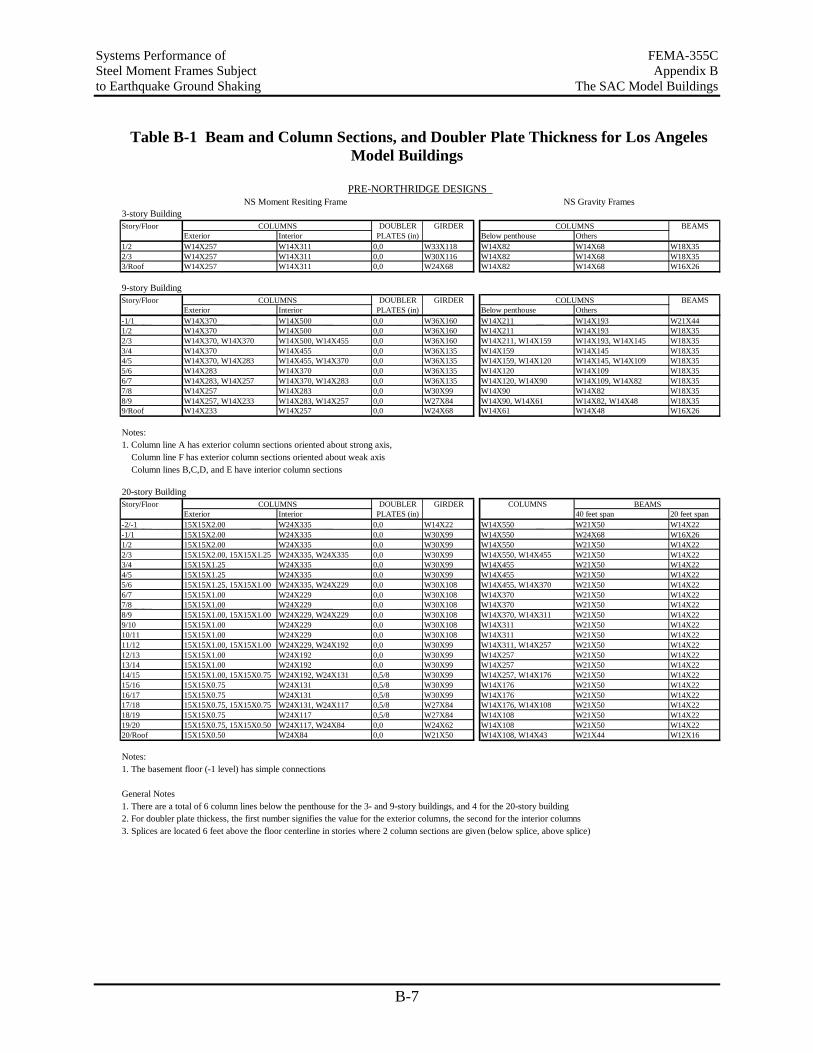
Systems Performance of FEMA-355C Steel Moment Frames Subject Appendix B to Earthquake Ground Shaking The SAC Model Buildings
B-7
Table B-1 Beam and Column Sections, and Doubler Plate Thickness for Los Angeles Model Buildings
3-story Building DOUBLER GIRDER BEAMS
Exterior Interior PLATES (in) Below penthouse Others 1/2 W14X257 W14X311 0,0 W33X118 W14X82 W14X68 W18X352/3 W14X257 W14X311 0,0 W30X116 W14X82 W14X68 W18X353/Roof W14X257 W14X311 0,0 W24X68 W14X82 W14X68 W16X26
9-story Building DOUBLER GIRDER BEAMS
Exterior Interior PLATES (in) Below penthouse Others -1/1 W14X370 W14X500 0,0 W36X160 W14X211 W14X193 W21X441/2 W14X370 W14X500 0,0 W36X160 W14X211 W14X193 W18X352/3 W14X370, W14X370 W14X500, W14X455 0,0 W36X160 W14X211, W14X159 W14X193, W14X145 W18X353/4 W14X370 W14X455 0,0 W36X135 W14X159 W14X145 W18X354/5 W14X370, W14X283 W14X455, W14X370 0,0 W36X135 W14X159, W14X120 W14X145, W14X109 W18X355/6 W14X283 W14X370 0,0 W36X135 W14X120 W14X109 W18X356/7 W14X283, W14X257 W14X370, W14X283 0,0 W36X135 W14X120, W14X90 W14X109, W14X82 W18X357/8 W14X257 W14X283 0,0 W30X99 W14X90 W14X82 W18X358/9 W14X257, W14X233 W14X283, W14X257 0,0 W27X84 W14X90, W14X61 W14X82, W14X48 W18X359/Roof W14X233 W14X257 0,0 W24X68 W14X61 W14X48 W16X26
Notes: 1. Column line A has exterior column sections oriented about strong axis, Column line F has exterior column sections oriented about weak axis Column lines B,C,D, and E have interior column sections
20-story Building DOUBLER GIRDER COLUMNS
Exterior Interior PLATES (in) 40 feet span 20 feet span-2/-1 15X15X2.00 W24X335 0,0 W14X22 W14X550 W21X50 W14X22-1/1 15X15X2.00 W24X335 0,0 W30X99 W14X550 W24X68 W16X261/2 15X15X2.00 W24X335 0,0 W30X99 W14X550 W21X50 W14X222/3 15X15X2.00, 15X15X1.25 W24X335, W24X335 0,0 W30X99 W14X550, W14X455 W21X50 W14X223/4 15X15X1.25 W24X335 0,0 W30X99 W14X455 W21X50 W14X224/5 15X15X1.25 W24X335 0,0 W30X99 W14X455 W21X50 W14X225/6 15X15X1.25, 15X15X1.00 W24X335, W24X229 0,0 W30X108 W14X455, W14X370 W21X50 W14X226/7 15X15X1.00 W24X229 0,0 W30X108 W14X370 W21X50 W14X227/8 15X15X1.00 W24X229 0,0 W30X108 W14X370 W21X50 W14X228/9 15X15X1.00, 15X15X1.00 W24X229, W24X229 0,0 W30X108 W14X370, W14X311 W21X50 W14X229/10 15X15X1.00 W24X229 0,0 W30X108 W14X311 W21X50 W14X2210/11 15X15X1.00 W24X229 0,0 W30X108 W14X311 W21X50 W14X2211/12 15X15X1.00, 15X15X1.00 W24X229, W24X192 0,0 W30X99 W14X311, W14X257 W21X50 W14X2212/13 15X15X1.00 W24X192 0,0 W30X99 W14X257 W21X50 W14X2213/14 15X15X1.00 W24X192 0,0 W30X99 W14X257 W21X50 W14X2214/15 15X15X1.00, 15X15X0.75 W24X192, W24X131 0,5/8 W30X99 W14X257, W14X176 W21X50 W14X2215/16 15X15X0.75 W24X131 0,5/8 W30X99 W14X176 W21X50 W14X2216/17 15X15X0.75 W24X131 0,5/8 W30X99 W14X176 W21X50 W14X2217/18 15X15X0.75, 15X15X0.75 W24X131, W24X117 0,5/8 W27X84 W14X176, W14X108 W21X50 W14X2218/19 15X15X0.75 W24X117 0,5/8 W27X84 W14X108 W21X50 W14X2219/20 15X15X0.75, 15X15X0.50 W24X117, W24X84 0,0 W24X62 W14X108 W21X50 W14X2220/Roof 15X15X0.50 W24X84 0,0 W21X50 W14X108, W14X43 W21X44 W12X16
Notes: 1. The basement floor (-1 level) has simple connections
General Notes 1. There are a total of 6 column lines below the penthouse for the 3- and 9-story buildings, and 4 for the 20-story building2. For doubler plate thickess, the first number signifies the value for the exterior columns, the second for the interior columns 3. Splices are located 6 feet above the floor centerline in stories where 2 column sections are given (below splice, above splice)
COLUMNS COLUMNS
PRE-NORTHRIDGE DESIGNSNS Moment Resiting Frame NS Gravity Frames
Story/Floor
Story/Floor COLUMNS BEAMS
Story/Floor COLUMNS COLUMNS
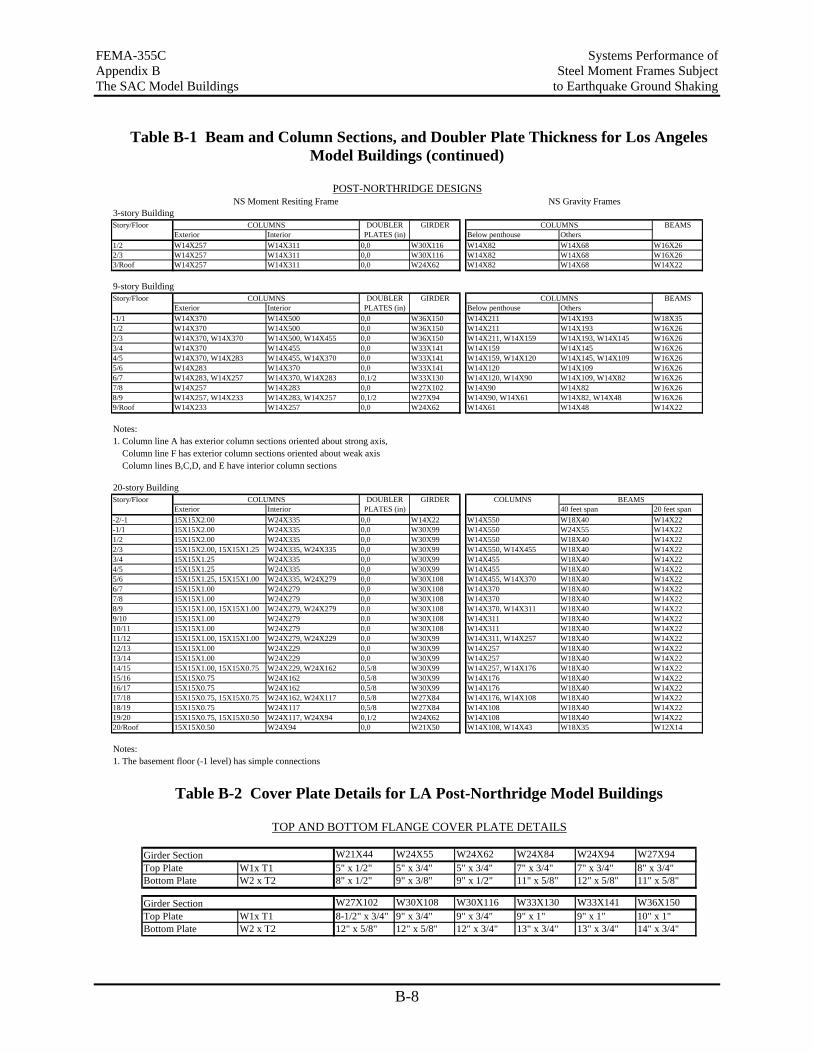
FEMA-355C Systems Performance of Appendix B Steel Moment Frames Subject The SAC Model Buildings to Earthquake Ground Shaking
B-8
Table B-1 Beam and Column Sections, and Doubler Plate Thickness for Los Angeles Model Buildings (continued)
3-story BuildingDOUBLER GIRDER BEAMS
Exterior Interior PLATES (in) Below penthouse Others1/2 W14X257 W14X311 0,0 W30X116 W14X82 W14X68 W16X262/3 W14X257 W14X311 0,0 W30X116 W14X82 W14X68 W16X263/Roof W14X257 W14X311 0,0 W24X62 W14X82 W14X68 W14X22
9-story BuildingDOUBLER GIRDER BEAMS
Exterior Interior PLATES (in) Below penthouse Others-1/1 W14X370 W14X500 0,0 W36X150 W14X211 W14X193 W18X351/2 W14X370 W14X500 0,0 W36X150 W14X211 W14X193 W16X262/3 W14X370, W14X370 W14X500, W14X455 0,0 W36X150 W14X211, W14X159 W14X193, W14X145 W16X263/4 W14X370 W14X455 0,0 W33X141 W14X159 W14X145 W16X264/5 W14X370, W14X283 W14X455, W14X370 0,0 W33X141 W14X159, W14X120 W14X145, W14X109 W16X265/6 W14X283 W14X370 0,0 W33X141 W14X120 W14X109 W16X266/7 W14X283, W14X257 W14X370, W14X283 0,1/2 W33X130 W14X120, W14X90 W14X109, W14X82 W16X267/8 W14X257 W14X283 0,0 W27X102 W14X90 W14X82 W16X268/9 W14X257, W14X233 W14X283, W14X257 0,1/2 W27X94 W14X90, W14X61 W14X82, W14X48 W16X269/Roof W14X233 W14X257 0,0 W24X62 W14X61 W14X48 W14X22
Notes:1. Column line A has exterior column sections oriented about strong axis, Column line F has exterior column sections oriented about weak axis Column lines B,C,D, and E have interior column sections
20-story BuildingDOUBLER GIRDER COLUMNS
Exterior Interior PLATES (in) 40 feet span 20 feet span-2/-1 15X15X2.00 W24X335 0,0 W14X22 W14X550 W18X40 W14X22-1/1 15X15X2.00 W24X335 0,0 W30X99 W14X550 W24X55 W14X221/2 15X15X2.00 W24X335 0,0 W30X99 W14X550 W18X40 W14X222/3 15X15X2.00, 15X15X1.25 W24X335, W24X335 0,0 W30X99 W14X550, W14X455 W18X40 W14X223/4 15X15X1.25 W24X335 0,0 W30X99 W14X455 W18X40 W14X224/5 15X15X1.25 W24X335 0,0 W30X99 W14X455 W18X40 W14X225/6 15X15X1.25, 15X15X1.00 W24X335, W24X279 0,0 W30X108 W14X455, W14X370 W18X40 W14X226/7 15X15X1.00 W24X279 0,0 W30X108 W14X370 W18X40 W14X227/8 15X15X1.00 W24X279 0,0 W30X108 W14X370 W18X40 W14X228/9 15X15X1.00, 15X15X1.00 W24X279, W24X279 0,0 W30X108 W14X370, W14X311 W18X40 W14X229/10 15X15X1.00 W24X279 0,0 W30X108 W14X311 W18X40 W14X2210/11 15X15X1.00 W24X279 0,0 W30X108 W14X311 W18X40 W14X2211/12 15X15X1.00, 15X15X1.00 W24X279, W24X229 0,0 W30X99 W14X311, W14X257 W18X40 W14X2212/13 15X15X1.00 W24X229 0,0 W30X99 W14X257 W18X40 W14X2213/14 15X15X1.00 W24X229 0,0 W30X99 W14X257 W18X40 W14X2214/15 15X15X1.00, 15X15X0.75 W24X229, W24X162 0,5/8 W30X99 W14X257, W14X176 W18X40 W14X2215/16 15X15X0.75 W24X162 0,5/8 W30X99 W14X176 W18X40 W14X2216/17 15X15X0.75 W24X162 0,5/8 W30X99 W14X176 W18X40 W14X2217/18 15X15X0.75, 15X15X0.75 W24X162, W24X117 0,5/8 W27X84 W14X176, W14X108 W18X40 W14X2218/19 15X15X0.75 W24X117 0,5/8 W27X84 W14X108 W18X40 W14X2219/20 15X15X0.75, 15X15X0.50 W24X117, W24X94 0,1/2 W24X62 W14X108 W18X40 W14X2220/Roof 15X15X0.50 W24X94 0,0 W21X50 W14X108, W14X43 W18X35 W12X14
Notes:1. The basement floor (-1 level) has simple connections
Story/Floor COLUMNS BEAMS
Story/Floor COLUMNS COLUMNS
COLUMNS COLUMNS
POST-NORTHRIDGE DESIGNSNS Moment Resiting Frame NS Gravity Frames
Story/Floor
Table B-2 Cover Plate Details for LA Post-Northridge Model Buildings
W21X44 W24X55 W24X62 W24X84 W24X94 W27X94Top Plate W1x T1 5" x 1/2" 5" x 3/4" 5" x 3/4" 7" x 3/4" 7" x 3/4" 8" x 3/4"Bottom Plate W2 x T2 8" x 1/2" 9" x 3/8" 9" x 1/2" 11" x 5/8" 12" x 5/8" 11" x 5/8"
W27X102 W30X108 W30X116 W33X130 W33X141 W36X150Top Plate W1x T1 8-1/2" x 3/4" 9" x 3/4" 9" x 3/4" 9" x 1" 9" x 1" 10" x 1"Bottom Plate W2 x T2 12" x 5/8" 12" x 5/8" 12" x 3/4" 13" x 3/4" 13" x 3/4" 14" x 3/4"
Girder Section
Girder Section
TOP AND BOTTOM FLANGE COVER PLATE DETAILS
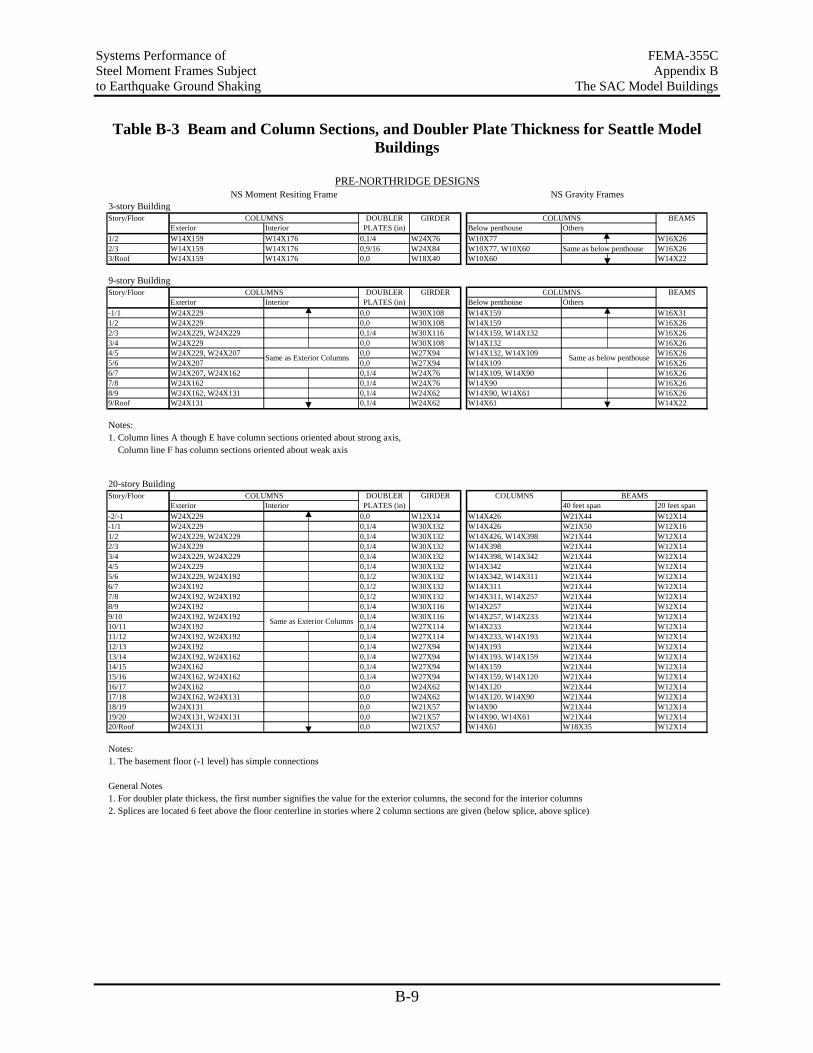
Systems Performance of FEMA-355C Steel Moment Frames Subject Appendix B to Earthquake Ground Shaking The SAC Model Buildings
B-9
Table B-3 Beam and Column Sections, and Doubler Plate Thickness for Seattle Model Buildings
3-story BuildingDOUBLER GIRDER BEAMS
Exterior Interior PLATES (in) Below penthouse Others1/2 W14X159 W14X176 0,1/4 W24X76 W10X77 W16X262/3 W14X159 W14X176 0,9/16 W24X84 W10X77, W10X60 Same as below penthouse W16X263/Roof W14X159 W14X176 0,0 W18X40 W10X60 W14X22
9-story BuildingDOUBLER GIRDER BEAMS
Exterior Interior PLATES (in) Below penthouse Others-1/1 W24X229 0,0 W30X108 W14X159 W16X311/2 W24X229 0,0 W30X108 W14X159 W16X262/3 W24X229, W24X229 0,1/4 W30X116 W14X159, W14X132 W16X263/4 W24X229 0,0 W30X108 W14X132 W16X264/5 W24X229, W24X207 0,0 W27X94 W14X132, W14X109 W16X265/6 W24X207 0,0 W27X94 W14X109 W16X266/7 W24X207, W24X162 0,1/4 W24X76 W14X109, W14X90 W16X267/8 W24X162 0,1/4 W24X76 W14X90 W16X268/9 W24X162, W24X131 0,1/4 W24X62 W14X90, W14X61 W16X269/Roof W24X131 0,1/4 W24X62 W14X61 W14X22
Notes:1. Column lines A though E have column sections oriented about strong axis, Column line F has column sections oriented about weak axis
20-story BuildingDOUBLER GIRDER COLUMNS
Exterior Interior PLATES (in) 40 feet span 20 feet span-2/-1 W24X229 0,0 W12X14 W14X426 W21X44 W12X14-1/1 W24X229 0,1/4 W30X132 W14X426 W21X50 W12X161/2 W24X229, W24X229 0,1/4 W30X132 W14X426, W14X398 W21X44 W12X142/3 W24X229 0,1/4 W30X132 W14X398 W21X44 W12X143/4 W24X229, W24X229 0,1/4 W30X132 W14X398, W14X342 W21X44 W12X144/5 W24X229 0,1/4 W30X132 W14X342 W21X44 W12X145/6 W24X229, W24X192 0,1/2 W30X132 W14X342, W14X311 W21X44 W12X146/7 W24X192 0,1/2 W30X132 W14X311 W21X44 W12X147/8 W24X192, W24X192 0,1/2 W30X132 W14X311, W14X257 W21X44 W12X148/9 W24X192 0,1/4 W30X116 W14X257 W21X44 W12X149/10 W24X192, W24X192 0,1/4 W30X116 W14X257, W14X233 W21X44 W12X1410/11 W24X192 0,1/4 W27X114 W14X233 W21X44 W12X1411/12 W24X192, W24X192 0,1/4 W27X114 W14X233, W14X193 W21X44 W12X1412/13 W24X192 0,1/4 W27X94 W14X193 W21X44 W12X1413/14 W24X192, W24X162 0,1/4 W27X94 W14X193, W14X159 W21X44 W12X1414/15 W24X162 0,1/4 W27X94 W14X159 W21X44 W12X1415/16 W24X162, W24X162 0,1/4 W27X94 W14X159, W14X120 W21X44 W12X1416/17 W24X162 0,0 W24X62 W14X120 W21X44 W12X1417/18 W24X162, W24X131 0,0 W24X62 W14X120, W14X90 W21X44 W12X1418/19 W24X131 0,0 W21X57 W14X90 W21X44 W12X1419/20 W24X131, W24X131 0,0 W21X57 W14X90, W14X61 W21X44 W12X1420/Roof W24X131 0,0 W21X57 W14X61 W18X35 W12X14
Notes:1. The basement floor (-1 level) has simple connections
General Notes1. For doubler plate thickess, the first number signifies the value for the exterior columns, the second for the interior columns2. Splices are located 6 feet above the floor centerline in stories where 2 column sections are given (below splice, above splice)
Same as Exterior Columns
Story/Floor COLUMNS BEAMS
Same as below penthouseSame as Exterior Columns
Story/Floor COLUMNS COLUMNS
COLUMNS COLUMNS
PRE-NORTHRIDGE DESIGNSNS Moment Resiting Frame NS Gravity Frames
Story/Floor
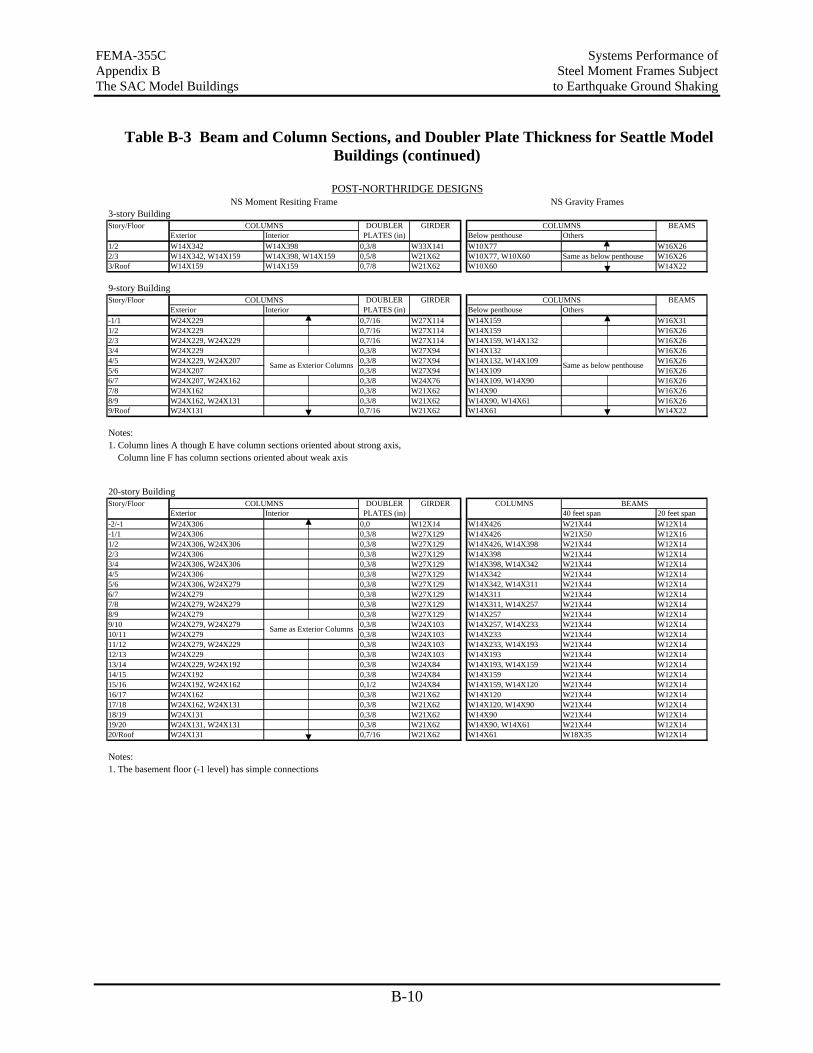
FEMA-355C Systems Performance of Appendix B Steel Moment Frames Subject The SAC Model Buildings to Earthquake Ground Shaking
B-10
Table B-3 Beam and Column Sections, and Doubler Plate Thickness for Seattle Model Buildings (continued)
3-story BuildingDOUBLER GIRDER BEAMS
Exterior Interior PLATES (in) Below penthouse Others1/2 W14X342 W14X398 0,3/8 W33X141 W10X77 W16X262/3 W14X342, W14X159 W14X398, W14X159 0,5/8 W21X62 W10X77, W10X60 Same as below penthouse W16X263/Roof W14X159 W14X159 0,7/8 W21X62 W10X60 W14X22
9-story BuildingDOUBLER GIRDER BEAMS
Exterior Interior PLATES (in) Below penthouse Others-1/1 W24X229 0,7/16 W27X114 W14X159 W16X311/2 W24X229 0,7/16 W27X114 W14X159 W16X262/3 W24X229, W24X229 0,7/16 W27X114 W14X159, W14X132 W16X263/4 W24X229 0,3/8 W27X94 W14X132 W16X264/5 W24X229, W24X207 0,3/8 W27X94 W14X132, W14X109 W16X265/6 W24X207 0,3/8 W27X94 W14X109 W16X266/7 W24X207, W24X162 0,3/8 W24X76 W14X109, W14X90 W16X267/8 W24X162 0,3/8 W21X62 W14X90 W16X268/9 W24X162, W24X131 0,3/8 W21X62 W14X90, W14X61 W16X269/Roof W24X131 0,7/16 W21X62 W14X61 W14X22
Notes:1. Column lines A though E have column sections oriented about strong axis, Column line F has column sections oriented about weak axis
20-story BuildingDOUBLER GIRDER COLUMNS
Exterior Interior PLATES (in) 40 feet span 20 feet span-2/-1 W24X306 0,0 W12X14 W14X426 W21X44 W12X14-1/1 W24X306 0,3/8 W27X129 W14X426 W21X50 W12X161/2 W24X306, W24X306 0,3/8 W27X129 W14X426, W14X398 W21X44 W12X142/3 W24X306 0,3/8 W27X129 W14X398 W21X44 W12X143/4 W24X306, W24X306 0,3/8 W27X129 W14X398, W14X342 W21X44 W12X144/5 W24X306 0,3/8 W27X129 W14X342 W21X44 W12X145/6 W24X306, W24X279 0,3/8 W27X129 W14X342, W14X311 W21X44 W12X146/7 W24X279 0,3/8 W27X129 W14X311 W21X44 W12X147/8 W24X279, W24X279 0,3/8 W27X129 W14X311, W14X257 W21X44 W12X148/9 W24X279 0,3/8 W27X129 W14X257 W21X44 W12X149/10 W24X279, W24X279 0,3/8 W24X103 W14X257, W14X233 W21X44 W12X1410/11 W24X279 0,3/8 W24X103 W14X233 W21X44 W12X1411/12 W24X279, W24X229 0,3/8 W24X103 W14X233, W14X193 W21X44 W12X1412/13 W24X229 0,3/8 W24X103 W14X193 W21X44 W12X1413/14 W24X229, W24X192 0,3/8 W24X84 W14X193, W14X159 W21X44 W12X1414/15 W24X192 0,3/8 W24X84 W14X159 W21X44 W12X1415/16 W24X192, W24X162 0,1/2 W24X84 W14X159, W14X120 W21X44 W12X1416/17 W24X162 0,3/8 W21X62 W14X120 W21X44 W12X1417/18 W24X162, W24X131 0,3/8 W21X62 W14X120, W14X90 W21X44 W12X1418/19 W24X131 0,3/8 W21X62 W14X90 W21X44 W12X1419/20 W24X131, W24X131 0,3/8 W21X62 W14X90, W14X61 W21X44 W12X1420/Roof W24X131 0,7/16 W21X62 W14X61 W18X35 W12X14
Notes:1. The basement floor (-1 level) has simple connections
COLUMNS COLUMNS
POST-NORTHRIDGE DESIGNSNS Moment Resiting Frame NS Gravity Frames
Story/Floor
Same as below penthouseSame as Exterior Columns
Story/Floor COLUMNS COLUMNS
Same as Exterior Columns
Story/Floor COLUMNS BEAMS
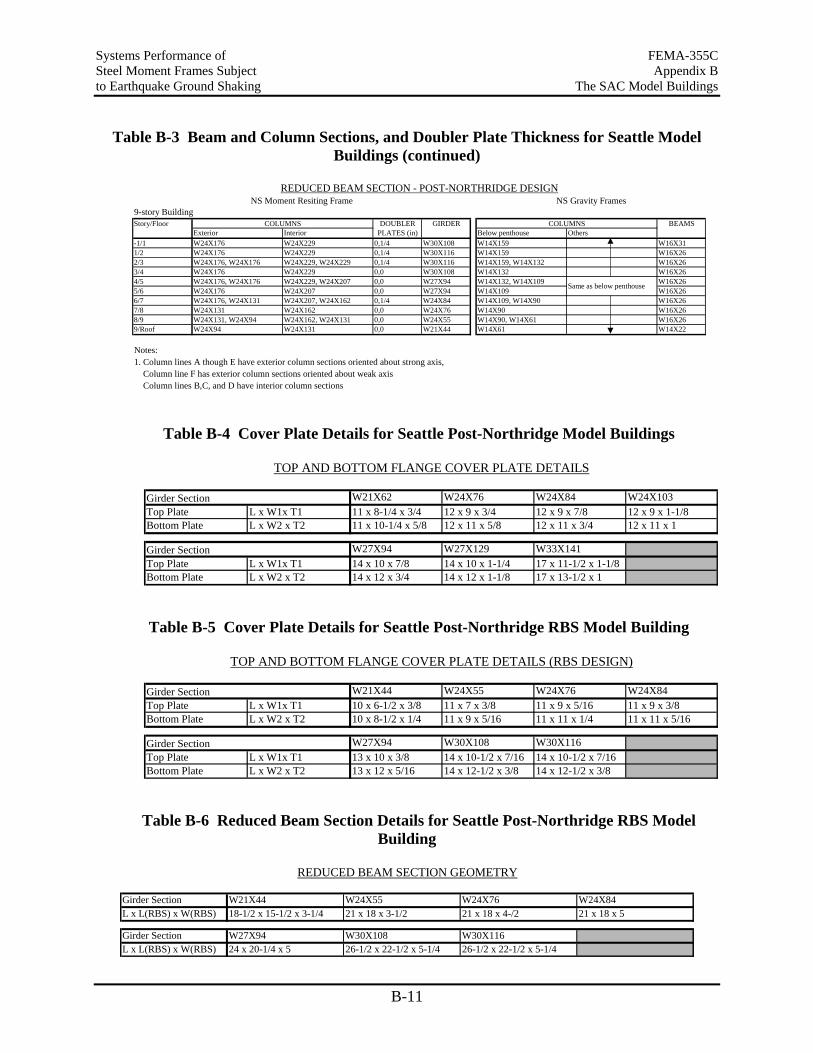
Systems Performance of FEMA-355C Steel Moment Frames Subject Appendix B to Earthquake Ground Shaking The SAC Model Buildings
B-11
Table B-3 Beam and Column Sections, and Doubler Plate Thickness for Seattle Model Buildings (continued)
9-story BuildingDOUBLER GIRDER BEAMS
Exterior Interior PLATES (in) Below penthouse Others-1/1 W24X176 W24X229 0,1/4 W30X108 W14X159 W16X311/2 W24X176 W24X229 0,1/4 W30X116 W14X159 W16X262/3 W24X176, W24X176 W24X229, W24X229 0,1/4 W30X116 W14X159, W14X132 W16X263/4 W24X176 W24X229 0,0 W30X108 W14X132 W16X264/5 W24X176, W24X176 W24X229, W24X207 0,0 W27X94 W14X132, W14X109 W16X265/6 W24X176 W24X207 0,0 W27X94 W14X109 W16X266/7 W24X176, W24X131 W24X207, W24X162 0,1/4 W24X84 W14X109, W14X90 W16X267/8 W24X131 W24X162 0,0 W24X76 W14X90 W16X268/9 W24X131, W24X94 W24X162, W24X131 0,0 W24X55 W14X90, W14X61 W16X269/Roof W24X94 W24X131 0,0 W21X44 W14X61 W14X22
Notes:1. Column lines A though E have exterior column sections oriented about strong axis, Column line F has exterior column sections oriented about weak axis Column lines B,C, and D have interior column sections
REDUCED BEAM SECTION - POST-NORTHRIDGE DESIGNNS Moment Resiting Frame NS Gravity Frames
Same as below penthouse
Story/Floor COLUMNS COLUMNS
Table B-4 Cover Plate Details for Seattle Post-Northridge Model Buildings
W21X62 W24X76 W24X84 W24X103Top Plate L x W1x T1 11 x 8-1/4 x 3/4 12 x 9 x 3/4 12 x 9 x 7/8 12 x 9 x 1-1/8Bottom Plate L x W2 x T2 11 x 10-1/4 x 5/8 12 x 11 x 5/8 12 x 11 x 3/4 12 x 11 x 1
W27X94 W27X129 W33X141Top Plate L x W1x T1 14 x 10 x 7/8 14 x 10 x 1-1/4 17 x 11-1/2 x 1-1/8Bottom Plate L x W2 x T2 14 x 12 x 3/4 14 x 12 x 1-1/8 17 x 13-1/2 x 1
Girder Section
Girder Section
TOP AND BOTTOM FLANGE COVER PLATE DETAILS
Table B-5 Cover Plate Details for Seattle Post-Northridge RBS Model Building
W21X44 W24X55 W24X76 W24X84Top Plate L x W1x T1 10 x 6-1/2 x 3/8 11 x 7 x 3/8 11 x 9 x 5/16 11 x 9 x 3/8Bottom Plate L x W2 x T2 10 x 8-1/2 x 1/4 11 x 9 x 5/16 11 x 11 x 1/4 11 x 11 x 5/16
W27X94 W30X108 W30X116Top Plate L x W1x T1 13 x 10 x 3/8 14 x 10-1/2 x 7/16 14 x 10-1/2 x 7/16Bottom Plate L x W2 x T2 13 x 12 x 5/16 14 x 12-1/2 x 3/8 14 x 12-1/2 x 3/8
Girder Section
Girder Section
TOP AND BOTTOM FLANGE COVER PLATE DETAILS (RBS DESIGN)
Table B-6 Reduced Beam Section Details for Seattle Post-Northridge RBS Model Building
Girder Section W21X44 W24X55 W24X76 W24X84L x L(RBS) x W(RBS) 18-1/2 x 15-1/2 x 3-1/4 21 x 18 x 3-1/2 21 x 18 x 4-/2 21 x 18 x 5
Girder Section W27X94 W30X108 W30X116L x L(RBS) x W(RBS) 24 x 20-1/4 x 5 26-1/2 x 22-1/2 x 5-1/4 26-1/2 x 22-1/2 x 5-1/4
REDUCED BEAM SECTION GEOMETRY
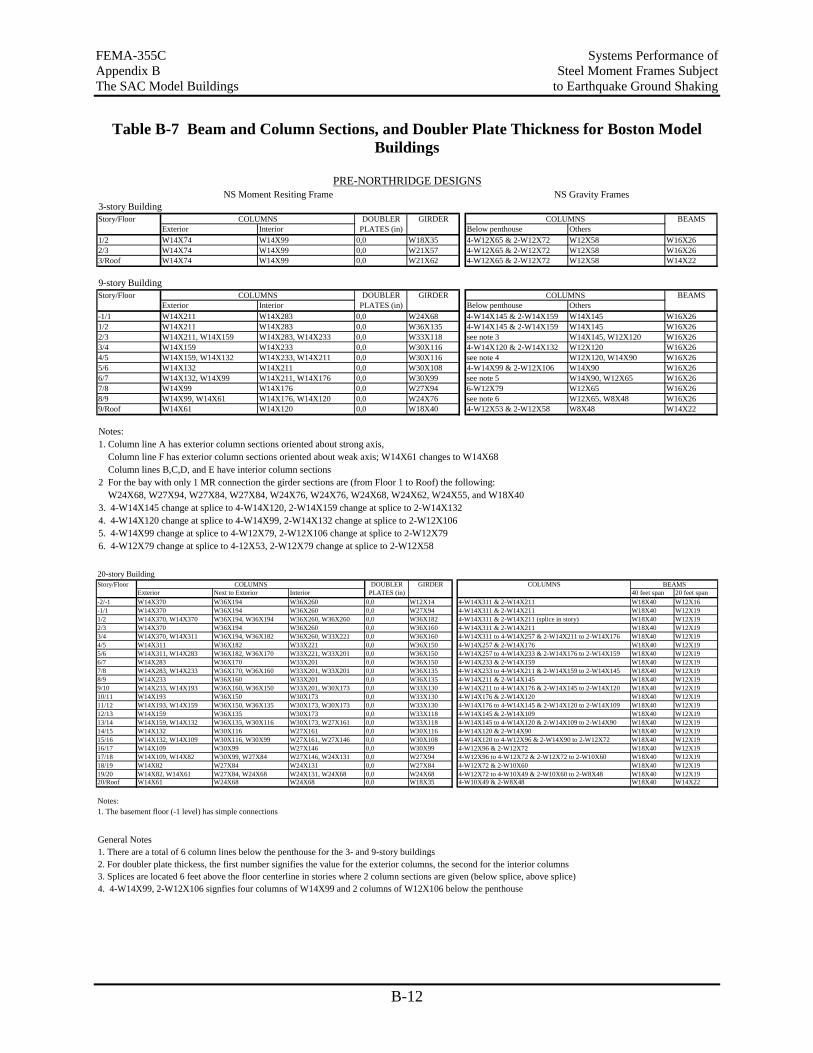
FEMA-355C Systems Performance of Appendix B Steel Moment Frames Subject The SAC Model Buildings to Earthquake Ground Shaking
B-12
Table B-7 Beam and Column Sections, and Doubler Plate Thickness for Boston Model Buildings
3-story BuildingDOUBLER GIRDER BEAMS
Exterior Interior PLATES (in) Below penthouse Others1/2 W14X74 W14X99 0,0 W18X35 4-W12X65 & 2-W12X72 W12X58 W16X262/3 W14X74 W14X99 0,0 W21X57 4-W12X65 & 2-W12X72 W12X58 W16X263/Roof W14X74 W14X99 0,0 W21X62 4-W12X65 & 2-W12X72 W12X58 W14X22
9-story BuildingDOUBLER GIRDER BEAMS
Exterior Interior PLATES (in) Below penthouse Others-1/1 W14X211 W14X283 0,0 W24X68 4-W14X145 & 2-W14X159 W14X145 W16X261/2 W14X211 W14X283 0,0 W36X135 4-W14X145 & 2-W14X159 W14X145 W16X262/3 W14X211, W14X159 W14X283, W14X233 0,0 W33X118 see note 3 W14X145, W12X120 W16X263/4 W14X159 W14X233 0,0 W30X116 4-W14X120 & 2-W14X132 W12X120 W16X264/5 W14X159, W14X132 W14X233, W14X211 0,0 W30X116 see note 4 W12X120, W14X90 W16X265/6 W14X132 W14X211 0,0 W30X108 4-W14X99 & 2-W12X106 W14X90 W16X266/7 W14X132, W14X99 W14X211, W14X176 0,0 W30X99 see note 5 W14X90, W12X65 W16X267/8 W14X99 W14X176 0,0 W27X94 6-W12X79 W12X65 W16X268/9 W14X99, W14X61 W14X176, W14X120 0,0 W24X76 see note 6 W12X65, W8X48 W16X269/Roof W14X61 W14X120 0,0 W18X40 4-W12X53 & 2-W12X58 W8X48 W14X22
Notes:1. Column line A has exterior column sections oriented about strong axis, Column line F has exterior column sections oriented about weak axis; W14X61 changes to W14X68 Column lines B,C,D, and E have interior column sections2 For the bay with only 1 MR connection the girder sections are (from Floor 1 to Roof) the following: W24X68, W27X94, W27X84, W27X84, W24X76, W24X76, W24X68, W24X62, W24X55, and W18X403. 4-W14X145 change at splice to 4-W14X120, 2-W14X159 change at splice to 2-W14X1324. 4-W14X120 change at splice to 4-W14X99, 2-W14X132 change at splice to 2-W12X1065. 4-W14X99 change at splice to 4-W12X79, 2-W12X106 change at splice to 2-W12X796. 4-W12X79 change at splice to 4-12X53, 2-W12X79 change at splice to 2-W12X58
Story/Floor COLUMNS COLUMNS
COLUMNS COLUMNS
PRE-NORTHRIDGE DESIGNSNS Moment Resiting Frame NS Gravity Frames
Story/Floor
20-story Building
DOUBLER GIRDER COLUMNSExterior Next to Exterior Interior PLATES (in) 40 feet span 20 feet span
-2/-1 W14X370 W36X194 W36X260 0,0 W12X14 4-W14X311 & 2-W14X211 W18X40 W12X16-1/1 W14X370 W36X194 W36X260 0,0 W27X94 4-W14X311 & 2-W14X211 W18X40 W12X191/2 W14X370, W14X370 W36X194, W36X194 W36X260, W36X260 0,0 W36X182 4-W14X311 & 2-W14X211 (splice in story) W18X40 W12X192/3 W14X370 W36X194 W36X260 0,0 W36X160 4-W14X311 & 2-W14X211 W18X40 W12X193/4 W14X370, W14X311 W36X194, W36X182 W36X260, W33X221 0,0 W36X160 4-W14X311 to 4-W14X257 & 2-W14X211 to 2-W14X176 W18X40 W12X194/5 W14X311 W36X182 W33X221 0,0 W36X150 4-W14X257 & 2-W14X176 W18X40 W12X195/6 W14X311, W14X283 W36X182, W36X170 W33X221, W33X201 0,0 W36X150 4-W14X257 to 4-W14X233 & 2-W14X176 to 2-W14X159 W18X40 W12X196/7 W14X283 W36X170 W33X201 0,0 W36X150 4-W14X233 & 2-W14X159 W18X40 W12X197/8 W14X283, W14X233 W36X170, W36X160 W33X201, W33X201 0,0 W36X135 4-W14X233 to 4-W14X211 & 2-W14X159 to 2-W14X145 W18X40 W12X198/9 W14X233 W36X160 W33X201 0,0 W36X135 4-W14X211 & 2-W14X145 W18X40 W12X199/10 W14X233, W14X193 W36X160, W36X150 W33X201, W30X173 0,0 W33X130 4-W14X211 to 4-W14X176 & 2-W14X145 to 2-W14X120 W18X40 W12X1910/11 W14X193 W36X150 W30X173 0,0 W33X130 4-W14X176 & 2-W14X120 W18X40 W12X1911/12 W14X193, W14X159 W36X150, W36X135 W30X173, W30X173 0,0 W33X130 4-W14X176 to 4-W14X145 & 2-W14X120 to 2-W14X109 W18X40 W12X1912/13 W14X159 W36X135 W30X173 0,0 W33X118 4-W14X145 & 2-W14X109 W18X40 W12X1913/14 W14X159, W14X132 W36X135, W30X116 W30X173, W27X161 0,0 W33X118 4-W14X145 to 4-W14X120 & 2-W14X109 to 2-W14X90 W18X40 W12X1914/15 W14X132 W30X116 W27X161 0,0 W30X116 4-W14X120 & 2-W14X90 W18X40 W12X1915/16 W14X132, W14X109 W30X116, W30X99 W27X161, W27X146 0,0 W30X108 4-W14X120 to 4-W12X96 & 2-W14X90 to 2-W12X72 W18X40 W12X1916/17 W14X109 W30X99 W27X146 0,0 W30X99 4-W12X96 & 2-W12X72 W18X40 W12X1917/18 W14X109, W14X82 W30X99, W27X84 W27X146, W24X131 0,0 W27X94 4-W12X96 to 4-W12X72 & 2-W12X72 to 2-W10X60 W18X40 W12X1918/19 W14X82 W27X84 W24X131 0,0 W27X84 4-W12X72 & 2-W10X60 W18X40 W12X1919/20 W14X82, W14X61 W27X84, W24X68 W24X131, W24X68 0,0 W24X68 4-W12X72 to 4-W10X49 & 2-W10X60 to 2-W8X48 W18X40 W12X1920/Roof W14X61 W24X68 W24X68 0,0 W18X35 4-W10X49 & 2-W8X48 W18X40 W14X22
Notes:1. The basement floor (-1 level) has simple connections
Story/Floor BEAMSCOLUMNS
General Notes1. There are a total of 6 column lines below the penthouse for the 3- and 9-story buildings2. For doubler plate thickess, the first number signifies the value for the exterior columns, the second for the interior columns3. Splices are located 6 feet above the floor centerline in stories where 2 column sections are given (below splice, above splice)4. 4-W14X99, 2-W12X106 signfies four columns of W14X99 and 2 columns of W12X106 below the penthouse
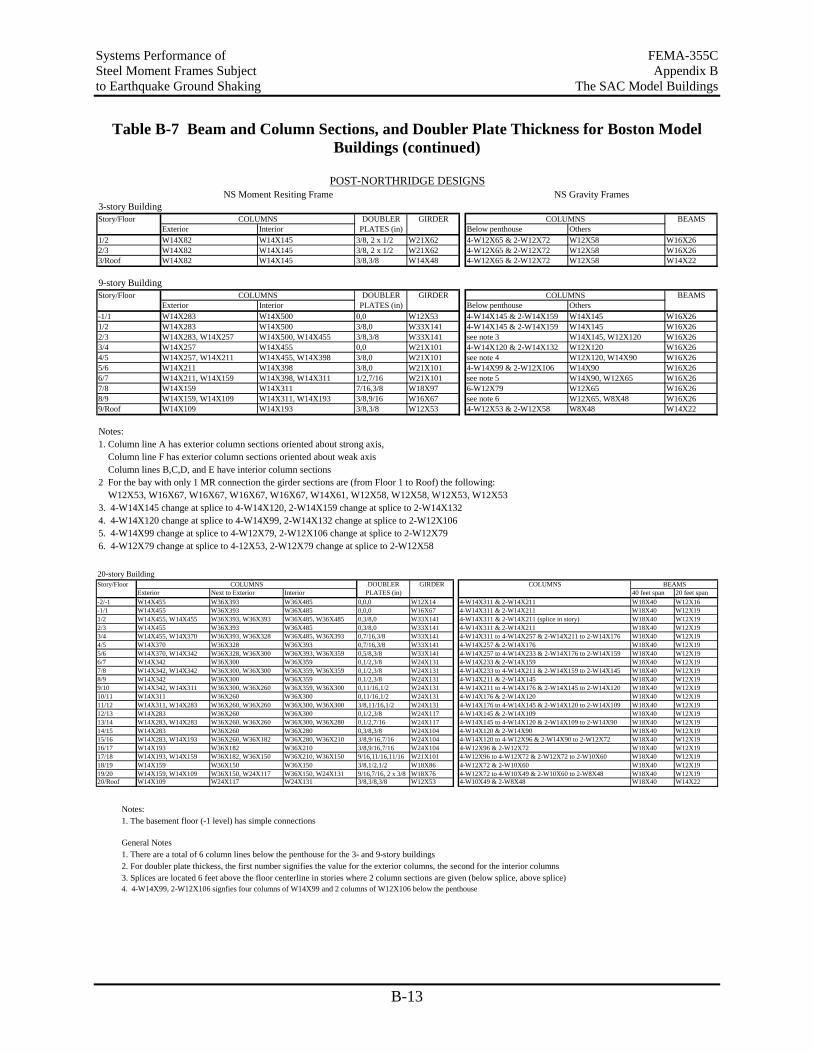
Systems Performance of FEMA-355C Steel Moment Frames Subject Appendix B to Earthquake Ground Shaking The SAC Model Buildings
B-13
Table B-7 Beam and Column Sections, and Doubler Plate Thickness for Boston Model Buildings (continued)
3-story BuildingDOUBLER GIRDER BEAMS
Exterior Interior PLATES (in) Below penthouse Others1/2 W14X82 W14X145 3/8, 2 x 1/2 W21X62 4-W12X65 & 2-W12X72 W12X58 W16X262/3 W14X82 W14X145 3/8, 2 x 1/2 W21X62 4-W12X65 & 2-W12X72 W12X58 W16X263/Roof W14X82 W14X145 3/8,3/8 W14X48 4-W12X65 & 2-W12X72 W12X58 W14X22
9-story BuildingDOUBLER GIRDER BEAMS
Exterior Interior PLATES (in) Below penthouse Others-1/1 W14X283 W14X500 0,0 W12X53 4-W14X145 & 2-W14X159 W14X145 W16X261/2 W14X283 W14X500 3/8,0 W33X141 4-W14X145 & 2-W14X159 W14X145 W16X262/3 W14X283, W14X257 W14X500, W14X455 3/8,3/8 W33X141 see note 3 W14X145, W12X120 W16X263/4 W14X257 W14X455 0,0 W21X101 4-W14X120 & 2-W14X132 W12X120 W16X264/5 W14X257, W14X211 W14X455, W14X398 3/8,0 W21X101 see note 4 W12X120, W14X90 W16X265/6 W14X211 W14X398 3/8,0 W21X101 4-W14X99 & 2-W12X106 W14X90 W16X266/7 W14X211, W14X159 W14X398, W14X311 1/2,7/16 W21X101 see note 5 W14X90, W12X65 W16X267/8 W14X159 W14X311 7/16,3/8 W18X97 6-W12X79 W12X65 W16X268/9 W14X159, W14X109 W14X311, W14X193 3/8,9/16 W16X67 see note 6 W12X65, W8X48 W16X269/Roof W14X109 W14X193 3/8,3/8 W12X53 4-W12X53 & 2-W12X58 W8X48 W14X22
Notes:1. Column line A has exterior column sections oriented about strong axis, Column line F has exterior column sections oriented about weak axis Column lines B,C,D, and E have interior column sections2 For the bay with only 1 MR connection the girder sections are (from Floor 1 to Roof) the following: W12X53, W16X67, W16X67, W16X67, W16X67, W14X61, W12X58, W12X58, W12X53, W12X533. 4-W14X145 change at splice to 4-W14X120, 2-W14X159 change at splice to 2-W14X1324. 4-W14X120 change at splice to 4-W14X99, 2-W14X132 change at splice to 2-W12X1065. 4-W14X99 change at splice to 4-W12X79, 2-W12X106 change at splice to 2-W12X796. 4-W12X79 change at splice to 4-12X53, 2-W12X79 change at splice to 2-W12X58
POST-NORTHRIDGE DESIGNSNS Moment Resiting Frame NS Gravity Frames
Story/Floor
Story/Floor COLUMNS COLUMNS
COLUMNS COLUMNS
20-story Building
DOUBLER GIRDER COLUMNSExterior Next to Exterior Interior PLATES (in) 40 feet span 20 feet span
-2/-1 W14X455 W36X393 W36X485 0,0,0 W12X14 4-W14X311 & 2-W14X211 W18X40 W12X16-1/1 W14X455 W36X393 W36X485 0,0,0 W16X67 4-W14X311 & 2-W14X211 W18X40 W12X191/2 W14X455, W14X455 W36X393, W36X393 W36X485, W36X485 0,3/8,0 W33X141 4-W14X311 & 2-W14X211 (splice in story) W18X40 W12X192/3 W14X455 W36X393 W36X485 0,3/8,0 W33X141 4-W14X311 & 2-W14X211 W18X40 W12X193/4 W14X455, W14X370 W36X393, W36X328 W36X485, W36X393 0,7/16,3/8 W33X141 4-W14X311 to 4-W14X257 & 2-W14X211 to 2-W14X176 W18X40 W12X194/5 W14X370 W36X328 W36X393 0,7/16,3/8 W33X141 4-W14X257 & 2-W14X176 W18X40 W12X195/6 W14X370, W14X342 W36X328, W36X300 W36X393, W36X359 0,5/8,3/8 W33X141 4-W14X257 to 4-W14X233 & 2-W14X176 to 2-W14X159 W18X40 W12X196/7 W14X342 W36X300 W36X359 0,1/2,3/8 W24X131 4-W14X233 & 2-W14X159 W18X40 W12X197/8 W14X342, W14X342 W36X300, W36X300 W36X359, W36X359 0,1/2,3/8 W24X131 4-W14X233 to 4-W14X211 & 2-W14X159 to 2-W14X145 W18X40 W12X198/9 W14X342 W36X300 W36X359 0,1/2,3/8 W24X131 4-W14X211 & 2-W14X145 W18X40 W12X199/10 W14X342, W14X311 W36X300, W36X260 W36X359, W36X300 0,11/16,1/2 W24X131 4-W14X211 to 4-W14X176 & 2-W14X145 to 2-W14X120 W18X40 W12X1910/11 W14X311 W36X260 W36X300 0,11/16,1/2 W24X131 4-W14X176 & 2-W14X120 W18X40 W12X1911/12 W14X311, W14X283 W36X260, W36X260 W36X300, W36X300 3/8,11/16,1/2 W24X131 4-W14X176 to 4-W14X145 & 2-W14X120 to 2-W14X109 W18X40 W12X1912/13 W14X283 W36X260 W36X300 0,1/2,3/8 W24X117 4-W14X145 & 2-W14X109 W18X40 W12X1913/14 W14X283, W14X283 W36X260, W36X260 W36X300, W36X280 0,1/2,7/16 W24X117 4-W14X145 to 4-W14X120 & 2-W14X109 to 2-W14X90 W18X40 W12X1914/15 W14X283 W36X260 W36X280 0,3/8,3/8 W24X104 4-W14X120 & 2-W14X90 W18X40 W12X1915/16 W14X283, W14X193 W36X260, W36X182 W36X280, W36X210 3/8,9/16,7/16 W24X104 4-W14X120 to 4-W12X96 & 2-W14X90 to 2-W12X72 W18X40 W12X1916/17 W14X193 W36X182 W36X210 3/8,9/16,7/16 W24X104 4-W12X96 & 2-W12X72 W18X40 W12X1917/18 W14X193, W14X159 W36X182, W36X150 W36X210, W36X150 9/16,11/16,11/16 W21X101 4-W12X96 to 4-W12X72 & 2-W12X72 to 2-W10X60 W18X40 W12X1918/19 W14X159 W36X150 W36X150 3/8,1/2,1/2 W18X86 4-W12X72 & 2-W10X60 W18X40 W12X1919/20 W14X159, W14X109 W36X150, W24X117 W36X150, W24X131 9/16,7/16, 2 x 3/8 W18X76 4-W12X72 to 4-W10X49 & 2-W10X60 to 2-W8X48 W18X40 W12X1920/Roof W14X109 W24X117 W24X131 3/8,3/8,3/8 W12X53 4-W10X49 & 2-W8X48 W18X40 W14X22
Story/Floor BEAMSCOLUMNS
Notes:1. The basement floor (-1 level) has simple connections
General Notes1. There are a total of 6 column lines below the penthouse for the 3- and 9-story buildings2. For doubler plate thickess, the first number signifies the value for the exterior columns, the second for the interior columns3. Splices are located 6 feet above the floor centerline in stories where 2 column sections are given (below splice, above splice)4. 4-W14X99, 2-W12X106 signfies four columns of W14X99 and 2 columns of W12X106 below the penthouse
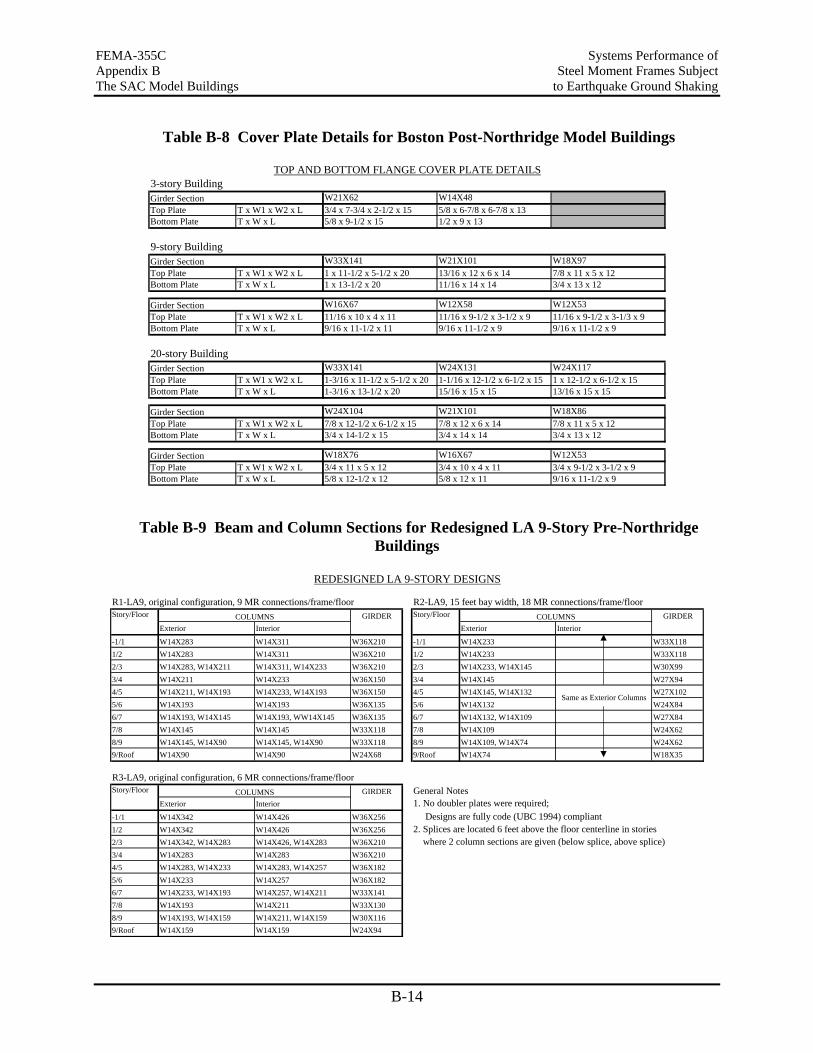
FEMA-355C Systems Performance of Appendix B Steel Moment Frames Subject The SAC Model Buildings to Earthquake Ground Shaking
B-14
Table B-8 Cover Plate Details for Boston Post-Northridge Model Buildings
3-story BuildingW21X62 W14X48
Top Plate T x W1 x W2 x L 3/4 x 7-3/4 x 2-1/2 x 15 5/8 x 6-7/8 x 6-7/8 x 13Bottom Plate T x W x L 5/8 x 9-1/2 x 15 1/2 x 9 x 13
9-story BuildingW33X141 W21X101 W18X97
Top Plate T x W1 x W2 x L 1 x 11-1/2 x 5-1/2 x 20 13/16 x 12 x 6 x 14 7/8 x 11 x 5 x 12Bottom Plate T x W x L 1 x 13-1/2 x 20 11/16 x 14 x 14 3/4 x 13 x 12
W16X67 W12X58 W12X53Top Plate T x W1 x W2 x L 11/16 x 10 x 4 x 11 11/16 x 9-1/2 x 3-1/2 x 9 11/16 x 9-1/2 x 3-1/3 x 9Bottom Plate T x W x L 9/16 x 11-1/2 x 11 9/16 x 11-1/2 x 9 9/16 x 11-1/2 x 9
20-story BuildingW33X141 W24X131 W24X117
Top Plate T x W1 x W2 x L 1-3/16 x 11-1/2 x 5-1/2 x 20 1-1/16 x 12-1/2 x 6-1/2 x 15 1 x 12-1/2 x 6-1/2 x 15Bottom Plate T x W x L 1-3/16 x 13-1/2 x 20 15/16 x 15 x 15 13/16 x 15 x 15
W24X104 W21X101 W18X86Top Plate T x W1 x W2 x L 7/8 x 12-1/2 x 6-1/2 x 15 7/8 x 12 x 6 x 14 7/8 x 11 x 5 x 12Bottom Plate T x W x L 3/4 x 14-1/2 x 15 3/4 x 14 x 14 3/4 x 13 x 12
W18X76 W16X67 W12X53Top Plate T x W1 x W2 x L 3/4 x 11 x 5 x 12 3/4 x 10 x 4 x 11 3/4 x 9-1/2 x 3-1/2 x 9Bottom Plate T x W x L 5/8 x 12-1/2 x 12 5/8 x 12 x 11 9/16 x 11-1/2 x 9
Girder Section
Girder Section
Girder Section
TOP AND BOTTOM FLANGE COVER PLATE DETAILS
Girder Section
Girder Section
Girder Section
Table B-9 Beam and Column Sections for Redesigned LA 9-Story Pre-Northridge Buildings
R1-LA9, original configuration, 9 MR connections/frame/floor R2-LA9, 15 feet bay width, 18 MR connections/frame/floorGIRDER GIRDER
Exterior Interior Exterior Interior
-1/1 W14X283 W14X311 W36X210 -1/1 W14X233 W33X1181/2 W14X283 W14X311 W36X210 1/2 W14X233 W33X1182/3 W14X283, W14X211 W14X311, W14X233 W36X210 2/3 W14X233, W14X145 W30X993/4 W14X211 W14X233 W36X150 3/4 W14X145 W27X944/5 W14X211, W14X193 W14X233, W14X193 W36X150 4/5 W14X145, W14X132 W27X1025/6 W14X193 W14X193 W36X135 5/6 W14X132 W24X846/7 W14X193, W14X145 W14X193, WW14X145 W36X135 6/7 W14X132, W14X109 W27X847/8 W14X145 W14X145 W33X118 7/8 W14X109 W24X628/9 W14X145, W14X90 W14X145, W14X90 W33X118 8/9 W14X109, W14X74 W24X629/Roof W14X90 W14X90 W24X68 9/Roof W14X74 W18X35
R3-LA9, original configuration, 6 MR connections/frame/floorGIRDER General Notes
Exterior Interior 1. No doubler plates were required; -1/1 W14X342 W14X426 W36X256 Designs are fully code (UBC 1994) compliant1/2 W14X342 W14X426 W36X256 2. Splices are located 6 feet above the floor centerline in stories 2/3 W14X342, W14X283 W14X426, W14X283 W36X210 where 2 column sections are given (below splice, above splice)3/4 W14X283 W14X283 W36X2104/5 W14X283, W14X233 W14X283, W14X257 W36X1825/6 W14X233 W14X257 W36X1826/7 W14X233, W14X193 W14X257, W14X211 W33X1417/8 W14X193 W14X211 W33X1308/9 W14X193, W14X159 W14X211, W14X159 W30X1169/Roof W14X159 W14X159 W24X94
REDESIGNED LA 9-STORY DESIGNS
Story/Floor COLUMNS
Story/Floor COLUMNS
Story/Floor COLUMNS
Same as Exterior Columns
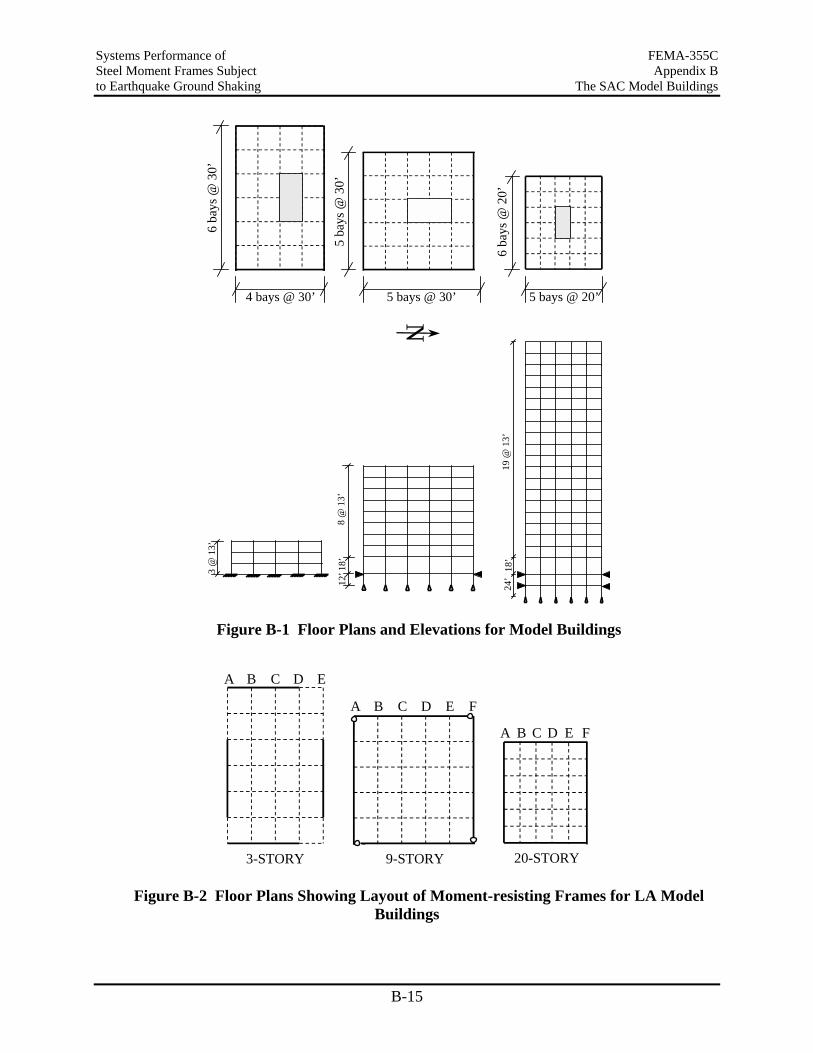
Systems Performance of FEMA-355C Steel Moment Frames Subject Appendix B to Earthquake Ground Shaking The SAC Model Buildings
B-15
4 bays @ 30’
6 ba
ys @
30’
5 bays @ 30’
5 ba
ys @
30’
5 bays @ 20’
6 ba
ys @
20’
3 @
13’
8 @
13’
18’
12’
19 @
13’
18’
24’
N
Figure B-1 Floor Plans and Elevations for Model Buildings
3-STORY 9-STORY 20-STORY
A B C D E
A B C D E F
A B C D E F
Figure B-2 Floor Plans Showing Layout of Moment-resisting Frames for LA Model Buildings
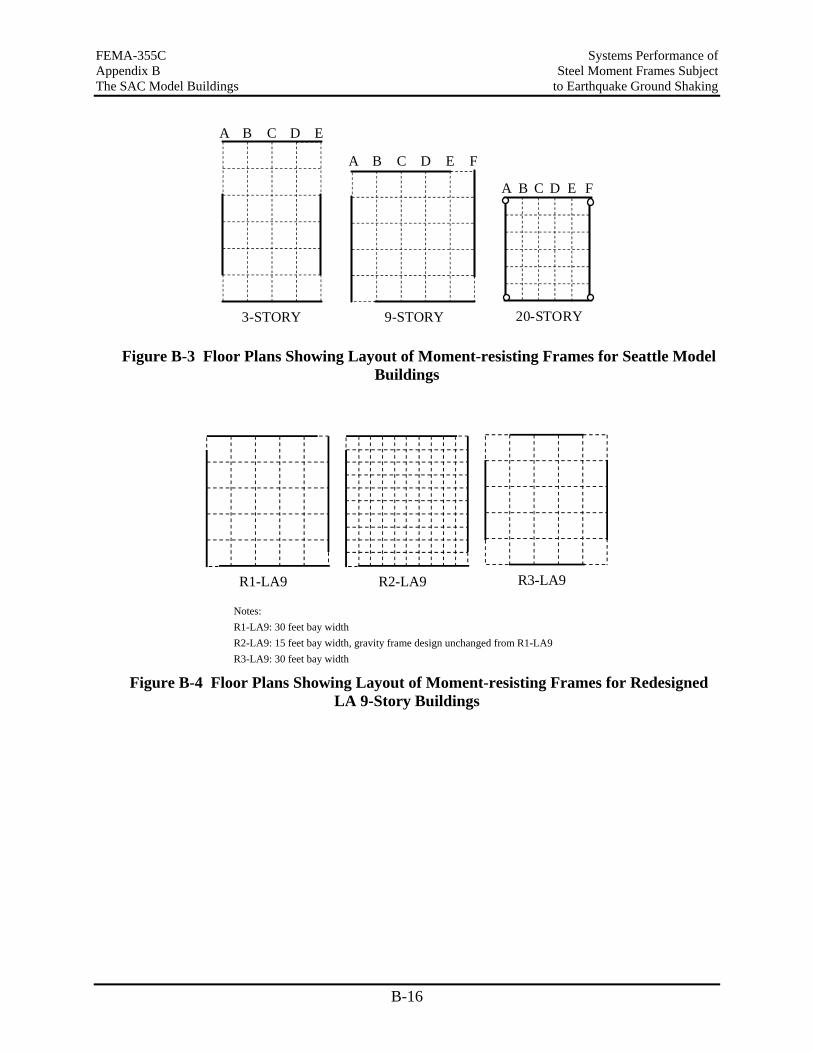
FEMA-355C Systems Performance of Appendix B Steel Moment Frames Subject The SAC Model Buildings to Earthquake Ground Shaking
B-16
3-STORY 9-STORY 20-STORY
A B C D E
A B C D E F
A B C D E F
Figure B-3 Floor Plans Showing Layout of Moment-resisting Frames for Seattle Model Buildings
R1-LA9 R2-LA9 R3-LA9 Notes: R1-LA9: 30 feet bay width R2-LA9: 15 feet bay width, gravity frame design unchanged from R1-LA9 R3-LA9: 30 feet bay width
Figure B-4 Floor Plans Showing Layout of Moment-resisting Frames for Redesigned LA 9-Story Buildings
Systems Performance of Steel Moment Frames Subject FEMA-355C to Earthquake Ground Shaking References, FEMA Reports, SAC Reports, and Acronyms
R-1
REFERENCES, FEMA REPORTS, SAC REPORTS, AND ACRONYMS References.
Ackroyd, M.H., and Gerstle, K., 1982, "Behavior of Type 2 Steel Frames", Journal of the Structural Division, ASCE, Vol. 108, No. ST7, pp. 1541-1558.
AISC, 1997, Seismic Provisions for Structural Steel Buildings, American Institute of Steel Construction.
Akiyama, H., 1985, Earthquake-Resistant Limit-State Design for Buildings, University of Tokyo Press, 1985.
Alavi, B., and Krawinkler, H., 2000, “Consideration of Near-Fault Ground Motion Effects in Seismic Design,” Proceedings of the 12th World Conference on Earthquake Engineering, Auckland, New Zealand.
Alavi, B., and H. Krawinkler., 1999, Structural Design Implications of Near-Fault Ground Motion, Kajima-CUREe Research Report 1999.12.
Altman, W.G., Azizinamini, A., Bradburn, J.H., and Radziminski, J.B., 1982, Moment-Rotation Characteristics of Semi-Rigid Steel Beam-to-Column Connections, Department of Civil Engineering, University of South Carolina, Columbia, SC.
Anderson, J.C., and Bertero, V.V., 1987, "Uncertainties in Establishing Design Earthquakes," Journal of Structural Engineering, ASCE, Vol. 113, No. 8.
Astaneh, A., 1989, “Demand and Supply of Ductility in Steel Shear Connections,” Journal of Construct. Steel Research, Vol. 14.
Astaneh-Asl, A., Nader, M.N., and Harriott, J.D., 1991, "Seismic Behavior and Design Considerations in Semi-Rigid Frames," Proceedings of the 1991 National Steel Construction Conference, AISC..
Astaneh, A., McMullin, K. M., and Call, S. M., 1993, “Behavior and Design of Steel Single Plate Shear Connections,” Journal of Structural Engineering, Vol. 119, No. 8.
Astaneh-Asl, A., 1995, “Seismic Design of Bolted Steel Moment-Resisting Frames,” Steel Tips, Structural Steel Education Council, Moraga, CA, 82 pp.
ATC-3, 1978, "Tentative Provisions for the Development of Seismic Regulations for Buildings," Applied Technology Council.
ATC-40, 1996, "Methodology for Seismic Evaluation and Upgrade of Concrete Structures," Applied Technology Council.
Attalla, M.R., Deierlein, G.G., and McGuire, W., 1996, "Nonlinear Frame Analysis with Torsional-Flexural Member Behavior," SSRC 5th International Colloquium, Chicago, IL.
Attiogbe, E., and Morris, G., 1991, "Moment-Rotation Functions for Steel Connections," Journal of Structural Engineering, ASCE, Vol. 117, No. 6.
Bernal, D., 1987, “Amplification Factors for Inelastic Dynamic P-∆ Effects in Earthquake Analysis,” Earthquake Engineering and Structural Dynamics., Vol. 15, pp. 635-651.
Bernal, D., 1998, “Instability of Buildings During Seismic Response,” Engineering Structures., Vol. 20, Nos. 4-6, pp. 496-502.
Systems Performance of FEMA-355C Steel Moment Frames Subject References, FEMA Reports, SAC Reports, and Acronyms to Earthquake Ground Shaking
R-2
Bertero R.D., and Bertero, V.V., 1992, "Tall Reinforced Concrete Buildings: Conceptual Earthquake Resistant Design Methodology," Report No. UCB/EERC-92/16, Earthquake Engineering Research Center (EERC), University of California at Berkeley.
Bertero R. D., 1995, “Inelastic Torsion for Preliminary Seismic Design”, Journal of Structural Engineering.,ASCE, V121(n8), p1183(7)
Bertero, V.V., Anderson, J.C., Krawinkler, H., and Miranda, E., 1991, "Design Guidelines For Ductility and Drift Limits," Report No. UCB/EERC-91/15, Earthquake Engineering Research Center (EERC), University of California at Berkeley.
Bertero, V.V., and Uang, C.M., 1992, "Issues and Future Directions in the Use of An Energy Approach for Seismic-Resistant Design of Structures," Nonlinear Seismic Analysis and Design of Reinforced Concrete Buildings, Edited by P. Fajfar and H. Krawinkler, Elsevier Applied Science, London and New York.
Bertero, V. V., Anderson, J. C., and Krawinkler, H., 1994, “Performance of Steel Buildings Structures During the Northridge Earthquake,” Report No. UCB/EERC-94/09, Earthquake Engineering Research Center (EERC), University of California at Berkeley.
Bertero, V. V., 1997, “Performance-Based Seismic Engineering: a Critical Review of Proposed Guidelines,” Seismic Design Methodologies for the Next Generation of Codes, Edited by P. Fajfar and H. Krawinkler, A. A. Balkema, Rotterdam.
Bjorhovde, R., Colson, A., and Brozzetti, J., 1990, "Classification System for Beam-to-Column Connections," Journal of Structural Engineering, ASCE, Vol. 116, No. 11.
Blackman, B., and Popov, E. P., 1995, “Studies in Steel Moment Resisting Beam-to-Column Connections for Seismic-Resistant Design,” Report No. UCB/EERC-95/11, Earthquake Engineering Research Center (EERC), University of California at Berkeley.
BOCA, 1993, “National Building Code,” 12th Edition, Building Officials & Code Administrators International, Inc.
Bondy, D. K., 1996, “A More Rational Approach to Capacity Design of Seismic Moment Frame Columns,” Earthquake Spectra, Vol. 12, No. 3.
Bonowitz, D., and Maison, B.F., 1998, “Are Steel Frames Safe? Probabilistic Seismic Evaluation of Existing WSMF Buildings,” Proceedings of the Sixth U.S. National Conference on Earthquake Engineering, Seattle, Washington.
Bruneau, M., Mahin, S. A., and Popov, E. P., 1987, “Ultimate Behavior of Butt Welded Splices in Heavy Rolled Steel Sections,” Report No. UCB/EERC-87/10, Earthquake Engineering Research Center (EERC), University of California at Berkeley.
Bruneau, M., and Mahin, S.A., 1990a, "Ultimate Behavior of Heavy Steel Section Welded Splices and Design Implications," Journal of Structural Engineering, ASCE, Vol. 116, No. 8.
Bruneau, M., and Mahin, S.A., 1990b, "Normalized Inelastic Response Of Structures Having Eccentricities in Plan," Journal of Structural Engineering, ASCE, Vol. 116, No. 12.
Cai, C.S., Liu, X.L., and Chen, W.F., 1991, "Further Verification of Beam-Column Strength Equations," Journal of Structural Engineering, ASCE, Vol. 117, No. 2.
Carlson, A.E., and Hall, J.F., 1997, “Three-Dimensional Non-Linear Analyses of a 17 Story Building,” Unpublished report provided to SAC.
Challa, V.R.M., and Hall, J.F., 1994, “Earthquake Collapse Analysis of Steel Frames”, Earthquake Engineering and Structural Dynamics, Vol. 23, No. 11, November 1994, pp. 1199-1218.
Systems Performance of Steel Moment Frames Subject FEMA-355C to Earthquake Ground Shaking References, FEMA Reports, SAC Reports, and Acronyms
R-3
Chen, W.F., and Atsuta, T., 1976, "Theory of Beam-Columns," Vols. 1 and 2, McGraw-Hill, New York.
Chen, P.F., and Powell, G.H., 1982, “Generalized Plastic Hinge Concepts for 3D Beam-Column Elements,” Report No. UCB/EERC-82/20, Earthquake Engineering Research Center (EERC), University of California at Berkeley.
Chi, W.M., El-Tawil, S., Deierlein, G.G., and Abel, J.F., 1997, "Inelastic Seismic Analysis of a 17 Story Steel Building Damaged in Northridge," Engineering Structures, Elsevier, Vol. 20, No. 4-6, pp. 481-495.
Choi, J., Stojadinovic, B., and Goel, S.C., 2000, “Parametric Tests on the Free Flange Connections,” Report SAC/BD-00/02, SAC Joint Venture.
Chopra, A.K., 1995, Dynamics of Structures: Theory and Applications to Earthquake Engineering, Prentice Hall, New Jersey
Cofie, N.G., and Krawinkler, H., 1985, "Uniaxial Cyclic Stress-Strain Behavior of Structural Steel," Journal of Engineering Mechanics, ASCE, Vol. lll, No. 9.
Collins, K. R., 1995) “A Reliability-Based Dual Level Seismic Design Procedure for Building Structures,” Earthquake Spectra, Vol. 11, No. 3.
Collins, K. R., Wen, Y. K., and Foutch, D. A., 1996, “An Alternative Seismic Design Procedure for Standard Buildings,” Proc. Eleventh World Conference on Earthquake Engineering, Acapulco, Mexico.
Cornell, C.A., 1996a, “Calculating Building Seismic Performance Reliability; a Basis for Multi-Level Design Norms,” Proceedings: Eleventh World Conference on Earthquake Engineering, Acapulco, Mexico.
Cornell, C.A., 1996b, “Reliability-Based Earthquake-Resistant Design; the Future,” Proc. Eleventh World Conference on Earthquake Engineering, Acapulco, Mexico.
Cornell, C.A., and Luco, N., 1999, “The Effect of Connection Fractures on Steel Moment Resisting Frame Seismic Demands and Safety,” SAC Background Document, Report No. SAC/BD-99/03.
Cosenza, E., Manfredi, G., and Ramasco, K., 1990, "An Evaluation of the Use of Damage Functionals in Earthquake Resistant Design," Proceedings, 9th European Conference on Earthquake Engineering, Moscow, July 1990.
Cuevas Barajas, L., 1962, "Comportamiento de la Estuctura de la Torre Latinoamericana de la Ciudad de Mexico," published in La Torre Latinoamericana, 1983.
Deierlein, G.G., and Yhao D., 1992, "Static and Dynamic Analysis of Steel Frames with Nonlinear Connections And Joint Effects," Proceedings of Structures Congress 1992, ASCE.
De la Llera, J.C., and Chopra, A.K., 1995, "Understanding the Inelastic Seismic Behavior of Asymmetric-Plan Buildings," Earthquake Engineering and Structural Dynamics, Vol. 24, No.4.
De la Llera, J. C. and Chopra A. K., 1996, “Inelastic Behavior of Asymmetric Multistory Buildings”, Journal of Structural Engineering, ASCE, V122(n6), pp597(10)
Duan, L., and Chen, W.F., 1989, "Design Interaction Equations for Steel Beam-Columns," Journal of Structural Engineering, ASCE, Vol. 115, No. 5.
Systems Performance of FEMA-355C Steel Moment Frames Subject References, FEMA Reports, SAC Reports, and Acronyms to Earthquake Ground Shaking
R-4
Elwood, K. J., and Wen, Y. K., 1996, “Evaluation of a Dual-Level Design Approach for the Earthquake Resistant Design of Buildings,” Proceedings of the Eleventh World Conference on Earthquake Engineering, Acapulco, Mexico.
Fajfar, P. and Fischinger, M., 1988, “N2 - a Method for Non-Linear Seismic Analysis of Regular Structures,” Proceedings of the 9th World Conference on Earthquake Engineering, Vol. 5, Tokyo, Japan.
Fajfar, P., and Krawinkler, H., 1992, Nonlinear Seismic Analysis and Design of Reinforced Concrete Buildings, Elsevier Applied Science, London and New York.
Fajfar, P., and Vidic, T., 1994, "Consistent Inelastic Design Spectra: Hysteretic and Input Energy," Earthquake Engineering and Structural Dynamics, Vol. 23.
FEMA 222A, 1995, 1994 Edition: NEHRP Recommended Provisions for Seismic Regulations for New Buildings, Federal Emergency Management Agency.
FEMA 223A, 1995, 1994 Edition: NEHRP Recommended Provisions for Seismic Regulations for New Buildings, Part 2 - Commentary, Federal Emergency Management Agency.
FEMA-267, 1995, Interim Guidelines, Inspection, Evaluation, Repair, Upgrade and Design of Welded Moment Resisting Steel Structures, prepared by the SAC Joint Venture for the Federal Emergency Management Agency, Washington, DC. Superseded by FEMA 350 to 353
FEMA-267A, 1996, Interim Guidelines Advisory No. 1, prepared by the SAC Joint Venture for the Federal Emergency Management Agency, Washington, DC. Superseded by FEMA 350 to 353
FEMA-267B, 1999, Interim Guidelines Advisory No. 2, prepared by the SAC Joint Venture for the Federal Emergency Management Agency, Washington, DC. Superseded by FEMA 350 to 353
FEMA 273, 1997, "NEHRP Guidelines for the Seismic Rehabilitation of Buildings," Federal Emergency Management Agency.
FEMA 274, 1997, NEHRP Commentary on the Guidelines for the Seismic Rehabilitation of Buildings, Federal Emergency Management Agency.
FEMA 288, 1997, Background Reports: Metallurgy, Fracture Mechanics, Welding, Moment Connections and Frame Systems Behavior, Federal Emergency Management Agency.
FEMA 302, 1997, 1997 Edition: NEHRP Recommended Provisions for Seismic Regulations for New Buildings, Federal Emergency Management Agency
FEMA 303, 1997, 1997 Edition: NEHRP Recommended Provisions for Seismic Regulations For New Buildings, Part 2 – Commentary, Federal Emergency Management Agency
Foutch, D. A., and S. Shi., 1996, Connection Element, Type 10 for DRAIN-2DX, University of Illinois.
Frye, M.J., and Morris, G.A., 1975, "Analysis of Flexibly Connected Steel Frames," Canadian Journal of Civil Engineering, 2(3)
Fuyama, H., Krawinkler, H., and Law, K.H., 1993, “Computer Assisted Conceptual Structural Design of Steel Buildings,” John A. Blume Earthquake Engineering Research Center Report No. 107, Department of Civil Engineering, Stanford University.
Ghobarah, A., Osman, A., and Korol, R.M., 1990, "Behavior of Extended End-Plate Connections Under Cyclic Loading," Engineering Structures, Vol. 12, No. 1.
Systems Performance of Steel Moment Frames Subject FEMA-355C to Earthquake Ground Shaking References, FEMA Reports, SAC Reports, and Acronyms
R-5
Goel, R.K., and Chopra, A.K., 1991, "Effects of Plan Asymmetry in Inelastic Seismic Response of One-Story Systems," Journal of Structural Engineering, ASCE, Vol. 117, No. 5.
Goel, R.K., and Chopra, A.K., 1993, "Seismic Code Analysis of Buildings Without Locating Centers of Rigidity," Journal of Structural Engineering, ASCE, Vol. 119, No. 10.
Goel, R.K., and Chopra, A.K., 1997, “Period Formulas for Moment-Resisting Frame Buildings,” Journal of Structural Engineering, ASCE, Vol. 123, No. 11.
Graham, J.D., Sherbourne, A.N., Khabbaz, R.N., and Jensen, C.D., 1959, "Welded Interior Beam-to-Column Connections," AISC Publication, A.I.A. File No. 13-C.
Gupta, A., and Krawinkler, H., 1998, "Effect of stiffness Degradation on Deformation Demands for SDOF And MDOF Structures," Proceedings of the 6th US National Conference on Earthquake Engineering, May 31 - June 4, 1998, Seattle, Washington.
Gupta, A., and Krawinkler, H., 1998a, "Influence of Design Parameters on Connection Demands," Proceedings of the First International Congress of Structural Engineers, July 19-23, 1998, San Francisco.
Gupta, A., and Krawinkler, H., 1999, “Prediction of Seismic Demands for SMRFS With Ductile Connections And Elements,” SAC Background Document, Report No. SAC/BD-99/06.
Gupta, A., and Krawinkler, H., 2000, “Dynamic P-Delta Effects for Flexible Inelastic Steel Structures,” ASCE Journal of Structural Engineering, Vol. 126, No. 1.
Hahn G. D. and Liu X., 1994, “Torsional Response Of Unsymmetric Buildings to Incoherent Ground Motions,” Journal of Structural Engineering, ASCE, V120(n4), p.1158(24)
Hajjar, J.F., Leon, R.T., Gustafson, M.A., and Shield, C.K., 1998, "Seismic Response of Composite Moment-Resisting Connections. II. Behavior," Journal of Structural Engineering, ASCE, Vol. 124, No. 8, August, pp. 877-885.
Hall, J.F., 1998, “Effects of Northridge and Larger Earthquakes on a City of Steel Frame Buildings,” Proceedings of the NEHRP Conference and Workshop on Research on the Northridge, California Earthquake of January 17, 1994, California Universities for Research in Earthquake Engineering, CUREe), Richmond, California, Vol. III-B, pages III-570 --III-577.
Hall, J.F., 1998a, “Seismic Response of Steel Frame Buildings to Near-Source Ground Motions,” Earthquake Engineering & Structural Dynamics, Vol. 27, No. 12, pp. 1445-1464.
Heaton, T.H., Hall, J.F., Wald, D.J., and Halling, M.W., 1995, "Response of High-Rise and Base-Isolated Buildings to a Hypothetical Mw7.0 Blind Thrust Earthquake," Science, Vol. 267, January.
Heredia Z. E. and Barranco F., 1996, “Torsion in Symmetric Structures Due to Ground-Motion Spatial Variation”, Journal of Engineering Mechanics, ASCE, V22(n9), p834(10)
Hsieh, S. H. and Deierlein, G. G., 1991, “Nonlinear Analysis of Three-Dimensional Steel Frames with Semi-Rigid Connections”, Computers & Structures, 41, 5, pp. 995-1009.
Idriss I.M., 1991, "Earthquake Ground Motions at Soft Soil Sites" Second International Conference on Recent Advances in Geotechnical Earthquake Engineering on Soil Dynamics, St. Louis, Missouri, March 1991.
Kasai, K., Maison, B.F., and Mayangarum, A., 1999, “Effects of Partially Restrained Connection Stiffness and Strength on Frame Seismic Performance,” SAC/BD-99/17, SAC Joint Venture.
Systems Performance of FEMA-355C Steel Moment Frames Subject References, FEMA Reports, SAC Reports, and Acronyms to Earthquake Ground Shaking
R-6
Kato, B., Aoki, H., and Tagawa, Y., 1984, “Seismic Behavior of Steel Frames with Composite Girders,” Proceedings, 8th World Conference on Earthquake Engineering, San Francisco, Vol. VI.
Kilar, V. and Fajfar, P., 1997, “Simple Push-Over Analysis of Asymmetric Buildings,” Earthquake Engineering and Structural Dynamics, Vol. 26, pp. 233-249.
Kilic, S.A., 1996, "Stability Issues in Frames Under Lateral Loads," Ph.D. Dissertation, Department of Civil Engineering, Stanford University.
Kim, K., and Engelhardt, M.D., 1995, “Development of Analytical Models for Earthquake Analysis of Steel Moment Frames,” Report No. PMFSEL 95-2, Dept. of Civil Engineering, University of Texas at Austin.
Kishi, N., and Chen, W.F., 1990, "Moment-Rotation Relations of Semirigid Connections with Angles," Journal of Structural Engineering, ASCE, Vol. 116, No. 7.
Krawinkler, H., Bertero, V.V., and Popov, E.P., 1971, "Inelastic Behavior of Steel Beam-to-Column Subassemblages," Report No. UCB/EERC-71/7, Earthquake Engineering Research Center (EERC), University of California at Berkeley.
Krawinkler, H., 1978, "Shear Design of Steel Frame Joints," Engineering Journal, AISC, Vol. 15, No. 3.
Krawinkler, H., et al., 1983, "Recommendations for Experimental Studies on the Seismic Behavior of Steel Components and Materials," John A. Blume Earthquake Engineering Center, Report No. 61, Department of Civil Engineering, Stanford University.
Krawinkler, H., and Zohrei, M., 1983, "Cumulative Damage in Steel Structures Subjected to Earthquake Ground Motions," Journal on Computers and Structures, Vol. 16, No. 1-4.
Krawinkler, H., and Mohasseb, S., 1987, "Effects of Panel Zone Deformations on Seismic Response," Journal of Constructional Steel Research, Elsevier Applied Science Publishers, England, Vol. 8.
Krawinkler, H., 1994, "New Trends in Seismic Design Methodology," Proceedings of the 10th European Conference in Earthquake Engineering, Vienna, Austria.
Krawinkler, H., and Al-Ali, A., 1996, "Seismic Demand Evaluation for a 4-Story Steel Frame Structure Damaged in the Northridge Earthquake," The Structural Design of Tall Buildings, Vol. 5, Number 1, 1996, pp. 1-27.
Krawinkler, H., 1996, "Pushover Analysis: Why, How, When, and When Not to Use it," Proceedings of the 1996 Convention of the Structural Engineers Association of California, Maui, Hawaii, October 2-4, 1996, pp. 17-36.
Krawinkler, H., 1996a, "Earthquake Design And Structural Performance Of Steel Structures," Bulletin of the New Zealand National Society for Earthquake Engineering, Vol. 29, No. 4, December, pp.229-241.
Krawinkler, H.,, 1997, "System Behavior of Structural Steel Frames Subjected to Earthquake Ground Motion," FEMA-288, Program to Reduce the Earthquake Hazards of Steel Moment Frame Structures- Background Reports, 1997, pp. 6-1 to 6-42.
Krawinkler, H., 1998, "Issues and Challenges in Performance-Based Seismic Design," Proceedings of the First International Congress of Structural Engineers, July 19-23, 1998, San Francisco.
Systems Performance of Steel Moment Frames Subject FEMA-355C to Earthquake Ground Shaking References, FEMA Reports, SAC Reports, and Acronyms
R-7
Krawinkler, H., and Seneviratna, G.D.P.K., 1998, “Pros and Cons of a Pushover Analysis for Seismic Performance Evaluation,” Journal of Engineering Structures, Vol. 20, No. 4-6, April-June, pp. 452-464.
Krawinkler, H., and Gupta, A., 1998, "Story Drift Demands for Steel Moment Frame Structures in Different Seismic Regions," Proceedings of the 6th US National Conference on Earthquake Engineering, May 31 - June 4, 1998, Seattle, Washington.
Krawinkler, H., and Gupta, A., 1998a, "Deformation and Ductility Demands in Steel Moment Frame Structures," Stability and Ductility of Steel Structures, T. Usami and Y Itoh, Editors, Pergamon, Elsevier Science Ltd., pp. 167-178.
Krawinkler, H., and Gupta, A., 1998b, "Modeling Issues in Evaluating Nonlinear Response for Steel Moment Frame Structures," Proceedings of the 11th European Conference on Earthquake Engineering, Paris, France, Sept. 6-11, 1998.
Kunnath, S.K., 1995, "Enhancements to program IDARC: "Modeling Inelastic Behavior of Welded Connections in Steel Moment-Resisting Frames," Report NIST GCR 95-673, National Institute of Standards and Technology, US Department of Commerce, Gaithersburg, MD.
Kunnath, S.K., 2000, "IDASS - A Program for Inelastic Damage Analysis of Structural Systems," Technical Report, Department of Civil Engineering, University of Central Florida, Orlando.
Lawson, R.S., Vance, V. and Krawinkler, H., 1994, “Nonlinear Static Push-over Analysis - Why, When, and How?” Proceedings of the 5th U. S. Conference in Earthquake Engineering, Vol. 1, Chicago, IL.
Lawson, R.S., and Krawinkler, H., 1994, "Cumulative Damage Potential of Seismic Ground Motion," Proceedings of the 10th European Conference in Earthquake Engineering, Vienna, Austria.
Lee, S.J., and Lu, L.W., 1989, “Cyclic Tests of Full-scale Composite Joint Subassemblages,” Journal of Structural Engineering, ASCE, Vol. 115, No. 8.
Leon, R.T., and Forcier, G.P., 1991, "Performance of Semi-Rigid Composite Frames," Proceedings of the 1991 Annual Technical Session, SSRC.
Leon, R.T., 1995, "Seismic Performance of Bolted And Riveted Connections," in Background Reports on Metallurgy, Fracture Mechanics, Welding, Moment Connections and Frame System Behavior, SAC Report 95-09, SAC Joint Venture.
Leon, R.T., Hoffman, J.J., and Steager, T., 1996, Partially Restrained Composite Connections,” Steel Design Guide Series No. 8, AISC, Chicago.
Leon, R.T., 1997, "Partially Restrained Connections," Chapter 4 in Handbook of Structural Steel Connection Design and Behavior, WA. Tamboli, ed., McGraw-Hill, New York, pp. 237-286.
Leon, R.T., 1998, "Analysis and Design Problems for PR Composite Frames Subjected to Seismic Loads," Engineering Structures, Vol. 20, N. 2-4, pp. 364-371.
Leon, R.T., Hajjar, J.F., and Gustafson, M.A., 1998, "Seismic Response of Composite Moment-Resisting Connections. I. Performance," Journal of Structural Engineering, ASCE, Vol. 124, No. 8, August, pp. 868-876.
Li, Y., and Mau S.T., 1997, “Learning From Recorded Earthquake Motion of Buildings,” Journal of Structural Engineering, ASCE, V123(n1), p62(8)
Systems Performance of FEMA-355C Steel Moment Frames Subject References, FEMA Reports, SAC Reports, and Acronyms to Earthquake Ground Shaking
R-8
Liew, J.Y.R., White, D.W., and Chen, W.F., 1993a, "Second-Order Refined Plastic-Hinge Analysis for Frame Design. Part I," J. of Structural Engineering, ASCE, Vol. 119, No. 11.
Liew, J.Y.R., White, D.W., and Chen, W.F., 1993b, "Second-Order Refined Plastic-Hinge Analysis for Frame Design. Part II," J. of Structural Engineering, ASCE, Vol. 119, No. 11.
Liew, J.Y.R., and Chen, W.F., 1995, “Analysis and Design of Steel Frames Considering Panel Joint Deformations,” Journal of Structural Engineering, ASCE, Vol. 121, No. 10.
Liu, J., and Astaneh-Asl, A., 2000, Cyclic tests on Simple Connections Including Effects of The Slab, Report SAC/BD-00/03, SAC Joint Venture.
Lopez O.A. and Torres R., 1997, “The Critical Angle of Seismic Incidence and the Maximum Structural Response,” EESD,, 26, 881-894.
LRFD, 1994, "Manual of Steel Construction, Load & Resistance Factor Design, Volume I - Seismic Provisions for Structural Steel Buildings," American Institute of Steel Construction, Chicago, IL.
Lu, L.W., Wang, S.J., and Lee, S.J., 1988, "Cyclic Behavior of Steel and Composite Joints With Panel Zone Deformation," Proceedings of the 9th World Conference on Earthquake Engineering, Vol. IV, Tokyo-Kyoto, Japan.
Luco, N., and Cornell, C.A., 1997, “Numerical Example of the Proposed SAC Procedure for Assessing the Annual Exceedance Probabilities of Specified Drift Demands and of Drift Capacity,” Internal SAC Report.
Luco, N., and Cornell, C.A., 1998a, “Effects of Random Connection Fractures on the Demands and Reliability For a 3-Story Pre-Northridge SMRF Structure,” Proc. of the Sixth US National Conference on Earthquake Engineering. Seattle, Washington.
Luco, N., and Cornell, C.A., 1998b, “Seismic Drift Demands for Two SMRF Structures with Brittle Connections,” First International Congress of Structural Engineers, San Francisco, California.
Luco, N. and Cornell, C.A., 2000), “Effects of Connection Fractures on SMRF Seismic Drift Demands,” ASCE Journal of Structural Engineering, Vol. 126, No. 1.
MacRae, G.A., 1994, “P-∆ Effects on Single-Degree-of-Freedom Structures in Earthquakes,” Earthquake Spectra, Vol. 10, No. 3.
MacRae, G.A., 1999, “Parametric Study on the Effect of Ground Motion Intensity and Dynamic Characteristics on Seismic Demands in Steel Moment-Resisting Frames,” SAC Background Document, Report No. SAC/BD-99/01.
MacRae, G.A., Fields, D., and Mattheis, J., 2000, “Ground Motion Characteristic Effects on Multistory Steel Frame Response,” Proceedings, 12WCEE, Auckland, New Zealand.
MacRae, G.A., and Mattheis, J.E., 2000), “Inelastic Behavior of a Three-Dimensional Steel Moment Resisting Building to Near-Fault Ground Motions,” ASCE Journal of Structural Engineering, Vol. 126, No. 1.
Maison, B., and Kasai, K., 1997, “Analysis of Northridge Damaged Thirteen-Story WSMF Building”, Earthquake Spectra, Volume 13, No. 3.
Maison, B., and Bonowitz, D., 1999, “Opinion Paper: How Safe Are Pre-Northridge WSMFs? A Case Study of the SAC Los Angeles 9-Story Building”, accepted for publication in Earthquake Spectra, EERI.
Systems Performance of Steel Moment Frames Subject FEMA-355C to Earthquake Ground Shaking References, FEMA Reports, SAC Reports, and Acronyms
R-9
Maison, B.F., and Kasai, K., 1999, “Seismic Performance of 3 And 9 Story Partially Restrained Moment Frame Buildings,” SAC/BD-99/16, SAC Joint Venture.
Maison, B., Rex, C.O., Lindsey, S.D., and Kasai, K., 2000, Performance of PR Moment Frame Buildings in UBC Seismic Zones 3 and 4,” ASCE Journal of Structural Engineering, Vol. 126, No. 1.
Marusic, D. and Fajfar, P., 1999, “Influence of Asymmetry on Seismic Response of Moment-Resisting Steel Frames,” in Stability and Ductility of Steel Structures, D.Dubina and M.Ivanyi, editors, Elsevier, pp. 401-408.
McCabe, S.L., and Hall, W.J., 1989, “Assessment of Seismic Structural Damage,” Journal of Structural Engineering, Vol. 115, No. 9.
McGuire, W., 1988, "Introduction to Special Issue on Steel Beam-Column Building Connections," Special Issue on Steel Beam-to-Column Building Connections, Journal for Construction. Steel Research, Vol. 10.
Meek, J.L., and Lin, W.J., 1990, "Geometric and Material Nonlinear Analysis of Thin-Walled Beam-Columns," Journal of Structural Engineering, ASCE, Vol. 116, No. 6.
Menun C. and Der Kiureghian, A., 1998, “A Replacement for the 30%, 40% and SRSS Rules for Multi-Component Seismic Excitation,” Earthquake Spectra, 14(1), p153-164.
Miranda, E., 1991, "Seismic Evaluation and Upgrading of Existing Buildings," Ph.D. Dissertation, Dept. of Civil Engineering, University of California, Berkeley.
Miranda, E., 1993, "Evaluation of Site-Dependent Inelastic Seismic Design Spectra," Journal of Structural Engineering, ASCE, Vol. 119, No. 5.
Miranda, E., 1993a, "Site-dependent Strength-Reduction Factors," Journal of Structural Engineering, ASCE, Vol. 119, No. 12.
Miranda, E., and Bertero, V.V., 1994, "Evaluation of Strength Reduction Factors for Earthquake-Resistant Design," Earthquake Spectra, EERI, Vol. 10, No. 2.
Miranda, E., 1997, “Estimation of Maximum Interstory Drift Demands in Displacement-Based Design,” Seismic Design Methodologies for the Next Generation of Codes, Edited by P. Fajfar and H. Krawinkler, A. A. Balkema, Rotterdam.
Mittal, A.K., and Jain, A.K., 1995, "Effective Strength Eccentricity Concept For Inelastic Analysis of Asymmetric Structures," Earthquake Engineering and Structural Dynamics, Vol. 24, No. 1.
Moehle, J.P., 1992, "Displacement Based Design of RC Structures," Proceedings of the 10th World Conference on Earthquake Engineering, Vol. 8, Madrid, Spain.
Murray, T.M., and Watson, D.P., 1996, "Strength of Moment End-Plate Connections with Multiple Rows at the Beam Tension Flange,” Connections in Steel Structures III: Behaviour, Strength and Design, R. Bjorhovde et al., eds., Elsevier Applied Science, London.
Nader, M.N., and Astaneh-Asl, A., 1991, "Dynamic Behavior of Flexible, Semi-Rigid and Rigid Steel Frames," Journal of Constructional Steel Research, Vol. 18, pp. 179-192.
Naeim, F., Skliros, S., Reinhorn, A.M., and Sivaselvan, M.V., 1999, “Effect of Hysteretic Deterioration Characteristics on Seismic Response of Moment Resisting Steel Structures,” SAC/BD-99/18, SAC Joint Venture.
Nakamura T. and Nakamura Y., 1993, “Stiffness design of 3-D Shear Buildings for Specified Seismic Drifts”, Journal of Structural Engineering, ASCE, V119(n1), p.50(19)
Systems Performance of FEMA-355C Steel Moment Frames Subject References, FEMA Reports, SAC Reports, and Acronyms to Earthquake Ground Shaking
R-10
Nakashima, M., 1991, "Statistical Evaluation of Strength of Steel Beam Columns," Journal of Structural Engineering, ASCE, Vol. 117, No. 11.
Nakashima, M., 1994, "Variation of Ductility Capacity of Steel Beam-Columns," Journal of Structural Engineering, ASCE, Vol. 120, No. 7.
Nakashima, M., and Sawaizumi, S., 2000, “Column-to-Beam Strength Ratio Required for Ensuring Beam-Collapse Mechanisms in Earthquake Response of Steel Moment Frames, Proceedings, 12WCEE, Auckland, New Zealand, paper #1109/6/A.
Nassar, A.A., and Krawinkler, H., 1991, "Seismic Demands for SDOF and MDOF Systems," John A. Blume Earthquake Engineering Center Report No. 95, Department of Civil Engineering, Stanford University.
Osteraas, J.D. and Krawinkler, H., 1990, "Strength and Ductility Considerations in Seismic Design," John A. Blume Earthquiake Engineering Research Center Report No. 90, Department of Civil Engineering, Stanford University.
Park, R., and Paulay, T.,1975, “Reinforced Concrete Structures,” John Wiley & Sons. Park, Y. J., Ang, A.H.-S., and Wen, Y.K., 1984, “Seismic Damage Analysis and Damage-
Limiting Design of R.C. Buildings,” Structural Engineering Research Series No. 516, Civil Engineering Studies, University of Illinois at Urbana-Champaign.
Popov, E.P., and Pinkney, R.B., 1969, "Cyclic Yield Reversals on Steel Building Connections," Journal of the Structural Division, ASCE, Vol. 95, No. 3.
Popov, E.P., and Stephen, R.M., 1970, "Cyclic Loading of Full-Scale Steel Connections," Report No. UCB/EERC-70/3, Earthquake Engineering Research Center (EERC), University of California at Berkeley.
Popov, E.P., and Stephen, R.M., 1976, Tensile Capacity Of Partial Penetration Welds, Report No. UCB/EERC-76/3, Earthquake Engineering Research Center (EERC), University of California at Berkeley.
Popov, E.P., Blondet, M., and Stepanov, L., 1996, Application of Dog-Bones for Improvement of Seismic Behavior of Steel Connections, Report No. UCB/EERC-96/05, Earthquake Engineering Research Center (EERC), University of California at Berkeley.
Powell G.H. and Campbell S., 1994, DRAIN-3DX Base Program Description and User Guide Version 1.10, Department of Civil Engineering, University of California, Berkeley, Report No. UCB/SEMM-94/07&08.
Qi, X., and Moehle, J.P., 1991, Displacement Design Approach for Reinforced Concrete Structures Subjected to Earthquakes, Report No. UCB/EERC-91/02, Earthquake Engineering Research Center (EERC), University of California at Berkeley.
Rahnama, M., and Krawinkler, H., 1993, Effects of Soft Soils and Hysteresis Models on Seismic Design Spectra, John A. Blume Earthquake Engineering Center, Report No. 108, Department of Civil Engineering, Stanford University.
Rahnama, M., and Krawinkler, H., 1994a, “Amplification of Seismic Demands in Linear and Nonlinear Soft Soils,” Proceedings of the 5th U.S. National Conference on Earthquake Engineering, Vol. II, Chicago, IL.
Rahnama, M., and Krawinkler, H., 1994b, "Effects of P-Delta and Strength Deterioration on SDOF Strength Demands," Proceedings of the 10th European Conference in Earthquake Engineering, Vienna, Austria.
Systems Performance of Steel Moment Frames Subject FEMA-355C to Earthquake Ground Shaking References, FEMA Reports, SAC Reports, and Acronyms
R-11
Ren, W.X., and Zeng, Q.Y., 1997, “Interactive Buckling Behavior and Ultimate Load of I-Section Steel Columns,” Journal of Structural Engineering, Vol. 123, No. 9
Rentschler, G.P., Chen, W.F., and Driscoll, G.C., 1980, "Tests of Beam-to-Column Web Moment Connections," Journal of the Structural Division, ASCE, Vol. 106, No. 5.
Roeder, C.W., Schneider, S.P., and Carpenter, J.E., 1993, "Seismic Behavior of Moment-Resisting Steel Frames: Analytical Study," Journal of Structural Engineering, ASCE, Vol. 119, No. 6.
Roeder, C.W., and Foutch, D., 1996, “Experimental Results for Seismic Resistant Steel Moment Frame Connections,” Journal of Structural Engineering, Vol. 122, No. 6
Roeder, C.W., 2000, State of the Art Report on Connection performance, Report No. SAC-2005, SAC Joint Venture.
Ryan, K., and Hall, J.F., 1998, “Aspects of Building Response to Near-Source Ground Motions,” Structural Engineering World Wide 1998, Elsevier Science Ltd., Oxford, England, Paper T162-5.
SAC 95-04, Parts 1 and 2, 1995, Technical Report: Analytical and Field Investigations of Buildings Affected by The Northridge Earthquake of January 17, 1994, part of FEMA phase I SAC project, Report No. 95-04
SAC 95-06, 1995, Technical Report: Surveys and Assessment of Damage to Buildings Affected by the Northridge earthquake of July 17, 1994, part of FEMA phase I SAC project, Report No. 95-06
SAC 96-01, Parts 1 and 2, 1996, Technical Report: Experimental Investigations of Beam-Column Subassemblages, part of FEMA phase I SAC project, Report No. 96-01
SAC 96-02,, 1996, “Connection Test Summaries,” SAC Technical Report 96-02. Sadek, A.W., and Tso, W.K., 1988, "Strength Eccentricity Concept for Inelastic Analysis of
Asymmetric Structures," Proceedings of the 9th World Conference on Earthquake Engineering, Tokyo, Japan.
Saiidi, M., and Sozen, M.A., 1981, "Simple Nonlinear Seismic Analysis of R/C Structures”, Journal of the Structural Division, ASCE, Vol. 107, No. 5.
Schneider, S.P., and Amidi, A., 1998, “Seismic behavior of steel frames with deformable panel zones,” Journal of Structural Engineering, ASCE, Vol. 124, No. 1.
SEAOC Vision 2000, 1995, “A Framework for Performance Based Design, Volumes I, II, & III,” Structural Engineers Association of California, SEAOC,
Seneviratna, G.D.P.K., and Krawinkler, H., 1997, “Evaluation of Inelastic MDOF Effects for Seismic Design,” John A. Blume Earthquake Engineering Center Report No. 120, Department of Civil Engineering, Stanford University.
Shome, N., et al., 1997, “Earthquake Records and Nonlinear MDOF Responses,” Report No. RMS-29, Dept. of Civil Engineering, Stanford University.
Shome, N., and Cornell, C. A., 1998, “Normalization and Scaling Accelerograms for Nonlinear Structural Analysis”, 6th U.S. National Conference on Earthquake Engineering.
Sivaselvan, M.V., Skliros, K., Reinhorn, A.M, 1998, “Multi-Linear and Smooth Hysteretic Model for Inelastic Analysis Of Deteriorating Structures”, International Symposium on Impact and Friction of Solids, Structures and Machines, June 27-30, 1998, Ottawa, Ontario.
Systems Performance of FEMA-355C Steel Moment Frames Subject References, FEMA Reports, SAC Reports, and Acronyms to Earthquake Ground Shaking
R-12
Sivakumaran, K.S., and Chen, S., 1994, "Seismic Behavior of Type PR Steel Frames," Proceedings of the Structures Congress 1994, ASCE.
Sohal, I.S., and Syed, N.A., 1992, "Inelastic Amplification Factor for Design of Steel Beam-Columns," Journal of Structural Engineering, ASCE, Vol. 118, No. 7.
Somerville, P., Smith, N., Punyamurthula, S., and Sun, J., 1997, Development of Ground Motion Time Histories for Phase 2 of the FEMA/SAC Steel Project, SAC Background Document, Report No. SAC/BD-97/04.
Somerville, P.G., 1998, “Development of an Improved Ground Motion Representation for Near Fault Ground Motions,” SMIP98 Seminar on Utilization of Strong-Motion Data, Oakland, CA.
Song, J., and Ellingwood, B., 1998, “Seismic Reliability Evaluation of Steel Frames with Damaged Welded Connections,” Ph.D. Dissertation, Department of Civil Engineering, The Johns Hopkins University.
SSPC, 1994, "Statistical Analysis of Tensile Data for Wide Flange Structural Shapes," Steel Shape Producers Council.
SSRC, 1998, Guide to Stability Design Criteria for Metal Structures, Structural Stability Research Council, 5th Ed., J. Wiley & Sons, New York.
Tagawa, Y., Kato, B., and Aoki, H., 1989, “Behavior of Composite Beams in Steel Frame Under Hysteretic Loading,” Journal of Structural Engineering, ASCE, Vol. 115, No. 8.
Tsai, K.C., and Popov, E.P., 1988, Steel beam-Column Joints in Seismic Moment Resisting Frames, Report No. UCB/EERC-88/19, Earthquake Engineering Research Center (EERC), University of California at Berkeley.
Tsai, K.C., and Popov, E.P., 1990, "Cyclic Behavior of End-Plate Moment Connections," Journal of Structural Engineering, ASCE, Vol. 116, No. 11.
Tsai, K.C., and Popov, E.P., 1990a, "Seismic Panel Zone Design Effect on Seismic Story Drift in Steel Frames," Journal of Structural Engineering, ASCE, Vol. 116, No. 12.
Tso, W.K., and Zhu, T.J., 1992, "Design of Torsionally Unbalanced Structural Systems Based on Code Provisions. I: Ductility Demand," Earthquake Engineering and Structural Dynamics, Vol. 21.
Uang, C.M., 1991, "Establishing R, or, Rw, and Cd Factors for Building Seismic Provisions," Journal of Structural Engineering, ASCE, Vol. 117, No. 1.
UBC, 1994, “Structural Engineering Design Provisions,” Uniform Building Code, Vol. 2, International Conference of Building Officials.
UBC, 1997, "Structural Engineering Design Provisions," Uniform Building Code, Vol. 2, International Conference of Building Officials.
Vidic, T., Fajfar, P., and Fischinger, M., 1994, "Consistent Inelastic Design Spectra: Strength and Displacement," Earthquake Engineering and Structural Dynamics, Vol. 23.
Wen, Y.K., 1995, “Building reliability and code calibration,” Earthquake Spectra, Vol. 11, No. 2.
Wen, Y. K., and Han, S.W., 1997, “Method of Reliability-Based Seismic Design. I: Equivalent Nonlinear Systems,” Journal of Structural Engineering, Vol. 123, No. 3.
Systems Performance of Steel Moment Frames Subject FEMA-355C to Earthquake Ground Shaking References, FEMA Reports, SAC Reports, and Acronyms
R-13
Wen, Y.K., and Foutch, D.A., 1997, Proposed Statistical and Reliability Framework for Com-paring and Evaluating Predictive Models for Evaluation and Design, And Critical Issues In Developing Such Framework, SAC Background Document, Report No. SAC/BD-97/03.
Yura, J. A., 1971, "The Effective Length of Columns in Unbraced Frames," Engineering Journal, AISC, April 1971.
Zhu, T.J., and Tso, W.K., 1992, "Design of Torsionally Unbalanced Structural Systems Based on Code Provisions. II: Strength Distribution," Earthquake Engineering and Structural Dynamics, Vol. 21.
Ziemian, R.D., McGuire, W., and Deierlein, G.G., 1992a, "Inelastic Limit States Design. Part I: Planar Frame Studies," Journal of Structural Engineering, ASCE, Vol. 118, No. 9.
Ziemian, R.D., McGuire, W., and Deierlein, G.G., 1992b, "Inelastic Limit States Design. Part II: Three-dimensional frame study," Journal of Structural Engineering, ASCE, Vol. 118, No. 9.
FEMA Reports.
FEMA reports are listed by report number. FEMA-178, 1992, NEHRP Handbook for the Seismic Evaluation of Existing Buildings,
developed by the Building Seismic Safety Council for the Federal Emergency Management Agency, Washington, DC.
FEMA-267, 1995, Interim Guidelines, Inspection, Evaluation, Repair, Upgrade and Design of Welded Moment Resisting Steel Structures, prepared by the SAC Joint Venture for the Federal Emergency Management Agency, Washington, DC. Superseded by FEMA 350 to 353.
FEMA-267A, 1996, Interim Guidelines Advisory No. 1, prepared by the SAC Joint Venture for the Federal Emergency Management Agency, Washington, DC. Superseded by FEMA 350 to 353.
FEMA-267B, 1999, Interim Guidelines Advisory No. 2, prepared by the SAC Joint Venture for the Federal Emergency Management Agency, Washington, DC. Superseded by FEMA 350 to 353.
FEMA-273, 1997, NEHRP Guidelines for the Seismic Rehabilitation of Buildings, prepared by the Applied Technology Council for the Building Seismic Safety Council, published by the Federal Emergency Management Agency, Washington, DC.
FEMA-274, 1997, NEHRP Commentary on the Guidelines for the Seismic Rehabilitation of Buildings, prepared by the Applied Technology Council for the Building Seismic Safety Council, published by the Federal Emergency Management Agency, Washington, DC.
FEMA-302, 1997, NEHRP Recommended Provisions for Seismic Regulations for New Buildings and Other Structures, Part 1 – Provisions, prepared by the Building Seismic Safety Council for the Federal Emergency Management Agency, Washington, DC.
FEMA-303, 1997, NEHRP Recommended Provisions for Seismic Regulations for New Buildings and Other Structures, Part 2 – Commentary, prepared by the Building Seismic Safety Council for the Federal Emergency Management Agency, Washington, DC.
FEMA-310, 1998, Handbook for the Seismic Evaluation of Buildings – A Prestandard, prepared by the American Society of Civil Engineers for the Federal Emergency Management Agency, Washington, DC.
Systems Performance of FEMA-355C Steel Moment Frames Subject References, FEMA Reports, SAC Reports, and Acronyms to Earthquake Ground Shaking
R-14
FEMA-350, 2000, Recommended Seismic Design Criteria for New Steel Moment-Frame Buildings, prepared by the SAC Joint Venture for the Federal Emergency Management Agency, Washington, DC.
FEMA-351, 2000, Recommended Seismic Evaluation and Upgrade Criteria for Existing Welded Steel Moment-Frame Buildings, prepared by the SAC Joint Venture for the Federal Emergency Management Agency, Washington, DC.
FEMA-352, 2000, Recommended Postearthquake Evaluation and Repair Criteria for Welded Steel Moment-Frame Buildings, prepared by the SAC Joint Venture for the Federal Emergency Management Agency, Washington, DC.
FEMA-353, 2000, Recommended Specifications and Quality Assurance Guidelines for Steel Moment-Frame Construction for Seismic Applications, prepared by the SAC Joint Venture for the Federal Emergency Management Agency, Washington, DC.
FEMA-354, 2000, A Policy Guide to Steel Moment-Frame Construction, prepared by the SAC Joint Venture for the Federal Emergency Management Agency, Washington, DC.
FEMA-355A, 2000, State of the Art Report on Base Metals and Fracture, prepared by the SAC Joint Venture for the Federal Emergency Management Agency, Washington, DC.
FEMA-355B, 2000, State of the Art Report on Welding and Inspection, prepared by the SAC Joint Venture for the Federal Emergency Management Agency, Washington, DC.
FEMA-355C, 2000, State of the Art Report on Systems Performance of Steel Moment Frames Subject to Earthquake Ground Shaking, prepared by the SAC Joint Venture for the Federal Emergency Management Agency, Washington, DC.
FEMA-355D, 2000, State of the Art Report on Connection Performance, prepared by the SAC Joint Venture for the Federal Emergency Management Agency, Washington, DC.
FEMA-355E, 2000, State of the Art Report on Past Performance of Steel Moment-Frame Buildings in Earthquakes, prepared by the SAC Joint Venture for the Federal Emergency Management Agency, Washington, DC.
FEMA-355F, 2000, State of the Art Report on Performance Prediction and Evaluation of Steel Moment-Frame Buildings, prepared by the SAC Joint Venture for the Federal Emergency Management Agency, Washington, DC.
SAC Joint Venture Reports.
SAC Joint Venture reports are listed by report number, except for SAC 2000a through 2000k; those entries that do not include a FEMA report number are published by the SAC Joint Venture.
SAC 94-01, 1994, Proceedings of the Invitational Workshop on Steel Seismic Issues, Los Angeles, September 1994, prepared by the SAC Joint Venture for the Federal Emergency Management Agency, Washington, DC.
SAC 94-01, 1994b, Proceedings of the International Workshop on Steel Moment Frames, Sacramento, December, 1994, prepared by the SAC Joint Venture for the Federal Emergency Management Agency, Washington, DC.
SAC 95-01, 1995, Steel Moment Frame Connection Advisory No. 3, prepared by the SAC Joint Venture for the Federal Emergency Management Agency, Washington, DC.
Systems Performance of Steel Moment Frames Subject FEMA-355C to Earthquake Ground Shaking References, FEMA Reports, SAC Reports, and Acronyms
R-15
SAC 95-02, 1995, Interim Guidelines: Evaluation, Repair, Modification and Design of Welded Steel Moment Frame Structures, prepared by the SAC Joint Venture for the Federal Emergency Management Agency, Report No. FEMA-267, Washington, DC.
SAC 95-03, 1995, Characterization of Ground Motions During the Northridge Earthquake of January 17, 1994, prepared by the SAC Joint Venture for the Federal Emergency Management Agency, Washington, DC.
SAC 95-04, 1995, Analytical and Field Investigations of Buildings Affected by the Northridge Earthquake of January 17, 1994, prepared by the SAC Joint Venture for the Federal Emergency Management Agency, Washington, DC.
SAC 95-05, 1995, Parametric Analytic Investigations of Ground Motion and Structural Response, Northridge Earthquake of January 17, 1994, prepared by the SAC Joint Venture for the Federal Emergency Management Agency, Washington, DC.
SAC 95-06, 1995, Technical Report: Surveys and Assessment of Damage to Buildings Affected by the Northridge Earthquake of January 17, 1994, prepared by the SAC Joint Venture for the Federal Emergency Management Agency, Washington, DC.
SAC 95-07, 1995, Technical Report: Case Studies of Steel Moment-Frame Building Performance in the Northridge Earthquake of January 17, 1994, prepared by the SAC Joint Venture for the Federal Emergency Management Agency, Washington, DC.
SAC 95-08, 1995, Experimental Investigations of Materials, Weldments and Nondestructive Examination Techniques, prepared by the SAC Joint Venture for the Federal Emergency Management Agency, Washington, DC.
SAC 95-09, 1995, Background Reports: Metallurgy, Fracture Mechanics, Welding, Moment Connections and Frame Systems Behavior, prepared by the SAC Joint Venture for the Federal Emergency Management Agency, Report No. FEMA-288, Washington, DC.
SAC 96-01, 1996, Experimental Investigations of Beam-Column Subassemblages, Part 1 and 2, prepared by the SAC Joint Venture for the Federal Emergency Management Agency, Washington, DC.
SAC 96-02, 1996, Connection Test Summaries, prepared by the SAC Joint Venture for the Federal Emergency Management Agency, Report No. FEMA-289, Washington, DC.
SAC 96-03, 1997, Interim Guidelines Advisory No. 1 Supplement to FEMA-267 Interim Guidelines, prepared by the SAC Joint Venture for the Federal Emergency Management Agency, Report No. FEMA-267A, Washington, DC.
SAC 98-PG, Update on the Seismic Safety of Steel Buildings – A Guide for Policy Makers, prepared by the SAC Joint Venture for the Federal Emergency Management Agency, Washington, DC.
SAC 99-01, 1999, Interim Guidelines Advisory No. 2 Supplement to FEMA-267 Interim Guidelines, prepared by the SAC Joint Venture, for the Federal Emergency Management Agency, Report No. FEMA-267B, Washington, DC.
SAC, 2000a, Recommended Seismic Design Criteria for New Steel Moment-Frame Buildings, prepared by the SAC Joint Venture for the Federal Emergency Management Agency, Report No. FEMA-350, Washington, DC.
SAC, 2000b, Recommended Seismic Evaluation and Upgrade Criteria for Existing Welded Steel Moment-Frame Buildings, prepared by the SAC Joint Venture for the Federal Emergency Management Agency, Report No. FEMA-351, Washington, DC.
Systems Performance of FEMA-355C Steel Moment Frames Subject References, FEMA Reports, SAC Reports, and Acronyms to Earthquake Ground Shaking
R-16
SAC, 2000c, Recommended Postearthquake Evaluation and Repair Criteria for Welded Steel Moment-Frame Buildings, prepared by the SAC Joint Venture for the Federal Emergency Management Agency, Report No. FEMA-352, Washington, DC.
SAC, 2000d, Recommended Specifications and Quality Assurance Guidelines for Steel Moment-Frame Construction for Seismic Applications, prepared by the SAC Joint Venture for the Federal Emergency Management Agency, Report No. FEMA-353, Washington, DC.
SAC, 2000e, A Policy Guide to Steel Moment-Frame Construction, prepared by the SAC Joint Venture for the Federal Emergency Management Agency, Report No. FEMA-354, Washington, DC.
SAC, 2000f, State of the Art Report on Base Metals and Fracture, prepared by the SAC Joint Venture for the Federal Emergency Management Agency, Report No. FEMA-355A, Washington, DC.
SAC, 2000g, State of the Art Report on Welding and Inspection, prepared by the SAC Joint Venture for the Federal Emergency Management Agency, Report No. FEMA-355B, Washington, DC.
SAC, 2000h, State of the Art Report on Systems Performance, prepared by the SAC Joint Venture for the Federal Emergency Management Agency, Report No. FEMA-355C, Washington, DC.
SAC, 2000i, State of the Art Report on Connection Performance, prepared by the SAC Joint Venture for the Federal Emergency Management Agency, Report No. FEMA-355D, Washington, DC.
SAC, 2000j, State of the Art Report on Past Performance of Steel Moment-Frame Buildings in Earthquakes, prepared by the SAC Joint Venture for the Federal Emergency Management Agency, Report No. FEMA-355E, Washington, DC.
SAC, 2000k, State of the Art Report on Performance Prediction and Evaluation, prepared by the SAC Joint Venture for the Federal Emergency Management Agency, Report No. FEMA-355F, Washington, DC.
SAC/BD-96/01, Selected Results from the SAC Phase 1 Beam-Column Connection Pre-Test Analyses, submissions from B. Maison, K. Kasai, and R. Dexter; and A. Ingraffea and G. Deierlein.
SAC/BD-96/02, Summary Report on SAC Phase 1 - Task 7 Experimental Studies, by C. Roeder (a revised version of this document is published in Report No. SAC 96-01; the original is no longer available).
SAC/BD-96/03, Selected Documents from the U.S.-Japan Workshop on Steel Fracture Issues. SAC/BD-96/04, Survey of Computer Programs for the Nonlinear Analysis of Steel Moment
Frame Structures. SAC/BD-97/01, Through-Thickness Properties of Structural Steels, by J. Barsom and S.
Korvink. SAC/BD-97/02, Protocol for Fabrication, Inspection, Testing, and Documentation of Beam-
Column Connection Tests and Other Experimental Specimens, by P. Clark, K. Frank, H. Krawinkler, and R. Shaw.
SAC/BD-97/03, Proposed Statistical and Reliability Framework for Comparing and Evaluating Predictive Models for Evaluation and Design, by Y.-K. Wen.
Systems Performance of Steel Moment Frames Subject FEMA-355C to Earthquake Ground Shaking References, FEMA Reports, SAC Reports, and Acronyms
R-17
SAC/BD-97/04, Development of Ground Motion Time Histories for Phase 2 of the FEMA/SAC Steel Project, by. P. Somerville, N. Smith, S. Punyamurthula, and J. Sun.
SAC/BD-97/05, Finite Element Fracture Mechanics Investigation of Welded Beam-Column Connections, by W.-M. Chi, G. Deierlein, and A. Ingraffea.
SAC/BD-98/01, Strength and Ductility of FR Welded-Bolted Connections, by S. El-Tawil, T. Mikesell, E. Vidarsson, and S. K. Kunnath.
SAC/BD-98/02, Effects of Strain Hardening and Strain Aging on the K-Region of Structural Shapes, by J. Barsom and S. Korvink
SAC/BD-98/03, Implementation Issues for Improved Seismic Design Criteria: Report on the Social, Economic, Policy and Political Issues Workshop by L. T. Tobin.
SAC/BD-99/01, Parametric Study on the Effect of Ground Motion Intensity and Dynamic Characteristics on Seismic Demands in Steel Moment Resisting Frames by G. A. MacRae.
SAC/BD-99/01A, Appendix to: Parametric Study on the Effect of Ground Motion Intensity and Dynamic Characteristics on Seismic Demands in Steel Moment Resisting Frames by G. A. MacRae.
SAC/BD-99/02, Through-Thickness Strength and Ductility of Column Flange in Moment Connections, by R. Dexter and M. Melendrez.
SAC/BD-99/03, The Effects of Connection Fractures on Steel Moment Resisting Frame Seismic Demands and Safety, by C. A. Cornell and N. Luco.
SAC/BD-99/04, Effects of Strength/Toughness Mismatch on Structural and Fracture Behaviors in Weldments, by P. Dong, T. Kilinski, J. Zhang, and F.W. Brust.
SAC/BD-99/05, Assessment of the Reliability of Available NDE Methods for Welded Joint and the Development of Improved UT Procedures, by G. Gruber and G. Light.
SAC/BD-99/06, Prediction of Seismic Demands for SMRFs with Ductile Connections and Elements, by A. Gupta and H. Krawinkler.
SAC/BD-99/07, Characterization of the Material Properties of Rolled Sections, by T. K. Jaquess and K. Frank.
SAC/BD-99/08, Study of the Material Properties of the Web-Flange Intersection of Rolled Shapes, by K. R. Miller and K. Frank.
SAC/BD-99/09, Investigation of Damage to WSMF Earthquakes other than Northridge, by M. Phipps.
SAC/BD-99/10, Clarifying the Extent of Northridge Induced Weld Fracturing and Examining the Related Issue of UT Reliability, by T. Paret.
SAC/BD-99/11, The Impact of Earthquakes on Welded Steel Moment Frame Buildings: Experience in Past Earthquakes, by P. Weinburg and J. Goltz.
SAC/BD-99/12, Assessment of the Benefits of Implementing the New Seismic Design Criteria and Inspection Procedures, by H. A. Seligson and R. Eguchi.
SAC/BD-99/13, Earthquake Loss Estimation for WSMF Buildings, by C. A. Kircher. SAC/BD-99/14, Simplified Loss Estimation for Pre-Northridge WSMF Buildings, by B. F.
Maison and D. Bonowitz. SAC/BD-99/15, Integrative Analytical Investigations on the Fracture Behavior of Welded
Moment Resisting Connections, by G. G. Deierlein and W.-M. Chi.
Systems Performance of FEMA-355C Steel Moment Frames Subject References, FEMA Reports, SAC Reports, and Acronyms to Earthquake Ground Shaking
R-18
SAC/BD-99/16, Seismic Performance of 3- and 9- Story Partially Restrained Moment Frame Buildings, by B. F. Maison and K. Kasai.
SAC/BD-99/17, Effects of Partially-Restrained Connection Stiffness and Strength on Frame Seismic Performance, by K. Kasai, B. F. Maison, and A. Mayangarum.
SAC/BD-99/18, Effects of Hysteretic Deterioration Characteristics on Seismic Response of Moment Resisting Steel Structures, by F. Naeim, K. Skliros, A. M. Reinhorn, and M. V. Sivaselvan.
SAC/BD-99/19, Cyclic Instability of Steel Moment Connections with Reduced Beam Section, by C.-M. Uang and C.-C. Fan.
SAC/BD-99/20, Local and Lateral-Torsion Buckling of Wide Flange Beams, by L. Kwasniewski, B. Stojadinovic, and S. C. Goel.
SAC/BD-99/21, Elastic Models for Predicting Building Performance, by X. Duan and J. C. Anderson.
SAC/BD-99/22, Reliability-Based Seismic Performance Evaluation of Steel Frame Buildings Using Nonlinear Static Analysis Methods, by G. C. Hart and M. J. Skokan.
SAC/BD-99/23, Failure Analysis of Welded Beam to Column Connections, by J. M. Barsom and J. V. Pellegrino.
SAC/BD-99/24, Weld Acceptance Criteria for Seismically-Loaded Welded Connections, by W. Mohr.
SAC/BD-00/01, Parametric Tests on Unreinforced Connections, Volume I – Final Report, by K.-H. Lee, B. Stojadinovic, S. C. Goel, A. G. Margarian, J. Choi, A. Wongkaew, B. P. Reyher, and D.-Y, Lee.
SAC/BD-00/01A, Parametric Tests on Unreinforced Connections, Volume II – Appendices, by K.-H. Lee, B. Stojadinovic, S. C. Goel, A. G. Margarian, J. Choi, A. Wongkaew, B. P. Reyher, and D.-Y, Lee.
SAC/BD-00/02, Parametric Tests on the Free Flange Connections, by J. Choi, B. Stojadinovic, and S. C. Goel.
SAC/BD-00/03, Cyclic Tests on Simple Connections Including Effects of the Slab, by J. Liu and A. Astaneh-Asl.
SAC/BD-00/04, Tests on Bolted Connections, Part I: Technical Report, by J. Swanson, R. Leon, and J. Smallridge.
SAC/BD-00/04A, Tests on Bolted Connections, Part II: Appendices, by J. Swanson, R. Leon, and J. Smallridge.
SAC/BD-00/05, Bolted Flange Plate Connections, by S. P. Schneider and I. Teeraparbwong. SAC/BD-00/06, Round Robin Testing of Ultrasonic Testing Technicians, by R. E. Shaw, Jr. SAC/BD-00/07, Dynamic Tension Tests of Simulated Welded Beam Flange Connections, by J.
M. Ricles, C. Mao, E. J. Kaufmann, L.-W. Lu, and J. W. Fisher. SAC/BD-00/08, Design of Steel Moment Frame Model Buildings in Los Angeles, Seattle and
Boston, by P. Clark. SAC/BD-00/09, Benchmarking of Analysis Programs for SMRF System Performance Studies, by
A. Gupta and H. Krawinkler.
Systems Performance of Steel Moment Frames Subject FEMA-355C to Earthquake Ground Shaking References, FEMA Reports, SAC Reports, and Acronyms
R-19
SAC/BD-00/10, Loading Histories for Seismic Performance Testing of SMRF Components and Assemblies, by H. Krawinkler, A. Gupta, R. Medina, and N. Luco.
SAC/BD-00/11, Development of Improved Post-Earthquake Inspection Procedures for Steel Moment Frame Buildings, by P. Clark.
SAC/BD-00/12, Evaluation of the Effect of Welding Procedure on the Mechanical Properties of FCAW-S and SMAW Weld Metal Used in the Construction of Seismic Moment Frames, by M. Q. Johnson.
SAC/BD-00/13, Preliminary Evaluation of Heat Affected Zone Toughness in Structural Shapes Used in the Construction of Seismic Moment Frames, by M. Q. Johnson and J. E. Ramirez.
SAC/BD-00/14, Evaluation of Mechanical Properties in Full-Scale Connections and Recommended Minimum Weld Toughness for Moment Resisting Frames, by M. Q. Johnson, W. Mohr, and J. Barsom.
SAC/BD-00/15, Simplified Design Models for Predicting the Seismic Performance of Steel Moment Frame Connections, by C. Roeder, R. G. Coons, and M. Hoit.
SAC/BD-00/16, SAC Phase 2 Test Plan, by C. Roeder. SAC/ BD-00/17, Behavior and Design of Radius-Cut, Reduced Beam Section Connections, by
M. Engelhardt, G. Fry, S. Jones, M. Venti, and S. Holliday. SAC/BD-00/18, Test of a Free Flange Connection with a Composite Floor Slab, by M. Venti
and M. Engelhardt. SAC/BD-00/19, Cyclic Testing of a Free Flange Moment Connection, by C. Gilton, B. Chi, and
C. M. Uang. SAC/BD-00/20, Improvement of Welded Connections Using Fracture Tough Overlays, by James
Anderson, J. Duan, P. Maranian, and Y. Xiao. SAC/BD-00/21, Cyclic Testing of Bolted Moment End-Plate Connections, by T. Murray, E.
Sumner, and T. Mays. SAC/BD-00/22, Cyclic Response of RBS Moment Connections: Loading Sequence and Lateral
Bracing Effects, by Q. S. Yu, C. Gilton, and C. M. Uang. SAC/BD-00/23, Cyclic Response of RBS Moment Connections: Weak Axis Configuration and
Deep Column Effects, by C. Gilton, B. Chi, and C. M. Uang. SAC/BD-00/24, Development and Evaluation of Improved Details for Ductile Welded
Unreinforced Flange Connections, by J. M. Ricles, C. Mao, L.-W. Lu, and J. Fisher. SAC/BD-00/25, Performance Prediction and Evaluation of Steel Special Moment Frames for
Seismic Loads, by K. Lee and D. A. Foutch. SAC/BD-00/26, Performance Prediction and Evaluation of Low Ductility Steel Moment Frames
for Seismic Loads, by S. Yun and D. A. Foutch. SAC/BD-00/27, Steel Moment Resisting Connections Reinforced with Cover and Flange Plates,
by T. Kim, A. S. Whittaker, V. V. Bertero, A. S. J. Gilani, and S. M. Takhirov. SAC/BD-00/28, Failure of a Column K-Area Fracture, by J. M. Barsom and J. V. Pellegrino. SAC/BD-00/29, Inspection Technology Workshop, by R. E. Shaw, Jr. SAC/BD-00/30, Preliminary Assessment of the Impact of the Northridge Earthquake on
Construction Costs of Steel Moment Frame Buildings, by Davis Langdon Adamson.
Systems Performance of FEMA-355C Steel Moment Frames Subject References, FEMA Reports, SAC Reports, and Acronyms to Earthquake Ground Shaking
R-20
Acronyms.
2-D, two-dimensional 3-D, three-dimensional A, acceleration response, amps A2LA, American Association for
Laboratory Accreditation ACAG, air carbon arc gouging ACIL, American Council of Independent
Laboratories AE, acoustic emission (testing) AISC, American Institute for Steel
Construction AISI, American Iron and Steel Institute AL, aluminum ANSI, American National Standards
Institute API, American Petroleum Institute ARCO, Atlantic-Richfield Company As, arsenic ASD, allowable stress design ASME, American Society of Mechanical
Engineers ASNT, American Society for
Nondestructive Testing ASTM, American Society for Testing and
Materials ATC, Applied Technology Council AWS, American Welding Society B, boron BB, Bolted Bracket (connection) BD, background document BF, bias factor BFO, bottom flange only (fracture) BFP, Bolted Flange Plates (connection) BM, base metal BO, Boston, Massachusetts BOCA, Building Officials and Code
Administrators BOF, basic oxygen furnace BSEP, Bolted Stiffened End Plate
(connection) BSSC, Building Seismic Safety Council BUEP, Bolted Unstiffened End Plate
(connection)
C, carbon CA, California CAC-A, air carbon arc cutting CAWI, Certified Associate Welding
Inspector CGHAZ, coarse-grained HAZ CJP, complete joint penetration (weld) CMU, concrete masonry unit, concrete
block COD, crack opening displacement “COV,” modified coefficient of variation, or
dispersion CP, Collapse Prevention (performance level) Connection Performance (team) Cr, chromium CSM, Capacity Spectrum Method CTOD, crack tip opening dimension or
displacement CTS, controlled thermal severity (test) Cu, copper CUREe, California Universities for
Research in Earthquake Engineering CVN, Charpy V-notch CWI, Certified Welding Inspector D, displacement response, dead load DMRSF, ductile, moment-resisting, space
frame DNV, Det Norske Veritas DRAIN-2DX, analysis program DRAIN-3DX, analysis program DRI, direct reduced iron DST, Double Split Tee (connection) DTI, Direct Tension Indicator EAF, electric-arc furnace EBT, eccentric bottom tapping EE, electrode extension EERC, Earthquake Engineering Research
Center, UC Berkeley EGW, electrogas welding ELF, equivalent lateral force EMS, electromagnetic stirring ENR, Engineering News Record ESW, electroslag welding
Systems Performance of Steel Moment Frames Subject FEMA-355C to Earthquake Ground Shaking References, FEMA Reports, SAC Reports, and Acronyms
R-21
EWI, Edison Welding Institute FATT, fracture appearance transition
temperature fb, fusion boundary FCAW-G, flux-cored arc welding – gas-
shielded FCAW-S or FCAW-SS, flux-cored arc
welding – self-shielded FEMA, Federal Emergency Management
Agency FF, Free Flange (connection) FGHAZ, fine-grained HAZ FL, fusion line FR, fully restrained (connection) GBOP, gapped bead on plate (test) gl, gage length GMAW, gas metal arc welding GTAW, gas tungsten arc welding HAC, hydrogen-assisted cracking HAZ, heat-affected zone HBI, hot briquetted iron HSLA, high strength, low alloy IBC, International Building Code ICBO, International Conference of Building
Officials ICC, International Code Council ICCGHAZ, intercritically reheated CGHAZ ICHAZ, intercritical HAZ ID, identification IDA, Incremental Dynamic Analysis IMF, Intermediate Moment Frame IO, Immediate Occupancy (performance
level) IOA, Incremental Dynamic Analysis ISO, International Standardization
Organization IWURF, Improved Welded Unreinforced
Flange (connection) L, longitudinal, live load LA, Los Angeles, California LACOTAP, Los Angeles County Technical
Advisory Panel LAX, Los Angeles International Airport LB, lower bound (building) LBZ, local brittlezone LDP, Linear Dynamic Procedure
LEC, Lincoln Electric Company LMF, ladle metallurgy furnace LRFD, load and resistance-factor design LS, Life Safety (performance level) LSP, Linear Static Procedure LTH, linear time history (analysis) LU, Lehigh University M, moment MAP, modal analysis procedure MAR, microalloyed rutile (consumables) MCE, Maximum Considered Earthquake MDOF, multidegree of freedom MMI, Modified Mercalli Intensity Mn, manganese Mo, molybdenum MRF, steel moment frame MRS, modal response spectrum MRSF, steel moment frame MT, magnetic particle testing N, nitrogen Nb, niobium NBC, National Building Code NDE, nondestructive examination NDP, Nonlinear Dynamic Procedure NDT, nondestructive testing NEHRP, National Earthquake Hazards
Reduction Program NES, National Evaluation Services NF, near-fault, near-field Ni, nickel NLP, nonlinear procedure NLTH, nonlinear time history (analysis) NS, north-south (direction) NSP, Nonlinear Static Procedure NTH, nonlinear time history (analysis) NVLAP, National Volunteer Laboratory
Accreditation Program O, oxygen OHF, open hearth furnace OMF, Ordinary Moment Frame OTM, overturning moment P, axial load P, axial load, phosphorus Pb, lead PGA, peak ground acceleration PGV, peak ground velocity
Systems Performance of FEMA-355C Steel Moment Frames Subject References, FEMA Reports, SAC Reports, and Acronyms to Earthquake Ground Shaking
R-22
PIDR, pseudo interstory drift ratio PJP, partial joint penetration (weld) PPE, Performance, Prediction, and
Evaluation (team) PQR, Performance Qualification Record PR, partially restrained (connection) PR-CC, partially restrained, composite
connection PT, liquid dye penetrant testing PWHT, postweld heat treatment PZ, panel zone QA, quality assurance QC, quality control QCP, Quality Control Plan, Quality
Certification Program QST, Quenching and Self-Tempering
(process) RB, Rockwell B scale (of hardness) RBS, Reduced Beam Section (connection) RCSC, Research Council for Structural
Connections RT, radiographic testing S, sulphur, shearwave (probe) SAC, the SAC Joint Venture; a partnership
of SEAOC, ATC, and CUREe SAV, sum of absolute values SAW, submerged arc welding SBC, Standard Building Code SBCCI, Southern Building Code Congress
International SCCGHAZ, subcritically reheated CGHAZ SCHAZ, subcritical HAZ SCWB, strong column, weak beam SCWI, Senior Certified Welding Inspector SDC, Seismic Design Category SDOF, single degree of freedom SE, Seattle, Washington SEAOC, Structural Engineers Association
of California SFRS, seismic-force-resisting system Si, silicon SMAW, shielded metal arc welding SMF, Special Moment Frame SMRF, special moment-resisting frame (in
1991 UBC) SMRF, Steel Moment Frame
SMRSF, special moment-resisting space frame (in 1988 UBC)
SN, strike-normal, fault-normal Sn, tin SP, Side Plate (connection) SP, strike-parallel, fault-parallel SP, Systems Performance (team) SPC, Seismic Performance Category SRSS, square root of the sum of the squares SSPC, Steel Shape Producers Council SSRC, Structural Stability Research Council SUG, Seismic Use Group SW, Slotted Web (connection) SwRI, Southwest Research Institute T, transverse TBF, top and bottom flange (fracture) Ti, titanium TIGW, tungsten inert gas welding TMCP, Thermo-Mechanical Processing TN, Tennessee TT, through-thickness TWI, The Welding Institute UB, upper bound (building) UBC, Uniform Building Code UCLA, University of California, Los
Angeles UM, University of Michigan URM, unreinforced masonry US, United States of America USC, University of Southern California USGS, US Geological Survey UT, ultrasonic testing UTA, University of Texas at Austin UTAM, Texas A & M University V, vanadium VI, visual inspection w/o, without WBH, Welded Bottom Haunch (connection) WCPF, Welded Cover Plate Flange
(connection) WCSB, weak column, strong beam WF, wide flange WFP, Welded Flange Plate (connection) WFS, wire feed speed WPQR, Welding Performance Qualification
Record
Systems Performance of Steel Moment Frames Subject FEMA-355C to Earthquake Ground Shaking References, FEMA Reports, SAC Reports, and Acronyms
R-23
WPS, Welding Procedure Specification WSMF, welded steel moment frame WT, Welded Top Haunch (connection) WTBH, Welded Top and Bottom Haunch
(connection) WUF-B, Welded Unreinforced Flanges –
Bolted Web (connection) WUF-W, Welded Unreinforced Flanges –
Welded Web (connection)
Systems Performance of Steel Moment Frames Subject FEMA-355C to Earthquake Ground Shaking SAC Phase II Project Participants
S-1
SAC Phase II Project Participants
FEMA Project Officer Michael Mahoney Federal Emergency Management Agency 500 C St. SW, Room 404 Washington, DC 20472
FEMA Technical Advisor Robert D. Hanson Federal Emergency Management Agency DFO Room 353 P.O. Box 6020 Pasadena, CA 91102-6020
Joint Venture Management Committee (JVMC) William T. Holmes, Chair Rutherford and Chekene 427 Thirteenth Street Oakland, CA 94612
Edwin T. Huston Smith & Huston, Inc. 8618 Roosevelt Way NE Seattle, WA 98115
Robert Reitherman California Universities for Research in
Earthquake Engineering 1301 South 46th St. Richmond, CA 94804
Christopher Rojahn Applied Technology Council 555 Twin Dolphin Dr., Suite 550 Redwood City, CA 94065
Arthur E. Ross Cole/Yee/Shubert & Associates 2500 Venture Oaks Way, Suite 100 Sacramento, CA 95833
Robin Shepherd Earthquake Damage Analysis Corporation 40585 Lakeview Drive, Suite 1B P.O. Box 1967 Big Bear Lake, CA 92315
Project Management Committee (PMC) Stephen A. Mahin, Project Manager Pacific Earthquake Engr. Research Center University of California Berkeley, CA 94720
Ronald O. Hamburger, Project Director for Project Development
EQE International 1111 Broadway, 10th Floor Oakland, CA 94607-5500
James O. Malley, Project Director for Topical Investigations
Degenkolb Engineers 225 Bush St., Suite 1000 San Francisco, CA 94104-1737
William T. Holmes, JVMC Rutherford and Chekene 427 Thirteenth Street Oakland, CA 94612
Christopher Rojahn, JVMC Applied Technology Council 555 Twin Dolphin Dr., Suite 550 Redwood City, CA 94065
Robin Shepherd, JVMC Earthquake Damage Analysis Corporation 40585 Lakeview Drive, Suite 1B P.O. Box 1967 Big Bear Lake, CA 92315
Systems Performance of FEMA-355C Steel Moment Frames Subject SAC Phase II Project Participants to Earthquake Ground Shaking
S-2
Peter W. Clark, Technical Assistant to PMC SAC Steel Project Technical Office 1301 South 46th St. Richmond, CA 94804
Project Administration Allen Paul Goldstein, Project Administrator Allen Paul Goldstein and Associates 1621B 13th Street Sacramento, CA 95814
Lori Campbell, Assistant to the Project Administrator
4804 Polo Court Fair Oaks, CA 95628-5266
Project Oversight Committee (POC) William J. Hall, Chair 3105 Valley Brook Dr. Champaign, IL 61821
Shirin Ader International Conference of Building
Officials 5360 Workman Mill Rd. Whittier, CA 90601-2298
John M. Barsom Barsom Consulting, Ltd. 1316 Murray Ave, Suite 300 Pittsburgh, PA 15217
Roger Ferch Herrick Corporation 7021 Koll Center Parkway P.O Box 9125 Pleasanton, CA 94566-9125
Theodore V. Galambos University of Minnesota 122 CE Building, 500 Pillsbury Dr. SE Minnneapolis, MN 55455
John L. Gross National Institute of Stds. & Technology Building and Fire Research Lab, Building 226, Room B158 Gaithersburg, MD 20899
James R. Harris J.R. Harris and Co. 1580 Lincoln St., Suite 550 Denver, CO 80203-1509
Richard Holguin 520 Kathryn Ct. Nipomo, CA 93444
Nestor Iwankiw American Institute of Steel Construction One East Wacker Dr., Suite 3100 Chicago, IL 60601-2001
Roy Johnston Brandow & Johnston Associates 1600 West 3rd St. Los Angeles, CA 90017
Leonard Joseph Thornton-Tomassetti Engineers 641 6th Ave., 7th Floor New York, NY 10011
Duane K. Miller The Lincoln Electric Company 22801 St. Clair Ave. Cleveland, OH 44117-1194
John Theiss EQE/Theiss Engineers 1848 Lackland Hills Parkway St. Louis, MO 63146-3572
Systems Performance of Steel Moment Frames Subject FEMA-355C to Earthquake Ground Shaking SAC Phase II Project Participants
S-3
John H. Wiggins J.H. Wiggins Company 1650 South Pacific Coast Hwy, Suite 311 Redondo Beach, CA 90277
Team Leaders for Topical Investigations Douglas A. Foutch University of Illinois MC-250, 205 N. Mathews Ave. 3129 Newmark Civil Engineering Lab Urbana, IL 61801
Karl H. Frank University of Texas at Austin 10100 Bornet Rd. Ferguson Lab, P.R.C. #177 Austin, TX 78758
Matthew Johnson Edison Welding Institute 1250 Arthur E. Adams Drive Columbus, OH 43221
Helmut Krawinkler Department of Civil Engineering Stanford University Stanford, CA 94305
Charles W. Roeder University of Washington 233-B More Hall FX-10 Dept. of Building and Safety Seattle, WA 98195-2700
L. Thomas Tobin Tobin and Associates 134 California Ave. Mill Valley, CA 94941
Lead Guideline Writers John D. Hooper Skilling Ward Magnusson Barkshire, Inc. 1301 Fifth Avenue, Suite 3200 Seattle, WA 98101-2699
Lawrence D. Reaveley University of Utah Civil Engineering Dept. 3220 Merrill Engineering Building Salt Lake City, UT 84112
Thomas A. Sabol Englekirk & Sabol Consulting Engineers P.O. Box 77-D Los Angeles, CA 90007
C. Mark Saunders Rutherford & Chekene 303 Second St., Suite 800 North San Francisco, CA 94107
Robert E. Shaw Steel Structures Technology Center, Inc. 42400 W Nine Mile Road Novi, MI 48375-4132
Raymond H. R. Tide Wiss, Janney, Elstner Associates, Inc. 330 Pfingsten Road Northbrook, IL 60062-2095
C. Allin Cornell, Associate Guideline Writer Stanford University Terman Engineering Center Stanford, CA 94305-4020
Systems Performance of FEMA-355C Steel Moment Frames Subject SAC Phase II Project Participants to Earthquake Ground Shaking
S-4
Technical Advisory Panel (TAP) for Materials and Fracture John M. Barsom, POC Barsom Consulting, Ltd. 1316 Murray Ave, Suite 300 Pittsburgh, PA 15217
Serge Bouchard* TradeARBED 825 Third Avenue, 35th Floor New York, NY 10022
Michael F. Engestrom* Nucor-Yamato Steel P.O. Box 678 Frederick, MD 21705-0678
Karl H. Frank, Team Leader University of Texas at Austin 10100 Bornet Rd. Ferguson Lab, P.R.C. #177 Austin, TX 78758
Nestor Iwankiw* American Institute of Steel Construction One East Wacker Dr., Suite 3100 Chicago, IL 60601-2001
Dean C. Krouse* 705 Pine Top Drive Bethelem, PA 18017
Frederick V. Lawrence University of Illinois at Urbana-Champaign 205 N. Mathews Ave. Room 2129 Newmark Lab Urbana, IL 61801
Robert F. Preece Preece, Goudie & Associates 100 Bush St., Suite 410 San Francisco, CA 94104
Raymond H. R. Tide, Guideline Writer Wiss, Janney, Elstner Associates, Inc. 330 Pfingsten Road Northbrook, IL 60062-2095
TAP for Welding and Inspection John M. Barsom Barsom Consulting, Ltd. 1316 Murray Ave, Suite 300 Pittsburgh, PA 15217
John W. Fisher Lehigh University 117 ATLSS Drive Bethlehem, PA 18015-4729
J. Ernesto Indacochea University of Illinois at Chicago Civil and Materials Engineering (mc 246) 842 West Taylor Street Chicago, IL 60607
Matthew Johnson, Team Leader Edison Welding Institute 1250 Arthur E. Adams Drive Columbus, OH 43221
David Long PDM Strocal, Inc. 2324 Navy Drive Stockton, CA 95206
Duane K. Miller, POC The Lincoln Electric Company 22801 St. Clair Ave. Cleveland, OH 44117-1194
Systems Performance of Steel Moment Frames Subject FEMA-355C to Earthquake Ground Shaking SAC Phase II Project Participants
S-5
Robert Pyle* AISC Marketing 10101 South State Street Sandy, Utah 84070
Douglas Rees-Evans* Steel Dynamics, Inc. Structural Mill Division 2601 County Road 700 East Columbia City, IN 46725
Richard I. Seals P.O. Box 11327 Berkeley, CA 94712-2327
Robert E. Shaw, Guideline Writer Steel Structures Technology Center, Inc. 42400 W Nine Mile Road Novi, MI 48375-4132
TAP for Connection Performance
Charlie Carter* American Institute of Steel Construction One East Wacker Drive, Suite 3100 Chicago, IL 60601-2001
Robert H. Dodds University of Illinois at Urbana-Champaign 205 N. Mathews Ave. 2129 Newmark Lab Urbana, IL 61801
Roger Ferch, POC Herrick Corporation 7021 Koll Center Parkway P.O Box 9125 Pleasanton, CA 94566-9125
John D. Hooper, Guideline Writer Skilling Ward Magnusson Barkshire, Inc. 1301 Fifth Avenue, Suite 3200 Seattle, WA 98101-2699
Egor Popov University of California at Berkeley Department of Civil and Environmental
Engineering, Davis Hall Berkeley, CA 94720
Steve Powell* SME Steel Contractors 5955 W. Wells Park Rd. West Jordan, UT 84088
Charles W. Roeder, Team Leader University of Washington 233-B More Hall FX-10 Dept. of Building and Safety Seattle, WA 98195-2700
Stanley T. Rolfe University of Kansas Civil Engineering Department 2006 Learned Hall Lawrence, KS 66045-2225
Rick Wilkinson* Gayle Manufacturing Company 1455 East Kentucky Woodland, CA 95695
Systems Performance of FEMA-355C Steel Moment Frames Subject SAC Phase II Project Participants to Earthquake Ground Shaking
S-6
TAP for System Performance Jacques Cattan* American Institute of Steel Construction One East Wacker Drive, Suite 3100 Chicago, IL 60601-2001
Gary C. Hart Hart Consultant Group The Water Garden, Ste. 670E 2425 Olympic Blvd. Santa Monica, CA 90404-4030
Y. Henry Huang* Los Angeles County Dept. of Public Works 900 S. Fremont Avenue, 8th Floor Alhambra, CA 91803
Helmut Krawinkler, Team Leader Department of Civil Engineering Stanford University Stanford, CA 94305
Dennis Randall* SME Steel Contractors 5955 West Wells Park Road West Jordan, UT 84088
Andrei M. Reinhorn State University of New York at Buffalo Civil Engineering Department 231 Ketter Hall Buffalo, NY 14260
Arthur E. Ross, JVMC Cole/Yee/Shubert & Associates 2500 Venture Oaks Way, Suite 100 Sacramento, CA 95833
C. Mark Saunders, Guideline Writer Rutherford & Chekene 303 Second St., Suite 800 North San Francisco, CA 94107
W. Lee Shoemaker* Metal Building Manufacturers Association 1300 Summer Avenue Cleveland, OH 44115
John Theiss, POC EQE/Theiss Engineers 1848 Lackland Hills Parkway St. Louis, MO 63146-3572
TAP for Performance Prediction and Evaluation Vitelmo V. Bertero University of California at Berkeley Pacific Earthquake Engr. Research Center 1301 S. 46th St. Richmond, CA 94804
Bruce R. Ellingwood Johns Hopkins University Department of Civil Engineering 3400 N. Charles St. Baltimore, MD 21218
Douglas A. Foutch, Team Leader University of Illinois MC-250, 205 N. Mathews Ave. 3129 Newmark Civil Engineering Lab Urbana, IL 61801
Theodore V. Galambos, POC University of Minnesota 122 CE Building, 500 Pillsbury Dr. SE Minnneapolis, MN 55455
Lawrence G. Griffis Walter P. Moore & Associates 3131 Eastside, Second Floor Houston, TX 77098
Systems Performance of Steel Moment Frames Subject FEMA-355C to Earthquake Ground Shaking SAC Phase II Project Participants
S-7
Edwin T. Huston, JVMC Smith & Huston, Inc. 8618 Roosevelt Way NE Seattle, WA 98115
Harry Martin* American Iron and Steel Institute 11899 Edgewood Road, Suite G Auburn, CA 95603
Thomas A. Sabol, Guideline Writer Englekirk & Sabol Consulting Engineers P.O. Box 77-D Los Angeles, CA 90007
Tom Schlafly* American Institute of Steel Construction One East Wacker Drive, Suite 3100 Chicago, IL 60601-2001
Technical Advisors NormAbrahamson Pacific Gas & Electric P.O. Box 770000, MC N4C San Francisco, CA 94177
C.B. Crouse URS – Dames and Moore 2025 First Avenue, Suite 500 Seattle, WA 98121
Robert Kennedy RPK Structural Mechanics Consultants 18971 Villa Terr Yorba Linda, CA 92886
Social Economic and Policy Panel Martha Cox-Nitikman Building and Owners and Managers
Association, Los Angeles 700 South Flower, Suite 2325 Los Angeles, CA 90017
Karl Deppe 27502 Fawnskin Dr. Rancho Palos Verdes, CA 90275
Eugene Lecomte Institute for Business and Home Safety 6 Sheffield Drive Billerica, MA 01821
James Madison Attorney at Law, Mediator and Arbitrator 750 Menlo Avenue, Suite 250 Menlo Park, CA 94025
Alan Merson Morley Builders 2901 28th Street, Suite 100 Santa Monica, CA 90405
Joanne Nigg University of Delaware Disaster Research Center Newark, DE 19716
William Petak University of Southern California Lewis Hall, Room 201 650 Childs Way Los Angeles, CA 90089
Francine Rabinovitz Hamilton, Rabinovitz and Alschuler 1990 South Bundy Drive, Suite 777 Los Angeles, CA 90025
Systems Performance of FEMA-355C Steel Moment Frames Subject SAC Phase II Project Participants to Earthquake Ground Shaking
S-8
Dennis Randall SME Steel Contractors 5955 West Wells Park Road West Jordan, UT 84088
David Ratterman Stites and Harbison 400 West Market St., Suite 1800 Louisville, KY 40202-3352
L. Thomas Tobin, Panel Coordinator 134 California Ave. Mill Valley, CA 94941
Stephen Toth TIAA-CREF 730 Third Avenue New York, NY 10017-3206
John H. Wiggins, POC J.H. Wiggins Company 1650 South Pacific Coast Hwy, Suite 311 Redondo Beach, CA 90277
Performance of Steel Buildings in Past Earthquakes Subcontractors David Bonowitz 887 Bush, No. 610 San Francisco, CA 94108
Peter Clark SAC Steel Project Technical Office 1301 South 46th St. Richmond, CA 94804
Michael Durkin Michael Durkin & Associates 22955 Leanora Dr. Woodland Hills, CA 91367
James Goltz California Institute of Technology Office of Earthquake Programs Mail Code 252-21 Pasadena, CA 91125
Bruce Maison 7309 Lynn Ave Elcerrito, CA 94530
Peter Maranian Brandow & Johnston Associates 1660 West Third Street Los Angeles, CA 90017
Terrence Paret Wiss Janney Elstner Associates, Inc. 2200 Powell St. Suite 925 Emeryville, CA 94602
Maryann Phipps Degenkolb Engineers 225 Bush Street, Suite 1000 San Francisco, CA 94104
Allan Porush Dames & Moore 911 Wilshire Blvd., Suite 700 Los Angeles, CA 90017
Access Current Knowledge Subcontractors David Bonowitz 887 Bush , No. 610 San Francisco, CA 94108
Stephen Liu Colorado School of Mines Mathematics and Computer Science
Department Golden, CO 80401
Systems Performance of Steel Moment Frames Subject FEMA-355C to Earthquake Ground Shaking SAC Phase II Project Participants
S-9
Materials and Fracture Subcontractors Robert Dexter University of Minnesota 122 Civil Engineering Building 500 Pillsbury Drive SE Minneapolis, MN 55455-0116
Karl H. Frank University of Texas at Austin 10100 Bornet Rd. Ferguson Lab, P.R.C. #177 Austin, TX 78758
Welding and Inspection Subcontractors Pingsha Dong / Tom Kilinski Center for Welded Structures Research Battelle Memorial Institute 501 King Avenue Columbus, OH 43201-2693
Matthew Johnson Edison Welding Institute 1250 Arthur E. Adams Drive Columbus, OH 43221
Glenn M. Light / George Gruber Southwest Research Institute 6220 Culebra Road, P. O. Drawer 28510 San Antonio, TX 78228-0510
William C. Mohr Edison Welding Institute 1250 Arthur E. Adams Drive Columbus, OH 43221
Connection Performance Subcontractors Gregory Deierlein Stanford University Terman Engineering Center Department of Civil and Enviromental Engr. Stanford, CA 94305-4020
Charles W. Roeder University of Washington 233-B More Hall FX-10 Seattle, WA 98195-2700
Sherif El-Tawil / Sashi Kunnath University of Central Florida Civil and Environmental Engr. Department Orlando, FL. 32816-2450
Anthony Ingraffea Cornell University School of Civil Engineering 363 Hollister Hall Ithaca, NY 14853
System Performance Subcontractors Paul Somerville Woodward-Clyde Federal Services 566 El Dorado St., Suite 100 Pasadena, CA 91101-2560
Farzad Naeim John A. Martin & Associates 1212 S. Flower Ave. Los Angeles, CA 90015
Andrei M. Reinhorn State University of New York at Buffalo Civil Engineering Department 231 Ketter Hall Buffalo, NY 14260
C. Allin Cornell Stanford University Terman Engineering Center Stanford, CA 94305-4020
Systems Performance of FEMA-355C Steel Moment Frames Subject SAC Phase II Project Participants to Earthquake Ground Shaking
S-10
Helmut Krawinkler Dept. of Civil Engineering Stanford University Stanford, CA 94305
Gregory MacRae University of Washington Civil Engineering Department Seattle, WA 98195-2700
Kazuhiko Kasai Tokyo Institute of Technology Structural Engineering Research Center Nagatsuta, Midori-Ku Yokohama 226-8503, JAPAN
Bruce F. Maison 7309 Lynn Avenue El Cerrito, CA 94530
Performance Prediction and Evaluation Subcontractors James Anderson University of Southern California Civil Engineering Department Los Angeles, CA 90089-2531
Douglas A. Foutch University of Illinois MC-250, 205 N. Mathews Ave. 3129 Newmark Civil Engineering Lab Urbana, IL 61801
Gary C. Hart Department of Civil and Environmental
Engineering University of California Los Angeles, CA 90095
Y.K. Wen University of Illinois 3129 Newmark Civil Engineering Lab 205 N. Mathews Ave. Urbana, IL 61801
Testing Subcontractors Subhash Goel / Bozidar Stojadinovic University of Michigan Civil Engineering Department Ann Arbor, MI 48109
Roberto Leon Georgia Institute of Technology School of Civil & Environmental Engr. 790 Atlantic Ave. Atlanta, GA 30332-0355
Vitelmo V. Bertero / Andrew Whittaker UC Berkeley Pacific Earthquake Engr. Research Center 1301 S. 46th St. Richmond, CA 94804
Thomas Murray Virginia Tech, Dept. of Civil Engineering 200 Patton Hall Blacksburg, VA 24061
James M. Ricles / Le-Wu Lu Lehigh University c/o ATLSS Center 117 ATLSS Drive, H Building Bethlehem, PA 18015-4729
John M. Barsom Barsom Consulting, Ltd. 1316 Murray Ave, Suite 300 Pittsburgh, PA 15217
Systems Performance of Steel Moment Frames Subject FEMA-355C to Earthquake Ground Shaking SAC Phase II Project Participants
S-11
Hassan Astaneh University of California at Berkeley Dept. of Civil and Environmental Engr. 781 Davis Hall Berkeley, CA 94720
Michael Engelhardt University of Texas at Austin Ferguson Laboratory 10100 Burnet Road, Building 177 Austin, TX 78712-1076
Gary T. Fry Texas A&M University Department of Civil Engineering Constructed Facilities Division, CE/TTI
Building, Room 710D College Station, TX 77843-3136
Chia-Ming Uang University of California at San Diego Dept. of AMES, Division of Structural Engr. 409 University Center La Jolla, California 92093-0085
Stephen Schneider University of Ilinois at Urbana-Champaign 3106 Newmark Civil Engr. Lab, MC-250 205 N. Mathews Avenue Urbana, IL 61801
Matthew Johnson Edison Welding Institute 1250 Arthur E. Adams Drive Columbus, OH 43221
James Anderson University of Southern California Civil Engineering Department Los Angeles, CA 90089-2531
Bozidar Stojadinovic Dept. of Civil & Environmental Engr. University of California Berkeley, CA 94720
Inspection Procedure Consultants Thomas Albert Digiray Corporation 2235 Omega Road, No. 3 San Ramon, CA 94583
Randal Fong Automated Inspection Systems, Inc. 4861 Sunrise Drive, Suite 101 Martinez, CA 94553
Andre Lamarre R.D Tech, Inc. 1200 St. Jean Baptiste, Suite 120 Quebec City, Quebec, Canada G2ZE 5E8
Glenn Light Southwest Research Institute 6220 Culebra Road San Antonio, TX 78228
Andrey Mishin AS & E High Energy Systems 330 Keller Street, Building 101 Santa Clara, CA 95054
Robert Shaw Steel Structures Technology Center, Inc. 42400 W. Nine Mile Road Novi, MI 48375-4132
Carlos Ventura Dept of Civil Engineering University of British Columbia 2324 Main Hall Vancouver, BC, Canada V6T 1Z4
Systems Performance of FEMA-355C Steel Moment Frames Subject SAC Phase II Project Participants to Earthquake Ground Shaking
S-12
Guideline Trial Applications Subcontractors John Hopper Skilling Ward Magnusson Barkshire, Inc. 1301 Fifth Avenue, Suite 320 Seattle WA 98101-2699
Leonard Joseph Thornton-Tomassetti Engineers 641 6th Avenue, 7th Floor New York, NY 10011
Lawrence Novak Skidmore, Owings, and Merrill 224 S. Michigan Ave, Suite 1000 Chicago, IL 60604
Maryann Phipps Degenkolb Engineers 225 Bush Street, Suite 1000 San Francisco, CA 94104
Economic and Social Impact Study Subcontractors Ronald Eguchi EQE Engineering and Design 300 Commerce Dr., Ste. 200 Irvine, CA 92602
Martin Gordon / Peter Morris Adamson Associates 170 Columbus Avenue San Francisco, CA 94133
Richard Henige Lemessurier Consultants Inc. 675 Massachusetts Ave. Cambridge, MA 02139-3309
Charles Kircher Charles Kircher & Associates 1121 San Antonio Road, Suite D-202 Palo Alto, CA 94303
Lizandro Mercado Brandow & Johnston Associates 1600 West 3rd St. Los Angeles, CA 90017
Greg Schindler KPFF Consulting Engineers 1201 3rd Ave. Seattle, WA 98101-3000
Report Production and Administrative Services A. Gerald Brady, Technical Editor Patricia A. Mork, Administrative Asst. Peter N. Mork, Computer Specialist Bernadette A. Mosby, Operations Admin. Michelle S. Schwartzbach, Pub. Specialist Applied Technology Council 555 Twin Dolphin Drive, Suite 550 Redwood City, CA 94065
Carol Cameron, Publications Coordinator Ericka Holmon, Admin. Assistant California Universities for Research in
Earthquake Engineering 1301 S. 46th Street Richmond, CA 94804
*indicates industrial or organizational contact representative


![OUTER DERIVATIONS OF LIE ALGEBRAS · 1967] OUTER DERIVATIONS OF LIE ALGEBRAS 267 outer derivations is a linear sum of the outer derivations, which are obtained as in the first part](https://img.pdfslide.us/doc/110x75/5ec52027613ab73b287ddf89/outer-derivations-of-lie-algebras-1967-outer-derivations-of-lie-algebras-267-outer.jpg)