Embed Size (px)
Citation preview

Disaster Risk MappingDistrict Swat
Evaluation & Research ReportNRSP-MER/2011-IV
National Rural Support ProgrammeIslamabad, Pakistan
Copyright © National Rural Support Programme - September 2011
All rights reserved, but development organizations which are working in the rural areas specially non-profit organizations working for capacity building can use this material for the benefit of poor rural communities. It is requested that please acknowledge the effort made by NRSP. No parts of this publication may be reproduced, stored in a retrieval system or transmitted in any form or by any means electronic, mechanical, photocopying, recording for the commercial or profit making purpose or otherwise without the written permission of the National Rural Support Programme.
Disaster Risk Mapping - District Swat
Author by: Ahmad Hassan (Senior Programme Officer - MER)Reviewed & Supervised by: Muhammad Tahir Waqar (Programme Manager - MER)
Design & Layout: Mansoor Abid
Printed by: PanGraphics (Pvt) Ltd., Islamabad
i
Disaster Risk Mapping - District Swat
Table of Contents
Introduction 1Methodology of Risk Assessment 2 Hazard Mapping 2 Methodology for calculating Hazard Score for different Hazards 3 Vulnerability Assessment 4 Matrix for calculating vulnerability assessment 5
Social, political and economic framework conditions 6 In the province 6 In the project area 6
Location of the risk assessment 7
Initial Justification of the Survey 8 Current risk propensity of selected villages 10 Process and the criteria applied for the selection of the proposed households 12
Collection of secondary data (sources and information) 13 Topography of Swat 13 Types of Hazard in Project area and their definition 13
Hazard Analysis 16 Hazard Ranking of villages 16 Methodology notes for Ranking 17 Social Mapping 17 Transect Walk 18 Focus Group Discussions 18 Community insights on Disaster History, their coping mechanisms and superstitions 19 Village wise summary of Focus group Discussions 20 Information gathered using other PRA tools 22
Summary of household vulnerability Analysis 23 Exposure Analysis 23 Fragility Analysis 23 Indicators of Socio economic wellbeing of communities in context of Hazard 24 Lack of resilience 26 Overall Vulnerability Score Range 26
Identified DRR & CCA project interventions 28
Ranking of Communities 29
ii
Disaster Risk Mapping - District Swat
List of Annexes
Annex 1: Village Report - Murguzar 31Annex 2: Village Report - Sapal Banday 36Annex 3: Village Report - Gul Banday 41Annex 4: Village Report - Kokrai 46Annex 5: Village Report - Saidu Shagae 51Annex 6: Village Report - Saidu 55Annex 7: Village Report - Ghari 59Annex 8: Village Report - Shagai Shahgram 64Annex 9: List of Targeted household for Assessment Survey 68Annex 10: Questionnaire for conducting Vulnerability Survey 82
Table of Contents
iii
Disaster Risk Mapping - District Swat
Acronyms
ACTED Agency for Technical Cooperation & DevelopmentBHU Basic Health UnitBISP Benazir Income Support ProgramCBDRM Community Based Disaster Risk ManagementCFW Cash for WorkDMC Disaster Management CommitteeFGDs Focus Group DiscussionsHHs House HoldsHUJRA Holistic Understanding for Justified Research Action INGO International Non Governmental OrganizationLasoona “Hands” in Pushto LanguageNFI Non-Food ItemsNGO Non-Governmental OrganizationNRSP National Rural Support ProgrammePRA Participatory Rural AppraisalOXFAM Oxford Committee for Famine ReliefSPADO Sustainable Peace & Development OrganizationUC Union CouncilWASH Water, Sanitation & Hygiene

1
Disaster Risk Mapping - District Swat
Introduction
In April 2011 NRSP signed an agreement for disaster risk assessment survey in Swat with Diakonie, a German based INGO which has been its strategic partner since Earthquake 2005. The assessment was carried out in 8 villages located in UC Madyan, Tirat, and Islampur & Saidu Sharif in Swat district.
The study was initiated with the orientation of the study team comprising of 15 members including, MER Officer, a data entry officer, 12 field supervisors and 60 enumerators. For data collection, District Swat was divided into two zones (upper and lower Swat) and two teams, each comprising of 6 field supervisors (3 male and 3 female) were deputed. Field supervisors were responsible for village level information collection using PRA tools (FGDs, transect walk, hazard mapping etc.). Each Field Supervisor also supervised a team of 6 enumerators (on an average) for Household survey.
The mentioned project while adopting an innovative approach carried out hazard mapping and analysis within different villages in terms of occurrence and magnitude of seasonal flooding, major flooding and soil erosion. The mapping exercise was supplemented by focus group discussions, village situational analysis, and consultation with different metrological and line departments. Based on hazard mapping about 765 households who were identified as being in high risk zones were targeted for vulnerability assessment survey. The survey, focusing on indicators such as exposure, fragility and lack of resilience of communities in terms of various hazards was able to assimilate proposed interventions with respect to disaster preparedness and mitigation strategies which can be employed to reduce risk level of targeted population (see questionnaire at Annex 10).
The proposed interventions focused upon capacity building initiatives in CBDRM, formation of Disaster Management Committee with formulation of a proper village level emergency, evacuation and preparedness plans. Mitigation measures which were suggested by stakeholders focused upon encouragement of ecological farming, kitchen gardening, terracing and reforestation alongside river banks along with fortification of houses and community buildings with more stable materials.
2
Disaster Risk Mapping - District Swat
Methodology for Risk Assessment
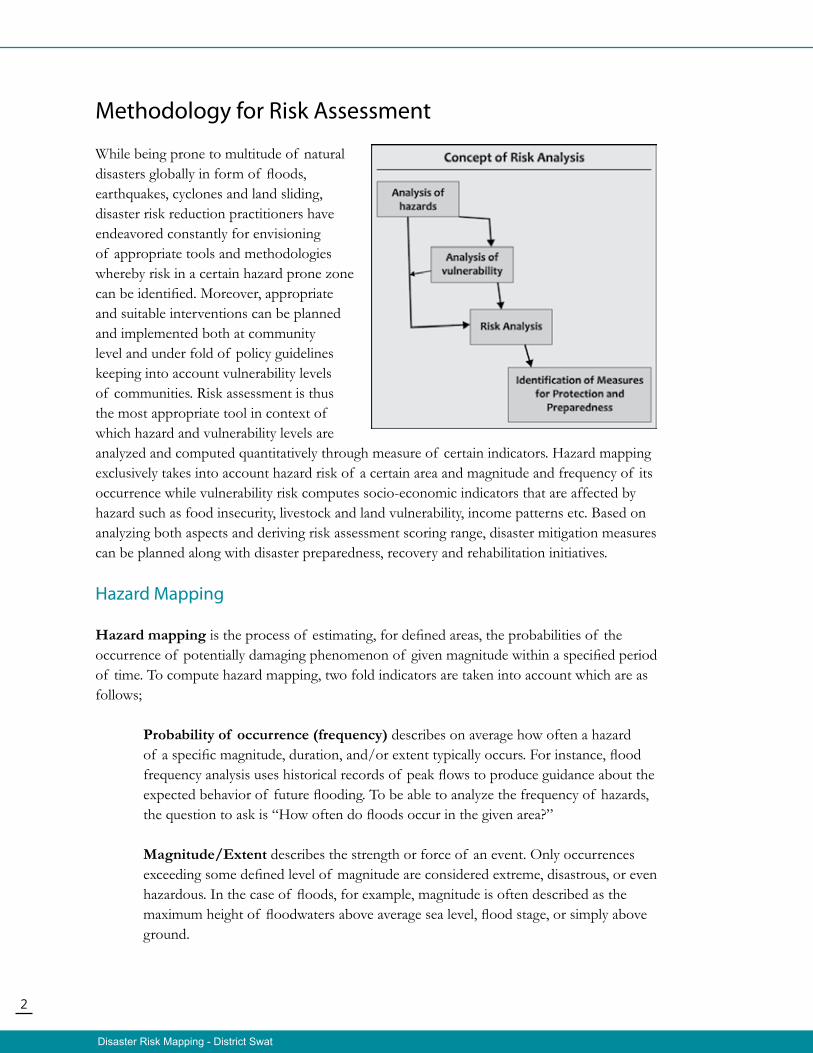
While being prone to multitude of natural disasters globally in form of floods, earthquakes, cyclones and land sliding, disaster risk reduction practitioners have endeavored constantly for envisioning of appropriate tools and methodologies whereby risk in a certain hazard prone zone can be identified. Moreover, appropriate and suitable interventions can be planned and implemented both at community level and under fold of policy guidelines keeping into account vulnerability levels of communities. Risk assessment is thus the most appropriate tool in context of which hazard and vulnerability levels are analyzed and computed quantitatively through measure of certain indicators. Hazard mapping exclusively takes into account hazard risk of a certain area and magnitude and frequency of its occurrence while vulnerability risk computes socio-economic indicators that are affected by hazard such as food insecurity, livestock and land vulnerability, income patterns etc. Based on analyzing both aspects and deriving risk assessment scoring range, disaster mitigation measures can be planned along with disaster preparedness, recovery and rehabilitation initiatives.
Hazard Mapping
Hazard mapping is the process of estimating, for defined areas, the probabilities of the occurrence of potentially damaging phenomenon of given magnitude within a specified period of time. To compute hazard mapping, two fold indicators are taken into account which are as follows;
Probability of occurrence (frequency) describes on average how often a hazard of a specific magnitude, duration, and/or extent typically occurs. For instance, flood frequency analysis uses historical records of peak flows to produce guidance about the expected behavior of future flooding. To be able to analyze the frequency of hazards, the question to ask is “How often do floods occur in the given area?”
Magnitude/Extent describes the strength or force of an event. Only occurrences exceeding some defined level of magnitude are considered extreme, disastrous, or even hazardous. In the case of floods, for example, magnitude is often described as the maximum height of floodwaters above average sea level, flood stage, or simply above ground.
3
Disaster Risk Mapping - District Swat
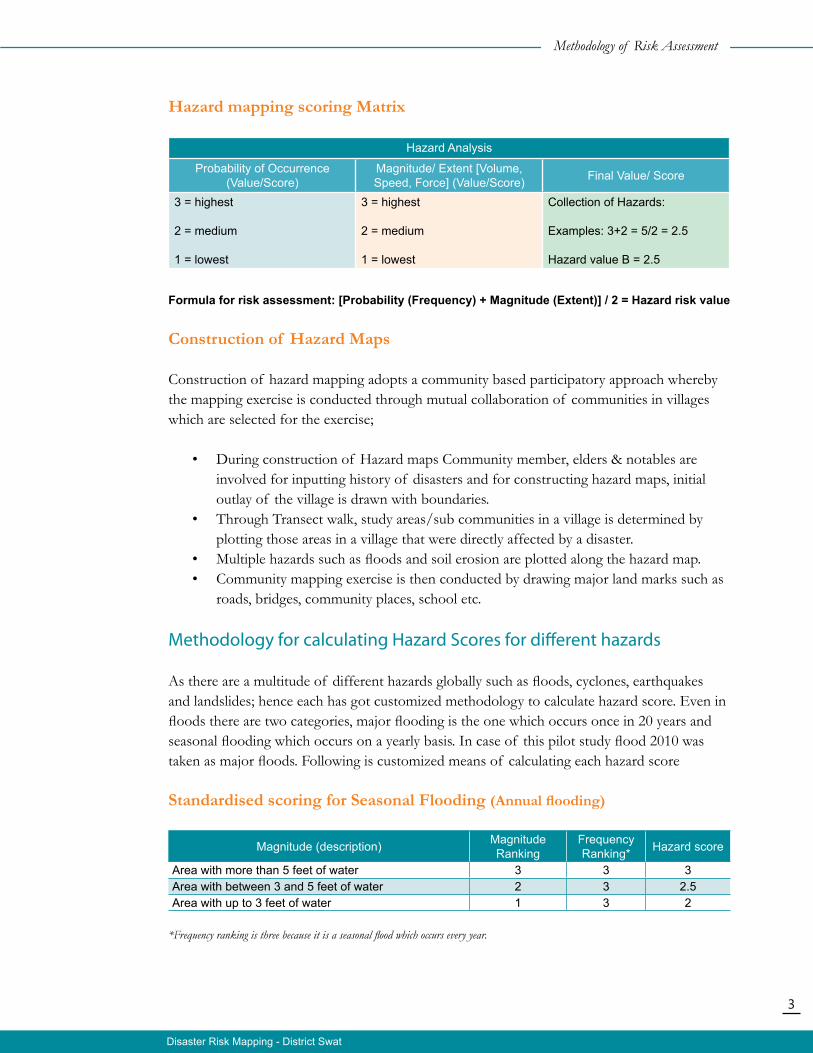
Hazard mapping scoring Matrix
Hazard Analysis
Probability of Occurrence(Value/Score)
Magnitude/ Extent [Volume, Speed, Force] (Value/Score) Final Value/ Score
3 = highest
2 = medium
1 = lowest
3 = highest
2 = medium
1 = lowest
Collection of Hazards:
Examples: 3+2 = 5/2 = 2.5
Hazard value B = 2.5
Formula for risk assessment: [Probability (Frequency) + Magnitude (Extent)] / 2 = Hazard risk value
Construction of Hazard Maps
Construction of hazard mapping adopts a community based participatory approach whereby the mapping exercise is conducted through mutual collaboration of communities in villages which are selected for the exercise;
• During construction of Hazard maps Community member, elders & notables are involved for inputting history of disasters and for constructing hazard maps, initial outlay of the village is drawn with boundaries.
• Through Transect walk, study areas/sub communities in a village is determined by plotting those areas in a village that were directly affected by a disaster.
• Multiple hazards such as floods and soil erosion are plotted along the hazard map. • Community mapping exercise is then conducted by drawing major land marks such as
roads, bridges, community places, school etc.
Methodology for calculating Hazard Scores for different hazards
As there are a multitude of different hazards globally such as floods, cyclones, earthquakes and landslides; hence each has got customized methodology to calculate hazard score. Even in floods there are two categories, major flooding is the one which occurs once in 20 years and seasonal flooding which occurs on a yearly basis. In case of this pilot study flood 2010 was taken as major floods. Following is customized means of calculating each hazard score
Standardised scoring for Seasonal Flooding (Annual flooding)
Magnitude (description) Magnitude Ranking
Frequency Ranking* Hazard score
Area with more than 5 feet of water 3 3 3Area with between 3 and 5 feet of water 2 3 2.5Area with up to 3 feet of water 1 3 2
*Frequency ranking is three because it is a seasonal flood which occurs every year.
Methodology of Risk Assessment
4
Disaster Risk Mapping - District Swat
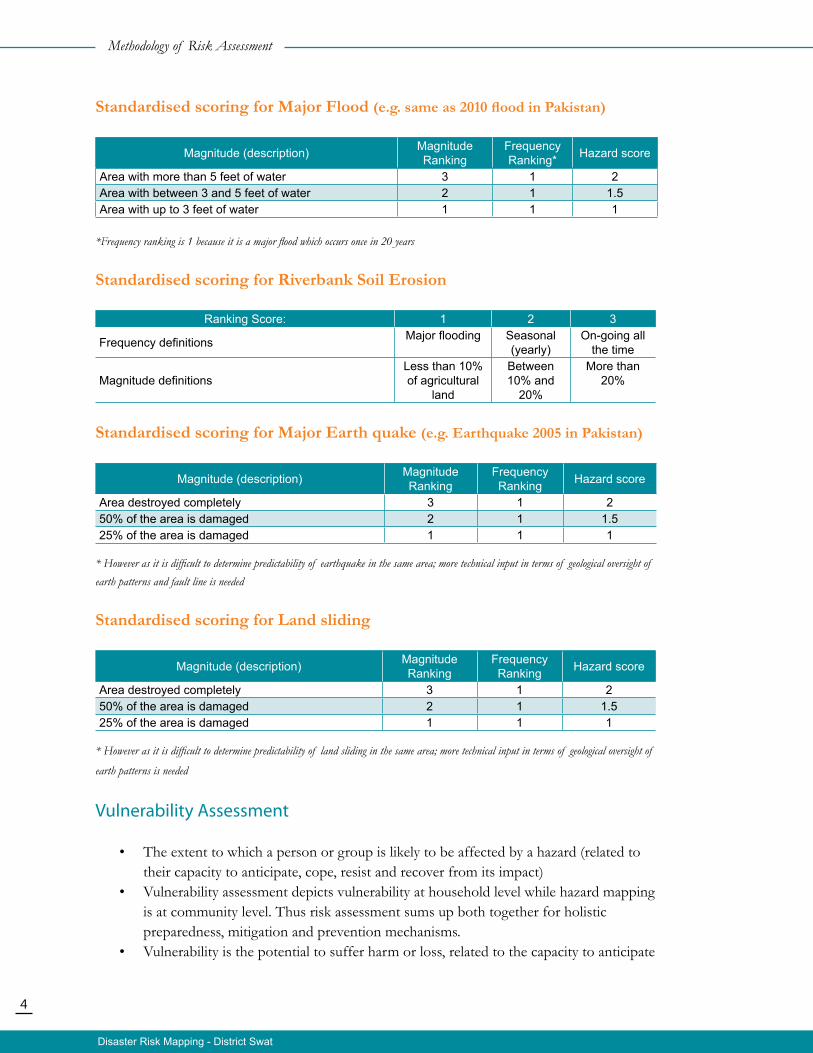
Standardised scoring for Major Flood (e.g. same as 2010 flood in Pakistan)
Magnitude (description) Magnitude Ranking
Frequency Ranking* Hazard score
Area with more than 5 feet of water 3 1 2Area with between 3 and 5 feet of water 2 1 1.5Area with up to 3 feet of water 1 1 1
*Frequency ranking is 1 because it is a major flood which occurs once in 20 years
Standardised scoring for Riverbank Soil Erosion
Ranking Score: 1 2 3
Frequency definitions Major flooding Seasonal (yearly)
On-going all the time
Magnitude definitionsLess than 10% of agricultural
land
Between 10% and
20%
More than 20%
Standardised scoring for Major Earth quake (e.g. Earthquake 2005 in Pakistan)
Magnitude (description) Magnitude Ranking
Frequency Ranking Hazard score
Area destroyed completely 3 1 250% of the area is damaged 2 1 1.525% of the area is damaged 1 1 1
* However as it is difficult to determine predictability of earthquake in the same area; more technical input in terms of geological oversight of earth patterns and fault line is needed
Standardised scoring for Land sliding
Magnitude (description) Magnitude Ranking
Frequency Ranking Hazard score
Area destroyed completely 3 1 250% of the area is damaged 2 1 1.525% of the area is damaged 1 1 1
* However as it is difficult to determine predictability of land sliding in the same area; more technical input in terms of geological oversight of
earth patterns is needed
Vulnerability Assessment
• The extent to which a person or group is likely to be affected by a hazard (related to their capacity to anticipate, cope, resist and recover from its impact)
• Vulnerability assessment depicts vulnerability at household level while hazard mapping is at community level. Thus risk assessment sums up both together for holistic preparedness, mitigation and prevention mechanisms.
• Vulnerability is the potential to suffer harm or loss, related to the capacity to anticipate
Methodology of Risk Assessment
5
Disaster Risk Mapping - District Swat
a hazard, cope, resist and recover from its impact. Both vulnerability and its antithesis, resilience, are determined by physical, environmental, social, economic, political, cultural and institutional factors.
• Vulnerability is more than just poverty, but the poor tend to be more vulnerable
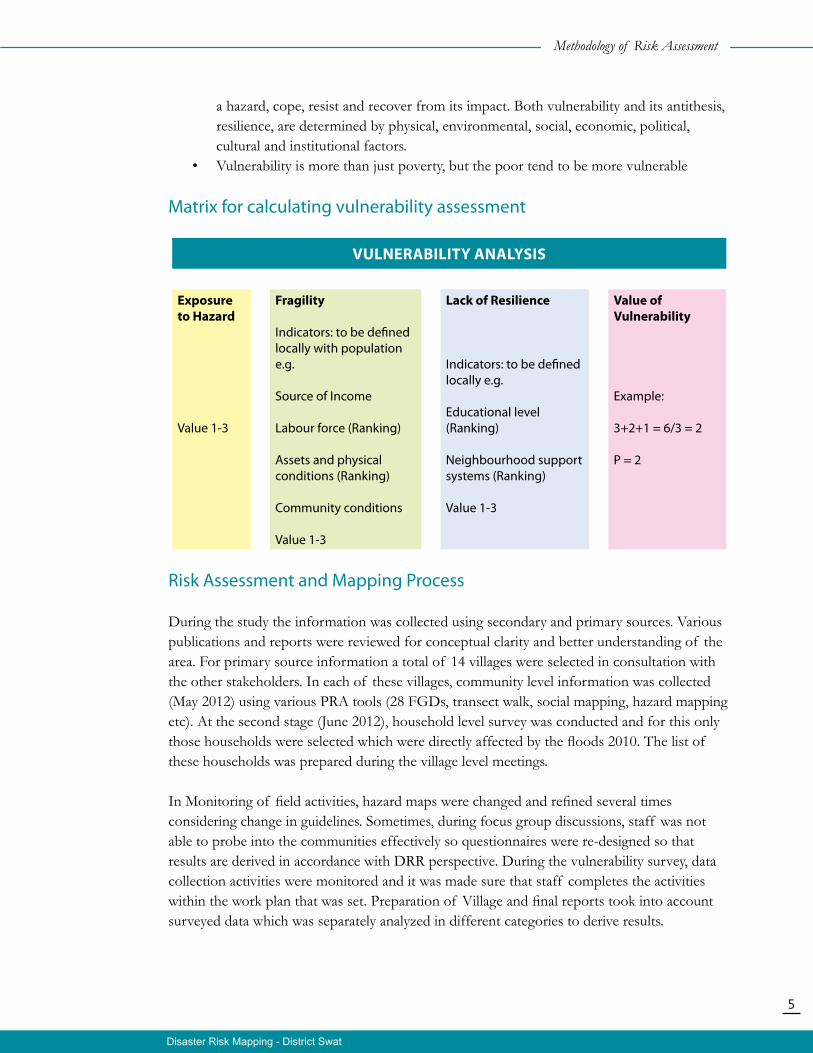
Matrix for calculating vulnerability assessment
Vulnerability analysis
exposure to Hazard
Value 1-3
Fragility
Indicators: to be defined locally with population e.g.
Source of Income
Labour force (Ranking)
Assets and physical conditions (Ranking)
Community conditions
Value 1-3
lack of resilience
Indicators: to be defined locally e.g.
Educational level(Ranking)
Neighbourhood support systems (Ranking)
Value 1-3
Value of Vulnerability
Example:
3+2+1 = 6/3 = 2
P = 2
Risk Assessment and Mapping Process
During the study the information was collected using secondary and primary sources. Various publications and reports were reviewed for conceptual clarity and better understanding of the area. For primary source information a total of 14 villages were selected in consultation with the other stakeholders. In each of these villages, community level information was collected (May 2012) using various PRA tools (28 FGDs, transect walk, social mapping, hazard mapping etc). At the second stage (June 2012), household level survey was conducted and for this only those households were selected which were directly affected by the floods 2010. The list of these households was prepared during the village level meetings.
In Monitoring of field activities, hazard maps were changed and refined several times considering change in guidelines. Sometimes, during focus group discussions, staff was not able to probe into the communities effectively so questionnaires were re-designed so that results are derived in accordance with DRR perspective. During the vulnerability survey, data collection activities were monitored and it was made sure that staff completes the activities within the work plan that was set. Preparation of Village and final reports took into account surveyed data which was separately analyzed in different categories to derive results.
Methodology of Risk Assessment
6
Disaster Risk Mapping - District Swat
Social, political and economic framework conditions
In the province
Communities in Swat have been facing man-made and natural disasters from last 5 years i.e. earth quake, Talbanization, terrorist attacks, bombings, militancy and in most recent context heavy monsoon rains and over flowing of swat river that led to severe flash floods in period of late July 2010. The flood spread across 15 UCS of swat creating wide scale damages ranging from devastation of roads, bridges, infrastructure to destruction of houses, shops and cropped fields. The after effects of the flood are still quite visible across different parts of swat with people still being posed with lack of proper shelter, food and health facilities and as a result are struggling to revitalize normal course of activities, with lack of income at their disposal many are reliant on support from humanitarian agencies and relatives to reconstruct their houses and revive their diminished sources of income. As per the current political situation recent killing of one of the major Taliban leaders have sent waves of negativity amongst general public against the armed forces and therefore pressure is being imposed upon them to evacuate area of swat which had been under stringent army control since flood came about. In the project area
In project areas people are increasingly susceptible to upcoming monsoon rains and the possible damages it can cause. They are gradually reconstructing their damaged houses in the same locations. However due to battered roads, silted water channels and eroded fields, accessibility and socio economic viability is not totally redeemed. Islampur and Saidu Sharif located in lower parts of Swat are more so prone to cloud burst in period of July due to heavy torrential rains, this causes land sliding, opening up of embankments thus leading to destruction of irrigation channels and houses. In upper parts of Swat melting of glaciers and flash floods originating from Kalam river are still a perennial threat to local inhabitants particularly to their agriculture fields because normally people reside at higher zones with their fields at the lower terrain, many villages in upper Swat have been completely washed away hence displaced people have migrated to more safer zones.
7
Disaster Risk Mapping - District Swat
Location of the risk assessment
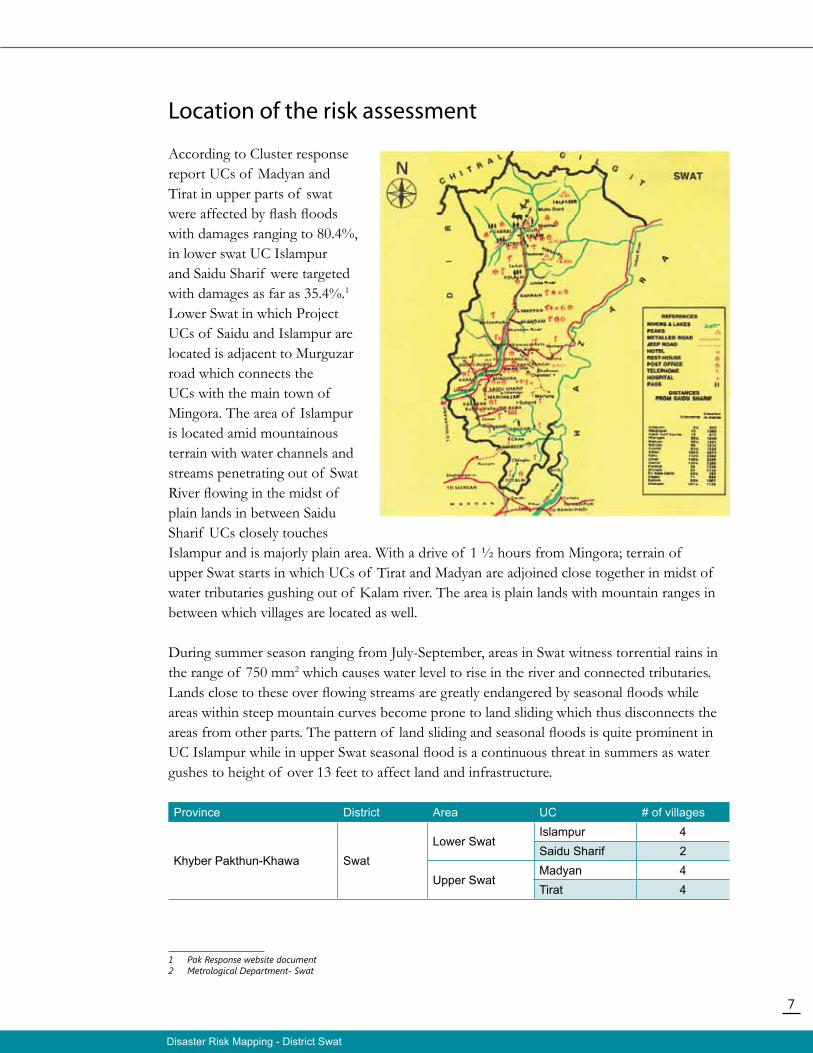
According to Cluster response report UCs of Madyan and Tirat in upper parts of swat were affected by flash floods with damages ranging to 80.4%, in lower swat UC Islampur and Saidu Sharif were targeted with damages as far as 35.4%.1 Lower Swat in which Project UCs of Saidu and Islampur are located is adjacent to Murguzar road which connects the UCs with the main town of Mingora. The area of Islampur is located amid mountainous terrain with water channels and streams penetrating out of Swat River flowing in the midst of plain lands in between Saidu Sharif UCs closely touches Islampur and is majorly plain area. With a drive of 1 ½ hours from Mingora; terrain of upper Swat starts in which UCs of Tirat and Madyan are adjoined close together in midst of water tributaries gushing out of Kalam river. The area is plain lands with mountain ranges in between which villages are located as well.
During summer season ranging from July-September, areas in Swat witness torrential rains in the range of 750 mm2 which causes water level to rise in the river and connected tributaries. Lands close to these over flowing streams are greatly endangered by seasonal floods while areas within steep mountain curves become prone to land sliding which thus disconnects the areas from other parts. The pattern of land sliding and seasonal floods is quite prominent in UC Islampur while in upper Swat seasonal flood is a continuous threat in summers as water gushes to height of over 13 feet to affect land and infrastructure.
Province District Area UC # of villages
Khyber Pakthun-Khawa SwatLower Swat
Islampur 4Saidu Sharif 2
Upper Swat Madyan 4Tirat 4
1 Pak Response website document2 Metrological Department- Swat
8
Disaster Risk Mapping - District Swat
Initial Justification of the Survey
The surveyed areas were selected in context of vast scale damage that were witnessed in different areas of Swat in context of Flood 2010. So criterion that were deemed to be important included household damage, destruction of agriculture land, roads and infrastructure. However during selection process, consideration was paid towards extent of vulnerability that was evident in the areas, in terms of future disaster.
Union Council Justification for SelectionIslampur Murguzar village is the biggest village of UC Islampur and is located amid
steep mountains and patches of plain lands; it generally receives seasonal flooding in the range of 1-3 feet. However in advent of floods 2010 the gushing stream that adjoins the village over flowed from swat river over 5 feet and inflicted damages to buildings, land, infrastructure, Murguzar road and standing crops. Furthermore, due to torrential rains, land sliding often causes blockage of various communities located in mountainous areas. Due to this community became prone to different levels of vulnerabilities in terms of loss of electricity, blockage of pathways and food insecurity. Murguzar village is composed of various sub communities which had damages of variant scale, in Amol Tal community local mosque was destroyed, mud houses and agriculture fields were destroyed, In Zakria community 20 houses were destroyed and heavy torrential rain and cloud burst cut off the area. In Jazwo, community cloud burst created significant damages, walls of many mud houses were destroyed and community was blocked due to ruining of pathways. Other communities including Kadoona and Totramay witnessed loss of agriculture land, damages to mud houses and with land sliding these communities were cut off from rest of the area. Spal Bandai village is closely knitted village in patches of mountains that adjoins it with Murguzar and other village, it also receives seasonal flooding in range of over 1 foot. In advent of flood 2010 the area witnessed significant damage of agriculture land, in various part water channels that connect some of the left over agriculture fields have been severely affected, hence there is a case in which these lands are endangered due to dearth of water supply. Tumbling of rocks due to seasonal flooding also incurred damages to mud houses, walls of which have been battered. Gul Bandai village is closely interconnected with Spal Bandai village. In the area water channels were destroyed and agriculture fields were severely damaged. In various parts of the village due to narrow water channels, water level intensified in minor spaces hence there was penetration of flood water into houses which caused damages particularly to mud houses while also leading to sanitation problems for the communities.
9
Disaster Risk Mapping - District Swat
In 2010 floods water level in Kokrai village was over 5 feet which inflicted damages to the houses and agriculture land in the village. A stream flows adjacent to the village over flowing of which caused water to penetrate into houses which led to sanitation problems. It was also noted that water channels within the village are very narrow hence in case of flood, water is bound to intensify into thin spaces in which houses and fields are located. Therefore these water channels need to be broadened so that flow of water is appropriately channelized and directed.
Saidu Sharif Saidu village connected to rest of the Swat through Murguzar road, is divided into rural and urban zones In 2005, area was hit by earth quake and still jerks of quake are felt in the area but the losses were minor being the mud houses affected, cracks and hollowness in house walls. In advent of flood 2010, water ranged over 5 feet which affected the rural part of Saidu. Highly affected area being the ones near the river and water streams and water channels not only damaged crops but also the houses near them were severely damaged. Massive destruction has been done to standing crops in fields, land, water channels, bridges and houses. In 2005, earthquake hit the Shagai village and there were minor damages to (kacha) mud houses and shops however during present flood, damages were on bigger scale than the earthquake. Crop fields were badly damaged and have now turned into stony area and needs land restoration, 6 houses were damaged, sanitation being the major problem of the area became worst. During flood the dirty water entered the houses and made conditions unhygienic for the community and numerous diseases spread in the area with diarrhea, dehydration (non availability of clean drinking water) and cholera being the top ones and others were allergies, skin rashes and general illness. Villagers said that due to development of our village we have been neglected in relief projects and hence now no rehabilitation program is being carried out in our area despite being the fact that our village is affected.
Madyan Ghari Village is adjacent to Madyan (60 km away from Mingora, Swat) with urban and rural mixed area and has 800 households. During flood, water level was 15-20 feet high and the village was cut off as Madyan road was completely washed away and transportation by road was not possible which completely blocked the area. Water level in Cheel stream (Flood) was high and it made damages on high scales. Snow melted from snowy hills and caused flood in Cheel streams (UC Bishigram) which meets River Swat. Jopin and Ingrabad are totally washed away with flood and fields of Ghari Kalay fields damaged, some land is washed away and irrigation channels are damaged. During flood, hospital was damaged which is now shifted to another rented building.
Initial Justification of the Survey
10
Disaster Risk Mapping - District Swat
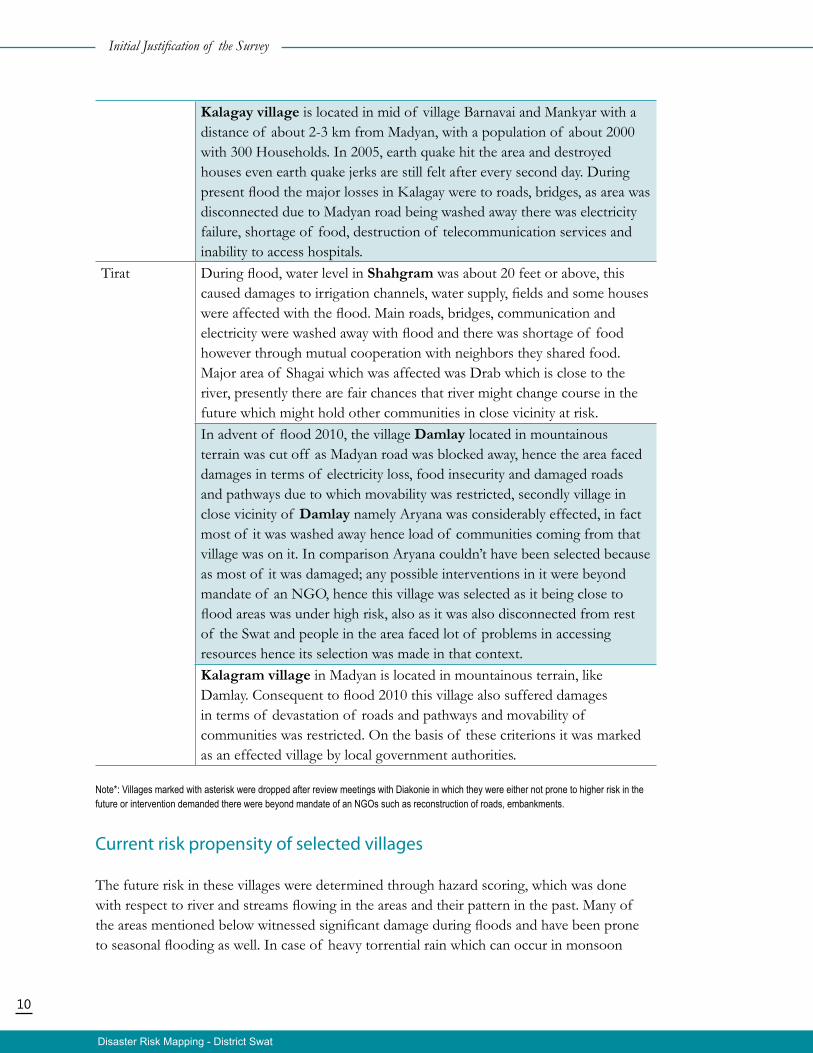
Kalagay village is located in mid of village Barnavai and Mankyar with a distance of about 2-3 km from Madyan, with a population of about 2000 with 300 Households. In 2005, earth quake hit the area and destroyed houses even earth quake jerks are still felt after every second day. During present flood the major losses in Kalagay were to roads, bridges, as area was disconnected due to Madyan road being washed away there was electricity failure, shortage of food, destruction of telecommunication services and inability to access hospitals.
Tirat During flood, water level in Shahgram was about 20 feet or above, this caused damages to irrigation channels, water supply, fields and some houses were affected with the flood. Main roads, bridges, communication and electricity were washed away with flood and there was shortage of food however through mutual cooperation with neighbors they shared food. Major area of Shagai which was affected was Drab which is close to the river, presently there are fair chances that river might change course in the future which might hold other communities in close vicinity at risk. In advent of flood 2010, the village Damlay located in mountainous terrain was cut off as Madyan road was blocked away, hence the area faced damages in terms of electricity loss, food insecurity and damaged roads and pathways due to which movability was restricted, secondly village in close vicinity of Damlay namely Aryana was considerably effected, in fact most of it was washed away hence load of communities coming from that village was on it. In comparison Aryana couldn’t have been selected because as most of it was damaged; any possible interventions in it were beyond mandate of an NGO, hence this village was selected as it being close to flood areas was under high risk, also as it was also disconnected from rest of the Swat and people in the area faced lot of problems in accessing resources hence its selection was made in that context.Kalagram village in Madyan is located in mountainous terrain, like Damlay. Consequent to flood 2010 this village also suffered damages in terms of devastation of roads and pathways and movability of communities was restricted. On the basis of these criterions it was marked as an effected village by local government authorities.
Note*: Villages marked with asterisk were dropped after review meetings with Diakonie in which they were either not prone to higher risk in the future or intervention demanded there were beyond mandate of an NGOs such as reconstruction of roads, embankments.
Current risk propensity of selected villages
The future risk in these villages were determined through hazard scoring, which was done with respect to river and streams flowing in the areas and their pattern in the past. Many of the areas mentioned below witnessed significant damage during floods and have been prone to seasonal flooding as well. In case of heavy torrential rain which can occur in monsoon
Initial Justification of the Survey
11
Disaster Risk Mapping - District Swat
seasons lower Swat is endangered by cloud burst and with areas such as Murguzar, Spal Bandai and Gul Bandai located in vicinity of mountains, damages can be far more significant due to tumbling of rocks and disruption caused along mountain alleys.
Current Risk Levels in Project villages
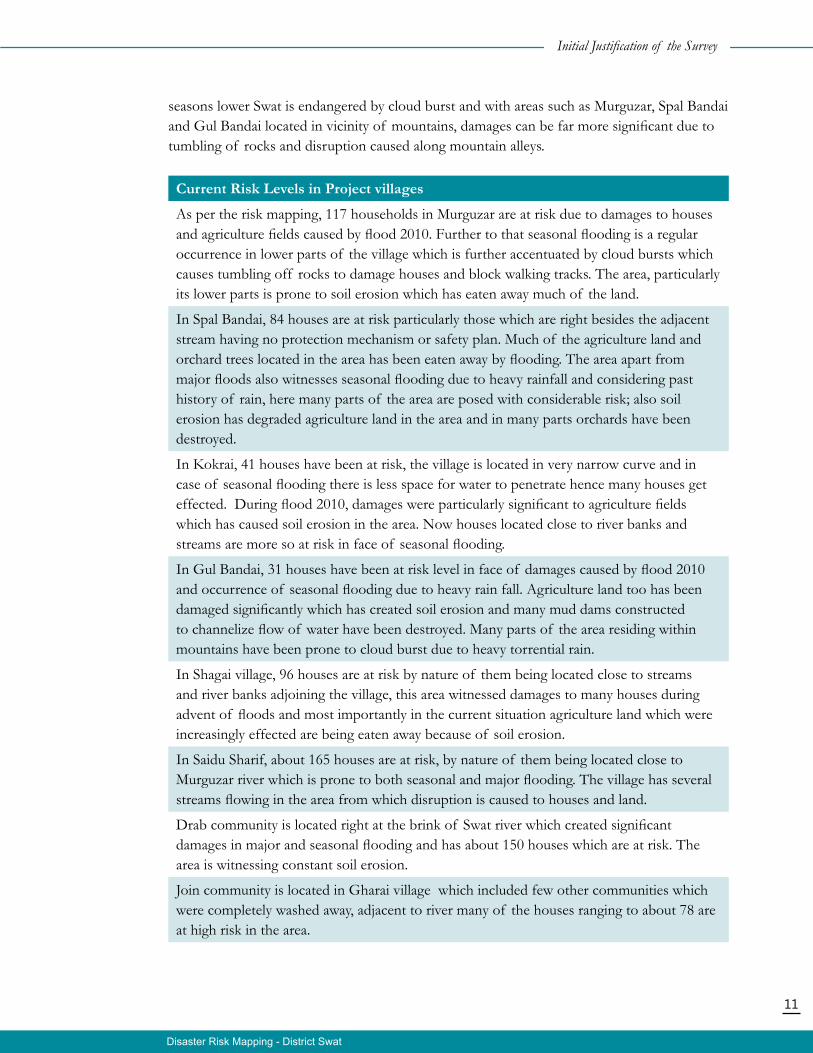
As per the risk mapping, 117 households in Murguzar are at risk due to damages to houses and agriculture fields caused by flood 2010. Further to that seasonal flooding is a regular occurrence in lower parts of the village which is further accentuated by cloud bursts which causes tumbling off rocks to damage houses and block walking tracks. The area, particularly its lower parts is prone to soil erosion which has eaten away much of the land.
In Spal Bandai, 84 houses are at risk particularly those which are right besides the adjacent stream having no protection mechanism or safety plan. Much of the agriculture land and orchard trees located in the area has been eaten away by flooding. The area apart from major floods also witnesses seasonal flooding due to heavy rainfall and considering past history of rain, here many parts of the area are posed with considerable risk; also soil erosion has degraded agriculture land in the area and in many parts orchards have been destroyed.
In Kokrai, 41 houses have been at risk, the village is located in very narrow curve and in case of seasonal flooding there is less space for water to penetrate hence many houses get effected. During flood 2010, damages were particularly significant to agriculture fields which has caused soil erosion in the area. Now houses located close to river banks and streams are more so at risk in face of seasonal flooding.
In Gul Bandai, 31 houses have been at risk level in face of damages caused by flood 2010 and occurrence of seasonal flooding due to heavy rain fall. Agriculture land too has been damaged significantly which has created soil erosion and many mud dams constructed to channelize flow of water have been destroyed. Many parts of the area residing within mountains have been prone to cloud burst due to heavy torrential rain.
In Shagai village, 96 houses are at risk by nature of them being located close to streams and river banks adjoining the village, this area witnessed damages to many houses during advent of floods and most importantly in the current situation agriculture land which were increasingly effected are being eaten away because of soil erosion.
In Saidu Sharif, about 165 houses are at risk, by nature of them being located close to Murguzar river which is prone to both seasonal and major flooding. The village has several streams flowing in the area from which disruption is caused to houses and land.
Drab community is located right at the brink of Swat river which created significant damages in major and seasonal flooding and has about 150 houses which are at risk. The area is witnessing constant soil erosion.
Join community is located in Gharai village which included few other communities which were completely washed away, adjacent to river many of the houses ranging to about 78 are at high risk in the area.
Initial Justification of the Survey
12
Disaster Risk Mapping - District Swat
Process and the criteria applied for the selection of the proposed households
Our definition of a village was guided by government entrenched norms according to which a village outlines segments of Mohalla and different communities closely adjoined together in a homogeneous pattern of landscape, water channels and streams. So in line with that our selection of villages was defined as demarcated by the government. Secondly as mentioned before, villages were selected based on types of hazards such as land sliding and floods which occurred in Islampur in conjunction, other measurable criteria was devastation in terms of houses, land, standing crops, roads and infrastructure, also different levels of vulnerability in terms of local habitat, land holding patterns, income, women/male headed households and food insecurity was also considered while selecting these villages. Once hazard zones in a village were defined through illustration of hazard maps, communities falling under those villages were selected and households within those were selected for survey.
Initial Justification of the Survey
13
Disaster Risk Mapping - District Swat
Collection of secondary data (sources and information)
Topography of Swat
Swat valley lies in the north between 34°40 to 35°N latitude and 72 to 74°6 E longitudes at an altitude of 2000 m above sea level. The region is humid having mild summer with average annual rainfall exceeds 1000 mm and mean annual temperature of about 18°C, with increase of up to 30°C in summers. The rainfall patterns in July- August range from 120-134 mm3. The area amid mountainous terrain with intersection of streams flowing from Swat and Kalam Rivers is prone to different natural hazards. Seasonal flooding is a regular occurrence in the period of July-August when water level rises due to torrential rains and melting of glaciers in higher parts of Pakistan. Over the period of time, effect of deforestation has increased in Swat which has made areas more so prone to land sliding and erosion4. In context of such situation it is important to have community based tree plantation schemes. In terms of trees that can be planted different varieties are viable in Swat which includes Safaida variety, it can be used for terracing along boundary walls of the villages and can also be used for candle making considering electricity is a major problem during flooding when infrastructure comes to an immediate halt.
Types of Hazard in Project area and their definition
All of the communities were seriously affected by major floods of 2010, which rattled most parts of Pakistan. The water in project areas ranged up to level of 5 feet, over flowed from Kalam and Swat rivers and skirted away into narrow streams too to effect houses, agriculture fields, roads, walking tracks and infrastructure mechanism. As indicated from the definition below, flooding beyond mean average accentuate within period of 2.33 years.
Flooding is a natural and recurring event for a river or stream. Statistically, streams will equal or exceed the mean annual flood once every 2.33 years.5 Flooding is a result of heavy or continuous rainfall exceeding the absorptive capacity of soil and the flow capacity of rivers, streams, and coastal areas. This causes a watercourse to overflow its banks onto adjacent lands. Floodplains are, in general, those lands most subject to recurring floods, situated adjacent to rivers and streams. Floodplains are therefore “flood-prone” and are hazardous to development activities if the vulnerability of those activities exceeds an acceptable level.
It is important to note that many of the low lying areas in project UCs come under category of flood plains which can be looked at from different perspectives. To define a floodplain depends somewhat on the goals in mind. As a topographic category it is quite flat and lies adjacent to a stream; geomorphologic ally, it is a landform composed primarily of unconsolidated depositional material derived from sediments being transported by the related
3 Metrological Department-Swat4 Provincial Disaster Management Authority (PDMA)5 Leopold et al., 1964
14
Disaster Risk Mapping - District Swat
stream; hydrologically, it is best defined as a landform subject to periodic flooding by a parent stream. A combination of these [characteristics] perhaps comprises the essential criteria for defining the floodplain” (Schmudde, 1968). Most simply, a flood-plain is defined as “a strip of relatively smooth land bordering a stream and overflowed [sic] at a time of high water.
Flood categories
Seasonal Flood: An overflow of water onto normally dry land. The inundation of a normally dry area caused by rising water in an existing waterway; such as a river, stream, or drainage ditch. Ponding of water at or near the point where the rain fell. Flooding is a longer term event than flash flooding: it may last days or weeks.
Flash flood: A flood caused by heavy or excessive rainfall in a short period of time, generally less than 6 hours. Flash floods are usually characterized by raging torrents after heavy rains that rip through river beds, urban streets, or mountain canyons sweeping everything before them. They can occur within minutes or a few hours of excessive rainfall. They can also occur even if no rain has fallen, for instance after a levee or dam has failed, or after a sudden release of water by a debris or ice jam.6
Cloud burst: Many areas of lower Swat particularly Murguzar, Spal Bandai and Gul Bandai have been prone to cloud burst which resulted in damages to houses, infrastructure and walking tracks while also blocking ways and exit routes for the communities. A cloudburst is an extreme amount of precipitation, sometimes with hail and thunder, which normally lasts no longer than a few minutes but is capable of creating flood conditions. Cloudbursts descend from very high clouds, sometimes with tops above 15 kilometers. Meteorologists say the rain from a cloudburst is usually of the shower type with a fall rate equal to or greater than 100mm (3.94 inches) per hour. During a cloudburst, more than 2 cm of rain may fall in a few minutes. When there are instances of cloudbursts, the results can be disastrous.7
Soil Erosion: Soil Erosion witnessed in flood plains of project area is the process by which material is removed from a region of the Earth surface. It can occur by weathering and transport of solids (sediment,soil, rock and other particles) in the natural environment, and leads to the deposition of these materials elsewhere. It usually occurs due to transport by wind, water, or ice; by down-slope creep of soil and other material under the force of gravity; or by living organisms, such as burrowing animals, in the case of bioerosion.
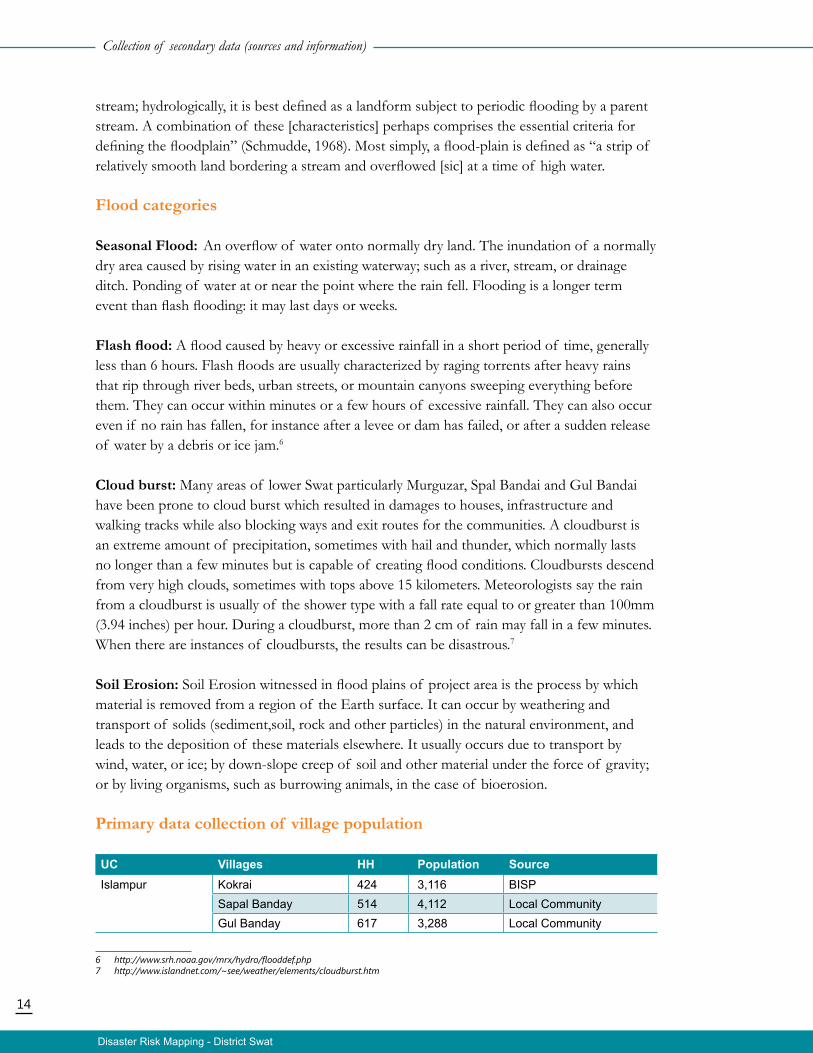
Primary data collection of village population
UC Villages HH Population SourceIslampur Kokrai 424 3,116 BISP
Sapal Banday 514 4,112 Local CommunityGul Banday 617 3,288 Local Community
6 http://www.srh.noaa.gov/mrx/hydro/flooddef.php7 http://www.islandnet.com/~see/weather/elements/cloudburst.htm
Collection of secondary data (sources and information)
15
Disaster Risk Mapping - District Swat
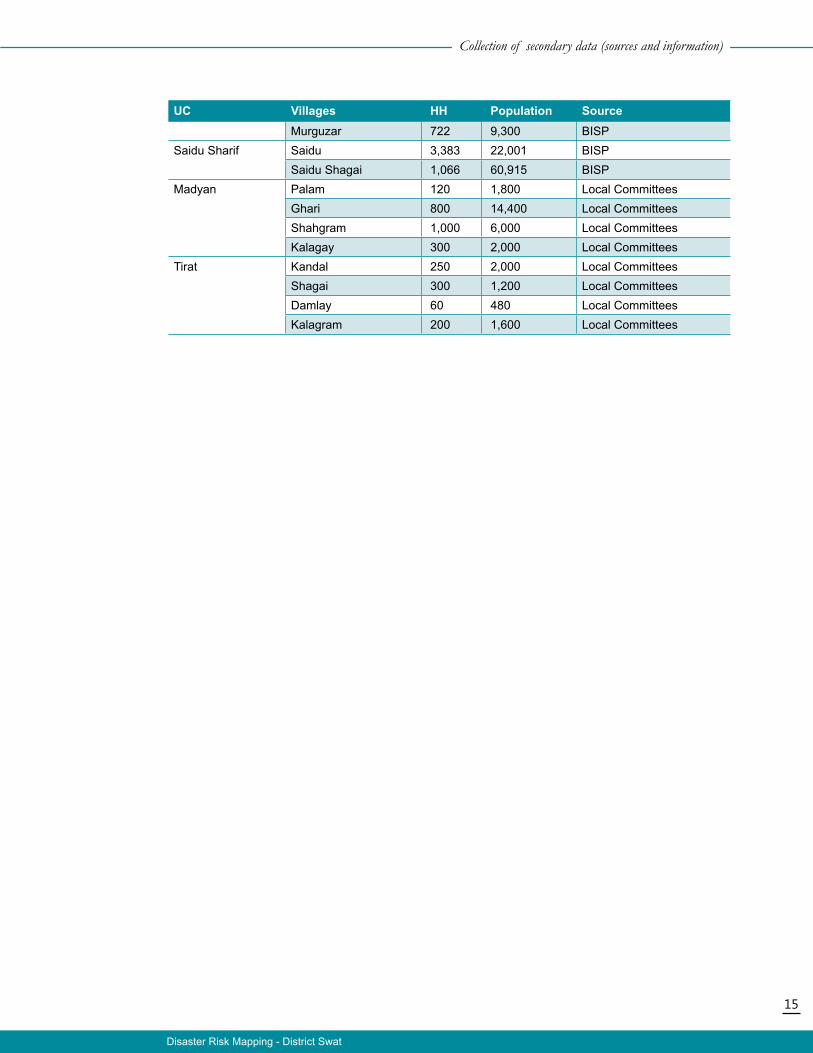
UC Villages HH Population SourceMurguzar 722 9,300 BISP
Saidu Sharif Saidu 3,383 22,001 BISPSaidu Shagai 1,066 60,915 BISP
Madyan Palam 120 1,800 Local Committees Ghari 800 14,400 Local CommitteesShahgram 1,000 6,000 Local CommitteesKalagay 300 2,000 Local Committees
Tirat Kandal 250 2,000 Local CommitteesShagai 300 1,200 Local CommitteesDamlay 60 480 Local CommitteesKalagram 200 1,600 Local Committees
Collection of secondary data (sources and information)
16
Disaster Risk Mapping - District Swat
Hazard Analysis
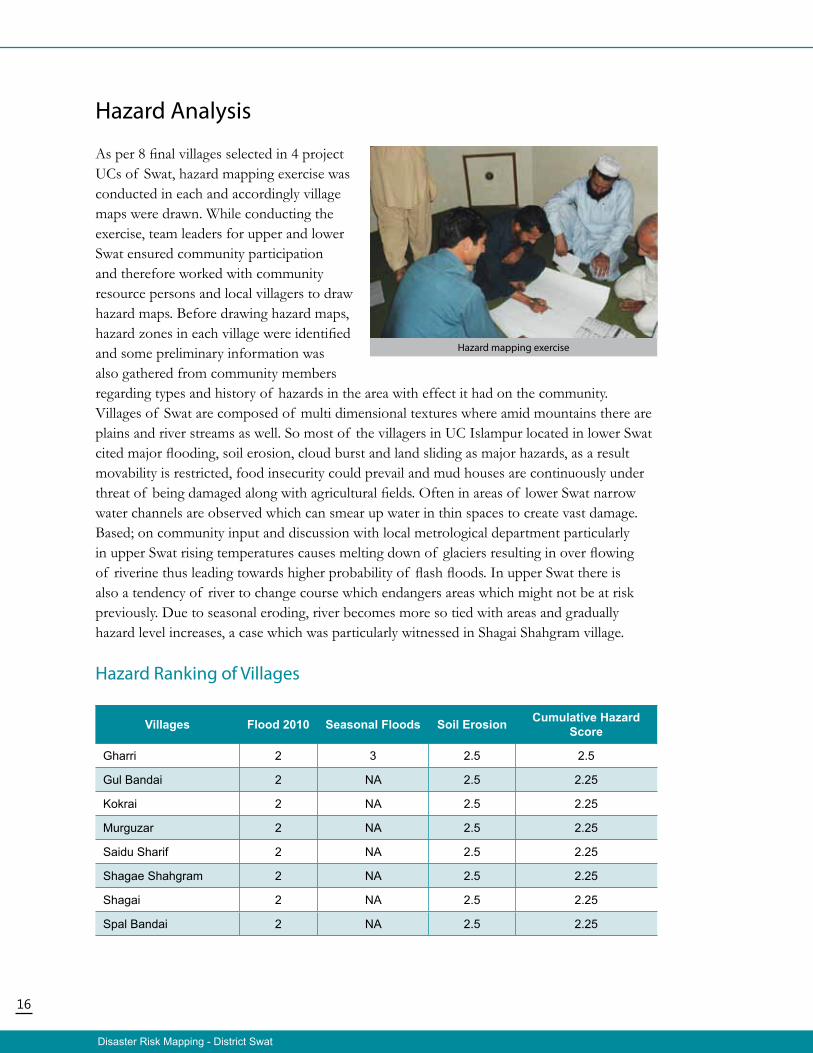
As per 8 final villages selected in 4 project UCs of Swat, hazard mapping exercise was conducted in each and accordingly village maps were drawn. While conducting the exercise, team leaders for upper and lower Swat ensured community participation and therefore worked with community resource persons and local villagers to draw hazard maps. Before drawing hazard maps, hazard zones in each village were identified and some preliminary information was also gathered from community members regarding types and history of hazards in the area with effect it had on the community. Villages of Swat are composed of multi dimensional textures where amid mountains there are plains and river streams as well. So most of the villagers in UC Islampur located in lower Swat cited major flooding, soil erosion, cloud burst and land sliding as major hazards, as a result movability is restricted, food insecurity could prevail and mud houses are continuously under threat of being damaged along with agricultural fields. Often in areas of lower Swat narrow water channels are observed which can smear up water in thin spaces to create vast damage. Based; on community input and discussion with local metrological department particularly in upper Swat rising temperatures causes melting down of glaciers resulting in over flowing of riverine thus leading towards higher probability of flash floods. In upper Swat there is also a tendency of river to change course which endangers areas which might not be at risk previously. Due to seasonal eroding, river becomes more so tied with areas and gradually hazard level increases, a case which was particularly witnessed in Shagai Shahgram village.
Hazard Ranking of Villages
Villages Flood 2010 Seasonal Floods Soil Erosion Cumulative Hazard Score
Gharri 2 3 2.5 2.5
Gul Bandai 2 NA 2.5 2.25
Kokrai 2 NA 2.5 2.25
Murguzar 2 NA 2.5 2.25
Saidu Sharif 2 NA 2.5 2.25
Shagae Shahgram 2 NA 2.5 2.25
Shagai 2 NA 2.5 2.25
Spal Bandai 2 NA 2.5 2.25
Hazard mapping exercise
17
Disaster Risk Mapping - District Swat
Methodology notes for Ranking
Under each village two significant hazards were taken into account and selected in terms of their magnitude and frequency. Barring Gharai village, all other villages were prone to soil erosion and affects of Flood 2010. With regard to Flood 2010, magnitude indicator was selected measured in terms of level of water rise starting from above 5 feet which is denoted by scale of 3.
It was felt that frequency was not a strong indicator in this situation because flood 2010 was of one the worst natural calamities in Pakistan, and if we measure it by frequency intensity of it in terms of hazard position it would be under valued. With regard to seasonal flooding which occurs in most parts of Swat due to over flowing of Swat and Kalam rivers, both magnitude and frequency are emphasized as effective indicators, as it occurs every year in scale of up to 3 feet.
Based on these hazards overall hazard score has been determined. Gharai, located in upper Swat carries the highest score in terms of devastation it has during seasonal as well as 2010 flood. The determined hazard scores have laid basis for conducting vulnerability survey computation of which with hazard scores will give measure of risk assessment of communities.
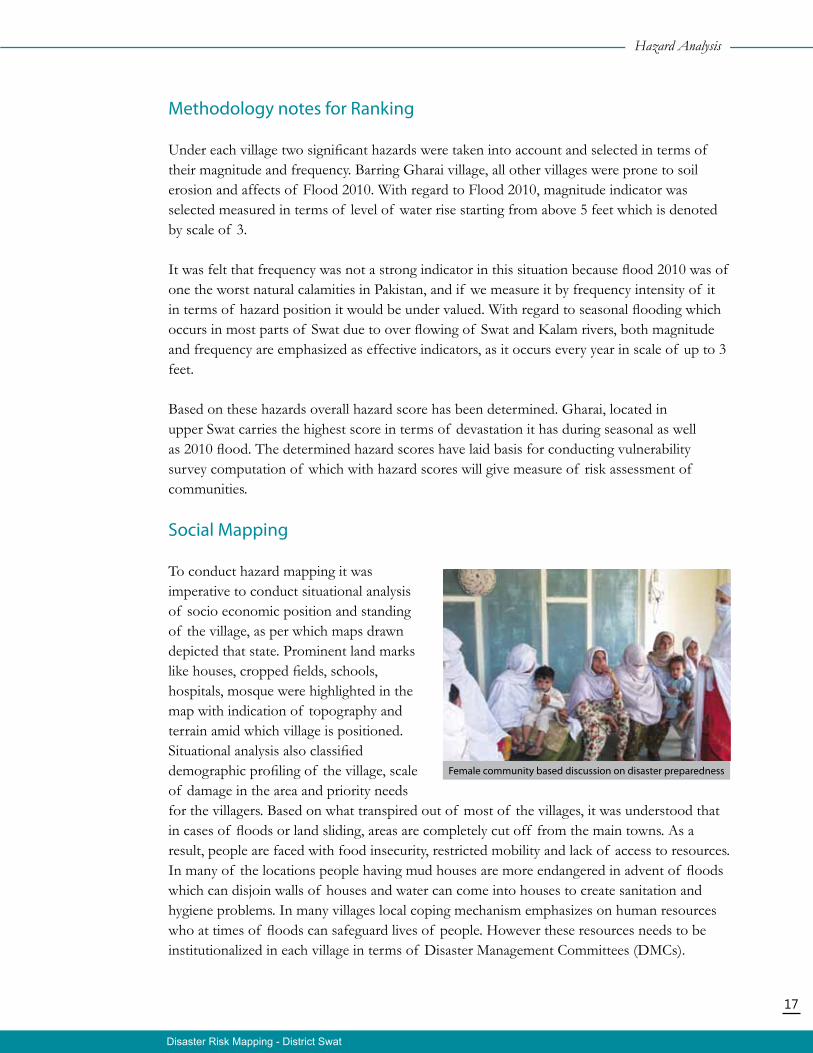
Social Mapping
To conduct hazard mapping it was imperative to conduct situational analysis of socio economic position and standing of the village, as per which maps drawn depicted that state. Prominent land marks like houses, cropped fields, schools, hospitals, mosque were highlighted in the map with indication of topography and terrain amid which village is positioned. Situational analysis also classified demographic profiling of the village, scale of damage in the area and priority needs for the villagers. Based on what transpired out of most of the villages, it was understood that in cases of floods or land sliding, areas are completely cut off from the main towns. As a result, people are faced with food insecurity, restricted mobility and lack of access to resources. In many of the locations people having mud houses are more endangered in advent of floods which can disjoin walls of houses and water can come into houses to create sanitation and hygiene problems. In many villages local coping mechanism emphasizes on human resources who at times of floods can safeguard lives of people. However these resources needs to be institutionalized in each village in terms of Disaster Management Committees (DMCs).
Hazard Analysis
Female community based discussion on disaster preparedness
18
Disaster Risk Mapping - District Swat
Transect Walk
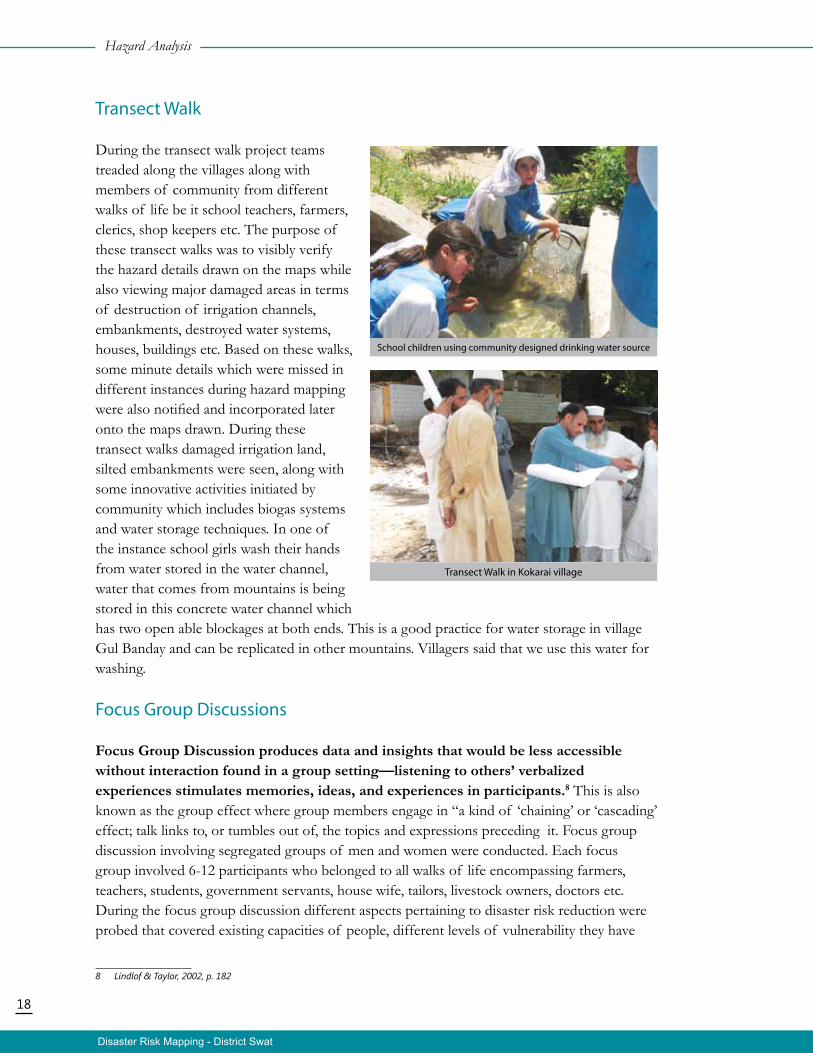
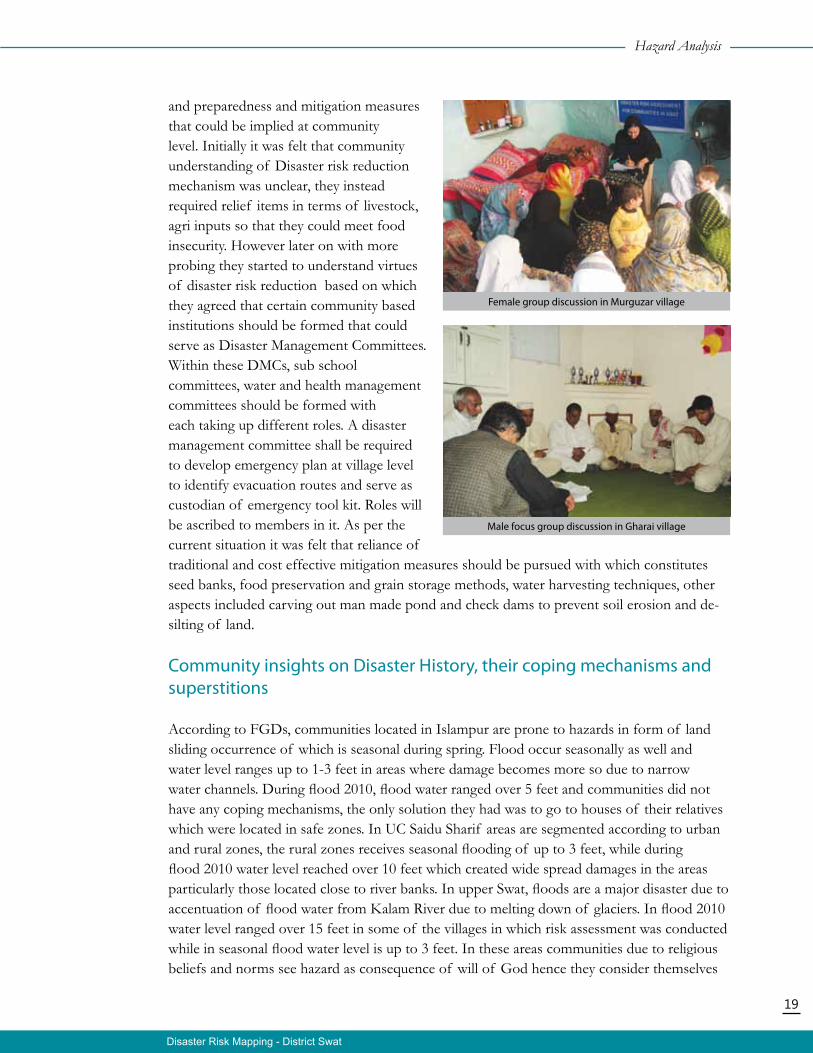
During the transect walk project teams treaded along the villages along with members of community from different walks of life be it school teachers, farmers, clerics, shop keepers etc. The purpose of these transect walks was to visibly verify the hazard details drawn on the maps while also viewing major damaged areas in terms of destruction of irrigation channels, embankments, destroyed water systems, houses, buildings etc. Based on these walks, some minute details which were missed in different instances during hazard mapping were also notified and incorporated later onto the maps drawn. During these transect walks damaged irrigation land, silted embankments were seen, along with some innovative activities initiated by community which includes biogas systems and water storage techniques. In one of the instance school girls wash their hands from water stored in the water channel, water that comes from mountains is being stored in this concrete water channel which has two open able blockages at both ends. This is a good practice for water storage in village Gul Banday and can be replicated in other mountains. Villagers said that we use this water for washing.
Focus Group Discussions
Focus Group Discussion produces data and insights that would be less accessible without interaction found in a group setting—listening to others’ verbalized experiences stimulates memories, ideas, and experiences in participants.8 This is also known as the group effect where group members engage in “a kind of ‘chaining’ or ‘cascading’ effect; talk links to, or tumbles out of, the topics and expressions preceding it. Focus group discussion involving segregated groups of men and women were conducted. Each focus group involved 6-12 participants who belonged to all walks of life encompassing farmers, teachers, students, government servants, house wife, tailors, livestock owners, doctors etc. During the focus group discussion different aspects pertaining to disaster risk reduction were probed that covered existing capacities of people, different levels of vulnerability they have
8 Lindlof&Taylor,2002,p.182
Hazard Analysis
School children using community designed drinking water source
Transect Walk in Kokarai village
19
Disaster Risk Mapping - District Swat
and preparedness and mitigation measures that could be implied at community level. Initially it was felt that community understanding of Disaster risk reduction mechanism was unclear, they instead required relief items in terms of livestock, agri inputs so that they could meet food insecurity. However later on with more probing they started to understand virtues of disaster risk reduction based on which they agreed that certain community based institutions should be formed that could serve as Disaster Management Committees. Within these DMCs, sub school committees, water and health management committees should be formed with each taking up different roles. A disaster management committee shall be required to develop emergency plan at village level to identify evacuation routes and serve as custodian of emergency tool kit. Roles will be ascribed to members in it. As per the current situation it was felt that reliance of traditional and cost effective mitigation measures should be pursued with which constitutes seed banks, food preservation and grain storage methods, water harvesting techniques, other aspects included carving out man made pond and check dams to prevent soil erosion and de-silting of land.
Community insights on Disaster History, their coping mechanisms and superstitions
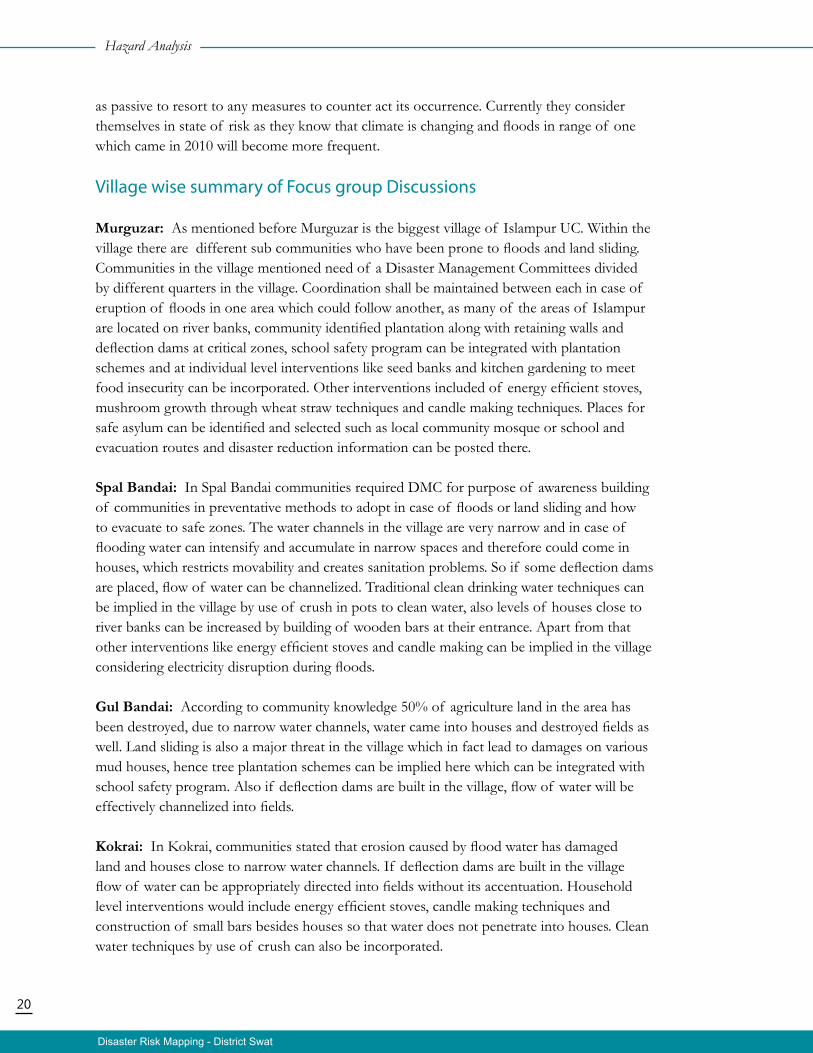
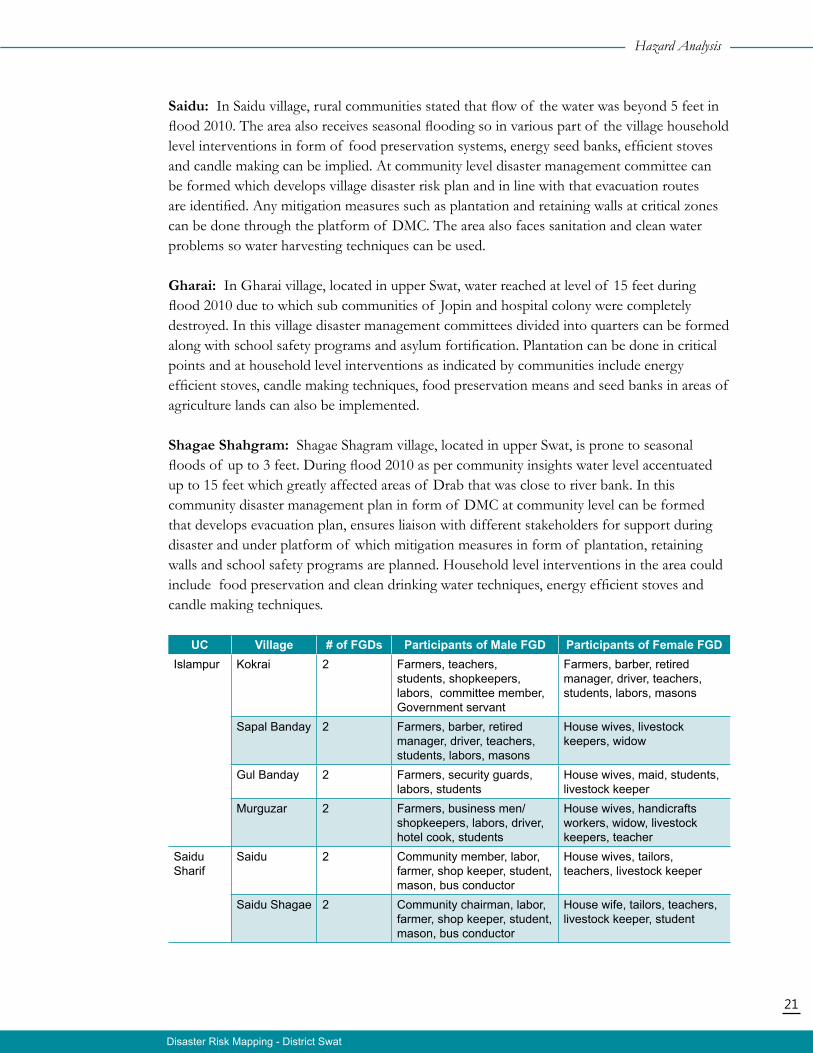
According to FGDs, communities located in Islampur are prone to hazards in form of land sliding occurrence of which is seasonal during spring. Flood occur seasonally as well and water level ranges up to 1-3 feet in areas where damage becomes more so due to narrow water channels. During flood 2010, flood water ranged over 5 feet and communities did not have any coping mechanisms, the only solution they had was to go to houses of their relatives which were located in safe zones. In UC Saidu Sharif areas are segmented according to urban and rural zones, the rural zones receives seasonal flooding of up to 3 feet, while during flood 2010 water level reached over 10 feet which created wide spread damages in the areas particularly those located close to river banks. In upper Swat, floods are a major disaster due to accentuation of flood water from Kalam River due to melting down of glaciers. In flood 2010 water level ranged over 15 feet in some of the villages in which risk assessment was conducted while in seasonal flood water level is up to 3 feet. In these areas communities due to religious beliefs and norms see hazard as consequence of will of God hence they consider themselves
Female group discussion in Murguzar village
Male focus group discussion in Gharai village
Hazard Analysis
20
Disaster Risk Mapping - District Swat
as passive to resort to any measures to counter act its occurrence. Currently they consider themselves in state of risk as they know that climate is changing and floods in range of one which came in 2010 will become more frequent.
Village wise summary of Focus group Discussions
Murguzar: As mentioned before Murguzar is the biggest village of Islampur UC. Within the village there are different sub communities who have been prone to floods and land sliding. Communities in the village mentioned need of a Disaster Management Committees divided by different quarters in the village. Coordination shall be maintained between each in case of eruption of floods in one area which could follow another, as many of the areas of Islampur are located on river banks, community identified plantation along with retaining walls and deflection dams at critical zones, school safety program can be integrated with plantation schemes and at individual level interventions like seed banks and kitchen gardening to meet food insecurity can be incorporated. Other interventions included of energy efficient stoves, mushroom growth through wheat straw techniques and candle making techniques. Places for safe asylum can be identified and selected such as local community mosque or school and evacuation routes and disaster reduction information can be posted there.
Spal Bandai: In Spal Bandai communities required DMC for purpose of awareness building of communities in preventative methods to adopt in case of floods or land sliding and how to evacuate to safe zones. The water channels in the village are very narrow and in case of flooding water can intensify and accumulate in narrow spaces and therefore could come in houses, which restricts movability and creates sanitation problems. So if some deflection dams are placed, flow of water can be channelized. Traditional clean drinking water techniques can be implied in the village by use of crush in pots to clean water, also levels of houses close to river banks can be increased by building of wooden bars at their entrance. Apart from that other interventions like energy efficient stoves and candle making can be implied in the village considering electricity disruption during floods.
Gul Bandai: According to community knowledge 50% of agriculture land in the area has been destroyed, due to narrow water channels, water came into houses and destroyed fields as well. Land sliding is also a major threat in the village which in fact lead to damages on various mud houses, hence tree plantation schemes can be implied here which can be integrated with school safety program. Also if deflection dams are built in the village, flow of water will be effectively channelized into fields.
Kokrai: In Kokrai, communities stated that erosion caused by flood water has damaged land and houses close to narrow water channels. If deflection dams are built in the village flow of water can be appropriately directed into fields without its accentuation. Household level interventions would include energy efficient stoves, candle making techniques and construction of small bars besides houses so that water does not penetrate into houses. Clean water techniques by use of crush can also be incorporated.
Hazard Analysis
21
Disaster Risk Mapping - District Swat
Saidu: In Saidu village, rural communities stated that flow of the water was beyond 5 feet in flood 2010. The area also receives seasonal flooding so in various part of the village household level interventions in form of food preservation systems, energy seed banks, efficient stoves and candle making can be implied. At community level disaster management committee can be formed which develops village disaster risk plan and in line with that evacuation routes are identified. Any mitigation measures such as plantation and retaining walls at critical zones can be done through the platform of DMC. The area also faces sanitation and clean water problems so water harvesting techniques can be used.
Gharai: In Gharai village, located in upper Swat, water reached at level of 15 feet during flood 2010 due to which sub communities of Jopin and hospital colony were completely destroyed. In this village disaster management committees divided into quarters can be formed along with school safety programs and asylum fortification. Plantation can be done in critical points and at household level interventions as indicated by communities include energy efficient stoves, candle making techniques, food preservation means and seed banks in areas of agriculture lands can also be implemented.
Shagae Shahgram: Shagae Shagram village, located in upper Swat, is prone to seasonal floods of up to 3 feet. During flood 2010 as per community insights water level accentuated up to 15 feet which greatly affected areas of Drab that was close to river bank. In this community disaster management plan in form of DMC at community level can be formed that develops evacuation plan, ensures liaison with different stakeholders for support during disaster and under platform of which mitigation measures in form of plantation, retaining walls and school safety programs are planned. Household level interventions in the area could include food preservation and clean drinking water techniques, energy efficient stoves and candle making techniques.
UC Village # of FGDs Participants of Male FGD Participants of Female FGDIslampur Kokrai 2 Farmers, teachers,
students, shopkeepers, labors, committee member, Government servant
Farmers, barber, retired manager, driver, teachers, students, labors, masons
Sapal Banday 2 Farmers, barber, retired manager, driver, teachers, students, labors, masons
House wives, livestock keepers, widow
Gul Banday 2 Farmers, security guards, labors, students
House wives, maid, students, livestock keeper
Murguzar 2 Farmers, business men/ shopkeepers, labors, driver, hotel cook, students
House wives, handicrafts workers, widow, livestock keepers, teacher
Saidu Sharif
Saidu 2 Community member, labor, farmer, shop keeper, student, mason, bus conductor
House wives, tailors, teachers, livestock keeper
Saidu Shagae 2 Community chairman, labor, farmer, shop keeper, student, mason, bus conductor
House wife, tailors, teachers, livestock keeper, student
Hazard Analysis
22
Disaster Risk Mapping - District Swat
UC Village # of FGDs Participants of Male FGD Participants of Female FGDMadyan Palam 2 Labor, student, tailor,
government servant, farmers, medicine store keeper
House wife, student, tailor, farmer
Ghari 2 Shop keeper, social worker, government teacher, land lord, student, electrician, transporter, retired manager, social activists, doctor
House wife, tailor, tuck shop keeper, student
Shahgram 2 Shop keeper, farmer, tailor, driver
House wife, tailor
Kalagay 2 Student, farmer, government servant
House wife, tailor
Tirat Kandal 2 Teacher, business man, exporter, police man, shop keeper, labor, students
House wife, student
Shagai 2 Shop keeper, farmer, teachers, student
House wife, student, livestock keeper
Damlay 2 Cleric, land lord, school teacher, driver, shop keeper
Government primary teacher, house wife, tailor
Kalagram 2 Shop keeper, farmer, teachers, student
House wife, student, livestock keeper
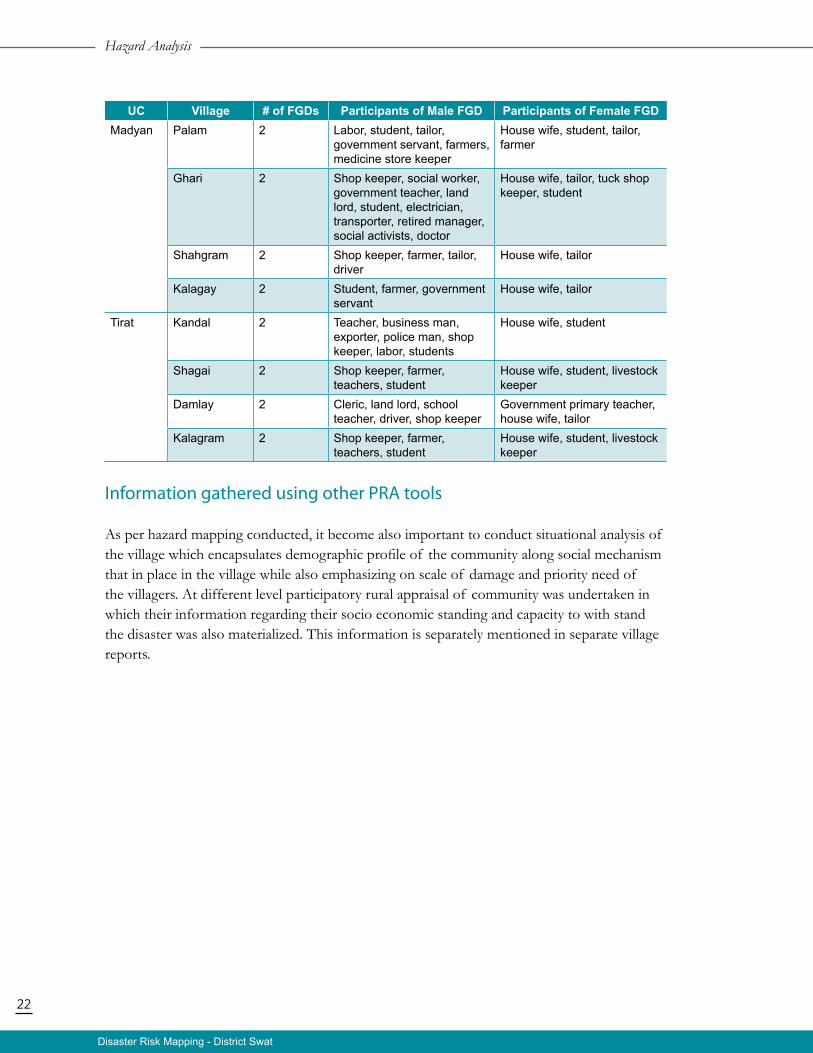
Information gathered using other PRA tools
As per hazard mapping conducted, it become also important to conduct situational analysis of the village which encapsulates demographic profile of the community along social mechanism that in place in the village while also emphasizing on scale of damage and priority need of the villagers. At different level participatory rural appraisal of community was undertaken in which their information regarding their socio economic standing and capacity to with stand the disaster was also materialized. This information is separately mentioned in separate village reports.
Hazard Analysis
Disaster Risk Mapping - District Swat
23
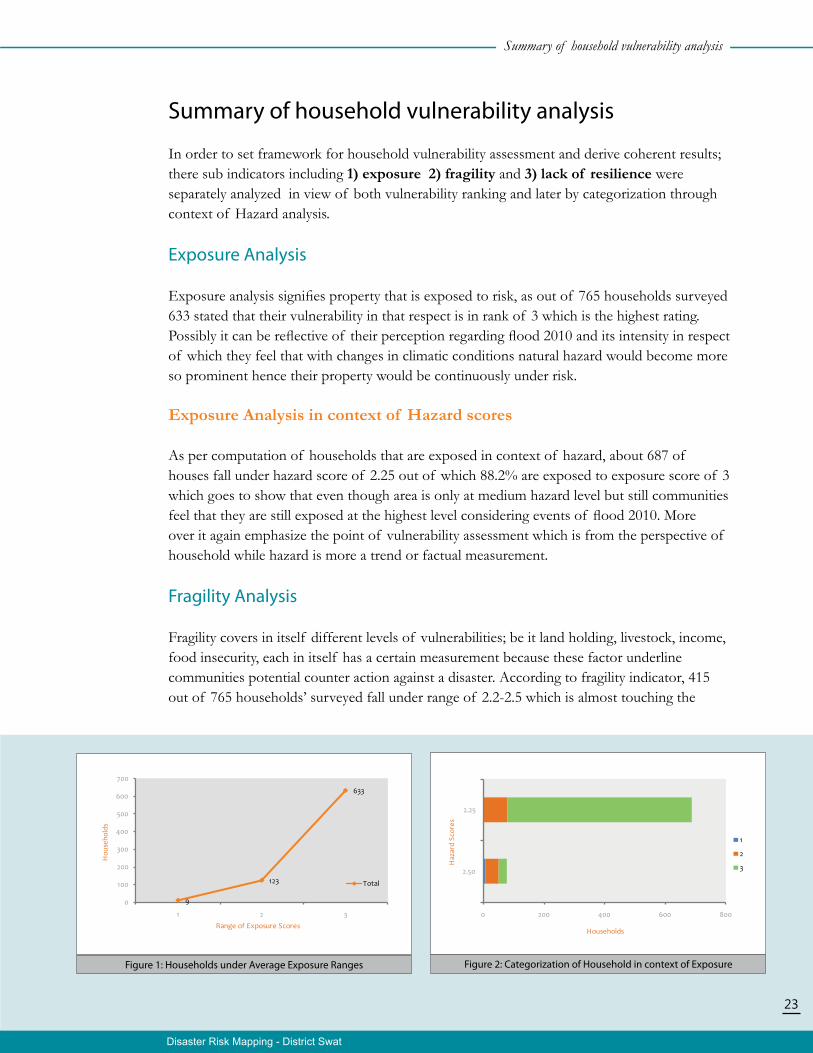
Figure 2: Categorization of Household in context of ExposureFigure 1: Households under Average Exposure Ranges
Summary of household vulnerability analysis
In order to set framework for household vulnerability assessment and derive coherent results; there sub indicators including 1) exposure 2) fragility and 3) lack of resilience were separately analyzed in view of both vulnerability ranking and later by categorization through context of Hazard analysis.
Exposure Analysis
Exposure analysis signifies property that is exposed to risk, as out of 765 households surveyed 633 stated that their vulnerability in that respect is in rank of 3 which is the highest rating. Possibly it can be reflective of their perception regarding flood 2010 and its intensity in respect of which they feel that with changes in climatic conditions natural hazard would become more so prominent hence their property would be continuously under risk.
Exposure Analysis in context of Hazard scores
As per computation of households that are exposed in context of hazard, about 687 of houses fall under hazard score of 2.25 out of which 88.2% are exposed to exposure score of 3 which goes to show that even though area is only at medium hazard level but still communities feel that they are still exposed at the highest level considering events of flood 2010. More over it again emphasize the point of vulnerability assessment which is from the perspective of household while hazard is more a trend or factual measurement.
Fragility Analysis
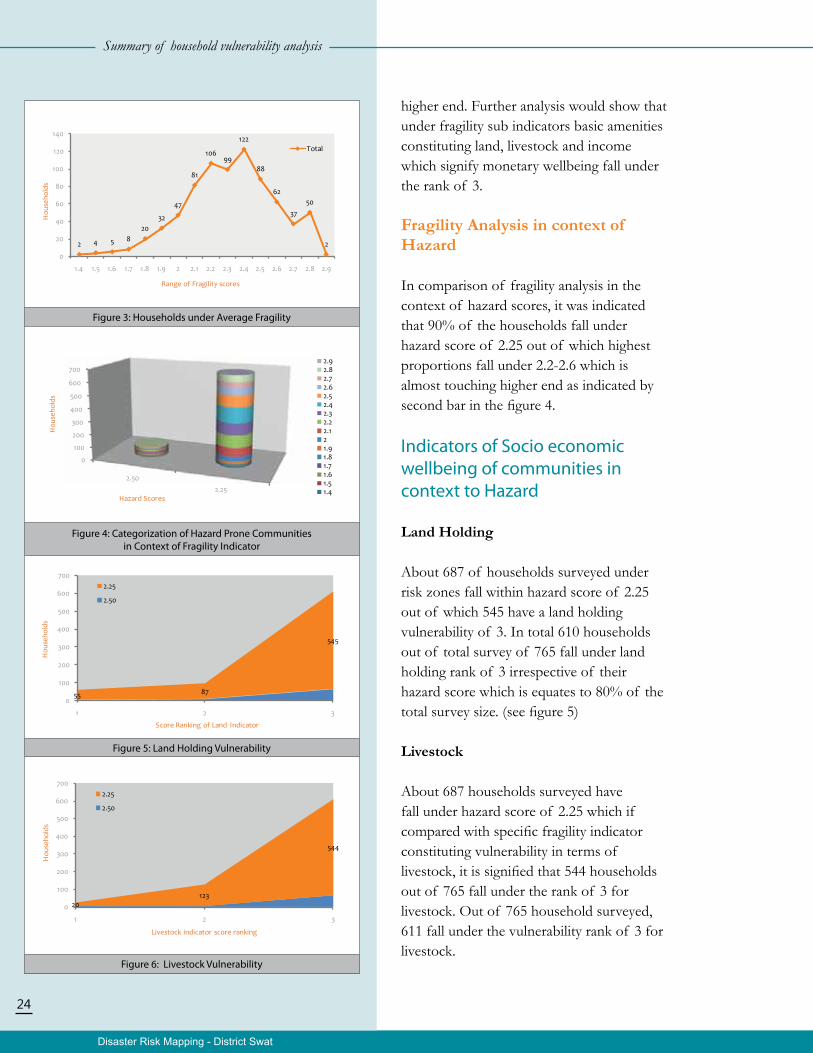
Fragility covers in itself different levels of vulnerabilities; be it land holding, livestock, income, food insecurity, each in itself has a certain measurement because these factor underline communities potential counter action against a disaster. According to fragility indicator, 415 out of 765 households’ surveyed fall under range of 2.2-2.5 which is almost touching the
Summary of household vulnerability analysis
Disaster Risk Mapping - District Swat
24
higher end. Further analysis would show that under fragility sub indicators basic amenities constituting land, livestock and income which signify monetary wellbeing fall under the rank of 3.
Fragility Analysis in context of Hazard
In comparison of fragility analysis in the context of hazard scores, it was indicated that 90% of the households fall under hazard score of 2.25 out of which highest proportions fall under 2.2-2.6 which is almost touching higher end as indicated by second bar in the figure 4.
Indicators of Socio economic wellbeing of communities in context to Hazard
Land Holding
About 687 of households surveyed under risk zones fall within hazard score of 2.25 out of which 545 have a land holding vulnerability of 3. In total 610 households out of total survey of 765 fall under land holding rank of 3 irrespective of their hazard score which is equates to 80% of the total survey size. (see figure 5)
Livestock
About 687 households surveyed have fall under hazard score of 2.25 which if compared with specific fragility indicator constituting vulnerability in terms of livestock, it is signified that 544 households out of 765 fall under the rank of 3 for livestock. Out of 765 household surveyed, 611 fall under the vulnerability rank of 3 for livestock.
Summary of household vulnerability analysis
Figure 3: Households under Average Fragility
Figure 4: Categorization of Hazard Prone Communities in Context of Fragility Indicator
Figure 5: Land Holding Vulnerability
Figure 6: Livestock Vulnerability
Disaster Risk Mapping - District Swat
25
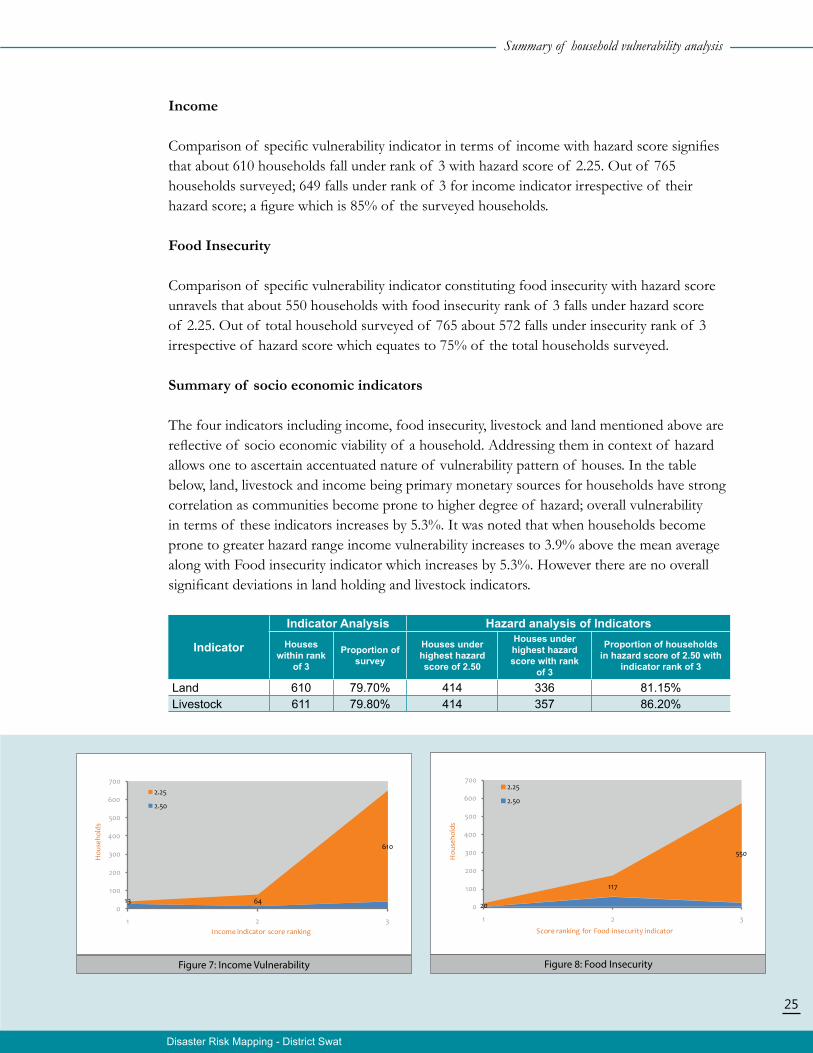
Figure 8: Food InsecurityFigure 7: Income Vulnerability
Income
Comparison of specific vulnerability indicator in terms of income with hazard score signifies that about 610 households fall under rank of 3 with hazard score of 2.25. Out of 765 households surveyed; 649 falls under rank of 3 for income indicator irrespective of their hazard score; a figure which is 85% of the surveyed households.
Food Insecurity
Comparison of specific vulnerability indicator constituting food insecurity with hazard score unravels that about 550 households with food insecurity rank of 3 falls under hazard score of 2.25. Out of total household surveyed of 765 about 572 falls under insecurity rank of 3 irrespective of hazard score which equates to 75% of the total households surveyed.
Summary of socio economic indicators
The four indicators including income, food insecurity, livestock and land mentioned above are reflective of socio economic viability of a household. Addressing them in context of hazard allows one to ascertain accentuated nature of vulnerability pattern of houses. In the table below, land, livestock and income being primary monetary sources for households have strong correlation as communities become prone to higher degree of hazard; overall vulnerability in terms of these indicators increases by 5.3%. It was noted that when households become prone to greater hazard range income vulnerability increases to 3.9% above the mean average along with Food insecurity indicator which increases by 5.3%. However there are no overall significant deviations in land holding and livestock indicators.
Indicator
Indicator Analysis Hazard analysis of IndicatorsHouses
within rank of 3
Proportion of survey
Houses under highest hazard score of 2.50
Houses under highest hazard score with rank
of 3
Proportion of households in hazard score of 2.50 with
indicator rank of 3
Land 610 79.70% 414 336 81.15%Livestock 611 79.80% 414 357 86.20%
Summary of household vulnerability analysis
Disaster Risk Mapping - District Swat
26
Indicator
Indicator Analysis Hazard analysis of IndicatorsHouses
within rank of 3
Proportion of survey
Houses under highest hazard score of 2.50
Houses under highest hazard score with rank
of 3
Proportion of households in hazard score of 2.50 with
indicator rank of 3
Food Insecurity 572 74.70% 414 310 74.80%Income 649 84.80% 414 363 87.60%
Lack of resilience
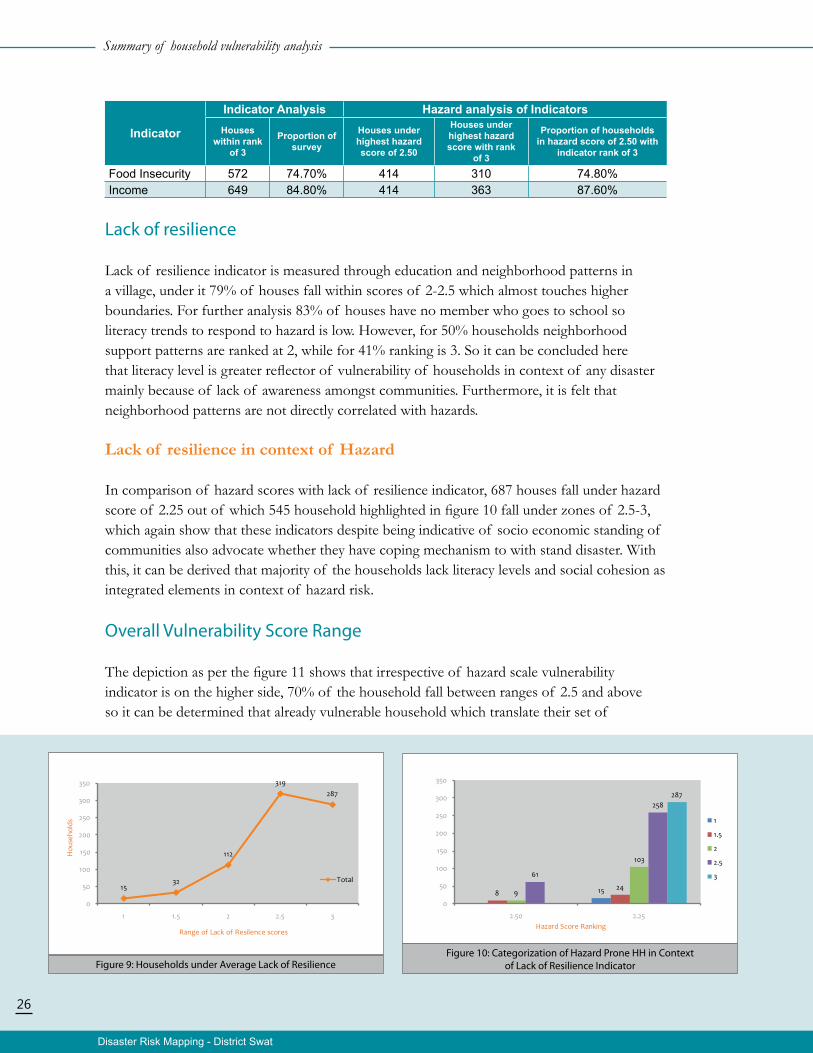
Lack of resilience indicator is measured through education and neighborhood patterns in a village, under it 79% of houses fall within scores of 2-2.5 which almost touches higher boundaries. For further analysis 83% of houses have no member who goes to school so literacy trends to respond to hazard is low. However, for 50% households neighborhood support patterns are ranked at 2, while for 41% ranking is 3. So it can be concluded here that literacy level is greater reflector of vulnerability of households in context of any disaster mainly because of lack of awareness amongst communities. Furthermore, it is felt that neighborhood patterns are not directly correlated with hazards.
Lack of resilience in context of Hazard
In comparison of hazard scores with lack of resilience indicator, 687 houses fall under hazard score of 2.25 out of which 545 household highlighted in figure 10 fall under zones of 2.5-3, which again show that these indicators despite being indicative of socio economic standing of communities also advocate whether they have coping mechanism to with stand disaster. With this, it can be derived that majority of the households lack literacy levels and social cohesion as integrated elements in context of hazard risk.
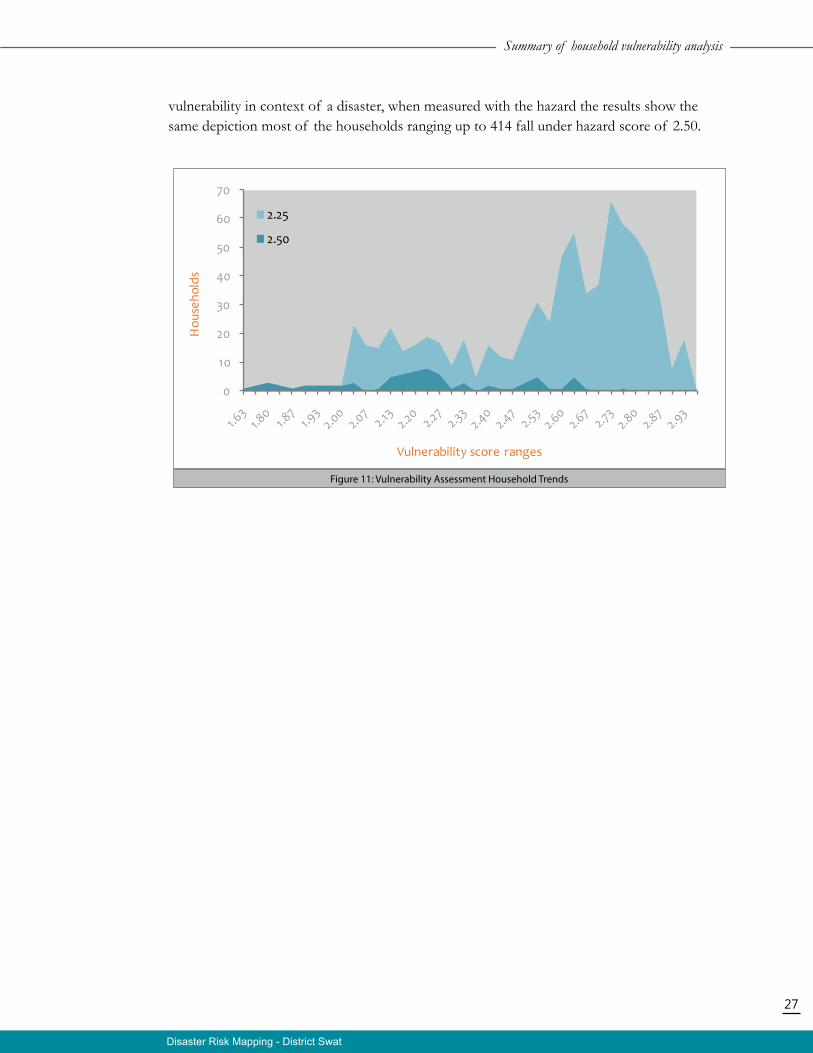
Overall Vulnerability Score Range
The depiction as per the figure 11 shows that irrespective of hazard scale vulnerability indicator is on the higher side, 70% of the household fall between ranges of 2.5 and above so it can be determined that already vulnerable household which translate their set of
Summary of household vulnerability analysis
Figure 9: Households under Average Lack of ResilienceFigure 10: Categorization of Hazard Prone HH in Context
of Lack of Resilience Indicator
27
Disaster Risk Mapping - District Swat
vulnerability in context of a disaster, when measured with the hazard the results show the same depiction most of the households ranging up to 414 fall under hazard score of 2.50.
Figure 11: Vulnerability Assessment Household Trends
Summary of household vulnerability analysis
28
Disaster Risk Mapping - District Swat
Identified DRR & CCA project interventions
Components Interventions
Disaster Preparedness Formation of Disaster Management Committees at village level under which roles will be ascribed to members in terms of disaster awareness at community level, coordination with different stakeholder, custodianship of emergency tool kit that is provided. Once a Disaster comes this community will enact as an emergency unit under fold of which they shall be separate search and rescue, communication, first aid team. These DMCs as per community based knowledge will be divided into different village quarters and will develop a network of regular coordination between each other.
Inclusion of sub school, water management and health committees with defined roles
Training in CBDRM Model for roles taken up by different committees
Development of Village level Hazard planning (identification of evacuation routes, fortification of community buildings like schools as safe asylums, mapping of safe and hazard prone areas)
Establishment of disaster management funds for different mitigation measures at community level.
Initiating school safety programs (Mock drills)
Linkage strengthening with local municipals and line authorities
Mitigation Measures Plantation of trees alongside river bank, using shrubs and rocks to mitigate risks. Construction of small scale retaining walls.
Kitchen gardening for food conservation. Encourage use of traditional food preservation methods eg. grain storage, meat preservation. Considering that many of the villages particularly those in lower Swat are cut off from the main area due to land sliding and floods which blocks pathways thus creating inaccessibility towards resources. In lower Swat many people located in mountainous terrain have barren lands as well on which Mushroom plantation can be initialized considering food insecurity in the area.
Homemade fuel efficient energy stoves, biogas systems and cost effective candle making techniques considering electricity problems that can be created.
Using humus and organic matter to prevent soil erosion and degeneration
Creation of seed Banks
Water harvesting and preservation of rain fed water mechanisms such as roof water harvesting, clean drinking water techniques by use of crush
Disaster Risk Mapping - District Swat
29
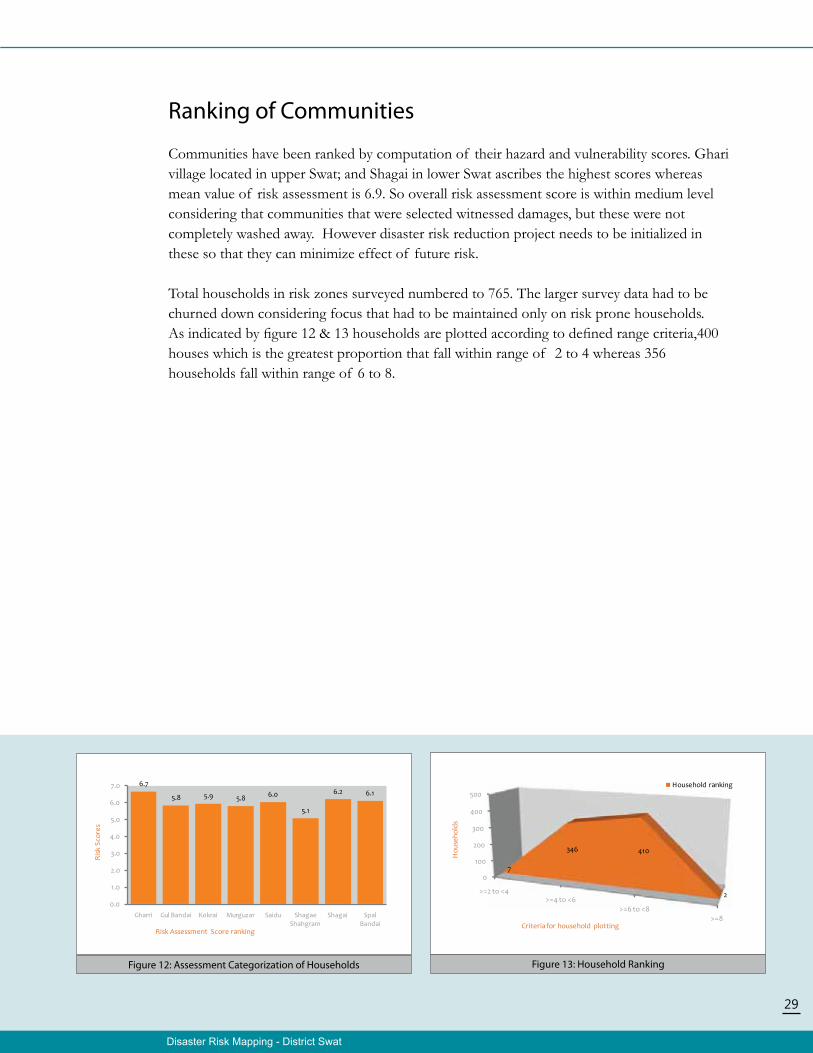
Figure 13: Household RankingFigure 12: Assessment Categorization of Households
Ranking of Communities
Communities have been ranked by computation of their hazard and vulnerability scores. Ghari village located in upper Swat; and Shagai in lower Swat ascribes the highest scores whereas mean value of risk assessment is 6.9. So overall risk assessment score is within medium level considering that communities that were selected witnessed damages, but these were not completely washed away. However disaster risk reduction project needs to be initialized in these so that they can minimize effect of future risk.
Total households in risk zones surveyed numbered to 765. The larger survey data had to be churned down considering focus that had to be maintained only on risk prone households. As indicated by figure 12 & 13 households are plotted according to defined range criteria,400 houses which is the greatest proportion that fall within range of 2 to 4 whereas 356 households fall within range of 6 to 8.
Annexes
31
Disaster Risk Mapping - District Swat
Annexes
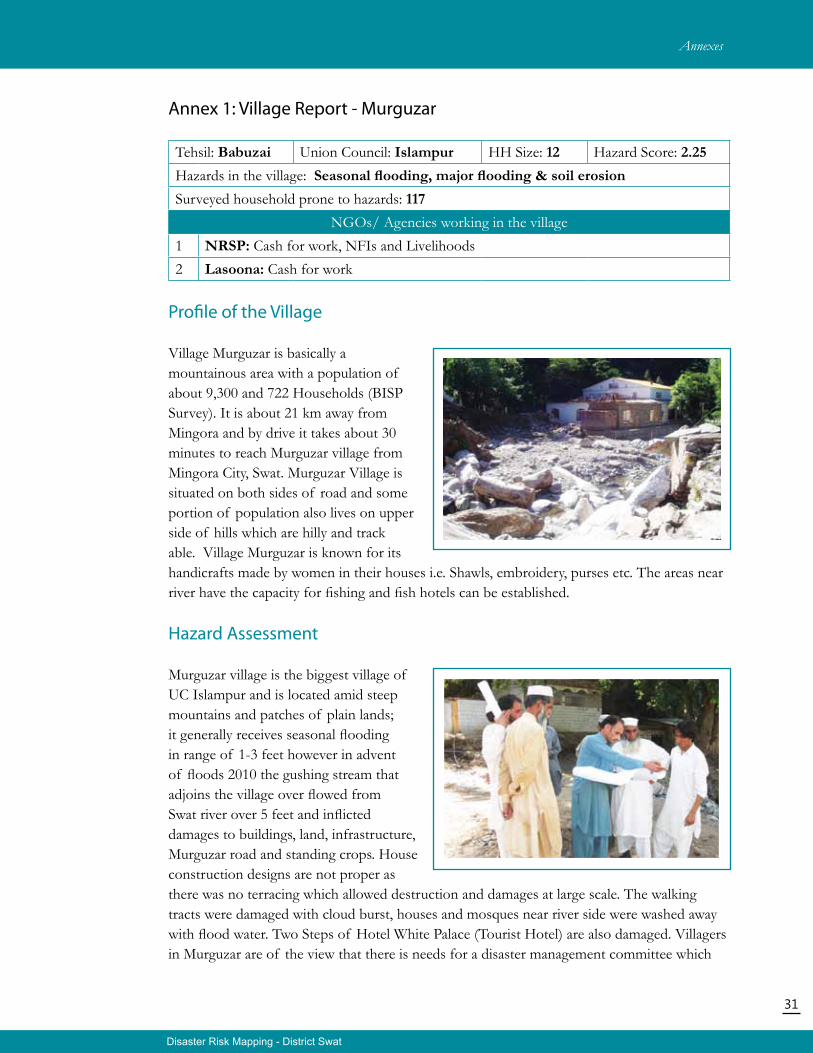
Annex 1: Village Report - Murguzar
Tehsil: Babuzai Union Council: Islampur HH Size: 12 Hazard Score: 2.25Hazards in the village: Seasonal flooding, major flooding & soil erosionSurveyed household prone to hazards: 117
NGOs/ Agencies working in the village1 NRSP: Cash for work, NFIs and Livelihoods2 Lasoona: Cash for work
Profile of the Village
Village Murguzar is basically a mountainous area with a population of about 9,300 and 722 Households (BISP Survey). It is about 21 km away from Mingora and by drive it takes about 30 minutes to reach Murguzar village from Mingora City, Swat. Murguzar Village is situated on both sides of road and some portion of population also lives on upper side of hills which are hilly and track able. Village Murguzar is known for its handicrafts made by women in their houses i.e. Shawls, embroidery, purses etc. The areas near river have the capacity for fishing and fish hotels can be established.
Hazard Assessment
Murguzar village is the biggest village of UC Islampur and is located amid steep mountains and patches of plain lands; it generally receives seasonal flooding in range of 1-3 feet however in advent of floods 2010 the gushing stream that adjoins the village over flowed from Swat river over 5 feet and inflicted damages to buildings, land, infrastructure, Murguzar road and standing crops. House construction designs are not proper as there was no terracing which allowed destruction and damages at large scale. The walking tracts were damaged with cloud burst, houses and mosques near river side were washed away with flood water. Two Steps of Hotel White Palace (Tourist Hotel) are also damaged. Villagers in Murguzar are of the view that there is needs for a disaster management committee which
Disaster Risk Mapping - District Swat
Disaster Risk Mapping - District Swat
32
develops an emergency plan and creates awareness among committee. They also need terracing and plantations that can be integrated with school safety program. Committee member of Murguzar Village told that they are working in Cash for work schemes with NRSP and Lasoona Organization but this work is only temporary. They said “we have stones and crush as natural resource which we get from river if we are only provided with cement we can rehabilitate our roads.” This will provide a permanent solution for the walking tracts rehabilitation as well as land sliding will not destroy the walking tract again. Establishment of small dispensaries or first aid trainings and water quality management trainings to villagers will help minimize the effects of disaster.
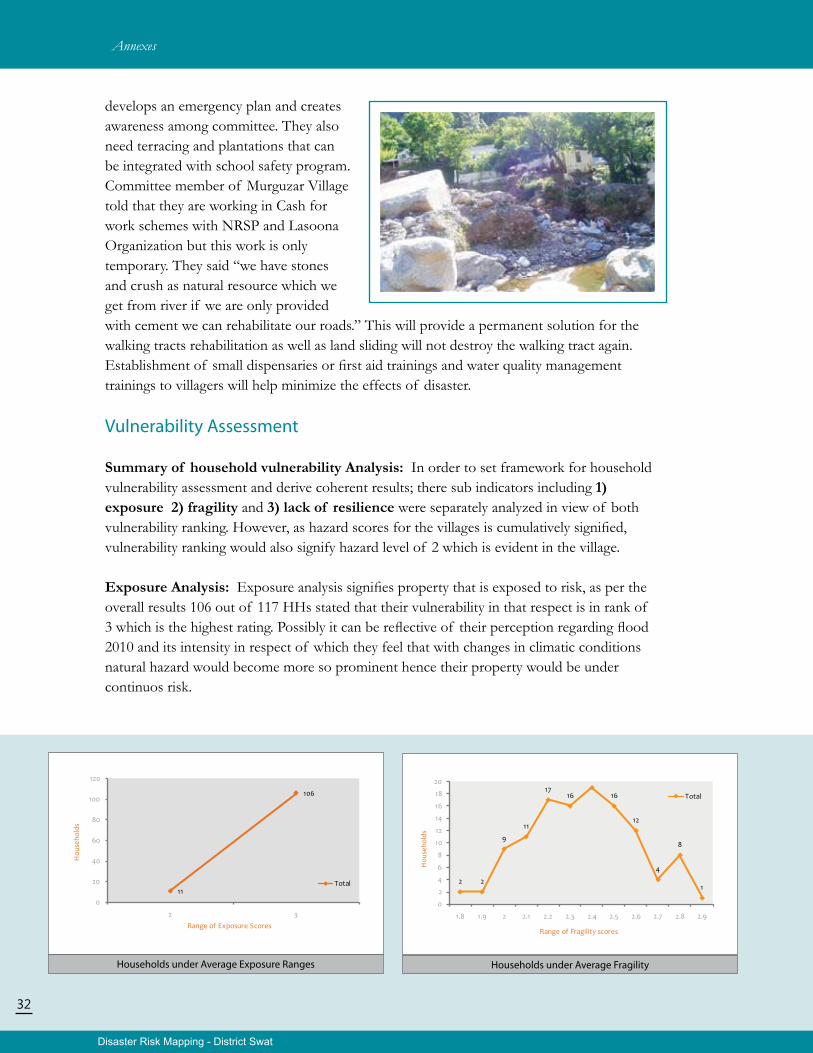
Vulnerability Assessment
Summary of household vulnerability Analysis: In order to set framework for household vulnerability assessment and derive coherent results; there sub indicators including 1) exposure 2) fragility and 3) lack of resilience were separately analyzed in view of both vulnerability ranking. However, as hazard scores for the villages is cumulatively signified, vulnerability ranking would also signify hazard level of 2 which is evident in the village.
Exposure Analysis: Exposure analysis signifies property that is exposed to risk, as per the overall results 106 out of 117 HHs stated that their vulnerability in that respect is in rank of 3 which is the highest rating. Possibly it can be reflective of their perception regarding flood 2010 and its intensity in respect of which they feel that with changes in climatic conditions natural hazard would become more so prominent hence their property would be under continuos risk.
Households under Average Exposure Ranges Households under Average Fragility
Annexes
Disaster Risk Mapping - District Swat
33
Land Holding Vulnerability
Livestock Vulnerability
Income Vulnerability
Food Insecurity
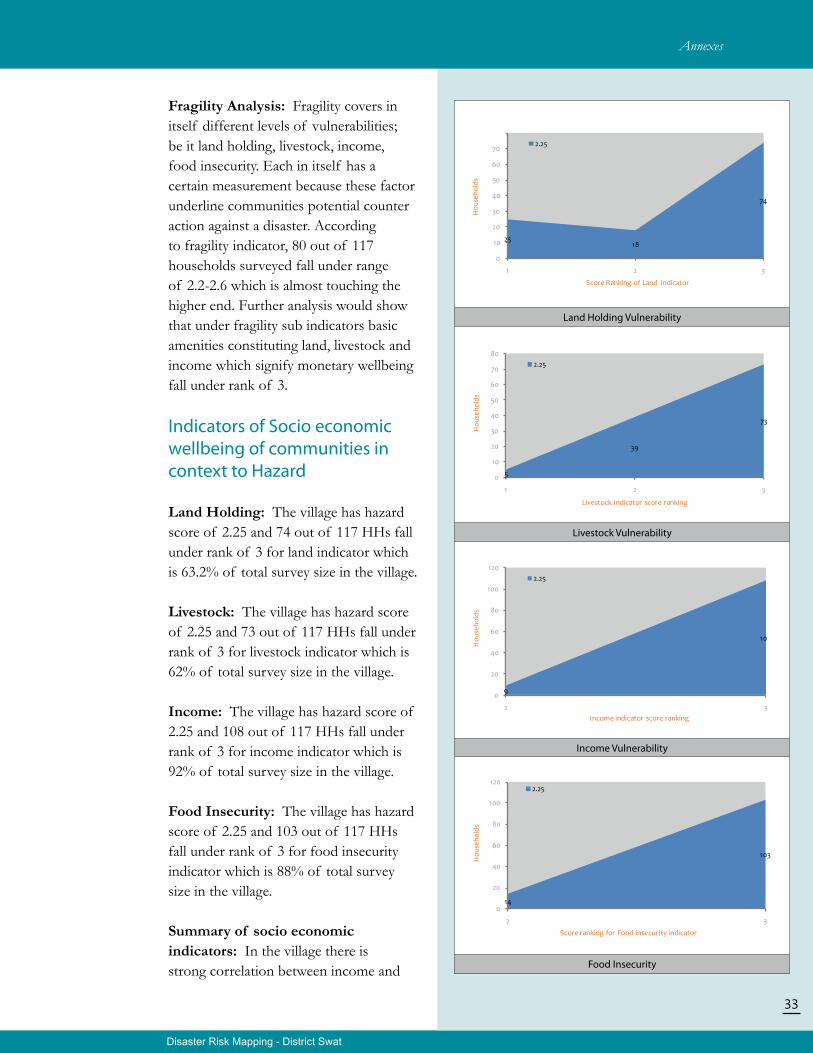
Fragility Analysis: Fragility covers in itself different levels of vulnerabilities; be it land holding, livestock, income, food insecurity. Each in itself has a certain measurement because these factor underline communities potential counter action against a disaster. According to fragility indicator, 80 out of 117 households surveyed fall under range of 2.2-2.6 which is almost touching the higher end. Further analysis would show that under fragility sub indicators basic amenities constituting land, livestock and income which signify monetary wellbeing fall under rank of 3.
Indicators of Socio economic wellbeing of communities in context to Hazard
Land Holding: The village has hazard score of 2.25 and 74 out of 117 HHs fall under rank of 3 for land indicator which is 63.2% of total survey size in the village.
Livestock: The village has hazard score of 2.25 and 73 out of 117 HHs fall under rank of 3 for livestock indicator which is 62% of total survey size in the village.
Income: The village has hazard score of 2.25 and 108 out of 117 HHs fall under rank of 3 for income indicator which is 92% of total survey size in the village.
Food Insecurity: The village has hazard score of 2.25 and 103 out of 117 HHs fall under rank of 3 for food insecurity indicator which is 88% of total survey size in the village.
Summary of socio economic indicators: In the village there is strong correlation between income and
Annexes
Disaster Risk Mapping - District Swat
34
Households under average Lack of Resilience
Vulnerability Assessment Household Trends
Household Count of Risk Assessment
Murguzar Risk Map
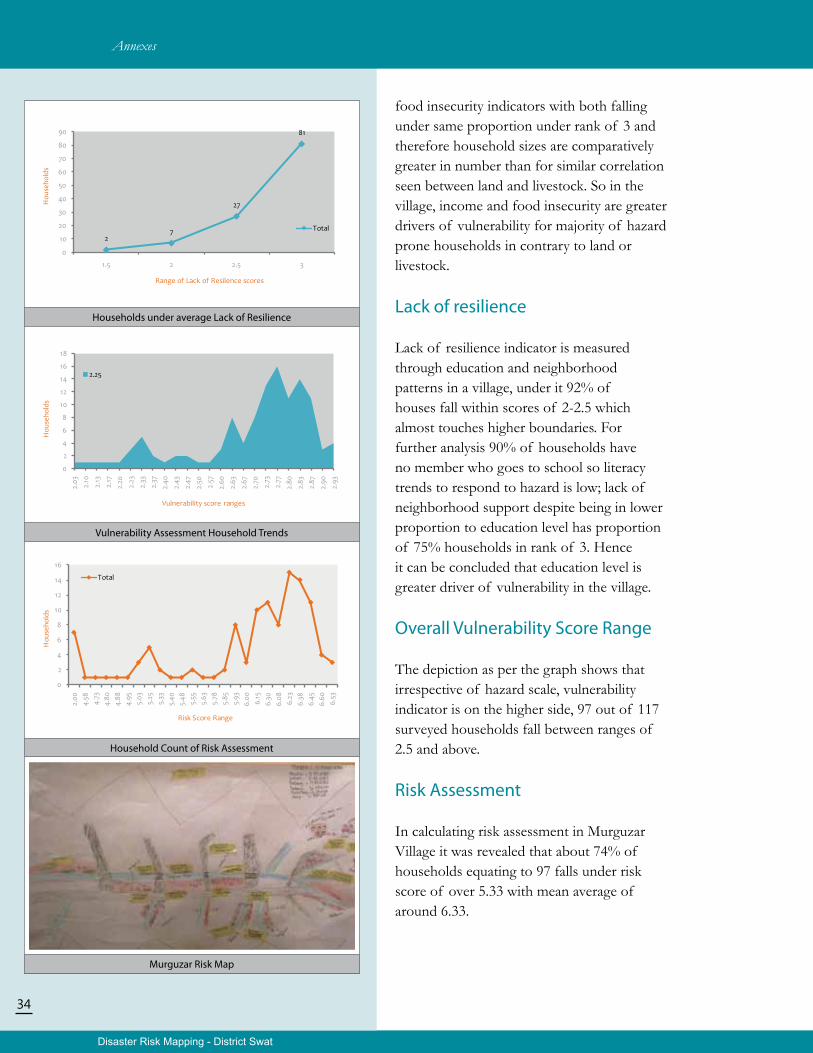
food insecurity indicators with both falling under same proportion under rank of 3 and therefore household sizes are comparatively greater in number than for similar correlation seen between land and livestock. So in the village, income and food insecurity are greater drivers of vulnerability for majority of hazard prone households in contrary to land or livestock.
Lack of resilience
Lack of resilience indicator is measured through education and neighborhood patterns in a village, under it 92% of houses fall within scores of 2-2.5 which almost touches higher boundaries. For further analysis 90% of households have no member who goes to school so literacy trends to respond to hazard is low; lack of neighborhood support despite being in lower proportion to education level has proportion of 75% households in rank of 3. Hence it can be concluded that education level is greater driver of vulnerability in the village.
Overall Vulnerability Score Range
The depiction as per the graph shows that irrespective of hazard scale, vulnerability indicator is on the higher side, 97 out of 117 surveyed households fall between ranges of 2.5 and above.
Risk Assessment
In calculating risk assessment in Murguzar Village it was revealed that about 74% of households equating to 97 falls under risk score of over 5.33 with mean average of around 6.33.
Annexes
35
Disaster Risk Mapping - District Swat
Accessibility
Average altitude of the village: Low as compared to Upper SwatAverage time that villages are cut off during the winter time: Due to cloud burst and heavy rain falls in winter (December and January) and summers (July and August) cause land sliding and Chitor road (Road turning from Murguzar Road to Kokrai) is blockedAvailability of public and other transport: No public transport is available in the village and villagers have to walk to Murguzar Road to get the public transport.
Demographic Profile
Name of Village
No. of Total HH
No. of widows & Single Women*
No. of Child-
headed HHs*
No. of elderly
as head of HHs*
No. ofdisabledas headof HHs*
Priority Needs Village Infrastructure
Murguzar 722 50 20-30 150 5 DMCs and Sub DMCs, Plantation, Mushroom Cultivation, food preservation, Kitchen gardening, Candle Making, School Safety Programs (6), Seed Banks, Energy Efficient Stoves, Retaining Wall (200 Feet), safe zones.
Note: *School students will be motivated to participate in plantation (i.e. sowing and safety of plants and trees) and hazard planning activities (i.e. drawings and coloring)
8 Mosques 4 educational institutions i.e. 1 Government Girls schools (Primary) and 3 Government Boys school (Primary, Middle and High), shops, 1 Hotel and bus stop.All the village houses do have electricity and telecommunication facility.
*Estimated figures based on local community knowledge
Annexes
36
Disaster Risk Mapping - District Swat
Annex 2: Village Report - Sapal Banday
Tehsil: Babuzai Union Council: Islampur HH Size: 8 Hazard Score: 2.25Hazards in the village: Seasonal flooding, major flooding & soil erosionSurveyed household prone to hazards: 84
NGOs/ Agencies working in the village1 NRSP: Livelihood2 Lasoona: Livelihood and Cash for work3 Spado: Child Protection Centers4 Red Cross: Assessment for Livelihoods
Profile of the Village
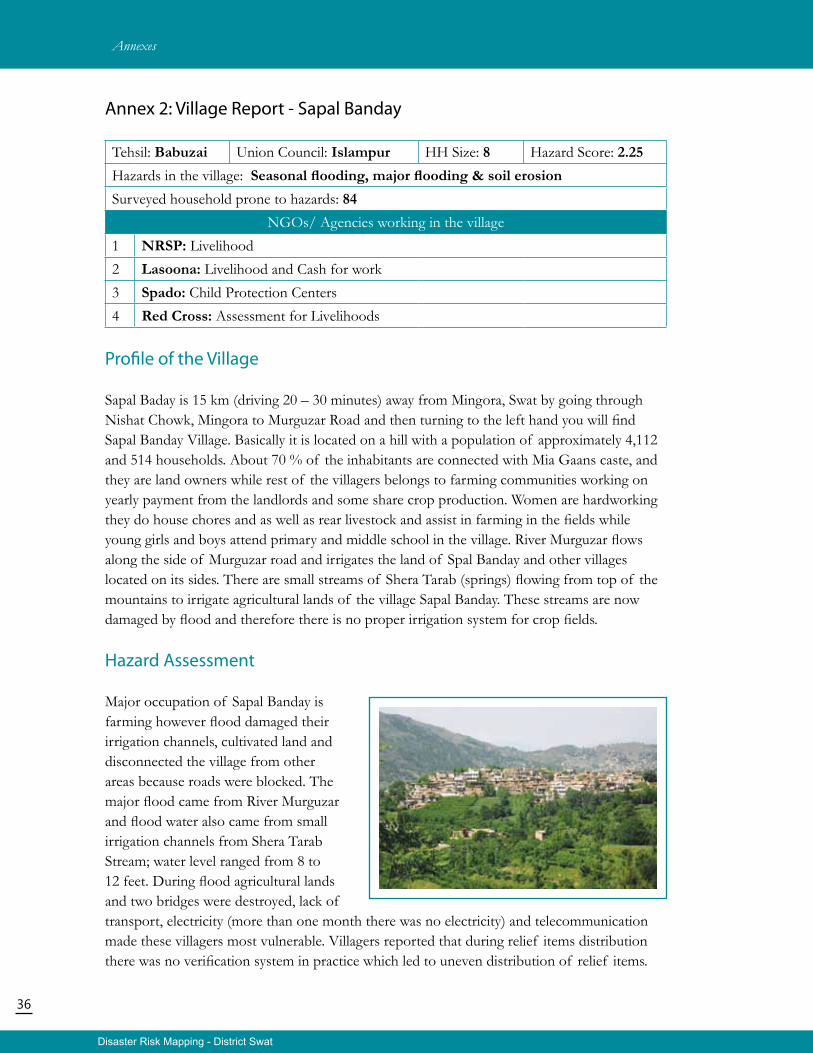
Sapal Baday is 15 km (driving 20 – 30 minutes) away from Mingora, Swat by going through Nishat Chowk, Mingora to Murguzar Road and then turning to the left hand you will find Sapal Banday Village. Basically it is located on a hill with a population of approximately 4,112 and 514 households. About 70 % of the inhabitants are connected with Mia Gaans caste, and they are land owners while rest of the villagers belongs to farming communities working on yearly payment from the landlords and some share crop production. Women are hardworking they do house chores and as well as rear livestock and assist in farming in the fields while young girls and boys attend primary and middle school in the village. River Murguzar flows along the side of Murguzar road and irrigates the land of Spal Banday and other villages located on its sides. There are small streams of Shera Tarab (springs) flowing from top of the mountains to irrigate agricultural lands of the village Sapal Banday. These streams are now damaged by flood and therefore there is no proper irrigation system for crop fields.
Hazard Assessment
Major occupation of Sapal Banday is farming however flood damaged their irrigation channels, cultivated land and disconnected the village from other areas because roads were blocked. The major flood came from River Murguzar and flood water also came from small irrigation channels from Shera Tarab Stream; water level ranged from 8 to 12 feet. During flood agricultural lands and two bridges were destroyed, lack of transport, electricity (more than one month there was no electricity) and telecommunication made these villagers most vulnerable. Villagers reported that during relief items distribution there was no verification system in practice which led to uneven distribution of relief items.
Annexes
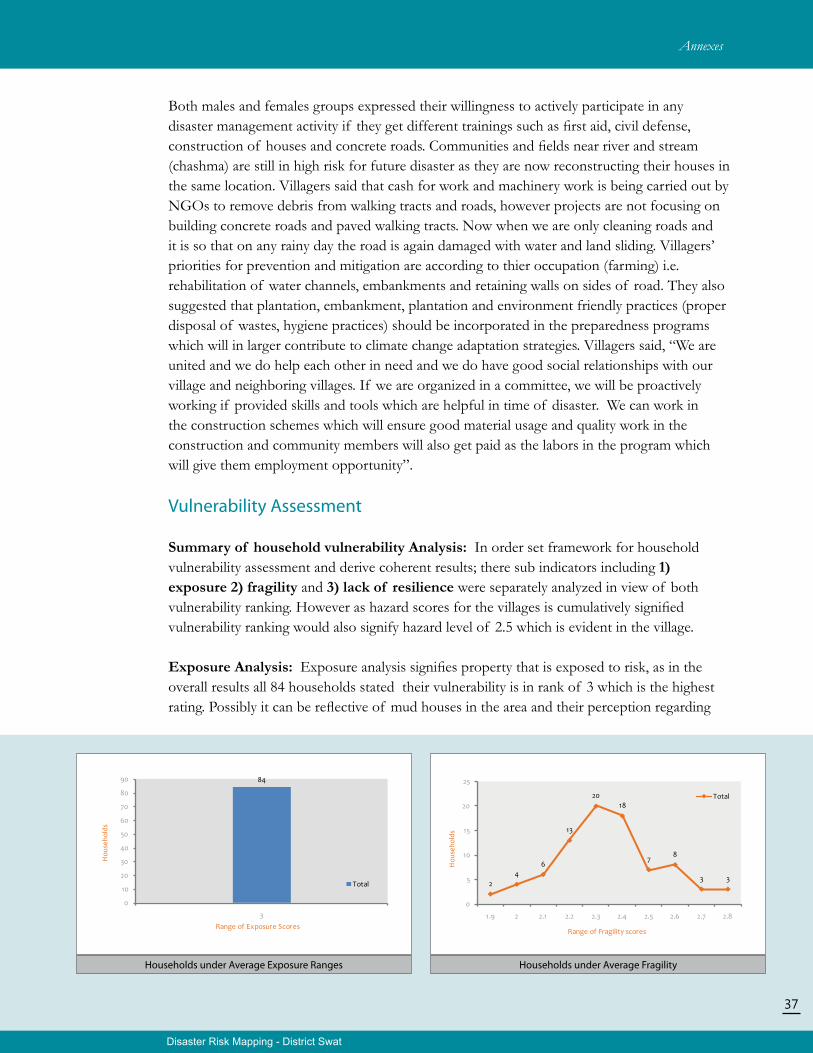
Disaster Risk Mapping - District Swat
37
Both males and females groups expressed their willingness to actively participate in any disaster management activity if they get different trainings such as first aid, civil defense, construction of houses and concrete roads. Communities and fields near river and stream (chashma) are still in high risk for future disaster as they are now reconstructing their houses in the same location. Villagers said that cash for work and machinery work is being carried out by NGOs to remove debris from walking tracts and roads, however projects are not focusing on building concrete roads and paved walking tracts. Now when we are only cleaning roads and it is so that on any rainy day the road is again damaged with water and land sliding. Villagers’ priorities for prevention and mitigation are according to thier occupation (farming) i.e. rehabilitation of water channels, embankments and retaining walls on sides of road. They also suggested that plantation, embankment, plantation and environment friendly practices (proper disposal of wastes, hygiene practices) should be incorporated in the preparedness programs which will in larger contribute to climate change adaptation strategies. Villagers said, “We are united and we do help each other in need and we do have good social relationships with our village and neighboring villages. If we are organized in a committee, we will be proactively working if provided skills and tools which are helpful in time of disaster. We can work in the construction schemes which will ensure good material usage and quality work in the construction and community members will also get paid as the labors in the program which will give them employment opportunity”.
Vulnerability Assessment
Summary of household vulnerability Analysis: In order set framework for household vulnerability assessment and derive coherent results; there sub indicators including 1) exposure 2) fragility and 3) lack of resilience were separately analyzed in view of both vulnerability ranking. However as hazard scores for the villages is cumulatively signified vulnerability ranking would also signify hazard level of 2.5 which is evident in the village.
Exposure Analysis: Exposure analysis signifies property that is exposed to risk, as in the overall results all 84 households stated their vulnerability is in rank of 3 which is the highest rating. Possibly it can be reflective of mud houses in the area and their perception regarding
Households under Average Exposure Ranges Households under Average Fragility
Annexes
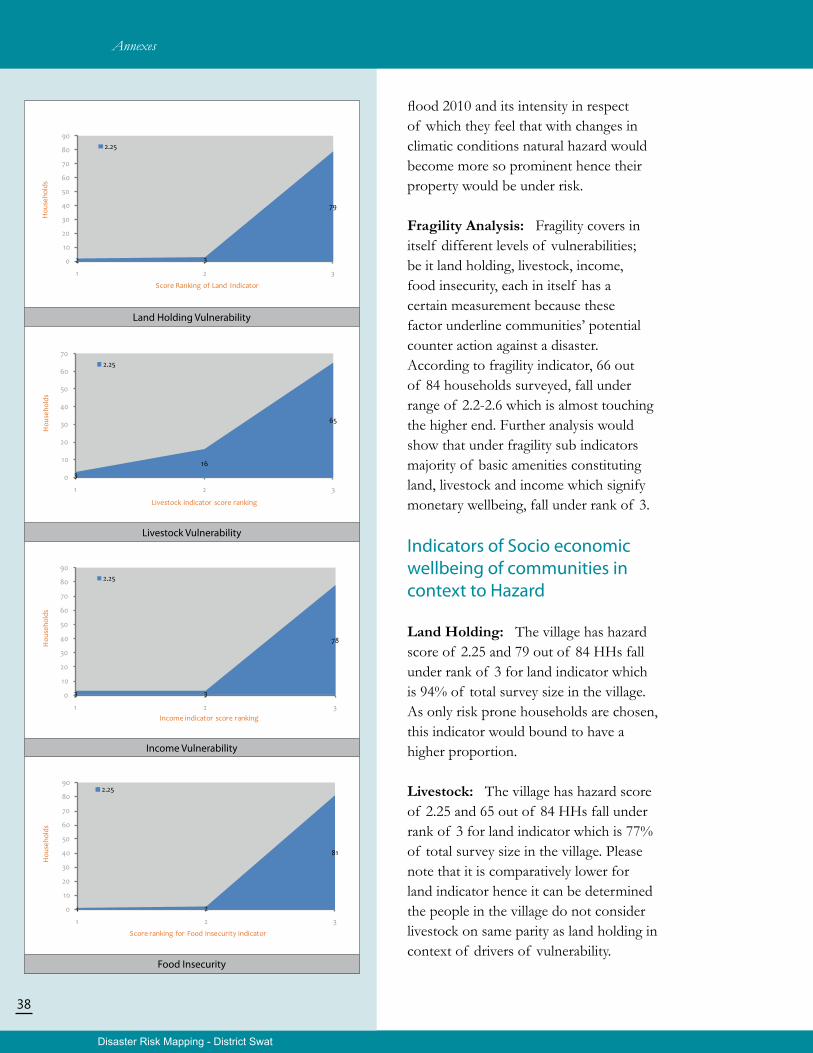
Disaster Risk Mapping - District Swat
38
Land Holding Vulnerability
Livestock Vulnerability
Income Vulnerability
Food Insecurity
flood 2010 and its intensity in respect of which they feel that with changes in climatic conditions natural hazard would become more so prominent hence their property would be under risk.
Fragility Analysis: Fragility covers in itself different levels of vulnerabilities; be it land holding, livestock, income, food insecurity, each in itself has a certain measurement because these factor underline communities’ potential counter action against a disaster. According to fragility indicator, 66 out of 84 households surveyed, fall under range of 2.2-2.6 which is almost touching the higher end. Further analysis would show that under fragility sub indicators majority of basic amenities constituting land, livestock and income which signify monetary wellbeing, fall under rank of 3.
Indicators of Socio economic wellbeing of communities in context to Hazard
Land Holding: The village has hazard score of 2.25 and 79 out of 84 HHs fall under rank of 3 for land indicator which is 94% of total survey size in the village. As only risk prone households are chosen, this indicator would bound to have a higher proportion.
Livestock: The village has hazard score of 2.25 and 65 out of 84 HHs fall under rank of 3 for land indicator which is 77% of total survey size in the village. Please note that it is comparatively lower for land indicator hence it can be determined the people in the village do not consider livestock on same parity as land holding in context of drivers of vulnerability.
Annexes
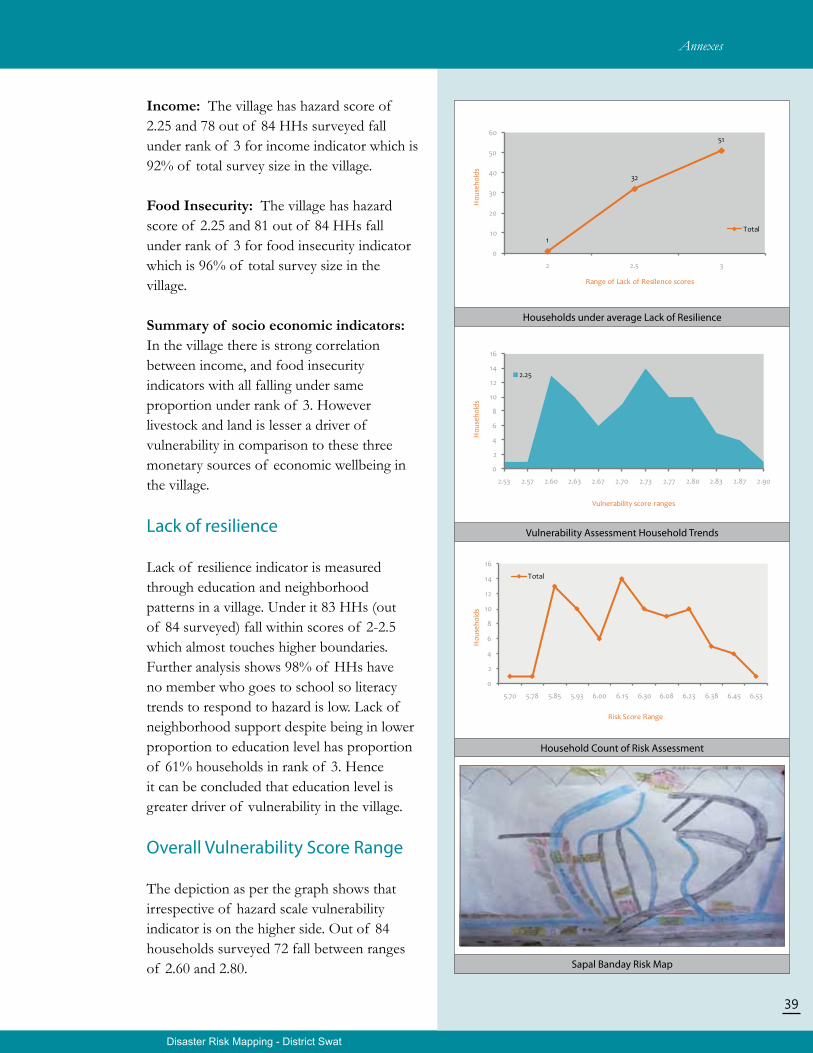
Disaster Risk Mapping - District Swat
39
Households under average Lack of Resilience
Vulnerability Assessment Household Trends
Household Count of Risk Assessment
Sapal Banday Risk Map
Income: The village has hazard score of 2.25 and 78 out of 84 HHs surveyed fall under rank of 3 for income indicator which is 92% of total survey size in the village.
Food Insecurity: The village has hazard score of 2.25 and 81 out of 84 HHs fall under rank of 3 for food insecurity indicator which is 96% of total survey size in the village.
Summary of socio economic indicators: In the village there is strong correlation between income, and food insecurity indicators with all falling under same proportion under rank of 3. However livestock and land is lesser a driver of vulnerability in comparison to these three monetary sources of economic wellbeing in the village.
Lack of resilience
Lack of resilience indicator is measured through education and neighborhood patterns in a village. Under it 83 HHs (out of 84 surveyed) fall within scores of 2-2.5 which almost touches higher boundaries. Further analysis shows 98% of HHs have no member who goes to school so literacy trends to respond to hazard is low. Lack of neighborhood support despite being in lower proportion to education level has proportion of 61% households in rank of 3. Hence it can be concluded that education level is greater driver of vulnerability in the village.
Overall Vulnerability Score Range
The depiction as per the graph shows that irrespective of hazard scale vulnerability indicator is on the higher side. Out of 84 households surveyed 72 fall between ranges of 2.60 and 2.80.
Annexes
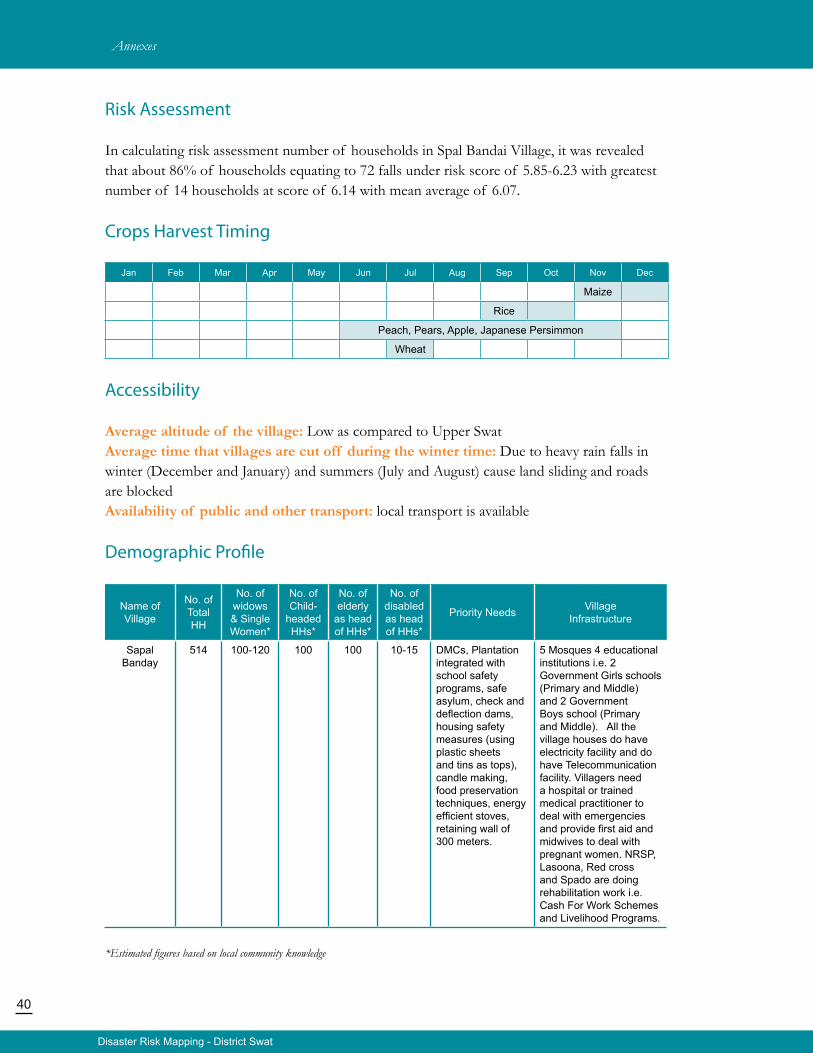
40
Disaster Risk Mapping - District Swat
Risk Assessment
In calculating risk assessment number of households in Spal Bandai Village, it was revealed that about 86% of households equating to 72 falls under risk score of 5.85-6.23 with greatest number of 14 households at score of 6.14 with mean average of 6.07.
Crops Harvest Timing
Jan Feb Mar Apr May Jun Jul Aug Sep Oct Nov Dec
Maize
Rice
Peach, Pears, Apple, Japanese Persimmon
Wheat
Accessibility
Average altitude of the village: Low as compared to Upper SwatAverage time that villages are cut off during the winter time: Due to heavy rain falls in winter (December and January) and summers (July and August) cause land sliding and roads are blockedAvailability of public and other transport: local transport is available
Demographic Profile
Name of Village
No. of Total HH
No. of widows & Single Women*
No. of Child-
headed HHs*
No. of elderly
as head of HHs*
No. ofdisabledas headof HHs*
Priority Needs Village Infrastructure
Sapal Banday
514 100-120 100 100 10-15 DMCs, Plantation integrated with school safety programs, safe asylum, check and deflection dams, housing safety measures (using plastic sheets and tins as tops), candle making, food preservation techniques, energy efficient stoves, retaining wall of 300 meters.
5 Mosques 4 educational institutions i.e. 2 Government Girls schools (Primary and Middle) and 2 Government Boys school (Primary and Middle). All the village houses do have electricity facility and do have Telecommunication facility. Villagers need a hospital or trained medical practitioner to deal with emergencies and provide first aid and midwives to deal with pregnant women. NRSP, Lasoona, Red cross and Spado are doing rehabilitation work i.e. Cash For Work Schemes and Livelihood Programs.
*Estimated figures based on local community knowledge
Annexes
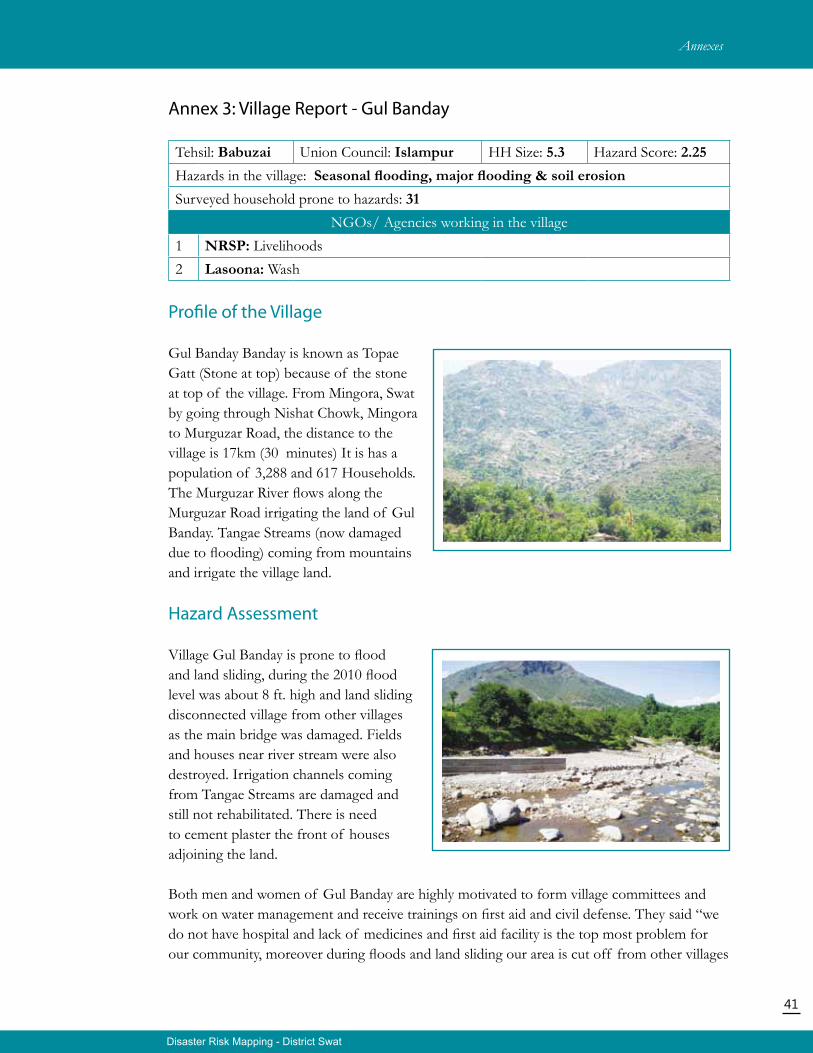
41
Disaster Risk Mapping - District Swat
Annex 3: Village Report - Gul Banday
Tehsil: Babuzai Union Council: Islampur HH Size: 5.3 Hazard Score: 2.25Hazards in the village: Seasonal flooding, major flooding & soil erosionSurveyed household prone to hazards: 31
NGOs/ Agencies working in the village1 NRSP: Livelihoods2 Lasoona: Wash
Profile of the Village
Gul Banday Banday is known as Topae Gatt (Stone at top) because of the stone at top of the village. From Mingora, Swat by going through Nishat Chowk, Mingora to Murguzar Road, the distance to the village is 17km (30 minutes) It is has a population of 3,288 and 617 Households. The Murguzar River flows along the Murguzar Road irrigating the land of Gul Banday. Tangae Streams (now damaged due to flooding) coming from mountains and irrigate the village land.
Hazard Assessment
Village Gul Banday is prone to flood and land sliding, during the 2010 flood level was about 8 ft. high and land sliding disconnected village from other villages as the main bridge was damaged. Fields and houses near river stream were also destroyed. Irrigation channels coming from Tangae Streams are damaged and still not rehabilitated. There is need to cement plaster the front of houses adjoining the land.
Both men and women of Gul Banday are highly motivated to form village committees and work on water management and receive trainings on first aid and civil defense. They said “we do not have hospital and lack of medicines and first aid facility is the top most problem for our community, moreover during floods and land sliding our area is cut off from other villages
Annexes
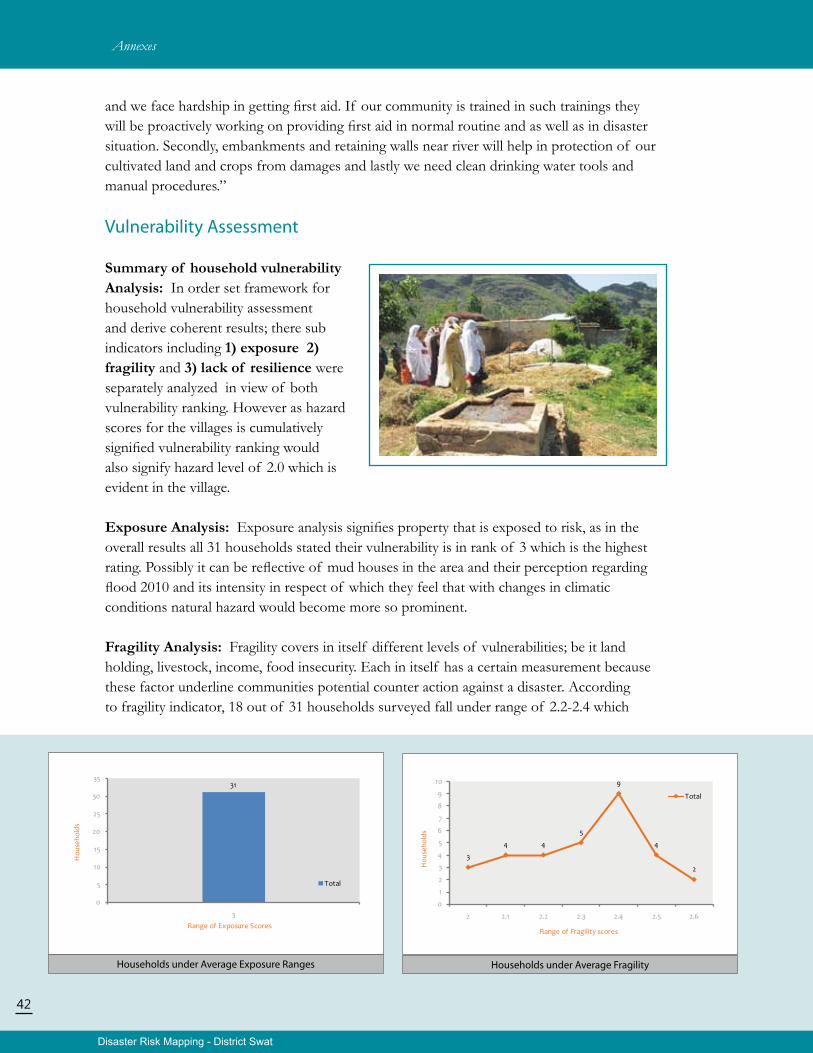
Disaster Risk Mapping - District Swat
42
and we face hardship in getting first aid. If our community is trained in such trainings they will be proactively working on providing first aid in normal routine and as well as in disaster situation. Secondly, embankments and retaining walls near river will help in protection of our cultivated land and crops from damages and lastly we need clean drinking water tools and manual procedures.”
Vulnerability Assessment
Summary of household vulnerability Analysis: In order set framework for household vulnerability assessment and derive coherent results; there sub indicators including 1) exposure 2) fragility and 3) lack of resilience were separately analyzed in view of both vulnerability ranking. However as hazard scores for the villages is cumulatively signified vulnerability ranking would also signify hazard level of 2.0 which is evident in the village.
Exposure Analysis: Exposure analysis signifies property that is exposed to risk, as in the overall results all 31 households stated their vulnerability is in rank of 3 which is the highest rating. Possibly it can be reflective of mud houses in the area and their perception regarding flood 2010 and its intensity in respect of which they feel that with changes in climatic conditions natural hazard would become more so prominent.
Fragility Analysis: Fragility covers in itself different levels of vulnerabilities; be it land holding, livestock, income, food insecurity. Each in itself has a certain measurement because these factor underline communities potential counter action against a disaster. According to fragility indicator, 18 out of 31 households surveyed fall under range of 2.2-2.4 which
Households under Average Exposure Ranges Households under Average Fragility
Annexes
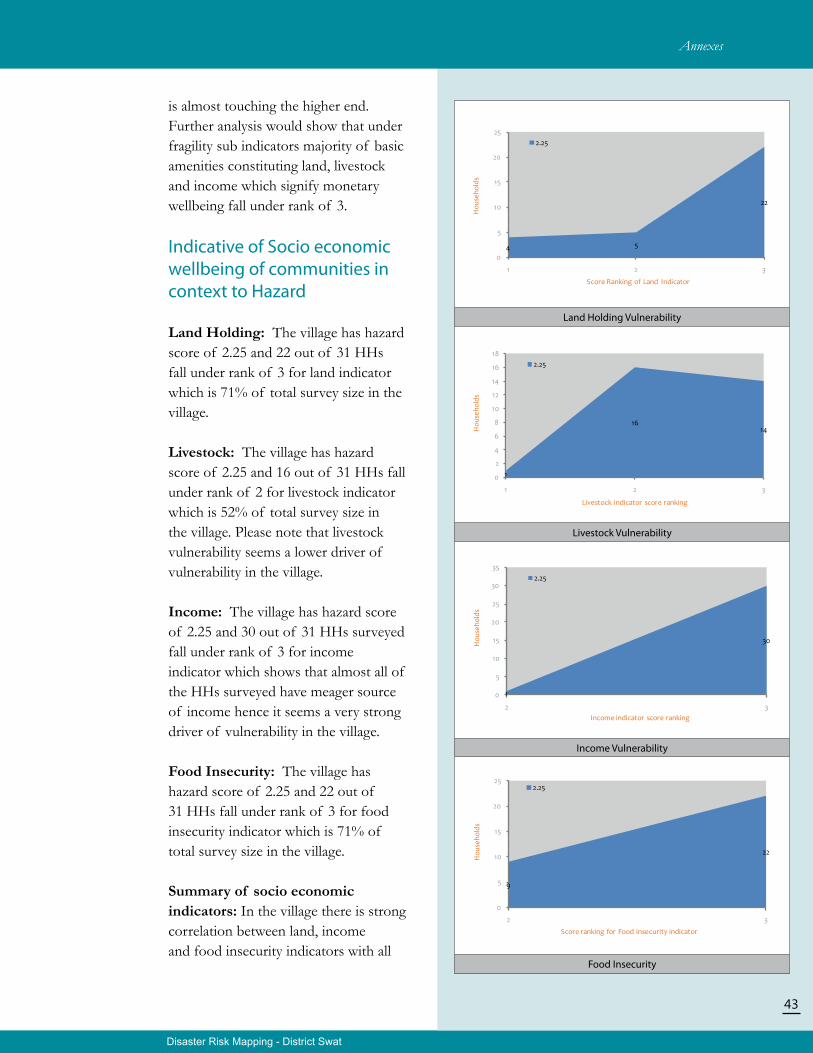
Disaster Risk Mapping - District Swat
43
Land Holding Vulnerability
Livestock Vulnerability
Income Vulnerability
Food Insecurity
is almost touching the higher end. Further analysis would show that under fragility sub indicators majority of basic amenities constituting land, livestock and income which signify monetary wellbeing fall under rank of 3.
Indicative of Socio economic wellbeing of communities in context to Hazard
Land Holding: The village has hazard score of 2.25 and 22 out of 31 HHs fall under rank of 3 for land indicator which is 71% of total survey size in the village.
Livestock: The village has hazard score of 2.25 and 16 out of 31 HHs fall under rank of 2 for livestock indicator which is 52% of total survey size in the village. Please note that livestock vulnerability seems a lower driver of vulnerability in the village.
Income: The village has hazard score of 2.25 and 30 out of 31 HHs surveyed fall under rank of 3 for income indicator which shows that almost all of the HHs surveyed have meager source of income hence it seems a very strong driver of vulnerability in the village.
Food Insecurity: The village has hazard score of 2.25 and 22 out of 31 HHs fall under rank of 3 for food insecurity indicator which is 71% of total survey size in the village.
Summary of socio economic indicators: In the village there is strong correlation between land, income and food insecurity indicators with all
Annexes
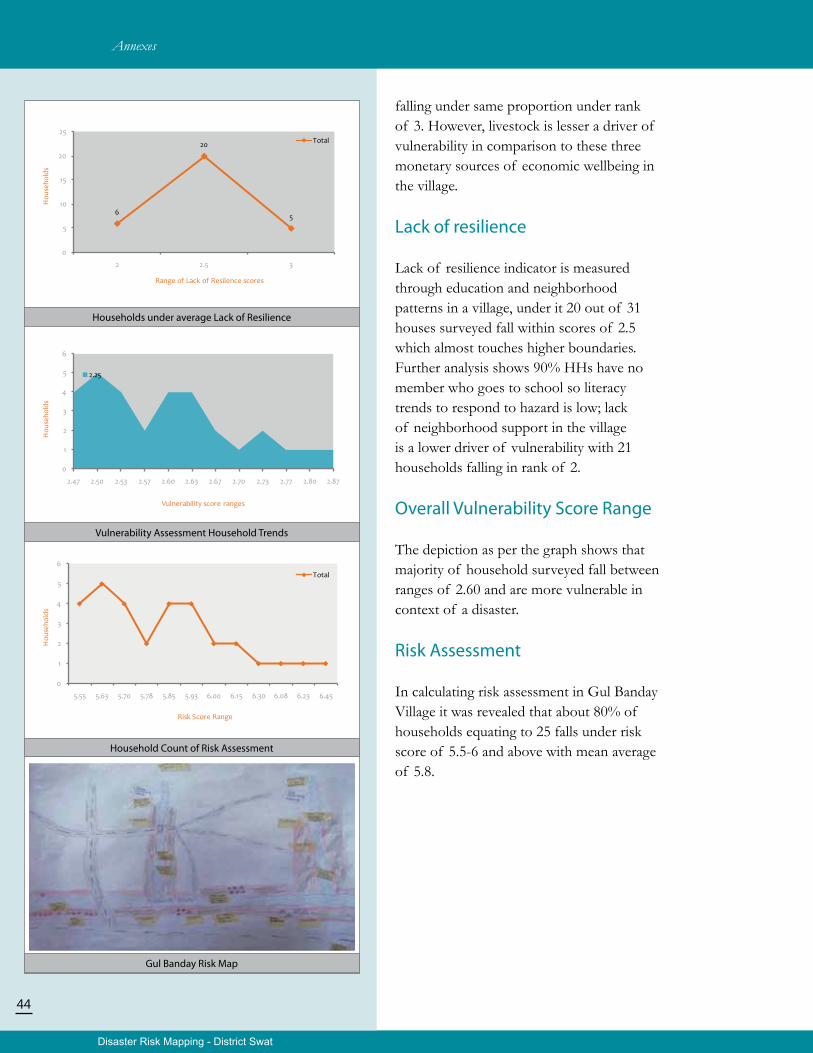
Disaster Risk Mapping - District Swat
44
Households under average Lack of Resilience
Vulnerability Assessment Household Trends
Household Count of Risk Assessment
Gul Banday Risk Map
falling under same proportion under rank of 3. However, livestock is lesser a driver of vulnerability in comparison to these three monetary sources of economic wellbeing in the village.
Lack of resilience
Lack of resilience indicator is measured through education and neighborhood patterns in a village, under it 20 out of 31 houses surveyed fall within scores of 2.5 which almost touches higher boundaries. Further analysis shows 90% HHs have no member who goes to school so literacy trends to respond to hazard is low; lack of neighborhood support in the village is a lower driver of vulnerability with 21 households falling in rank of 2.
Overall Vulnerability Score Range
The depiction as per the graph shows that majority of household surveyed fall between ranges of 2.60 and are more vulnerable in context of a disaster.
Risk Assessment
In calculating risk assessment in Gul Banday Village it was revealed that about 80% of households equating to 25 falls under risk score of 5.5-6 and above with mean average of 5.8.
Annexes
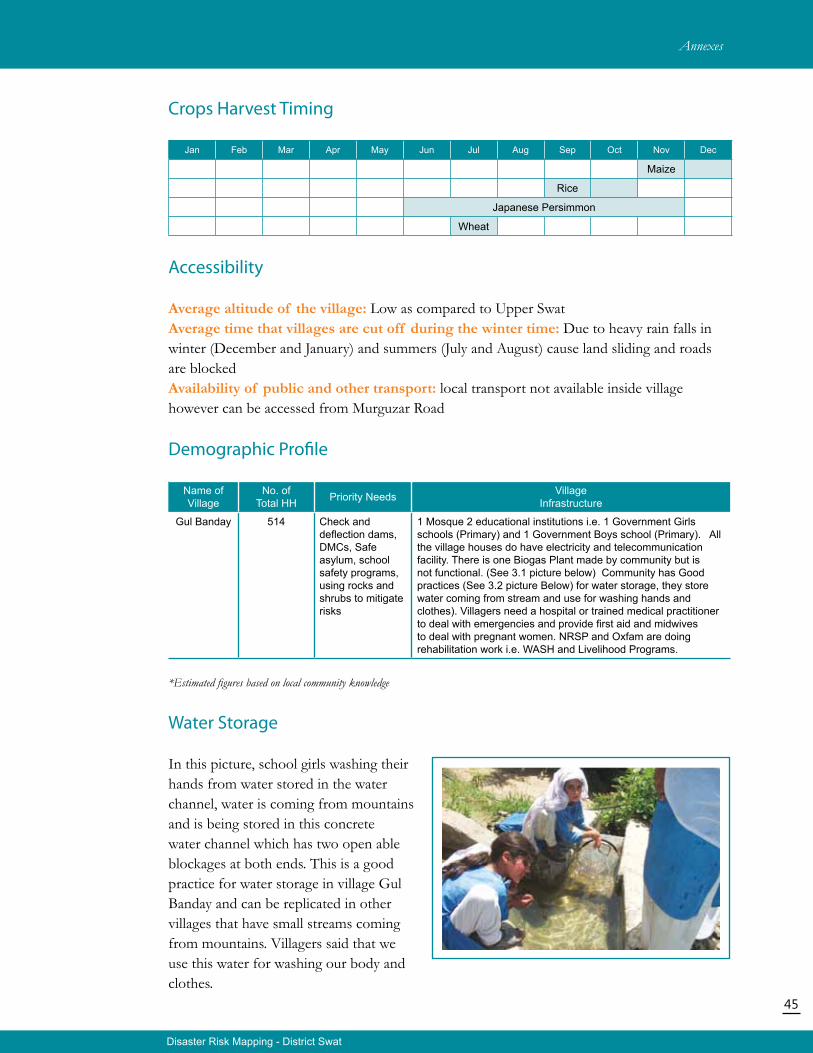
45
Disaster Risk Mapping - District Swat
Crops Harvest Timing
Jan Feb Mar Apr May Jun Jul Aug Sep Oct Nov Dec
Maize
Rice
Japanese Persimmon
Wheat
Accessibility
Average altitude of the village: Low as compared to Upper SwatAverage time that villages are cut off during the winter time: Due to heavy rain falls in winter (December and January) and summers (July and August) cause land sliding and roads are blockedAvailability of public and other transport: local transport not available inside village however can be accessed from Murguzar Road
Demographic Profile
Name of Village
No. of Total HH Priority Needs Village
Infrastructure
Gul Banday 514 Check and deflection dams, DMCs, Safe asylum, school safety programs, using rocks and shrubs to mitigate risks
1 Mosque 2 educational institutions i.e. 1 Government Girls schools (Primary) and 1 Government Boys school (Primary). All the village houses do have electricity and telecommunication facility. There is one Biogas Plant made by community but is not functional. (See 3.1 picture below) Community has Good practices (See 3.2 picture Below) for water storage, they store water coming from stream and use for washing hands and clothes). Villagers need a hospital or trained medical practitioner to deal with emergencies and provide first aid and midwives to deal with pregnant women. NRSP and Oxfam are doing rehabilitation work i.e. WASH and Livelihood Programs.
*Estimated figures based on local community knowledge
Water Storage
In this picture, school girls washing their hands from water stored in the water channel, water is coming from mountains and is being stored in this concrete water channel which has two open able blockages at both ends. This is a good practice for water storage in village Gul Banday and can be replicated in other villages that have small streams coming from mountains. Villagers said that we use this water for washing our body and clothes.
Annexes
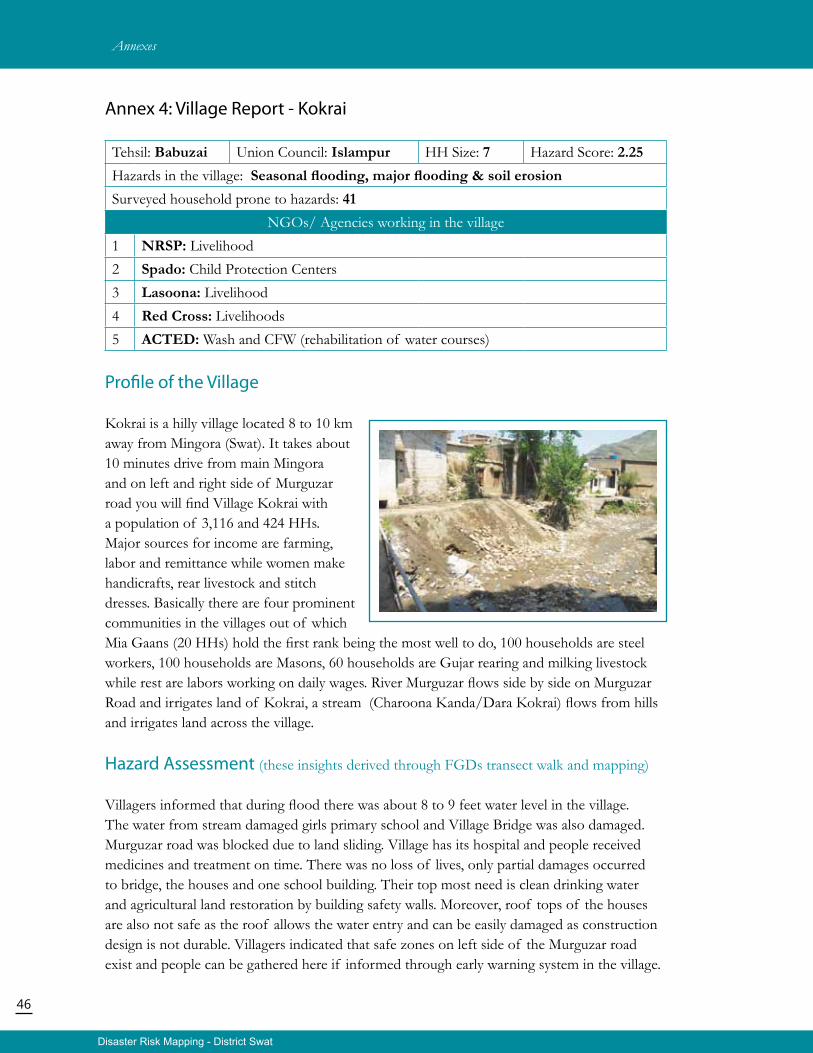
46
Disaster Risk Mapping - District Swat
Annex 4: Village Report - Kokrai
Tehsil: Babuzai Union Council: Islampur HH Size: 7 Hazard Score: 2.25Hazards in the village: Seasonal flooding, major flooding & soil erosionSurveyed household prone to hazards: 41
NGOs/ Agencies working in the village1 NRSP: Livelihood2 Spado: Child Protection Centers3 Lasoona: Livelihood4 Red Cross: Livelihoods5 ACTED: Wash and CFW (rehabilitation of water courses)
Profile of the Village
Kokrai is a hilly village located 8 to 10 km away from Mingora (Swat). It takes about 10 minutes drive from main Mingora and on left and right side of Murguzar road you will find Village Kokrai with a population of 3,116 and 424 HHs. Major sources for income are farming, labor and remittance while women make handicrafts, rear livestock and stitch dresses. Basically there are four prominent communities in the villages out of which Mia Gaans (20 HHs) hold the first rank being the most well to do, 100 households are steel workers, 100 households are Masons, 60 households are Gujar rearing and milking livestock while rest are labors working on daily wages. River Murguzar flows side by side on Murguzar Road and irrigates land of Kokrai, a stream (Charoona Kanda/Dara Kokrai) flows from hills and irrigates land across the village.
Hazard Assessment (these insights derived through FGDs transect walk and mapping)
Villagers informed that during flood there was about 8 to 9 feet water level in the village. The water from stream damaged girls primary school and Village Bridge was also damaged. Murguzar road was blocked due to land sliding. Village has its hospital and people received medicines and treatment on time. There was no loss of lives, only partial damages occurred to bridge, the houses and one school building. Their top most need is clean drinking water and agricultural land restoration by building safety walls. Moreover, roof tops of the houses are also not safe as the roof allows the water entry and can be easily damaged as construction design is not durable. Villagers indicated that safe zones on left side of the Murguzar road exist and people can be gathered here if informed through early warning system in the village.
Annexes
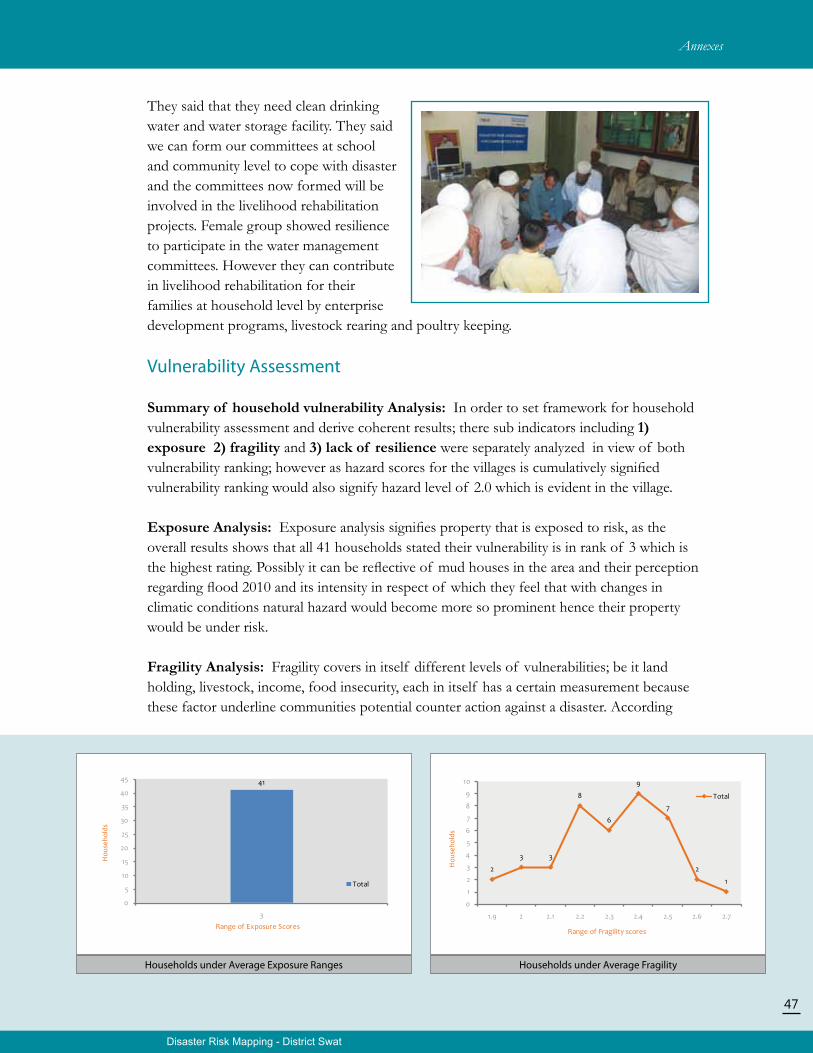
Disaster Risk Mapping - District Swat
47
They said that they need clean drinking water and water storage facility. They said we can form our committees at school and community level to cope with disaster and the committees now formed will be involved in the livelihood rehabilitation projects. Female group showed resilience to participate in the water management committees. However they can contribute in livelihood rehabilitation for their families at household level by enterprise development programs, livestock rearing and poultry keeping.
Vulnerability Assessment
Summary of household vulnerability Analysis: In order to set framework for household vulnerability assessment and derive coherent results; there sub indicators including 1) exposure 2) fragility and 3) lack of resilience were separately analyzed in view of both vulnerability ranking; however as hazard scores for the villages is cumulatively signified vulnerability ranking would also signify hazard level of 2.0 which is evident in the village.
Exposure Analysis: Exposure analysis signifies property that is exposed to risk, as the overall results shows that all 41 households stated their vulnerability is in rank of 3 which is the highest rating. Possibly it can be reflective of mud houses in the area and their perception regarding flood 2010 and its intensity in respect of which they feel that with changes in climatic conditions natural hazard would become more so prominent hence their property would be under risk.
Fragility Analysis: Fragility covers in itself different levels of vulnerabilities; be it land holding, livestock, income, food insecurity, each in itself has a certain measurement because these factor underline communities potential counter action against a disaster. According
Households under Average Exposure Ranges Households under Average Fragility
Annexes
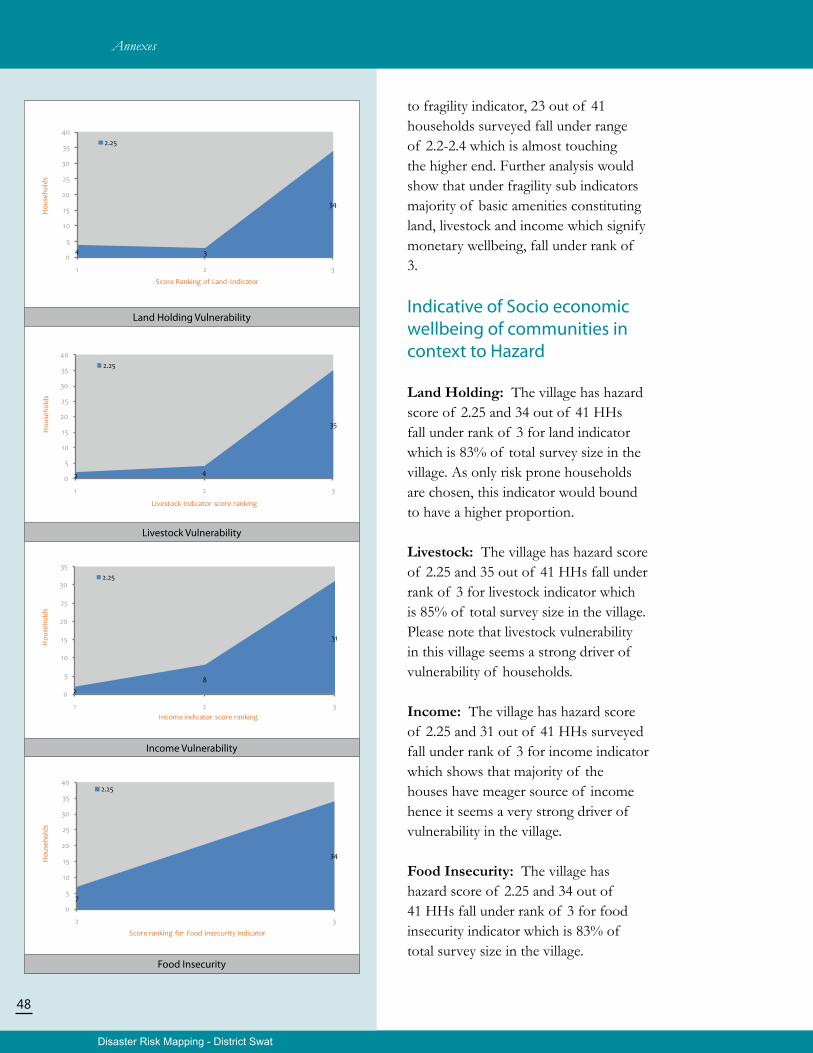
Disaster Risk Mapping - District Swat
48
Land Holding Vulnerability
Livestock Vulnerability
Income Vulnerability
Food Insecurity
to fragility indicator, 23 out of 41 households surveyed fall under range of 2.2-2.4 which is almost touching the higher end. Further analysis would show that under fragility sub indicators majority of basic amenities constituting land, livestock and income which signify monetary wellbeing, fall under rank of 3.
Indicative of Socio economic wellbeing of communities in context to Hazard
Land Holding: The village has hazard score of 2.25 and 34 out of 41 HHs fall under rank of 3 for land indicator which is 83% of total survey size in the village. As only risk prone households are chosen, this indicator would bound to have a higher proportion.
Livestock: The village has hazard score of 2.25 and 35 out of 41 HHs fall under rank of 3 for livestock indicator which is 85% of total survey size in the village. Please note that livestock vulnerability in this village seems a strong driver of vulnerability of households.
Income: The village has hazard score of 2.25 and 31 out of 41 HHs surveyed fall under rank of 3 for income indicator which shows that majority of the houses have meager source of income hence it seems a very strong driver of vulnerability in the village.
Food Insecurity: The village has hazard score of 2.25 and 34 out of 41 HHs fall under rank of 3 for food insecurity indicator which is 83% of total survey size in the village.
Annexes
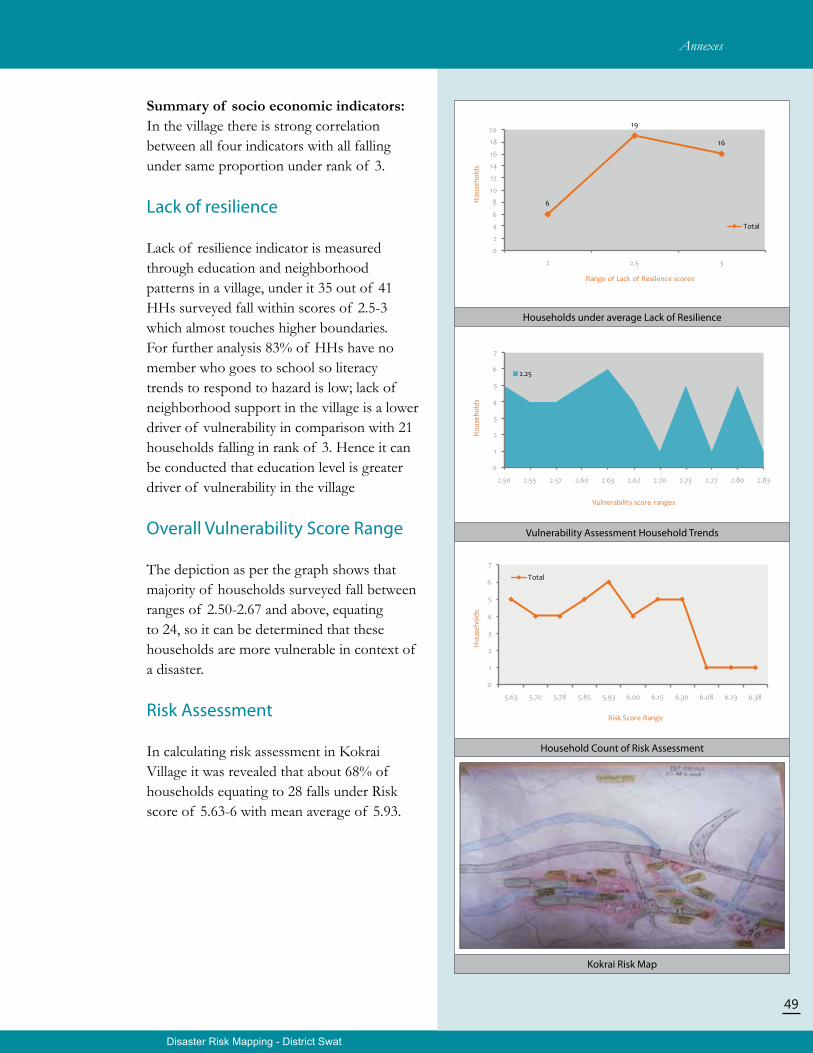
Disaster Risk Mapping - District Swat
49
Households under average Lack of Resilience
Vulnerability Assessment Household Trends
Household Count of Risk Assessment
Kokrai Risk Map
Summary of socio economic indicators: In the village there is strong correlation between all four indicators with all falling under same proportion under rank of 3.
Lack of resilience
Lack of resilience indicator is measured through education and neighborhood patterns in a village, under it 35 out of 41 HHs surveyed fall within scores of 2.5-3 which almost touches higher boundaries. For further analysis 83% of HHs have no member who goes to school so literacy trends to respond to hazard is low; lack of neighborhood support in the village is a lower driver of vulnerability in comparison with 21 households falling in rank of 3. Hence it can be conducted that education level is greater driver of vulnerability in the village
Overall Vulnerability Score Range
The depiction as per the graph shows that majority of households surveyed fall between ranges of 2.50-2.67 and above, equating to 24, so it can be determined that these households are more vulnerable in context of a disaster.
Risk Assessment
In calculating risk assessment in Kokrai Village it was revealed that about 68% of households equating to 28 falls under Risk score of 5.63-6 with mean average of 5.93.
Annexes
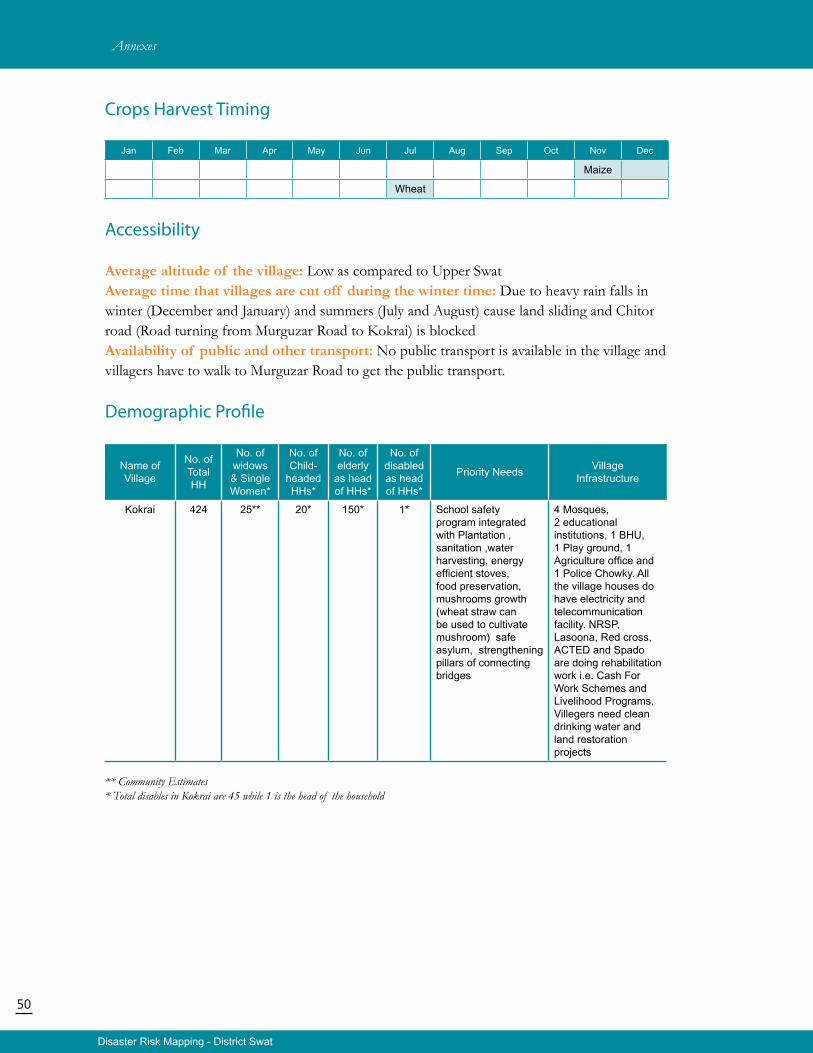
50
Disaster Risk Mapping - District Swat
Crops Harvest Timing
Jan Feb Mar Apr May Jun Jul Aug Sep Oct Nov Dec
Maize
Wheat
Accessibility
Average altitude of the village: Low as compared to Upper SwatAverage time that villages are cut off during the winter time: Due to heavy rain falls in winter (December and January) and summers (July and August) cause land sliding and Chitor road (Road turning from Murguzar Road to Kokrai) is blocked Availability of public and other transport: No public transport is available in the village and villagers have to walk to Murguzar Road to get the public transport.
Demographic Profile
Name of Village
No. of Total HH
No. of widows & Single Women*
No. of Child-
headed HHs*
No. of elderly
as head of HHs*
No. ofdisabledas headof HHs*
Priority Needs Village Infrastructure
Kokrai 424 25** 20* 150* 1* School safety program integrated with Plantation , sanitation ,water harvesting, energy efficient stoves, food preservation, mushrooms growth (wheat straw can be used to cultivate mushroom) safe asylum, strengthening pillars of connecting bridges
4 Mosques, 2 educational institutions, 1 BHU, 1 Play ground, 1 Agriculture office and 1 Police Chowky. All the village houses do have electricity and telecommunication facility. NRSP, Lasoona, Red cross, ACTED and Spado are doing rehabilitation work i.e. Cash For Work Schemes and Livelihood Programs. Villegers need clean drinking water and land restoration projects
** Community Estimates* Total disables in Kokrai are 45 while 1 is the head of the household
Annexes
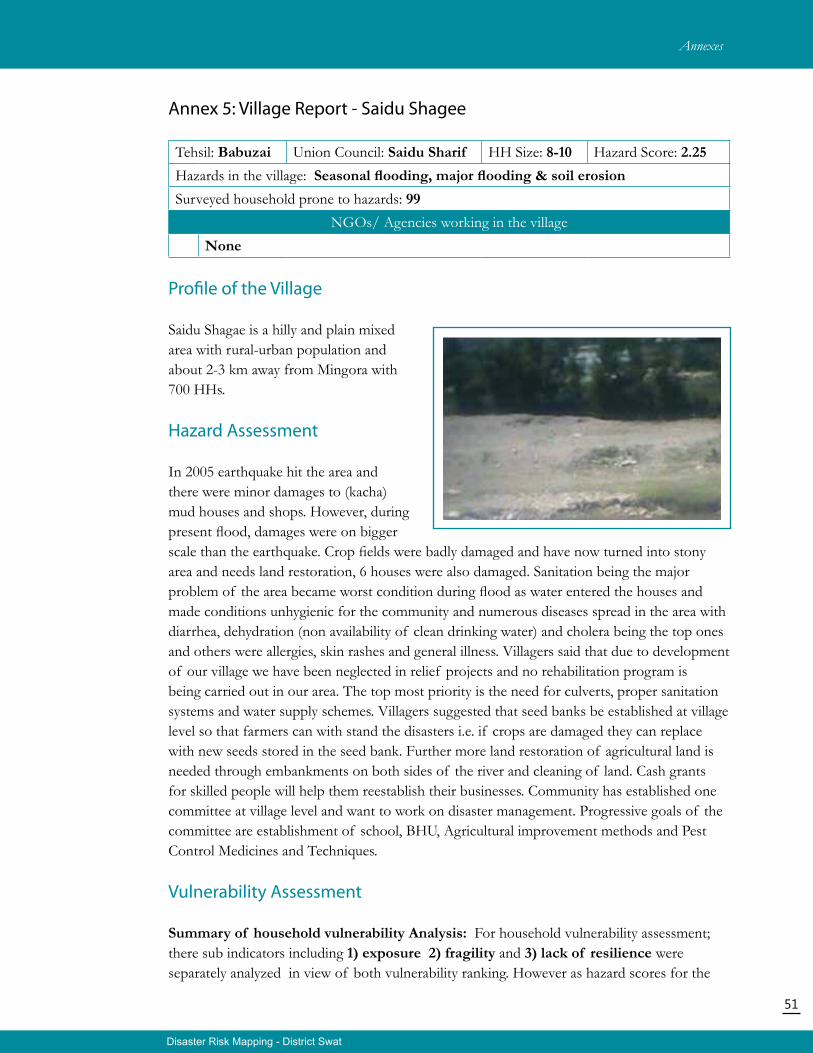
51
Disaster Risk Mapping - District Swat
Annex 5: Village Report - Saidu Shagee
Tehsil: Babuzai Union Council: Saidu Sharif HH Size: 8-10 Hazard Score: 2.25Hazards in the village: Seasonal flooding, major flooding & soil erosionSurveyed household prone to hazards: 99
NGOs/ Agencies working in the villageNone
Profile of the Village
Saidu Shagae is a hilly and plain mixed area with rural-urban population and about 2-3 km away from Mingora with 700 HHs.
Hazard Assessment
In 2005 earthquake hit the area and there were minor damages to (kacha) mud houses and shops. However, during present flood, damages were on bigger scale than the earthquake. Crop fields were badly damaged and have now turned into stony area and needs land restoration, 6 houses were also damaged. Sanitation being the major problem of the area became worst condition during flood as water entered the houses and made conditions unhygienic for the community and numerous diseases spread in the area with diarrhea, dehydration (non availability of clean drinking water) and cholera being the top ones and others were allergies, skin rashes and general illness. Villagers said that due to development of our village we have been neglected in relief projects and no rehabilitation program is being carried out in our area. The top most priority is the need for culverts, proper sanitation systems and water supply schemes. Villagers suggested that seed banks be established at village level so that farmers can with stand the disasters i.e. if crops are damaged they can replace with new seeds stored in the seed bank. Further more land restoration of agricultural land is needed through embankments on both sides of the river and cleaning of land. Cash grants for skilled people will help them reestablish their businesses. Community has established one committee at village level and want to work on disaster management. Progressive goals of the committee are establishment of school, BHU, Agricultural improvement methods and Pest Control Medicines and Techniques.
Vulnerability Assessment
Summary of household vulnerability Analysis: For household vulnerability assessment; there sub indicators including 1) exposure 2) fragility and 3) lack of resilience were separately analyzed in view of both vulnerability ranking. However as hazard scores for the
Annexes
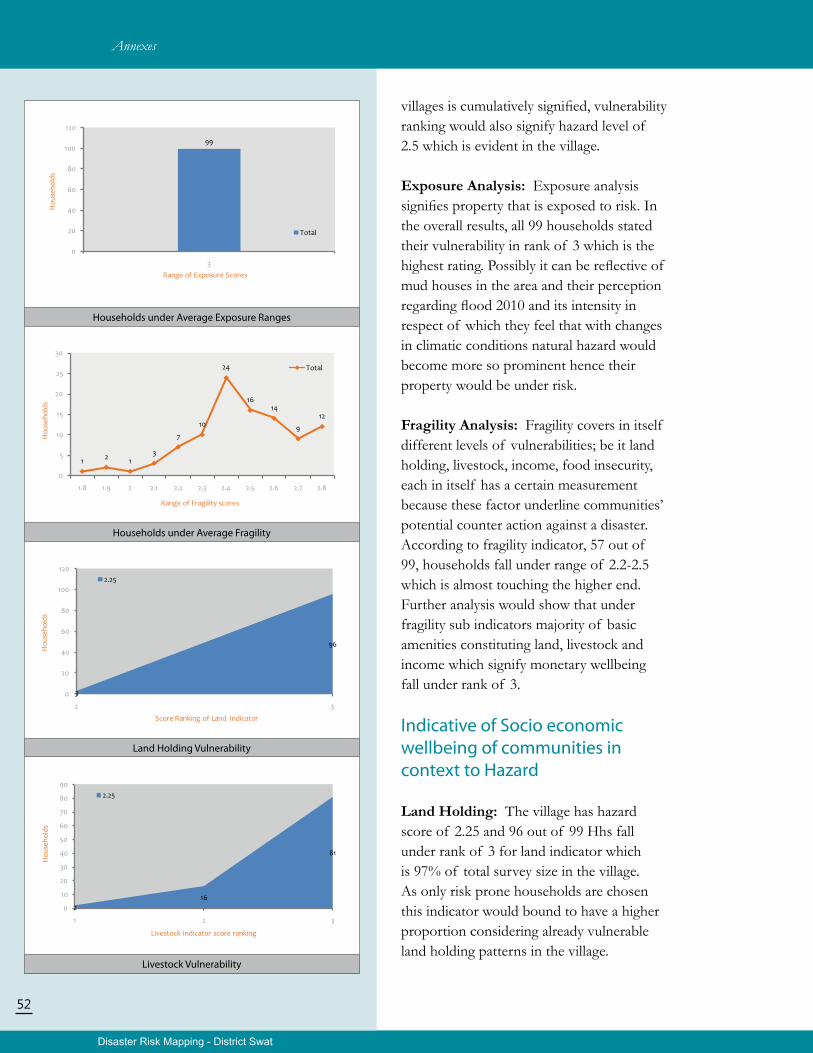
Disaster Risk Mapping - District Swat
52
villages is cumulatively signified, vulnerability ranking would also signify hazard level of 2.5 which is evident in the village.
Exposure Analysis: Exposure analysis signifies property that is exposed to risk. In the overall results, all 99 households stated their vulnerability in rank of 3 which is the highest rating. Possibly it can be reflective of mud houses in the area and their perception regarding flood 2010 and its intensity in respect of which they feel that with changes in climatic conditions natural hazard would become more so prominent hence their property would be under risk.
Fragility Analysis: Fragility covers in itself different levels of vulnerabilities; be it land holding, livestock, income, food insecurity, each in itself has a certain measurement because these factor underline communities’ potential counter action against a disaster. According to fragility indicator, 57 out of 99, households fall under range of 2.2-2.5 which is almost touching the higher end. Further analysis would show that under fragility sub indicators majority of basic amenities constituting land, livestock and income which signify monetary wellbeing fall under rank of 3.
Indicative of Socio economic wellbeing of communities in context to Hazard
Land Holding: The village has hazard score of 2.25 and 96 out of 99 Hhs fall under rank of 3 for land indicator which is 97% of total survey size in the village. As only risk prone households are chosen this indicator would bound to have a higher proportion considering already vulnerable land holding patterns in the village.
Households under Average Exposure Ranges
Households under Average Fragility
Land Holding Vulnerability
Livestock Vulnerability
Annexes
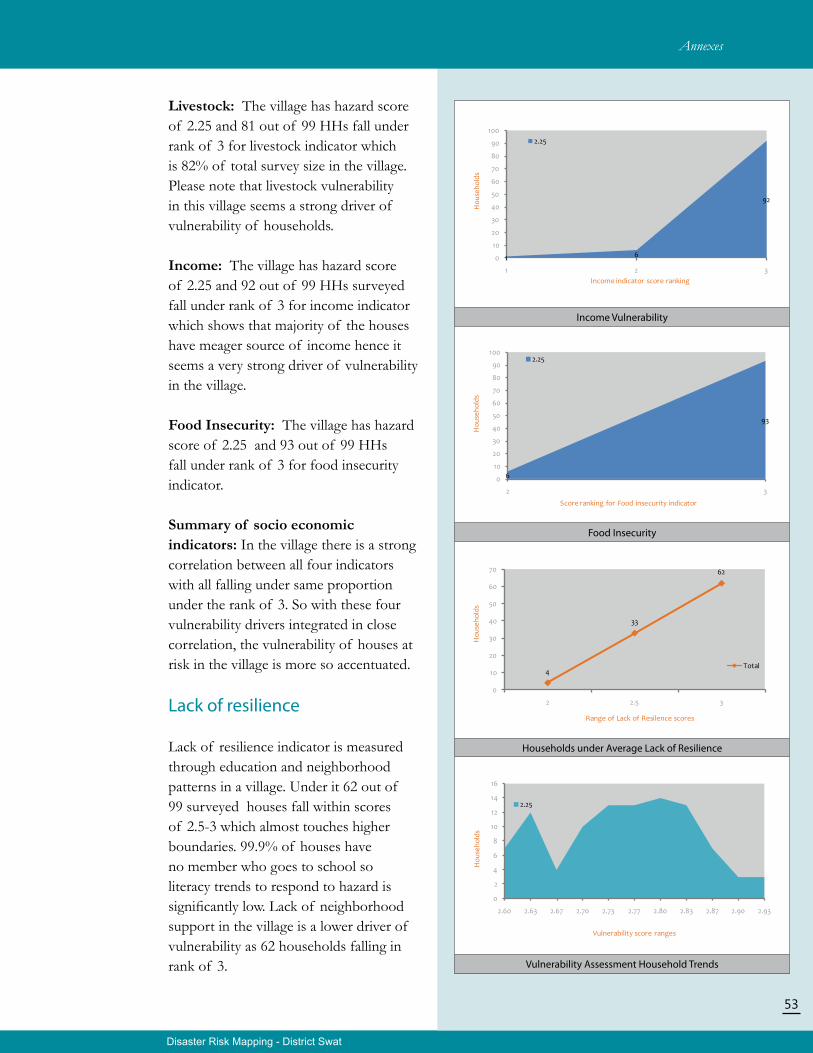
Disaster Risk Mapping - District Swat
53
Income Vulnerability
Food Insecurity
Households under Average Lack of Resilience
Vulnerability Assessment Household Trends
Livestock: The village has hazard score of 2.25 and 81 out of 99 HHs fall under rank of 3 for livestock indicator which is 82% of total survey size in the village. Please note that livestock vulnerability in this village seems a strong driver of vulnerability of households.
Income: The village has hazard score of 2.25 and 92 out of 99 HHs surveyed fall under rank of 3 for income indicator which shows that majority of the houses have meager source of income hence it seems a very strong driver of vulnerability in the village.
Food Insecurity: The village has hazard score of 2.25 and 93 out of 99 HHs fall under rank of 3 for food insecurity indicator.
Summary of socio economic indicators: In the village there is a strong correlation between all four indicators with all falling under same proportion under the rank of 3. So with these four vulnerability drivers integrated in close correlation, the vulnerability of houses at risk in the village is more so accentuated.
Lack of resilience
Lack of resilience indicator is measured through education and neighborhood patterns in a village. Under it 62 out of 99 surveyed houses fall within scores of 2.5-3 which almost touches higher boundaries. 99.9% of houses have no member who goes to school so literacy trends to respond to hazard is significantly low. Lack of neighborhood support in the village is a lower driver of vulnerability as 62 households falling in rank of 3.
Annexes
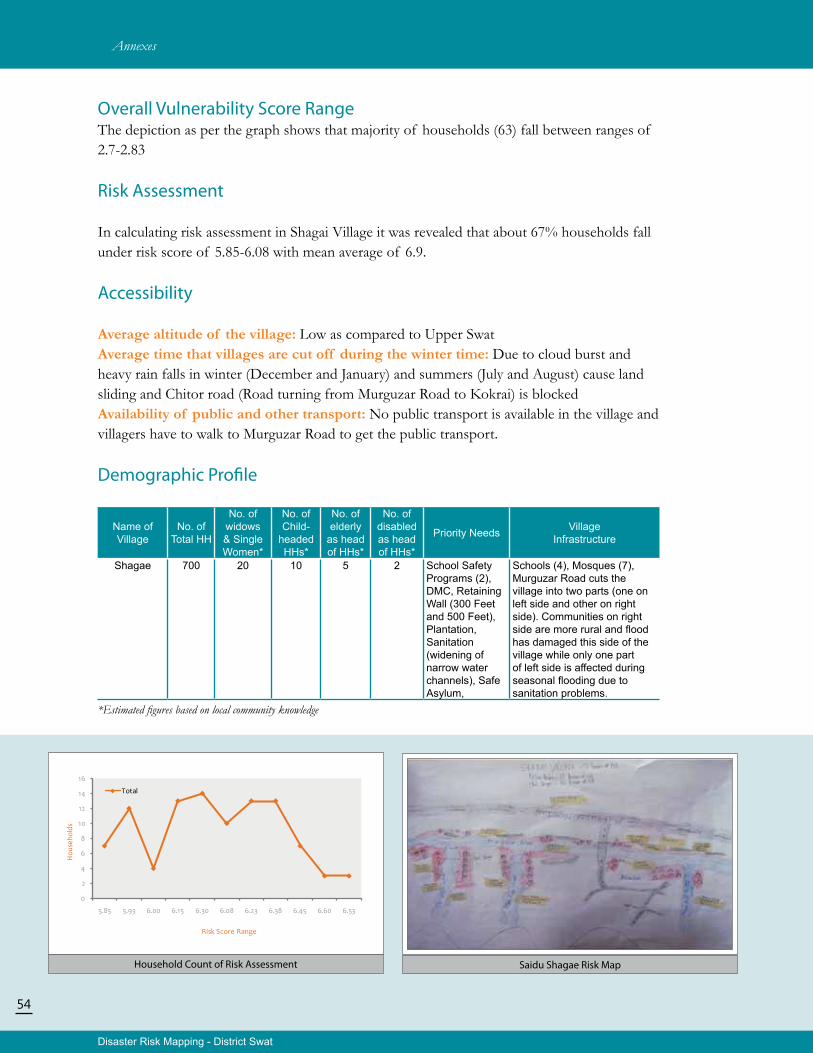
Disaster Risk Mapping - District Swat
54
Household Count of Risk Assessment Saidu Shagae Risk Map
Overall Vulnerability Score RangeThe depiction as per the graph shows that majority of households (63) fall between ranges of 2.7-2.83
Risk Assessment
In calculating risk assessment in Shagai Village it was revealed that about 67% households fall under risk score of 5.85-6.08 with mean average of 6.9.
Accessibility
Average altitude of the village: Low as compared to Upper SwatAverage time that villages are cut off during the winter time: Due to cloud burst and heavy rain falls in winter (December and January) and summers (July and August) cause land sliding and Chitor road (Road turning from Murguzar Road to Kokrai) is blockedAvailability of public and other transport: No public transport is available in the village and villagers have to walk to Murguzar Road to get the public transport.
Demographic Profile
Name of Village
No. of Total HH
No. of widows & Single Women*
No. of Child-
headed HHs*
No. of elderly
as head of HHs*
No. ofdisabledas headof HHs*
Priority Needs Village Infrastructure
Shagae 700 20 10 5 2 School Safety Programs (2), DMC, Retaining Wall (300 Feet and 500 Feet), Plantation, Sanitation (widening of narrow water channels), Safe Asylum,
Schools (4), Mosques (7), Murguzar Road cuts the village into two parts (one on left side and other on right side). Communities on right side are more rural and flood has damaged this side of the village while only one part of left side is affected during seasonal flooding due to sanitation problems.
*Estimated figures based on local community knowledge
Annexes
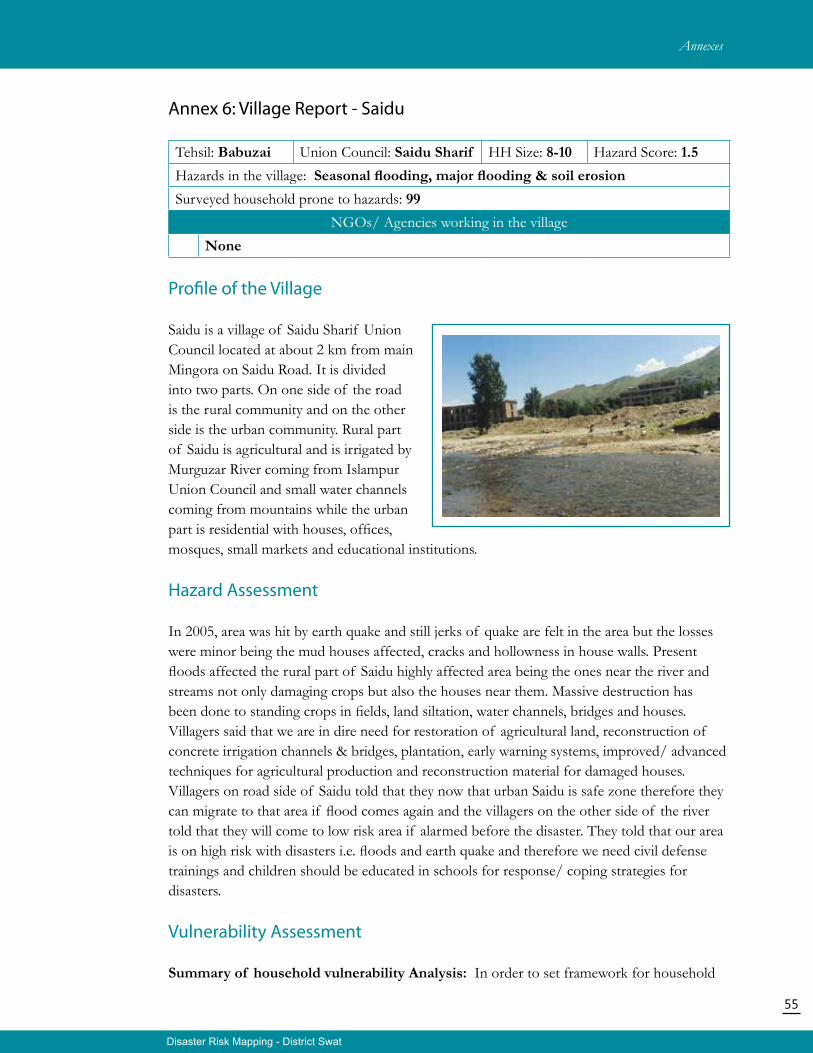
55
Disaster Risk Mapping - District Swat
Annex 6: Village Report - Saidu
Tehsil: Babuzai Union Council: Saidu Sharif HH Size: 8-10 Hazard Score: 1.5Hazards in the village: Seasonal flooding, major flooding & soil erosionSurveyed household prone to hazards: 99
NGOs/ Agencies working in the villageNone
Profile of the Village
Saidu is a village of Saidu Sharif Union Council located at about 2 km from main Mingora on Saidu Road. It is divided into two parts. On one side of the road is the rural community and on the other side is the urban community. Rural part of Saidu is agricultural and is irrigated by Murguzar River coming from Islampur Union Council and small water channels coming from mountains while the urban part is residential with houses, offices, mosques, small markets and educational institutions.
Hazard Assessment
In 2005, area was hit by earth quake and still jerks of quake are felt in the area but the losses were minor being the mud houses affected, cracks and hollowness in house walls. Present floods affected the rural part of Saidu highly affected area being the ones near the river and streams not only damaging crops but also the houses near them. Massive destruction has been done to standing crops in fields, land siltation, water channels, bridges and houses. Villagers said that we are in dire need for restoration of agricultural land, reconstruction of concrete irrigation channels & bridges, plantation, early warning systems, improved/ advanced techniques for agricultural production and reconstruction material for damaged houses. Villagers on road side of Saidu told that they now that urban Saidu is safe zone therefore they can migrate to that area if flood comes again and the villagers on the other side of the river told that they will come to low risk area if alarmed before the disaster. They told that our area is on high risk with disasters i.e. floods and earth quake and therefore we need civil defense trainings and children should be educated in schools for response/ coping strategies for disasters.
Vulnerability Assessment
Summary of household vulnerability Analysis: In order to set framework for household
Annexes
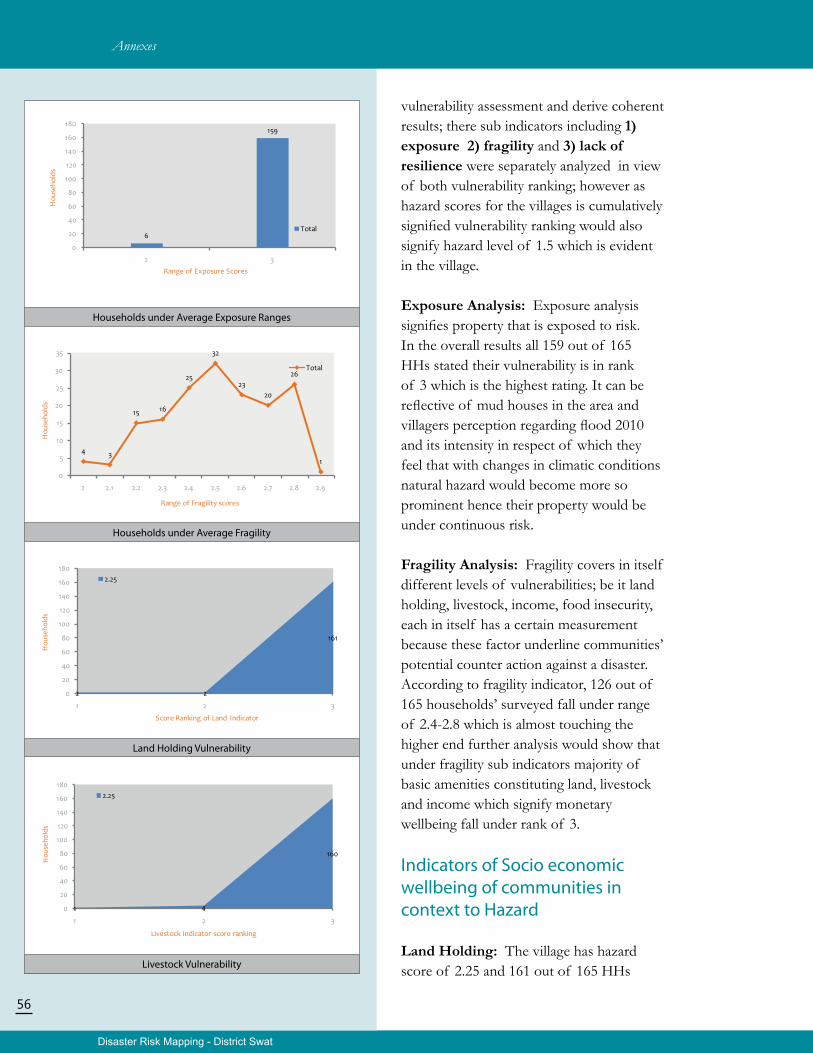
Disaster Risk Mapping - District Swat
56
vulnerability assessment and derive coherent results; there sub indicators including 1) exposure 2) fragility and 3) lack of resilience were separately analyzed in view of both vulnerability ranking; however as hazard scores for the villages is cumulatively signified vulnerability ranking would also signify hazard level of 1.5 which is evident in the village.
Exposure Analysis: Exposure analysis signifies property that is exposed to risk. In the overall results all 159 out of 165 HHs stated their vulnerability is in rank of 3 which is the highest rating. It can be reflective of mud houses in the area and villagers perception regarding flood 2010 and its intensity in respect of which they feel that with changes in climatic conditions natural hazard would become more so prominent hence their property would be under continuous risk.
Fragility Analysis: Fragility covers in itself different levels of vulnerabilities; be it land holding, livestock, income, food insecurity, each in itself has a certain measurement because these factor underline communities’ potential counter action against a disaster. According to fragility indicator, 126 out of 165 households’ surveyed fall under range of 2.4-2.8 which is almost touching the higher end further analysis would show that under fragility sub indicators majority of basic amenities constituting land, livestock and income which signify monetary wellbeing fall under rank of 3.
Indicators of Socio economic wellbeing of communities in context to Hazard
Land Holding: The village has hazard score of 2.25 and 161 out of 165 HHs
Households under Average Exposure Ranges
Households under Average Fragility
Land Holding Vulnerability
Livestock Vulnerability
Annexes
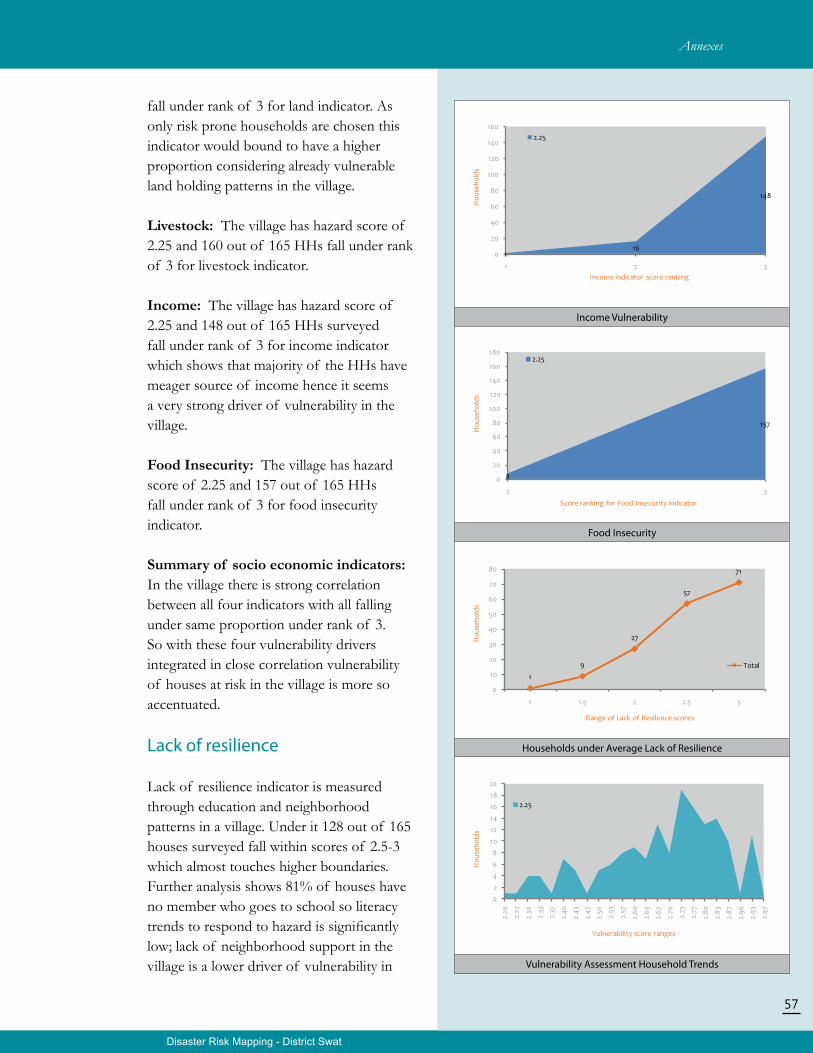
Disaster Risk Mapping - District Swat
57
fall under rank of 3 for land indicator. As only risk prone households are chosen this indicator would bound to have a higher proportion considering already vulnerable land holding patterns in the village.
Livestock: The village has hazard score of 2.25 and 160 out of 165 HHs fall under rank of 3 for livestock indicator.
Income: The village has hazard score of 2.25 and 148 out of 165 HHs surveyed fall under rank of 3 for income indicator which shows that majority of the HHs have meager source of income hence it seems a very strong driver of vulnerability in the village.
Food Insecurity: The village has hazard score of 2.25 and 157 out of 165 HHs fall under rank of 3 for food insecurity indicator.
Summary of socio economic indicators: In the village there is strong correlation between all four indicators with all falling under same proportion under rank of 3. So with these four vulnerability drivers integrated in close correlation vulnerability of houses at risk in the village is more so accentuated.
Lack of resilience
Lack of resilience indicator is measured through education and neighborhood patterns in a village. Under it 128 out of 165 houses surveyed fall within scores of 2.5-3 which almost touches higher boundaries. Further analysis shows 81% of houses have no member who goes to school so literacy trends to respond to hazard is significantly low; lack of neighborhood support in the village is a lower driver of vulnerability in
Income Vulnerability
Food Insecurity
Households under Average Lack of Resilience
Vulnerability Assessment Household Trends
Annexes
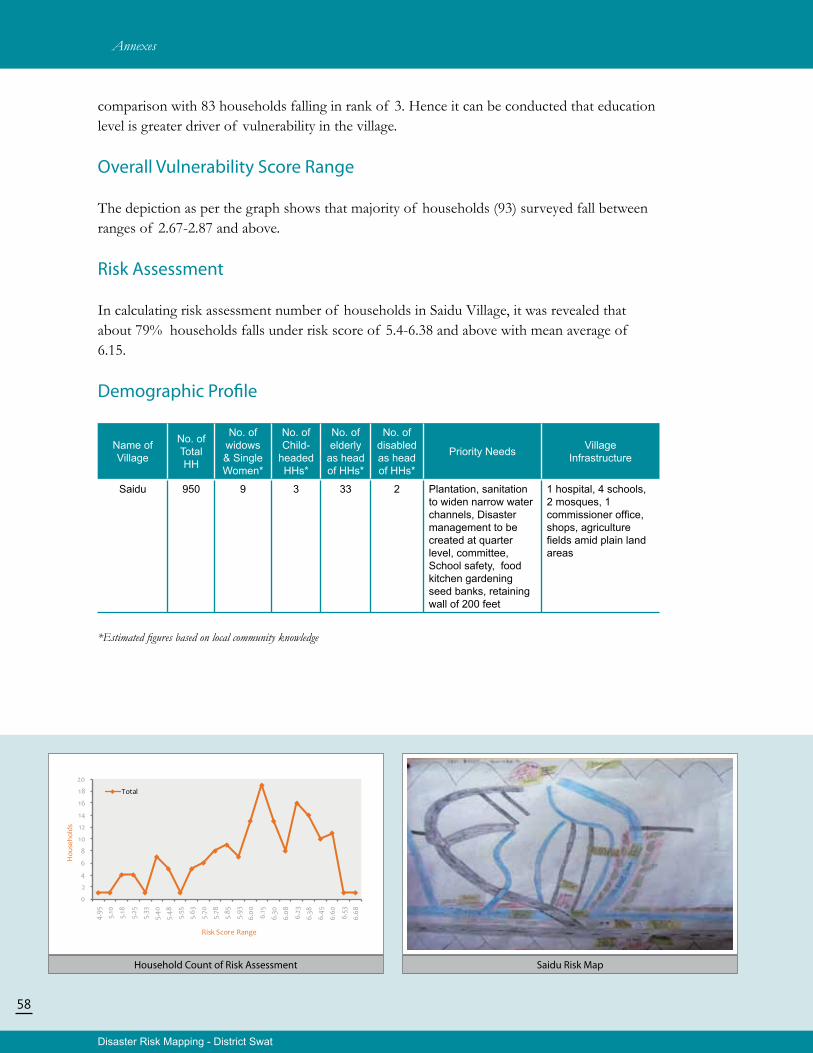
Disaster Risk Mapping - District Swat
58
Saidu Risk MapHousehold Count of Risk Assessment
comparison with 83 households falling in rank of 3. Hence it can be conducted that education level is greater driver of vulnerability in the village.
Overall Vulnerability Score Range
The depiction as per the graph shows that majority of households (93) surveyed fall between ranges of 2.67-2.87 and above.
Risk Assessment
In calculating risk assessment number of households in Saidu Village, it was revealed that about 79% households falls under risk score of 5.4-6.38 and above with mean average of 6.15.
Demographic Profile
Name of Village
No. of Total HH
No. of widows & Single Women*
No. of Child-
headed HHs*
No. of elderly
as head of HHs*
No. ofdisabledas headof HHs*
Priority Needs Village Infrastructure
Saidu 950 9 3 33 2 Plantation, sanitation to widen narrow water channels, Disaster management to be created at quarter level, committee, School safety, food kitchen gardening seed banks, retaining wall of 200 feet
1 hospital, 4 schools, 2 mosques, 1 commissioner office, shops, agriculture fields amid plain land areas
*Estimated figures based on local community knowledge
Annexes
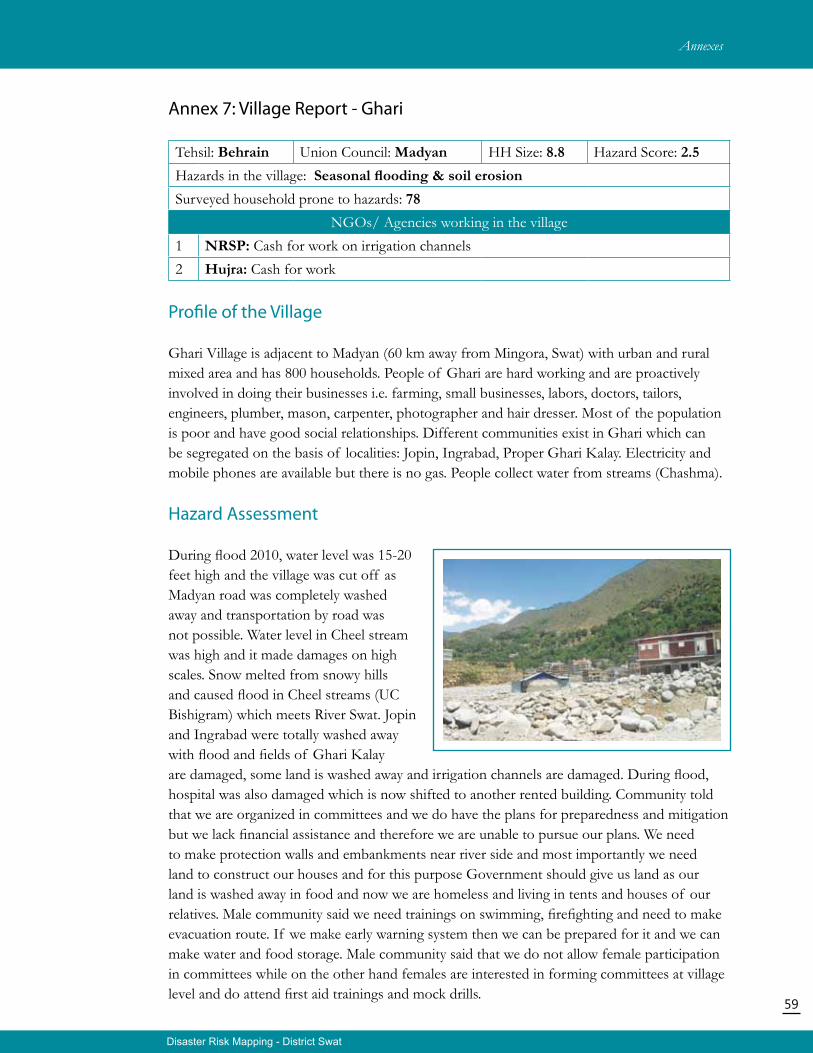
59
Disaster Risk Mapping - District Swat
Annex 7: Village Report - Ghari
Tehsil: Behrain Union Council: Madyan HH Size: 8.8 Hazard Score: 2.5Hazards in the village: Seasonal flooding & soil erosionSurveyed household prone to hazards: 78
NGOs/ Agencies working in the village1 NRSP: Cash for work on irrigation channels2 Hujra: Cash for work
Profile of the Village
Ghari Village is adjacent to Madyan (60 km away from Mingora, Swat) with urban and rural mixed area and has 800 households. People of Ghari are hard working and are proactively involved in doing their businesses i.e. farming, small businesses, labors, doctors, tailors, engineers, plumber, mason, carpenter, photographer and hair dresser. Most of the population is poor and have good social relationships. Different communities exist in Ghari which can be segregated on the basis of localities: Jopin, Ingrabad, Proper Ghari Kalay. Electricity and mobile phones are available but there is no gas. People collect water from streams (Chashma).
Hazard Assessment
During flood 2010, water level was 15-20 feet high and the village was cut off as Madyan road was completely washed away and transportation by road was not possible. Water level in Cheel stream was high and it made damages on high scales. Snow melted from snowy hills and caused flood in Cheel streams (UC Bishigram) which meets River Swat. Jopin and Ingrabad were totally washed away with flood and fields of Ghari Kalay are damaged, some land is washed away and irrigation channels are damaged. During flood, hospital was also damaged which is now shifted to another rented building. Community told that we are organized in committees and we do have the plans for preparedness and mitigation but we lack financial assistance and therefore we are unable to pursue our plans. We need to make protection walls and embankments near river side and most importantly we need land to construct our houses and for this purpose Government should give us land as our land is washed away in food and now we are homeless and living in tents and houses of our relatives. Male community said we need trainings on swimming, firefighting and need to make evacuation route. If we make early warning system then we can be prepared for it and we can make water and food storage. Male community said that we do not allow female participation in committees while on the other hand females are interested in forming committees at village level and do attend first aid trainings and mock drills.
Annexes
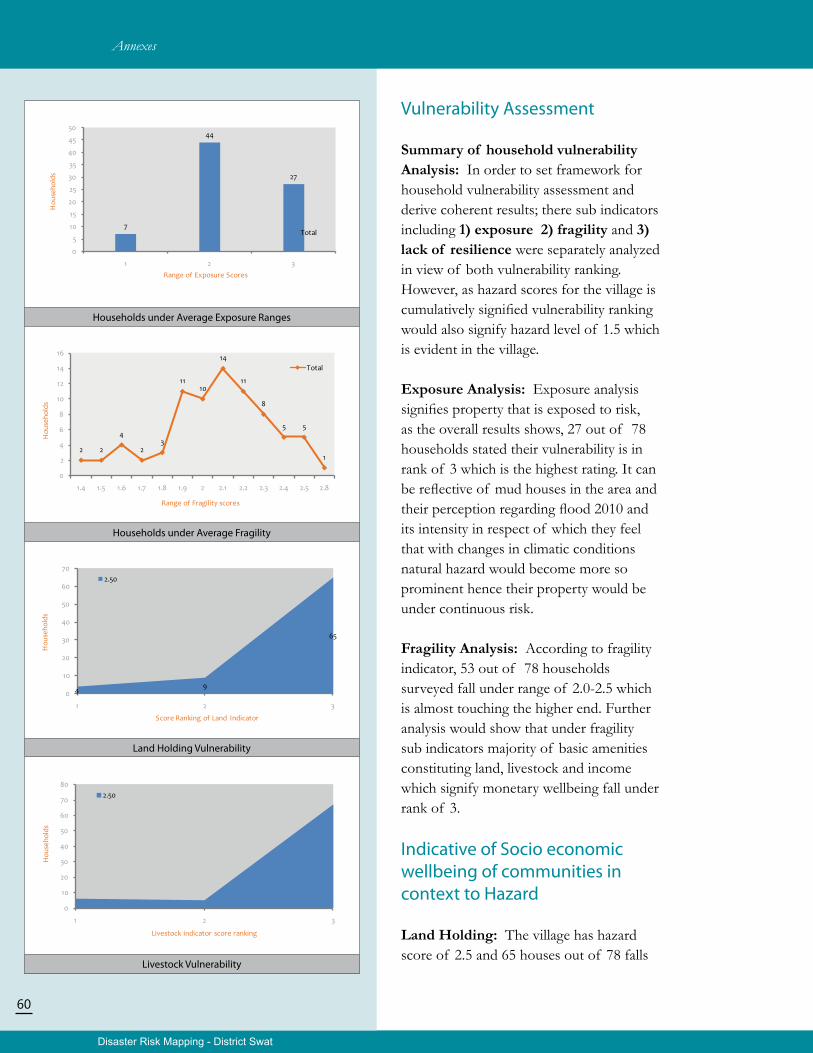
Disaster Risk Mapping - District Swat
60
Vulnerability Assessment
Summary of household vulnerability Analysis: In order to set framework for household vulnerability assessment and derive coherent results; there sub indicators including 1) exposure 2) fragility and 3) lack of resilience were separately analyzed in view of both vulnerability ranking. However, as hazard scores for the village is cumulatively signified vulnerability ranking would also signify hazard level of 1.5 which is evident in the village.
Exposure Analysis: Exposure analysis signifies property that is exposed to risk, as the overall results shows, 27 out of 78 households stated their vulnerability is in rank of 3 which is the highest rating. It can be reflective of mud houses in the area and their perception regarding flood 2010 and its intensity in respect of which they feel that with changes in climatic conditions natural hazard would become more so prominent hence their property would be under continuous risk.
Fragility Analysis: According to fragility indicator, 53 out of 78 households surveyed fall under range of 2.0-2.5 which is almost touching the higher end. Further analysis would show that under fragility sub indicators majority of basic amenities constituting land, livestock and income which signify monetary wellbeing fall under rank of 3.
Indicative of Socio economic wellbeing of communities in context to Hazard
Land Holding: The village has hazard score of 2.5 and 65 houses out of 78 falls
Households under Average Exposure Ranges
Households under Average Fragility
Land Holding Vulnerability
Livestock Vulnerability
Annexes

Disaster Risk Mapping - District Swat
61
under rank of 3 for land indicator .As only risk prone households are chosen this indicator would bound to have a higher proportion considering already vulnerable land holding patterns in the village.
Livestock: The village has hazard score of 2.5 and 67 out of 78 HHs fall under rank of 3 for livestock indicator.
Income: The village has hazard score of 2.5 and 39 houses out of 78 surveyed falls under rank of 3 for income indicator which shows that majority of the houses surveyed have meager source of income. However in comparison to other villages it seems comparatively low.
Food Insecurity: The village has hazard score of 2.50 and 56 out of 78 HHs fall under rank of 2 for food insecurity indicator.
Summary of socio economic indicators: In the village there is a strong correlation between land holding and livestock with both falling under same proportion under rank of 3. However other two indicators such as food insecurity and income are comparatively low, in fact most of the households fall in score of 2 for it which goes to show that despite hazard, food insecurity and income levels are not at critically high vulnerability level.
Lack of resilience
Lack of resilience indicator is measured through education and neighborhood patterns in a village, under it 61 out of 78 HHs surveyed fall within scores of 2.5
Income Vulnerability
Food Insecurity
Households under Average Lack of Resilience
Vulnerability Assessment Household Trends
Annexes
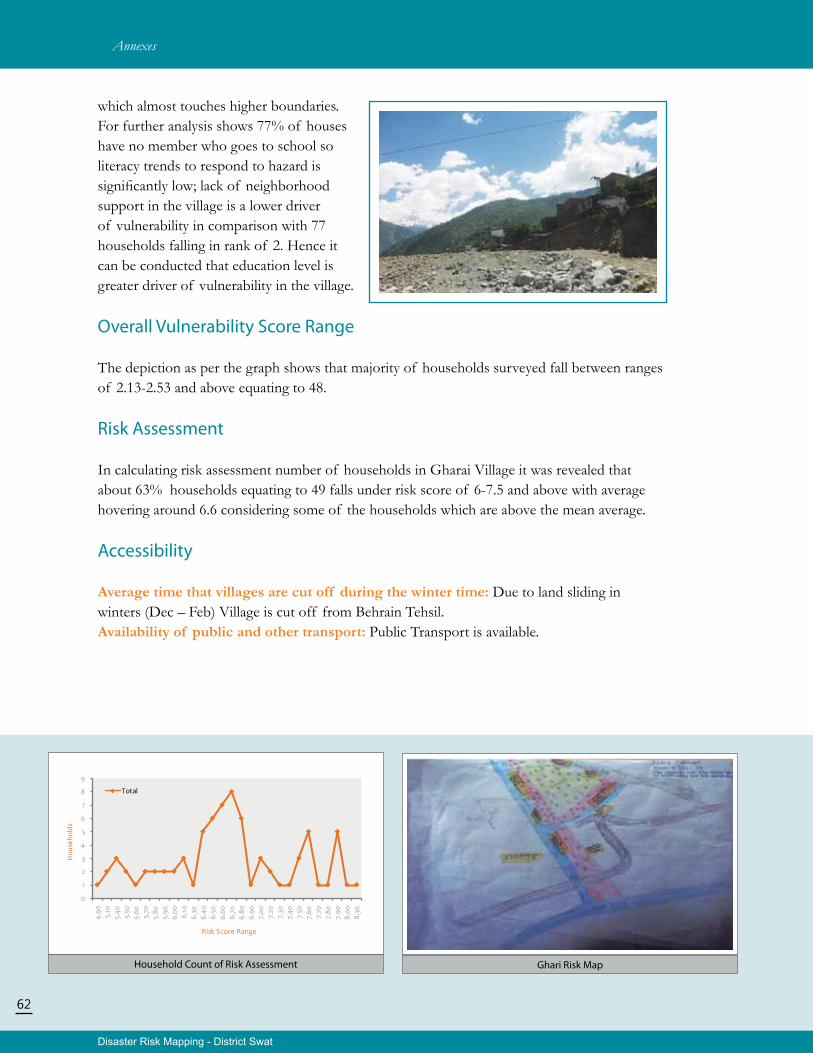
Disaster Risk Mapping - District Swat
62
Household Count of Risk Assessment Ghari Risk Map
which almost touches higher boundaries. For further analysis shows 77% of houses have no member who goes to school so literacy trends to respond to hazard is significantly low; lack of neighborhood support in the village is a lower driver of vulnerability in comparison with 77 households falling in rank of 2. Hence it can be conducted that education level is greater driver of vulnerability in the village.
Overall Vulnerability Score Range
The depiction as per the graph shows that majority of households surveyed fall between ranges of 2.13-2.53 and above equating to 48.
Risk Assessment
In calculating risk assessment number of households in Gharai Village it was revealed that about 63% households equating to 49 falls under risk score of 6-7.5 and above with average hovering around 6.6 considering some of the households which are above the mean average.
Accessibility
Average time that villages are cut off during the winter time: Due to land sliding in winters (Dec – Feb) Village is cut off from Behrain Tehsil.Availability of public and other transport: Public Transport is available.
Annexes
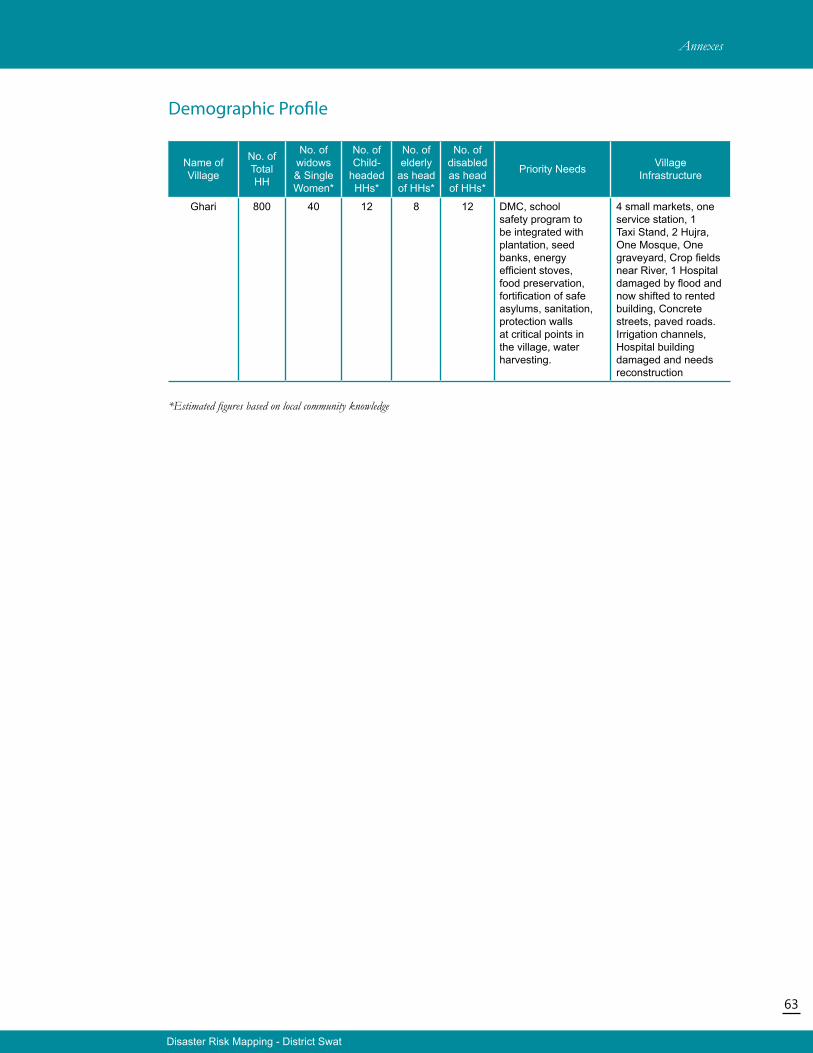
63
Disaster Risk Mapping - District Swat
Demographic Profile
Name of Village
No. of Total HH
No. of widows & Single Women*
No. of Child-
headed HHs*
No. of elderly
as head of HHs*
No. ofdisabledas headof HHs*
Priority Needs Village Infrastructure
Ghari 800 40 12 8 12 DMC, school safety program to be integrated with plantation, seed banks, energy efficient stoves, food preservation, fortification of safe asylums, sanitation, protection walls at critical points in the village, water harvesting.
4 small markets, one service station, 1 Taxi Stand, 2 Hujra, One Mosque, One graveyard, Crop fields near River, 1 Hospital damaged by flood and now shifted to rented building, Concrete streets, paved roads. Irrigation channels, Hospital building damaged and needs reconstruction
*Estimated figures based on local community knowledge
Annexes
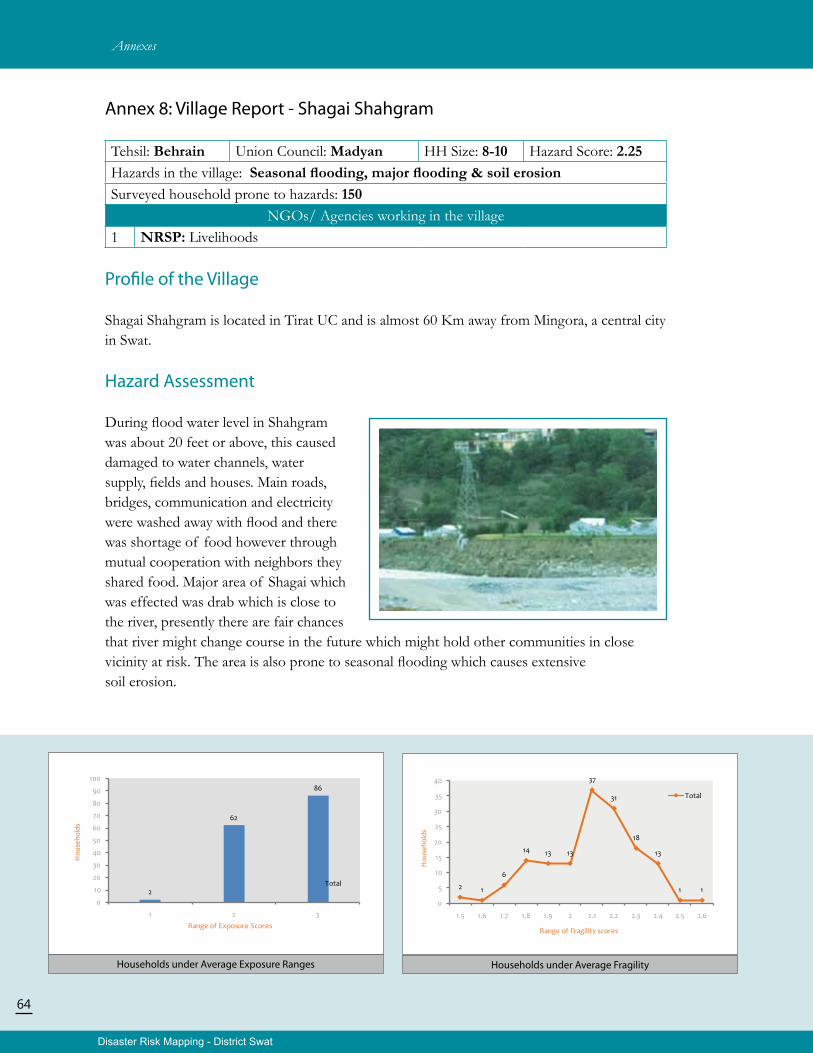
Disaster Risk Mapping - District Swat
64
Households under Average Exposure Ranges Households under Average Fragility
Annex 8: Village Report - Shagai Shahgram
Tehsil: Behrain Union Council: Madyan HH Size: 8-10 Hazard Score: 2.25Hazards in the village: Seasonal flooding, major flooding & soil erosionSurveyed household prone to hazards: 150
NGOs/ Agencies working in the village1 NRSP: Livelihoods
Profile of the Village
Shagai Shahgram is located in Tirat UC and is almost 60 Km away from Mingora, a central city in Swat.
Hazard Assessment
During flood water level in Shahgram was about 20 feet or above, this caused damaged to water channels, water supply, fields and houses. Main roads, bridges, communication and electricity were washed away with flood and there was shortage of food however through mutual cooperation with neighbors they shared food. Major area of Shagai which was effected was drab which is close to the river, presently there are fair chances that river might change course in the future which might hold other communities in close vicinity at risk. The area is also prone to seasonal flooding which causes extensive soil erosion.
Annexes
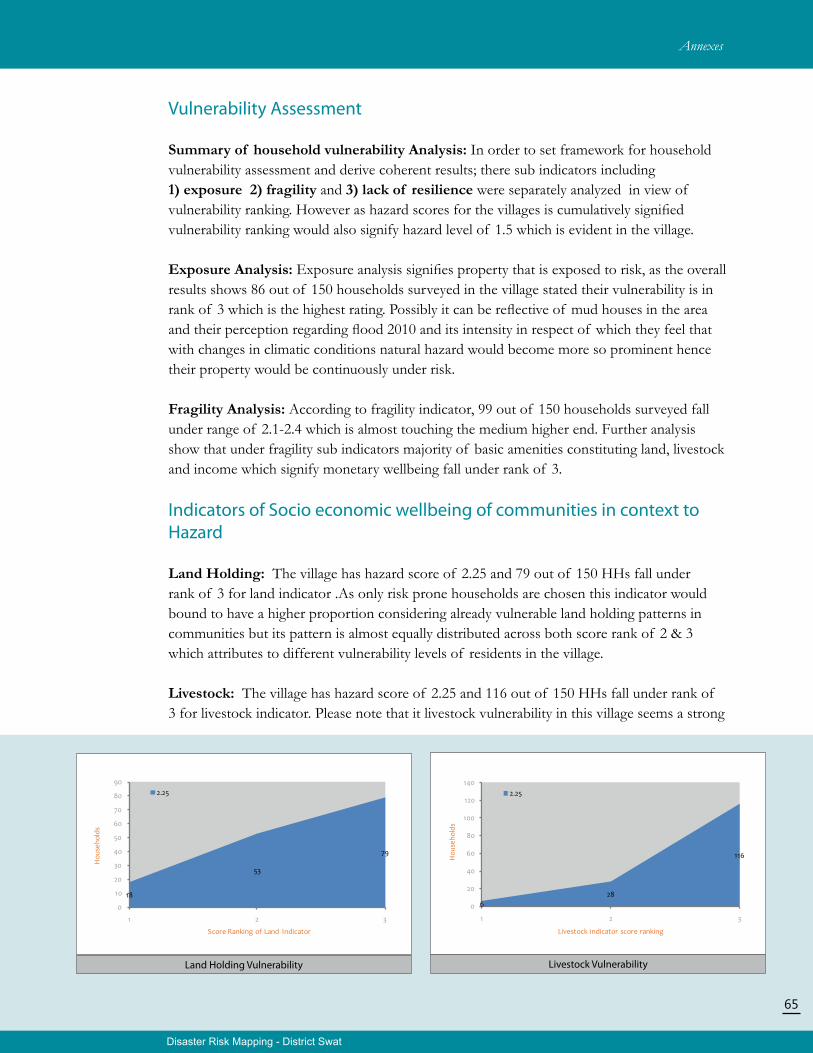
Disaster Risk Mapping - District Swat
65
Vulnerability Assessment
Summary of household vulnerability Analysis: In order to set framework for household vulnerability assessment and derive coherent results; there sub indicators including 1) exposure 2) fragility and 3) lack of resilience were separately analyzed in view of vulnerability ranking. However as hazard scores for the villages is cumulatively signified vulnerability ranking would also signify hazard level of 1.5 which is evident in the village.
Exposure Analysis: Exposure analysis signifies property that is exposed to risk, as the overall results shows 86 out of 150 households surveyed in the village stated their vulnerability is in rank of 3 which is the highest rating. Possibly it can be reflective of mud houses in the area and their perception regarding flood 2010 and its intensity in respect of which they feel that with changes in climatic conditions natural hazard would become more so prominent hence their property would be continuously under risk.
Fragility Analysis: According to fragility indicator, 99 out of 150 households surveyed fall under range of 2.1-2.4 which is almost touching the medium higher end. Further analysis show that under fragility sub indicators majority of basic amenities constituting land, livestock and income which signify monetary wellbeing fall under rank of 3.
Indicators of Socio economic wellbeing of communities in context to Hazard
Land Holding: The village has hazard score of 2.25 and 79 out of 150 HHs fall under rank of 3 for land indicator .As only risk prone households are chosen this indicator would bound to have a higher proportion considering already vulnerable land holding patterns in communities but its pattern is almost equally distributed across both score rank of 2 & 3 which attributes to different vulnerability levels of residents in the village.
Livestock: The village has hazard score of 2.25 and 116 out of 150 HHs fall under rank of 3 for livestock indicator. Please note that it livestock vulnerability in this village seems a strong
Livestock VulnerabilityLand Holding Vulnerability
Annexes
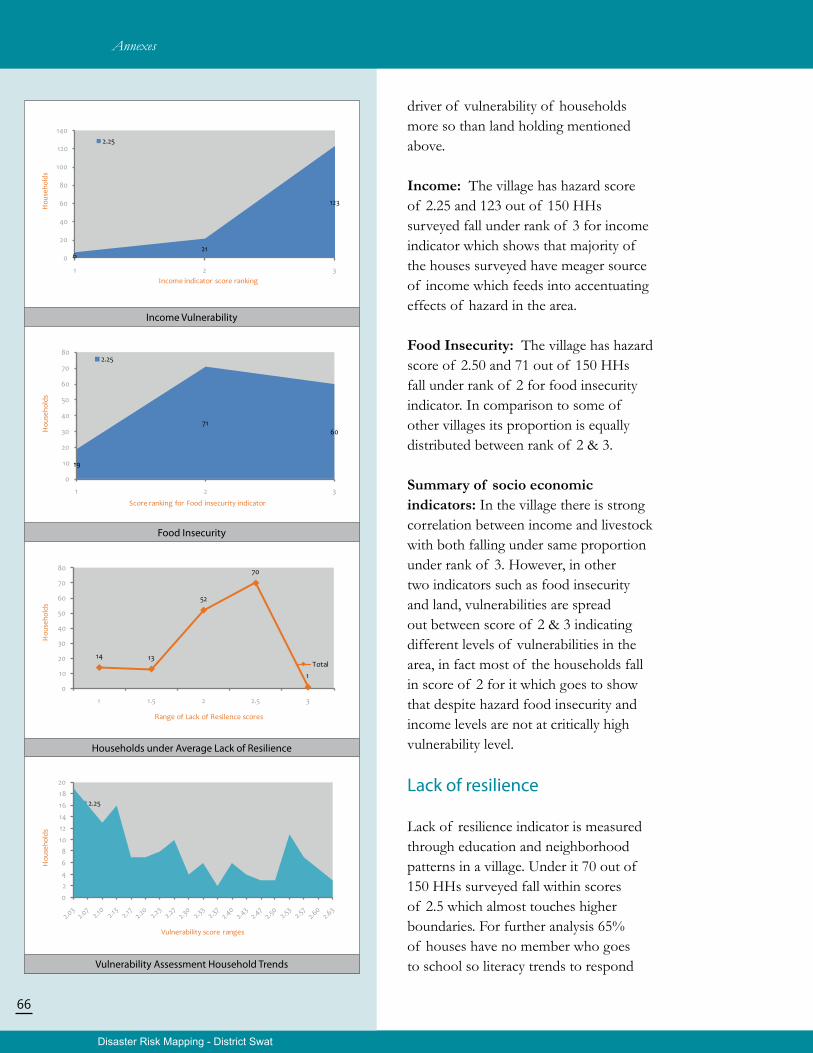
Disaster Risk Mapping - District Swat
66
Income Vulnerability
Food Insecurity
Households under Average Lack of Resilience
Vulnerability Assessment Household Trends
driver of vulnerability of households more so than land holding mentioned above.
Income: The village has hazard score of 2.25 and 123 out of 150 HHs surveyed fall under rank of 3 for income indicator which shows that majority of the houses surveyed have meager source of income which feeds into accentuating effects of hazard in the area.
Food Insecurity: The village has hazard score of 2.50 and 71 out of 150 HHs fall under rank of 2 for food insecurity indicator. In comparison to some of other villages its proportion is equally distributed between rank of 2 & 3.
Summary of socio economic indicators: In the village there is strong correlation between income and livestock with both falling under same proportion under rank of 3. However, in other two indicators such as food insecurity and land, vulnerabilities are spread out between score of 2 & 3 indicating different levels of vulnerabilities in the area, in fact most of the households fall in score of 2 for it which goes to show that despite hazard food insecurity and income levels are not at critically high vulnerability level.
Lack of resilience
Lack of resilience indicator is measured through education and neighborhood patterns in a village. Under it 70 out of 150 HHs surveyed fall within scores of 2.5 which almost touches higher boundaries. For further analysis 65% of houses have no member who goes to school so literacy trends to respond
Annexes
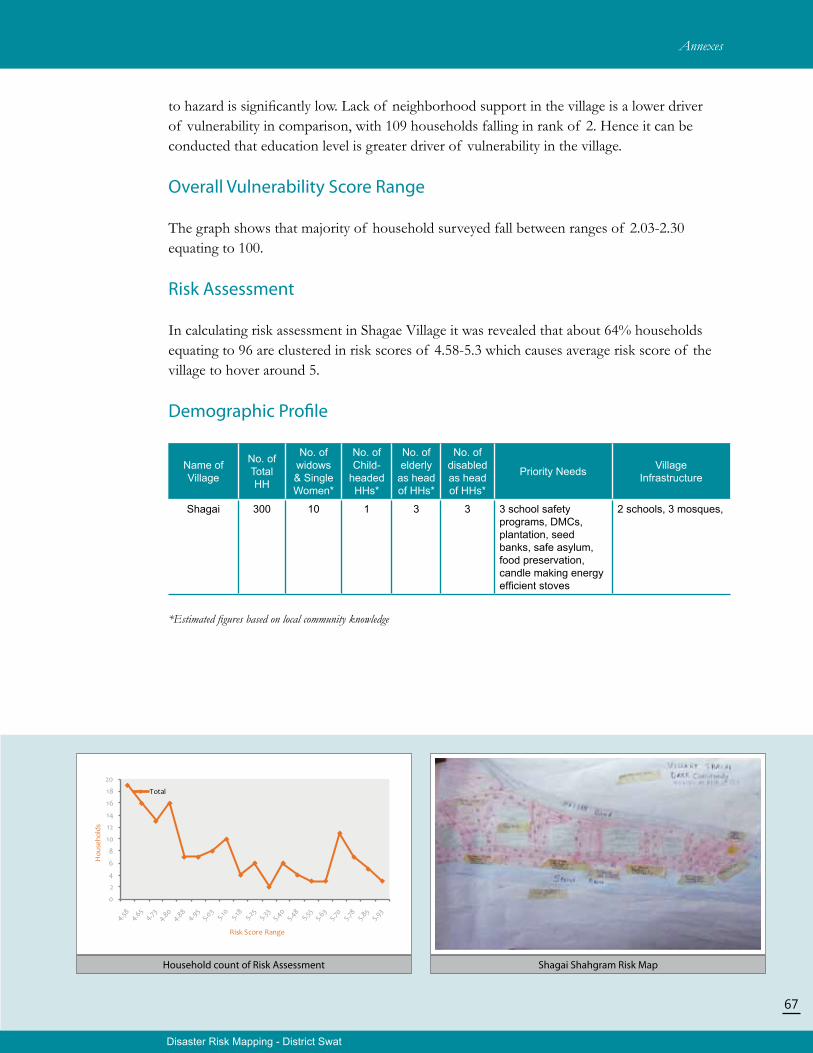
Disaster Risk Mapping - District Swat
67
Household count of Risk Assessment Shagai Shahgram Risk Map
to hazard is significantly low. Lack of neighborhood support in the village is a lower driver of vulnerability in comparison, with 109 households falling in rank of 2. Hence it can be conducted that education level is greater driver of vulnerability in the village.
Overall Vulnerability Score Range
The graph shows that majority of household surveyed fall between ranges of 2.03-2.30 equating to 100.
Risk Assessment
In calculating risk assessment in Shagae Village it was revealed that about 64% households equating to 96 are clustered in risk scores of 4.58-5.3 which causes average risk score of the village to hover around 5.
Demographic Profile
Name of Village
No. of Total HH
No. of widows & Single Women*
No. of Child-
headed HHs*
No. of elderly
as head of HHs*
No. ofdisabledas headof HHs*
Priority Needs Village Infrastructure
Shagai 300 10 1 3 3 3 school safety programs, DMCs, plantation, seed banks, safe asylum, food preservation, candle making energy efficient stoves
2 schools, 3 mosques,
*Estimated figures based on local community knowledge
Annexes
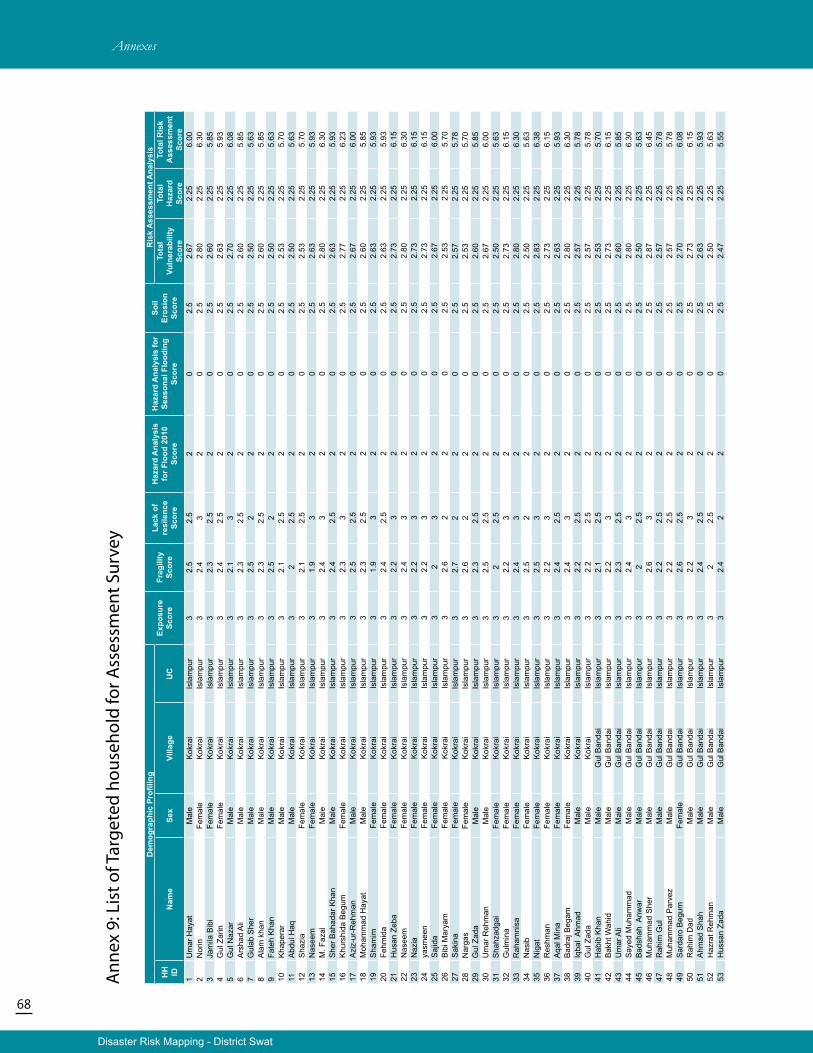
68
Disaster Risk Mapping - District Swat
Ann
ex 9
: Lis
t of T
arge
ted
hous
ehol
d fo
r Ass
essm
ent S
urve
y
Dem
ogra
phic
Pro
filin
gEx
posu
re
Scor
eFr
agili
ty
Scor
e
Lack
of
resi
lenc
e Sc
ore
Haz
ard
Ana
lysi
s fo
r Flo
od 2
010
Scor
e
Haz
ard
Ana
lysi
s fo
r Se
ason
al F
lood
ing
Scor
e
Soil
Eros
ion
Scor
e
Ris
k A
sses
smen
t Ana
lysi
s
HH
ID
Nam
eSe
xVi
llage
UC
Tota
l Vu
lner
abili
ty
Scor
e
Tota
l H
azar
d Sc
ore
Tota
l Ris
k A
sses
smen
t Sc
ore
1U
mar
Hay
atM
ale
Kok
rai
Isla
mpu
r3
2.5
2.5
20
2.5
2.67
2.25
6.00
2N
orin
Fem
ale
Kok
rai
Isla
mpu
r3
2.4
32
02.
52.
802.
256.
303
Jam
ila B
ibi
Fem
ale
Kok
rai
Isla
mpu
r3
2.3
2.5
20
2.5
2.60
2.25
5.85
4G
ul Z
arin
Fem
ale
Kok
rai
Isla
mpu
r3
2.4
2.5
20
2.5
2.63
2.25
5.93
5G
ul N
azar
Mal
eK
okra
iIs
lam
pur
32.
13
20
2.5
2.70
2.25
6.08
6A
rsha
d A
liM
ale
Kok
rai
Isla
mpu
r3
2.3
2.5
20
2.5
2.60
2.25
5.85
7G
ulab
She
rM
ale
Kok
rai
Isla
mpu
r3
2.5
22
02.
52.
502.
255.
638
Ala
m k
han
Mal
eK
okra
iIs
lam
pur
32.
32.
52
02.
52.
602.
255.
859
Fate
h K
han
Mal
eK
okra
iIs
lam
pur
32.
52
20
2.5
2.50
2.25
5.63
10K
hape
rar
Mal
eK
okra
iIs
lam
pur
32.
12.
52
02.
52.
532.
255.
7011
Abd
ul H
aqM
ale
Kok
rai
Isla
mpu
r3
22.
52
02.
52.
502.
255.
6312
Sha
zia
Fem
ale
Kok
rai
Isla
mpu
r3
2.1
2.5
20
2.5
2.53
2.25
5.70
13N
asee
mFe
mal
eK
okra
iIs
lam
pur
31.
93
20
2.5
2.63
2.25
5.93
14M
. Faz
alM
ale
Kok
rai
Isla
mpu
r3
2.4
32
02.
52.
802.
256.
3015
She
r Bah
adar
Kha
nM
ale
Kok
rai
Isla
mpu
r3
2.4
2.5
20
2.5
2.63
2.25
5.93
16K
hurs
hida
Beg
umFe
mal
eK
okra
iIs
lam
pur
32.
33
20
2.5
2.77
2.25
6.23
17A
ziz-
ur-R
ehm
anM
ale
Kok
rai
Isla
mpu
r3
2.5
2.5
20
2.5
2.67
2.25
6.00
18M
oham
mad
Hay
atM
ale
Kok
rai
Isla
mpu
r3
2.3
2.5
20
2.5
2.60
2.25
5.85
19S
ham
imFe
mal
eK
okra
iIs
lam
pur
31.
93
20
2.5
2.63
2.25
5.93
20Fe
hmid
aFe
mal
eK
okra
iIs
lam
pur
32.
42.
52
02.
52.
632.
255.
9321
Hus
an Z
eba
Fem
ale
Kok
rai
Isla
mpu
r3
2.2
32
02.
52.
732.
256.
1522
Nas
eem
Fem
ale
Kok
rai
Isla
mpu
r3
2.4
32
02.
52.
802.
256.
3023
Naz
iaFe
mal
eK
okra
iIs
lam
pur
32.
23
20
2.5
2.73
2.25
6.15
24ya
smee
nFe
mal
eK
okra
iIs
lam
pur
32.
23
20
2.5
2.73
2.25
6.15
25S
ajid
aFe
mal
eK
okra
iIs
lam
pur
32
32
02.
52.
672.
256.
0026
Bib
i Mar
yam
Fem
ale
Kok
rai
Isla
mpu
r3
2.6
22
02.
52.
532.
255.
7027
Sak
ina
Fem
ale
Kok
rai
Isla
mpu
r3
2.7
22
02.
52.
572.
255.
7828
Nar
gas
Fem
ale
Kok
rai
Isla
mpu
r3
2.6
22
02.
52.
532.
255.
7029
Gul
Zad
aM
ale
Kok
rai
Isla
mpu
r3
2.3
2.5
20
2.5
2.60
2.25
5.85
30U
mar
Reh
man
Mal
eK
okra
iIs
lam
pur
32.
52.
52
02.
52.
672.
256.
0031
Sha
hzad
gai
Fem
ale
Kok
rai
Isla
mpu
r3
22.
52
02.
52.
502.
255.
6332
Gul
min
aFe
mal
eK
okra
iIs
lam
pur
32.
23
20
2.5
2.73
2.25
6.15
33R
aham
nisa
Fem
ale
Kok
rai
Isla
mpu
r3
2.4
32
02.
52.
802.
256.
3034
Nas
ibFe
mal
eK
okra
iIs
lam
pur
32.
52
20
2.5
2.50
2.25
5.63
35N
igat
Fem
ale
Kok
rai
Isla
mpu
r3
2.5
32
02.
52.
832.
256.
3836
Res
hman
Fem
ale
Kok
rai
Isla
mpu
r3
2.2
32
02.
52.
732.
256.
1537
Aqa
l Min
aFe
mal
eK
okra
iIs
lam
pur
32.
42.
52
02.
52.
632.
255.
9338
Bad
raj B
egam
Fem
ale
Kok
rai
Isla
mpu
r3
2.4
32
02.
52.
802.
256.
3039
Iqba
l A
hmad
Mal
eK
okra
iIs
lam
pur
32.
22.
52
02.
52.
572.
255.
7840
Gul
Zad
aM
ale
Kok
rai
Isla
mpu
r3
2.2
2.5
20
2.5
2.57
2.25
5.78
41H
abib
Kha
nM
ale
Gul
Ban
dai
Isla
mpu
r3
2.1
2.5
20
2.5
2.53
2.25
5.70
42B
akht
Wah
idM
ale
Gul
Ban
dai
Isla
mpu
r3
2.2
32
02.
52.
732.
256.
1543
Um
ar A
liM
ale
Gul
Ban
dai
Isla
mpu
r3
2.3
2.5
20
2.5
2.60
2.25
5.85
44S
ayed
Muh
amm
adM
ale
Gul
Ban
dai
Isla
mpu
r3
2.4
32
02.
52.
802.
256.
3045
Bad
shah
Anw
arM
ale
Gul
Ban
dai
Isla
mpu
r3
22.
52
02.
52.
502.
255.
6346
Muh
amm
ad S
her
Mal
eG
ul B
anda
iIs
lam
pur
32.
63
20
2.5
2.87
2.25
6.45
47R
ahim
Gul
Mal
eG
ul B
anda
iIs
lam
pur
32.
22.
52
02.
52.
572.
255.
7848
Muh
amm
ad P
arve
zM
ale
Gul
Ban
dai
Isla
mpu
r3
2.2
2.5
20
2.5
2.57
2.25
5.78
49S
arda
ro B
egum
Fem
ale
Gul
Ban
dai
Isla
mpu
r3
2.6
2.5
20
2.5
2.70
2.25
6.08
50R
ahim
Dad
Mal
eG
ul B
anda
iIs
lam
pur
32.
23
20
2.5
2.73
2.25
6.15
51A
hmad
Sha
hM
ale
Gul
Ban
dai
Isla
mpu
r3
2.4
2.5
20
2.5
2.63
2.25
5.93
52H
azra
t Reh
man
Mal
eG
ul B
anda
iIs
lam
pur
32
2.5
20
2.5
2.50
2.25
5.63
53H
ussa
n Za
daM
ale
Gul
Ban
dai
Isla
mpu
r3
2.4
22
02.
52.
472.
255.
55
Annexes
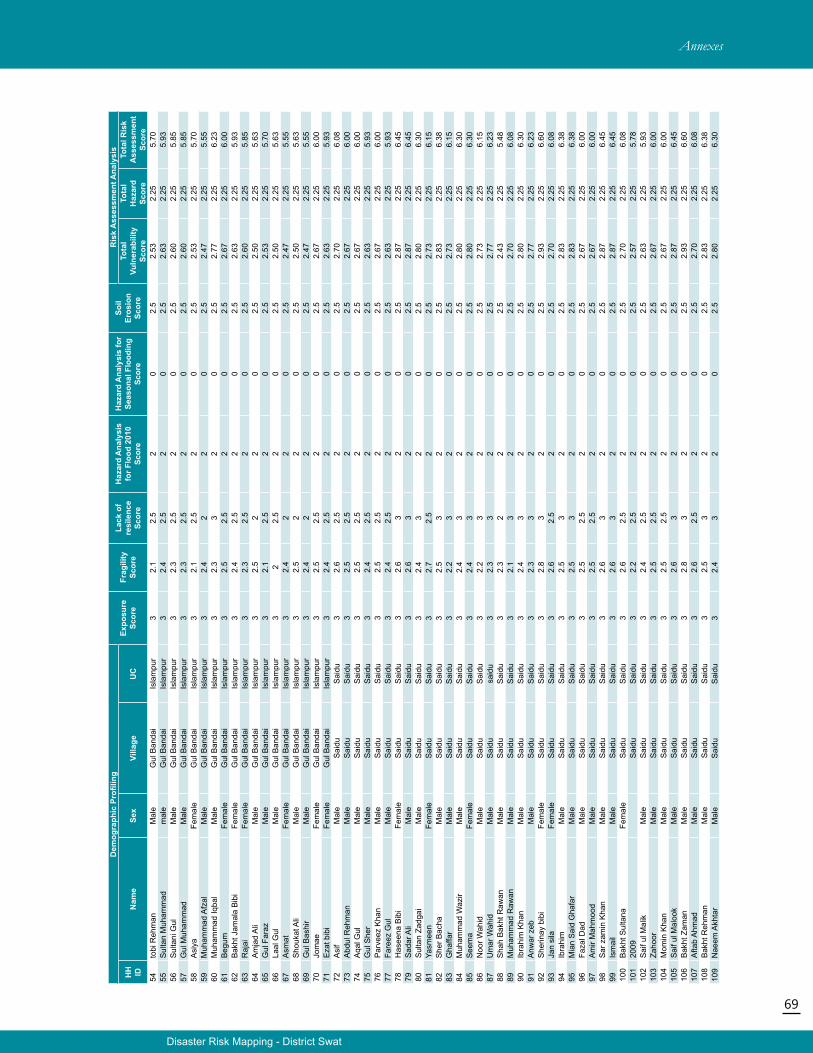
69
Disaster Risk Mapping - District Swat
Dem
ogra
phic
Pro
filin
gEx
posu
re
Scor
eFr
agili
ty
Scor
e
Lack
of
resi
lenc
e Sc
ore
Haz
ard
Ana
lysi
s fo
r Flo
od 2
010
Scor
e
Haz
ard
Ana
lysi
s fo
r Se
ason
al F
lood
ing
Scor
e
Soil
Eros
ion
Scor
e
Ris
k A
sses
smen
t Ana
lysi
s
HH
ID
Nam
eSe
xVi
llage
UC
Tota
l Vu
lner
abili
ty
Scor
e
Tota
l H
azar
d Sc
ore
Tota
l Ris
k A
sses
smen
t Sc
ore
54to
bi R
ehm
anM
ale
Gul
Ban
dai
Isla
mpu
r3
2.1
2.5
20
2.5
2.53
2.25
5.70
55S
ulta
n M
uham
mad
mal
eG
ul B
anda
iIs
lam
pur
32.
42.
52
02.
52.
632.
255.
9356
Sul
tani
Gul
Mal
eG
ul B
anda
iIs
lam
pur
32.
32.
52
02.
52.
602.
255.
8557
Gul
Muh
amm
adM
ale
Gul
Ban
dai
Isla
mpu
r3
2.3
2.5
20
2.5
2.60
2.25
5.85
58A
siya
Fem
ale
Gul
Ban
dai
Isla
mpu
r3
2.1
2.5
20
2.5
2.53
2.25
5.70
59M
uham
mad
Afz
alM
ale
Gul
Ban
dai
Isla
mpu
r3
2.4
22
02.
52.
472.
255.
5560
Muh
amm
ad Iq
bal
Mal
eG
ul B
anda
iIs
lam
pur
32.
33
20
2.5
2.77
2.25
6.23
61B
egum
Fem
ale
Gul
Ban
dai
Isla
mpu
r3
2.5
2.5
20
2.5
2.67
2.25
6.00
62B
akht
Jam
ala
Bib
iFe
mal
eG
ul B
anda
iIs
lam
pur
32.
42.
52
02.
52.
632.
255.
9363
Raj
ai
Fem
ale
Gul
Ban
dai
Isla
mpu
r3
2.3
2.5
20
2.5
2.60
2.25
5.85
64A
mja
d A
liM
ale
Gul
Ban
dai
Isla
mpu
r3
2.5
22
02.
52.
502.
255.
6365
Gul
Far
azM
ale
Gul
Ban
dai
Isla
mpu
r3
2.1
2.5
20
2.5
2.53
2.25
5.70
66La
al G
ulM
ale
Gul
Ban
dai
Isla
mpu
r3
22.
52
02.
52.
502.
255.
6367
Asm
atFe
mal
eG
ul B
anda
iIs
lam
pur
32.
42
20
2.5
2.47
2.25
5.55
68S
houk
at A
liM
ale
Gul
Ban
dai
Isla
mpu
r3
2.5
22
02.
52.
502.
255.
6369
Gul
Bas
hir
Mal
eG
ul B
anda
iIs
lam
pur
32.
42
20
2.5
2.47
2.25
5.55
70Jo
mae
Fem
ale
Gul
Ban
dai
Isla
mpu
r3
2.5
2.5
20
2.5
2.67
2.25
6.00
71E
zat b
ibi
Fem
ale
Gul
Ban
dai
Isla
mpu
r3
2.4
2.5
20
2.5
2.63
2.25
5.93
72A
sif
Mal
eS
aidu
Sai
du3
2.6
2.5
20
2.5
2.70
2.25
6.08
73A
bdul
Reh
man
Mal
eS
aidu
Sai
du3
2.5
2.5
20
2.5
2.67
2.25
6.00
74A
qal G
ulM
ale
Sai
duS
aidu
32.
52.
52
02.
52.
672.
256.
0075
Gul
She
rM
ale
Sai
duS
aidu
32.
42.
52
02.
52.
632.
255.
9376
Par
veez
Kha
nM
ale
Sai
duS
aidu
32.
52.
52
02.
52.
672.
256.
0077
Fare
ez G
ulM
ale
Sai
duS
aidu
32.
42.
52
02.
52.
632.
255.
9378
Has
eena
Bib
iFe
mal
eS
aidu
Sai
du3
2.6
32
02.
52.
872.
256.
4579
Sad
ar A
liM
ale
Sai
duS
aidu
32.
63
20
2.5
2.87
2.25
6.45
80S
ulta
n Za
dgai
Mal
eS
aidu
Sai
du3
2.4
32
02.
52.
802.
256.
3081
Yasm
een
Fem
ale
Sai
duS
aidu
32.
72.
52
02.
52.
732.
256.
1582
She
r Bac
haM
ale
Sai
duS
aidu
32.
53
20
2.5
2.83
2.25
6.38
83G
haffa
rM
ale
Sai
duS
aidu
32.
23
20
2.5
2.73
2.25
6.15
84M
uham
mad
Waz
irM
ale
Sai
duS
aidu
32.
43
20
2.5
2.80
2.25
6.30
85S
eem
aFe
mal
eS
aidu
Sai
du3
2.4
32
02.
52.
802.
256.
3086
Noo
r Wah
idM
ale
Sai
duS
aidu
32.
23
20
2.5
2.73
2.25
6.15
87U
mar
Wah
idM
ale
Sai
dusa
idu
32.
33
20
2.5
2.77
2.25
6.23
88S
hah
Bak
ht R
awan
Mal
eS
aidu
Sai
du3
2.3
22
02.
52.
432.
255.
4889
Muh
amm
ad R
awan
Mal
eS
aidu
Sai
du3
2.1
32
02.
52.
702.
256.
0890
Ibra
him
Kha
nM
ale
Sai
duS
aidu
32.
43
20
2.5
2.80
2.25
6.30
91A
nwar
zeb
Mal
eS
aidu
Sai
du3
2.3
32
02.
52.
772.
256.
2392
She
rinay
bib
iFe
mal
eS
aidu
Sai
du3
2.8
32
02.
52.
932.
256.
6093
Jan
sila
Fem
ale
Sai
duS
aidu
32.
62.
52
02.
52.
702.
256.
0894
Ibra
him
Mal
eS
aidu
Sai
du3
2.5
32
02.
52.
832.
256.
3895
Mia
n S
aid
Gha
far
Mal
eS
aidu
Sai
du3
2.5
32
02.
52.
832.
256.
3896
Faza
l Dad
Mal
eS
aidu
Sai
du3
2.5
2.5
20
2.5
2.67
2.25
6.00
97A
mir
Mah
moo
dM
ale
Sai
duS
aidu
32.
52.
52
02.
52.
672.
256.
0098
Sar
zam
in K
han
Mal
eS
aidu
Sai
du3
2.6
32
02.
52.
872.
256.
4599
Ism
ail
Mal
eS
aidu
Sai
du3
2.6
32
02.
52.
872.
256.
4510
0B
akht
Sul
tana
Fem
ale
Sai
duS
aidu
32.
62.
52
02.
52.
702.
256.
0810
120
09S
aidu
Sai
du3
2.2
2.5
20
2.5
2.57
2.25
5.78
102
Sai
f ul M
alik
Mal
eS
aidu
Sai
du3
2.4
2.5
20
2.5
2.63
2.25
5.93
103
Zaho
orM
ale
Sai
duS
aidu
32.
52.
52
02.
52.
672.
256.
0010
4M
omin
Kha
nM
ale
Sai
duS
aidu
32.
52.
52
02.
52.
672.
256.
0010
5S
aif u
l Mal
ook
Mal
eS
aidu
Sai
du3
2.6
32
02.
52.
872.
256.
4510
6B
akht
Zam
anM
ale
Sai
duS
aidu
32.
83
20
2.5
2.93
2.25
6.60
107
Afta
b A
hmad
Mal
eS
aidu
Sai
du3
2.6
2.5
20
2.5
2.70
2.25
6.08
108
Bak
ht R
ehm
anM
ale
Sai
duS
aidu
32.
53
20
2.5
2.83
2.25
6.38
109
Nae
em A
khta
rM
ale
Sai
duS
aidu
32.
43
20
2.5
2.80
2.25
6.30
Annexes
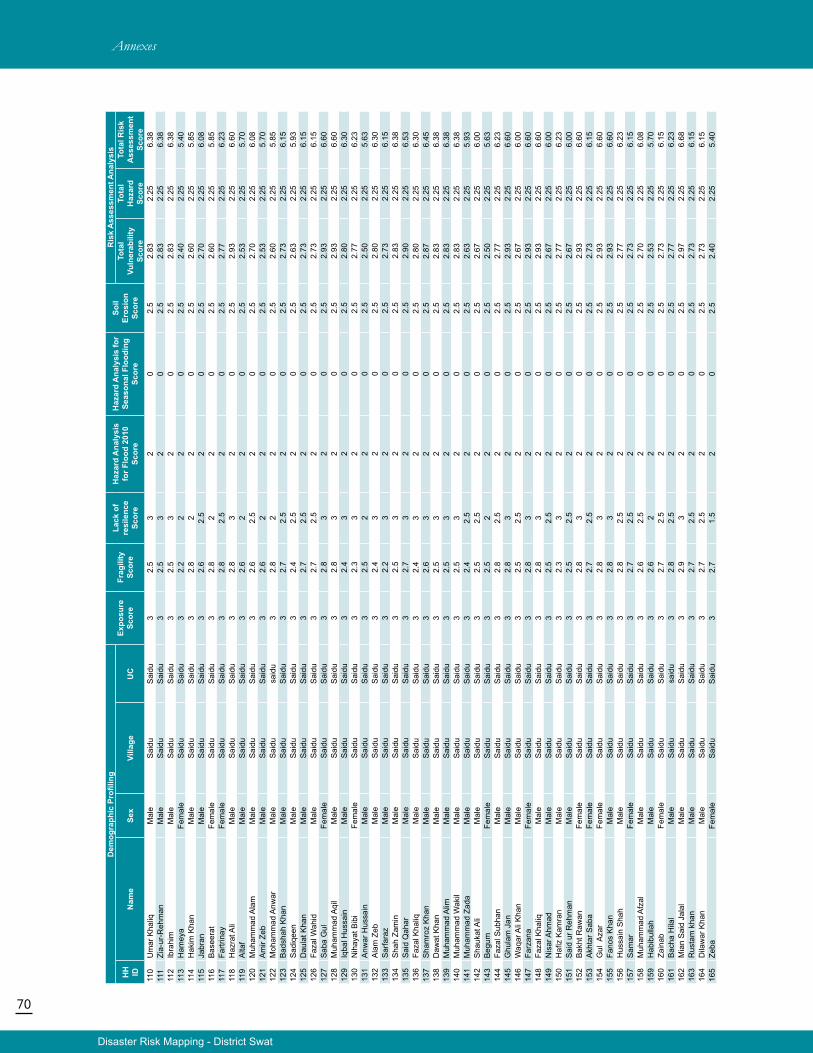
70
Disaster Risk Mapping - District Swat
Annexes
Dem
ogra
phic
Pro
filin
gEx
posu
re
Scor
eFr
agili
ty
Scor
e
Lack
of
resi
lenc
e Sc
ore
Haz
ard
Ana
lysi
s fo
r Flo
od 2
010
Scor
e
Haz
ard
Ana
lysi
s fo
r Se
ason
al F
lood
ing
Scor
e
Soil
Eros
ion
Scor
e
Ris
k A
sses
smen
t Ana
lysi
s
HH
ID
Nam
eSe
xVi
llage
UC
Tota
l Vu
lner
abili
ty
Scor
e
Tota
l H
azar
d Sc
ore
Tota
l Ris
k A
sses
smen
t Sc
ore
110
Um
ar K
haliq
Mal
eS
aidu
Sai
du3
2.5
32
02.
52.
832.
256.
3811
1Zi
a-ur
-Reh
man
Mal
eS
aidu
Sai
du3
2.5
32
02.
52.
832.
256.
3811
2Ib
rahi
mM
ale
Sai
duS
aidu
32.
53
20
2.5
2.83
2.25
6.38
113
Ham
eya
Fem
ale
Sai
duS
aidu
32.
22
20
2.5
2.40
2.25
5.40
114
Hak
im K
han
Mal
eS
aidu
Sai
du3
2.8
22
02.
52.
602.
255.
8511
5Ja
bran
Mal
eS
aidu
Sai
du3
2.6
2.5
20
2.5
2.70
2.25
6.08
116
Bas
eera
tFe
mal
eS
aidu
Sai
du3
2.8
22
02.
52.
602.
255.
8511
7Fa
rtrin
ayFe
mal
eS
aidu
Sai
du3
2.8
2.5
20
2.5
2.77
2.25
6.23
118
Haz
rat A
liM
ale
Sai
duS
aidu
32.
83
20
2.5
2.93
2.25
6.60
119
Alta
fM
ale
Sai
duS
aidu
32.
62
20
2.5
2.53
2.25
5.70
120
Muh
amm
ad A
lam
Mal
eS
aidu
Sai
du3
2.6
2.5
20
2.5
2.70
2.25
6.08
121
Am
ir Ze
bM
ale
Sai
duS
aidu
32.
62
20
2.5
2.53
2.25
5.70
122
Moh
amm
ad A
nwar
Mal
eS
aidu
said
u3
2.8
22
02.
52.
602.
255.
8512
3B
adsh
ah K
han
Mal
eS
aidu
Sai
du3
2.7
2.5
20
2.5
2.73
2.25
6.15
124
Sad
iqee
nM
ale
Sai
duS
aidu
32.
42.
52
02.
52.
632.
255.
9312
5D
aula
t Kha
nM
ale
Sai
duS
aidu
32.
72.
52
02.
52.
732.
256.
1512
6Fa
zal W
ahid
Mal
eS
aidu
Sai
du3
2.7
2.5
20
2.5
2.73
2.25
6.15
127
Sab
a G
ulFe
mal
eS
aidu
Sai
du3
2.8
32
02.
52.
932.
256.
6012
8M
uham
mad
Aqi
lM
ale
Sai
duS
aidu
32.
83
20
2.5
2.93
2.25
6.60
129
Iqba
l Hus
sain
Mal
eS
aidu
Sai
du3
2.4
32
02.
52.
802.
256.
3013
0N
ihay
at B
ibi
Fem
ale
Sai
duS
aidu
32.
33
20
2.5
2.77
2.25
6.23
131
Anw
ar H
ussa
inM
ale
Sai
duS
aidu
32.
52
20
2.5
2.50
2.25
5.63
132
Ala
m Z
ebM
ale
Sai
duS
aidu
32.
43
20
2.5
2.80
2.25
6.30
133
Sar
fara
zM
ale
Sai
duS
aidu
32.
23
20
2.5
2.73
2.25
6.15
134
Sha
h Za
min
Mal
eS
aidu
Sai
du3
2.5
32
02.
52.
832.
256.
3813
5S
aid
Qah
arM
ale
Sai
duS
aidu
32.
73
20
2.5
2.90
2.25
6.53
136
Faza
l Kha
liqM
ale
Sai
duS
aidu
32.
43
20
2.5
2.80
2.25
6.30
137
Sha
mro
z K
han
Mal
eS
aidu
Sai
du3
2.6
32
02.
52.
872.
256.
4513
8D
awat
Kha
nM
ale
Sai
duS
aidu
32.
53
20
2.5
2.83
2.25
6.38
139
Muh
amm
ad A
limM
ale
Sai
duS
aidu
32.
53
20
2.5
2.83
2.25
6.38
140
Muh
amm
ad W
akil
Mal
eS
aidu
Sai
du3
2.5
32
02.
52.
832.
256.
3814
1M
uham
mad
Zad
aM
ale
Sai
duS
aidu
32.
42.
52
02.
52.
632.
255.
9314
2S
hauk
at A
liM
ale
Sai
duS
aidu
32.
52.
52
02.
52.
672.
256.
0014
3B
egum
Fem
ale
Sai
duS
aidu
32.
52
20
2.5
2.50
2.25
5.63
144
Faza
l Sub
han
Mal
eS
aidu
Sai
du3
2.8
2.5
20
2.5
2.77
2.25
6.23
145
Ghu
lam
Jan
Mal
eS
aidu
Sai
du3
2.8
32
02.
52.
932.
256.
6014
6W
aqar
Ali
Kha
nM
ale
Sai
duS
aidu
32.
52.
52
02.
52.
672.
256.
0014
7Fa
rzan
aFe
mal
eS
aidu
Sai
du3
2.8
32
02.
52.
932.
256.
6014
8Fa
zal K
haliq
Mal
eS
aidu
Sai
du3
2.8
32
02.
52.
932.
256.
6014
9N
isar
Ahm
adM
ale
Sai
duS
aidu
32.
52.
52
02.
52.
672.
256.
0015
0H
afiz
Kam
ran
Mal
eS
aidu
Sai
du3
2.3
32
02.
52.
772.
256.
2315
1S
aid
ur R
ehm
anM
ale
Sai
duS
aidu
32.
52.
52
02.
52.
672.
256.
0015
2B
akht
Raw
anFe
mal
eS
aidu
Sai
du3
2.8
32
02.
52.
932.
256.
6015
3A
khta
r Sab
aFe
mal
eS
aidu
Sai
du3
2.7
2.5
20
2.5
2.73
2.25
6.15
154
Gul
Aza
rFe
mal
eS
aidu
Sai
du3
2.8
32
02.
52.
932.
256.
6015
5Fa
nos
Kha
nM
ale
Sai
duS
aidu
32.
83
20
2.5
2.93
2.25
6.60
156
Hus
sain
Sha
hM
ale
Sai
duS
aidu
32.
82.
52
02.
52.
772.
256.
2315
7S
amar
Fem
ale
Sai
duS
aidu
32.
72.
52
02.
52.
732.
256.
1515
8M
uham
mad
Afz
alM
ale
Sai
duS
aidu
32.
62.
52
02.
52.
702.
256.
0815
9H
abib
ulla
hM
ale
Sai
duS
aidu
32.
62
20
2.5
2.53
2.25
5.70
160
Zain
abFe
mal
eS
aidu
Sai
du3
2.7
2.5
20
2.5
2.73
2.25
6.15
161
Bac
ha H
ilal
Mal
eS
aidu
said
u3
2.8
2.5
20
2.5
2.77
2.25
6.23
162
Mia
n S
aid
Jala
lM
ale
Sai
duS
aidu
32.
93
20
2.5
2.97
2.25
6.68
163
Rus
tam
kha
nM
ale
Sai
duS
aidu
32.
72.
52
02.
52.
732.
256.
1516
4D
ilaw
ar K
han
Mal
eS
aidu
Sai
du3
2.7
2.5
20
2.5
2.73
2.25
6.15
165
Zeba
Fem
ale
Sai
duS
aidu
32.
71.
52
02.
52.
402.
255.
40

71
Disaster Risk Mapping - District Swat
Annexes
Dem
ogra
phic
Pro
filin
gEx
posu
re
Scor
eFr
agili
ty
Scor
e
Lack
of
resi
lenc
e Sc
ore
Haz
ard
Ana
lysi
s fo
r Flo
od 2
010
Scor
e
Haz
ard
Ana
lysi
s fo
r Se
ason
al F
lood
ing
Scor
e
Soil
Eros
ion
Scor
e
Ris
k A
sses
smen
t Ana
lysi
s
HH
ID
Nam
eSe
xVi
llage
UC
Tota
l Vu
lner
abili
ty
Scor
e
Tota
l H
azar
d Sc
ore
Tota
l Ris
k A
sses
smen
t Sc
ore
166
Faza
l Hus
sain
Mal
eS
aidu
Sai
du3
2.8
2.5
20
2.5
2.77
2.25
6.23
167
Ghu
fran
Mal
eS
aidu
Sai
du3
2.7
2.5
20
2.5
2.73
2.25
6.15
168
Muh
amm
ad Iq
bal
Mal
eS
aidu
Sai
du3
2.7
22
02.
52.
572.
255.
7816
9M
uham
mad
Am
inM
ale
Sai
duS
aidu
32.
72.
52
02.
52.
732.
256.
1517
0H
amee
d H
ussa
inM
ale
Sai
duS
aidu
32.
72.
52
02.
52.
732.
256.
1517
1U
mar
a K
han
Fem
ale
Sai
duS
aidu
32.
62
20
2.5
2.53
2.25
5.70
172
Bak
ht R
aja
Mal
eS
aidu
Sai
du3
2.4
32
02.
52.
802.
256.
3017
3D
unya
Am
inM
ale
Sai
duS
aidu
32.
33
20
2.5
2.77
2.25
6.23
174
Akb
ar A
liM
ale
Sai
duS
aidu
32.
41.
52
02.
52.
302.
255.
1817
5R
ehm
an A
liM
ale
Sai
duS
aidu
32.
41.
52
02.
52.
302.
255.
1817
6Fa
zal R
ahim
Mal
eS
aidu
Sai
du3
2.7
1.5
20
2.5
2.40
2.25
5.40
177
Nia
z M
inm
Kha
nM
ale
Sai
duS
aidu
32.
82
20
2.5
2.60
2.25
5.85
178
Am
jad
Hus
sain
Mal
eS
aidu
Sai
du3
2.5
2.5
20
2.5
2.67
2.25
6.00
179
Dun
ya Z
ada
Fem
ale
Sai
duS
aidu
32.
72
20
2.5
2.57
2.25
5.78
180
Khu
rshe
ed Iq
bal
Mal
eS
aidu
Sai
du3
2.7
22
02.
52.
572.
255.
7818
1Ih
sanu
llah
Mal
eS
aidu
Sai
du3
2.8
12
02.
52.
272.
255.
1018
2Ta
hir H
ussa
inM
ale
Sai
duS
aidu
32.
42.
52
02.
52.
632.
255.
9318
3Fa
zal
Khi
tab
Mal
eS
aidu
Sai
du3
2.6
1.5
20
2.5
2.37
2.25
5.33
184
Irsha
d R
ehm
anM
ale
Sai
duS
aidu
32.
42.
52
02.
52.
632.
255.
9318
5A
khta
r Ali
Mal
eS
aidu
Sai
du3
2.4
22
02.
52.
472.
255.
5518
6M
uham
mad
Imra
nM
ale
Sai
duS
aidu
22.
33
20
2.5
2.43
2.25
5.48
187
Jaha
n S
her
Mal
eS
aidu
Sai
du2
2.2
32
02.
52.
402.
255.
4018
8A
khta
r Ali
Mal
eS
aidu
Sai
du3
2.4
32
02.
52.
802.
256.
3018
9P
arve
ena
Fem
ale
Sai
duS
aidu
32.
43
20
2.5
2.80
2.25
6.30
190
Waz
ir Za
daM
ale
Sai
duS
aidu
32.
53
20
2.5
2.83
2.25
6.38
191
Sam
i ulla
hM
ale
Sai
duS
aidu
32.
63
20
2.5
2.87
2.25
6.45
192
Pir
Muh
amm
ad K
han
Mal
eS
aidu
Sai
du2
2.3
32
02.
52.
432.
255.
4819
3N
uzuh
it Ja
bin
Fem
ale
Sai
duS
aidu
32.
32
20
2.5
2.43
2.25
5.48
194
Sar
dar H
ussa
inM
ale
Sai
duS
aidu
32.
22.
52
02.
52.
572.
255.
7819
5A
qal M
and
Mal
eS
aidu
Sai
du3
2.2
2.5
20
2.5
2.57
2.25
5.78
196
Am
jad
Mal
eS
aidu
Sai
du3
2.4
1.5
20
2.5
2.30
2.25
5.18
197
Dos
t Muh
amm
ad K
han
Mal
eS
aidu
Sai
du2
2.5
32
02.
52.
502.
255.
6319
8S
habn
am B
ibi
Fem
ale
Sai
duS
aidu
32.
12.
52
02.
52.
532.
255.
7019
9B
akht
Nas
eeba
Fem
ale
Sai
duS
aidu
32.
22.
52
02.
52.
572.
255.
7820
0K
han
She
rM
ale
Sai
duS
aidu
32.
43
20
2.5
2.80
2.25
6.30
201
Nas
rinFe
mal
eS
aidu
Sai
du3
2.2
32
02.
52.
732.
256.
1520
2B
akht
Nas
eeba
Fem
ale
Sai
duS
aidu
22.
33
20
2.5
2.43
2.25
5.48
203
Gul
She
rinFe
mal
eS
aidu
Sai
du3
2.6
32
02.
52.
872.
256.
4520
4Ta
liman
dM
ale
Sai
duS
aidu
32.
82.
52
02.
52.
772.
256.
2320
5A
mir
Bad
shah
Mal
eS
aidu
Sai
du3
2.5
2.5
20
2.5
2.67
2.25
6.00
206
Ban
oFe
mal
eS
aidu
Sai
du3
2.8
22
02.
52.
602.
255.
8520
7R
ashe
ed K
han
Mal
eS
aidu
Sai
du3
2.8
2.5
20
2.5
2.77
2.25
6.23
208
Muh
amm
ad N
awaz
kha
nM
ale
Sai
duS
aidu
32.
72.
52
02.
52.
732.
256.
1520
9G
ul R
ehm
anM
ale
Sai
duS
aidu
32.
72
20
2.5
2.57
2.25
5.78
210
Muh
amm
ad Ik
ram
Mal
eS
aidu
Sai
du3
2.8
2.5
20
2.5
2.77
2.25
6.23
211
Rah
im T
ajM
ale
Sai
duS
aidu
32.
82
20
2.5
2.60
2.25
5.85
212
Kha
n S
her
Mal
eS
aidu
Sai
du3
2.5
32
02.
52.
832.
256.
3821
3M
uham
mad
Am
inM
ale
Sai
dusa
idu
32
2.5
20
2.5
2.50
2.25
5.63
214
Akb
ar H
ussa
inM
ale
Sai
duS
aidu
32
22
02.
52.
332.
255.
2521
5B
adsh
ah K
han
Mal
eS
aidu
Sai
du3
2.3
32
02.
52.
772.
256.
2321
6S
houk
at Iq
bal
Mal
eS
aidu
Sai
du3
2.3
2.5
20
2.5
2.60
2.25
5.85
217
Bak
ht S
arda
raFe
mal
eS
aidu
Sai
du3
2.2
22
02.
52.
402.
255.
4021
8B
ahra
m S
hah
Mal
eS
aidu
Sai
du3
2.3
2.5
20
2.5
2.60
2.25
5.85
219
Mar
yam
Bib
iFe
mal
eS
aidu
Sai
du3
2.5
1.5
20
2.5
2.33
2.25
5.25
220
Raf
aat B
ibi
Fem
ale
Sai
duS
aidu
32.
62
20
2.5
2.53
2.25
5.70
221
Ham
ish
Gul
Mal
eS
aidu
Sai
du3
2.5
32
02.
52.
832.
256.
38
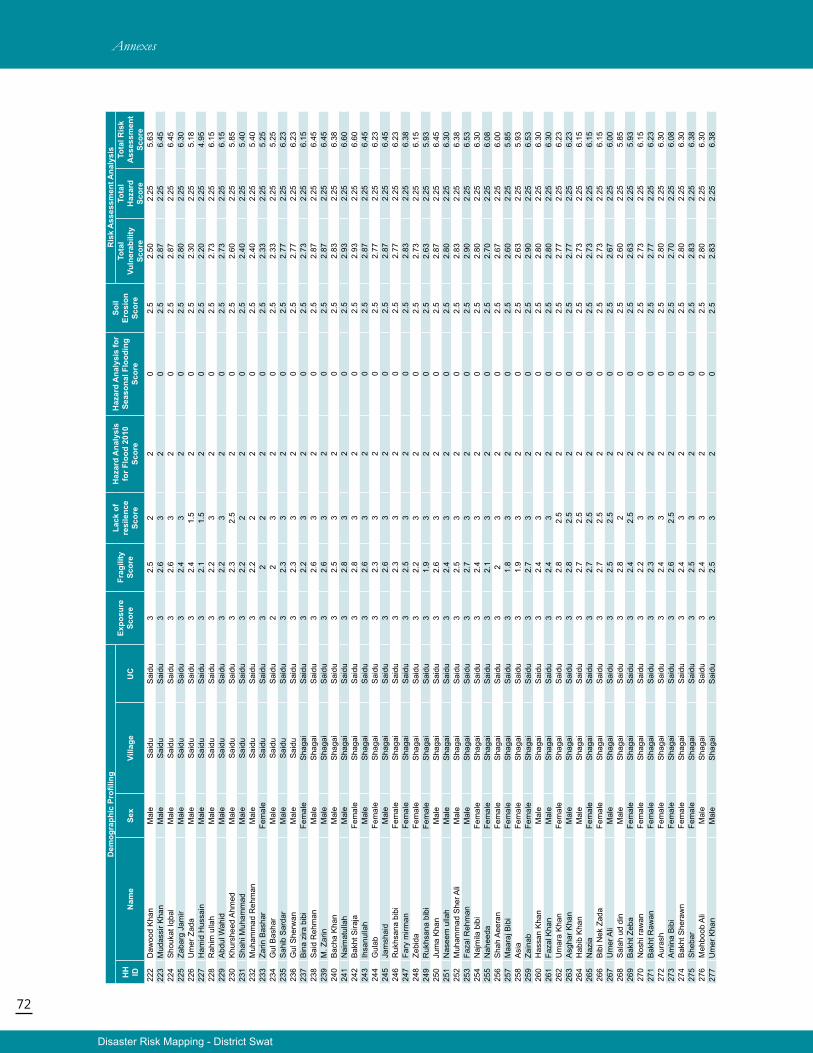
72
Disaster Risk Mapping - District Swat
Annexes
Dem
ogra
phic
Pro
filin
gEx
posu
re
Scor
eFr
agili
ty
Scor
e
Lack
of
resi
lenc
e Sc
ore
Haz
ard
Ana
lysi
s fo
r Flo
od 2
010
Scor
e
Haz
ard
Ana
lysi
s fo
r Se
ason
al F
lood
ing
Scor
e
Soil
Eros
ion
Scor
e
Ris
k A
sses
smen
t Ana
lysi
s
HH
ID
Nam
eSe
xVi
llage
UC
Tota
l Vu
lner
abili
ty
Scor
e
Tota
l H
azar
d Sc
ore
Tota
l Ris
k A
sses
smen
t Sc
ore
222
Daw
ood
Kha
nM
ale
Sai
duS
aidu
32.
52
20
2.5
2.50
2.25
5.63
223
Mud
assi
r Kha
nM
ale
Sai
duS
aidu
32.
63
20
2.5
2.87
2.25
6.45
224
Sho
ukat
Iqba
lM
ale
Sai
duS
aidu
32.
63
20
2.5
2.87
2.25
6.45
225
Zaba
rg J
amir
Mal
eS
aidu
Sai
du3
2.4
32
02.
52.
802.
256.
3022
6U
mer
Zad
aM
ale
Sai
duS
aidu
32.
41.
52
02.
52.
302.
255.
1822
7H
amid
Hus
sain
Mal
eS
aidu
Sai
du3
2.1
1.5
20
2.5
2.20
2.25
4.95
228
Rah
im u
llah
Mal
eS
aidu
Sai
du3
2.2
32
02.
52.
732.
256.
1522
9A
bdul
Wah
idM
ale
Sai
duS
aidu
32.
23
20
2.5
2.73
2.25
6.15
230
Khu
rshe
ed A
hmed
Mal
eS
aidu
Sai
du3
2.3
2.5
20
2.5
2.60
2.25
5.85
231
Sha
hi M
uham
mad
Mal
eS
aidu
Sai
du3
2.2
22
02.
52.
402.
255.
4023
2M
uham
mad
Reh
man
Mal
eS
aidu
Sai
du3
2.2
22
02.
52.
402.
255.
4023
3Za
rin B
asha
rFe
mal
eS
aidu
Sai
du3
22
20
2.5
2.33
2.25
5.25
234
Gul
Bas
har
Mal
eS
aidu
Sai
du2
23
20
2.5
2.33
2.25
5.25
235
Sah
ib S
arda
rM
ale
Sai
duS
aidu
32.
33
20
2.5
2.77
2.25
6.23
236
Gul
She
rwan
Mal
eS
aidu
Sai
du3
2.3
32
02.
52.
772.
256.
2323
7B
ina
zira
bib
iFe
mal
eS
haga
iS
aidu
32.
23
20
2.5
2.73
2.25
6.15
238
Sai
d R
ehm
anM
ale
Sha
gai
Sai
du3
2.6
32
02.
52.
872.
256.
4523
9M
. Zar
inM
ale
Sha
gai
Sai
du3
2.6
32
02.
52.
872.
256.
4524
0B
acha
Kha
nM
ale
Sha
gai
Sai
du3
2.5
32
02.
52.
832.
256.
3824
1N
aim
atul
lah
Mal
eS
haga
iS
aidu
32.
83
20
2.5
2.93
2.25
6.60
242
Bak
ht S
iraja
Fe
mal
eS
haga
iS
aidu
32.
83
20
2.5
2.93
2.25
6.60
243
Ihsa
nulla
hM
ale
Sha
gai
Sai
du3
2.6
32
02.
52.
872.
256.
4524
4G
ulab
Fem
ale
Sha
gai
Sai
du3
2.3
32
02.
52.
772.
256.
2324
5Ja
msh
aid
Mal
eS
haga
iS
aidu
32.
63
20
2.5
2.87
2.25
6.45
246
Ruk
hsan
a bi
biFe
mal
eS
haga
iS
aidu
32.
33
20
2.5
2.77
2.25
6.23
247
Fary
mirm
anFe
mal
eS
haga
iS
aidu
32.
53
20
2.5
2.83
2.25
6.38
248
Zebi
daFe
mal
eS
haga
iS
aidu
32.
23
20
2.5
2.73
2.25
6.15
249
Ruk
hsan
a bi
biFe
mal
eS
haga
iS
aidu
31.
93
20
2.5
2.63
2.25
5.93
250
Jum
a K
han
Mal
eS
haga
iS
aidu
32.
63
20
2.5
2.87
2.25
6.45
251
Nas
eem
ulla
hM
ale
Sha
gai
Sai
du3
2.4
32
02.
52.
802.
256.
3025
2M
uham
mad
She
r Ali
Mal
eS
haga
iS
aidu
32.
53
20
2.5
2.83
2.25
6.38
253
Faza
l Reh
man
Mal
eS
haga
iS
aidu
32.
73
20
2.5
2.90
2.25
6.53
254
Naj
mila
bib
iFe
mal
eS
haga
iS
aidu
32.
43
20
2.5
2.80
2.25
6.30
255
Nah
eeda
Fem
ale
Sha
gai
Sai
du3
2.1
32
02.
52.
702.
256.
0825
6S
hah
Aee
ran
Fem
ale
Sha
gai
Sai
du3
23
20
2.5
2.67
2.25
6.00
257
Maa
raj B
ibi
Fem
ale
Sha
gai
Sai
du3
1.8
32
02.
52.
602.
255.
8525
8A
sia
Fem
ale
Sha
gai
Sai
du3
1.9
32
02.
52.
632.
255.
9325
9Za
inab
Fem
ale
Sha
gai
Sai
du3
2.7
32
02.
52.
902.
256.
5326
0H
assa
n K
han
Mal
eS
haga
iS
aidu
32.
43
20
2.5
2.80
2.25
6.30
261
Faza
l Kha
nM
ale
Sha
gai
Sai
du3
2.4
32
02.
52.
802.
256.
3026
2U
mar
a K
han
Fem
ale
Sha
gai
Sai
du3
2.8
2.5
20
2.5
2.77
2.25
6.23
263
Asg
har K
han
Mal
eS
haga
iS
aidu
32.
82.
52
02.
52.
772.
256.
2326
4H
abib
Kha
nM
ale
Sha
gai
Sai
du3
2.7
2.5
20
2.5
2.73
2.25
6.15
265
Naz
iaFe
mal
eS
haga
iS
aidu
32.
72.
52
02.
52.
732.
256.
1526
6B
ibi N
ek Z
ada
Fem
ale
Sha
gai
Sai
du3
2.7
2.5
20
2.5
2.73
2.25
6.15
267
Um
er A
liM
ale
Sha
gai
Sai
du3
2.5
2.5
20
2.5
2.67
2.25
6.00
268
Sal
ah u
d di
nM
ale
Sha
gai
Sai
du3
2.8
22
02.
52.
602.
255.
8526
9B
akht
Zeb
aFe
mal
eS
haga
iS
aidu
32.
42.
52
02.
52.
632.
255.
9327
0N
oshi
raw
anFe
mal
eS
haga
iS
aidu
32.
23
20
2.5
2.73
2.25
6.15
271
Bak
ht R
awan
Fem
ale
Sha
gai
Sai
du3
2.3
32
02.
52.
772.
256.
2327
2A
uras
hFe
mal
eS
haga
iS
aidu
32.
43
20
2.5
2.80
2.25
6.30
273
Am
ina
Bib
iFe
mal
eS
haga
iS
aidu
32.
62.
52
02.
52.
702.
256.
0827
4B
akht
She
raw
nFe
mal
eS
haga
iS
aidu
32.
43
20
2.5
2.80
2.25
6.30
275
She
bar
Fem
ale
Sha
gai
Sai
du3
2.5
32
02.
52.
832.
256.
3827
6M
ehbo
ob A
liM
ale
Sha
gai
Sai
du3
2.4
32
02.
52.
802.
256.
3027
7U
mer
Kha
nM
ale
Sha
gai
Sai
du3
2.5
32
02.
52.
832.
256.
38
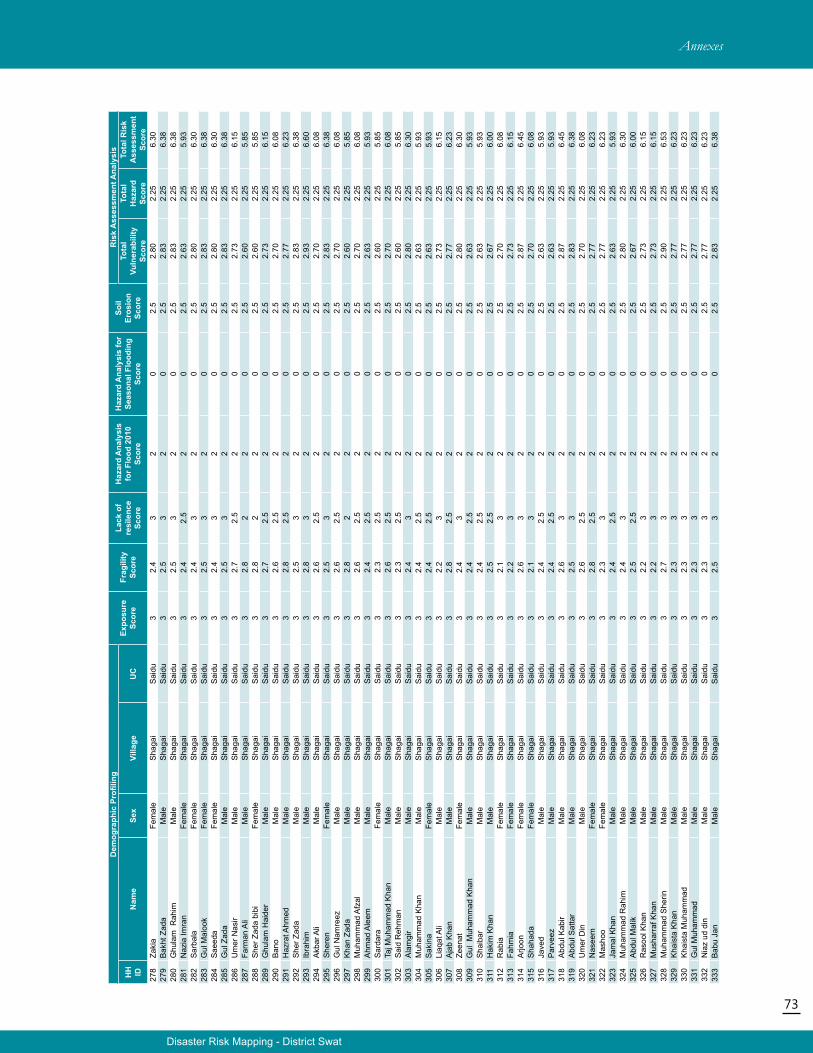
73
Disaster Risk Mapping - District Swat
Annexes
Dem
ogra
phic
Pro
filin
gEx
posu
re
Scor
eFr
agili
ty
Scor
e
Lack
of
resi
lenc
e Sc
ore
Haz
ard
Ana
lysi
s fo
r Flo
od 2
010
Scor
e
Haz
ard
Ana
lysi
s fo
r Se
ason
al F
lood
ing
Scor
e
Soil
Eros
ion
Scor
e
Ris
k A
sses
smen
t Ana
lysi
s
HH
ID
Nam
eSe
xVi
llage
UC
Tota
l Vu
lner
abili
ty
Scor
e
Tota
l H
azar
d Sc
ore
Tota
l Ris
k A
sses
smen
t Sc
ore
278
Zaki
a Fe
mal
eS
haga
iS
aidu
32.
43
20
2.5
2.80
2.25
6.30
279
Bak
ht Z
ada
Mal
eS
haga
iS
aidu
32.
53
20
2.5
2.83
2.25
6.38
280
Ghu
lam
Rah
imM
ale
Sha
gai
Sai
du3
2.5
32
02.
52.
832.
256.
3828
1N
azia
Imra
nFe
mal
eS
haga
iS
aidu
32.
42.
52
02.
52.
632.
255.
9328
2S
arba
laFe
mal
eS
haga
iS
aidu
32.
43
20
2.5
2.80
2.25
6.30
283
Gul
Mal
ook
Fem
ale
Sha
gai
Sai
du3
2.5
32
02.
52.
832.
256.
3828
4S
aeed
aFe
mal
eS
haga
iS
aidu
32.
43
20
2.5
2.80
2.25
6.30
285
Gul
Zad
aM
ale
Sha
gai
Sai
du3
2.5
32
02.
52.
832.
256.
3828
6U
mer
Nas
irM
ale
Sha
gai
Sai
du3
2.7
2.5
20
2.5
2.73
2.25
6.15
287
Farm
an A
liM
ale
Sha
gai
Sai
du3
2.8
22
02.
52.
602.
255.
8528
8S
her Z
ada
bibi
Fem
ale
Sha
gai
Sai
du3
2.8
22
02.
52.
602.
255.
8528
9G
hula
m H
aide
rM
ale
Sha
gai
Sai
du3
2.7
2.5
20
2.5
2.73
2.25
6.15
290
Ban
oM
ale
Sha
gai
Sai
du3
2.6
2.5
20
2.5
2.70
2.25
6.08
291
Haz
rat A
hmed
Mal
eS
haga
iS
aidu
32.
82.
52
02.
52.
772.
256.
2329
2S
her Z
ada
Mal
eS
haga
iS
aidu
32.
53
20
2.5
2.83
2.25
6.38
293
Ibra
him
Mal
eS
haga
iS
aidu
32.
83
20
2.5
2.93
2.25
6.60
294
Akb
ar A
liM
ale
Sha
gai
Sai
du3
2.6
2.5
20
2.5
2.70
2.25
6.08
295
She
ren
Fem
ale
Sha
gai
Sai
du3
2.5
32
02.
52.
832.
256.
3829
6G
ul N
amre
ezM
ale
Sha
gai
Sai
du3
2.6
2.5
20
2.5
2.70
2.25
6.08
297
Kha
n Za
daM
ale
Sha
gai
Sai
du3
2.8
22
02.
52.
602.
255.
8529
8M
uham
mad
Afz
alM
ale
Sha
gai
Sai
du3
2.6
2.5
20
2.5
2.70
2.25
6.08
299
Ahm
ad A
leem
Mal
eS
haga
iS
aidu
32.
42.
52
02.
52.
632.
255.
9330
0S
arda
raFe
mal
eS
haga
iS
aidu
32.
32.
52
02.
52.
602.
255.
8530
1Ta
j Muh
amm
ad K
han
Mal
eS
haga
iS
aidu
32.
62.
52
02.
52.
702.
256.
0830
2S
aid
Reh
man
Mal
eS
haga
iS
aidu
32.
32.
52
02.
52.
602.
255.
8530
3A
lam
gir
Mal
eS
haga
iS
aidu
32.
43
20
2.5
2.80
2.25
6.30
304
Muh
amm
ad K
han
Mal
eS
haga
iS
aidu
32.
42.
52
02.
52.
632.
255.
9330
5S
akin
aFe
mal
eS
haga
iS
aidu
32.
42.
52
02.
52.
632.
255.
9330
6Li
aqat
Ali
Mal
eS
haga
iS
aidu
32.
23
20
2.5
2.73
2.25
6.15
307
Aja
b K
han
Mal
eS
haga
iS
aidu
32.
82.
52
02.
52.
772.
256.
2330
8Ze
enat
Fem
ale
Sha
gai
Sai
du3
2.4
32
02.
52.
802.
256.
3030
9G
ul M
uham
mad
Kha
nM
ale
Sha
gai
Sai
du3
2.4
2.5
20
2.5
2.63
2.25
5.93
310
Sha
ibar
Mal
eS
haga
iS
aidu
32.
42.
52
02.
52.
632.
255.
9331
1H
akim
Kha
nM
ale
Sha
gai
Sai
du3
2.5
2.5
20
2.5
2.67
2.25
6.00
312
Rab
iaFe
mal
eS
haga
iS
aidu
32.
13
20
2.5
2.70
2.25
6.08
313
Fahm
iaFe
mal
eS
haga
iS
aidu
32.
23
20
2.5
2.73
2.25
6.15
314
Arjo
onFe
mal
eS
haga
iS
aidu
32.
63
20
2.5
2.87
2.25
6.45
315
Sha
hada
Fem
ale
Sha
gai
Sai
du3
2.1
32
02.
52.
702.
256.
0831
6Ja
ved
Mal
eS
haga
iS
aidu
32.
42.
52
02.
52.
632.
255.
9331
7P
arve
ezM
ale
Sha
gai
Sai
du3
2.4
2.5
20
2.5
2.63
2.25
5.93
318
Abd
ul K
abir
Mal
eS
haga
iS
aidu
32.
63
20
2.5
2.87
2.25
6.45
319
Abd
ul S
atta
rM
ale
Sha
gai
Sai
du3
2.5
32
02.
52.
832.
256.
3832
0U
mer
Din
Mal
eS
haga
iS
aidu
32.
62.
52
02.
52.
702.
256.
0832
1N
asee
mFe
mal
eS
haga
iS
aidu
32.
82.
52
02.
52.
772.
256.
2332
2M
asho
oFe
mal
eS
haga
iS
aidu
32.
33
20
2.5
2.77
2.25
6.23
323
Jam
al K
han
Mal
eS
haga
iS
aidu
32.
42.
52
02.
52.
632.
255.
9332
4M
uham
mad
Rah
imM
ale
Sha
gai
Sai
du3
2.4
32
02.
52.
802.
256.
3032
5A
bdul
Mal
ikM
ale
Sha
gai
Sai
du3
2.5
2.5
20
2.5
2.67
2.25
6.00
326
Ras
ool K
han
Mal
eS
haga
iS
aidu
32.
23
20
2.5
2.73
2.25
6.15
327
Mus
harr
af K
han
Mal
eS
haga
iS
aidu
32.
23
20
2.5
2.73
2.25
6.15
328
Muh
amm
ad S
herin
Mal
eS
haga
iS
aidu
32.
73
20
2.5
2.90
2.25
6.53
329
Kha
ista
Kha
nM
ale
Sha
gai
Sai
du3
2.3
32
02.
52.
772.
256.
2333
0K
hais
ta M
uham
mad
Mal
eS
haga
iS
aidu
32.
33
20
2.5
2.77
2.25
6.23
331
Gul
Muh
amm
adM
ale
Sha
gai
Sai
du3
2.3
32
02.
52.
772.
256.
2333
2N
iaz
ud d
inM
ale
Sha
gai
Sai
du3
2.3
32
02.
52.
772.
256.
2333
3B
abu
Jan
Mal
eS
haga
iS
aidu
32.
53
20
2.5
2.83
2.25
6.38
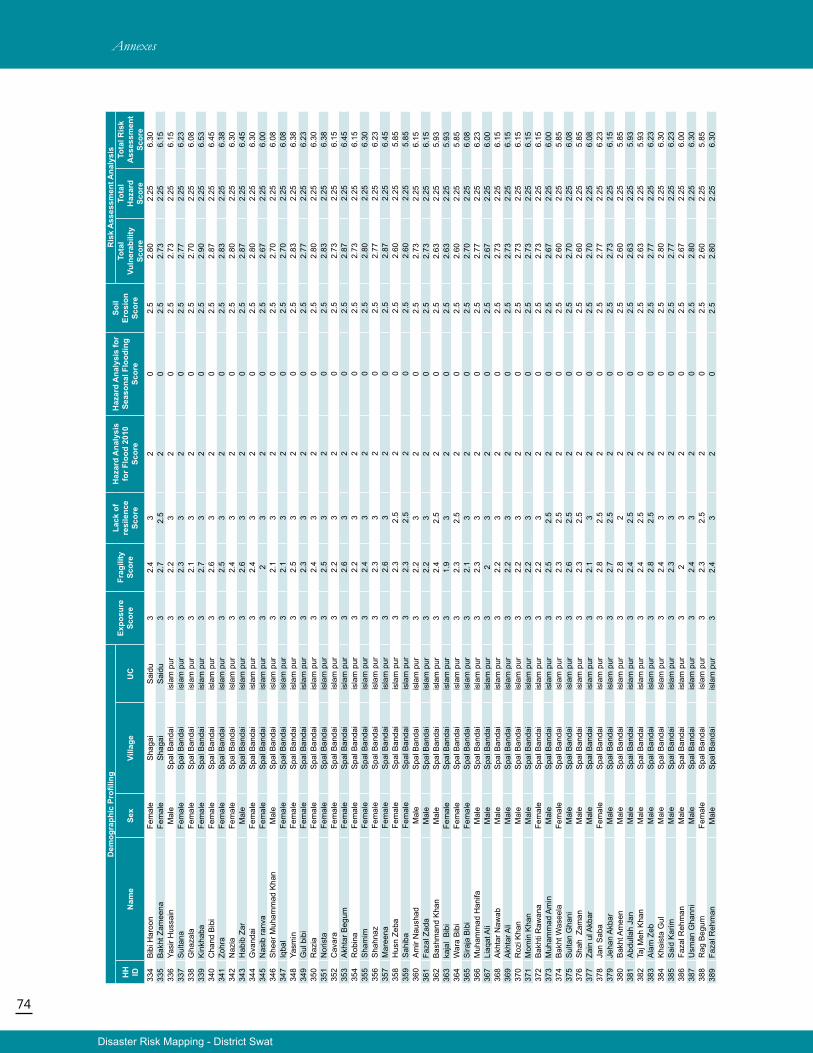
74
Disaster Risk Mapping - District Swat
Annexes
Dem
ogra
phic
Pro
filin
gEx
posu
re
Scor
eFr
agili
ty
Scor
e
Lack
of
resi
lenc
e Sc
ore
Haz
ard
Ana
lysi
s fo
r Flo
od 2
010
Scor
e
Haz
ard
Ana
lysi
s fo
r Se
ason
al F
lood
ing
Scor
e
Soil
Eros
ion
Scor
e
Ris
k A
sses
smen
t Ana
lysi
s
HH
ID
Nam
eSe
xVi
llage
UC
Tota
l Vu
lner
abili
ty
Scor
e
Tota
l H
azar
d Sc
ore
Tota
l Ris
k A
sses
smen
t Sc
ore
334
Bib
i Har
oon
Fem
ale
Sha
gai
Sai
du3
2.4
32
02.
52.
802.
256.
3033
5B
akht
Zam
eena
Fem
ale
Sha
gai
Sai
du3
2.7
2.5
20
2.5
2.73
2.25
6.15
336
Yasi
r Hus
sain
Mal
eS
pal B
anda
iis
lam
pur
32.
23
20
2.5
2.73
2.25
6.15
337
Sul
tana
Fem
ale
Spa
l Ban
dai
isla
m p
ur3
2.3
32
02.
52.
772.
256.
2333
8G
haza
laFe
mal
eS
pal B
anda
iis
lam
pur
32.
13
20
2.5
2.70
2.25
6.08
339
Kin
khab
aFe
mal
eS
pal B
anda
iis
lam
pur
32.
73
20
2.5
2.90
2.25
6.53
340
Cha
nd B
ibi
Fem
ale
Spa
l Ban
dai
isla
m p
ur3
2.6
32
02.
52.
872.
256.
4534
1Zo
hra
Fem
ale
Spa
l Ban
dai
isla
m p
ur3
2.5
32
02.
52.
832.
256.
3834
2N
azia
Fem
ale
Spa
l Ban
dai
isla
m p
ur3
2.4
32
02.
52.
802.
256.
3034
3H
abib
Zar
Mal
eS
pal B
anda
iis
lam
pur
32.
63
20
2.5
2.87
2.25
6.45
344
Gva
ndai
Fem
ale
Spa
l Ban
dai
isla
m p
ur3
2.4
32
02.
52.
802.
256.
3034
5N
asib
ranv
aFe
mal
eS
pal B
anda
iis
lam
pur
32
32
02.
52.
672.
256.
0034
6S
heer
Muh
amm
ad K
han
Mal
eS
pal B
anda
iis
lam
pur
32.
13
20
2.5
2.70
2.25
6.08
347
Iqba
lFe
mal
eS
pal B
anda
iis
lam
pur
32.
13
20
2.5
2.70
2.25
6.08
348
Yasm
inFe
mal
eS
pal B
anda
iis
lam
pur
32.
53
20
2.5
2.83
2.25
6.38
349
Gul
bib
iFe
mal
eS
pal B
anda
iis
lam
pur
32.
33
20
2.5
2.77
2.25
6.23
350
Raz
iaFe
mal
eS
pal B
anda
iis
lam
pur
32.
43
20
2.5
2.80
2.25
6.30
351
Nor
ista
Fem
ale
Spa
l Ban
dai
isla
m p
ur3
2.5
32
02.
52.
832.
256.
3835
2C
avar
aFe
mal
eS
pal B
anda
iis
lam
pur
32.
23
20
2.5
2.73
2.25
6.15
353
Akh
tar B
egum
Fem
ale
Spa
l Ban
dai
isla
m p
ur3
2.6
32
02.
52.
872.
256.
4535
4R
obin
aFe
mal
eS
pal B
anda
iis
lam
pur
32.
23
20
2.5
2.73
2.25
6.15
355
Sha
mim
Fem
ale
Spa
l Ban
dai
isla
m p
ur3
2.4
32
02.
52.
802.
256.
3035
6S
hahn
azFe
mal
eS
pal B
anda
iis
lam
pur
32.
33
20
2.5
2.77
2.25
6.23
357
Mar
eena
Fem
ale
Spa
l Ban
dai
isla
m p
ur3
2.6
32
02.
52.
872.
256.
4535
8H
usn
Zeba
Fem
ale
Spa
l Ban
dai
isla
m p
ur3
2.3
2.5
20
2.5
2.60
2.25
5.85
359
Sah
iba
Fem
ale
Spa
l Ban
dai
isla
m p
ur3
2.3
2.5
20
2.5
2.60
2.25
5.85
360
Am
ir N
aush
adM
ale
Spa
l Ban
dai
isla
m p
ur3
2.2
32
02.
52.
732.
256.
1536
1Fa
zal Z
ada
Mal
eS
pal B
anda
iis
lam
pur
32.
23
20
2.5
2.73
2.25
6.15
362
Bas
hman
d K
han
Mal
eS
pal B
anda
iis
lam
pur
32.
42.
52
02.
52.
632.
255.
9336
3ka
jal
Bib
iFe
mal
eS
pal B
anda
iis
lam
pur
31.
93
20
2.5
2.63
2.25
5.93
364
War
a B
ibi
Fem
ale
Spa
l Ban
dai
isla
m p
ur3
2.3
2.5
20
2.5
2.60
2.25
5.85
365
Sira
ja B
ibi
Fem
ale
Spa
l Ban
dai
isla
m p
ur3
2.1
32
02.
52.
702.
256.
0836
6M
uham
mad
Han
ifaM
ale
Spa
l Ban
dai
isla
m p
ur3
2.3
32
02.
52.
772.
256.
2336
7Li
aqat
Ali
Mal
eS
pal B
anda
iis
lam
pur
32
32
02.
52.
672.
256.
0036
8A
khta
r Naw
abM
ale
Spa
l Ban
dai
isla
m p
ur3
2.2
32
02.
52.
732.
256.
1536
9A
khta
r Ali
Mal
eS
pal B
anda
iis
lam
pur
32.
23
20
2.5
2.73
2.25
6.15
370
Roz
i Kha
nM
ale
Spa
l Ban
dai
isla
m p
ur3
2.2
32
02.
52.
732.
256.
1537
1M
omin
Kha
nM
ale
Spa
l Ban
dai
isla
m p
ur3
2.2
32
02.
52.
732.
256.
1537
2B
akht
i Raw
ana
Fem
ale
Spa
l Ban
dai
isla
m p
ur3
2.2
32
02.
52.
732.
256.
1537
3M
uham
mad
Am
inM
ale
Spa
l Ban
dai
isla
m p
ur3
2.5
2.5
20
2.5
2.67
2.25
6.00
374
Bak
ht W
asee
laFe
mal
eS
pal B
anda
iis
lam
pur
32.
32.
52
02.
52.
602.
255.
8537
5S
ulta
n G
hani
Mal
eS
pal B
anda
iis
lam
pur
32.
62.
52
02.
52.
702.
256.
0837
6S
hah
Zam
anM
ale
Spa
l Ban
dai
isla
m p
ur3
2.3
2.5
20
2.5
2.60
2.25
5.85
377
Zain
ul A
kbar
Mal
eS
pal B
anda
iis
lam
pur
32.
13
20
2.5
2.70
2.25
6.08
378
Jan
Sab
aFe
mal
eS
pal B
anda
iis
lam
pur
32.
82.
52
02.
52.
772.
256.
2337
9Je
han
Akb
arM
ale
Spa
l Ban
dai
isla
m p
ur3
2.7
2.5
20
2.5
2.73
2.25
6.15
380
Bak
ht A
mee
nM
ale
Spa
l Ban
dai
isla
m p
ur3
2.8
22
02.
52.
602.
255.
8538
1A
bdul
lah
Jan
Mal
eS
pal B
anda
iis
lam
pur
32.
42.
52
02.
52.
632.
255.
9338
2Ta
j Meh
Kha
nM
ale
Spa
l Ban
dai
isla
m p
ur3
2.4
2.5
20
2.5
2.63
2.25
5.93
383
Ala
m Z
ebM
ale
Spa
l Ban
dai
isla
m p
ur3
2.8
2.5
20
2.5
2.77
2.25
6.23
384
Kha
ista
Gul
Mal
eS
pal B
anda
iis
lam
pur
32.
43
20
2.5
2.80
2.25
6.30
385
Sai
d K
arim
Mal
eS
pal B
anda
iis
lam
pur
32.
33
20
2.5
2.77
2.25
6.23
386
Faza
l Reh
man
Mal
eS
pal B
anda
iis
lam
pur
32
32
02.
52.
672.
256.
0038
7U
sman
Gha
nni
Mal
eS
pal B
anda
iis
lam
pur
32.
43
20
2.5
2.80
2.25
6.30
388
Rag
Beg
umFe
mal
eS
pal B
anda
iis
lam
pur
32.
32.
52
02.
52.
602.
255.
8538
9Fa
zal R
ehm
anM
ale
Spa
l Ban
dai
isla
m p
ur3
2.4
32
02.
52.
802.
256.
30
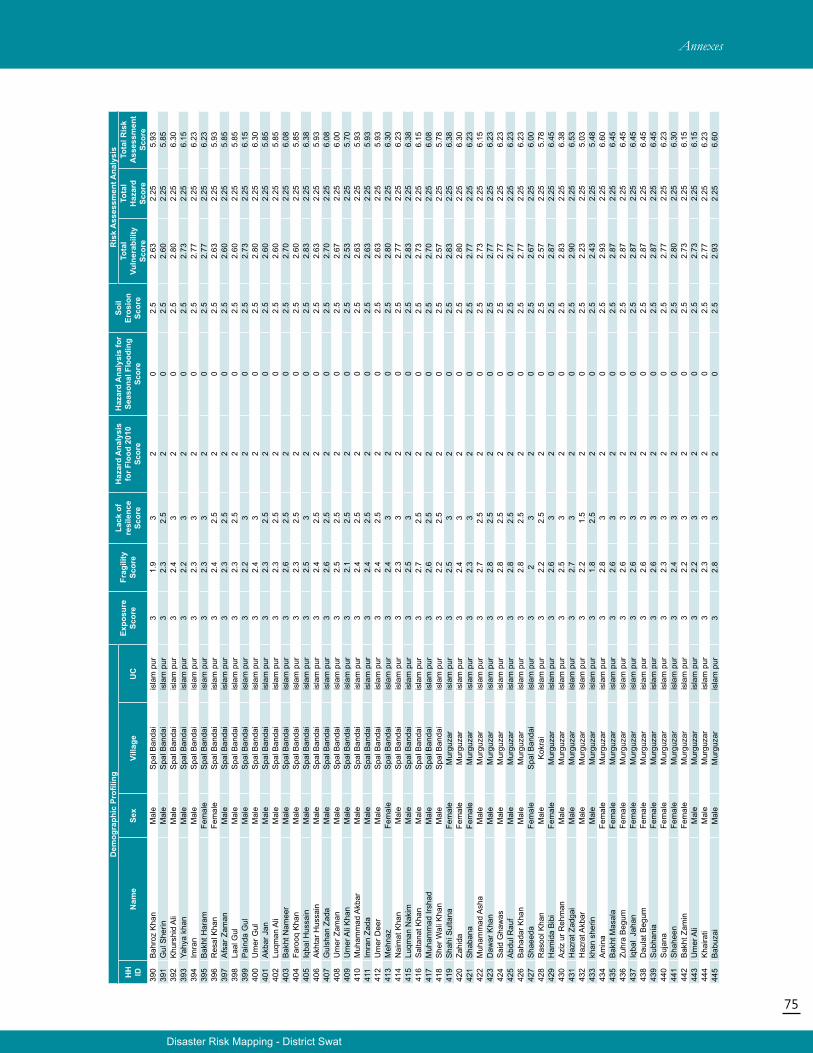
75
Disaster Risk Mapping - District Swat
Annexes
Dem
ogra
phic
Pro
filin
gEx
posu
re
Scor
eFr
agili
ty
Scor
e
Lack
of
resi
lenc
e Sc
ore
Haz
ard
Ana
lysi
s fo
r Flo
od 2
010
Scor
e
Haz
ard
Ana
lysi
s fo
r Se
ason
al F
lood
ing
Scor
e
Soil
Eros
ion
Scor
e
Ris
k A
sses
smen
t Ana
lysi
s
HH
ID
Nam
eSe
xVi
llage
UC
Tota
l Vu
lner
abili
ty
Scor
e
Tota
l H
azar
d Sc
ore
Tota
l Ris
k A
sses
smen
t Sc
ore
390
Bah
roz
Kha
nM
ale
Spa
l Ban
dai
isla
m p
ur3
1.9
32
02.
52.
632.
255.
9339
1G
ul S
herin
Mal
eS
pal B
anda
iis
lam
pur
32.
32.
52
02.
52.
602.
255.
8539
2K
hurs
hid
Ali
Mal
eS
pal B
anda
iis
lam
pur
32.
43
20
2.5
2.80
2.25
6.30
393
Yahy
a kh
anM
ale
Spa
l Ban
dai
isla
m p
ur3
2.2
32
02.
52.
732.
256.
1539
4Im
ran
Mal
eS
pal B
anda
iis
lam
pur
32.
33
20
2.5
2.77
2.25
6.23
395
Bak
ht H
aram
Fem
ale
Spa
l Ban
dai
isla
m p
ur3
2.3
32
02.
52.
772.
256.
2339
6R
esal
Kha
nFe
mal
eS
pal B
anda
iis
lam
pur
32.
42.
52
02.
52.
632.
255.
9339
7A
fsar
Zam
anM
ale
Spa
l Ban
dai
isla
m p
ur3
2.3
2.5
20
2.5
2.60
2.25
5.85
398
Laal
Gul
Mal
eS
pal B
anda
iis
lam
pur
32.
32.
52
02.
52.
602.
255.
8539
9P
aind
a G
ulM
ale
Spa
l Ban
dai
isla
m p
ur3
2.2
32
02.
52.
732.
256.
1540
0U
mer
Gul
Mal
eS
pal B
anda
iis
lam
pur
32.
43
20
2.5
2.80
2.25
6.30
401
Akb
ar J
anM
ale
Spa
l Ban
dai
isla
m p
ur3
2.3
2.5
20
2.5
2.60
2.25
5.85
402
Luqm
an A
liM
ale
Spa
l Ban
dai
isla
m p
ur3
2.3
2.5
20
2.5
2.60
2.25
5.85
403
Bak
ht N
amee
rM
ale
Spa
l Ban
dai
isla
m p
ur3
2.6
2.5
20
2.5
2.70
2.25
6.08
404
Faro
oq K
han
Mal
eS
pal B
anda
iis
lam
pur
32.
32.
52
02.
52.
602.
255.
8540
5Iq
bal H
ussa
inM
ale
Spa
l Ban
dai
isla
m p
ur3
2.5
32
02.
52.
832.
256.
3840
6A
khta
r Hus
sain
Mal
eS
pal B
anda
iis
lam
pur
32.
42.
52
02.
52.
632.
255.
9340
7G
ulsh
an Z
ada
Mal
eS
pal B
anda
iis
lam
pur
32.
62.
52
02.
52.
702.
256.
0840
8U
mer
Zam
anM
ale
Spa
l Ban
dai
isla
m p
ur3
2.5
2.5
20
2.5
2.67
2.25
6.00
409
Um
er A
li K
han
Mal
eS
pal B
anda
iis
lam
pur
32.
12.
52
02.
52.
532.
255.
7041
0M
uham
mad
Akb
arM
ale
Spa
l Ban
dai
isla
m p
ur3
2.4
2.5
20
2.5
2.63
2.25
5.93
411
Imra
n Za
daM
ale
Spa
l Ban
dai
isla
m p
ur3
2.4
2.5
20
2.5
2.63
2.25
5.93
412
Um
er D
eer
Mal
eS
pal B
anda
iis
lam
pur
32.
42.
52
02.
52.
632.
255.
9341
3M
ehna
zFe
mal
eS
pal B
anda
iis
lam
pur
32.
43
20
2.5
2.80
2.25
6.30
414
Nai
mat
Kha
nM
ale
Spa
l Ban
dai
isla
m p
ur3
2.3
32
02.
52.
772.
256.
2341
5Lu
qman
Nak
imM
ale
Spa
l Ban
dai
isla
m p
ur3
2.5
32
02.
52.
832.
256.
3841
6S
alta
nat K
han
Mal
eS
pal B
anda
iis
lam
pur
32.
72.
52
02.
52.
732.
256.
1541
7M
uham
mad
Irsh
adM
ale
Spa
l Ban
dai
isla
m p
ur3
2.6
2.5
20
2.5
2.70
2.25
6.08
418
She
r Wal
i Kha
nM
ale
Spa
l Ban
dai
isla
m p
ur3
2.2
2.5
20
2.5
2.57
2.25
5.78
419
Sha
hi S
ulta
naFe
mal
eM
urgu
zar
isla
m p
ur3
2.5
32
02.
52.
832.
256.
3842
0Za
hida
Fem
ale
Mur
guza
ris
lam
pur
32.
43
20
2.5
2.80
2.25
6.30
421
Sha
bana
Fem
ale
Mur
guza
ris
lam
pur
32.
33
20
2.5
2.77
2.25
6.23
422
Muh
amm
ad A
sha
Mal
eM
urgu
zar
isla
m p
ur3
2.7
2.5
20
2.5
2.73
2.25
6.15
423
Daw
ar K
han
Mal
eM
urgu
zar
isla
m p
ur3
2.8
2.5
20
2.5
2.77
2.25
6.23
424
Sai
d G
haw
asM
ale
Mur
guza
ris
lam
pur
32.
82.
52
02.
52.
772.
256.
2342
5A
bdul
Rau
fM
ale
Mur
guza
ris
lam
pur
32.
82.
52
02.
52.
772.
256.
2342
6B
ahad
ar K
han
Mal
eM
urgu
zar
isla
m p
ur3
2.8
2.5
20
2.5
2.77
2.25
6.23
427
Sha
eeda
Fem
ale
Spa
l Ban
dai
isla
m p
ur3
23
20
2.5
2.67
2.25
6.00
428
Ras
ool K
han
Mal
eK
okra
iis
lam
pur
32.
22.
52
02.
52.
572.
255.
7842
9H
amid
a B
ibi
Fem
ale
Mur
guza
ris
lam
pur
32.
63
20
2.5
2.87
2.25
6.45
430
Azi
z ur
Reh
man
Mal
eM
urgu
zar
isla
m p
ur3
2.5
32
02.
52.
832.
256.
3843
1H
azra
t Zad
gai
Mal
eM
urgu
zar
isla
m p
ur3
2.7
32
02.
52.
902.
256.
5343
2H
azra
t Akb
arM
ale
Mur
guza
ris
lam
pur
32.
21.
52
02.
52.
232.
255.
0343
3kh
an s
herin
Mal
eM
urgu
zar
isla
m p
ur3
1.8
2.5
20
2.5
2.43
2.25
5.48
434
Am
ina
Fem
ale
Mur
guza
ris
lam
pur
32.
83
20
2.5
2.93
2.25
6.60
435
Bak
ht M
asal
aFe
mal
eM
urgu
zar
isla
m p
ur3
2.6
32
02.
52.
872.
256.
4543
6Zu
hra
Beg
umFe
mal
eM
urgu
zar
isla
m p
ur3
2.6
32
02.
52.
872.
256.
4543
7Iq
bal
Jaha
nFe
mal
eM
urgu
zar
isla
m p
ur3
2.6
32
02.
52.
872.
256.
4543
8D
aula
t Beg
umFe
mal
eM
urgu
zar
isla
m p
ur3
2.6
32
02.
52.
872.
256.
4543
9S
ubha
nia
Fem
ale
Mur
guza
ris
lam
pur
32.
63
20
2.5
2.87
2.25
6.45
440
Suj
ana
Fem
ale
Mur
guza
ris
lam
pur
32.
33
20
2.5
2.77
2.25
6.23
441
Sha
heen
Fem
ale
Mur
guza
ris
lam
pur
32.
43
20
2.5
2.80
2.25
6.30
442
Bak
ht Z
amin
Fem
ale
Mur
guza
ris
lam
pur
32.
23
20
2.5
2.73
2.25
6.15
443
Um
er A
liM
ale
Mur
guza
ris
lam
pur
32.
23
20
2.5
2.73
2.25
6.15
444
Kha
irati
Mal
eM
urgu
zar
isla
m p
ur3
2.3
32
02.
52.
772.
256.
2344
5B
abuz
aiM
ale
Mur
guza
ris
lam
pur
32.
83
20
2.5
2.93
2.25
6.60
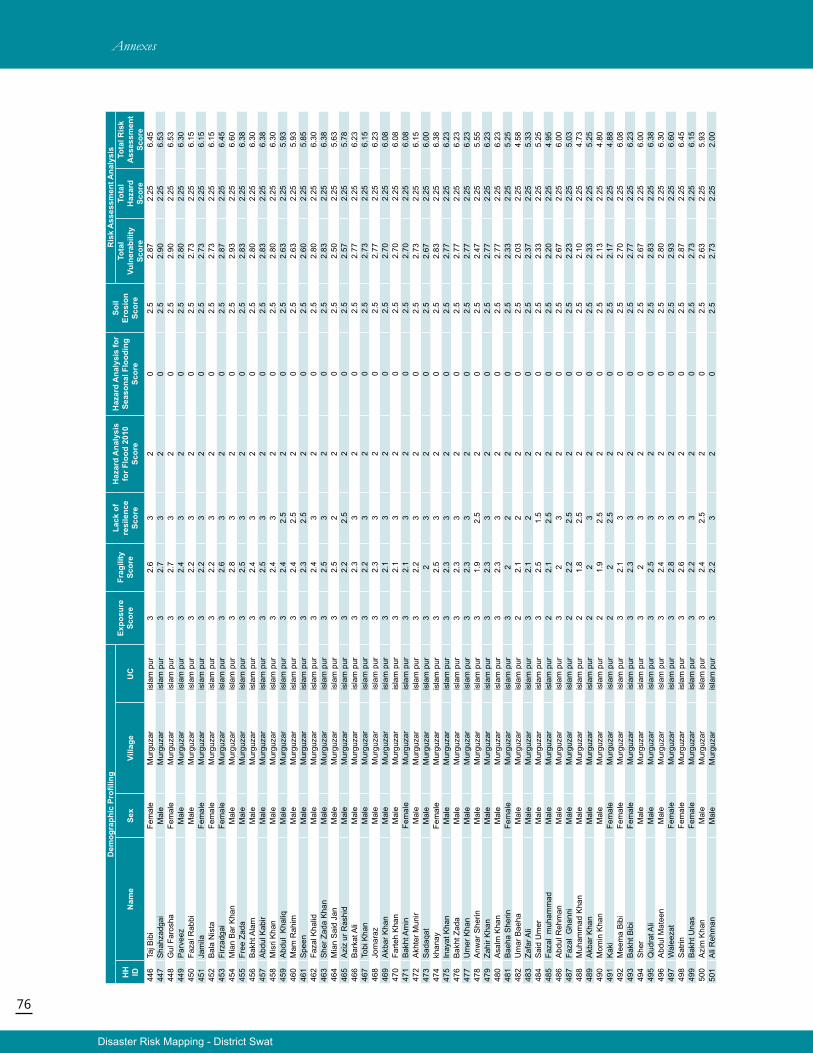
76
Disaster Risk Mapping - District Swat
Annexes
Dem
ogra
phic
Pro
filin
gEx
posu
re
Scor
eFr
agili
ty
Scor
e
Lack
of
resi
lenc
e Sc
ore
Haz
ard
Ana
lysi
s fo
r Flo
od 2
010
Scor
e
Haz
ard
Ana
lysi
s fo
r Se
ason
al F
lood
ing
Scor
e
Soil
Eros
ion
Scor
e
Ris
k A
sses
smen
t Ana
lysi
s
HH
ID
Nam
eSe
xVi
llage
UC
Tota
l Vu
lner
abili
ty
Scor
e
Tota
l H
azar
d Sc
ore
Tota
l Ris
k A
sses
smen
t Sc
ore
446
Taj B
ibi
Fem
ale
Mur
guza
ris
lam
pur
32.
63
20
2.5
2.87
2.25
6.45
447
Sha
hzad
gai
Mal
eM
urgu
zar
isla
m p
ur3
2.7
32
02.
52.
902.
256.
5344
8G
ul F
aros
haFe
mal
eM
urgu
zar
isla
m p
ur3
2.7
32
02.
52.
902.
256.
5344
9P
arve
ezM
ale
Mur
guza
ris
lam
pur
32.
43
20
2.5
2.80
2.25
6.30
450
Faza
l Rab
biM
ale
Mur
guza
ris
lam
pur
32.
23
20
2.5
2.73
2.25
6.15
451
Jam
ilaFe
mal
eM
urgu
zar
isla
m p
ur3
2.2
32
02.
52.
732.
256.
1545
2B
ala
Nis
taFe
mal
eM
urgu
zar
isla
m p
ur3
2.2
32
02.
52.
732.
256.
1545
3Fi
rzad
gai
Fem
ale
Mur
guza
ris
lam
pur
32.
63
20
2.5
2.87
2.25
6.45
454
Mia
n B
ar K
han
Mal
eM
urgu
zar
isla
m p
ur3
2.8
32
02.
52.
932.
256.
6045
5Fr
ee Z
ada
Mal
eM
urgu
zar
isla
m p
ur3
2.5
32
02.
52.
832.
256.
3845
6B
akht
Ala
mM
ale
Mur
guza
ris
lam
pur
32.
43
20
2.5
2.80
2.25
6.30
457
Abd
ul K
abir
Mal
eM
urgu
zar
isla
m p
ur3
2.5
32
02.
52.
832.
256.
3845
8M
isri
Kha
nM
ale
Mur
guza
ris
lam
pur
32.
43
20
2.5
2.80
2.25
6.30
459
Abd
ul K
haliq
Mal
eM
urgu
zar
isla
m p
ur3
2.4
2.5
20
2.5
2.63
2.25
5.93
460
Mam
Rah
imM
ale
Mur
guza
ris
lam
pur
32.
42.
52
02.
52.
632.
255.
9346
1S
peen
Mal
eM
urgu
zar
isla
m p
ur3
2.3
2.5
20
2.5
2.60
2.25
5.85
462
Faza
l Kha
lidM
ale
Mur
guza
ris
lam
pur
32.
43
20
2.5
2.80
2.25
6.30
463
She
r Zad
a K
han
Mal
eM
urgu
zar
isla
m p
ur3
2.5
32
02.
52.
832.
256.
3846
4M
ian
Sai
d Ja
nM
ale
Mur
guza
ris
lam
pur
32.
52
20
2.5
2.50
2.25
5.63
465
Azi
z ur
Ras
hid
Mal
eM
urgu
zar
isla
m p
ur3
2.2
2.5
20
2.5
2.57
2.25
5.78
466
Bar
kat A
liM
ale
Mur
guza
ris
lam
pur
32.
33
20
2.5
2.77
2.25
6.23
467
Tobi
Kha
nM
ale
Mur
guza
ris
lam
pur
32.
23
20
2.5
2.73
2.25
6.15
468
Jom
araz
Mal
eM
urgu
zar
isla
m p
ur3
2.3
32
02.
52.
772.
256.
2346
9A
kbar
Kha
nM
ale
Mur
guza
ris
lam
pur
32.
13
20
2.5
2.70
2.25
6.08
470
Farte
h K
han
Mal
eM
urgu
zar
isla
m p
ur3
2.1
32
02.
52.
702.
256.
0847
1B
akht
Am
inFe
mal
eM
urgu
zar
isla
m p
ur3
2.1
32
02.
52.
702.
256.
0847
2A
khte
r Mun
irM
ale
Mur
guza
ris
lam
pur
32.
23
20
2.5
2.73
2.25
6.15
473
Sad
aqat
Mal
eM
urgu
zar
isla
m p
ur3
23
20
2.5
2.67
2.25
6.00
474
khan
ayFe
mal
eM
urgu
zar
isla
m p
ur3
2.5
32
02.
52.
832.
256.
3847
5In
ayat
Kha
nM
ale
Mur
guza
ris
lam
pur
32.
33
20
2.5
2.77
2.25
6.23
476
Bak
ht Z
ada
Mal
eM
urgu
zar
isla
m p
ur3
2.3
32
02.
52.
772.
256.
2347
7U
mer
Kha
nM
ale
Mur
guza
ris
lam
pur
32.
33
20
2.5
2.77
2.25
6.23
478
Anw
ar S
herin
Mal
eM
urgu
zar
isla
m p
ur3
1.9
2.5
20
2.5
2.47
2.25
5.55
479
Zahi
r Kha
nM
ale
Mur
guza
ris
lam
pur
32.
33
20
2.5
2.77
2.25
6.23
480
Asa
lm K
han
Mal
eM
urgu
zar
isla
m p
ur3
2.3
32
02.
52.
772.
256.
2348
1B
aeha
She
rinFe
mal
eM
urgu
zar
isla
m p
ur3
22
20
2.5
2.33
2.25
5.25
482
Um
ar B
aeha
Mal
eM
urgu
zar
isla
m p
ur2
2.1
22
02.
52.
032.
254.
5848
3Za
far A
liM
ale
Mur
guza
ris
lam
pur
32.
12
20
2.5
2.37
2.25
5.33
484
Sai
d U
mer
Mal
eM
urgu
zar
isla
m p
ur3
2.5
1.5
20
2.5
2.33
2.25
5.25
485
Faza
l m
uham
mad
Mal
eM
urgu
zar
isla
m p
ur2
2.1
2.5
20
2.5
2.20
2.25
4.95
486
Abd
ul R
ehm
anM
ale
Mur
guza
ris
lam
pur
32
32
02.
52.
672.
256.
0048
7Fa
zal
Gha
nni
Mal
eM
urgu
zar
isla
m p
ur2
2.2
2.5
20
2.5
2.23
2.25
5.03
488
Muh
amm
ad K
han
Mal
eM
urgu
zar
isla
m p
ur2
1.8
2.5
20
2.5
2.10
2.25
4.73
489
Akb
ar K
han
Mal
eM
urgu
zar
isla
m p
ur2
23
20
2.5
2.33
2.25
5.25
490
Mom
in K
han
Mal
eM
urgu
zar
isla
m p
ur2
1.9
2.5
20
2.5
2.13
2.25
4.80
491
Kak
iFe
mal
eM
urgu
zar
isla
m p
ur2
22.
52
02.
52.
172.
254.
8849
2M
eem
a B
ibi
Fem
ale
Mur
guza
ris
lam
pur
32.
13
20
2.5
2.70
2.25
6.08
493
Bak
ht B
ibi
Fem
ale
Mur
guza
ris
lam
pur
32.
33
20
2.5
2.77
2.25
6.23
494
She
rM
ale
Mur
guza
ris
lam
pur
32
32
02.
52.
672.
256.
0049
5Q
udra
t Ali
Mal
eM
urgu
zar
isla
m p
ur3
2.5
32
02.
52.
832.
256.
3849
6A
bdul
Mat
een
Mal
eM
urgu
zar
isla
m p
ur3
2.4
32
02.
52.
802.
256.
3049
7W
alee
zat
Fem
ale
Mur
guza
ris
lam
pur
32.
83
20
2.5
2.93
2.25
6.60
498
Sat
rinFe
mal
eM
urgu
zar
isla
m p
ur3
2.6
32
02.
52.
872.
256.
4549
9B
akht
Una
sFe
mal
eM
urgu
zar
isla
m p
ur3
2.2
32
02.
52.
732.
256.
1550
0A
zim
Kha
nM
ale
Mur
guza
ris
lam
pur
32.
42.
52
02.
52.
632.
255.
9350
1A
li R
ehm
anM
ale
Mur
guza
ris
lam
pur
32.
23
20
2.5
2.73
2.25
2.00
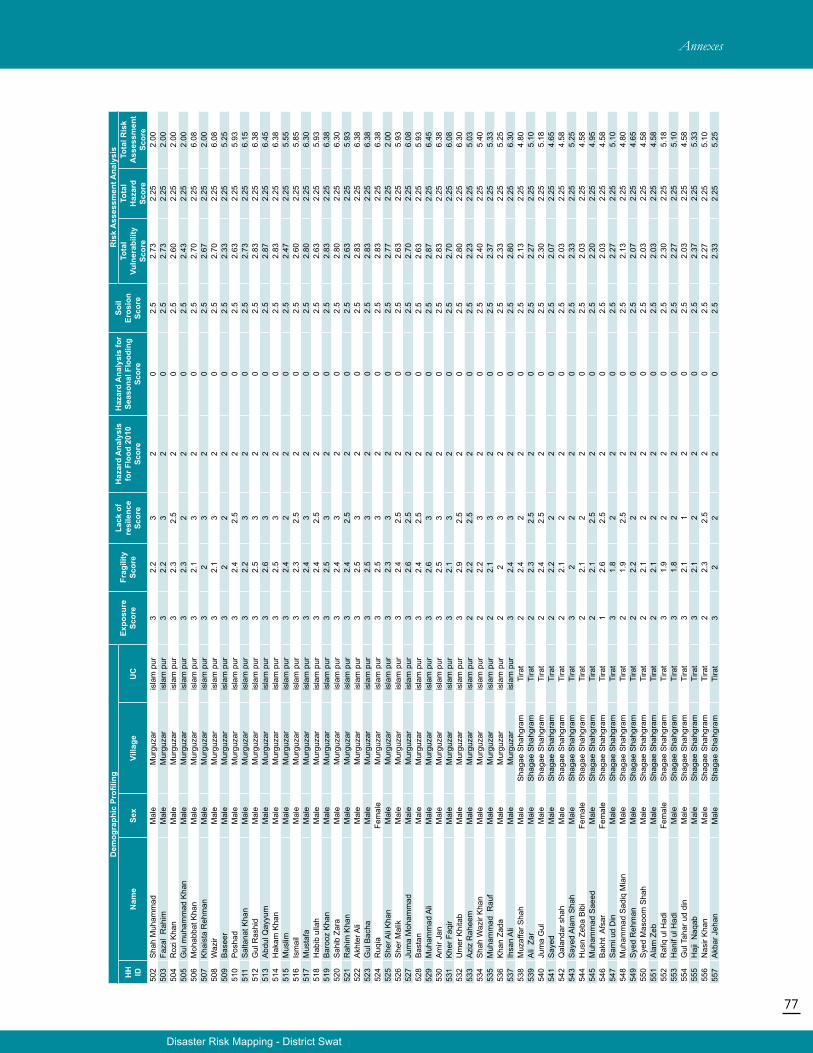
77
Disaster Risk Mapping - District Swat
Annexes
Dem
ogra
phic
Pro
filin
gEx
posu
re
Scor
eFr
agili
ty
Scor
e
Lack
of
resi
lenc
e Sc
ore
Haz
ard
Ana
lysi
s fo
r Flo
od 2
010
Scor
e
Haz
ard
Ana
lysi
s fo
r Se
ason
al F
lood
ing
Scor
e
Soil
Eros
ion
Scor
e
Ris
k A
sses
smen
t Ana
lysi
s
HH
ID
Nam
eSe
xVi
llage
UC
Tota
l Vu
lner
abili
ty
Scor
e
Tota
l H
azar
d Sc
ore
Tota
l Ris
k A
sses
smen
t Sc
ore
502
Sha
h M
uham
mad
Mal
eM
urgu
zar
isla
m p
ur3
2.2
32
02.
52.
732.
252.
0050
3Fa
zal
Rah
imM
ale
Mur
guza
ris
lam
pur
32.
23
20
2.5
2.73
2.25
2.00
504
Roz
i Kha
nM
ale
Mur
guza
ris
lam
pur
32.
32.
52
02.
52.
602.
252.
0050
5G
ul m
uham
mad
Kha
nM
ale
Mur
guza
ris
lam
pur
32.
32
20
2.5
2.43
2.25
2.00
506
Moh
abba
t Kha
nM
ale
Mur
guza
ris
lam
pur
32.
13
20
2.5
2.70
2.25
6.08
507
Kha
ista
Reh
man
Mal
eM
urgu
zar
isla
m p
ur3
23
20
2.5
2.67
2.25
2.00
508
Waz
ir M
ale
Mur
guza
ris
lam
pur
32.
13
20
2.5
2.70
2.25
6.08
509
Bas
eer
Mal
eM
urgu
zar
isla
m p
ur3
22
20
2.5
2.33
2.25
5.25
510
Pos
had
Mal
eM
urgu
zar
isla
m p
ur3
2.4
2.5
20
2.5
2.63
2.25
5.93
511
Sal
tana
t Kha
nM
ale
Mur
guza
ris
lam
pur
32.
23
20
2.5
2.73
2.25
6.15
512
Gul
Ras
hid
Mal
eM
urgu
zar
isla
m p
ur3
2.5
32
02.
52.
832.
256.
3851
3A
bdul
Qay
yum
Mal
eM
urgu
zar
isla
m p
ur3
2.6
32
02.
52.
872.
256.
4551
4H
akam
Kha
nM
ale
Mur
guza
ris
lam
pur
32.
53
20
2.5
2.83
2.25
6.38
515
Mus
limM
ale
Mur
guza
ris
lam
pur
32.
42
20
2.5
2.47
2.25
5.55
516
Ism
ail
Mal
eM
urgu
zar
isla
m p
ur3
2.3
2.5
20
2.5
2.60
2.25
5.85
517
Mus
tafa
Mal
eM
urgu
zar
isla
m p
ur3
2.4
32
02.
52.
802.
256.
3051
8H
abib
ulla
hM
ale
Mur
guza
ris
lam
pur
32.
42.
52
02.
52.
632.
255.
9351
9B
aroo
z K
han
Mal
eM
urgu
zar
isla
m p
ur3
2.5
32
02.
52.
832.
256.
3852
0S
ahib
Zar
aM
ale
Mur
guza
ris
lam
pur
32.
43
20
2.5
2.80
2.25
6.30
521
Rah
im K
han
Mal
eM
urgu
zar
isla
m p
ur3
2.4
2.5
20
2.5
2.63
2.25
5.93
522
Akh
ter A
liM
ale
Mur
guza
ris
lam
pur
32.
53
20
2.5
2.83
2.25
6.38
523
Gul
Bac
haM
ale
Mur
guza
ris
lam
pur
32.
53
20
2.5
2.83
2.25
6.38
524
Ruq
iaFe
mal
eM
urgu
zar
isla
m p
ur3
2.5
32
02.
52.
832.
256.
3852
5S
her A
li K
han
Mal
eM
urgu
zar
isla
m p
ur3
2.3
32
02.
52.
772.
252.
0052
6S
her M
alik
Mal
eM
urgu
zar
isla
m p
ur3
2.4
2.5
20
2.5
2.63
2.25
5.93
527
Jum
a M
oham
mad
Mal
eM
urgu
zar
isla
m p
ur3
2.6
2.5
20
2.5
2.70
2.25
6.08
528
Bas
tan
Mal
eM
urgu
zar
isla
m p
ur3
2.4
2.5
20
2.5
2.63
2.25
5.93
529
Muh
amm
ad A
liM
ale
Mur
guza
ris
lam
pur
32.
63
20
2.5
2.87
2.25
6.45
530
Am
ir Ja
nM
ale
Mur
guza
ris
lam
pur
32.
53
20
2.5
2.83
2.25
6.38
531
Khe
r Faq
irM
ale
Mur
guza
ris
lam
pur
32.
13
20
2.5
2.70
2.25
6.08
532
Um
er K
hita
bM
ale
Mur
guza
ris
lam
pur
32.
92.
52
02.
52.
802.
256.
3053
3A
ziz
Rah
eem
Mal
eM
urgu
zar
isla
m p
ur2
2.2
2.5
20
2.5
2.23
2.25
5.03
534
Sha
h W
azir
Kha
nM
ale
Mur
guza
ris
lam
pur
22.
23
20
2.5
2.40
2.25
5.40
535
Muh
amm
ad R
auf
Mal
eM
urgu
zar
isla
m p
ur2
2.1
32
02.
52.
372.
255.
3353
6K
han
Zada
Mal
eM
urgu
zar
isla
m p
ur2
23
20
2.5
2.33
2.25
5.25
537
Ihsa
n A
liM
ale
Mur
guza
ris
lam
pur
32.
43
20
2.5
2.80
2.25
6.30
538
Muz
affa
r Sha
hM
ale
Sha
gae
Sha
hgra
mTi
rat
22.
42
20
2.5
2.13
2.25
4.80
539
Ali
Zar
Mal
eS
haga
e S
hahg
ram
Tira
t2
2.3
2.5
20
2.5
2.27
2.25
5.10
540
Jum
a G
ulM
ale
Sha
gae
Sha
hgra
mTi
rat
22.
42.
52
02.
52.
302.
255.
1854
1S
ayed
Mal
eS
haga
e S
hahg
ram
Tira
t2
2.2
22
02.
52.
072.
254.
6554
2Q
alan
dar s
hah
Mal
eS
haga
e S
hahg
ram
Tira
t2
2.1
22
02.
52.
032.
254.
5854
3S
ayed
Ala
m S
hah
Mal
eS
haga
e S
hahg
ram
Tira
t3
22
20
2.5
2.33
2.25
5.25
544
Hus
n Ze
ba B
ibi
Fem
ale
Sha
gae
Sha
hgra
mTi
rat
22.
12
20
2.5
2.03
2.25
4.58
545
Muh
amm
ad S
aeed
Mal
eS
haga
e S
hahg
ram
Tira
t2
2.1
2.5
20
2.5
2.20
2.25
4.95
546
Bak
ht A
fsar
Fem
ale
Sha
gae
Sha
hgra
mTi
rat
12.
62.
52
02.
52.
032.
254.
5854
7S
ami u
d D
inM
ale
Sha
gae
Sha
hgra
mTi
rat
31.
82
20
2.5
2.27
2.25
5.10
548
Muh
amm
ad S
adiq
Mia
nM
ale
Sha
gae
Sha
hgra
mTi
rat
21.
92.
52
02.
52.
132.
254.
8054
9S
yed
Reh
man
Mal
eS
haga
e S
hahg
ram
Tira
t2
2.2
22
02.
52.
072.
254.
6555
0S
yed
Mas
oom
Sha
hM
ale
Sha
gae
Sha
hgra
mTi
rat
22.
12
20
2.5
2.03
2.25
4.58
551
Ala
m Z
ebM
ale
Sha
gae
Sha
hgra
mTi
rat
22.
12
20
2.5
2.03
2.25
4.58
552
Rafi
q ul
Had
iFe
mal
eS
haga
e S
hahg
ram
Tira
t3
1.9
22
02.
52.
302.
255.
1855
3H
anif
ul H
adi
Mal
eS
haga
e S
hahg
ram
Tira
t3
1.8
22
02.
52.
272.
255.
1055
4G
ul T
ahar
ud
din
Mal
eS
haga
e S
hahg
ram
Tira
t3
2.1
12
02.
52.
032.
254.
5855
5H
aji
Naq
abM
ale
Sha
gae
Sha
hgra
mTi
rat
32.
12
20
2.5
2.37
2.25
5.33
556
Nas
ir K
han
Mal
eS
haga
e S
hahg
ram
Tira
t2
2.3
2.5
20
2.5
2.27
2.25
5.10
557
Akb
ar J
ehan
Mal
eS
haga
e S
hahg
ram
Tira
t3
22
20
2.5
2.33
2.25
5.25
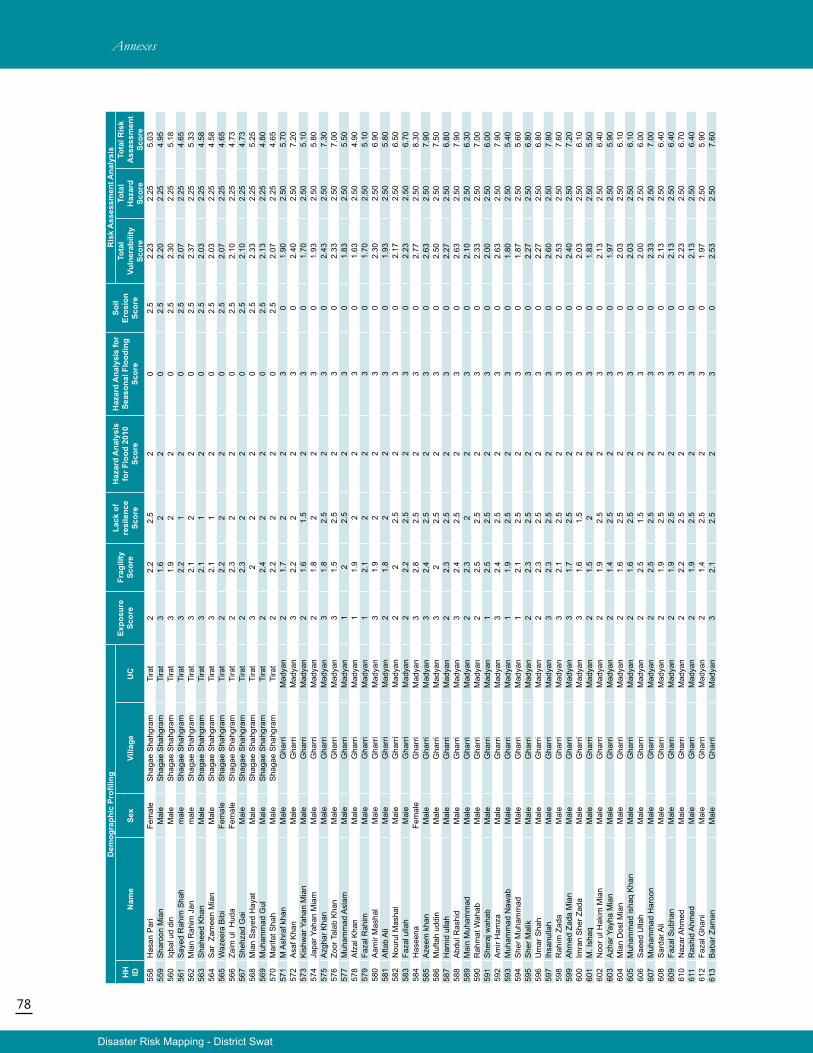
78
Disaster Risk Mapping - District Swat
Annexes
Dem
ogra
phic
Pro
filin
gEx
posu
re
Scor
eFr
agili
ty
Scor
e
Lack
of
resi
lenc
e Sc
ore
Haz
ard
Ana
lysi
s fo
r Flo
od 2
010
Scor
e
Haz
ard
Ana
lysi
s fo
r Se
ason
al F
lood
ing
Scor
e
Soil
Eros
ion
Scor
e
Ris
k A
sses
smen
t Ana
lysi
s
HH
ID
Nam
eSe
xVi
llage
UC
Tota
l Vu
lner
abili
ty
Scor
e
Tota
l H
azar
d Sc
ore
Tota
l Ris
k A
sses
smen
t Sc
ore
558
Has
an P
ari
Fem
ale
Sha
gae
Sha
hgra
mTi
rat
22.
22.
52
02.
52.
232.
255.
0355
9S
haro
on M
ian
Mal
eS
haga
e S
hahg
ram
Tira
t3
1.6
22
02.
52.
202.
254.
9556
0Iq
bal u
d di
nM
ale
Sha
gae
Sha
hgra
mTi
rat
31.
92
20
2.5
2.30
2.25
5.18
561
Say
ed R
ahim
Sha
hm
ale
Sha
gae
Sha
hgra
mTi
rat
32.
21
20
2.5
2.07
2.25
4.65
562
Mia
n R
ahim
Jan
mal
eS
haga
e S
hahg
ram
Tira
t3
2.1
22
02.
52.
372.
255.
3356
3S
hahe
ed K
han
Mal
eS
haga
e S
hahg
ram
Tira
t3
2.1
12
02.
52.
032.
254.
5856
4S
ar Z
amee
n M
ian
Mal
eS
haga
e S
hahg
ram
Tira
t3
2.1
12
02.
52.
032.
254.
5856
5W
azee
ra B
ibi
Fem
ale
Sha
gae
Sha
hgra
mTi
rat
22.
22
20
2.5
2.07
2.25
4.65
566
Zaim
ul
Hud
aFe
mal
eS
haga
e S
hahg
ram
Tira
t2
2.3
22
02.
52.
102.
254.
7356
7S
hehz
ad G
aiM
ale
Sha
gae
Sha
hgra
mTi
rat
22.
32
20
2.5
2.10
2.25
4.73
568
Mia
n S
ayed
Hay
atM
ale
Sha
gae
Sha
hgra
mTi
rat
32
22
02.
52.
332.
255.
2556
9M
uham
mad
Gul
Mal
eS
haga
e S
hahg
ram
Tira
t2
2.4
22
02.
52.
132.
254.
8057
0M
arifa
t Sha
hM
ale
Sha
gae
Sha
hgra
mTi
rat
22.
22
20
2.5
2.07
2.25
4.65
571
M A
shra
f kha
nM
ale
Gha
rri
Mad
yan
21.
72
23
01.
902.
505.
7057
2A
saf K
han
Mal
eG
harr
iM
adya
n3
2.2
22
30
2.40
2.50
7.20
573
Kis
hwar
Yah
an M
ian
Mal
eG
harr
iM
adya
n2
1.6
1.5
23
01.
702.
505.
1057
4Ja
par Y
ahan
Mia
mM
ale
Gha
rri
Mad
yan
21.
82
23
01.
932.
505.
8057
5A
zgha
r Kha
nM
ale
Gha
rri
Mad
yan
31.
82.
52
30
2.43
2.50
7.30
576
Zoor
Tal
ab K
han
Mal
eG
harr
iM
adya
n3
1.5
2.5
23
02.
332.
507.
0057
7M
uham
mad
Asl
amM
ale
Gha
rri
Mad
yan
12
2.5
23
01.
832.
505.
5057
8A
fzal
Kha
nM
ale
Gha
rri
Mad
yan
11.
92
23
01.
632.
504.
9057
9Fa
zal R
ahim
Mal
eG
harr
iM
adya
n1
2.1
22
30
1.70
2.50
5.10
580
Aam
ir M
asha
lM
ale
Gha
rri
Mad
yan
31.
92
23
02.
302.
506.
9058
1A
ftab
Ali
Mal
eG
harr
iM
adya
n2
1.8
22
30
1.93
2.50
5.80
582
Nou
rul M
asha
lM
ale
Gha
rri
Mad
yan
22
2.5
23
02.
172.
506.
5058
3Fa
zal u
llah
Mal
eG
harr
iM
adya
n2
2.2
2.5
23
02.
232.
506.
7058
4H
asee
naFe
mal
eG
harr
iM
adya
n3
2.8
2.5
23
02.
772.
508.
3058
5A
zeem
kha
nM
ale
Gha
rri
Mad
yan
32.
42.
52
30
2.63
2.50
7.90
586
Muf
tah
uddi
n M
ale
Gha
rri
Mad
yan
32
2.5
23
02.
502.
507.
5058
7H
amid
ulla
hM
ale
Gha
rri
Mad
yan
22.
32.
52
30
2.27
2.50
6.80
588
Abd
ul R
ashi
dM
ale
Gha
rri
Mad
yan
32.
42.
52
30
2.63
2.50
7.90
589
Mai
n M
uham
mad
Mal
eG
harr
iM
adya
n2
2.3
22
30
2.10
2.50
6.30
590
Rah
mat
Wah
abM
ale
Gha
rri
Mad
yan
22.
52.
52
30
2.33
2.50
7.00
591
She
raj w
ahab
M
ale
Gha
rri
Mad
yan
12.
52.
52
30
2.00
2.50
6.00
592
Am
ir H
amza
Mal
eG
harr
iM
adya
n3
2.4
2.5
23
02.
632.
507.
9059
3M
uham
mad
Naw
abM
ale
Gha
rri
Mad
yan
11.
92.
52
30
1.80
2.50
5.40
594
She
r Muh
amm
adM
ale
Gha
rri
Mad
yan
12.
12.
52
30
1.87
2.50
5.60
595
She
r Mal
ikM
ale
Gha
rri
Mad
yan
22.
32.
52
30
2.27
2.50
6.80
596
Um
ar S
hah
Mal
eG
harr
iM
adya
n2
2.3
2.5
23
02.
272.
506.
8059
7Ih
sanu
llah
Mal
eG
harr
iM
adya
n3
2.3
2.5
23
02.
602.
507.
8059
8R
ahim
Zad
aM
ale
Gha
rri
Mad
yan
32.
12.
52
30
2.53
2.50
7.60
599
Ahm
ed Z
ada
Mia
nM
ale
Gha
rri
Mad
yan
31.
72.
52
30
2.40
2.50
7.20
600
Imra
n S
her Z
ada
Mal
eG
harr
iM
adya
n3
1.6
1.5
23
02.
032.
506.
1060
1M
. Ish
aqM
ale
Gha
rri
Mad
yan
21.
52
23
01.
832.
505.
5060
2N
oor u
l Hak
im M
ian
Mal
eG
harr
iM
adya
n2
1.9
2.5
23
02.
132.
506.
4060
3A
zhar
Yay
ha M
ian
Mal
eG
harr
iM
adya
n2
1.4
2.5
23
01.
972.
505.
9060
4M
ian
Dos
t Mia
n M
ale
Gha
rri
Mad
yan
21.
62.
52
30
2.03
2.50
6.10
605
Muh
amm
ad is
haq
Kha
nM
ale
Gha
rri
Mad
yan
21.
62.
52
30
2.03
2.50
6.10
606
Sae
ed U
llah
Mal
eG
harr
iM
adya
n2
2.5
1.5
23
02.
002.
506.
0060
7M
uham
mad
Har
oon
Mal
eG
harr
iM
adya
n2
2.5
2.5
23
02.
332.
507.
0060
8S
arda
r Ali
Mal
eG
harr
iM
adya
n2
1.9
2.5
23
02.
132.
506.
4060
9Fa
zal S
ubha
nM
ale
Gha
rri
Mad
yan
21.
92.
52
30
2.13
2.50
6.40
610
Naz
ar A
hmed
Mal
eG
harr
iM
adya
n2
2.2
2.5
23
02.
232.
506.
7061
1R
ashi
d A
hmed
Mal
eG
harr
iM
adya
n2
1.9
2.5
23
02.
132.
506.
4061
2Fa
zal G
hani
M
ale
Gha
rri
Mad
yan
21.
42.
52
30
1.97
2.50
5.90
613
Bab
ar Z
aman
Mal
eG
harr
iM
adya
n3
2.1
2.5
23
02.
532.
507.
60
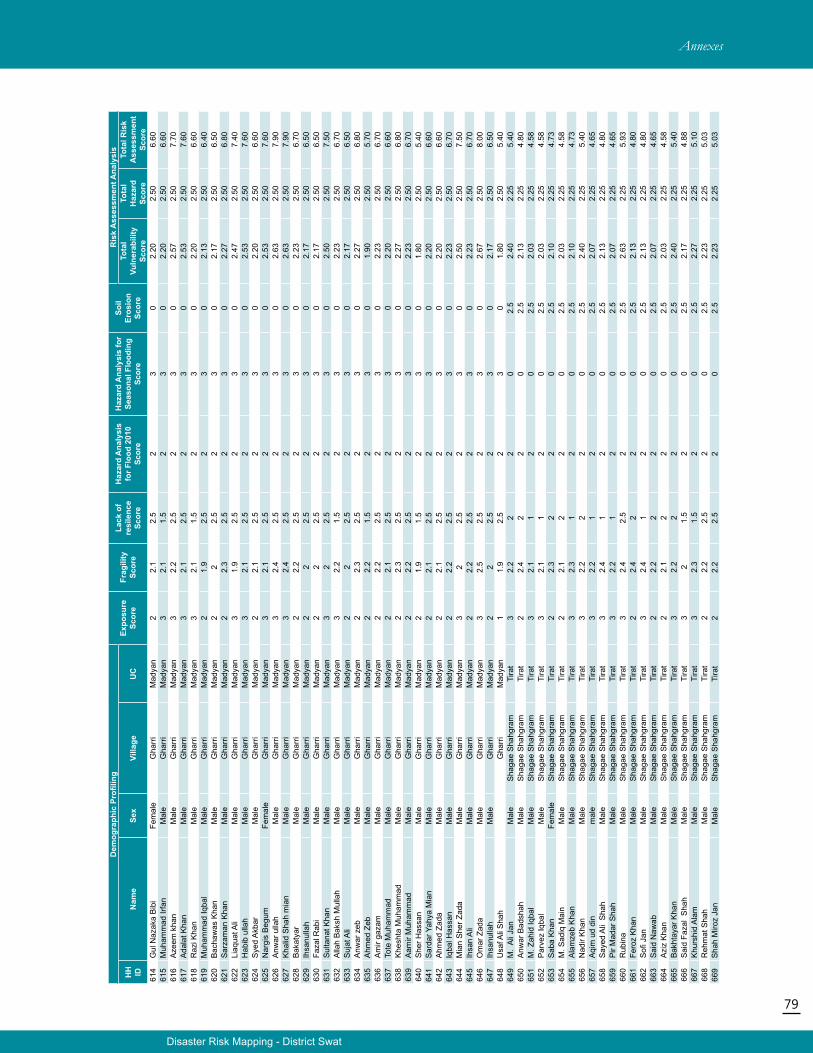
79
Disaster Risk Mapping - District Swat
Annexes
Dem
ogra
phic
Pro
filin
gEx
posu
re
Scor
eFr
agili
ty
Scor
e
Lack
of
resi
lenc
e Sc
ore
Haz
ard
Ana
lysi
s fo
r Flo
od 2
010
Scor
e
Haz
ard
Ana
lysi
s fo
r Se
ason
al F
lood
ing
Scor
e
Soil
Eros
ion
Scor
e
Ris
k A
sses
smen
t Ana
lysi
s
HH
ID
Nam
eSe
xVi
llage
UC
Tota
l Vu
lner
abili
ty
Scor
e
Tota
l H
azar
d Sc
ore
Tota
l Ris
k A
sses
smen
t Sc
ore
614
Gul
Naz
aka
Bib
iFe
mal
eG
harr
iM
adya
n2
2.1
2.5
23
02.
202.
506.
6061
5M
uham
mad
Irfa
nM
ale
Gha
rri
Mad
yan
32.
11.
52
30
2.20
2.50
6.60
616
Aze
em k
han
Mal
eG
harr
iM
adya
n3
2.2
2.5
23
02.
572.
507.
7061
7A
dala
t Kha
nM
ale
Gha
rri
Mad
yan
32.
12.
52
30
2.53
2.50
7.60
618
Raz
i Kha
nM
ale
Gha
rri
Mad
yan
32.
11.
52
30
2.20
2.50
6.60
619
Muh
amm
ad Iq
bal
Mal
eG
harr
iM
adya
n2
1.9
2.5
23
02.
132.
506.
4062
0B
acha
was
Kha
nM
ale
Gha
rri
Mad
yan
22
2.5
23
02.
172.
506.
5062
1S
arza
man
Kha
nM
ale
Gha
rri
Mad
yan
22.
32.
52
30
2.27
2.50
6.80
622
Liaq
uat A
li M
ale
Gha
rri
Mad
yan
31.
92.
52
30
2.47
2.50
7.40
623
Hab
ib u
llah
Mal
eG
harr
iM
adya
n3
2.1
2.5
23
02.
532.
507.
6062
4S
yed
Akb
arM
ale
Gha
rri
Mad
yan
22.
12.
52
30
2.20
2.50
6.60
625
Nar
gis
Beg
umFe
mal
eG
harr
iM
adya
n3
2.1
2.5
23
02.
532.
507.
6062
6A
nwar
ulla
hM
ale
Gha
rri
Mad
yan
32.
42.
52
30
2.63
2.50
7.90
627
Kha
lid S
hah
mia
nM
ale
Gha
rri
Mad
yan
32.
42.
52
30
2.63
2.50
7.90
628
Bak
atya
rM
ale
Gha
rri
Mad
yan
22.
22.
52
30
2.23
2.50
6.70
629
Ihsa
nulla
h M
ale
Gha
rri
Mad
yan
22
2.5
23
02.
172.
506.
5063
0Fa
zal R
abi
Mal
eG
harr
iM
adya
n2
22.
52
30
2.17
2.50
6.50
631
Sul
tana
t Kha
nM
ale
Gha
rri
Mad
yan
32
2.5
23
02.
502.
507.
5063
2A
llah
Bak
sh M
ulla
hM
ale
Gha
rri
Mad
yan
32.
21.
52
30
2.23
2.50
6.70
633
Suj
at A
li M
ale
Gha
rri
Mad
yan
22
2.5
23
02.
172.
506.
5063
4A
nwar
zeb
Mal
eG
harr
iM
adya
n2
2.3
2.5
23
02.
272.
506.
8063
5A
hmed
Zeb
M
ale
Gha
rri
Mad
yan
22.
21.
52
30
1.90
2.50
5.70
636
Am
ir ga
zam
Mal
eG
harr
iM
adya
n2
2.2
2.5
23
02.
232.
506.
7063
7To
te M
uham
mad
Mal
eG
harr
iM
adya
n2
2.1
2.5
23
02.
202.
506.
6063
8K
hesh
ta M
uham
mad
Mal
eG
harr
iM
adya
n2
2.3
2.5
23
02.
272.
506.
8063
9A
amir
Muh
amm
adM
ale
Gha
rri
Mad
yan
22.
22.
52
30
2.23
2.50
6.70
640
She
r Has
san
Mal
eG
harr
iM
adya
n2
1.9
1.5
23
01.
802.
505.
4064
1S
arda
r Yah
ya M
ian
Mal
eG
harr
iM
adya
n2
2.1
2.5
23
02.
202.
506.
6064
2A
hmed
Zad
aM
ale
Gha
rri
Mad
yan
22.
12.
52
30
2.20
2.50
6.60
643
Iqba
l Has
san
Mal
eG
harr
iM
adya
n2
2.2
2.5
23
02.
232.
506.
7064
4M
ian
She
r Zad
aM
ale
Gha
rri
Mad
yan
32
2.5
23
02.
502.
507.
5064
5Ih
san
Ali
Mal
eG
harr
iM
adya
n2
2.2
2.5
23
02.
232.
506.
7064
6O
mar
Zad
aM
ale
Gha
rri
Mad
yan
32.
52.
52
30
2.67
2.50
8.00
647
Ihsa
nulla
h M
ale
Gha
rri
Mad
yan
22
2.5
23
02.
172.
506.
5064
8U
saf A
li S
hah
Gha
rri
Mad
yan
11.
92.
52
30
1.80
2.50
5.40
649
M.
Ali
Jan
Mal
eS
haga
e S
hahg
ram
Tira
t3
2.2
22
02.
52.
402.
255.
4065
0A
nwar
Bad
shah
Mal
eS
haga
e S
hahg
ram
Tira
t2
2.4
22
02.
52.
132.
254.
8065
1M
. Zah
id Iq
bal
Mal
eS
haga
e S
hahg
ram
Tira
t3
2.1
12
02.
52.
032.
254.
5865
2P
arve
z Iq
bal
Mal
eS
haga
e S
hahg
ram
Tira
t3
2.1
12
02.
52.
032.
254.
5865
3S
aba
Kha
nFe
mal
eS
haga
e S
hahg
ram
Tira
t2
2.3
22
02.
52.
102.
254.
7365
4M
. Sad
iq M
ain
Mal
eS
haga
e S
hahg
ram
Tira
t2
2.1
22
02.
52.
032.
254.
5865
5A
lam
zeb
Kha
nM
ale
Sha
gae
Sha
hgra
mTi
rat
32.
31
20
2.5
2.10
2.25
4.73
656
Nad
ir K
han
Mal
eS
haga
e S
hahg
ram
Tira
t3
2.2
22
02.
52.
402.
255.
4065
7A
qim
ud
din
mal
eS
haga
e S
hahg
ram
Tira
t3
2.2
12
02.
52.
072.
254.
6565
8S
ayed
Ali
Sha
hM
ale
Sha
gae
Sha
hgra
mTi
rat
32.
41
20
2.5
2.13
2.25
4.80
659
Pir
Mad
ar S
hah
Mal
eS
haga
e S
hahg
ram
Tira
t3
2.2
12
02.
52.
072.
254.
6566
0R
ubin
aM
ale
Sha
gae
Sha
hgra
mTi
rat
32.
42.
52
02.
52.
632.
255.
9366
1Fe
roz
Kha
nM
ale
Sha
gae
Sha
hgra
mTi
rat
22.
42
20
2.5
2.13
2.25
4.80
662
Sofi
Jan
Mal
eS
haga
e S
hahg
ram
Tira
t3
2.4
12
02.
52.
132.
254.
8066
3S
aid
Naw
abM
ale
Sha
gae
Sha
hgra
mTi
rat
22.
22
20
2.5
2.07
2.25
4.65
664
Azi
z K
han
Mal
eS
haga
e S
hahg
ram
Tira
t2
2.1
22
02.
52.
032.
254.
5866
5B
akht
ayar
Kha
nM
ale
Sha
gae
Sha
hgra
mTi
rat
32.
22
20
2.5
2.40
2.25
5.40
666
Sai
d Fa
zal
Sha
h
Mal
eS
haga
e S
hahg
ram
Tira
t3
21.
52
02.
52.
172.
254.
8866
7K
hurs
hid
Ala
mM
ale
Sha
gae
Sha
hgra
mTi
rat
32.
31.
52
02.
52.
272.
255.
1066
8R
ehm
at S
hah
Mal
eS
haga
e S
hahg
ram
Tira
t2
2.2
2.5
20
2.5
2.23
2.25
5.03
669
Sha
h M
iroz
Jan
Mal
eS
haga
e S
hahg
ram
Tira
t2
2.2
2.5
20
2.5
2.23
2.25
5.03
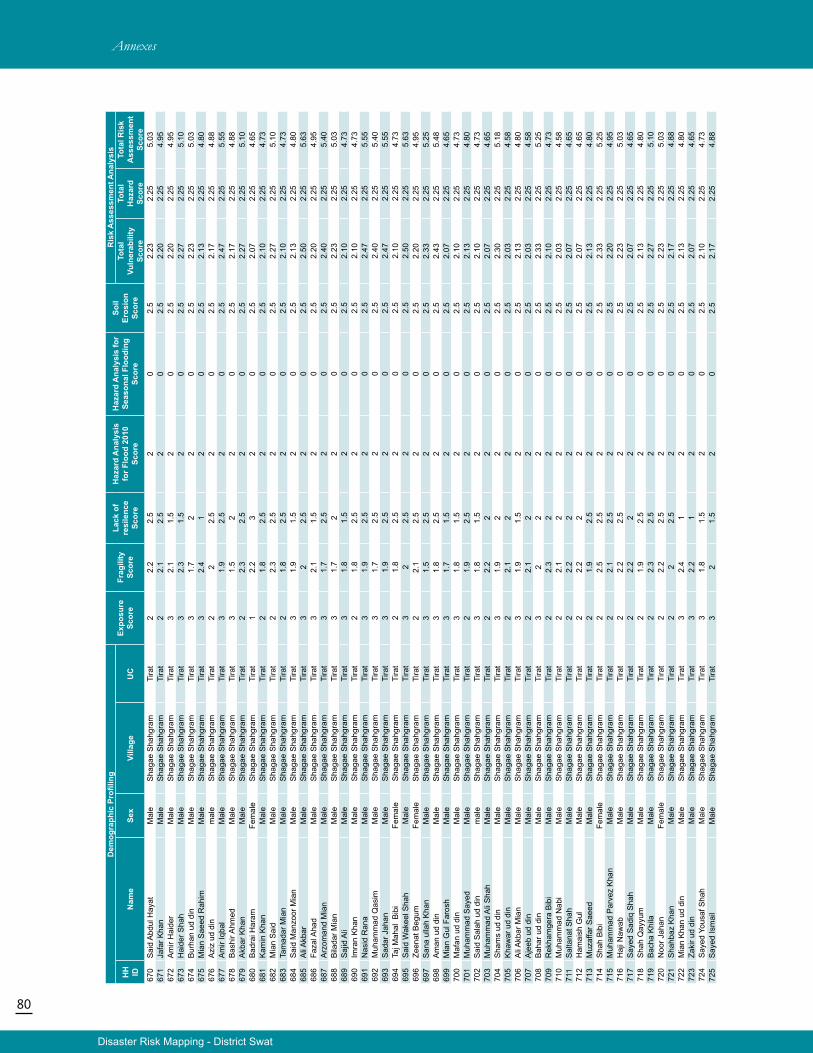
80
Disaster Risk Mapping - District Swat
Annexes
Dem
ogra
phic
Pro
filin
gEx
posu
re
Scor
eFr
agili
ty
Scor
e
Lack
of
resi
lenc
e Sc
ore
Haz
ard
Ana
lysi
s fo
r Flo
od 2
010
Scor
e
Haz
ard
Ana
lysi
s fo
r Se
ason
al F
lood
ing
Scor
e
Soil
Eros
ion
Scor
e
Ris
k A
sses
smen
t Ana
lysi
s
HH
ID
Nam
eSe
xVi
llage
UC
Tota
l Vu
lner
abili
ty
Scor
e
Tota
l H
azar
d Sc
ore
Tota
l Ris
k A
sses
smen
t Sc
ore
670
Sai
d A
bdul
Hay
atM
ale
Sha
gae
Sha
hgra
mTi
rat
22.
22.
52
02.
52.
232.
255.
0367
1Ja
far K
han
Mal
eS
haga
e S
hahg
ram
Tira
t2
2.1
2.5
20
2.5
2.20
2.25
4.95
672
Am
ir H
aide
rM
ale
Sha
gae
Sha
hgra
mTi
rat
32.
11.
52
02.
52.
202.
254.
9567
3H
aide
r Sha
hM
ale
Sha
gae
Sha
hgra
mTi
rat
32.
31.
52
02.
52.
272.
255.
1067
4B
urha
n ud
din
Mal
eS
haga
e S
hahg
ram
Tira
t3
1.7
22
02.
52.
232.
255.
0367
5M
ian
Sae
ed R
ahim
Mal
eS
haga
e S
hahg
ram
Tira
t3
2.4
12
02.
52.
132.
254.
8067
6A
ziz
ud d
inm
ale
Sha
gae
Sha
hgra
mTi
rat
22
2.5
20
2.5
2.17
2.25
4.88
677
Am
ir Iq
bal
Mal
eS
haga
e S
hahg
ram
Tira
t3
1.9
2.5
20
2.5
2.47
2.25
5.55
678
Bas
hir A
hmed
Mal
eS
haga
e S
hahg
ram
Tira
t3
1.5
22
02.
52.
172.
254.
8867
9A
kbar
Kha
nM
ale
Sha
gae
Sha
hgra
mTi
rat
22.
32.
52
02.
52.
272.
255.
1068
0B
adra
i Har
amFe
mal
eS
haga
e S
hahg
ram
Tira
t1
2.2
32
02.
52.
072.
254.
6568
1K
amin
Kha
nM
ale
Sha
gae
Sha
hgra
mTi
rat
21.
82.
52
02.
52.
102.
254.
7368
2M
ian
Sai
d
Mal
eS
haga
e S
hahg
ram
Tira
t2
2.3
2.5
20
2.5
2.27
2.25
5.10
683
Tam
adar
Mia
nM
ale
Sha
gae
Sha
hgra
mTi
rat
21.
82.
52
02.
52.
102.
254.
7368
4S
aid
Man
zoor
Mia
nM
ale
Sha
gae
Sha
hgra
mTi
rat
31.
91.
52
02.
52.
132.
254.
8068
5A
li A
kbar
Mal
eS
haga
e S
hahg
ram
Tira
t3
22.
52
02.
52.
502.
255.
6368
6Fa
zal A
had
Mal
eS
haga
e S
hahg
ram
Tira
t3
2.1
1.5
20
2.5
2.20
2.25
4.95
687
Arz
oman
d M
ian
Mal
eS
haga
e S
hahg
ram
Tira
t3
1.7
2.5
20
2.5
2.40
2.25
5.40
688
Bila
dar M
ian
Mal
eS
haga
e S
hahg
ram
Tira
t3
1.7
22
02.
52.
232.
255.
0368
9S
ajid
Ali
Mal
eS
haga
e S
hahg
ram
Tira
t3
1.8
1.5
20
2.5
2.10
2.25
4.73
690
Imra
n K
han
Mal
eS
haga
e S
hahg
ram
Tira
t2
1.8
2.5
20
2.5
2.10
2.25
4.73
691
Nas
id R
ana
Mal
eS
haga
e S
hahg
ram
Tira
t3
1.9
2.5
20
2.5
2.47
2.25
5.55
692
Muh
amm
ad Q
asim
Mal
eS
haga
e S
hahg
ram
Tira
t3
1.7
2.5
20
2.5
2.40
2.25
5.40
693
Sad
ar J
ahan
Mal
eS
haga
e S
hahg
ram
Tira
t3
1.9
2.5
20
2.5
2.47
2.25
5.55
694
Taj M
ahal
Bib
iFe
mal
eS
haga
e S
hahg
ram
Tira
t2
1.8
2.5
20
2.5
2.10
2.25
4.73
695
Sai
d W
akee
l Sha
hM
ale
Sha
gae
Sha
hgra
mTi
rat
32
2.5
20
2.5
2.50
2.25
5.63
696
Zeen
at B
egum
Fem
ale
Sha
gae
Sha
hgra
mTi
rat
22.
12.
52
02.
52.
202.
254.
9569
7S
ana
ulla
h K
han
Mal
eS
haga
e S
hahg
ram
Tira
t3
1.5
2.5
20
2.5
2.33
2.25
5.25
698
Am
an u
d di
nM
ale
Sha
gae
Sha
hgra
mTi
rat
31.
82.
52
02.
52.
432.
255.
4869
9M
ian
Gul
Far
osh
Mal
eS
haga
e S
hahg
ram
Tira
t3
1.7
1.5
20
2.5
2.07
2.25
4.65
700
Maf
an u
d di
nM
ale
Sha
gae
Sha
hgra
mTi
rat
31.
81.
52
02.
52.
102.
254.
7370
1M
uham
mad
Say
edM
ale
Sha
gae
Sha
hgra
mTi
rat
21.
92.
52
02.
52.
132.
254.
8070
2S
aid
Sal
ah u
d di
nm
ale
Sha
gae
Sha
hgra
mTi
rat
31.
81.
52
02.
52.
102.
254.
7370
3M
uham
mad
Ali
Sha
hM
ale
Sha
gae
Sha
hgra
mTi
rat
22.
22
20
2.5
2.07
2.25
4.65
704
Sha
ms
ud d
inM
ale
Sha
gae
Sha
hgra
mTi
rat
31.
92
20
2.5
2.30
2.25
5.18
705
Kha
war
ud
din
Mal
eS
haga
e S
hahg
ram
Tira
t2
2.1
22
02.
52.
032.
254.
5870
6A
li A
kbar
Mia
nM
ale
Sha
gae
Sha
hgra
mTi
rat
31.
91.
52
02.
52.
132.
254.
8070
7A
jeeb
ud
din
Mal
eS
haga
e S
hahg
ram
Tira
t2
2.1
22
02.
52.
032.
254.
5870
8B
ahar
ud
din
Mal
eS
haga
e S
hahg
ram
Tira
t3
22
20
2.5
2.33
2.25
5.25
709
Rek
ham
gera
Bib
iM
ale
Sha
gae
Sha
hgra
mTi
rat
22.
32
20
2.5
2.10
2.25
4.73
710
Muh
amm
ad N
abi
Mal
eS
haga
e S
hahg
ram
Tira
t2
2.1
22
02.
52.
032.
254.
5871
1S
alta
nat S
hah
Mal
eS
haga
e S
hahg
ram
Tira
t2
2.2
22
02.
52.
072.
254.
6571
2H
amai
sh G
ulM
ale
Sha
gae
Sha
hgra
mTi
rat
22.
22
20
2.5
2.07
2.25
4.65
713
Muz
affa
r Sae
edM
ale
Sha
gae
Sha
hgra
mTi
rat
21.
92.
52
02.
52.
132.
254.
8071
4S
hah
Bib
iFe
mal
eS
haga
e S
hahg
ram
Tira
t2
2.5
2.5
20
2.5
2.33
2.25
5.25
715
Muh
amm
ad P
arve
z K
han
Mal
eS
haga
e S
hahg
ram
Tira
t2
2.1
2.5
20
2.5
2.20
2.25
4.95
716
Haj
i Naw
abM
ale
Sha
gae
Sha
hgra
mTi
rat
22.
22.
52
02.
52.
232.
255.
0371
7S
ayed
Sad
iq S
hah
Mal
eS
haga
e S
hahg
ram
Tira
t2
2.2
22
02.
52.
072.
254.
6571
8S
hah
Qay
yum
Mal
eS
haga
e S
hahg
ram
Tira
t2
1.9
2.5
20
2.5
2.13
2.25
4.80
719
Bac
ha K
hila
Mal
eS
haga
e S
hahg
ram
Tira
t2
2.3
2.5
20
2.5
2.27
2.25
5.10
720
Noo
r Jah
anFe
mal
eS
haga
e S
hahg
ram
Tira
t2
2.2
2.5
20
2.5
2.23
2.25
5.03
721
Sha
hbaz
Kha
nM
ale
Sha
gae
Sha
hgra
mTi
rat
22
2.5
20
2.5
2.17
2.25
4.88
722
Mia
n K
han
ud d
inM
ale
Sha
gae
Sha
hgra
mTi
rat
32.
41
20
2.5
2.13
2.25
4.80
723
Zaki
r ud
din
Mal
eS
haga
e S
hahg
ram
Tira
t3
2.2
12
02.
52.
072.
254.
6572
4S
ayed
You
saf S
hah
Mal
eS
haga
e S
hahg
ram
Tira
t3
1.8
1.5
20
2.5
2.10
2.25
4.73
725
Say
ed Is
mai
lM
ale
Sha
gae
Sha
hgra
mTi
rat
32
1.5
20
2.5
2.17
2.25
4.88
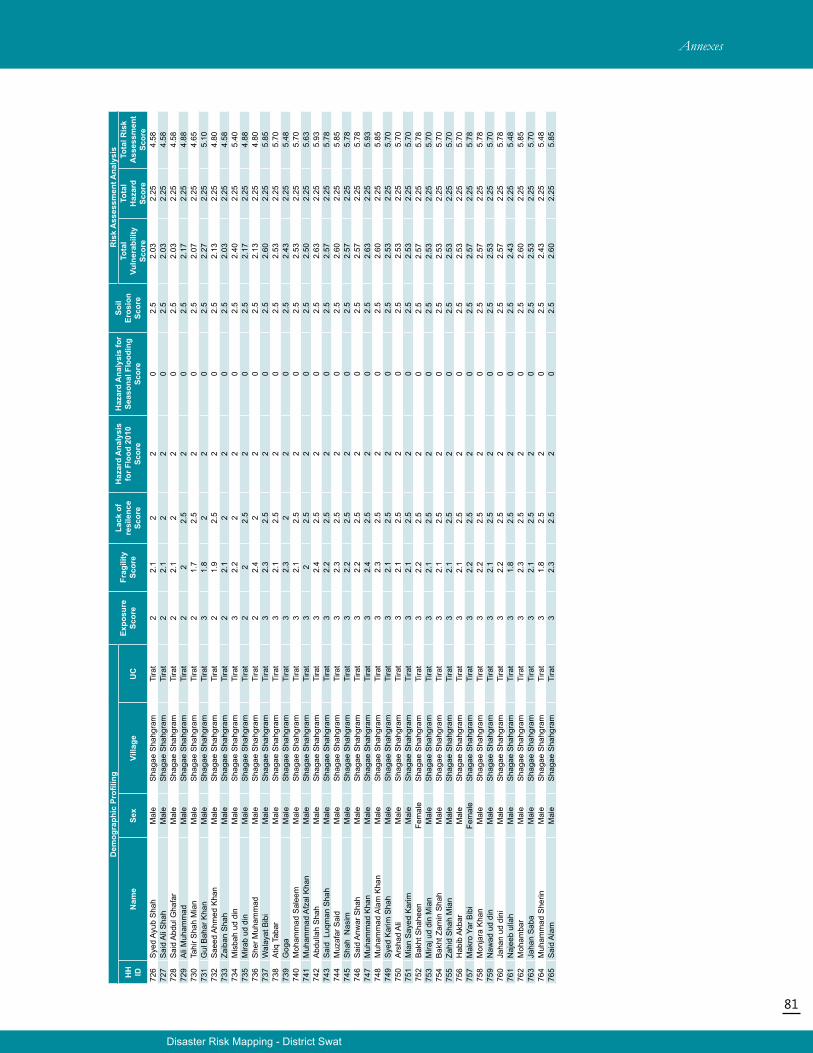
81
Disaster Risk Mapping - District Swat
Annexes
Dem
ogra
phic
Pro
filin
gEx
posu
re
Scor
eFr
agili
ty
Scor
e
Lack
of
resi
lenc
e Sc
ore
Haz
ard
Ana
lysi
s fo
r Flo
od 2
010
Scor
e
Haz
ard
Ana
lysi
s fo
r Se
ason
al F
lood
ing
Scor
e
Soil
Eros
ion
Scor
e
Ris
k A
sses
smen
t Ana
lysi
s
HH
ID
Nam
eSe
xVi
llage
UC
Tota
l Vu
lner
abili
ty
Scor
e
Tota
l H
azar
d Sc
ore
Tota
l Ris
k A
sses
smen
t Sc
ore
726
Sye
d Ay
ub S
hah
Mal
eS
haga
e S
hahg
ram
Tira
t2
2.1
22
02.
52.
032.
254.
5872
7S
aid
Ali
Sha
hM
ale
Sha
gae
Sha
hgra
mTi
rat
22.
12
20
2.5
2.03
2.25
4.58
728
Sai
d A
bdul
Gha
far
Mal
eS
haga
e S
hahg
ram
Tira
t2
2.1
22
02.
52.
032.
254.
5872
9A
li M
uham
mad
Mal
eS
haga
e S
hahg
ram
Tira
t2
22.
52
02.
52.
172.
254.
8873
0Ta
hir S
hah
Mia
nM
ale
Sha
gae
Sha
hgra
mTi
rat
21.
72.
52
02.
52.
072.
254.
6573
1G
ul B
ahar
Kha
nM
ale
Sha
gae
Sha
hgra
mTi
rat
31.
82
20
2.5
2.27
2.25
5.10
732
Sae
ed A
hmed
Kha
nM
ale
Sha
gae
Sha
hgra
mTi
rat
21.
92.
52
02.
52.
132.
254.
8073
3Za
iban
Sha
hM
ale
Sha
gae
Sha
hgra
mTi
rat
22.
12
20
2.5
2.03
2.25
4.58
734
Mis
bah
ud d
inM
ale
Sha
gae
Sha
hgra
mTi
rat
32.
22
20
2.5
2.40
2.25
5.40
735
Mira
b ud
din
Mal
eS
haga
e S
hahg
ram
Tira
t2
22.
52
02.
52.
172.
254.
8873
6S
her M
uham
mad
Mal
eS
haga
e S
hahg
ram
Tira
t2
2.4
22
02.
52.
132.
254.
8073
7W
alay
at B
ibi
Mal
eS
haga
e S
hahg
ram
Tira
t3
2.3
2.5
20
2.5
2.60
2.25
5.85
738
Atiq
Tab
arM
ale
Sha
gae
Sha
hgra
mTi
rat
32.
12.
52
02.
52.
532.
255.
7073
9G
oga
Mal
eS
haga
e S
hahg
ram
Tira
t3
2.3
22
02.
52.
432.
255.
4874
0M
oham
mad
Sal
eem
Mal
eS
haga
e S
hahg
ram
Tira
t3
2.1
2.5
20
2.5
2.53
2.25
5.70
741
Muh
amm
ad A
fzal
Kha
nM
ale
Sha
gae
Sha
hgra
mTi
rat
32
2.5
20
2.5
2.50
2.25
5.63
742
Abd
ulla
h S
hah
Mal
eS
haga
e S
hahg
ram
Tira
t3
2.4
2.5
20
2.5
2.63
2.25
5.93
743
Sai
d L
uqm
an S
hah
Mal
eS
haga
e S
hahg
ram
Tira
t3
2.2
2.5
20
2.5
2.57
2.25
5.78
744
Muz
afar
Sai
dM
ale
Sha
gae
Sha
hgra
mTi
rat
32.
32.
52
02.
52.
602.
255.
8574
5S
hah
Nas
imM
ale
Sha
gae
Sha
hgra
mTi
rat
32.
22.
52
02.
52.
572.
255.
7874
6S
aid
Anw
ar S
hah
Mal
eS
haga
e S
hahg
ram
Tira
t3
2.2
2.5
20
2.5
2.57
2.25
5.78
747
Muh
amm
ad K
han
Mal
eS
haga
e S
hahg
ram
Tira
t3
2.4
2.5
20
2.5
2.63
2.25
5.93
748
Muh
amm
ad A
lam
Kha
nM
ale
Sha
gae
Sha
hgra
mTi
rat
32.
32.
52
02.
52.
602.
255.
8574
9S
yed
Kar
im S
hah
Mal
eS
haga
e S
hahg
ram
Tira
t3
2.1
2.5
20
2.5
2.53
2.25
5.70
750
Ars
had
Ali
Mal
eS
haga
e S
hahg
ram
Tira
t3
2.1
2.5
20
2.5
2.53
2.25
5.70
751
Mia
n S
ayed
Kar
imM
ale
Sha
gae
Sha
hgra
mTi
rat
32.
12.
52
02.
52.
532.
255.
7075
2B
akht
Sha
heen
Fem
ale
Sha
gae
Sha
hgra
mTi
rat
32.
22.
52
02.
52.
572.
255.
7875
3M
iraj u
d di
n M
ian
Mal
eS
haga
e S
hahg
ram
Tira
t3
2.1
2.5
20
2.5
2.53
2.25
5.70
754
Bak
ht Z
amin
Sha
hM
ale
Sha
gae
Sha
hgra
mTi
rat
32.
12.
52
02.
52.
532.
255.
7075
5Za
hid
Sha
h M
ian
Mal
eS
haga
e S
hahg
ram
Tira
t3
2.1
2.5
20
2.5
2.53
2.25
5.70
756
Hab
ib A
kbar
Mal
eS
haga
e S
hahg
ram
Tira
t3
2.1
2.5
20
2.5
2.53
2.25
5.70
757
Mak
ro Y
ar B
ibi
Fem
ale
Sha
gae
Sha
hgra
mTi
rat
32.
22.
52
02.
52.
572.
255.
7875
8M
onja
ra K
han
Mal
eS
haga
e S
hahg
ram
Tira
t3
2.2
2.5
20
2.5
2.57
2.25
5.78
759
Naw
ad u
d di
nM
ale
Sha
gae
Sha
hgra
mTi
rat
32.
12.
52
02.
52.
532.
255.
7076
0Ja
han
ud d
ini
Mal
eS
haga
e S
hahg
ram
Tira
t3
2.2
2.5
20
2.5
2.57
2.25
5.78
761
Naj
eeb
ulla
hM
ale
Sha
gae
Sha
hgra
mTi
rat
31.
82.
52
02.
52.
432.
255.
4876
2M
oham
bar
Mal
eS
haga
e S
hahg
ram
Tira
t3
2.3
2.5
20
2.5
2.60
2.25
5.85
763
Jaha
n S
aba
Mal
eS
haga
e S
hahg
ram
Tira
t3
2.1
2.5
20
2.5
2.53
2.25
5.70
764
Muh
amm
ad S
herin
Mal
eS
haga
e S
hahg
ram
Tira
t3
1.8
2.5
20
2.5
2.43
2.25
5.48
765
Sai
d A
lam
Mal
eS
haga
e S
hahg
ram
Tira
t3
2.3
2.5
20
2.5
2.60
2.25
5.85
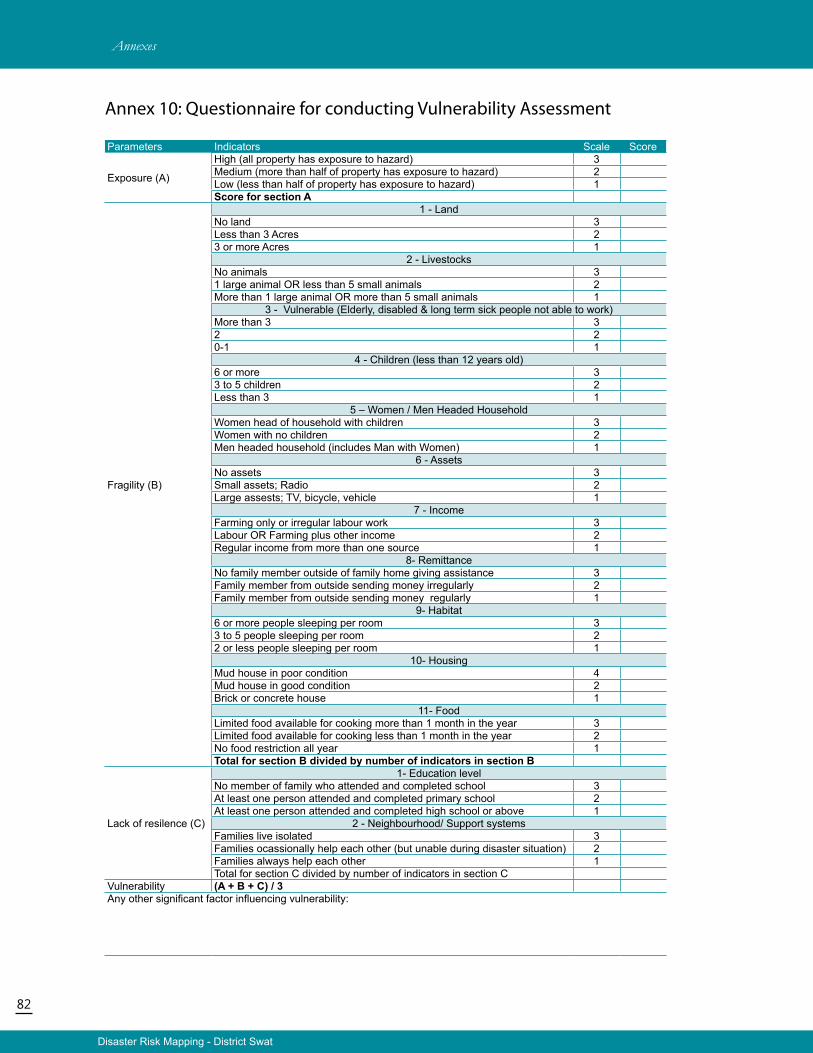
82
Disaster Risk Mapping - District Swat
Annex 10: Questionnaire for conducting Vulnerability Assessment
Parameters Indicators Scale Score
Exposure (A)
High (all property has exposure to hazard) 3Medium (more than half of property has exposure to hazard) 2Low (less than half of property has exposure to hazard) 1Score for section A
Fragility (B)
1 - LandNo land 3Less than 3 Acres 23 or more Acres 1
2 - LivestocksNo animals 31 large animal OR less than 5 small animals 2More than 1 large animal OR more than 5 small animals 1
3 - Vulnerable (Elderly, disabled & long term sick people not able to work)More than 3 32 20-1 1
4 - Children (less than 12 years old)6 or more 33 to 5 children 2Less than 3 1
5 – Women / Men Headed HouseholdWomen head of household with children 3Women with no children 2Men headed household (includes Man with Women) 1
6 - AssetsNo assets 3Small assets; Radio 2Large assests; TV, bicycle, vehicle 1
7 - IncomeFarming only or irregular labour work 3Labour OR Farming plus other income 2Regular income from more than one source 1
8- RemittanceNo family member outside of family home giving assistance 3Family member from outside sending money irregularly 2Family member from outside sending money regularly 1
9- Habitat6 or more people sleeping per room 33 to 5 people sleeping per room 22 or less people sleeping per room 1
10- HousingMud house in poor condition 4Mud house in good condition 2Brick or concrete house 1
11- FoodLimited food available for cooking more than 1 month in the year 3Limited food available for cooking less than 1 month in the year 2No food restriction all year 1Total for section B divided by number of indicators in section B
Lack of resilence (C)
1- Education levelNo member of family who attended and completed school 3At least one person attended and completed primary school 2At least one person attended and completed high school or above 1
2 - Neighbourhood/ Support systemsFamilies live isolated 3Families ocassionally help each other (but unable during disaster situation) 2Families always help each other 1Total for section C divided by number of indicators in section C
Vulnerability (A + B + C) / 3Any other significant factor influencing vulnerability:
Annexes