Embed Size (px)
Citation preview
SOPAC ECOnOmiC REPORt (PR21) Vanuatu investment in Disaster Risk Management SOPAC ECOnOmiC REPORt (PR21) Vanuatu investment in Disaster Risk Management 1
Vanuatu investment in Disaster Risk Management
April 2011
Samantha CookDisaster Reduction Programme
ECOnOmiC REPORt (PR21)
Produced with the support of the ACP-EU natural Disaster Facility under the 9th European Development Fund
2 Vanuatu investment in Disaster Risk Management SOPAC ECOnOmiC REPORt (PR21)
DISCLAIMER
While care has been taken in the collection, analysis, and compilation of the data, it is supplied on the condition that the Applied Geoscience and technology Division (SOPAC) of the Secretariat of Pacific Community shall not be liable for any loss or injury whatsoever arising from the use of the data.
Published by: Applied Geoscience and technology Division (SOPAC) 2011
Cover design by: Sailesh Kumar Sen SPC SOPAC Division
Cover photos: Samantha Cook and Federica Gerber (SPC SOPAC Division), Christina Shaw Layout by: Sailesh Kumar Sen SPC SOPAC Division
Printed by: Quality Print Limited Suva Fiji
Available from: Applied Geoscience and technology Division (SOPAC) Private mail Bag GPO Suva Fiji islands telephone: (679) 338 1377 Fax: (679) 337 0040 E-mail: [email protected] Web site: http://www.sopac.org
SOPACLD70.08.07.11
Vanuatu investment in Disaster Risk Management
April 2011
Samantha CookDisaster Reduction Programme
ECOnOmiC REPORt (PR21)

4 Vanuatu investment in Disaster Risk Management SOPAC ECOnOmiC REPORt (PR21)
Our Mission
The mission of the SPC is “to help Pacific island people position themselves to respond effectively to the challenges they face and make informed decisions about their future and the future they wish to leave for the generations that follow.
Our Goal
The goal of the Applied Geoscience and Technology Division is to apply geoscience and technology to realise new opportunities for improving the livelihoods of Pacific communities.
Acronyms...................................................................................................... 2
Prologue....................................................................................................... 3
Defining Disaster Risk management.............................................................. 5
Regional Context.......................................................................................... 7
Country Context............................................................................................ 9
methodology................................................................................................. 11
national Government Funding............................................................................. 12
Donor Funding.................................................................................................... 13
Desk Review....................................................................................................... 13
Past events and their costs........................................................................... 14
Resulting Budget Allocation........................................................................... 17
Current Economic Climate............................................................................ 20
Potential Losses............................................................................................ 23
Demonstrating Losses................................................................................... 25
Benefits of investing in DRR........................................................................... 29
Summary....................................................................................................... 31
Conclusion.................................................................................................... 32
References.................................................................................................... 33
Contents
SOPAC ECOnOmiC REPORt (PR21) Vanuatu investment in Disaster Risk Management
2 Vanuatu investment in Disaster Risk Management SOPAC ECOnOmiC REPORt (PR21)
COFOG Classifications of the Functions of Government
CPi Consumer Price index
Dm Disaster management
DRm Disaster Risk management
DRR Disaster Risk Reduction
Em-DAt international Disaster Database
GDP Gross Domestic Product
HFA Hyogo Framework for Action
iPCC international Panel for Climate Change
LHS Left Hand Side
nAP national Action Plan
nBV national Bank of Vanuatu
nDmO national Disaster management Office
nPP new Policy Proposal
mFEm ministry of Finance and Economic management
PDRmPn Pacific Disaster Risk management Partnership network
RBV Reserve Bank of Vanuatu
RFA Regional Framework for Action
RHS Right Hand Side
SOPAC Applied Geoscience and technology Division, Secretariat of the Pacific Community
UnECLAC United nations Economic Commission for Latin America and the Caribbean
VAt Value Added tax
VSO Vanuatu Statistics Office
VVAL Vanuatu Volcano Alert Level
Acronyms
SOPAC ECOnOmiC REPORt (PR21) Vanuatu investment in Disaster Risk Management
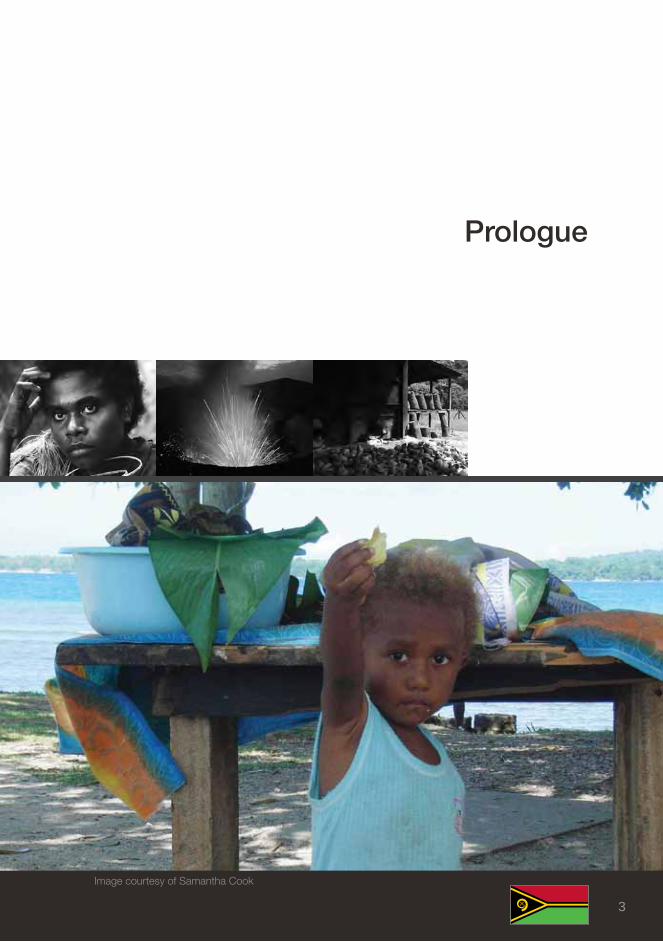
Prologue
image courtesy of Samantha Cook
3
4 Vanuatu investment in Disaster Risk Management SOPAC ECOnOmiC REPORt (PR21)
The tsunami that hit Samoa, American Samoa and Tonga in late September 2009 gave a distressing reminder that the Pacific is one of the most natural disaster prone regions of the world. Since 1950 natural disasters have affected approximately 2.5 million1 people in the region, causing 1,9752 reported deaths in the region. This has cost the Pacific Island Countries (PICs) around $1.6 billion (in nominal terms) in associated damage costs (EM-DAT, 2010).
The Intergovernmental Panel on Climate Change (IPCC) Fourth Assessment Report has emphasised that if the planet’s surface temperature increases by 2°C above pre-industrial levels, a catastrophic collapse of ecosystems becomes possible with unforseen, non-linear impacts on poverty and disaster risk. The IPCC has also confirmed that the geographic distribution, frequency and intensity of these hazards are already being significantly altered by climate change. This has strong implications for the Pacific. For example, a rise in the mean sea level of 1 metre at the upper range of estimates for the next hundred years will have drastic consequences for many coastal communities (Dow and Downing, 2007).
Evidence of rising sea levels has already emerged in the Pacific after 2,000 inhabitants were forced to relocate after their homes were washed away by high tides and storm surges. Rising seas also forced the inhabitants of Tégua, Vanuatu, to abandon their island in December 2005 (Dow and Downing, 2007).
With the climate trend models for the Pacific indicating increased extreme weather conditions and increased climate variability (IPCC, 2007), PICs have little choice but to develop comprehensive risk management plans for the hazards that they will face.
The objective of this report is to present a high level desk based assessment of the potential economic costs of a disaster and to identify the level of investment in Disaster Risk Management (DRM). This will be used to draw attention to the benefits of investing in Disaster Risk Reduction (DRR) versus the cost of a disaster.
1 excluding Papua New Guinea and the Overseas Countries and Territories. SPC Pocket Handbook 2010.2 excluding Papua New Guinea and the Overseas Countries and Territories, EM-DAT 2010.
SOPAC ECOnOmiC REPORt (PR21) Vanuatu investment in Disaster Risk Management
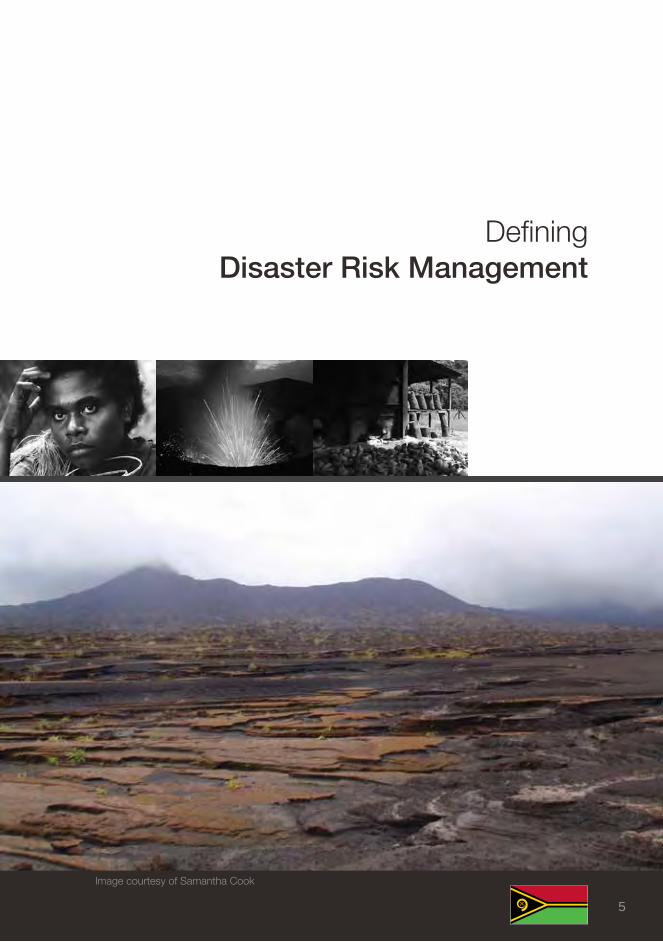
Defining Disaster Risk Management
image courtesy of Samantha Cook
5
6 Vanuatu investment in Disaster Risk Management SOPAC ECOnOmiC REPORt (PR21)
To ascertain the level of investment in Disaster Risk Management (DRM) as a whole it is important to understand exactly what is comprised underneath the heading of DRM itself.
A disaster does not stem from a country’s lack of capacity to respond to a hazard but rather from its inability to cope with any resulting damage. For example, the occurrence of a cyclone is not a disaster in itself, it is merely a hazard. It is a country’s (or a community’s) lack of resources to be able to deal with the effects of the hazard that will turn the event in to a disaster. If a cyclone hits a country but that country is able to cope with the after effects of the cyclone then no disaster has occurred.
Disaster Risk Management describes;
“The systematic process of using administrative directives, organizations, and operational skills and capacities to implement strategies, policies and improved coping capacities in order to lessen the adverse impacts of hazards and the possibility of disaster.” (UNISDR)
An important component of DRM is Disaster Risk Reduction which is;
“The concept and practice of reducing disaster risks through systematic efforts to analyse and manage the causal factors of disasters, including through reduced exposure to Hazards, lessened vulnerability of people and property, wise management of land and the environment, and improved preparedness for adverse events.” (UNISDR)
The other integral component of DRM is Disaster Management (DM) which is;
“the component which involves the planning, leading and controlling of activities related to the management of disasters in any of its phases and stages”
according to The Asia Foundation and United States Agency for International Development.
SOPAC ECOnOmiC REPORt (PR21) Vanuatu investment in Disaster Risk Management
Regional Context
image courtesy of Samantha Cook
7
8 Vanuatu investment in Disaster Risk Management SOPAC ECOnOmiC REPORt (PR21)
The Hyogo Framework for Action (HFA) was adopted in 2005 with an expected outcome of “The substantial reduction of disaster losses, in lives and the social, economic and environmental assets of communities and countries.”
In the Pacific, the HFA formed the basis for the development of the Pacific Disaster Risk Reduction and Disaster Management Framework for Action (Regional Framework for Action or RFA). In 2005 at the 36th Pacific Islands Forum the leaders of the Pacific Island Countries endorsed a coordinated approach on an ‘all hazards’ basis that would significantly improve the capacity of the Pacific island nations to reduce their vulnerabilities and to better manage disasters when they occurred. The ultimate goal is to see “DRR and Disaster Management (DM) policies mainstreamed in to national policies, planning processes and decision making at all levels”. The RFA outlines the major policy imperatives needed in the region to support the management of disaster. Additionally, the Pacific Plan, which is the overarching strategic development policy document for the Pacific region, emphasises the need for improved disaster risk management practices and policies to enhance sustainable development.
In 2006 the Pacific Disaster Risk Management Partnership Network (PDRMPN) was established to support capacity building in DRM in PICs. The Partnership assists the development of National Action Plans (NAPs) for Disaster Risk Management consistent with the RFA and other linked regional and international policy instruments for DRM and climate change adaptation. NAPs are the vehicle through which PICs actively pursue the mainstreaming of disaster risk and climate risk considerations into their national and sectoral planning processes and budgets. This ensures that the relevant measures are introduced to reduce the potential impact of future disasters to their national economies. NAPs have been developed for, Vanuatu (2006), Republic of Marshall Islands (2007), Cook Islands (2008), Palau (2009) and Tonga (2010). There are also discussions underway to establish NAPs in Palau and Tuvalu at present. Major donors such as the European Union and AusAID are providing dedicated funding through organisations like SOPAC to support the development and implementation of NAPs.
SOPAC ECOnOmiC REPORt (PR21) Vanuatu investment in Disaster Risk Management
Country Context
image courtesy of Samantha Cook
9
10 Vanuatu investment in Disaster Risk Management SOPAC ECOnOmiC REPORt (PR21)
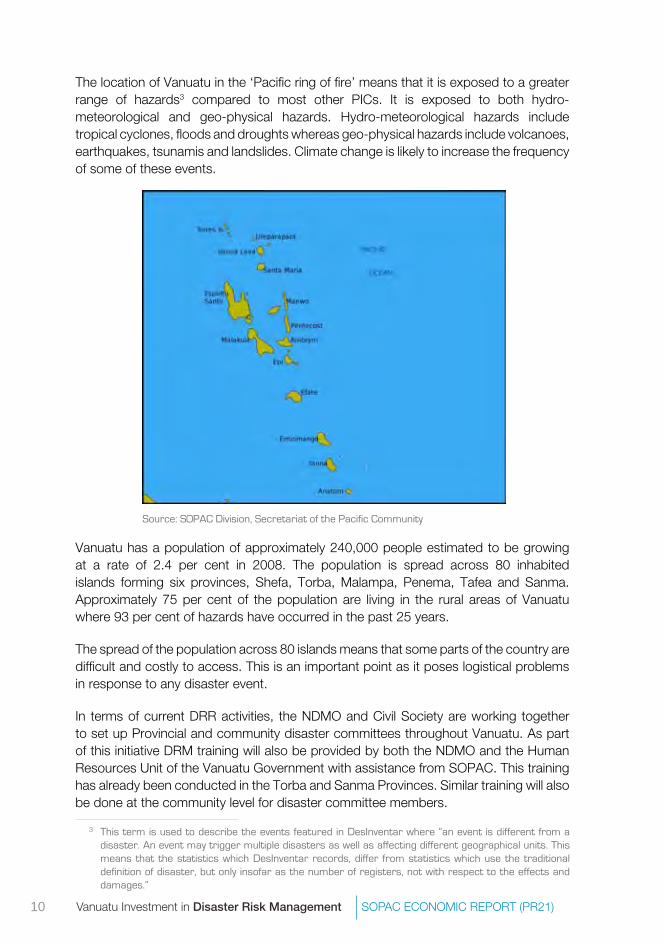
The location of Vanuatu in the ‘Pacific ring of fire’ means that it is exposed to a greater range of hazards3 compared to most other PICs. It is exposed to both hydro- meteorological and geo-physical hazards. Hydro-meteorological hazards include tropical cyclones, floods and droughts whereas geo-physical hazards include volcanoes, earthquakes, tsunamis and landslides. Climate change is likely to increase the frequency of some of these events.
3 This term is used to describe the events featured in DesInventar where “an event is different from a disaster. An event may trigger multiple disasters as well as affecting different geographical units. This means that the statistics which DesInventar records, differ from statistics which use the traditional definition of disaster, but only insofar as the number of registers, not with respect to the effects and damages.”
Vanuatu has a population of approximately 240,000 people estimated to be growing at a rate of 2.4 per cent in 2008. The population is spread across 80 inhabited islands forming six provinces, Shefa, Torba, Malampa, Penema, Tafea and Sanma. Approximately 75 per cent of the population are living in the rural areas of Vanuatu where 93 per cent of hazards have occurred in the past 25 years.
The spread of the population across 80 islands means that some parts of the country are difficult and costly to access. This is an important point as it poses logistical problems in response to any disaster event.
In terms of current DRR activities, the NDMO and Civil Society are working together to set up Provincial and community disaster committees throughout Vanuatu. As part of this initiative DRM training will also be provided by both the NDMO and the Human Resources Unit of the Vanuatu Government with assistance from SOPAC. This training has already been conducted in the Torba and Sanma Provinces. Similar training will also be done at the community level for disaster committee members.
Source: SOPAC Division, Secretariat of the Pacific Community
SOPAC ECOnOmiC REPORt (PR21) Vanuatu investment in Disaster Risk Management
Methodology
image courtesy of Samantha Cook
11
12 Vanuatu investment in Disaster Risk Management SOPAC ECOnOmiC REPORt (PR21)
There are commonly three sources of funding for DRM investments; National Government Funding, Provincial Council Expenditure and Donor Funding. In Vanuatu, it was only possible to focus on one of these, National Government Funding. The remaining two areas were not visible due to current reporting practices of the Government. This should improve with the introduction of Classification of the Functions of Government (COFOG) classifications, expenditure in DRM should become more transparent. It is also hoped that with the increase in the recurrent budget allocation for the NDMO that investment in risk reduction efforts will improve.
The broader economic analysis was conducted by doing a desk review involving data collection for the statistical analysis.
national Government FundingTo capture data on the level of investment in DRM the annual budget allocation (commonly known as an appropriation) from the National budget to the NDMO was analysed. In addition to this, any supplementary funds (those funds which are released due to unforseen events to cover additional costs) that may have been released in response to a disaster were also analysed. Given the predominance of recurrent expenditures (those which occur every year such as salaries and wages) in the NDMO budget appropriation it was not felt necessary to analyse the difference between appropriation and expenditure.
The primary source of information for identifying expenditure in DRM was the national budget documentation from 2005 onwards. The focus of this paper is therefore driven by the appropriations from the central Government to the National Disaster Management Office (NDMO).
It was not possible to identify appropriations or expenditures at the sectoral level as the Budget is a high level document and does not drill down to the level of detail required for such analysis. Examples of indirect expenditures at the sectoral level would include the integration of disaster awareness in to the school curriculum. This does not mean such initiatives do not exist but merely that they are difficult to track with the current financial management systems present in Vanuatu.
13SOPAC ECOnOmiC REPORt (PR21) Vanuatu investment in Disaster Risk Management
Donor FundingIt is recognised that donors will invest in several DRM measures in a country at any one time. However, unless the money goes through the Ministry of Finance and Economic Management (MFEM), it becomes very difficult to attain detailed figures. For example, community based DRM measures funded directly by donors are almost impossible to track as the outcomes are often not communicated to those who are not directly involved.
This reinforces the point that in most instances the costs of mainstreaming DRM in a project, whether Government or donor funded, can therefore not be explicitly observed. This makes progress in this area very difficult to track. As a result, the analysis in this paper is limited to appropriations and post event expenditures in DRM.
Desk ReviewTo facilitate the general economic analysis and the statistical analysis involving the calculation of losses data was collected from the Vanuatu Statistics Office, the Reserve Bank of Vanuatu and the Ministry of Finance and Economic Management The desk review also involved reviewing several key papers on DRM in Vanuatu.
image courtesy of Federica Gerber
Vanuatu investment in Disaster Risk Management SOPAC ECOnOmiC REPORt (PR21)
Past Events and Their Costs
image courtesy of Christina Shaw
14
15SOPAC ECOnOmiC REPORt (PR21) Vanuatu investment in Disaster Risk Management
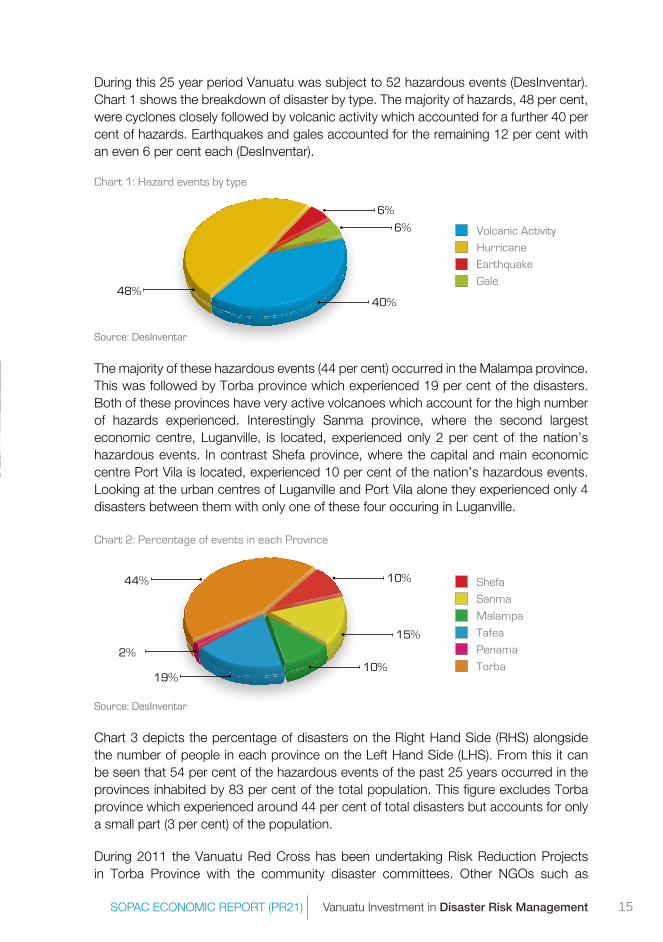
During this 25 year period Vanuatu was subject to 52 hazardous events (DesInventar). Chart 1 shows the breakdown of disaster by type. The majority of hazards, 48 per cent, were cyclones closely followed by volcanic activity which accounted for a further 40 per cent of hazards. Earthquakes and gales accounted for the remaining 12 per cent with an even 6 per cent each (DesInventar).
Chart 1: Hazard events by type
6%
6%
40%48%
Volcanic Activity
Hurricane
Earthquake
Gale
15%
10%
10%2%
19%
44% Shefa
Sanma
Malampa
Tafea
Penama
Torba
Source: DesInventar
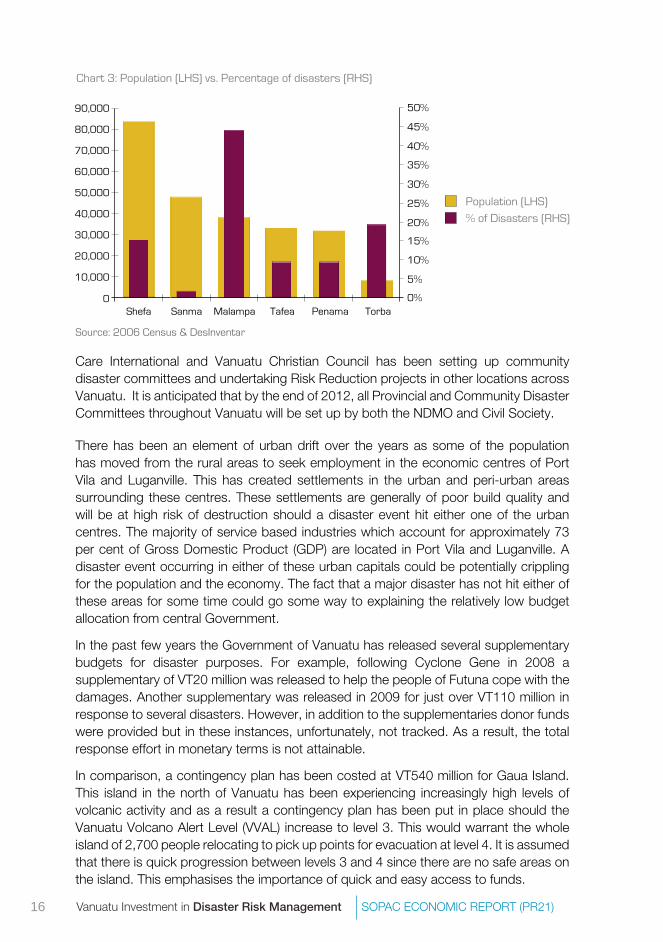
Chart 3 depicts the percentage of disasters on the Right Hand Side (RHS) alongside the number of people in each province on the Left Hand Side (LHS). From this it can be seen that 54 per cent of the hazardous events of the past 25 years occurred in the provinces inhabited by 83 per cent of the total population. This figure excludes Torba province which experienced around 44 per cent of total disasters but accounts for only a small part (3 per cent) of the population.
During 2011 the Vanuatu Red Cross has been undertaking Risk Reduction Projects in Torba Province with the community disaster committees. Other NGOs such as
Source: DesInventar
The majority of these hazardous events (44 per cent) occurred in the Malampa province. This was followed by Torba province which experienced 19 per cent of the disasters. Both of these provinces have very active volcanoes which account for the high number of hazards experienced. Interestingly Sanma province, where the second largest economic centre, Luganville, is located, experienced only 2 per cent of the nation’s hazardous events. In contrast Shefa province, where the capital and main economic centre Port Vila is located, experienced 10 per cent of the nation’s hazardous events. Looking at the urban centres of Luganville and Port Vila alone they experienced only 4 disasters between them with only one of these four occuring in Luganville.
Chart 2: Percentage of events in each Province
16 Vanuatu investment in Disaster Risk Management SOPAC ECOnOmiC REPORt (PR21)
Care International and Vanuatu Christian Council has been setting up community disaster committees and undertaking Risk Reduction projects in other locations across Vanuatu. It is anticipated that by the end of 2012, all Provincial and Community Disaster Committees throughout Vanuatu will be set up by both the NDMO and Civil Society.
There has been an element of urban drift over the years as some of the population has moved from the rural areas to seek employment in the economic centres of Port Vila and Luganville. This has created settlements in the urban and peri-urban areas surrounding these centres. These settlements are generally of poor build quality and will be at high risk of destruction should a disaster event hit either one of the urban centres. The majority of service based industries which account for approximately 73 per cent of Gross Domestic Product (GDP) are located in Port Vila and Luganville. A disaster event occurring in either of these urban capitals could be potentially crippling for the population and the economy. The fact that a major disaster has not hit either of these areas for some time could go some way to explaining the relatively low budget allocation from central Government.
In the past few years the Government of Vanuatu has released several supplementary budgets for disaster purposes. For example, following Cyclone Gene in 2008 a supplementary of VT20 million was released to help the people of Futuna cope with the damages. Another supplementary was released in 2009 for just over VT110 million in response to several disasters. However, in addition to the supplementaries donor funds were provided but in these instances, unfortunately, not tracked. As a result, the total response effort in monetary terms is not attainable.
In comparison, a contingency plan has been costed at VT540 million for Gaua Island. This island in the north of Vanuatu has been experiencing increasingly high levels of volcanic activity and as a result a contingency plan has been put in place should the Vanuatu Volcano Alert Level (VVAL) increase to level 3. This would warrant the whole island of 2,700 people relocating to pick up points for evacuation at level 4. It is assumed that there is quick progression between levels 3 and 4 since there are no safe areas on the island. This emphasises the importance of quick and easy access to funds.
10,000
0Shefa Sanma Malampa Tafea Penama Torba
5%
0%
10%
15%
20%
25%
30%
35%
40%
45%
50%
20,000
30,000
40,000
50,000
60,000
70,000
80,000
90,000
Population (LHS)
% of Disasters (RHS)
Chart 3: Population (LHS) vs. Percentage of disasters (RHS)
Source: 2006 Census & DesInventar
SOPAC ECOnOmiC REPORt (PR21) Vanuatu investment in Disaster Risk Management
Resulting Budget Allocation
image courtesy of Federica Gerber
17
18 Vanuatu investment in Disaster Risk Management SOPAC ECOnOmiC REPORt (PR21)
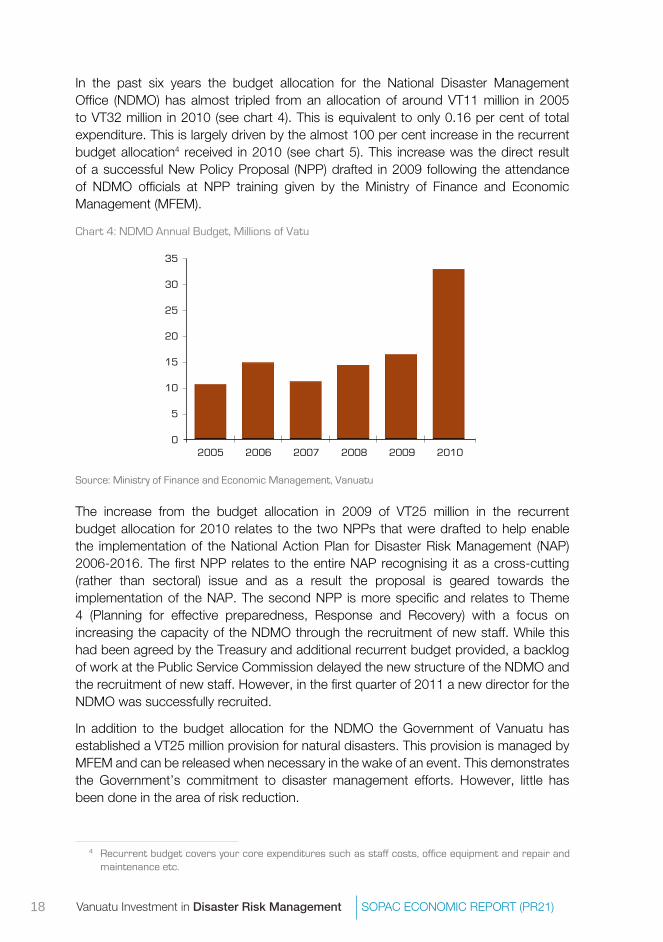
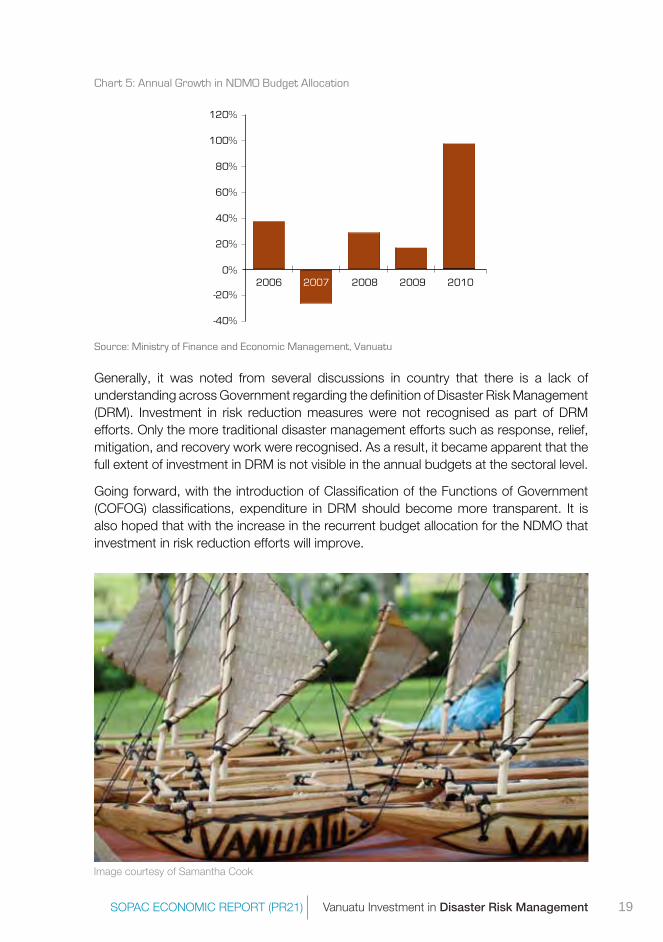
In the past six years the budget allocation for the National Disaster Management Office (NDMO) has almost tripled from an allocation of around VT11 million in 2005 to VT32 million in 2010 (see chart 4). This is equivalent to only 0.16 per cent of total expenditure. This is largely driven by the almost 100 per cent increase in the recurrent budget allocation4 received in 2010 (see chart 5). This increase was the direct result of a successful New Policy Proposal (NPP) drafted in 2009 following the attendance of NDMO officials at NPP training given by the Ministry of Finance and Economic Management (MFEM).
Chart 4: NDMO Annual Budget, Millions of Vatu
Source: Ministry of Finance and Economic Management, Vanuatu
The increase from the budget allocation in 2009 of VT25 million in the recurrent budget allocation for 2010 relates to the two NPPs that were drafted to help enable the implementation of the National Action Plan for Disaster Risk Management (NAP) 2006-2016. The first NPP relates to the entire NAP recognising it as a cross-cutting (rather than sectoral) issue and as a result the proposal is geared towards the implementation of the NAP. The second NPP is more specific and relates to Theme 4 (Planning for effective preparedness, Response and Recovery) with a focus on increasing the capacity of the NDMO through the recruitment of new staff. While this had been agreed by the Treasury and additional recurrent budget provided, a backlog of work at the Public Service Commission delayed the new structure of the NDMO and the recruitment of new staff. However, in the first quarter of 2011 a new director for the NDMO was successfully recruited.
In addition to the budget allocation for the NDMO the Government of Vanuatu has established a VT25 million provision for natural disasters. This provision is managed by MFEM and can be released when necessary in the wake of an event. This demonstrates the Government’s commitment to disaster management efforts. However, little has been done in the area of risk reduction.
5
02005 2006 2007 2008 2009 2010
10
15
20
25
30
35
4 Recurrent budget covers your core expenditures such as staff costs, office equipment and repair and maintenance etc.
19SOPAC ECOnOmiC REPORt (PR21) Vanuatu investment in Disaster Risk Management
Source: Ministry of Finance and Economic Management, Vanuatu
Generally, it was noted from several discussions in country that there is a lack of understanding across Government regarding the definition of Disaster Risk Management (DRM). Investment in risk reduction measures were not recognised as part of DRM efforts. Only the more traditional disaster management efforts such as response, relief, mitigation, and recovery work were recognised. As a result, it became apparent that the full extent of investment in DRM is not visible in the annual budgets at the sectoral level.
Going forward, with the introduction of Classification of the Functions of Government (COFOG) classifications, expenditure in DRM should become more transparent. It is also hoped that with the increase in the recurrent budget allocation for the NDMO that investment in risk reduction efforts will improve.
20%
-40%
0%2006 2007 2008 2009 2010
40%
-20%
60%
80%
100%
120%
image courtesy of Samantha Cook
Chart 5: Annual Growth in NDMO Budget Allocation
2007
Vanuatu investment in Disaster Risk Management SOPAC ECOnOmiC REPORt (PR21)
Current Economic Climate
image courtesy of Samantha Cook
20
21SOPAC ECOnOmiC REPORt (PR21) Vanuatu investment in Disaster Risk Management
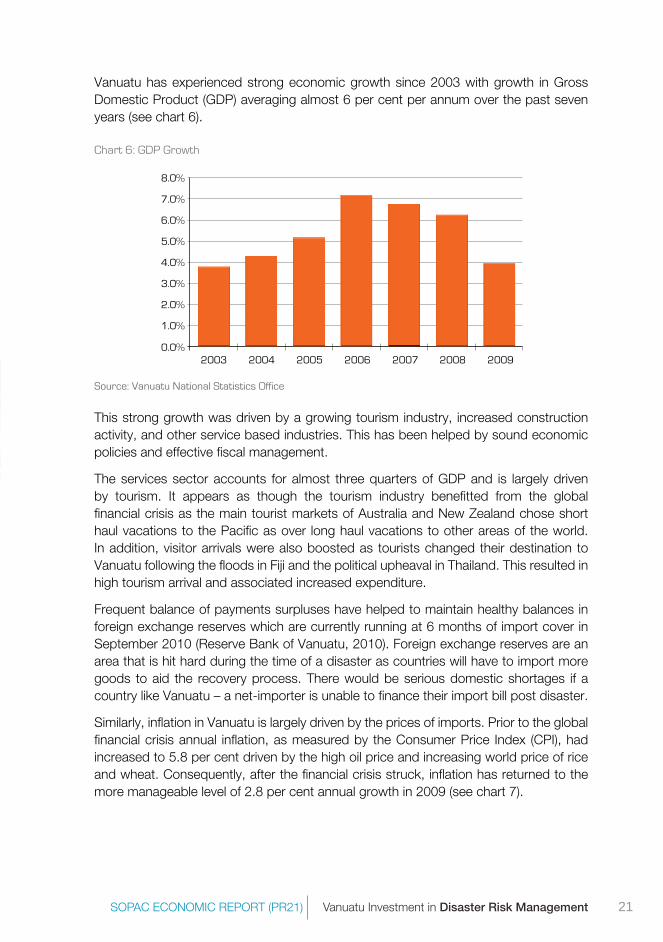
Vanuatu has experienced strong economic growth since 2003 with growth in Gross Domestic Product (GDP) averaging almost 6 per cent per annum over the past seven years (see chart 6).
Chart 6: GDP Growth
Source: Vanuatu National Statistics Office
This strong growth was driven by a growing tourism industry, increased construction activity, and other service based industries. This has been helped by sound economic policies and effective fiscal management.
The services sector accounts for almost three quarters of GDP and is largely driven by tourism. It appears as though the tourism industry benefitted from the global financial crisis as the main tourist markets of Australia and New Zealand chose short haul vacations to the Pacific as over long haul vacations to other areas of the world. In addition, visitor arrivals were also boosted as tourists changed their destination to Vanuatu following the floods in Fiji and the political upheaval in Thailand. This resulted in high tourism arrival and associated increased expenditure.
Frequent balance of payments surpluses have helped to maintain healthy balances in foreign exchange reserves which are currently running at 6 months of import cover in September 2010 (Reserve Bank of Vanuatu, 2010). Foreign exchange reserves are an area that is hit hard during the time of a disaster as countries will have to import more goods to aid the recovery process. There would be serious domestic shortages if a country like Vanuatu – a net-importer is unable to finance their import bill post disaster.
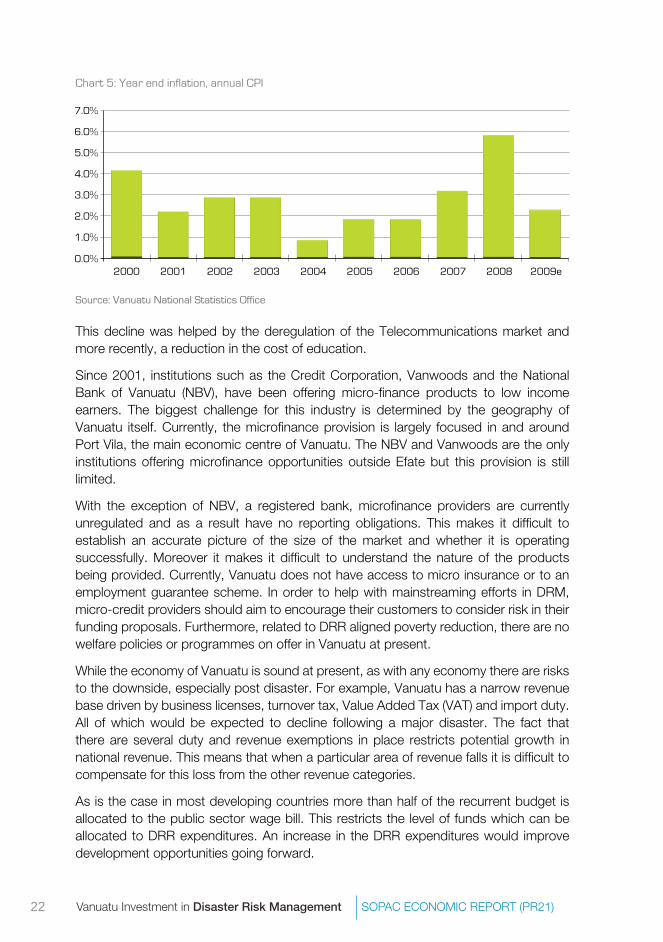
Similarly, inflation in Vanuatu is largely driven by the prices of imports. Prior to the global financial crisis annual inflation, as measured by the Consumer Price Index (CPI), had increased to 5.8 per cent driven by the high oil price and increasing world price of rice and wheat. Consequently, after the financial crisis struck, inflation has returned to the more manageable level of 2.8 per cent annual growth in 2009 (see chart 7).
1.0%
0.0%2003 2004 2005 2006 20082007 2009
2.0%
3.0%
4.0%
5.0%
6.0%
7.0%
8.0%
22 Vanuatu investment in Disaster Risk Management SOPAC ECOnOmiC REPORt (PR21)
Source: Vanuatu National Statistics Office
This decline was helped by the deregulation of the Telecommunications market and more recently, a reduction in the cost of education.
Since 2001, institutions such as the Credit Corporation, Vanwoods and the National Bank of Vanuatu (NBV), have been offering micro-finance products to low income earners. The biggest challenge for this industry is determined by the geography of Vanuatu itself. Currently, the microfinance provision is largely focused in and around Port Vila, the main economic centre of Vanuatu. The NBV and Vanwoods are the only institutions offering microfinance opportunities outside Efate but this provision is still limited.
With the exception of NBV, a registered bank, microfinance providers are currently unregulated and as a result have no reporting obligations. This makes it difficult to establish an accurate picture of the size of the market and whether it is operating successfully. Moreover it makes it difficult to understand the nature of the products being provided. Currently, Vanuatu does not have access to micro insurance or to an employment guarantee scheme. In order to help with mainstreaming efforts in DRM, micro-credit providers should aim to encourage their customers to consider risk in their funding proposals. Furthermore, related to DRR aligned poverty reduction, there are no welfare policies or programmes on offer in Vanuatu at present.
While the economy of Vanuatu is sound at present, as with any economy there are risks to the downside, especially post disaster. For example, Vanuatu has a narrow revenue base driven by business licenses, turnover tax, Value Added Tax (VAT) and import duty. All of which would be expected to decline following a major disaster. The fact that there are several duty and revenue exemptions in place restricts potential growth in national revenue. This means that when a particular area of revenue falls it is difficult to compensate for this loss from the other revenue categories.
As is the case in most developing countries more than half of the recurrent budget is allocated to the public sector wage bill. This restricts the level of funds which can be allocated to DRR expenditures. An increase in the DRR expenditures would improve development opportunities going forward.
1.0%
0.0%2000 2001 2002 20052003 2006 20082004 2007 2009e
2.0%
3.0%
4.0%
5.0%
6.0%
7.0%
Chart 5: Year end inflation, annual CPI
SOPAC ECOnOmiC REPORt (PR21) Vanuatu investment in Disaster Risk Management
Potential Losses
image courtesy of Samantha Cook
23
24 Vanuatu investment in Disaster Risk Management SOPAC ECOnOmiC REPORt (PR21)
It is critical for Governments to consider indirect losses to the economy as well as the direct damages resulting from disasters. Currently across the Pacific, only direct damages are assessed and little is done to try and estimate the economic losses resulting from a given hazard which can often be of greater cost to the community.
The United Nations Economic Commission for Latin America and the Caribbean (UNECLAC) have developed a Damage and Loss Assessment (DALA) methodology define direct damage as that which refers to damage to property that occurs as a direct result of the natural disaster. In some cases of damage, the damaged asset must be demolished before re-construction work can commence. The demolition is also considered to be a part of direct damage.
Indirect losses come from the loss of production flows of goods or services and income that result from a natural disaster. Indirect damage includes the increased cost of provision of goods and services that result from the disaster. The added cost of operation is reflected in higher fuel bills for automobiles, greater transportation and maintenance costs and the loss of rental incomes accruing to landowners who suffered loss. Consequently, indirect damage may be measurable for some time after the disaster. Indirect effects should be added to direct damage to obtain the total cost of the disaster.
Consider the example of a hotel that has been damaged or even destroyed as a result of a hazardous event. First, the damage should be assessed and reconstruction costs to return the hotel to its pre-disaster condition should be estimated. Second, economic losses would arise from the closure of the hotel as the result of a hazardous event. The hotel would be closed during the rebuild phase, incurring economic losses from lost revenue as well as the foregone wages for the staff who cannot return to work during the rebuild phase. Additionally, the hotel would possibly incur the cost of making alternative housing arrangements for staff that normally live on-site. Such losses would then pose a secondary tier of indirect effects to the Government through foregone tax revenue while the staff and the business are no longer liable for income5 and corporate tax, respectively. The rebuild could also pose inflationary problems for the economy as when the hotel re-opens the expense of the rebuild will undoubtedly be passed on to the consumer.
5 It should be noted that there is no income tax in Vanuatu at present.
SOPAC ECOnOmiC REPORt (PR21) Vanuatu investment in Disaster Risk Management
Demonstrating Losses
image courtesy of Samantha Cook
25
26 Vanuatu investment in Disaster Risk Management SOPAC ECOnOmiC REPORt (PR21)
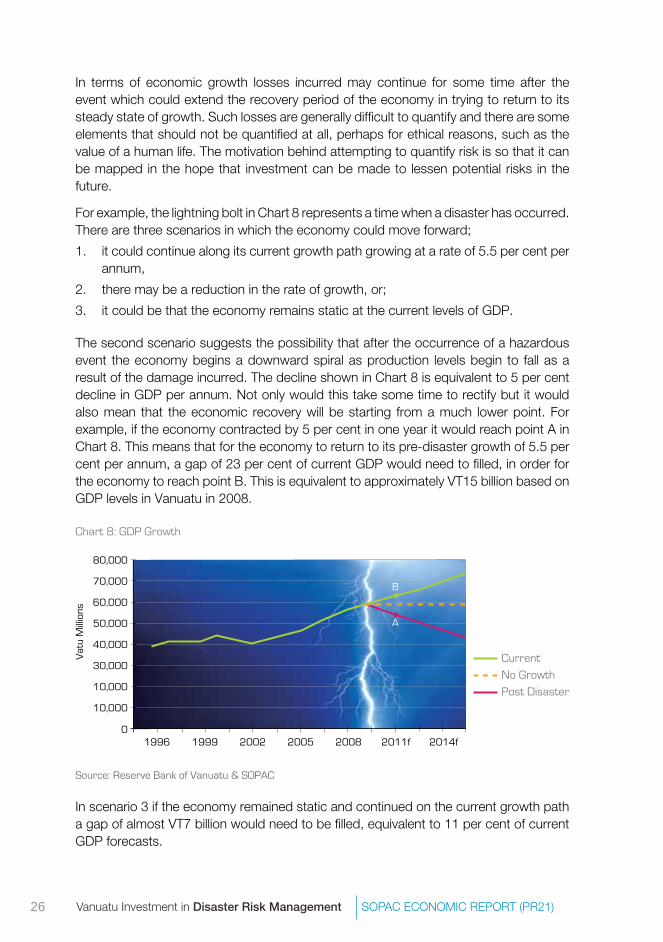
In terms of economic growth losses incurred may continue for some time after the event which could extend the recovery period of the economy in trying to return to its steady state of growth. Such losses are generally difficult to quantify and there are some elements that should not be quantified at all, perhaps for ethical reasons, such as the value of a human life. The motivation behind attempting to quantify risk is so that it can be mapped in the hope that investment can be made to lessen potential risks in the future.
For example, the lightning bolt in Chart 8 represents a time when a disaster has occurred. There are three scenarios in which the economy could move forward;
1. it could continue along its current growth path growing at a rate of 5.5 per cent per annum,
2. there may be a reduction in the rate of growth, or;
3. it could be that the economy remains static at the current levels of GDP.
The second scenario suggests the possibility that after the occurrence of a hazardous event the economy begins a downward spiral as production levels begin to fall as a result of the damage incurred. The decline shown in Chart 8 is equivalent to 5 per cent decline in GDP per annum. Not only would this take some time to rectify but it would also mean that the economic recovery will be starting from a much lower point. For example, if the economy contracted by 5 per cent in one year it would reach point A in Chart 8. This means that for the economy to return to its pre-disaster growth of 5.5 per cent per annum, a gap of 23 per cent of current GDP would need to filled, in order for the economy to reach point B. This is equivalent to approximately VT15 billion based on GDP levels in Vanuatu in 2008.
Chart 8: GDP Growth
Source: Reserve Bank of Vanuatu & SOPAC
In scenario 3 if the economy remained static and continued on the current growth path a gap of almost VT7 billion would need to be filled, equivalent to 11 per cent of current GDP forecasts.
10,000
01996 1999 2002 2005 2011f2008 2014f
10,000
30,000
40,000
Vat
u M
illio
ns
50,000
60,000
70,000
80,000
Current
No Growth
Post Disaster
B
A
27SOPAC ECOnOmiC REPORt (PR21) Vanuatu investment in Disaster Risk Management
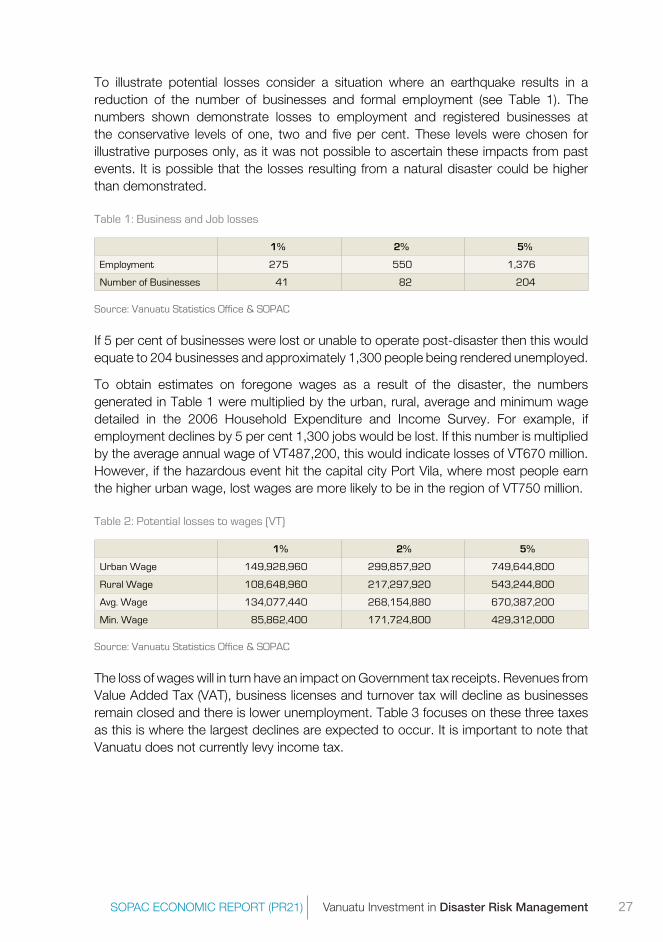
To illustrate potential losses consider a situation where an earthquake results in a reduction of the number of businesses and formal employment (see Table 1). The numbers shown demonstrate losses to employment and registered businesses at the conservative levels of one, two and five per cent. These levels were chosen for illustrative purposes only, as it was not possible to ascertain these impacts from past events. It is possible that the losses resulting from a natural disaster could be higher than demonstrated.
Table 1: Business and Job losses
1% 2% 5%
Employment 275 550 1,376
Number of Businesses 41 82 204
Source: Vanuatu Statistics Office & SOPAC
If 5 per cent of businesses were lost or unable to operate post-disaster then this would equate to 204 businesses and approximately 1,300 people being rendered unemployed.
To obtain estimates on foregone wages as a result of the disaster, the numbers generated in Table 1 were multiplied by the urban, rural, average and minimum wage detailed in the 2006 Household Expenditure and Income Survey. For example, if employment declines by 5 per cent 1,300 jobs would be lost. If this number is multiplied by the average annual wage of VT487,200, this would indicate losses of VT670 million. However, if the hazardous event hit the capital city Port Vila, where most people earn the higher urban wage, lost wages are more likely to be in the region of VT750 million.
Table 2: Potential losses to wages (VT)
1% 2% 5%
Urban Wage 149,928,960 299,857,920 749,644,800
Rural Wage 108,648,960 217,297,920 543,244,800
Avg. Wage 134,077,440 268,154,880 670,387,200
Min. Wage 85,862,400 171,724,800 429,312,000
Source: Vanuatu Statistics Office & SOPAC
The loss of wages will in turn have an impact on Government tax receipts. Revenues from Value Added Tax (VAT), business licenses and turnover tax will decline as businesses remain closed and there is lower unemployment. Table 3 focuses on these three taxes as this is where the largest declines are expected to occur. It is important to note that Vanuatu does not currently levy income tax.
28 Vanuatu investment in Disaster Risk Management SOPAC ECOnOmiC REPORt (PR21)
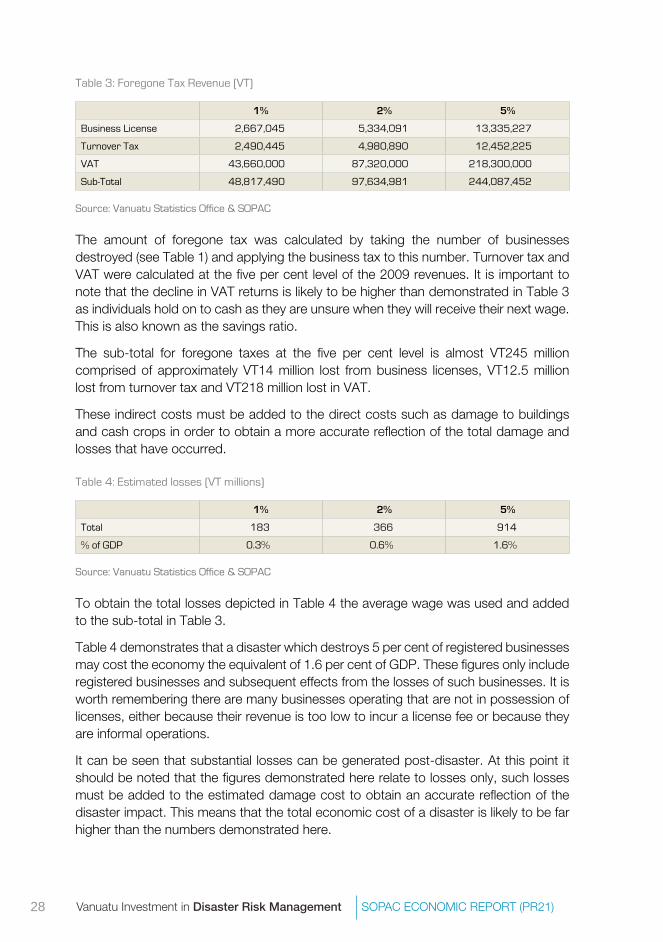
Table 3: Foregone Tax Revenue (VT)
1% 2% 5%
Business License 2,667,045 5,334,091 13,335,227
Turnover Tax 2,490,445 4,980,890 12,452,225
VAT 43,660,000 87,320,000 218,300,000
Sub-Total 48,817,490 97,634,981 244,087,452
Source: Vanuatu Statistics Office & SOPAC
The amount of foregone tax was calculated by taking the number of businesses destroyed (see Table 1) and applying the business tax to this number. Turnover tax and VAT were calculated at the five per cent level of the 2009 revenues. It is important to note that the decline in VAT returns is likely to be higher than demonstrated in Table 3 as individuals hold on to cash as they are unsure when they will receive their next wage. This is also known as the savings ratio.
The sub-total for foregone taxes at the five per cent level is almost VT245 million comprised of approximately VT14 million lost from business licenses, VT12.5 million lost from turnover tax and VT218 million lost in VAT.
These indirect costs must be added to the direct costs such as damage to buildings and cash crops in order to obtain a more accurate reflection of the total damage and losses that have occurred.
Table 4: Estimated losses (VT millions)
1% 2% 5%
Total 183 366 914
% of GDP 0.3% 0.6% 1.6%
Source: Vanuatu Statistics Office & SOPAC
To obtain the total losses depicted in Table 4 the average wage was used and added to the sub-total in Table 3.
Table 4 demonstrates that a disaster which destroys 5 per cent of registered businesses may cost the economy the equivalent of 1.6 per cent of GDP. These figures only include registered businesses and subsequent effects from the losses of such businesses. It is worth remembering there are many businesses operating that are not in possession of licenses, either because their revenue is too low to incur a license fee or because they are informal operations.
It can be seen that substantial losses can be generated post-disaster. At this point it should be noted that the figures demonstrated here relate to losses only, such losses must be added to the estimated damage cost to obtain an accurate reflection of the disaster impact. This means that the total economic cost of a disaster is likely to be far higher than the numbers demonstrated here.
SOPAC ECOnOmiC REPORt (PR21) Vanuatu investment in Disaster Risk Management
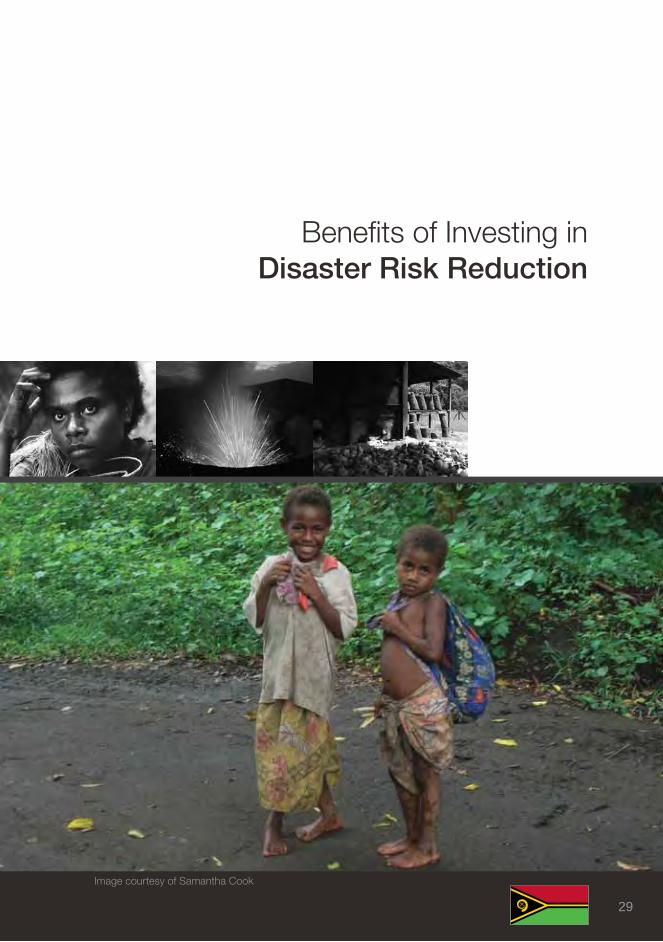
Benefits of investing in Disaster Risk Reduction
image courtesy of Samantha Cook
29
30 Vanuatu investment in Disaster Risk Management SOPAC ECOnOmiC REPORt (PR21)
The costs of any disaster can be reduced by investing in DRR measures such as the implementation of building codes and early warning systems. For example, in the Cayman Islands following Hurricanes Gilbert and Mitch both in 1998 the preparedness and community resilience was improved. The Government made changes in the rules and governance of hurricane risk accompanied by changes in the early warning systems. As a result the economic and ecological impacts of hurricane Ivan in 2004 were reduced (Adger et al 2005).
According to the World Bank and the US Geological Survey, if $40 billion had been invested in DRR type measures such as ensuring adequate design of buildings, then $280 billion of economic losses worldwide from natural disasters would have been avoided in the 1990s (World Bank, 2006).
It is estimated that the $3.15 billion expenditure on flood control measures in China over a forty year period helped to avoid losses in the region of $12 billion (World Bank, 2004).
Investments in DRR would help to reduce the direct costs for reconstruction and recovery to the Government of Vanuatu such as the VT104 million that was appropriated in 2009 in response to several disasters. Investing in risk reduction would also help reduce those losses which are larger and more difficult to measure and have greater impacts on development of the country such as the loss of employment or foregone tax revenue in terms of corporate tax, duty and VAT to be paid to the Government.
It is important that risk reduction projects in Vanuatu continue in order to reduce the damage and losses from future disasters. This is why it is recommended that the existing disaster fund of VT25 million be expanded for both risk reduction and disaster management purposes.
31SOPAC ECOnOmiC REPORt (PR21) Vanuatu investment in Disaster Risk Management
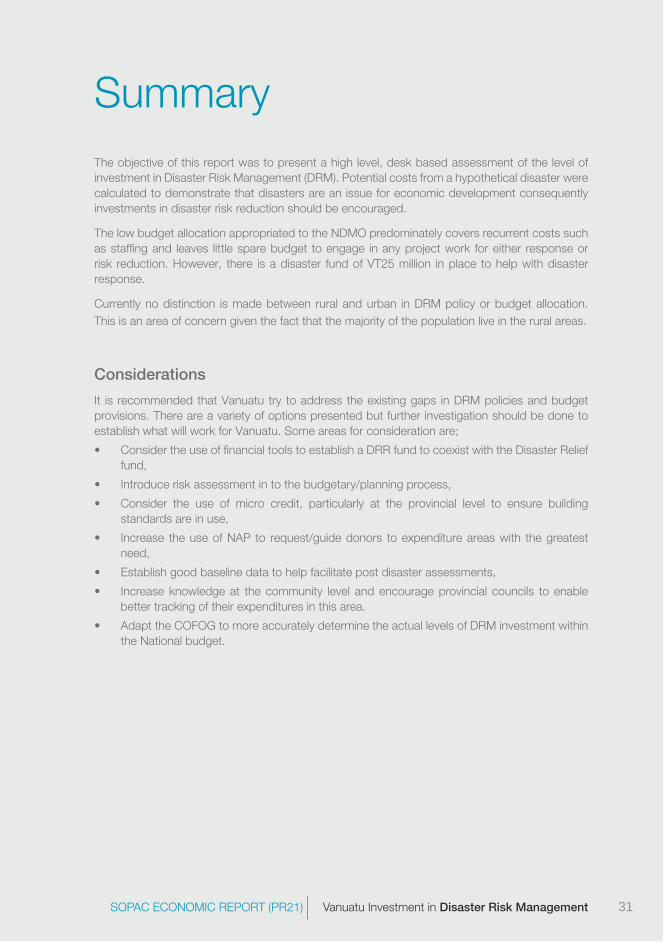
The objective of this report was to present a high level, desk based assessment of the level of investment in Disaster Risk Management (DRM). Potential costs from a hypothetical disaster were calculated to demonstrate that disasters are an issue for economic development consequently investments in disaster risk reduction should be encouraged.
The low budget allocation appropriated to the NDMO predominately covers recurrent costs such as staffing and leaves little spare budget to engage in any project work for either response or risk reduction. However, there is a disaster fund of VT25 million in place to help with disaster response.
Currently no distinction is made between rural and urban in DRM policy or budget allocation. This is an area of concern given the fact that the majority of the population live in the rural areas.
Considerations
It is recommended that Vanuatu try to address the existing gaps in DRM policies and budget provisions. There are a variety of options presented but further investigation should be done to establish what will work for Vanuatu. Some areas for consideration are;
• ConsidertheuseoffinancialtoolstoestablishaDRRfundtocoexistwiththeDisasterRelieffund,
• Introduceriskassessmentintothebudgetary/planningprocess,
• Consider the use of micro credit, particularly at the provincial level to ensure buildingstandards are in use,
• Increase theuseofNAP to request/guidedonors toexpenditureareaswith thegreatestneed,
• Establishgoodbaselinedatatohelpfacilitatepostdisasterassessments,
• Increaseknowledgeat thecommunity level andencourageprovincial councils toenablebetter tracking of their expenditures in this area.
• AdapttheCOFOGtomoreaccuratelydeterminetheactuallevelsofDRMinvestmentwithinthe National budget.
Summary
32 Vanuatu investment in Disaster Risk Management SOPAC ECOnOmiC REPORt (PR21)
ConclusionWhile Vanuatu has taken some significant steps, such as the establishment of a Disaster Relief fund of VT25 million, there is still more that could be done to assist with preparedness and to make future development less susceptible to disasters.
In the past disaster costs have exceed the annual allocations for DRM expenditures allocated from central Government. It is hoped that with the introduction of COFOG classifications that DRM expenditures will become more transparent. If risk considerations are embedded in to the budgetary and planning processes the costs of future disasters will be reduced. Consequently, this will enable economic development to stabilise as the recovery period post disaster is shortened.
33SOPAC ECOnOmiC REPORt (PR21) Vanuatu investment in Disaster Risk Management
Adger et al (2005) “Social-Ecological Resilience to Coastal Disasters” 12 August 2005, Vol 39, Science www.sciencemag.org
Davidson,A (2010), Vanuatu national Action Plan for Disaster Risk management An independent Progress Review, Pacific islands Applied Geoscience Commission (SOPAC), Suva.
Desinventar http://online.desinventar.org/desinventar/?r=VUt-1250695628-disaster_database_of_the_republic_of_vanuatu&lang=eng
Dow, K. and Downing, t.E. (2007): the Atlas of Climate Change mapping the World’s Greatest Challenge. Brighton, UK. University of California Press.
Em-DAt: the OFDA/CRED international Disaster Database www.emdat.be - Université Catholique de Louvain - Brussels – Belgium.
ELCAC (2003), Handbook for estimating the socio-economic and environmental impacts of disasters, UnECLAC, iBRD and the World Bank.
Government of Vanuatu, national Action Plan for Disaster Risk management (2006- 2016), Vanuatu and Pacific islands Applied Geosciences Commission (SOPAC), Suva.
Household Expenditure Survey, 2006. Port Vila: Vanuatu national Statistics Office.
iPCC (2007)Climate Change2007: impacts, Adaptation and Vulnerability. Contribution of Working Group ii to the Fourth Assessment Report of the iPCC (intergovernmental Panel on Climate Change). in Parry, m.L., Canziani, O.F., Palutikof,J.P., Linden, P.J. v.d. and Hanson, C.E. (Eds) Fourth Asessement Report of the iPCC. Cambridge, UK. Cambridge University Press.
Reserve Bank of Vanuatu (2010), Quarterly Economic Review September 2010.
Pacific islands Applied Geoscience Commission, 2005. A Framework for Action 2005-2015: Building the Resilience of nations and Communities to Disasters, Pacific islands Applied Geoscience Commission (SOPAC), Suva.
United nations international Strategy for Disaster Reduction, 2005. Hyogo Framework for Action 2005-2015: Building the Resilience of nations and Communities to Disasters, United nations international Strategy for Disaster Reduction, Hyogo.
World Bank (2004), natural Disasters : counting the cost, feature story march 2004, www.worldbank.org
World Bank (2005) “natural Disaster Hotspots: A Global Risk Analysis” iBRD, WB and Columbia University, Washington.
References

34 Vanuatu investment in Disaster Risk Management SOPAC ECOnOmiC REPORt (PR21)34
35SOPAC ECOnOmiC REPORt (PR21) Vanuatu investment in Disaster Risk Management
36 Vanuatu investment in Disaster Risk Management SOPAC ECOnOmiC REPORt (PR21)
Applied Geoscience and technology Division (SOPAC)Private mail BagGPO SuvaFiji islandstelephone: (679) 338 1377Fax: (679) 337 0040E-mail: [email protected] site: http://www.sopac.org