Embed Size (px)
Citation preview

Disaster Research Center
Havidan RodríguezJenniffer Santos-Hernández,
Walter DíazWilliam Donner
Disaster Research Center (DRC) University of Delaware
Technology, Society & Severe Weather Events:Developing Integrated Warning Systems
This work was supported by the Engineering Research Centers (ERC) Program of the National Science Foundation under NSF Cooperative Agreement No. EEC-0313747. Any opinions, findings and conclusions, or recommendations expressed in this material are
those of the authors and do not necessarily reflect those of the National Science Foundation.

Engineering Research Center (ERC)for Collaborative Adaptive Sensing
of the Atmosphere (CASA)
“Revolutionize our ability to observe the lower troposphere through Distributed Collaborative Adaptive Sensing (DCAS), vastly improving our ability to detect, understand, and predict severe storms, floods, and other atmospheric and airborne hazards”
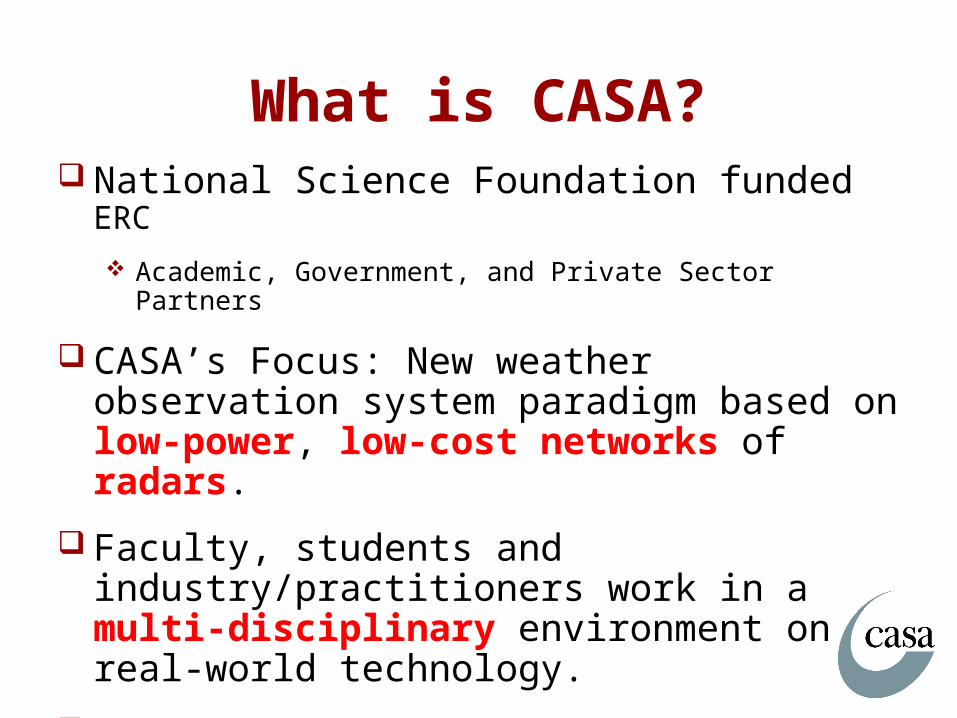
What is CASA? National Science Foundation funded ERC
Academic, Government, and Private Sector Partners
CASA’s Focus: New weather observation system paradigm based on low-power, low-cost networks of radars.
Faculty, students and industry/practitioners work in a multi-disciplinary environment on real-world technology.
Year 6 of a 10-year research project

Understanding how CASA Systems Impact Warning and Response
NWS
Media
EMs
Cyril
Rush
Springs
Chickasha
LawtonPublic

End-User Team Objectives Incorporate end-user needs into the system
design from day one
Identify users’ perceptions:
advantages & limitations of current weather observation and warning systems
how the media and public perceive, understand, and respond to weather forecasts and warning information
Policy determinations and enhancing weather technology

Background or Context
CASA Social Scientists are focusing their research efforts on examining how improved forecasting can reduce the exposure and vulnerability of individuals and property to every-day and extreme weather events
Through the use of field research, focus groups, in-depth interviews, and surveys, we are examining how the end-user community, particularly emergency managers and the general public, access, utilize, and respond to weather forecasts
Use of both qualitative and quantitative approaches

Research on Tornado Warnings Warning Process (Donner, 2007: Modified
from Mileti and Sorenson, 1990): Hearing the warning Believing the warning is credible Understanding the warning Confirming that the threat does exist Personalizing the warning and confirming that others
are heeding it Determining whether protective action is needed Determining whether protective action is feasible Determining what action to take and taking it

Qualitative Analysis Oklahoma emergency managers’ and NWS
meteorologists’, spotters’ knowledge, perceptions, and attitudes regarding severe weather events warnings
Advantages, problems and limitations of current weather technology perceived by end-users and others in Oklahoma
Data collection:
Structured surveys (n = 72) In-depth interviews (n = 50)

Qualitative Analysis Quick response research on tornadoes (n =
50)
New Orleans Missouri Tennessee
Data from case-study tornado scenarios in Oklahoma
Lawton Minco Arnett
Quick response research in Louisiana and Mississippi to observe the effects of Hurricane Katrina on communities

Quantitative Approach:Objectives
Explore and describe public response and the household decision making process following a severe weather warning or a hazard event: actual response
Computer Assisted Telephone Interviewing (CATI): Survey exploring public response to four (4) severe weather warning/events in communities in Kansas, Minnesota, Oklahoma, and Illinois in 2008
Quantitative and predictive models, which are based on extensive qualitative research with emergency managers and the general public following severe weather events

Questionnaire 127 questions in total yielding about 429 variables:
Severe storm/tornado impact Confirmation/verification Sources of information Communication Protective action, including seeking shelter Damage to property Insurance coverage Lead time, watch, warnings, false alarms Previous experience with hazards Perceptions/trust Preparedness Demographic and socio-economic variables Disabilities

Oklahoma June 5, 2008, 11:50 AM: NWS
issued a tornado watch for parts of central Kansas and northwest Oklahoma
10:00PM: Tornado warning for Northwest Arkansas and Eastern Oklahoma
11:51PM: Line of storms moved to central Okmulgee county and southwest Tulsa county. Winds measuring up to eighty miles per hour in southwest Tulsa County
No tornado touchdown (“False Alarm”)
No fatalities or injuries Outages for 19,611 Oklahoma
Gas and Electric customers (47,400 statewide) and numerous downed power lines
Source: NOAA’s National Weather Service Storm Prediction Center. “Tornado Watch 471.” June 5, 2008. <http://www.spc.noaa.gov/products/watch/ww0471.html>

Kansas June, 11, 2008, 10:00PM: Two
super-cell thunderstorms caused 4 tornadoes and extensive damage across northeast Kansas
The second tornado (F4)
Manhattan, Kansas
About $27 million worth of damages to Kansas State University
Destroyed 47 homes and 3 businesses; major damage to over 70 homes and 10 businesses
Source: National Oceanic and Atmospheric Administration (NOAA). 2008. NOAA National Weather Service Weather Forecast Office in Topeka, KS. “Tornadoes Strike Northeast Kansas.” June 11. Retrieved November 3, 2008. (http://www.crh.noaa.gov/top/?n=11june2008.)

Minnesota July 11, 2008: Squall line of thunderstorms formed and
tracked across Minnesota; several individual super cell-like thunderstorms developed
6:36PM: NWS issued a tornado warning for NE Kandiyohi County
Two minor injuries and no fatalities
Eleven homes and three businesses were affected by the tornado
Sources: National Oceanic and Atmospheric Administration (NOAA). 2008. NOAA National Weather Service Weather Forecast Office in Willmar, MN and FOX News. Retrieved November 3, 2008. (www. crh.noaa.gov/images/mpx/71108_1.JPG and http://www.foxnews.com/story/0,2933,381221,00.html)

Illinois August 4-5, 2008: Ten tornados, ranging from F0 to F2,
were reported, of which 5 were confirmed for NW Indiana and N. Illinois
7:15PM: Watch in NE Illinois, NW Indiana, and SW Michigan
7:24PM: Tornado warning issued for Cook, DuPage, and Kane Counties in Illinois
8:01PM: Tornado reported by Emergency Management Office in DuPage County
8:14PM: Tornado warning issued for Cook County, Illinois, including Chicago
Two deaths
Damages to 25 homes
Power service interruptions to 288,000 residences
350 flight cancellations out of O’Hare International Airport

Illinois
Source: National Oceanic and Atmospheric Administration (NOAA). 2008. NOAA National Weather Service Weather Forecast Office in Chicago, IL. “August 4th Tornadoes and Damaging Winds (Updated Information).” August 15. Retrieved August 19, 2008.

Sample 268 interviews completed
23 in Tulsa County, Oklahoma
112 in Riley County, Kansas
76 in Kandiyohi County, Minnesota
57 in DuPage County, Illinois
Average duration of interviews: 35 minutes

Demographic Characteristics
Male Female Refused0.00%
10.00%
20.00%
30.00%
40.00%
50.00%
60.00%
70.00%
36.5%
63%
0.5%
Gender

Demographic Characteristics
18-24
25-34
35-44
45-54
55-64
65 and u
p0%
5%
10%
15%
20%
25%
30%
35%
40%
3%7%
10%
21%25%
35%
Age

Demographic Characteristics
90.5%
2%
1%
2% 2%2%
Racial Composition
White BlackPacific American
IndianOther Refused

Demographic Characteristics
Less
than $24,9
99
$25,000 to
$49,999
$50,000 to
$74,999
$75,000 to
$99,999
$100,000 to
$149,999
More th
an $150,000
0%
5%
10%
15%
20%
25%
30%
19%
25%23%
12%14%
7%
Annual Income

Where you in the area on the date of the event?
77.7%
22.3%
YesNo

Where you aware that a tornado or severe storm had been observed in the surrounding area before it got to your town?
Yes No Don’t know0.00%
10.00%
20.00%
30.00%
40.00%
50.00%
60.00%
70.00%
80.00%
90.00%
81.6%
13.3%
5.1%

Did you receive a warning or notification of a tornado or severe storm in your region?
No Yes Don’t Know0.00%
10.00%
20.00%
30.00%
40.00%
50.00%
60.00%
70.00%
80.00%
90.00%
100.00%
9.3%
85.8%
4.8%

From who did you receive this information?
53.8%
42.3%
Parents
Siblings
Friends
Neighbors
Fire Department
Emergency Manager
Hospital
Mass Media
Other: Siren

When you first found out a tornado or severe storm was present inside or near your town or city, about
how many minutes did it take before it hit your neighborhood? (Average = 27.9 minutes)
0_5 6_10 11_15 16_20 21_25 26_30 36+0.0%
5.0%
10.0%
15.0%
20.0%
25.0%
9.6%
22.9%
10.8%
14.5%
1.2%
20.5% 20.5%

Did the tornado sirens in your community go off?
Yes No There are no sirens
Don’t know0.00%
10.00%
20.00%
30.00%
40.00%
50.00%
60.00%
70.00%
80.00%
90.00%
80.4%
12%
2.5% 5.1%

Did you contact someone to confirm information about the impending tornado or severe storm?
Yes No0.00%
10.00%
20.00%
30.00%
40.00%
50.00%
60.00%
70.00%
80.00%
90.00%
17.1%
82.9%

Did you look outside to verify whether the tornado or severe storm was coming?
Yes No0.00%
10.00%
20.00%
30.00%
40.00%
50.00%
60.00%
70.00%
62.8%
37.2%
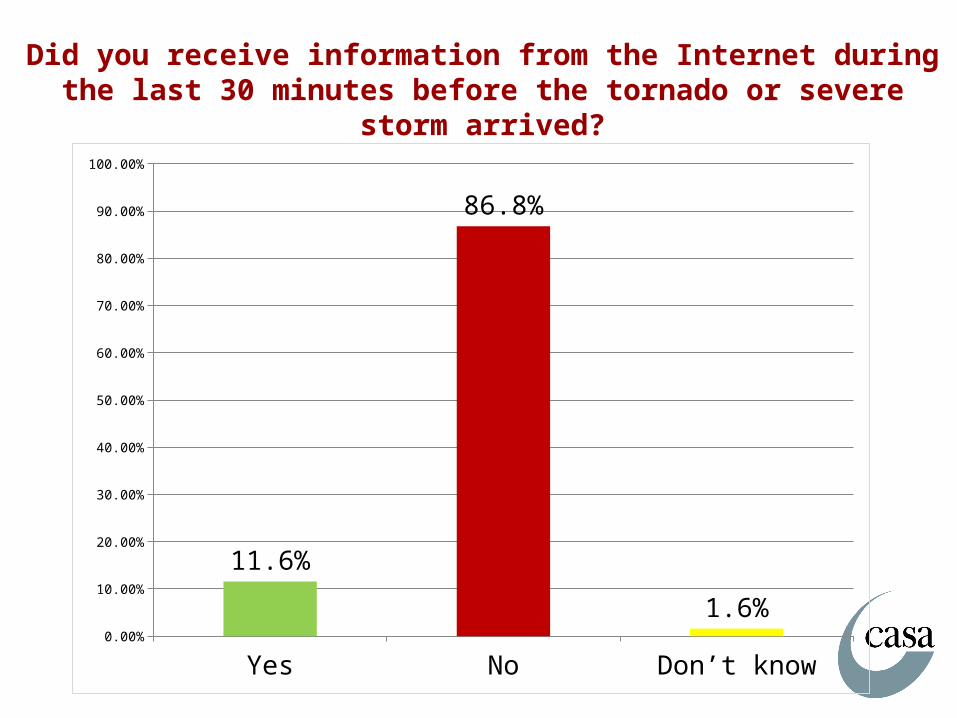
Did you receive information from the Internet during the last 30 minutes before the tornado or severe storm arrived?
Yes No Don’t know0.00%
10.00%
20.00%
30.00%
40.00%
50.00%
60.00%
70.00%
80.00%
90.00%
100.00%
11.6%
86.8%
1.6%

Why did you not receive information from the internet?
8%8.9%
2.7%
57.1%
9.8%
3.6%8.1% 1.8%
Power OutageDo not have access to the Internet Already seeking shelterComputer offNo access to computerEnough Information

Did you receive information from the TV during the last30 minutes before the tornado or severe storm arrived?
No Yes Don’t Know0.00%
10.00%
20.00%
30.00%
40.00%
50.00%
60.00%
70.00%
80.00%
90.00%
14.7%
84.4%
0.9%

After receiving the warning or notification, what did you do?
20.1
50.61.7
25.9
1.7 Continued what they were doing
Immediate Protective Action
Called and warned others
Sought more information
Other

Did you take any actions to protect yourself, your family, or your property from the hazard event?
Yes No0.00%
10.00%
20.00%
30.00%
40.00%
50.00%
60.00%
70.00%
64%
35.8%

Where did you take protective action?
86.1%
1.7%
12.2%
At home
Public Shelter
Somewhere else

What information led you to seek shelter?(n = 169)
0
10
20
30
40
50
60
163 0
56
18
54
417
1

NOAA Radio Ownership
66%
31%
2%1%
Do you own a NOAA weather radio?
No
Yes
Don’t know
Refused

70%
8%
3%4%
13% 2%
1 (Never)
2
3
4
5 (V. Frequently)
Don’t know
How often would you say you listen to a NOAA radio for information about
tornadoes or severe storms?

Tornado Watch & Warningand False Alarms
Respondents appear to have some difficulty understanding the differences between watches and warnings and what is a false alarm
Participants seem to understand that watches and warnings represent some type of danger, but they are unable to clearly differentiate between these two concepts

Watch Definition
40.00%
42.00%
44.00%
46.00%
48.00%
50.00%
52.00%
54.00%
56.00% 54.4%
45.6%

Watch Definitions: Sample I think the watch is the more dangerous one Same as a warning When the TV flashes yellow They put it up on the TV and tell you what time
it will be in your area and when to take shelter They feel like there’s one [tornado] in our
vicinity A tornado is on the ground near your house Tornado was been sighted in my area

Warning Definition
Agree
s w/ N
WS
defin
ition
Disag
rees
w/ N
WS
defin
ition
0.00%
10.00%
20.00%
30.00%
40.00%
50.00%
60.00%
70.00%
39.8%
60.2%

False Alarm Definition
Agree
s w/ N
WS
defin
ition
Disag
rees
w/ N
WS
defin
ition
0.00%
10.00%
20.00%
30.00%
40.00%
50.00%
60.00%
70.00%
80.00%
90.00%
21%
79%

In your opinion, how trustworthy are the weather forecasts provided in your region? (1 being “not trustworthy at all” to 5 “very trustworthy”)
1 2 3 4 5 Don’t know
0.00%
10.00%
20.00%
30.00%
40.00%
50.00%
60.00%
1% 3%
16%
27.8%
51%
1%

Next StepsContinue CATI Survey; expand sample size
Develop predictive models on protective action:Binary logistic model to predict protective
action following severe weather warning or a hazard event
Estimate the probability that the dependent variable will assume a certain value (e.g., take protective action or not) based on a number of independent variables

Technology matters, but what really matters is the application of the substantive knowledge that we generate regarding how individuals respond (or not) to severe weather events and how can we improve their response in order to minimize the devastating impacts associated with these events
Technology and Substantive Knowledge

Develop an integrated/holistic model to communicate risk and warnings, which takes into account:
the contributions of different disciplines: an interdisciplinary approach
the role of new and emerging technology
the role of the media
and the changing socio-economic and demographic characteristics of the general population

A Model for CommunicatingHazard Risk and Warnings*
Development Technology: Dissemination of information
Education/Training
Contacting/Networking: Organizational End-Users
Mass Media Political LeadersEmergency
Management Agencies
Industry
General Population
• Elderly• Handicapped
• Single Mothers• Racial/Ethnic Minorities
• Poor*Modified model based on Nigg’s (1995) Components of an Integrated Warning System.

We must actively engage end-users in identifying their risks, disaster planning and management, development of technology, and the communication process
We must respond to the needs, interests, and the limitations that end-users confront, if we are to achieve the desired outcome:
Reduction in the loss of life, injuries, and damage to property
Concluding Remarks

http://www.mind-mapping.co.uk/assets/examples/MM---Questions.gif