Embed Size (px)
Citation preview
MERMS16 L2
Dirty REMOTE SENSINGWeek 2
Interpreation
Stuart Green
Earthobservation.wordpress.com
MERMS16 L2
MERMS16 L2
AERIAL PHOTOGRAPHICINTERPRETATION
http://airphotos.nrcan.gc.ca/photos101/photos101_info_e.php
MERMS16 L2
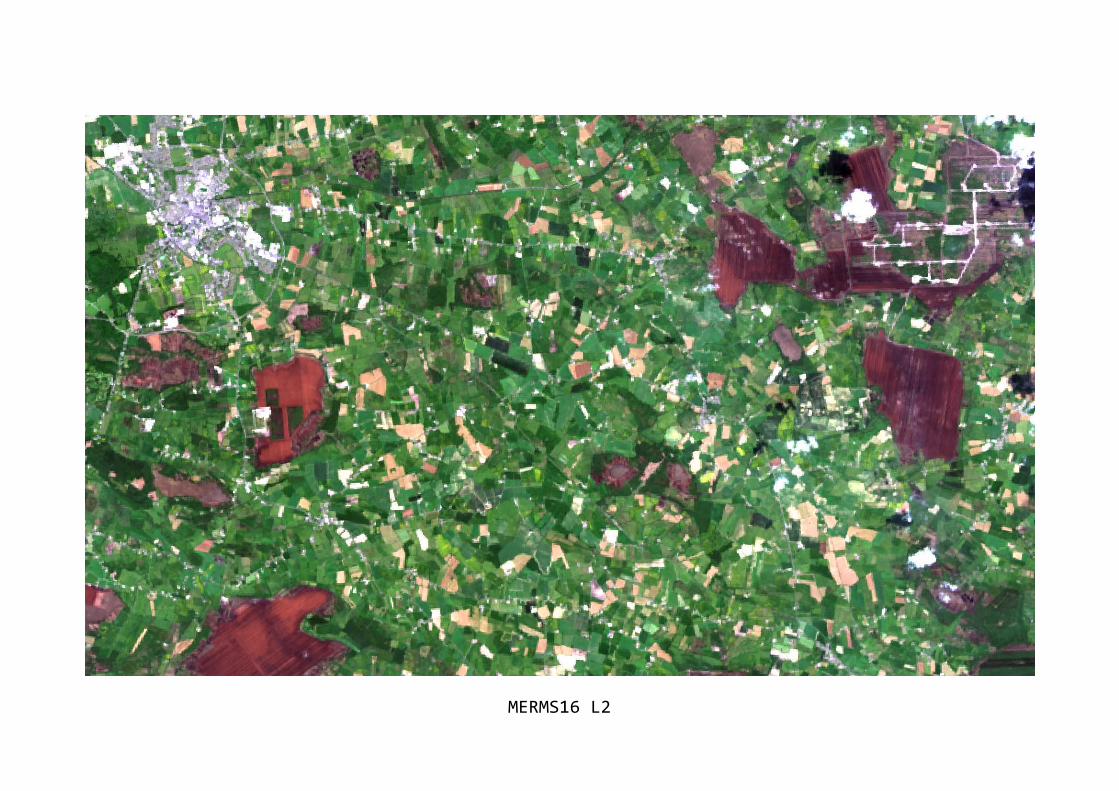
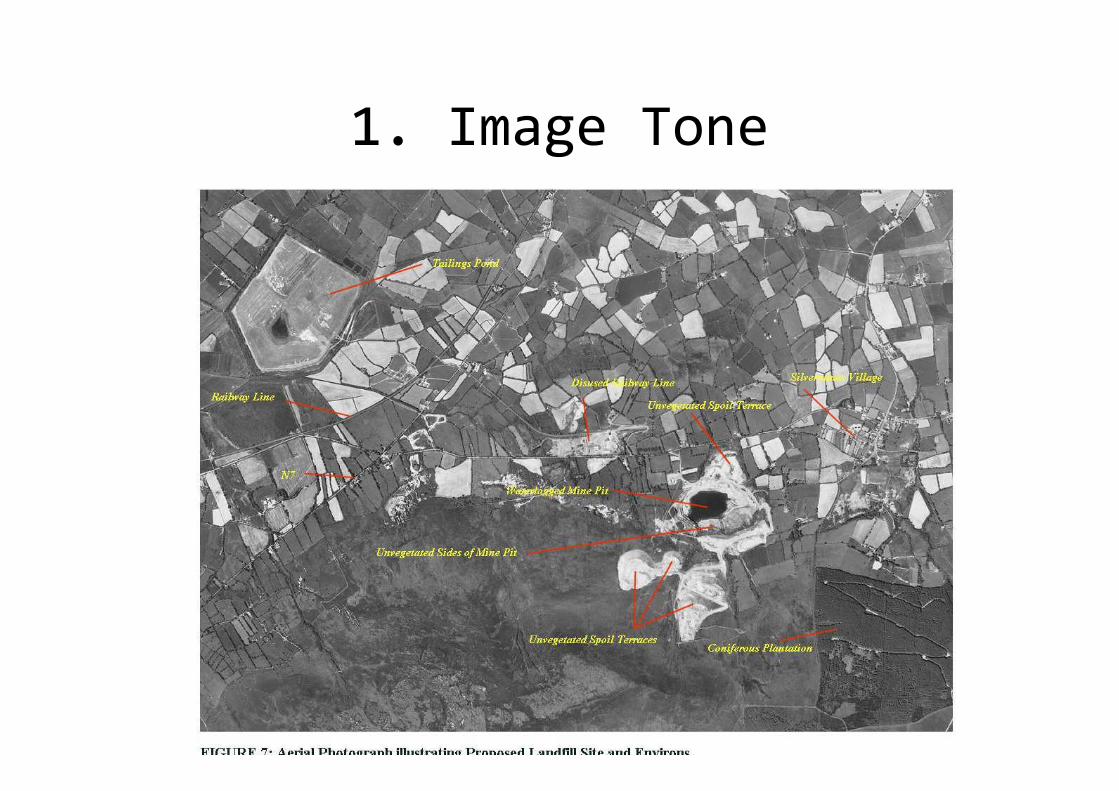
• Images of the earth are map like representations of theearth’s surface based on reflections of electromagneticenergy from vegetation, soil, water, rocks, andstructures.
• Yet such information is not presented to us directly-the information we seek is encoded in the various tonesand textures we see on the image.
• To translate images into information we must apply aspecialised knowledge-knowledge that forms the field ofimage interpretation, which we can apply to deriveuseful information from the raw, un-interpreted imageswe receive from remote sensing systems.
These definations are taken from Campbell 2002:http://books.google.com/books?id=VEFsebwUxDkC&printsec=fr
ontcover&source=gbs_navlinks_s#v=onepage&q=&f=false
MERMS16 L2
What are we looking for?• Knowledge of the subject :Accurateinterpretation requires familiaritywith the subject of theinterpretation.
• Image interpreters should beequipped with a broad range ofknowledge and experince across earthand biological sciences.
MERMS16 L2
• The Human Image ProcessingContinuum
• natural perception (looking) ->
abduction (hunch) ->
convention (experience/teaching)->cognitive (Understanding)
http://spot.colorado.edu/~moriarts/reprsntn.html
First Questions
• Where am I Looking?
• What system took the image?
• When was it taken?
MERMS16 L2
MERMS16 L2
Remember.
• (1) Remotely sensed imagery usually presentsan overhead view.
• (2) Many remote sensing images use radiationoutside the visible portion of the spectrum.
• (3) Remote sensing images often portray theearth’s surface at unfamiliar scales andresolutions.
MERMS16 L2
Elements
• Tone/Colour
• Size, Shape & Texture
• Pattern, Shaddow
• Location, Context
MERMS16 L2
1. Image Tone
MERMS16 L2
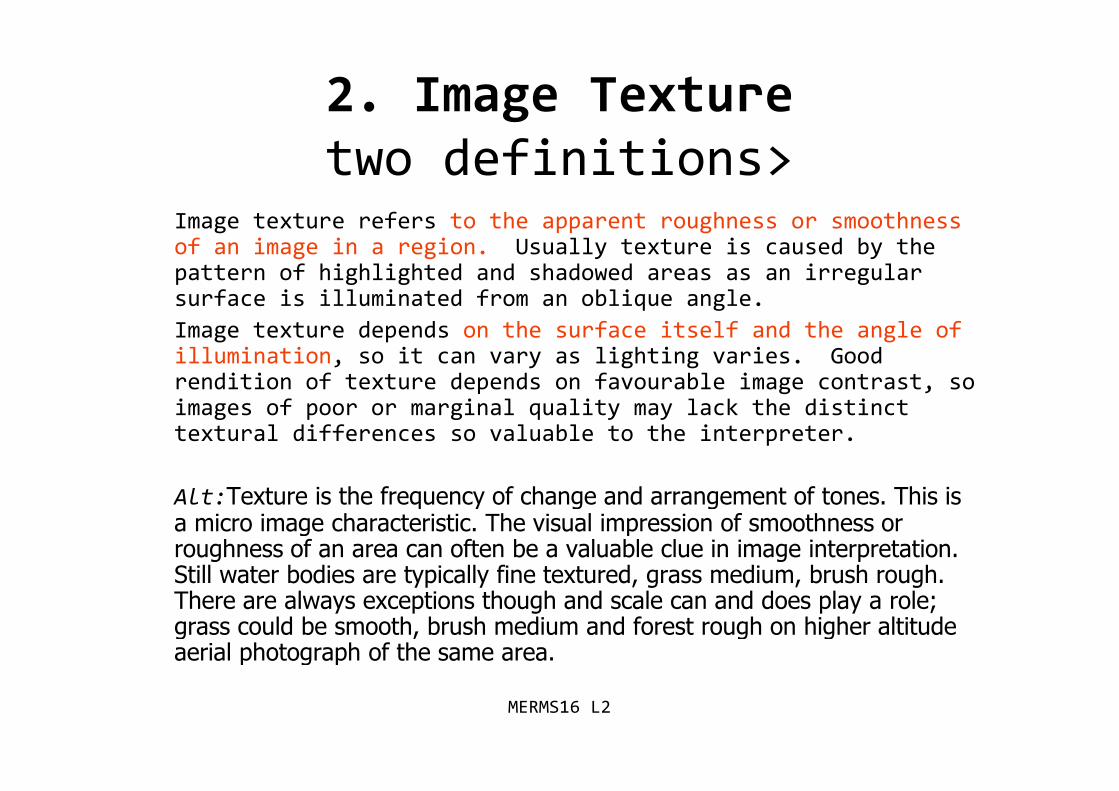
2. Image Texturetwo definitions>
Image texture refers to the apparent roughness or smoothnessof an image in a region. Usually texture is caused by thepattern of highlighted and shadowed areas as an irregularsurface is illuminated from an oblique angle.
Image texture depends on the surface itself and the angle ofillumination, so it can vary as lighting varies. Goodrendition of texture depends on favourable image contrast, soimages of poor or marginal quality may lack the distincttextural differences so valuable to the interpreter.
Alt:Texture is the frequency of change and arrangement of tones. This isa micro image characteristic. The visual impression of smoothness orroughness of an area can often be a valuable clue in image interpretation.Still water bodies are typically fine textured, grass medium, brush rough.There are always exceptions though and scale can and does play a role;grass could be smooth, brush medium and forest rough on higher altitudeaerial photograph of the same area.
MERMS16 L2
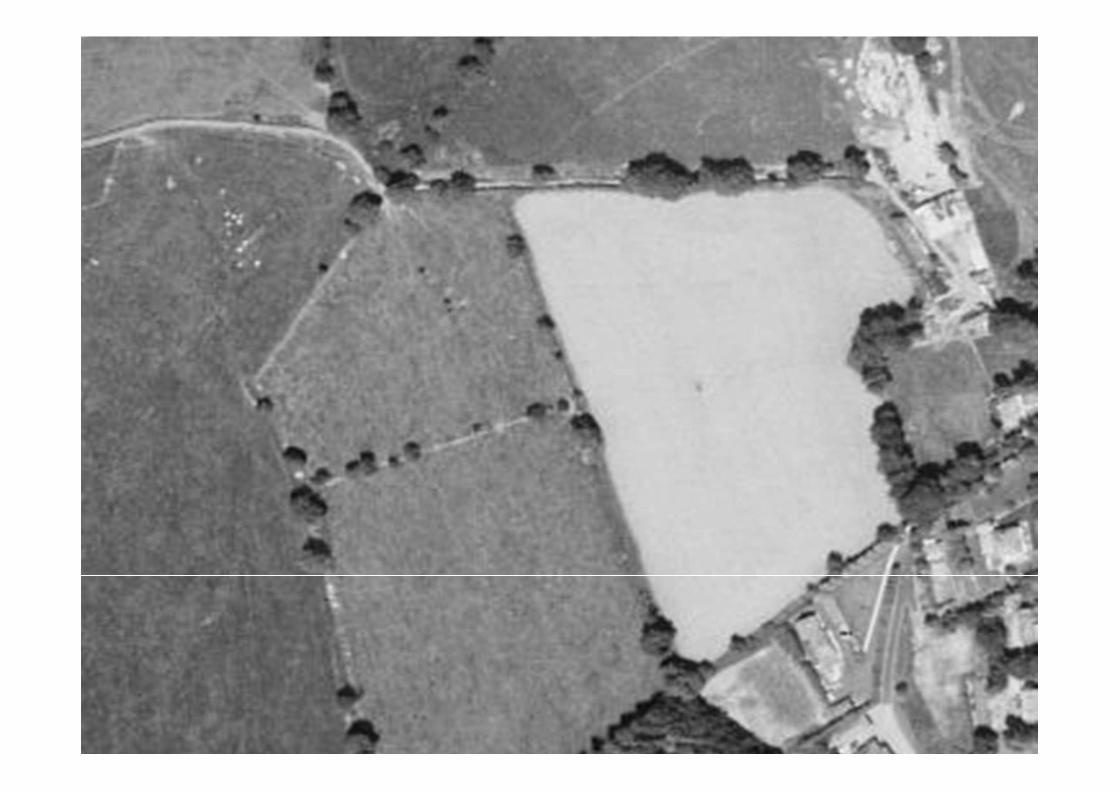
Image Texture
MERMS16 L2
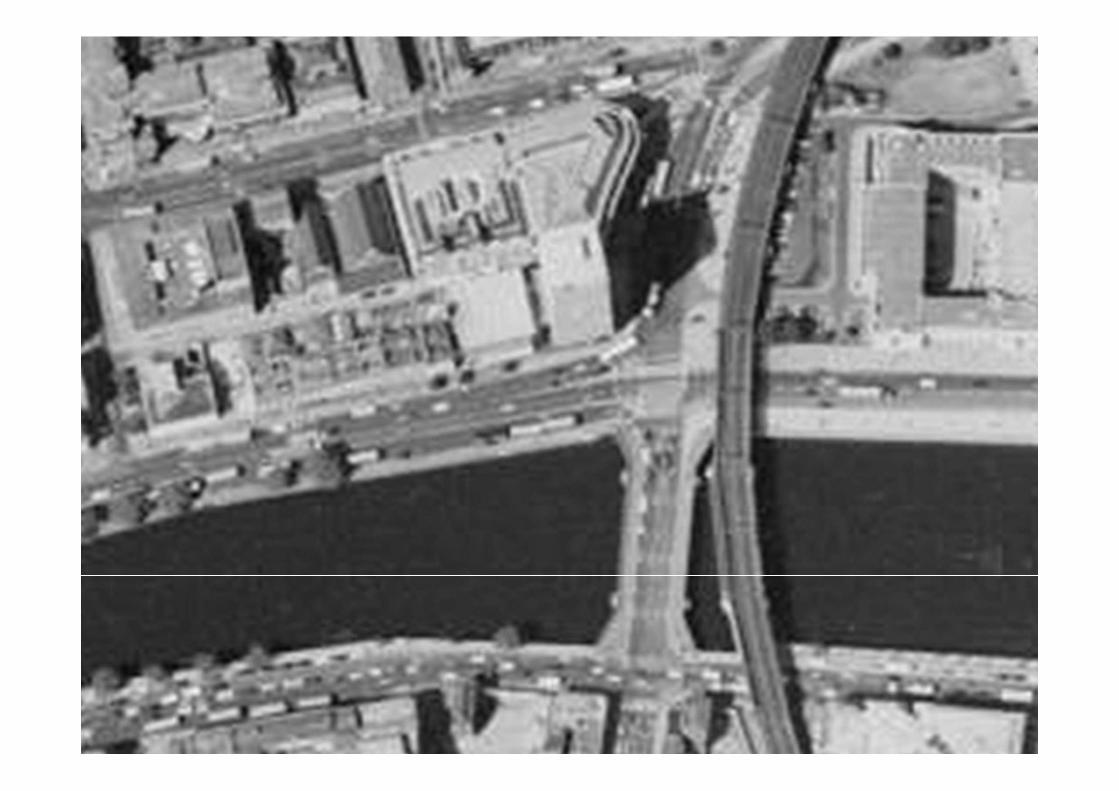
3. Shadow
• Shadow is crucial in telling usabout relative size and position
MERMS16 L2
Shadow
MERMS16 L2
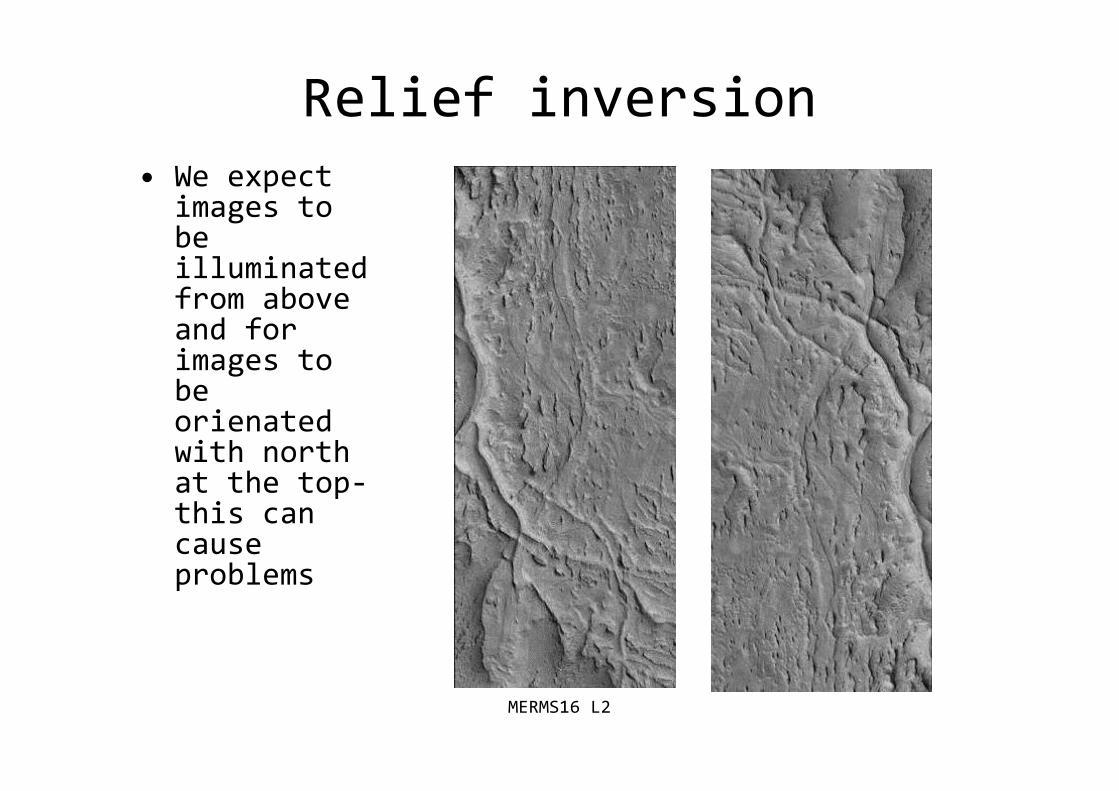
Relief inversion• We expect
images tobeilluminatedfrom aboveand forimages tobeorienatedwith northat the top-this cancauseproblems
MERMS16 L2
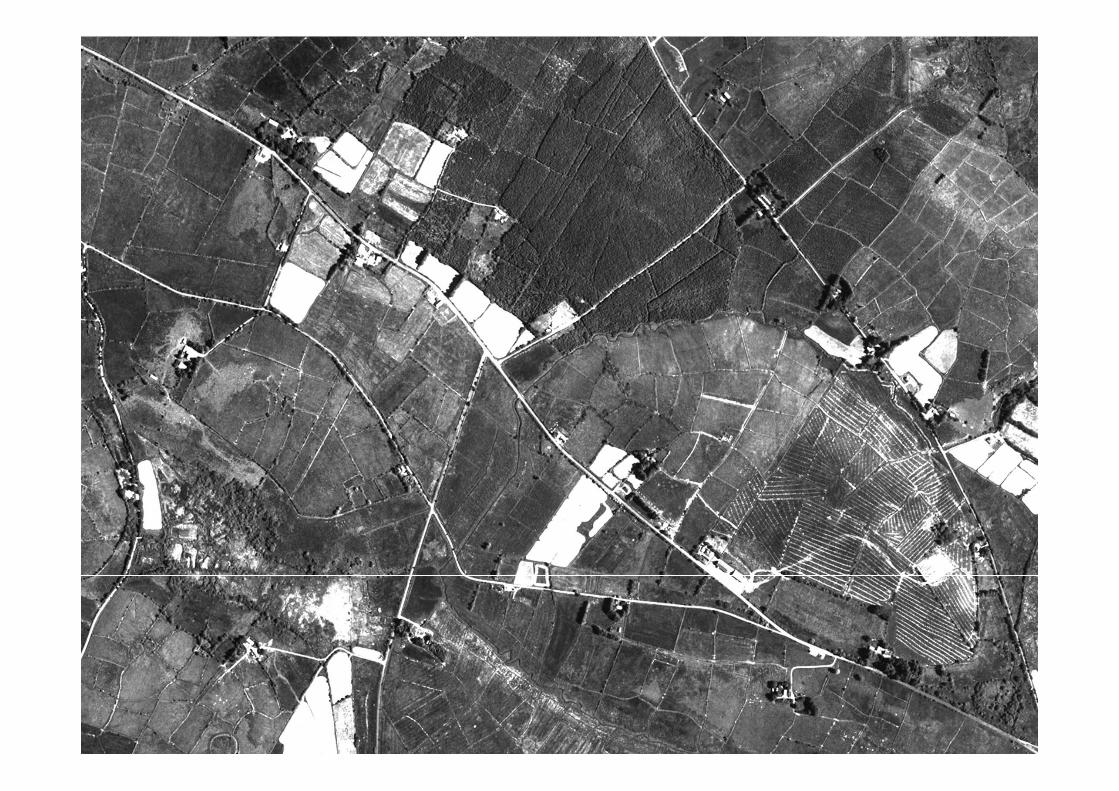
4. Pattern• It must be noted here that patternis highly scale dependent.
MERMS16 L2
Pattern
MERMS16 L2
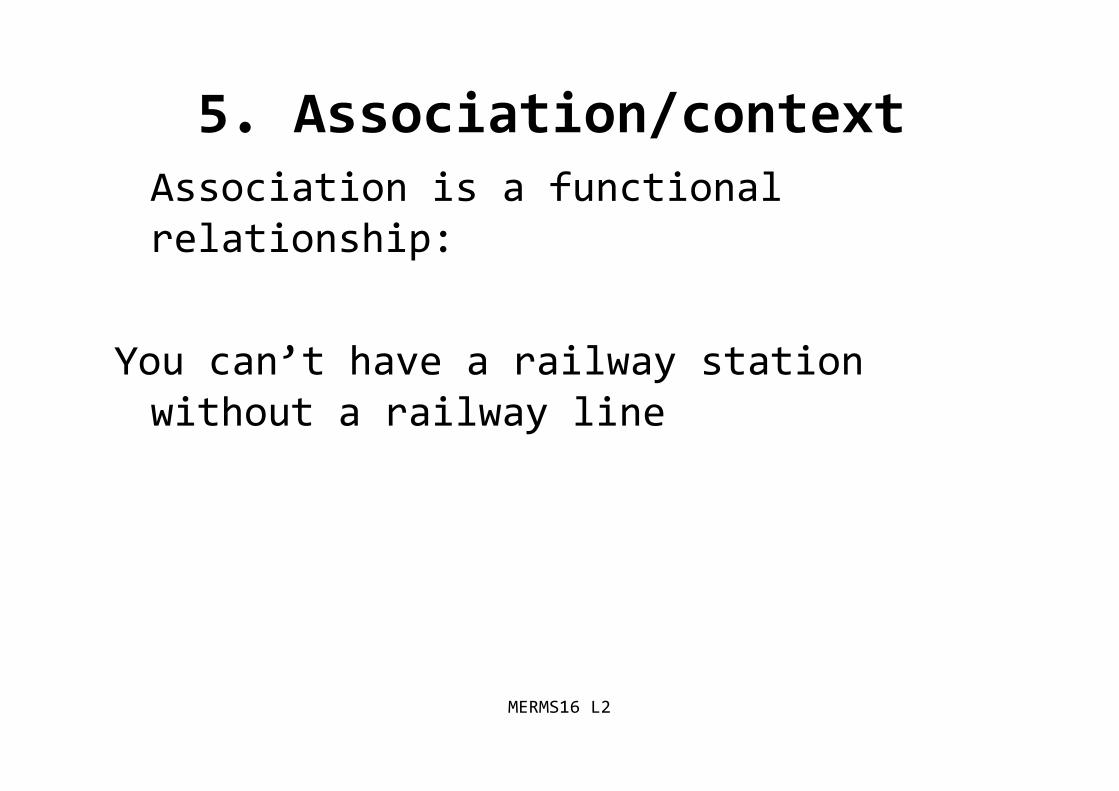
5. Association/contextAssociation is a functionalrelationship:
You can’t have a railway stationwithout a railway line
MERMS16 L2
MERMS16 L2
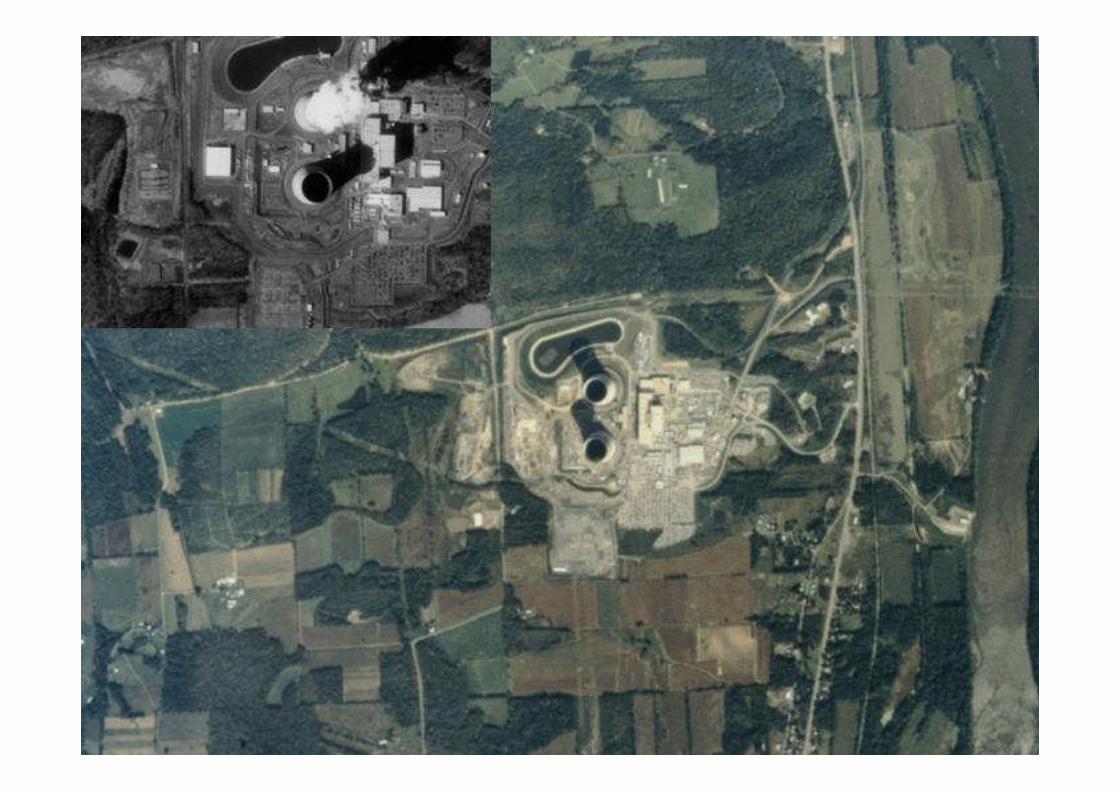
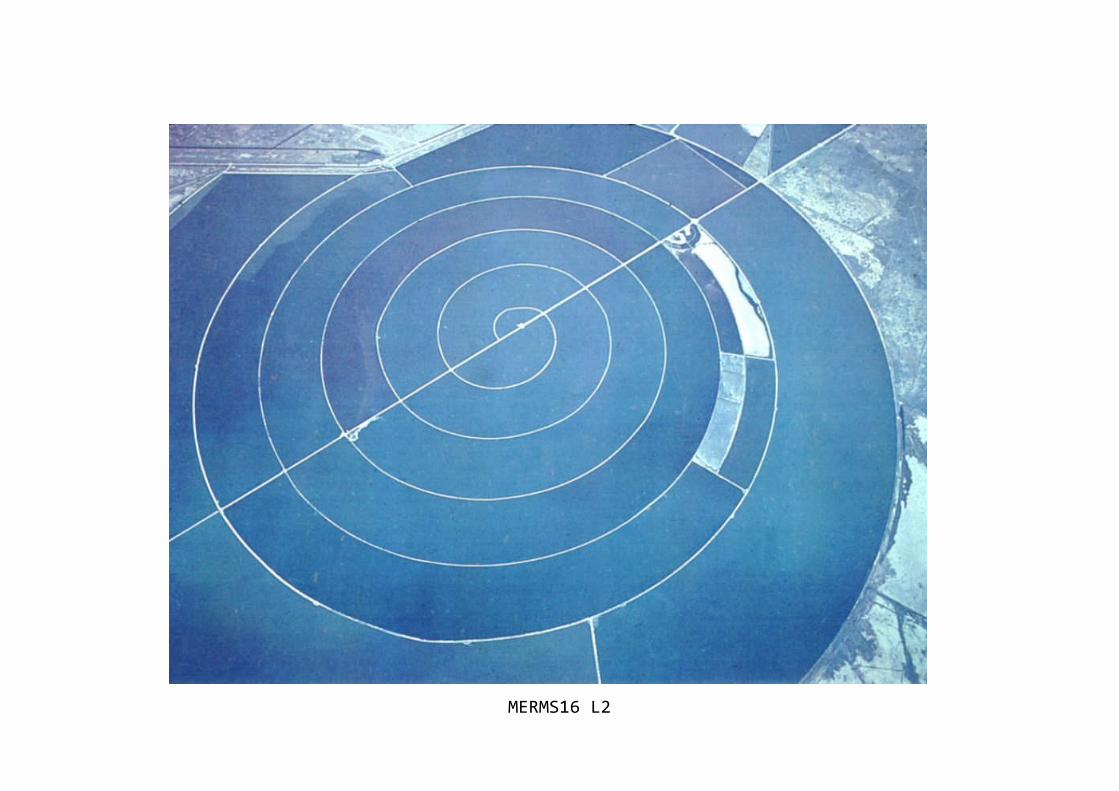
6.Shape & Size
Size can be absolute if you have ascale or it can relative; onething is bigger than the other
MERMS16 L2
MERMS16 L2
8. Location
Location is about position inlandscape, especially in realtionto topography
MERMS16 L2
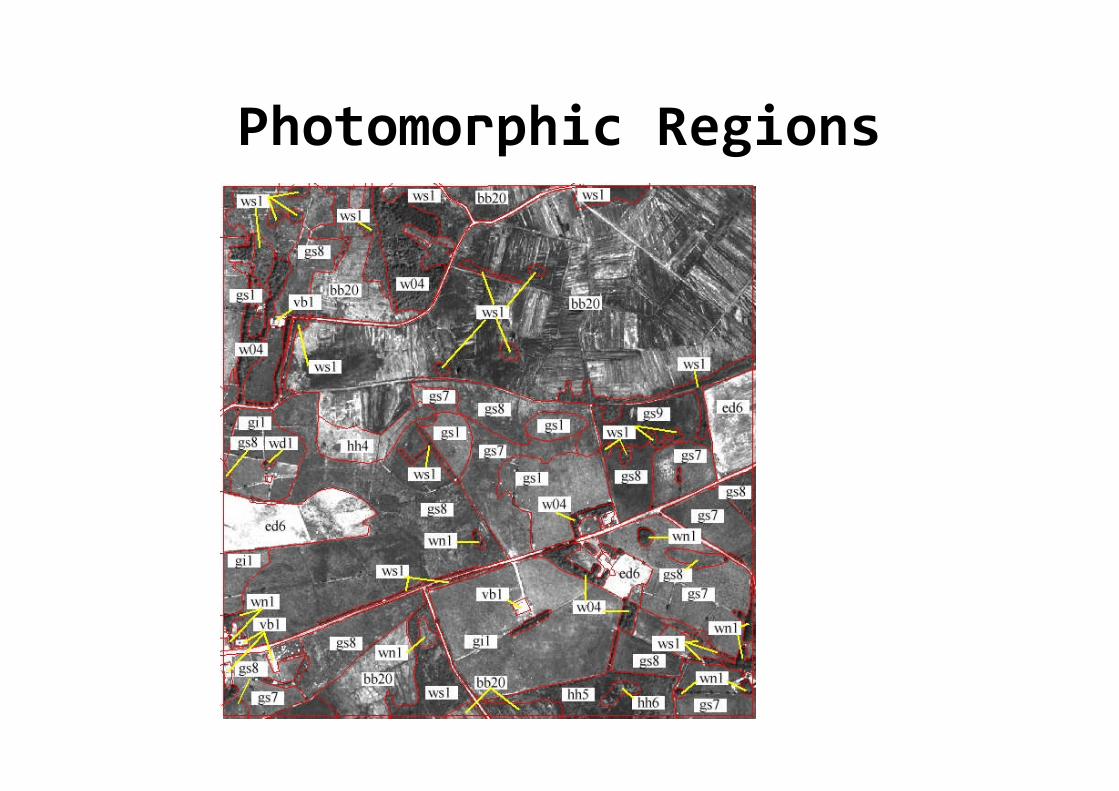
Photomorphic Regions
MERMS16 L2
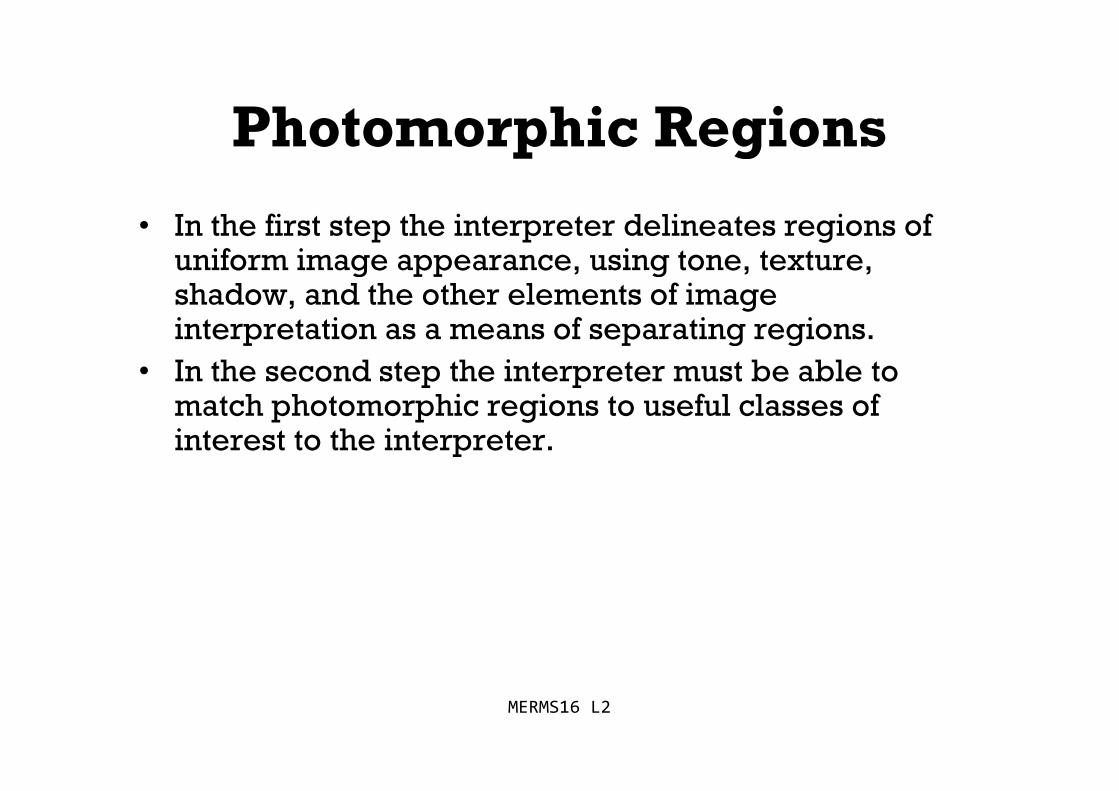
Photomorphic Regions
• In the first step the interpreter delineates regions ofuniform image appearance, using tone, texture,shadow, and the other elements of imageinterpretation as a means of separating regions.
• In the second step the interpreter must be able tomatch photomorphic regions to useful classes ofinterest to the interpreter.
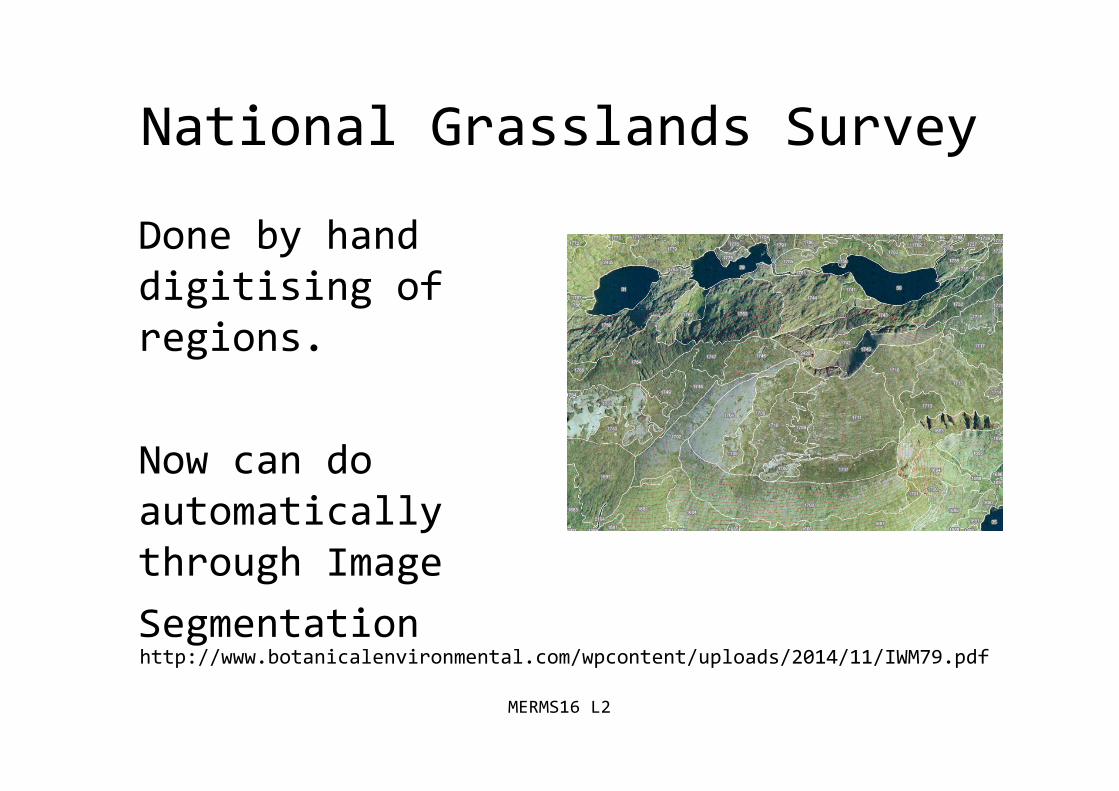
National Grasslands Survey
Done by handdigitising ofregions.
Now can doautomaticallythrough Image
Segmentation
MERMS16 L2
http://www.botanicalenvironmental.com/wpcontent/uploads/2014/11/IWM79.pdf
MERMS16 L2
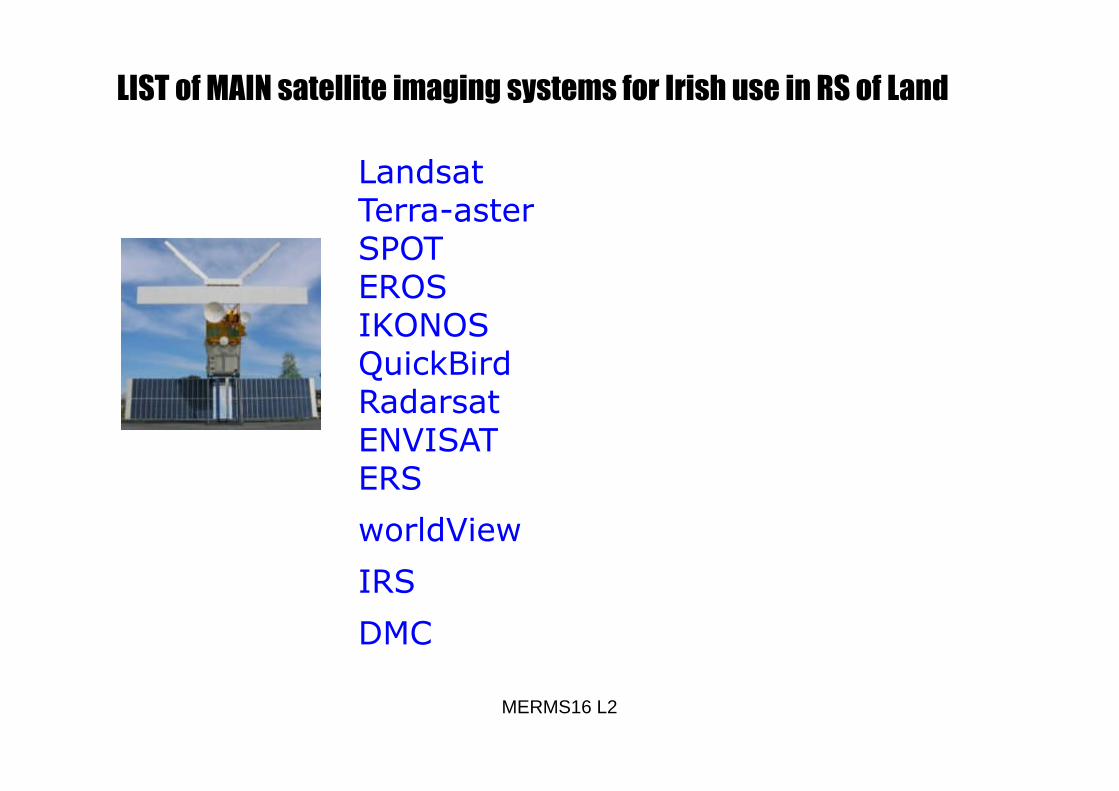
LandsatTerra-asterSPOTEROSIKONOSQuickBirdRadarsatENVISATERS
worldView
IRS
DMC
LIST of MAIN satellite imaging systems for Irish use in RS of Land
MERMS16 L2
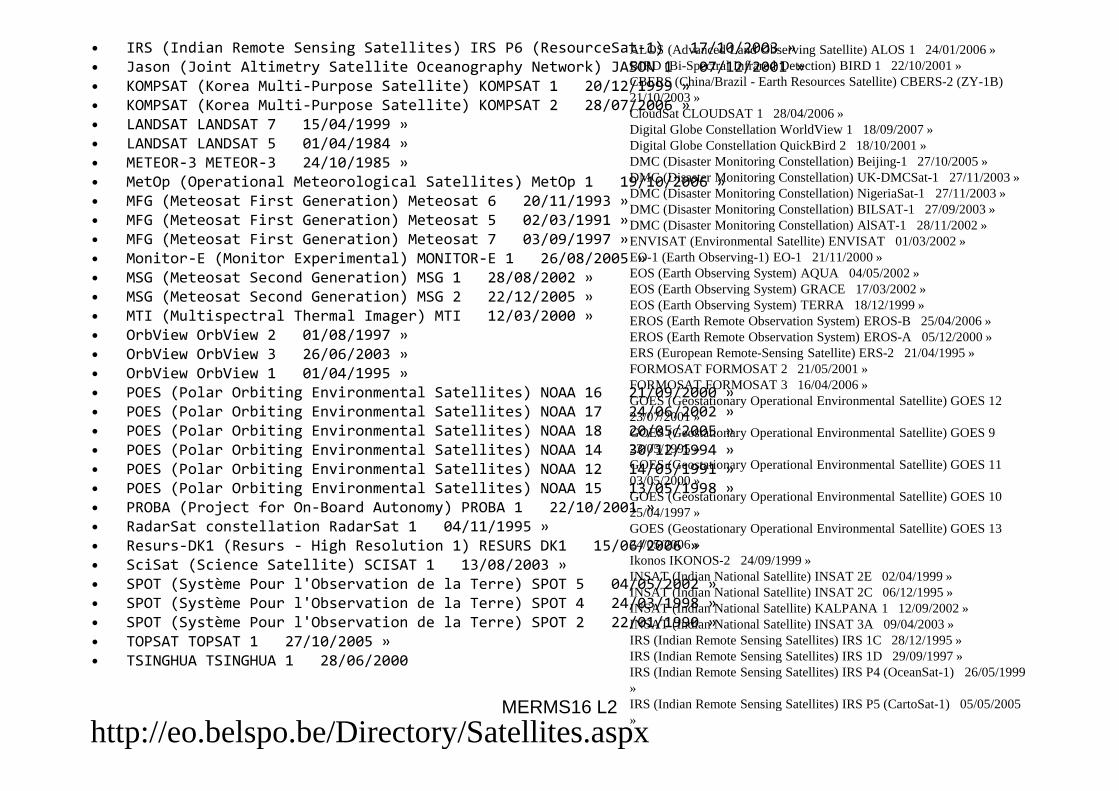
ALOS (Advanced Land Observing Satellite) ALOS 1 24/01/2006 »BIRD (Bi-Spectral Infrared Detection) BIRD 1 22/10/2001 »CBERS (China/Brazil - Earth Resources Satellite) CBERS-2 (ZY-1B)21/10/2003 »CloudSat CLOUDSAT 1 28/04/2006 »Digital Globe Constellation WorldView 1 18/09/2007 »Digital Globe Constellation QuickBird 2 18/10/2001 »DMC (Disaster Monitoring Constellation) Beijing-1 27/10/2005 »DMC (Disaster Monitoring Constellation) UK-DMCSat-1 27/11/2003 »DMC (Disaster Monitoring Constellation) NigeriaSat-1 27/11/2003 »DMC (Disaster Monitoring Constellation) BILSAT-1 27/09/2003 »DMC (Disaster Monitoring Constellation) AlSAT-1 28/11/2002 »ENVISAT (Environmental Satellite) ENVISAT 01/03/2002 »EO-1 (Earth Observing-1) EO-1 21/11/2000 »EOS (Earth Observing System) AQUA 04/05/2002 »EOS (Earth Observing System) GRACE 17/03/2002 »EOS (Earth Observing System) TERRA 18/12/1999 »EROS (Earth Remote Observation System) EROS-B 25/04/2006 »EROS (Earth Remote Observation System) EROS-A 05/12/2000 »ERS (European Remote-Sensing Satellite) ERS-2 21/04/1995 »FORMOSAT FORMOSAT 2 21/05/2001 »FORMOSAT FORMOSAT 3 16/04/2006 »GOES (Geostationary Operational Environmental Satellite) GOES 1223/07/2001 »GOES (Geostationary Operational Environmental Satellite) GOES 923/05/1995 »GOES (Geostationary Operational Environmental Satellite) GOES 1103/05/2000 »GOES (Geostationary Operational Environmental Satellite) GOES 1025/04/1997 »GOES (Geostationary Operational Environmental Satellite) GOES 1324/05/2006 »Ikonos IKONOS-2 24/09/1999 »INSAT (Indian National Satellite) INSAT 2E 02/04/1999 »INSAT (Indian National Satellite) INSAT 2C 06/12/1995 »INSAT (Indian National Satellite) KALPANA 1 12/09/2002 »INSAT (Indian National Satellite) INSAT 3A 09/04/2003 »IRS (Indian Remote Sensing Satellites) IRS 1C 28/12/1995 »IRS (Indian Remote Sensing Satellites) IRS 1D 29/09/1997 »IRS (Indian Remote Sensing Satellites) IRS P4 (OceanSat-1) 26/05/1999»IRS (Indian Remote Sensing Satellites) IRS P5 (CartoSat-1) 05/05/2005»
• IRS (Indian Remote Sensing Satellites) IRS P6 (ResourceSat-1) 17/10/2003 »• Jason (Joint Altimetry Satellite Oceanography Network) JASON 1 07/12/2001 »• KOMPSAT (Korea Multi-Purpose Satellite) KOMPSAT 1 20/12/1999 »• KOMPSAT (Korea Multi-Purpose Satellite) KOMPSAT 2 28/07/2006 »• LANDSAT LANDSAT 7 15/04/1999 »• LANDSAT LANDSAT 5 01/04/1984 »• METEOR-3 METEOR-3 24/10/1985 »• MetOp (Operational Meteorological Satellites) MetOp 1 19/10/2006 »• MFG (Meteosat First Generation) Meteosat 6 20/11/1993 »• MFG (Meteosat First Generation) Meteosat 5 02/03/1991 »• MFG (Meteosat First Generation) Meteosat 7 03/09/1997 »• Monitor-E (Monitor Experimental) MONITOR-E 1 26/08/2005 »• MSG (Meteosat Second Generation) MSG 1 28/08/2002 »• MSG (Meteosat Second Generation) MSG 2 22/12/2005 »• MTI (Multispectral Thermal Imager) MTI 12/03/2000 »• OrbView OrbView 2 01/08/1997 »• OrbView OrbView 3 26/06/2003 »• OrbView OrbView 1 01/04/1995 »• POES (Polar Orbiting Environmental Satellites) NOAA 16 21/09/2000 »• POES (Polar Orbiting Environmental Satellites) NOAA 17 24/06/2002 »• POES (Polar Orbiting Environmental Satellites) NOAA 18 20/05/2005 »• POES (Polar Orbiting Environmental Satellites) NOAA 14 30/12/1994 »• POES (Polar Orbiting Environmental Satellites) NOAA 12 14/05/1991 »• POES (Polar Orbiting Environmental Satellites) NOAA 15 13/05/1998 »• PROBA (Project for On-Board Autonomy) PROBA 1 22/10/2001 »• RadarSat constellation RadarSat 1 04/11/1995 »• Resurs-DK1 (Resurs - High Resolution 1) RESURS DK1 15/06/2006 »• SciSat (Science Satellite) SCISAT 1 13/08/2003 »• SPOT (Système Pour l'Observation de la Terre) SPOT 5 04/05/2002 »• SPOT (Système Pour l'Observation de la Terre) SPOT 4 24/03/1998 »• SPOT (Système Pour l'Observation de la Terre) SPOT 2 22/01/1990 »• TOPSAT TOPSAT 1 27/10/2005 »• TSINGHUA TSINGHUA 1 28/06/2000
http://eo.belspo.be/Directory/Satellites.aspx
Multiple Bands
• Remember a satellite doesn’t justrecord an image in RED, GREEN andBLUE light. The satellite is ableto record information across awider spectrum and with morediscrimination
MERMS16 L2
MERMS16 L2
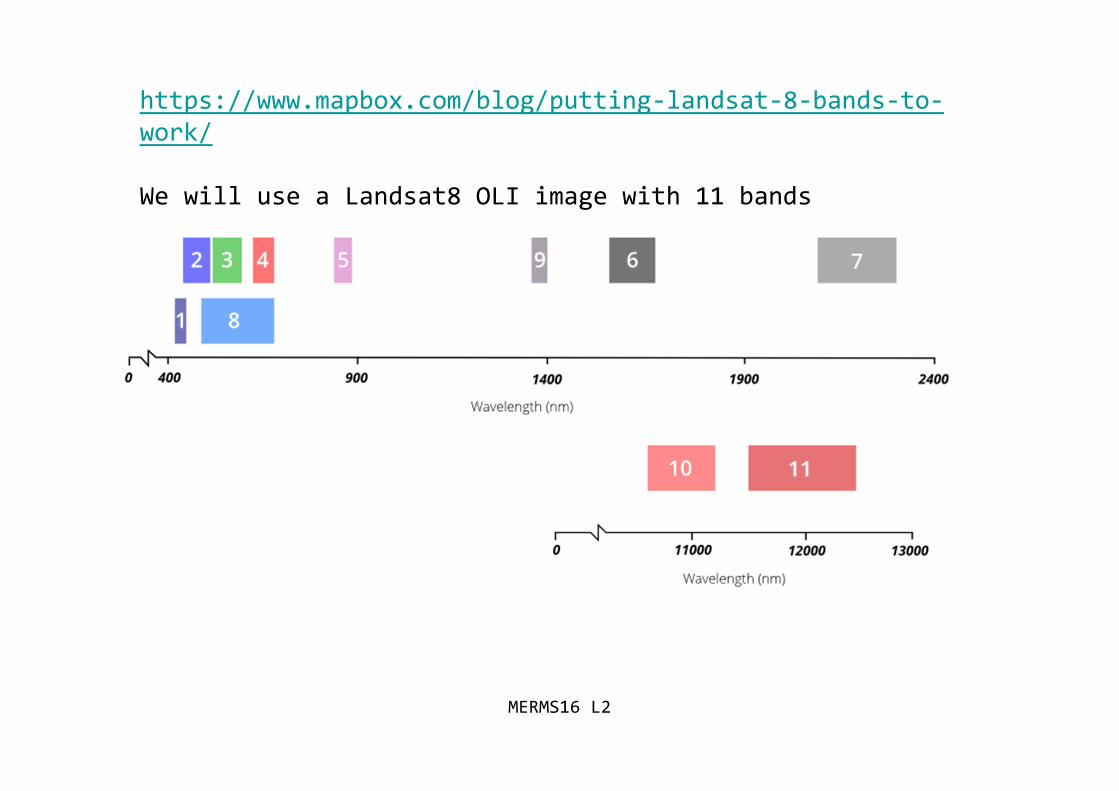
https://www.mapbox.com/blog/putting-landsat-8-bands-to-work/
We will use a Landsat8 OLI image with 11 bands
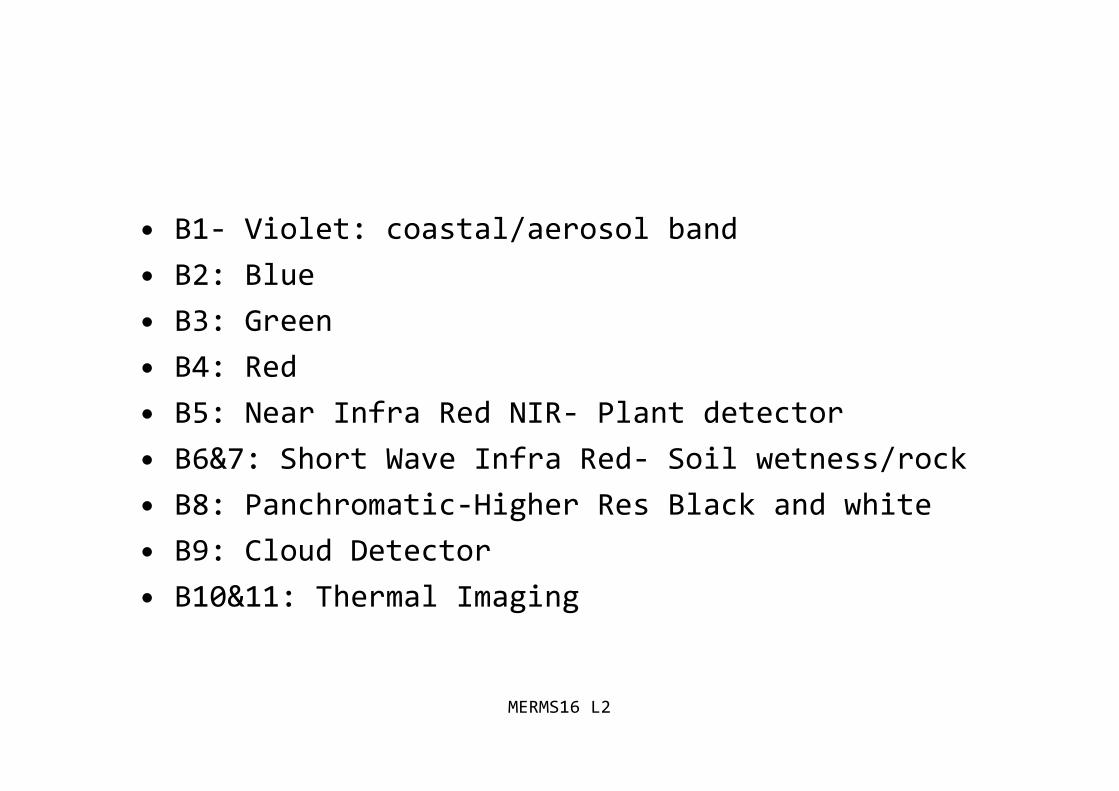
• B1- Violet: coastal/aerosol band
• B2: Blue
• B3: Green
• B4: Red
• B5: Near Infra Red NIR- Plant detector
• B6&7: Short Wave Infra Red- Soil wetness/rock
• B8: Panchromatic-Higher Res Black and white
• B9: Cloud Detector
• B10&11: Thermal Imaging
MERMS16 L2
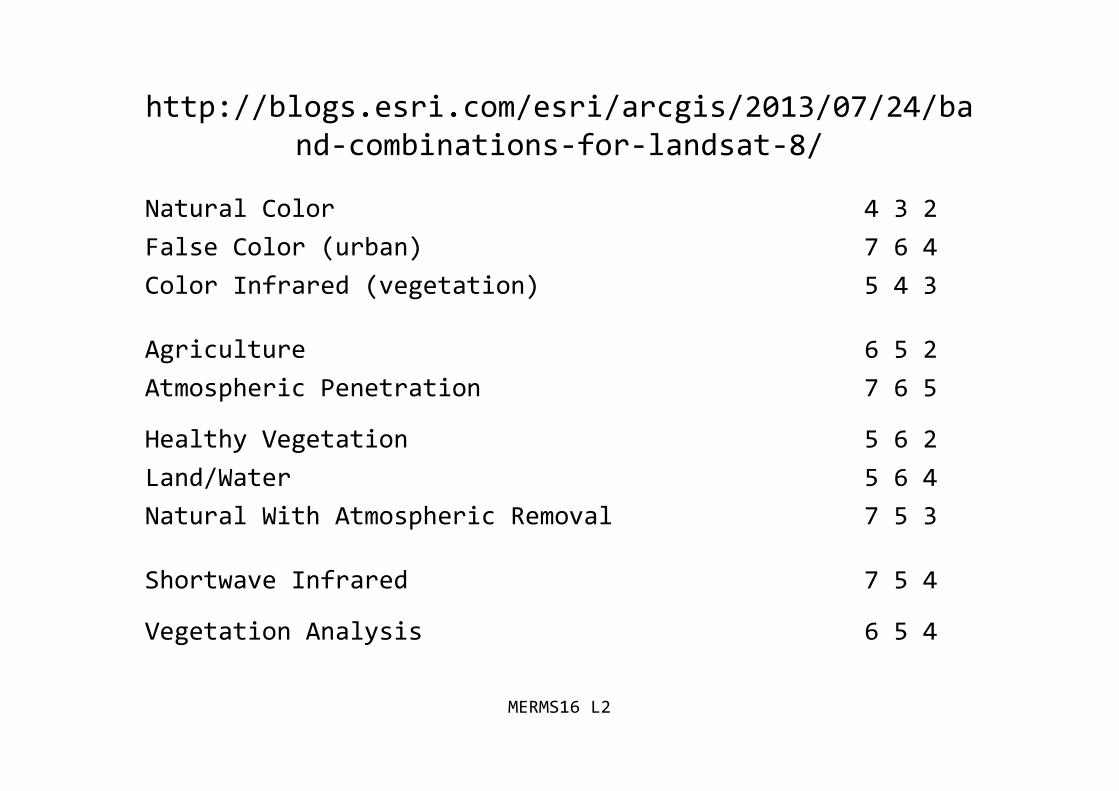
http://blogs.esri.com/esri/arcgis/2013/07/24/band-combinations-for-landsat-8/
Natural Color 4 3 2
False Color (urban) 7 6 4
Color Infrared (vegetation) 5 4 3
Agriculture 6 5 2
Atmospheric Penetration 7 6 5
Healthy Vegetation 5 6 2
Land/Water 5 6 4
Natural With Atmospheric Removal 7 5 3
Shortwave Infrared 7 5 4
Vegetation Analysis 6 5 4
MERMS16 L2
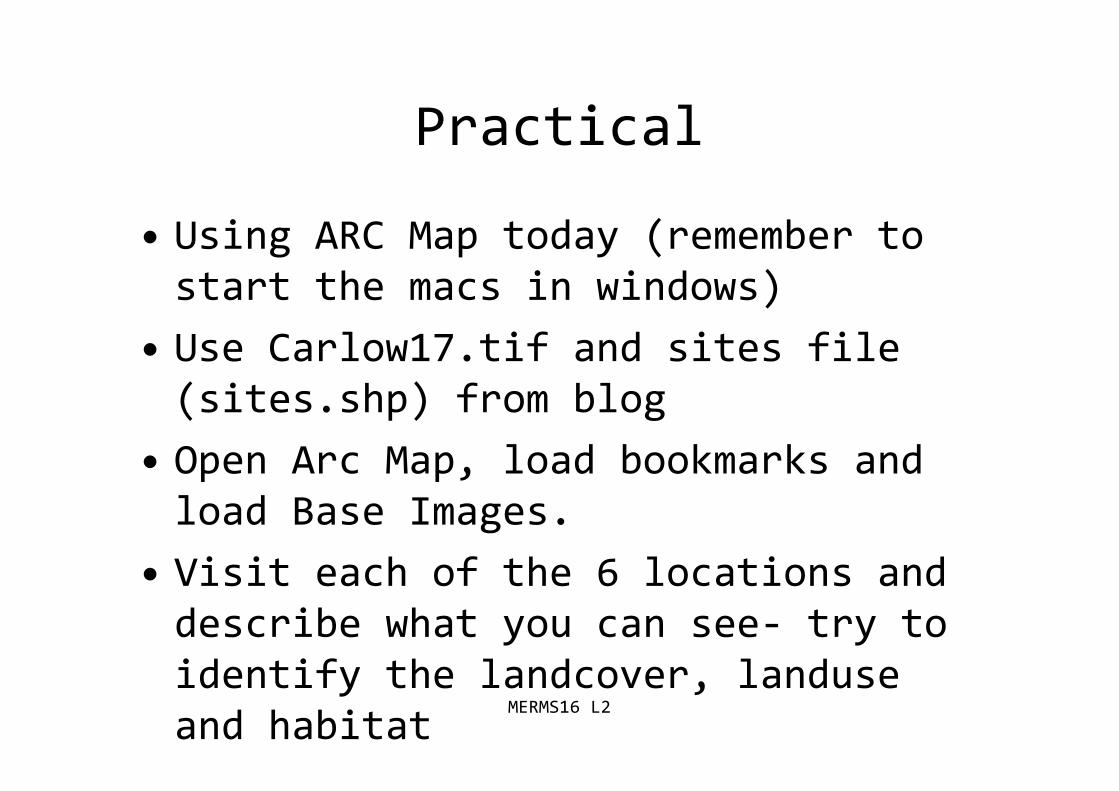
Practical
• Using ARC Map today (remember tostart the macs in windows)
• Use Carlow17.tif and sites file(sites.shp) from blog
• Open Arc Map, load bookmarks andload Base Images.
• Visit each of the 6 locations anddescribe what you can see- try toidentify the landcover, landuseand habitat
MERMS16 L2
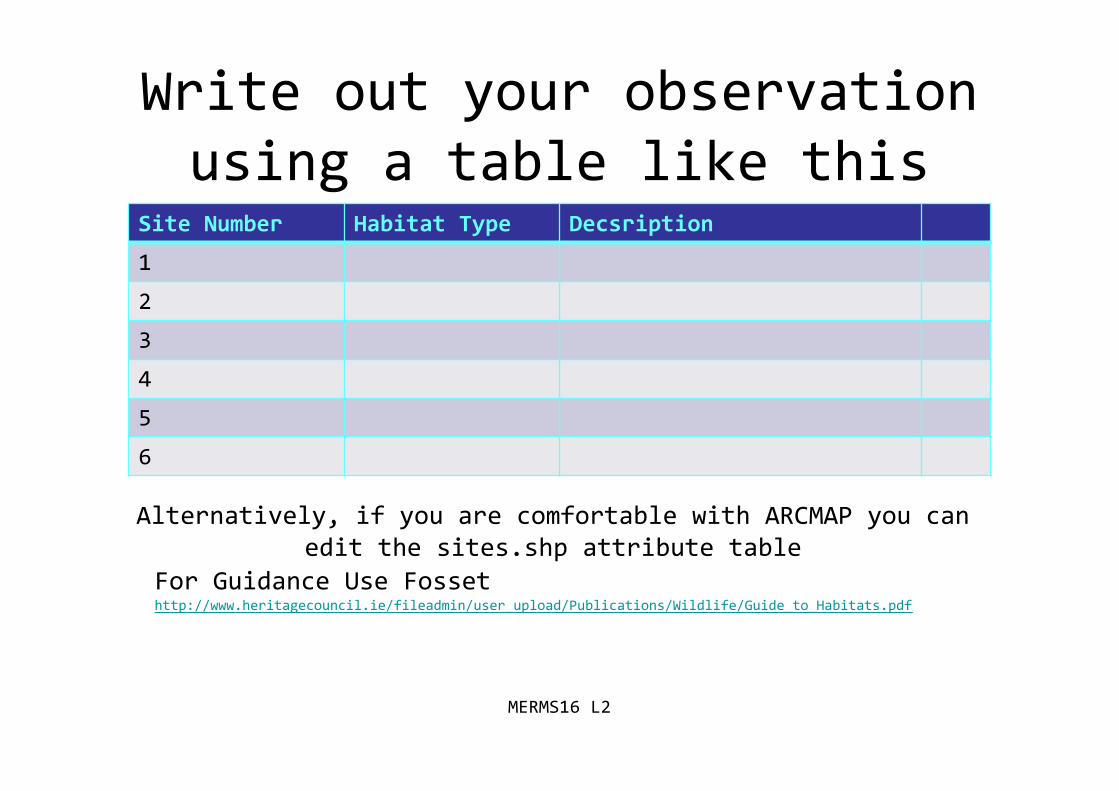
Write out your observationusing a table like this
Site Number Habitat Type Decsription
1
2
3
4
5
6
MERMS16 L2
For Guidance Use Fossethttp://www.heritagecouncil.ie/fileadmin/user_upload/Publications/Wildlife/Guide_to_Habitats.pdf
Alternatively, if you are comfortable with ARCMAP you canedit the sites.shp attribute table
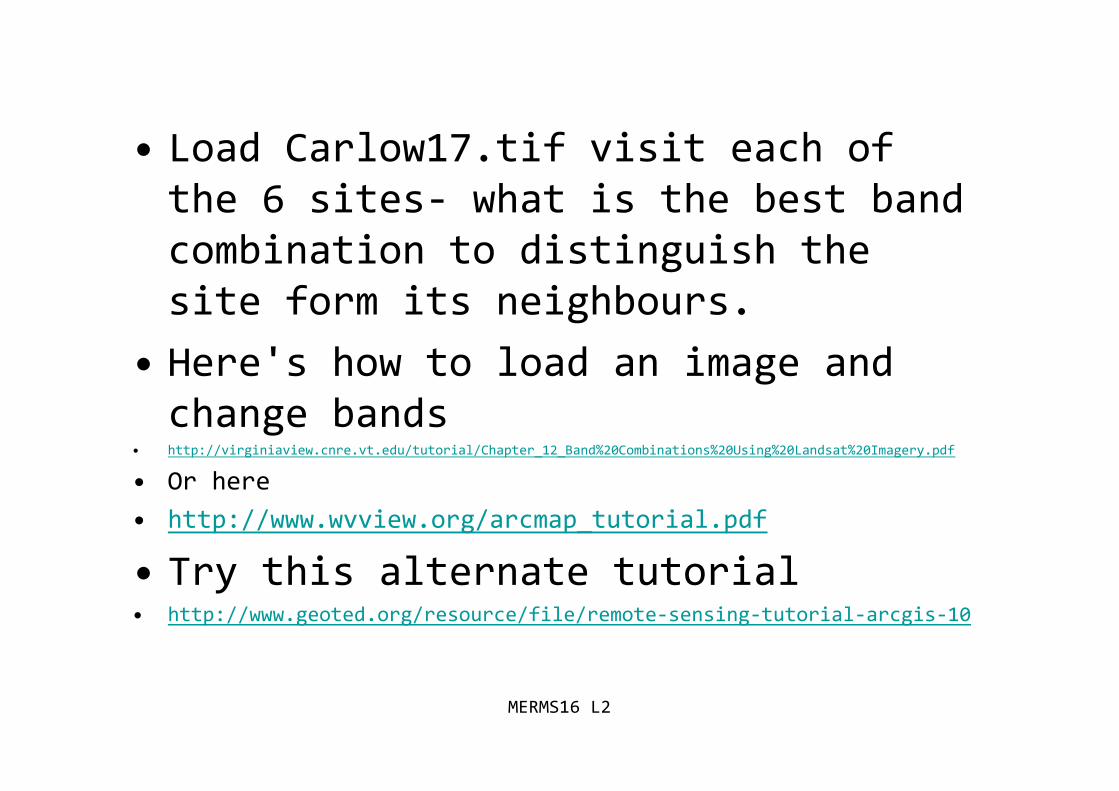
• Load Carlow17.tif visit each ofthe 6 sites- what is the best bandcombination to distinguish thesite form its neighbours.
• Here's how to load an image andchange bands
• http://virginiaview.cnre.vt.edu/tutorial/Chapter_12_Band%20Combinations%20Using%20Landsat%20Imagery.pdf
• Or here
• http://www.wvview.org/arcmap_tutorial.pdf
• Try this alternate tutorial• http://www.geoted.org/resource/file/remote-sensing-tutorial-arcgis-10
MERMS16 L2
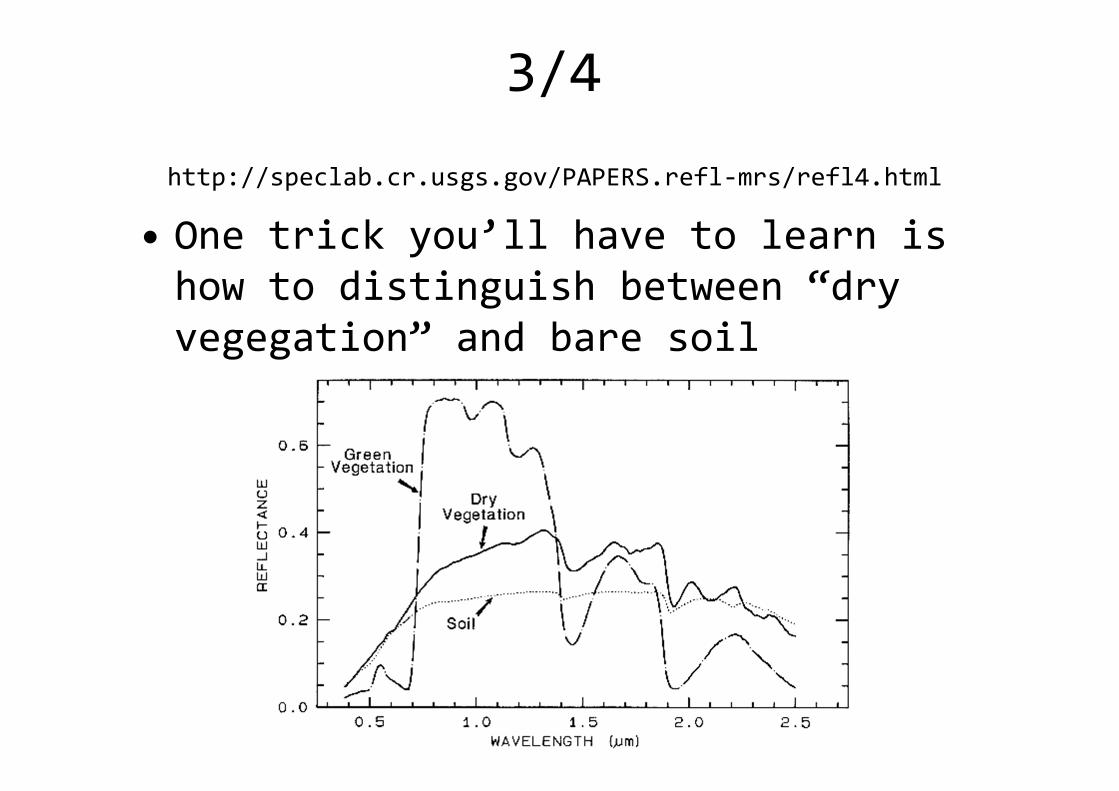
http://speclab.cr.usgs.gov/PAPERS.refl-mrs/refl4.html
• One trick you’ll have to learn ishow to distinguish between “dryvegegation” and bare soil
MERMS16 L2
3/4
Compare the 6 sites• Load the Base Map/Image.
• What can you see at the six sitesin the aerial imagery that youcan’t see in the satellite?
• Do you need to change any of your6 habitat observations?
• What does shaddow tell you foreach of the 6 locations
MERMS16 L2
4/4