Embed Size (px)
Citation preview

Directions in observational data organization: from schemas to ontologies
Matthew B. Jones1
Chad Berkley1
Shawn Bowers2
Joshua Madin3
Mark Schildhauer1
National Center for Ecological Analysis and Synthesis (NCEAS)
University of California, Santa Barbara1
University of California, Davis2
MacQuarie University3
Ecological studies
• Ecological studies focus on– Distribution and abundance of organisms– Organism interactions– Population and community processes– Ecosystem processes– Mechanistic understanding of ecosystems
• Diverse data sources, e.g.,– Biodiversity monitoring– Experimental manipulations– Environmental monitoring
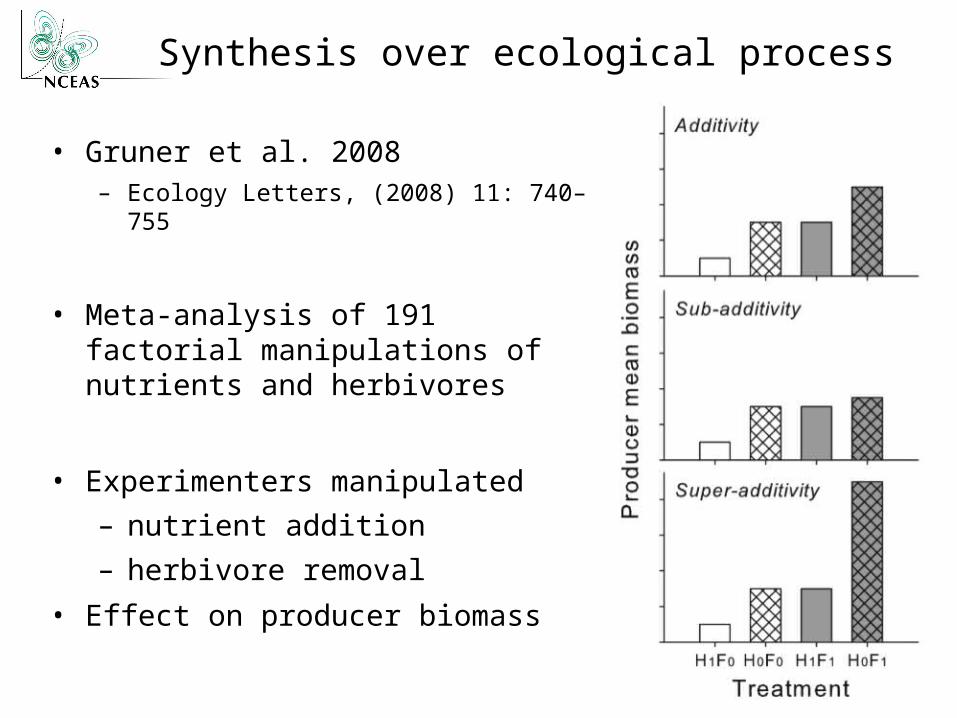
Synthesis over ecological process
• Gruner et al. 2008– Ecology Letters, (2008) 11: 740–
755
• Meta-analysis of 191 factorial manipulations of nutrients and herbivores
• Experimenters manipulated
– nutrient addition
– herbivore removal
• Effect on producer biomass
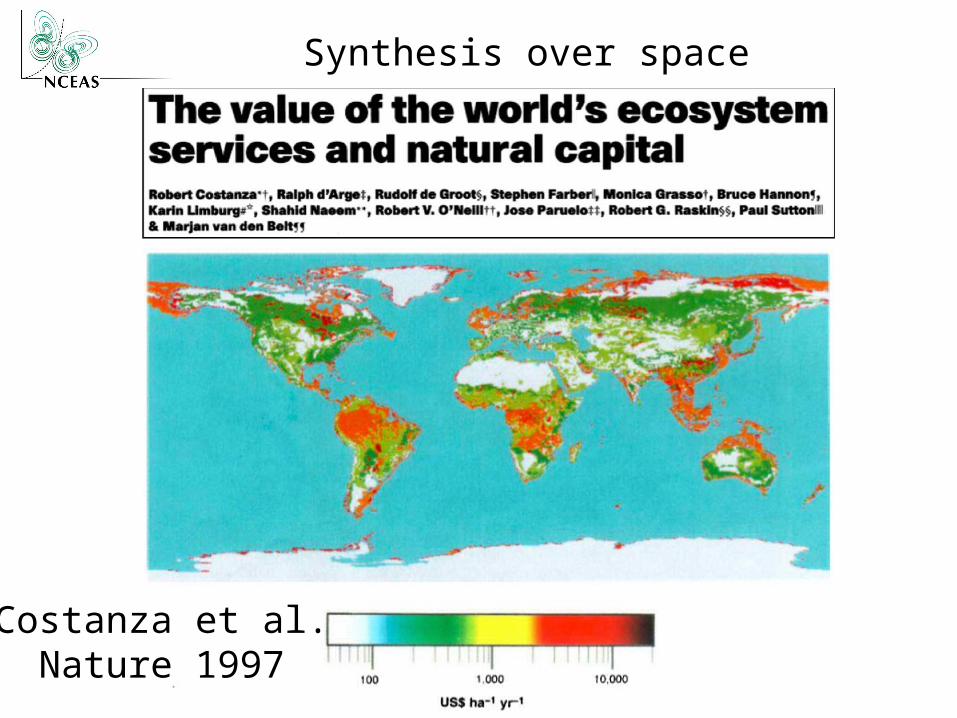
Synthesis over space
Costanza et al.Nature 1997
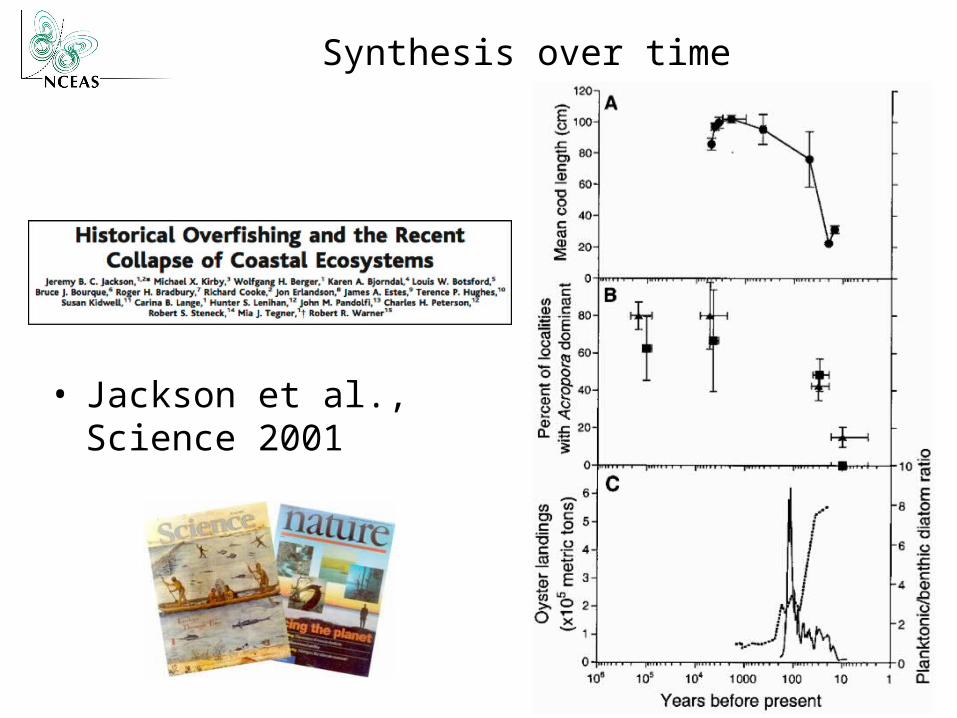
Synthesis over time
• Jackson et al., Science 2001
How did they do it?
• As a scientist, could you:
– Locate the precise data used?
– Locate the analytical processes used?•Reconstruct them?
• Today, only a slim chance...
– Why?
Insufficient sharing
• Researchers don’t publish their data
• Researchers don’t publish their analytical code
• In general, we have no way to verify or reproduce the conclusions in papers

• Synthesis requires access to global ecological data
• Single-schema databases do not suffice
• Loosely-coupled metadata and data collections– No constraints on data schemas
• Knowledge Network for Biocomplexity (KNB)
• National Biological Information Infrastructure (NBII)
Preserving data for synthesis
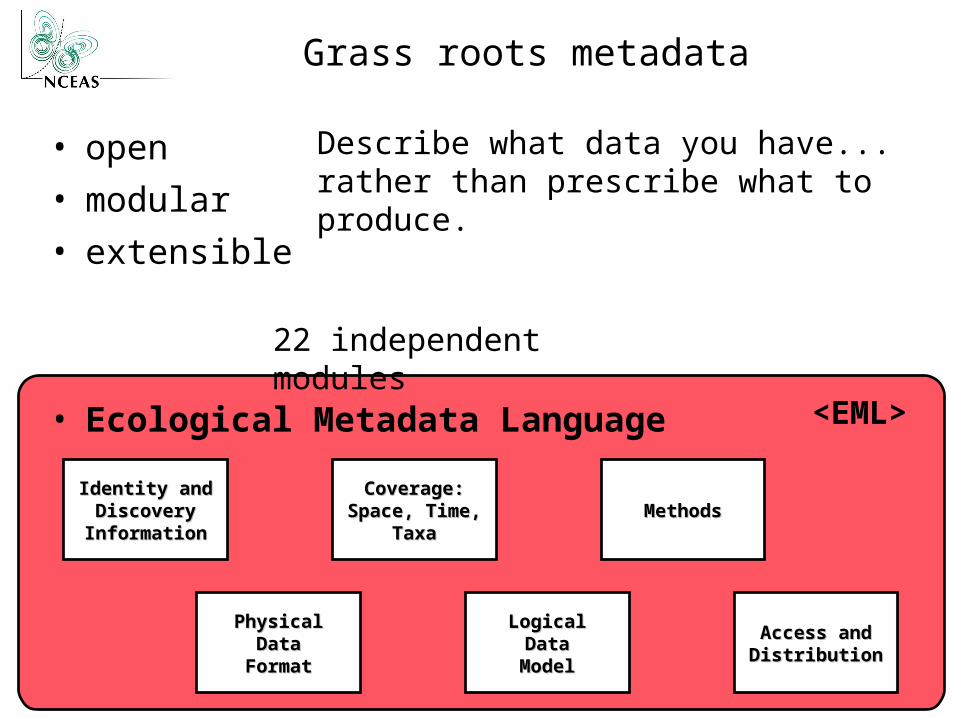
PhysicalPhysicalDataDataFormatFormat
Access and Access and DistributionDistribution
LogicalLogicalDataDataModelModel
MethodsMethodsCoverage:Coverage:
Space, Time, Space, Time, TaxaTaxa
Identity andIdentity andDiscovery Discovery InformationInformation
<EML>
22 independent modules
• open• modular• extensible
• Ecological Metadata Language
Grass roots metadata
Describe what data you have...rather than prescribe what to produce.
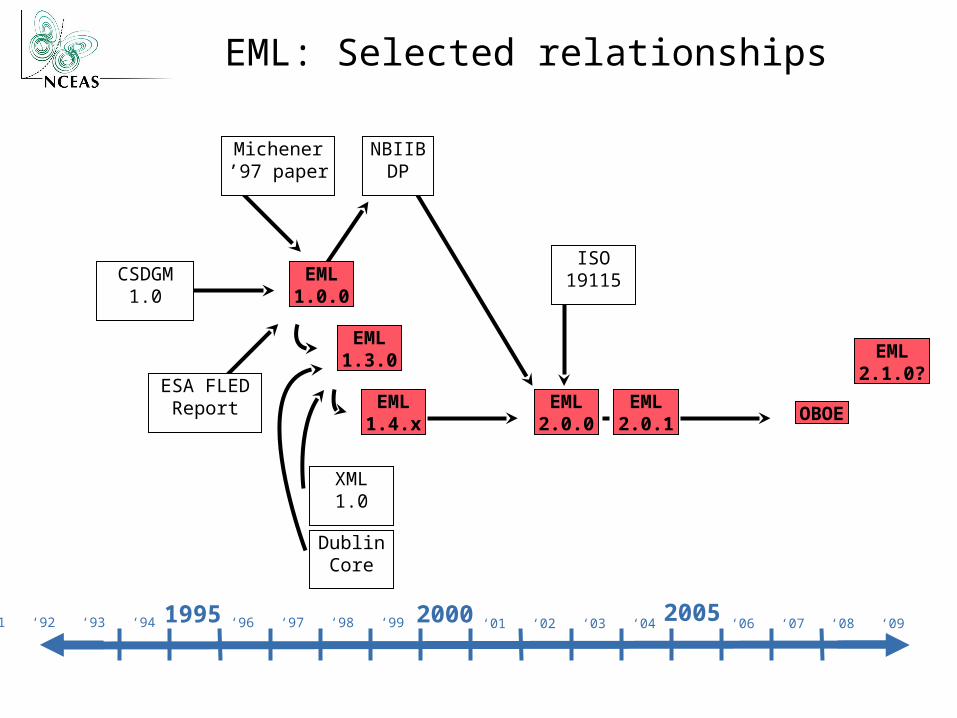
EML: Selected relationships
1995 2000 2005‘91 ‘92 ‘93 ‘94 ‘96 ‘97 ‘98 ‘99 ‘01 ‘02 ‘03 ‘04 ‘06 ‘07 ‘08 ‘09
EML1.0.0
EML1.3.0
EML1.4.x
EML2.0.0
CSDGM1.0
Michener ’97 paper
ESA FLEDReport
NBIIBDP
ISO 19115
DublinCore
OBOE
XML1.0
EML2.0.1
EML2.1.0?

Logical Model: Attribute structure
• Describes data tables and their attributes
• a typical data table with 10 attributes– some metadata are likely apparent, other ambiguous
– missing value code is present
– definitions need to be explicit, as well as data typing
YEAR MONTH DATE SITE TRANSECT SECTION SP_CODE SIZE OBS_CODE NOTES2001 8 2001-08-22 ABUR 1 0-20 CLIN 5 06 .2001 8 2001-08-22 ABUR 1 21-40 OPIC 11 06 .2001 8 2001-08-22 ABUR 1 21-40 OPIC 10 06 .2001 8 2001-08-22 ABUR 1 21-40 OPIC 14 06 .2001 8 2001-08-22 ABUR 1 21-40 OPIC 7 06 .2001 8 2001-08-22 ABUR 1 21-40 OPIC 19 06 .2001 8 2001-08-22 ABUR 1 21-40 COTT 5 06 .2001 8 2001-08-22 ABUR 2 0-20 CLIN 5 06 .2001 8 2001-08-22 ABUR 2 21-40 NF 0 06 .2001 8 2001-08-27 AHND 1 0-20 NF 0 03 .
Species
Codes
Valuebounds
DateFormat
Codedefinitions
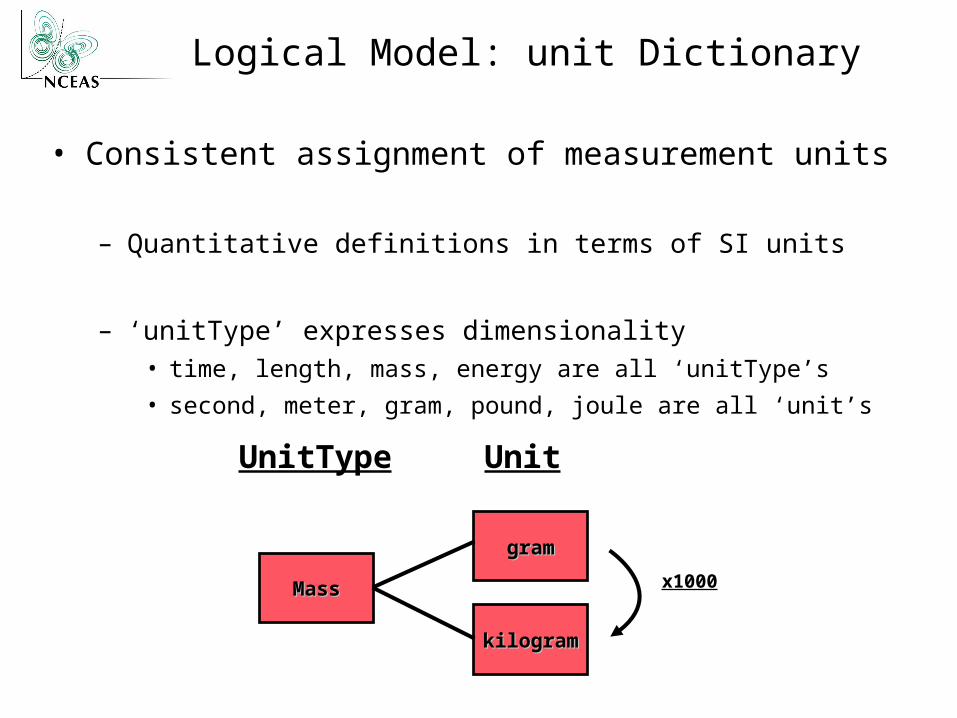
Logical Model: unit Dictionary
• Consistent assignment of measurement units
– Quantitative definitions in terms of SI units
– ‘unitType’ expresses dimensionality• time, length, mass, energy are all ‘unitType’s
• second, meter, gram, pound, joule are all ‘unit’s
MassMass
kilogramkilogram
gramgram
UnitType Unit
x1000

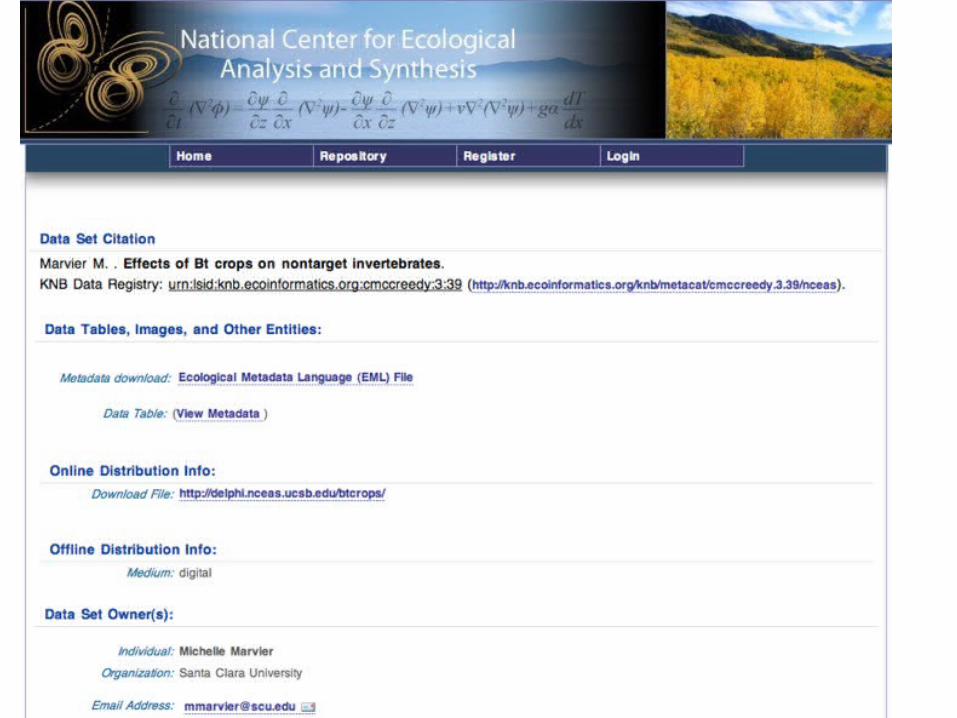
An EML Record at NCEAS
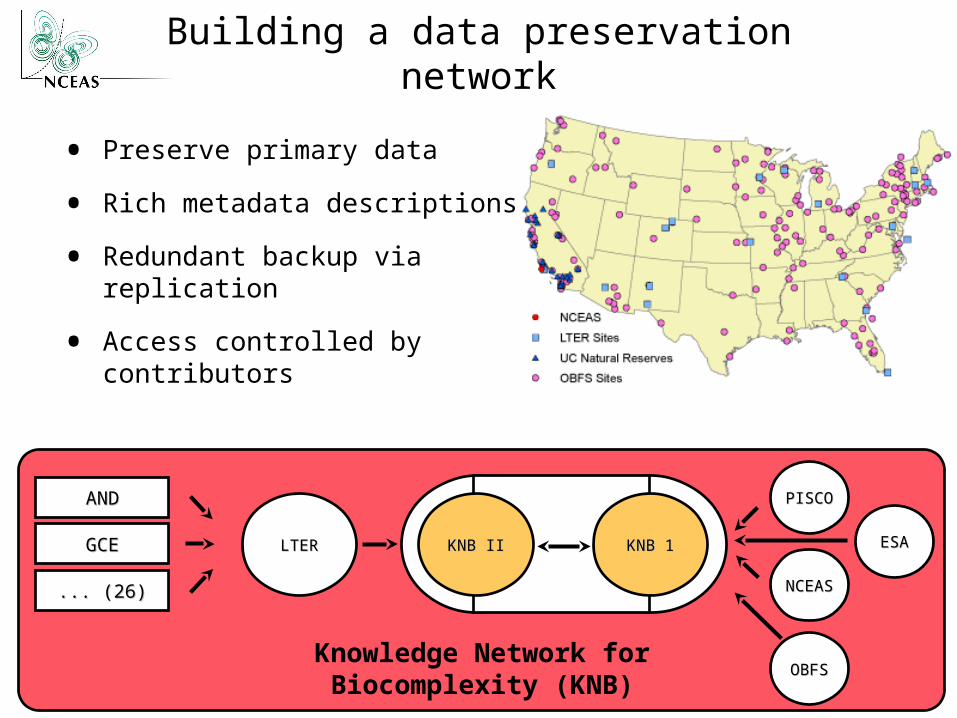
Knowledge Network for Biocomplexity (KNB)
PISCOPISCO
KNB IIKNB II
ANDAND
... (26)... (26)
GCEGCE LTERLTER
NCEASNCEAS
ESAESA
OBFSOBFS
KNB 1KNB 1
Building a data preservation network
• Preserve primary data
• Rich metadata descriptions
• Redundant backup via replication
• Access controlled by contributors
KNB 1KNB 1KNB IIKNB II
PISCOPISCOANDAND
... (26)... (26)
GCEGCE LTERLTER
NCEASNCEAS
ESAESA
OBFSOBFSKnowledge Network for Biocomplexity (KNB)
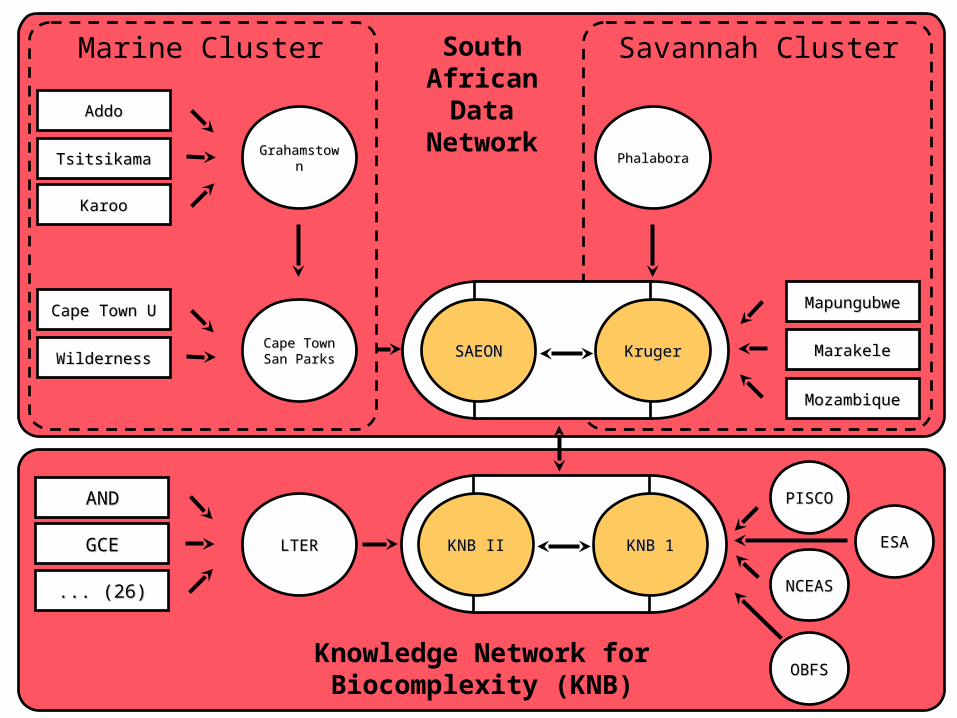
SouthAfricanData
Network
MozambiqueMozambique
MapungubweMapungubwe
MarakeleMarakeleKrugerKrugerSAEONSAEON
GrahamstowGrahamstownn
Cape TownCape TownSan ParksSan ParksWildernessWilderness
Cape Town UCape Town U
AddoAddo
KarooKaroo
TsitsikamaTsitsikama PhalaboraPhalabora
Savannah ClusterMarine Cluster

South African National Parks Metacat
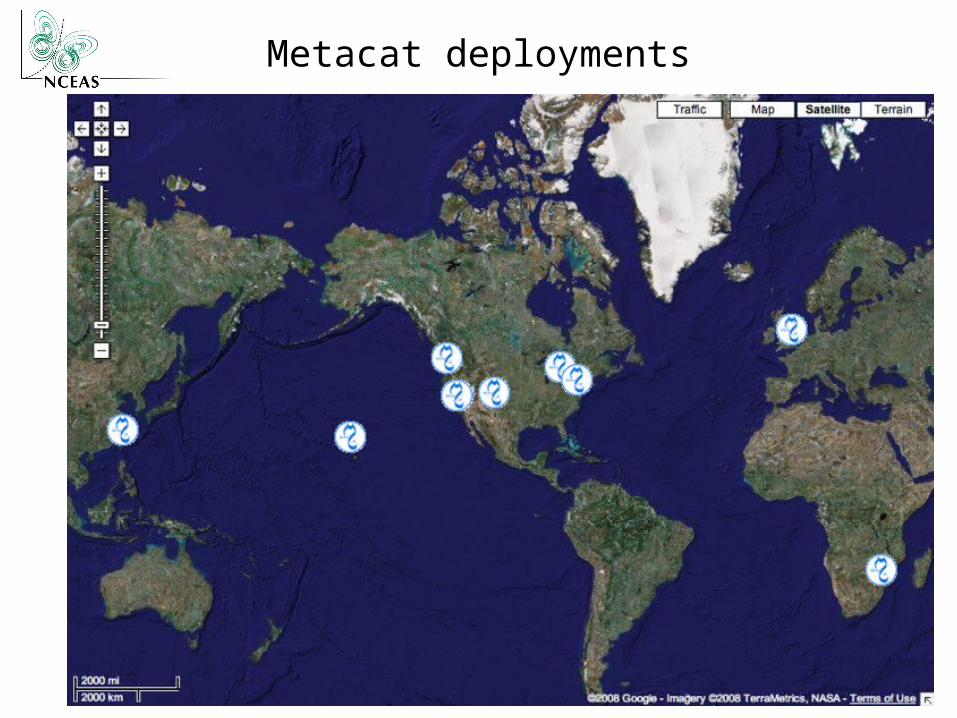
Metacat deployments
International LTER
• Recommendation for producing EML across all ILTER sites
• Recommendation for producing continental and regional metadata caches– one or more in each ILTER region– initial nodes may use Metacat
att1 | attr2 | attr3.... | .... | .......... | .... | .......... | .... | .......... | .... | ......
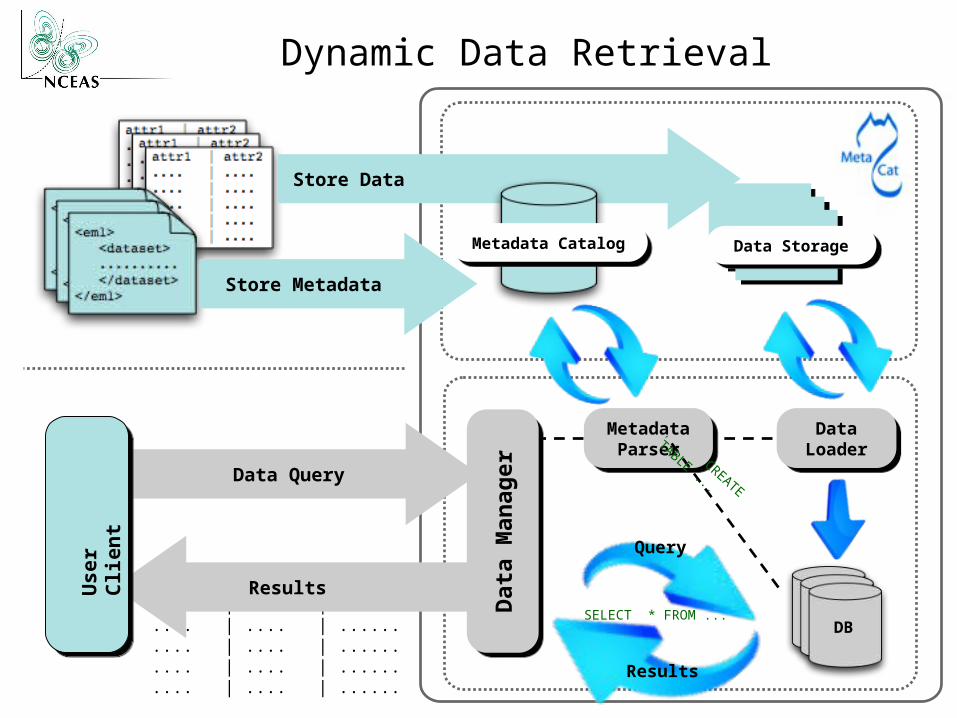
Dynamic Data Retrieval
Data StorageData Storage
MetadataParser
MetadataParser
DataLoader
DataLoader
DB
Results
Query
SELECT * FROM ...
CREATE
TABLE ...Data Query
Results
Data Manager
Data Manager
Store Data
Store Metadata
User
Client
Metadata CatalogMetadata Catalog
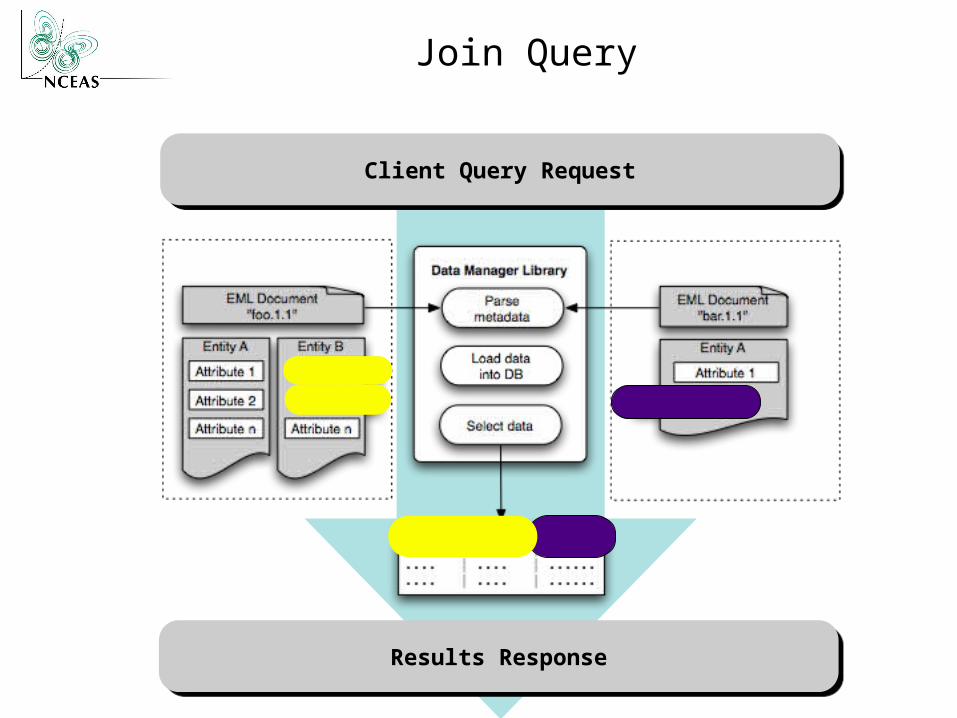
Join Query
Client Query RequestClient Query Request
Results ResponseResults Response
Importance of semantics
• So far we’ve dealt only with the logical data model– any semantics in EML in natural language
• The computer doesn’t really understand:– what is being measured– how measurements relate to one another– how semantics map to logical structure
• Analysis depends on understanding the semantic contextual relationships among data measurements– e.g., density measured within subplot
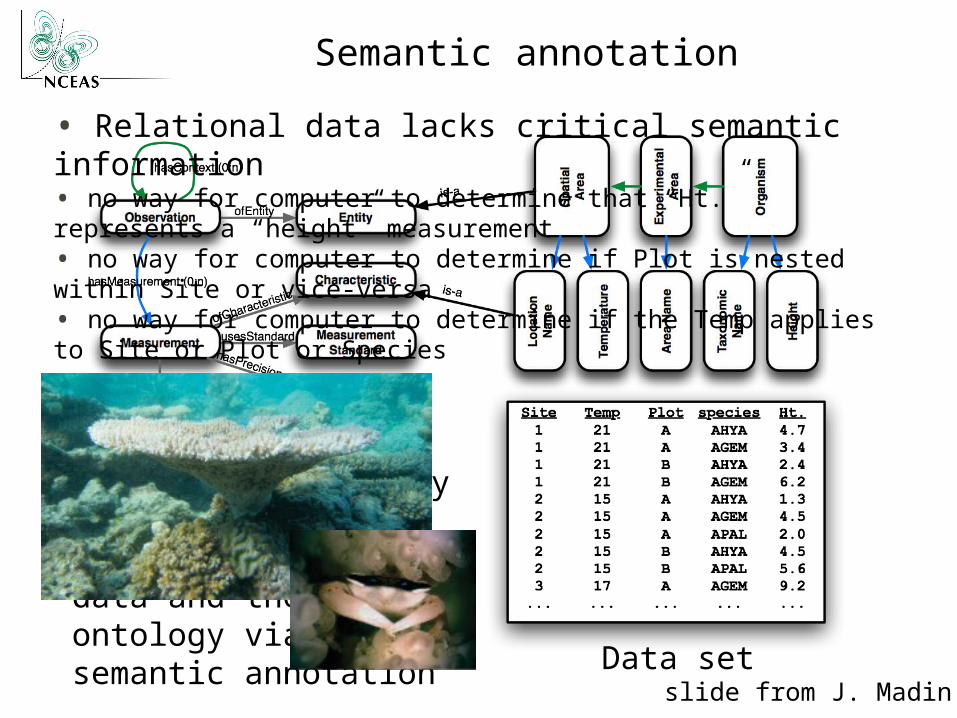
Semantic annotation
Observation Ontology
Data set
Mapping between data and the ontology via semantic annotation
slide from J. Madin
• Relational data lacks critical semantic information• no way for computer to determine that “Ht.” represents a “height” measurement • no way for computer to determine if Plot is nested within Site or vice-versa• no way for computer to determine if the Temp applies to Site or Plot or Species

Scientific Observations
• An Observation is the
Measurement of the Value of a
Characteristic of some Entity
in a particular Context
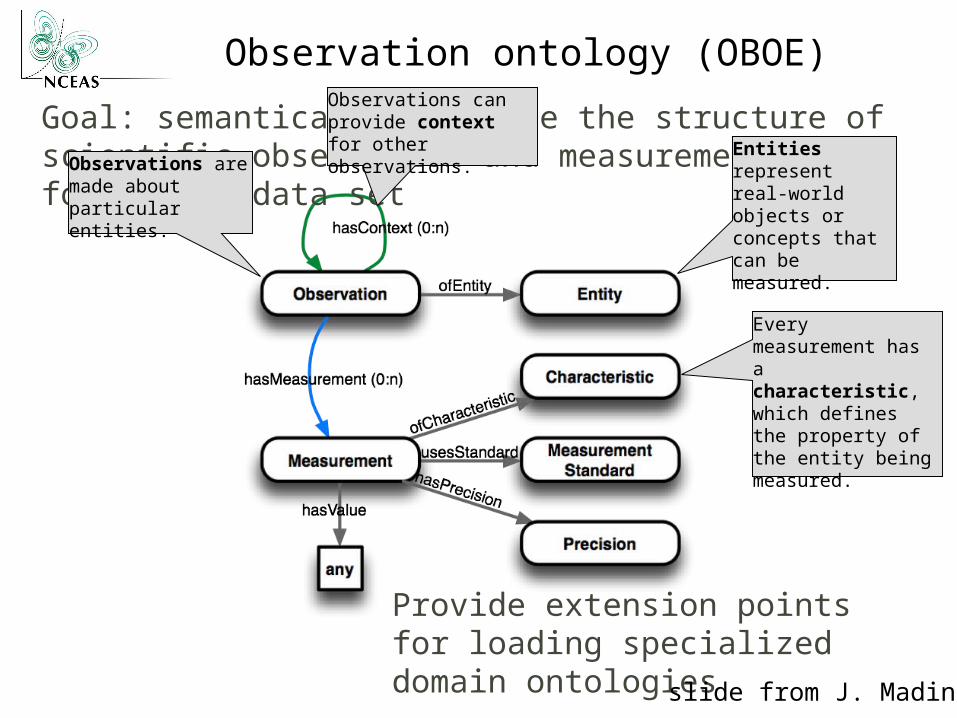
Provide extension points for loading specialized domain ontologies
Goal: semantically describe the structure of scientific observation and measurement as found in a data set
Observation ontology (OBOE)
Entities represent real-world objects or concepts that can be measured.
Observations are made about particular entities.
Every measurement has a characteristic, which defines the property of the entity being measured.
Observations can provide context for other observations.
slide from J. Madin

Datasets vs. Observations
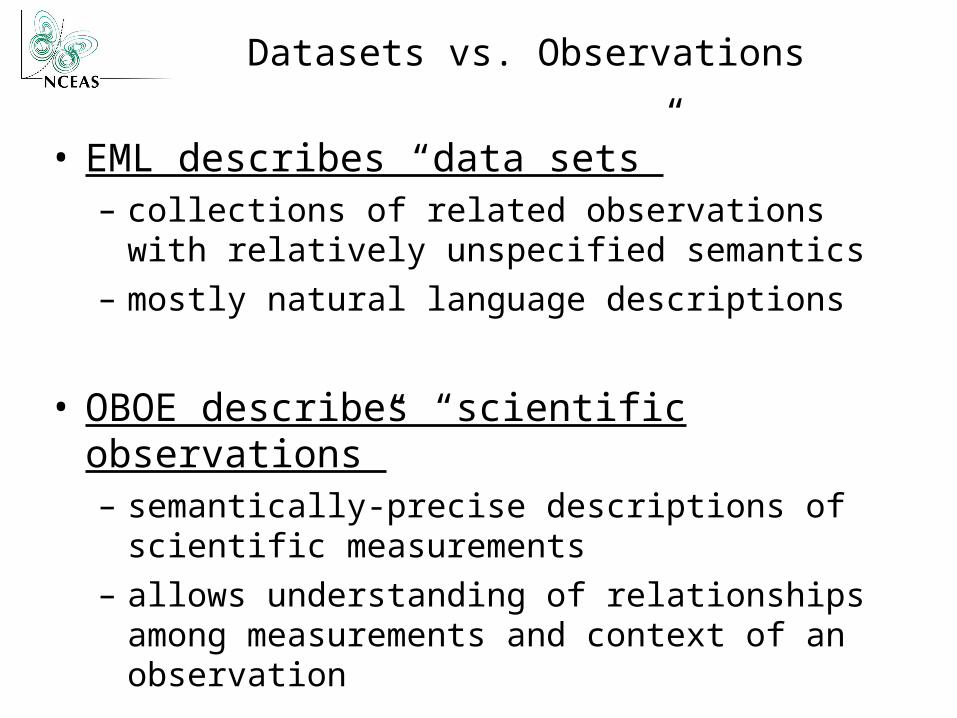
• EML describes “data sets”– collections of related observations with relatively unspecified semantics
– mostly natural language descriptions
• OBOE describes “scientific observations”– semantically-precise descriptions of scientific measurements
– allows understanding of relationships among measurements and context of an observation
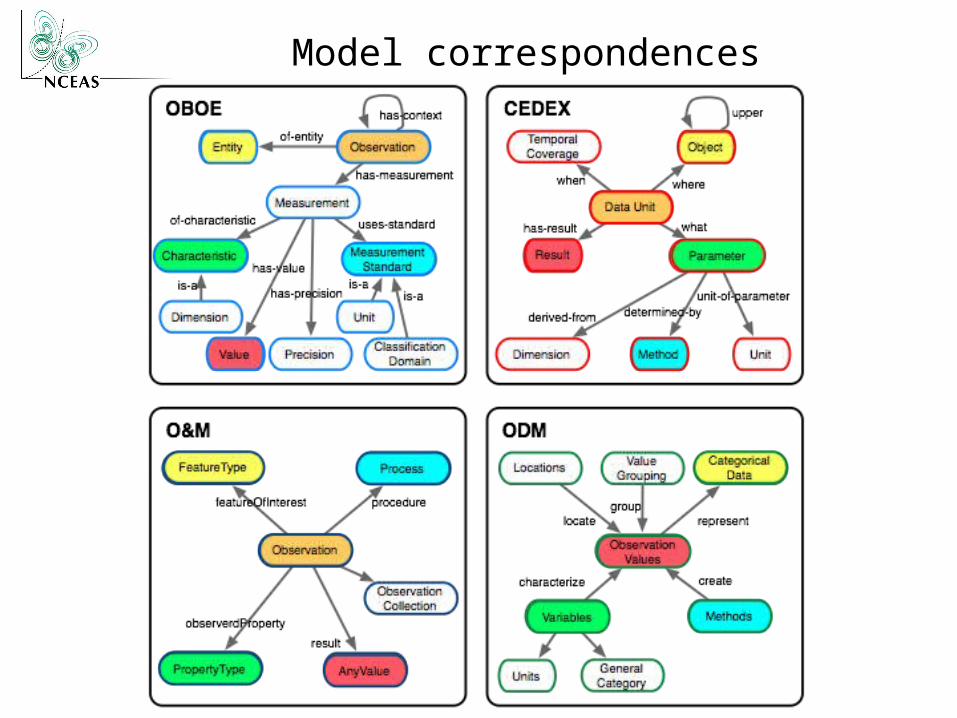
Model correspondences
TDWG Observations Task Group
• An Observation is the Measurement of the Value of a Characteristic of some Entity in a particular Context
• Create: Community-sanctioned, extensible, and unified ontology model for observational data– Compatible with existing standards
– Integrate with metadata standards such as EML, CSDGM, etc.
– Reduce the “babel” of scientific dialects
Questions?
• http://www.nceas.ucsb.edu/ecoinformatics/
• http://knb.ecoinformatics.org/• http://seek.ecoinformatics.org/• http://kepler-project.org/

Acknowledgments
• This material is based upon work supported by:
• The National Science Foundation under Grant Numbers 9980154, 9904777, 0131178, 9905838, 0129792, and 0225676.
• Collaborators: NCEAS (UC Santa Barbara), University of New Mexico (Long Term Ecological Research Network Office), San Diego Supercomputer Center, University of Kansas (Center for Biodiversity Research), University of Vermont, University of North Carolina, Napier University, Arizona State University, UC Davis
• The National Center for Ecological Analysis and Synthesis, a Center funded by NSF (Grant Number 0072909), the University of California, and the UC Santa Barbara campus.
• The Andrew W. Mellon Foundation.
• Kepler contributors: SEEK, Ptolemy II, SDM/SciDAC, GEON, RoadNet, EOL, Resurgence