Embed Size (px)
Citation preview

Direct Relationships
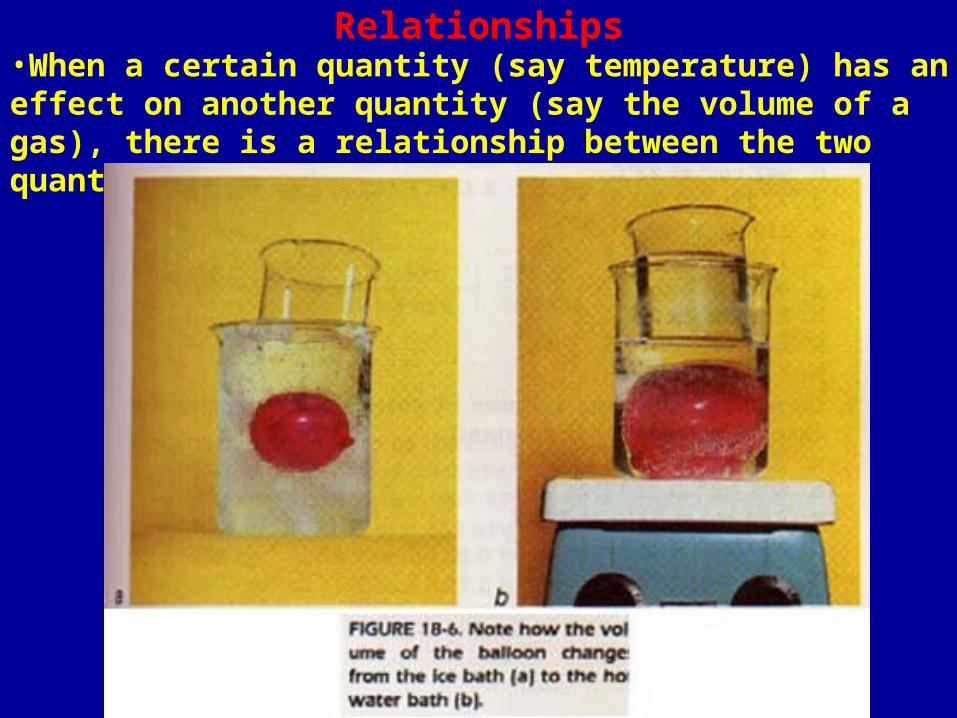
Relationships•When a certain quantity (say temperature) has an effect on another quantity (say the volume of a gas), there is a relationship between the two quantities.
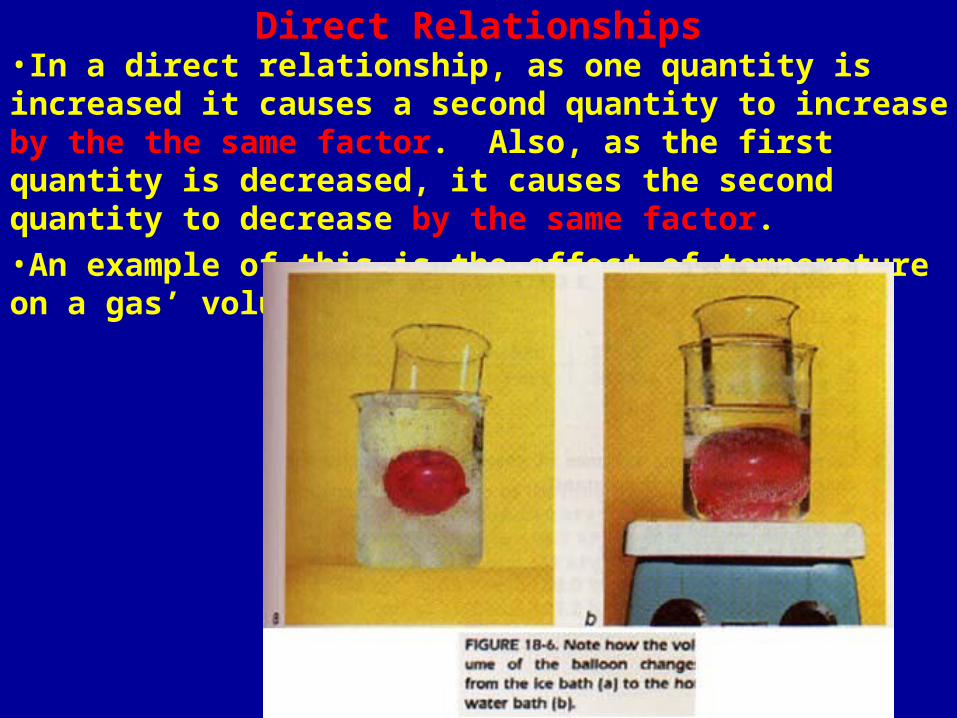
Direct Relationships•In a direct relationship, as one quantity is increased it causes a second quantity to increase by the the same factor. Also, as the first quantity is decreased, it causes the second quantity to decrease by the same factor.•An example of this is the effect of temperature on a gas’ volume

By The Same Factor – Its Meaning•Doubling the absolute temperature (degrees Kelvin) doubles the volume. Reducing the absolute temperature (degrees Kelvin) by one third reduces the volume by one third.
• 1V T doubled
2V
1V T down 1/3 V down 1/3

Effect of Temperature on Gas Volume•A gas’ volume is directly related to its absolute temperature (Also known as Charles’ Law).

Direct Relation Data and Graph
•Note that the graph of a direct relation is a straight line that passes through the origin (0,0).
Gas Volume vs Absolute Temperature
0123456789
0 100 200 300 400 500
Degrees Kelvin
Volu
me
(L)
Absolute Temp (K)
Gas Volume
(L)
100 2
200 4
300 6
400 8
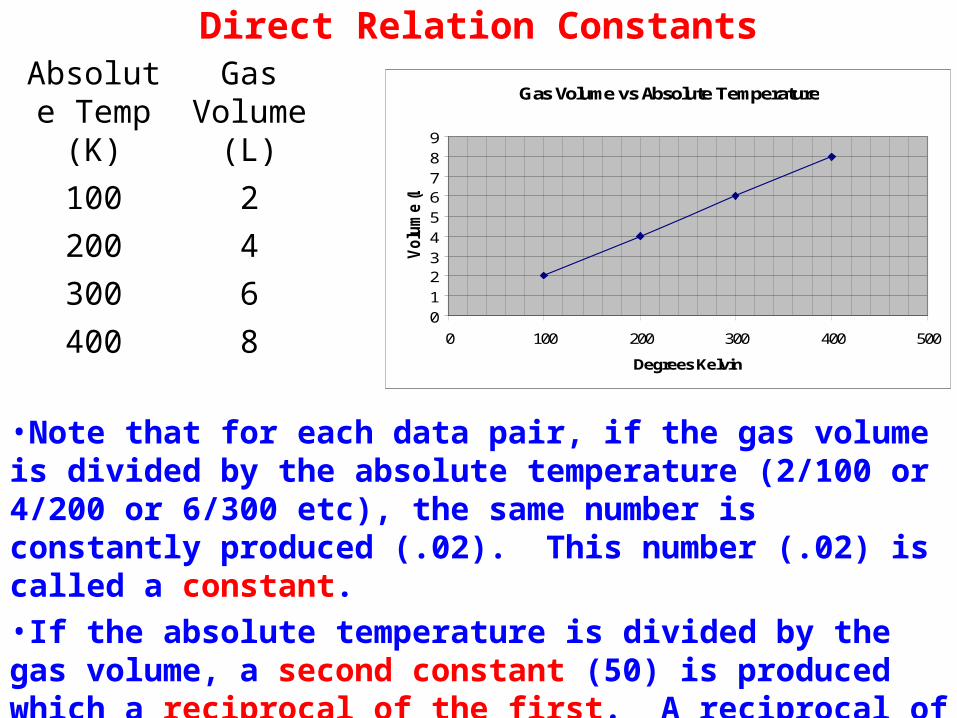
Direct Relation Constants
•Note that for each data pair, if the gas volume is divided by the absolute temperature (2/100 or 4/200 or 6/300 etc), the same number is constantly produced (.02). This number (.02) is called a constant.•If the absolute temperature is divided by the gas volume, a second constant (50) is produced which a reciprocal of the first. A reciprocal of x = 1/x. Note 1/50 = .02
Gas Volume vs Absolute Temperature
0123456789
0 100 200 300 400 500
Degrees Kelvin
Volu
me
(L)
Absolute Temp (K)
Gas Volume
(L)
100 2
200 4
300 6
400 8

The Slope of a Direct Relation Graph
•The slope of a direct relation graph is the constant obtained by dividing the y axis quantity by the x axis quantity. In this example, the slope = vol.(L)/deg.(K) = Δy/Δx = 2/100 or 4/200 = .02
Gas Volume vs Absolute Temperature
0123456789
0 100 200 300 400 500
Degrees Kelvin
Volu
me
(L)
Absolute Temp (K)
Gas Volume
(L)
100 2
200 4
300 6
400 8
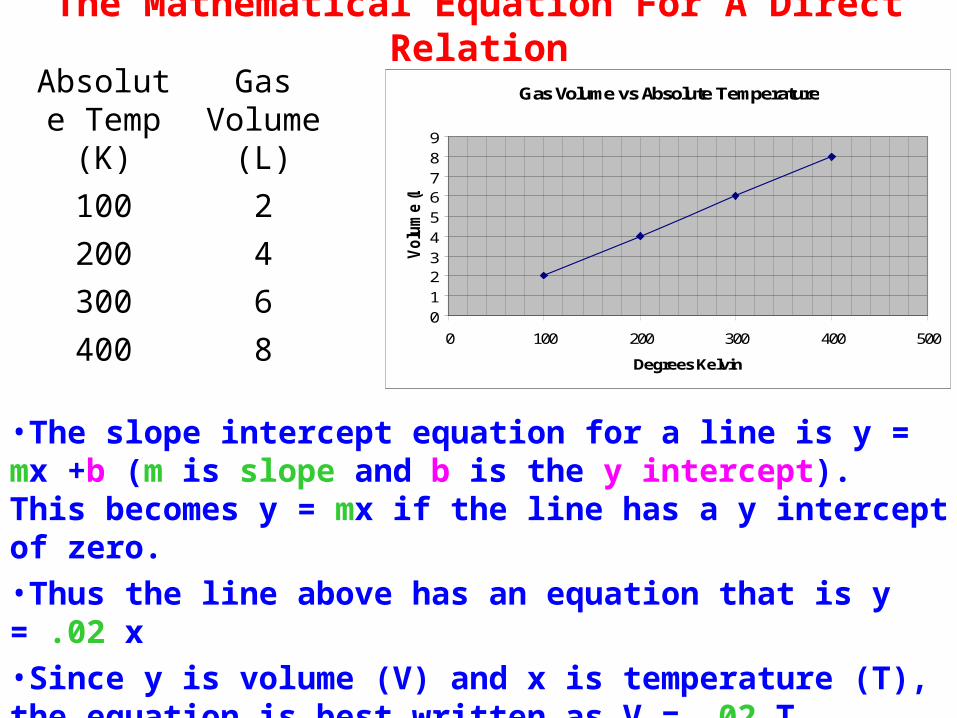
The Mathematical Equation For A Direct Relation
•The slope intercept equation for a line is y = mx +b (m is slope and b is the y intercept). This becomes y = mx if the line has a y intercept of zero.•Thus the line above has an equation that is y = .02 x•Since y is volume (V) and x is temperature (T), the equation is best written as V = .02 T
Gas Volume vs Absolute Temperature
0123456789
0 100 200 300 400 500
Degrees Kelvin
Volu
me
(L)
Absolute Temp (K)
Gas Volume
(L)
100 2
200 4
300 6
400 8
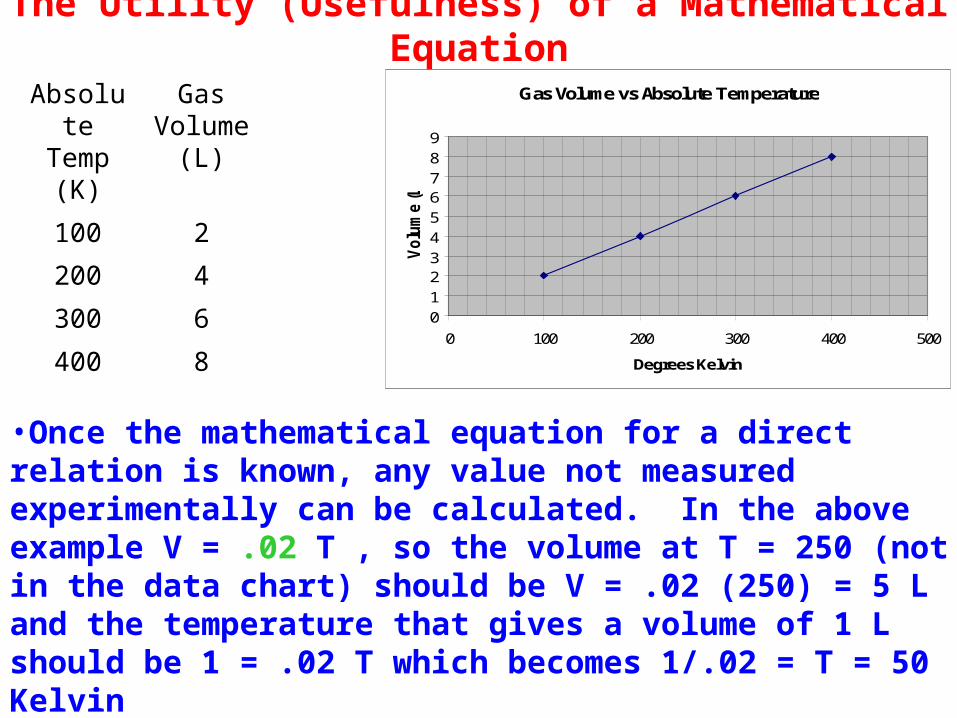
The Utility (Usefulness) of a Mathematical Equation
•Once the mathematical equation for a direct relation is known, any value not measured experimentally can be calculated. In the above example V = .02 T , so the volume at T = 250 (not in the data chart) should be V = .02 (250) = 5 L and the temperature that gives a volume of 1 L should be 1 = .02 T which becomes 1/.02 = T = 50 Kelvin•The equation allows any value not measured to be calculated
Gas Volume vs Absolute Temperature
0123456789
0 100 200 300 400 500
Degrees Kelvin
Volu
me
(L)
Absolute Temp
(K)
Gas Volume
(L)
100 2
200 4
300 6
400 8
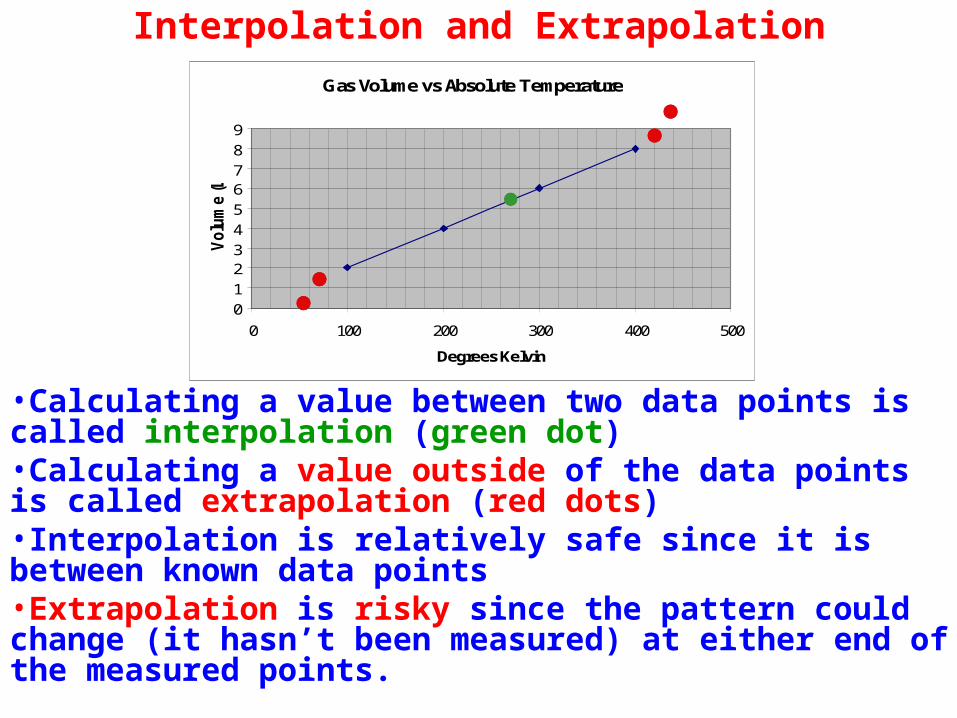
Interpolation and Extrapolation
•Calculating a value between two data points is called interpolation (green dot)•Calculating a value outside of the data points is called extrapolation (red dots)•Interpolation is relatively safe since it is between known data points•Extrapolation is risky since the pattern could change (it hasn’t been measured) at either end of the measured points.
Gas Volume vs Absolute Temperature
0123456789
0 100 200 300 400 500
Degrees Kelvin
Volu
me
(L)

Inverse or Indirect Relationship•In an inverse relationship as one quantity is increased a second quantity is decreased by the same factor. As an example, if the pressure on a gas is doubled (2 times), the volume of the gas will be decreased by one half (1/2 times). If the pressure on a gas is reduced by 1/3, the gas volume will increase by 3 times. One quantity goes opposite to the other by the same factor.
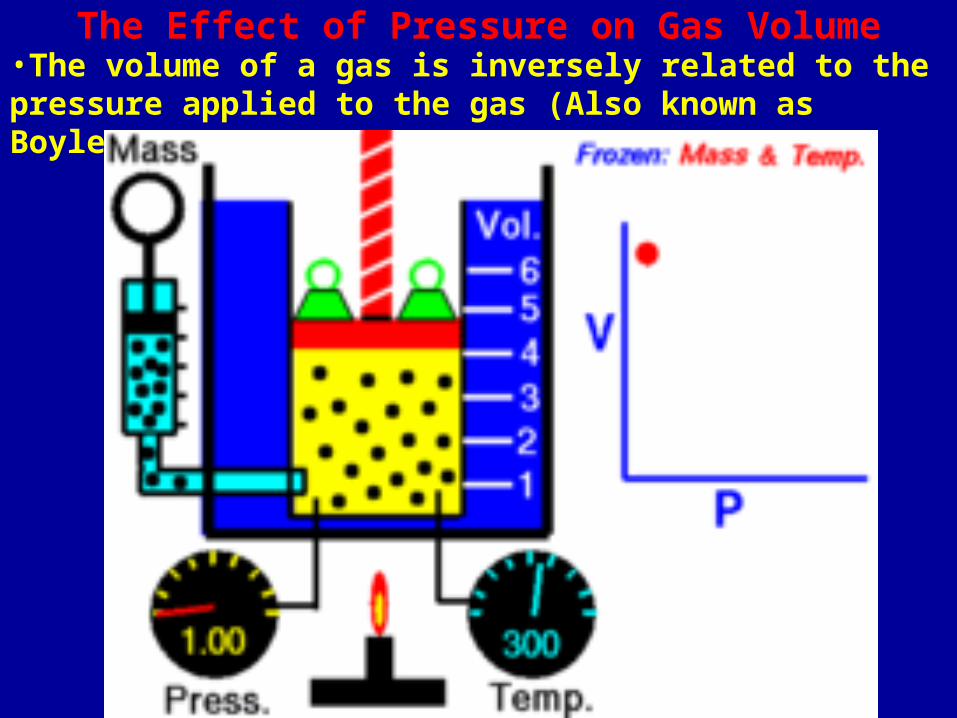
The Effect of Pressure on Gas Volume•The volume of a gas is inversely related to the pressure applied to the gas (Also known as Boyle’s Law).
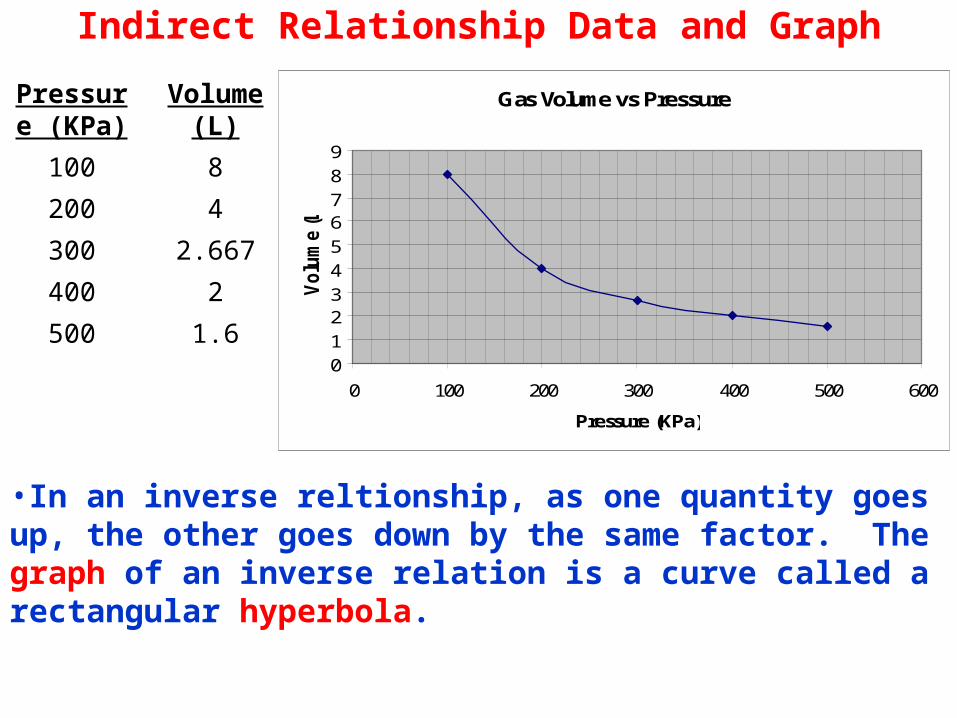
Indirect Relationship Data and Graph
•In an inverse reltionship, as one quantity goes up, the other goes down by the same factor. The graph of an inverse relation is a curve called a rectangular hyperbola.
Pressure (KPa)
Volume (L)
100 8
200 4
300 2.667
400 2
500 1.6
Gas Volume vs Pressure
0123456789
0 100 200 300 400 500 600
Pressure (KPa)
Volu
me
(L)

The Indirect Relationship Constant
•In inverse relationships if one quantity of a data pair is multiplied times the other quantity, a constant is obtained. Note that 100*8 = 800, 200*4 = 800, 300*2.667 = 800 etc.
Pressure (KPa)
Volume (L)
100 8
200 4
300 2.667
400 2
500 1.6
Gas Volume vs Pressure
0123456789
0 100 200 300 400 500 600
Pressure (KPa)
Volu
me
(L)
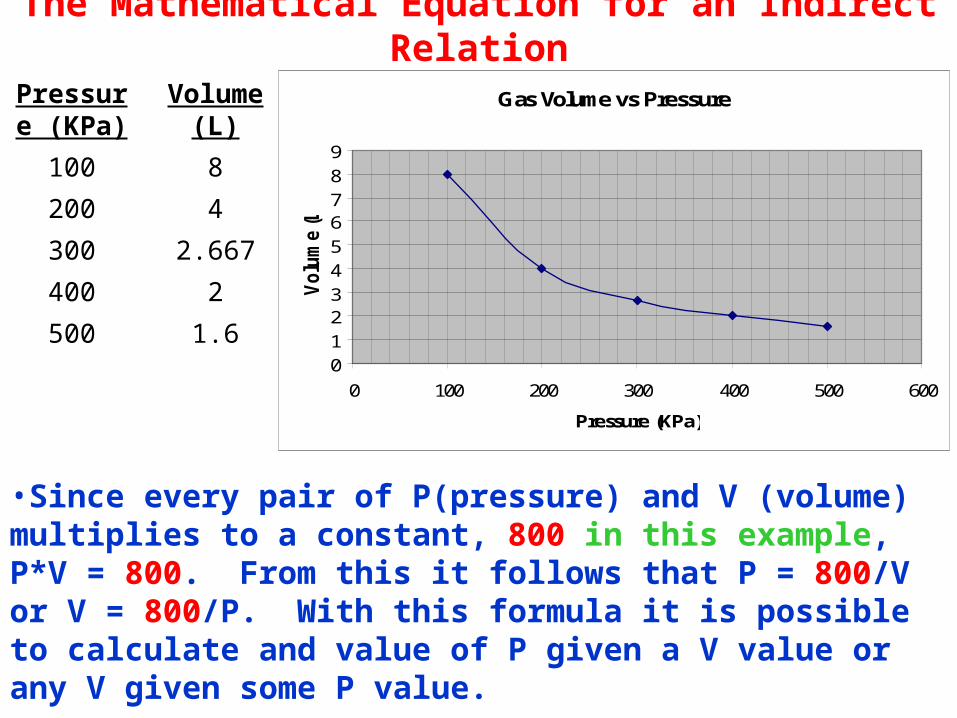
The Mathematical Equation for an Indirect Relation
•Since every pair of P(pressure) and V (volume) multiplies to a constant, 800 in this example, P*V = 800. From this it follows that P = 800/V or V = 800/P. With this formula it is possible to calculate and value of P given a V value or any V given some P value.
Pressure (KPa)
Volume (L)
100 8
200 4
300 2.667
400 2
500 1.6
Gas Volume vs Pressure
0123456789
0 100 200 300 400 500 600
Pressure (KPa)
Volu
me
(L)
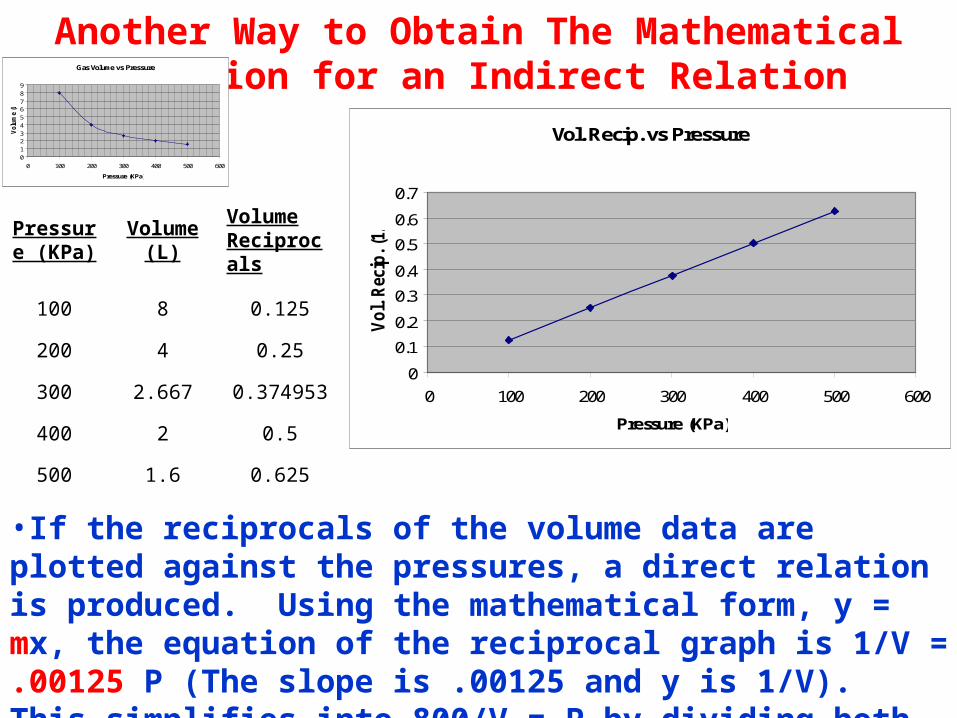
Another Way to Obtain The Mathematical Equation for an Indirect Relation
•If the reciprocals of the volume data are plotted against the pressures, a direct relation is produced. Using the mathematical form, y = mx, the equation of the reciprocal graph is 1/V = .00125 P (The slope is .00125 and y is 1/V). This simplifies into 800/V = P by dividing both sides by .00125
Gas Volume vs Pressure
0123456789
0 100 200 300 400 500 600
Pressure (KPa)
Volu
me
(L)
Vol. Recip. vs Pressure
0
0.1
0.2
0.3
0.4
0.5
0.6
0.7
0 100 200 300 400 500 600
Pressure (KPa)
Vol. R
ecip
. (1
/L)
Pressure (KPa)
Volume (L)
Volume Reciprocals
100 8 0.125
200 4 0.25
300 2.667 0.374953
400 2 0.5
500 1.6 0.625
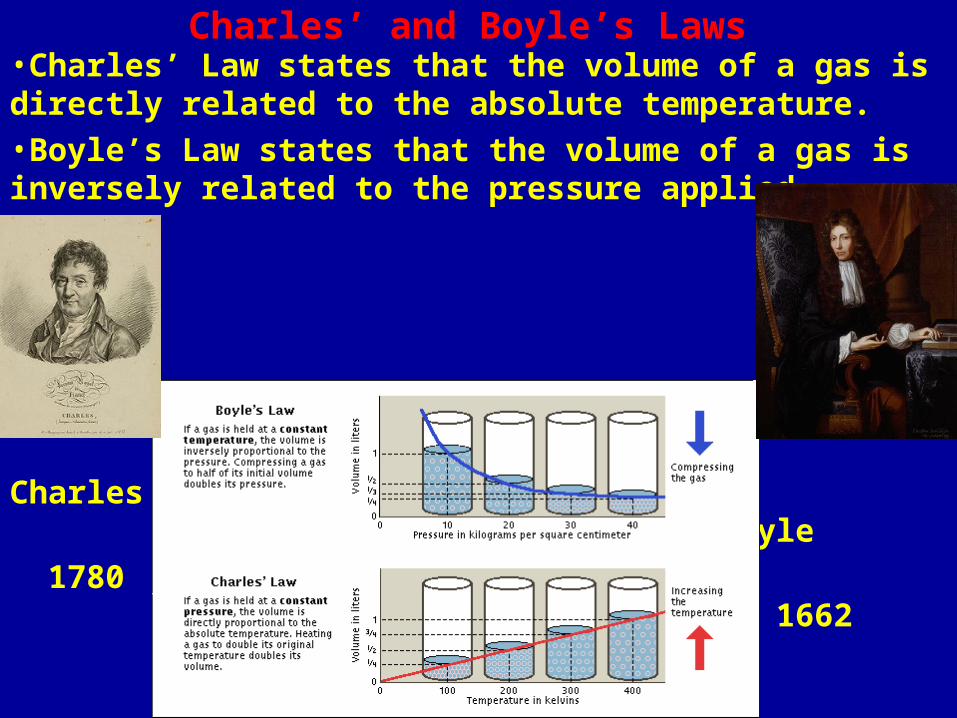
Charles’ and Boyle’s Laws •Charles’ Law states that the volume of a gas is directly related to the absolute temperature.•Boyle’s Law states that the volume of a gas is inversely related to the pressure applied.
Charles Boyle
1780 1662

Fitting Data to a Mathematical Equation
•Use a graphics calculator or computer to change the y values so that the changed y values graphed against the x values produces a straight line (Use trial and error – the inverse operation [operation undoing what the original operation did] to the original relation produces a straight line). In this example, the square root produces a st. line since the original relation was a squared relation. Note that inverse operation has a different meaning from inverse relation.
Distance Fallen vs Time
0
20
40
60
80
100
120
140
0 1 2 3 4 5 6
Time (s)
Dis
tance
(m
)
Roots of Distance vs Time
0
2
4
6
8
10
12
0 1 2 3 4 5 6
Time (s)
Dis
tance
Roots
Time (s)Distance
(m)Roots of Distance
0 0 0
1 4.9 2.213594
2 19.6 4.427189
3 44.1 6.640783
4 78.4 8.854377
5 122.5 11.06797

Fitting Data to a Mathematical Equation
•From the straight line graph and the mathematical pattern, y = mx, the equation for the data must be √d = 2.213594 t since y is √d, x is t and the slope is 2.213594. By squaring both sides the equation becomes d = 4.9t2 . Thus the mathematical equation for the data is d = 4.9t2 .
Roots of Distance vs Time
0
2
4
6
8
10
12
0 1 2 3 4 5 6
Time (s)
Dis
tance
Roots
Time (s)Distance
(m)Roots of Distance
0 0 0
1 4.9 2.213594
2 19.6 4.427189
3 44.1 6.640783
4 78.4 8.854377
5 122.5 11.06797
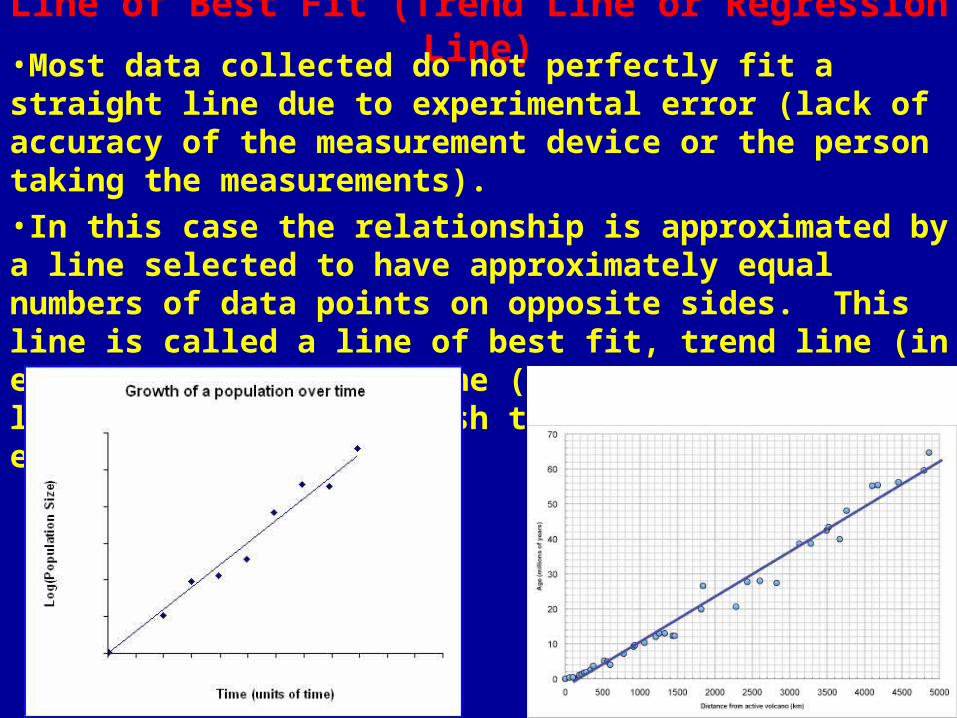
Line of Best Fit (Trend Line or Regression Line)•Most data collected do not perfectly fit a straight line due to experimental error (lack of accuracy of the measurement device or the person taking the measurements).•In this case the relationship is approximated by a line selected to have approximately equal numbers of data points on opposite sides. This line is called a line of best fit, trend line (in excel) or regression line (Logger Pro). This line is used to establish the mathematical equation for the data.

A•A

A•A


![How to Say Anything to Anyone - a Guide to Building Business Relationships That Really Work - Shari Harley [Qwerty80]](https://img.pdfslide.us/doc/110x75/577cce581a28ab9e788dd0fa/how-to-say-anything-to-anyone-a-guide-to-building-business-relationships.jpg)