Embed Size (px)
Citation preview

In the format provided by the authors and unedited.
© 2017 Macmillan Publishers Limited, part of Springer Nature. All rights reserved.
Supplemental Information for
Direct optical detection of Weyl fermion chirality in a topological
semimetal
(Dated: March 10, 2017)
1
SUPPLEMENTARY INFORMATIONDOI: 10.1038/NPHYS4146
NATURE PHYSICS | www.nature.com/naturephysics 1
© 2017 Macmillan Publishers Limited, part of Springer Nature. All rights reserved.
This file includes:
I. Symmetry relation of the Weyl nodes in TaAs
II. Temperature and power dependences of the photocurrent
III. Materials and methods
III.1. Mid-infrared photocurrent microscopy setup
III.2. Single crystal growth and magneto-transport measurements
III.3. First-principles band structure calculations
III.4. Methods for photocurrent calculations
III.5. Single crystal x-ray diffraction methods
IV. Details of the photocurrent calculations
IV.1. An intuitive explanation for the non-vanishing photocurrent
in an inversion breaking Weyl semimetal
IV.2. Symmetry analyses of the photocurrent
IV.3. Calculated photocurrents from each Weyl fermion
IV.4. Estimation of the photocurrent amplitude
V. Exclusion of other CPGE mechanisms
VI. Additional photocurrent measurements
VII. Previous transport and ARPES measurements on Weyl semimetals
2NATURE PHYSICS | www.nature.com/naturephysics 2
SUPPLEMENTARY INFORMATIONDOI: 10.1038/NPHYS4146

© 2017 Macmillan Publishers Limited, part of Springer Nature. All rights reserved.
I. SYMMETRY RELATION BETWEEN WEYL NODES IN TaAs
TaAs crystalizes in a body-centered tetragonal lattice system. The lattice constants are
a = b = 3.437 A and c = 11.646 A, and the space group is I41md (#109, C4v) (Fig. S1).
The important symmetries are the time-reversal symmetry (T ), the four-fold rotational
symmetry around the z axis (C4z) and two mirror reflections about x = 0 and y = 0 (Mx
and My). Interestingly, the chirality flips under a mirror reflection M, whereas it remains
unchanged under time-reversal T and the C4z rotation. More specifically, the transformation
under symmetries can be written as
|χ = ±1, kx, ky, kzMx=⇒ |χ = ∓1,−kx, ky, kz (S1)
|χ = ±1, kx, ky, kzT
=⇒ |χ = ±1,−kx,−ky,−kz (S2)
|χ = ±1, kx, ky, kzC4z=⇒ |χ = ±1,−ky, kx, kz. (S3)
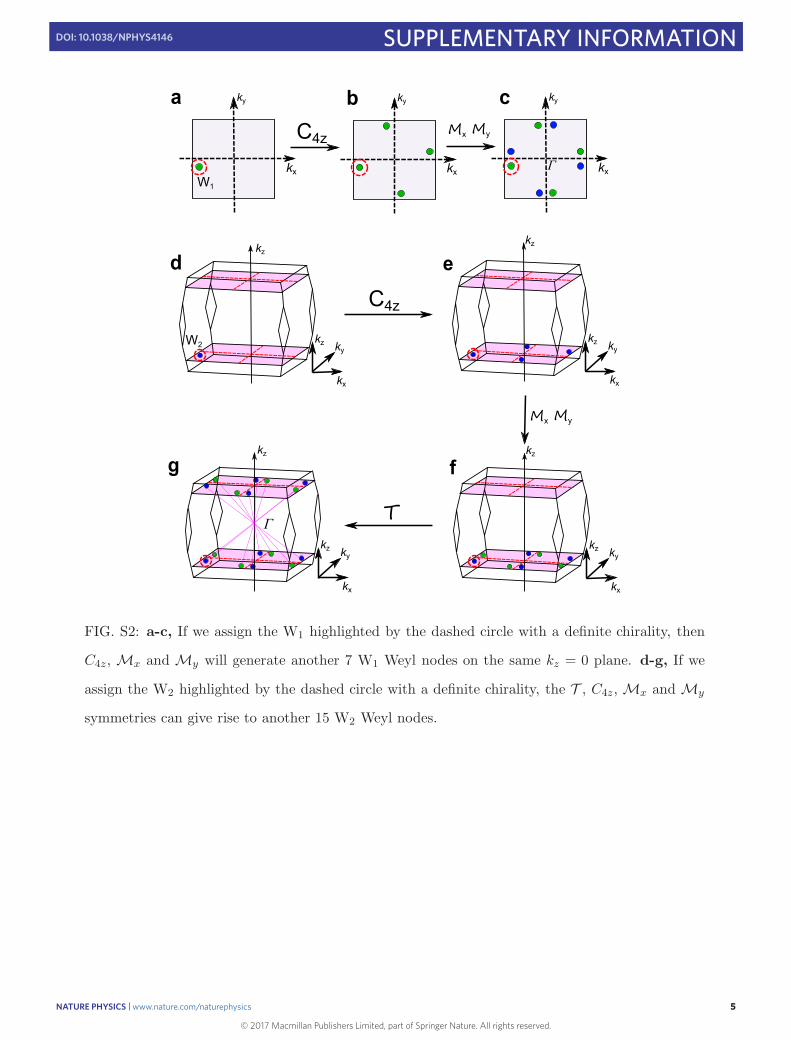
We use these symmetries to understand the Weyl node configuration in TaAs. If we pick
one Weyl node on the kz = 0 plane (W1) and assign its chirality, then C4z, Mx and My
will generate another 7 W1 Weyl nodes on the same kz = 0 plane (Fig. S2a-c). Similarly,
if we fix one Weyl node at a finite kz (kz = k0 = 0, labeled W2), the T , C4z, Mx and My
symmetries can give rise to another 15 W2 Weyl nodes at both kz = ±k0 planes (Fig. S2d-g).
Therefore, among the total 24 Weyl nodes in TaAs, only two are independent Weyl nodes
and the others can be automatically related by symmetries.
We define Jn as the photocurrent from the nth Weyl node. We explain the following issue:
If two Weyl nodes (i, j) are related by certain symmetry, whether their currents ( J i, J j) can
also be related by the symmetry.
• If Weyl nodes (i, j) are related by a 90 rotation around z (C4z), then J i, J j can only
be related by C4z if the light propagates along z (Figs. S3a,b). Specifically, if the
propagation direction of the light is along z, we have J jx = −J i
y, Jjy = J i
x, Jjz = J i
z.
• If Weyl nodes (i, j) are related by the mirror plane Mx, then J i, J j can only be related
by Mx if the light propagates along x (Figs. S3c,d). Specifically, if the propagation
direction of the light is along x, we have J jx = −J i
x, Jjy = J i
y, Jjz = J i
z.
3NATURE PHYSICS | www.nature.com/naturephysics 3
SUPPLEMENTARY INFORMATIONDOI: 10.1038/NPHYS4146

© 2017 Macmillan Publishers Limited, part of Springer Nature. All rights reserved.
c
a
y
a
FIG. S1: Crystal structure of TaAs and relevant symmetries. a, A unit cell of TaAs lattice. b, No
mirror symmetry along c. c, Mirror symmetries along a(b) and the four-fold rotational symmetry
around z axis (C4z).
4NATURE PHYSICS | www.nature.com/naturephysics 4
SUPPLEMENTARY INFORMATIONDOI: 10.1038/NPHYS4146
© 2017 Macmillan Publishers Limited, part of Springer Nature. All rights reserved.
a
Mx My
kz
kx
kyW2
kz
kx
ky
kz
kx
ky
e
g
T
kz
b c
dkz
kz
f
kz
kx
ky
kz
Γ
C4z
kx
ky
kx
ky
kx
ky
Γ
C4z Mx My
W1
FIG. S2: a-c, If we assign the W1 highlighted by the dashed circle with a definite chirality, then
C4z, Mx and My will generate another 7 W1 Weyl nodes on the same kz = 0 plane. d-g, If we
assign the W2 highlighted by the dashed circle with a definite chirality, the T , C4z, Mx and My
symmetries can give rise to another 15 W2 Weyl nodes.
5NATURE PHYSICS | www.nature.com/naturephysics 5
SUPPLEMENTARY INFORMATIONDOI: 10.1038/NPHYS4146

© 2017 Macmillan Publishers Limited, part of Springer Nature. All rights reserved.
FIG. S3: The propagation direction and electric field of the light in the presence of the C4z
rotational symmetry (panels (a,b)) or the mirror symmetry Mx (panels (c,d)).
6NATURE PHYSICS | www.nature.com/naturephysics 6
SUPPLEMENTARY INFORMATIONDOI: 10.1038/NPHYS4146

© 2017 Macmillan Publishers Limited, part of Springer Nature. All rights reserved.
II. TEMPERATURE AND POWER DEPENDENCE OF THE PHOTOCURRENT
FIG. S4: a, The photocurrent as a function of light polarization measured at different temperatures.
b, Temperature dependence of both the circularly polarized light induced photocurrent and the
photo-thermal current. c, Nearly linear power dependence of the circularly polarized light induced
photocurrent. The beam-size is 50 µm × 50 µm. Thus a 10 mW power corresponds to a power
density of about 4× 10⁶ W·m−2.
As one increases temperature from T = 10 K to T = 300 K, the circularly polarized
light induced photocurrent reduces significantly (Fig. S4a). This is quite intuitive since
the photocurrent depends on the relaxation time (see equation S7) and we expect the elec-
tron mobility and relaxation time decrease significantly with increasing temperature [8]. By
contrast, the photo-thermal current near the contact (Fig. S4b) increases with increasing
7NATURE PHYSICS | www.nature.com/naturephysics 7
SUPPLEMENTARY INFORMATIONDOI: 10.1038/NPHYS4146
© 2017 Macmillan Publishers Limited, part of Springer Nature. All rights reserved.
temperature. This is also expected because the Seebeck coefficient of metals is larger at
higher temperatures [9]. The temperature dependent data, especially the opposite tem-
perature trends seen in Fig. S4b allow us to further separate these two effects.The power
dependence in Fig. S4c shows that our measurements stay in the linear regime.
8NATURE PHYSICS | www.nature.com/naturephysics 8
SUPPLEMENTARY INFORMATIONDOI: 10.1038/NPHYS4146

© 2017 Macmillan Publishers Limited, part of Springer Nature. All rights reserved.
III MATERIALS AND METHODS
III.1. Mid-infrared photocurrent microscopy setup
c 200
-200
I (nA
)
b
y
z
a a
cb
FIG. S5: a, Mid-infrared photocurrent microscopy setup. b, Optical photograph of the TaAs
device. Scale bar: 300 µm. c, Reflection image of the entire device. d, Photocurrent image of the
device.
In our experiment, the sample is contacted with metal wires and placed in an optical
scanning microscope setup (Figs. S5a,b) that combines electronic transport measurements
with light illumination [1, 2]. The laser source is a temperature-stablized CO2 laser with
a wavelength λ = 10.6 µm (ω ≃ 120 meV). A focused beam spot (diameter d ≈ 50
µm) is scanned (using a two axis piezo-controlled scanning mirror) over the entire sample
and the current is recorded at the same time to form a colormap of photocurrent as a
function of spatial positions (Fig. S5d). Reflected light from the sample is collected to form
a simultaneous reflection image of the sample (Fig. S5c). The absolute location of the photo-
induced signal is therefore found by comparing the photocurrent map to the reflection image.
The light is first polarized by a polarizer and the chirality of light is further modulated by
a rotatable quarter-wave plate characterized by an angle θ.
9NATURE PHYSICS | www.nature.com/naturephysics 9
SUPPLEMENTARY INFORMATIONDOI: 10.1038/NPHYS4146

© 2017 Macmillan Publishers Limited, part of Springer Nature. All rights reserved.
FIG. S6: a, Hall resistivity measurement of the TaAs sample. b, Shubnikov-de Haas (SdH)
oscillation of the longitudinal resistivity of the TaAs sample used for photocurrent measurements.
The non-oscillatory-background is removed. The quantum oscillation is described by ρxx = ρ0[1 +
A(B,T ) cos(2π(F/B+γ))] [4], where A(B,T ) is the amplitude of the oscillations, F is the frequency
of the oscillation, and γ is the Onsager phase. The frequency of the oscillation is obtained from
this data is F = 7.7 T. c, First-principles calculated extremal area of the W1 Fermi surface as
a function of the energy from the W1 Weyl node. d, Schematic band structure of the W1 and
W2 WFs. According to the first-principles calculations, the W2 Weyl node is 13 meV above the
W1 Weyl node. By matching the measured extremal area of the Fermi surface to our calculations
(panel (c)), we obtain that the Fermi level is about 17.8 meV above the W1 Weyl nodes.
III.2. Single crystal growth and magneto-transport measurements
Single crystals of TaAs were prepared by the standard chemical vapor transfer (CVT)
method. The polycrystalline samples were prepared by heating up the stoichiometric mix-
10NATURE PHYSICS | www.nature.com/naturephysics 10
SUPPLEMENTARY INFORMATIONDOI: 10.1038/NPHYS4146

© 2017 Macmillan Publishers Limited, part of Springer Nature. All rights reserved.
tures of high quality Ta (99.98%) and As (99.999%) powders in an evacuated quartz am-
poule. Then the powder of TaAs (300 mg) and the transport agent were sealed in a long
evacuated quartz ampoule (30 cm). The end of the sealed ampoule was placed horizontally
at the center of a single-zone furnace. The central zone of the furnace was slowly heated
up to 1273 K and kept at the temperature for 5 days, while the cold end was less than
973 K. Magneto-transport measurements were performed using a Quantum Design Physical
Property Measurement System.
Figure S6a shows the Hall resistivity measurement at T = 2 K. The negative slope
of ρyx − B data shows that the sample’s magneto-transport is dominated by electron-like
carriers at low-temperatures. The oscillatory part of the longitudinal resistivity (Fig. S6b)
is periodic in 1B. The observed quantum oscillations are described by the standard formula
ρxx = ρ0[1+A(B, T ) cos(2π(F/B+γ))] [4], where A(B, T ) is the amplitude of the oscillations,
F is the frequency of the oscillation, and γ is the Onsager phase. By Fourier analysis of
the ρxx(1B) data, we obtain a frequency F = 7.7 T. The extremal cross-section area of the
Fermi surface (AF) can be obtained from the SdH oscillation frequency by AF = 2πeF =
7.3 × 10⁻⁴ A−2. These numbers extracted from the SdH oscillation is very close to our
previous measurements on similar TaAs samples [3]. In Fig. S6c, we show the calculated
extremal area of W1 Fermi surface. By matching the measured value to our calculation, we
obtain that the Fermi level is about 17.8 meV above the W1 Weyl nodes. Since calculations
show that the W2 Weyl node is 13 meV higher than the W1 node, the Fermi level is about
4.8 meV above the W2 Weyl node. Therefore, EF is very close to the W2 Weyl nodes
but relatively far from the W1 Weyl nodes. This explains the electron-like Hall resistivity
observed in Fig. S6a. Moreover, as shown in Ref.[5], the photocurrent vanishes when EF is
located at the Weyl node. Therefore, we expect that our observed photocurrent is dominated
by the contribution from the W1 WFs.
11NATURE PHYSICS | www.nature.com/naturephysics 11
SUPPLEMENTARY INFORMATIONDOI: 10.1038/NPHYS4146
© 2017 Macmillan Publishers Limited, part of Springer Nature. All rights reserved.
III.3. First-principles band structure calculations
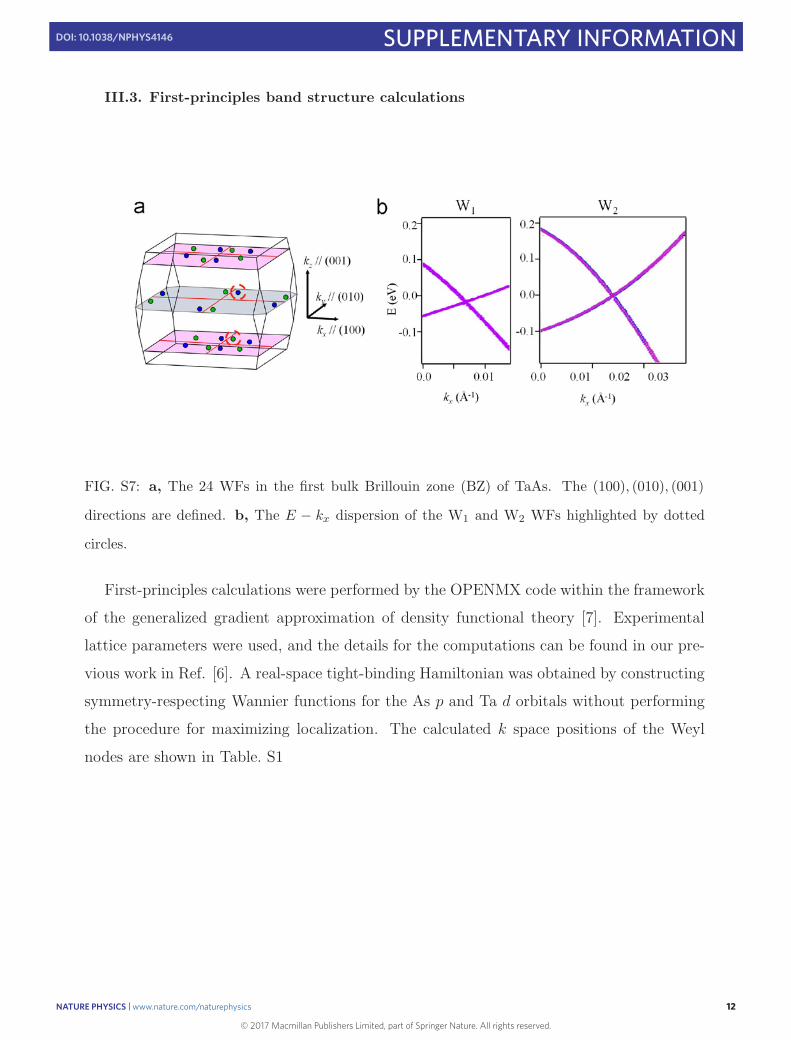
FIG. S7: a, The 24 WFs in the first bulk Brillouin zone (BZ) of TaAs. The (100), (010), (001)
directions are defined. b, The E − kx dispersion of the W1 and W2 WFs highlighted by dotted
circles.
First-principles calculations were performed by the OPENMX code within the framework
of the generalized gradient approximation of density functional theory [7]. Experimental
lattice parameters were used, and the details for the computations can be found in our pre-
vious work in Ref. [6]. A real-space tight-binding Hamiltonian was obtained by constructing
symmetry-respecting Wannier functions for the As p and Ta d orbitals without performing
the procedure for maximizing localization. The calculated k space positions of the Weyl
nodes are shown in Table. S1
12NATURE PHYSICS | www.nature.com/naturephysics 12
SUPPLEMENTARY INFORMATIONDOI: 10.1038/NPHYS4146

© 2017 Macmillan Publishers Limited, part of Springer Nature. All rights reserved.
kx (πa ) ky (πa ) kz (πc )
W1 0.014 0.949 0
W2 0.037 0.520 0.592
TABLE S1: The calculated k space positions of the Weyl nodes. The positions of other WFs can
be related by symmetries.
Direction v+ (eV·A) v− (eV·A)
(100) +2.03 -3.55
(010) +0.70 -2.48
(001) +0.17 -0.17
(110) +0.80 -3.14
(101) +1.42 -2.52
(011) +0.49 -1.78
TABLE S2: Calculated Fermi velocities of the W1 WF near at (kx, ky, ky) = (0.0072πa , 0.4752π
a , 0)
(highlighted by the dotted circle). The Fermi velocities of other W1 WFs can be related by
symmetries.
We use the first-principles calculated band structure to obtain the degree of tilt needed
for our photocurrent calculation shown by Tables S2, S3. We see that v+ = −v−, which
means that the WFs in TaAs are indeed tilted.
The low-energy effective Hamiltonian expanded around each Weyl node can be generally
written as:
HWeyl(q) = vtqtσ0 + vFvi,jqiσj , (S4)
where vF is a velocity parameter without tilt, σj are Pauli matrices, vi,j represents anisotropy,
vt gives the tilt velocity and qt = t · q with t being the tilt direction. These parameters (vF,
vi,j, vt, qt) are obtained by fitting the dispersion from this effective Hamiltonian to that
of from the first-principles calculated results. In fact, along most directions away from the
Weyl node, linear band structure is a quite good approximation to the DFT band structure.
As an example, we study the dispersion of the W1 Weyl cone in Fig. S8 along the ky and kz
13NATURE PHYSICS | www.nature.com/naturephysics 13
SUPPLEMENTARY INFORMATIONDOI: 10.1038/NPHYS4146

© 2017 Macmillan Publishers Limited, part of Springer Nature. All rights reserved.
Direction v+ (eV·A) v− (eV·A)
(100) +1.57 -2.81
(010) +2.40 -1.01
(001) +0.92 -2.68
(110) +2.52 -2.41
(101) +0.30 -2.43
(011) +0.81 -1.06
TABLE S3: Calculated Fermi velocities of the W2 WF near at (kx, ky, ky) =
(0.01852πa , 0.28312π
a , 0.60002πc ) (highlighted by the dotted circle). The Fermi velocities of other
W2 WFs can be related by symmetries.
FIG. S8: a, The 24 Weyl nodes of TaAs in the BZ. The green arrows represent the k paths for the
dispersions shown in panels (b,c). b,c, Band structure of the W1 Weyl node along ky and kz as
indicated by the green arrows in panel (a).
directions. As shown in Figs. S8b,c, the DFT dispersions do not deviate significantly from
linearity.
On the other hand, we do find one exception, i.e the direction connecting two Weyl nodes.
The dispersion along this direction is heavily affected by nonlinear corrections, because one
Weyl cone “feels” the influence from its neighbour, as shown in Fig. S9. Most significantly,
the energy gap at k points between the two W1 nodes is always smaller than 120 meV
(Figs. S9a,b), which prohibits a 120 meV optical transition (The same issue does not exist
14NATURE PHYSICS | www.nature.com/naturephysics 14
SUPPLEMENTARY INFORMATIONDOI: 10.1038/NPHYS4146

© 2017 Macmillan Publishers Limited, part of Springer Nature. All rights reserved.
kx
ky
kz = 0
kx
ky
kz = +0.6 × /c
a b
c d
W2 cut x
W2 cut x
E(e
V)
kx
(Å-1)
-0 .12
-0.08
-0.04
0.00
0.04
0.08
-60 -40 -20 0 20 40 60x10
-3
-0 .08
-0.06
-0.04
-0.02
0.00
0.02
0.04
0.06
-30 -20 -10 0 10 20 30x10
-3
E(e
V)
W1 cut x
W1 cut x
FIG. S9: a,b, The dispersion across a pair of nearby Weyl nodes. The energy gap at k points
between the two W1 nodes is always smaller than 120 meV, which prohibits a 120 meV optical
transition. c,d, The same as panels (a,b) but for a pair of W2 nodes. The energy gap at k points
between two W2 nodes can be larger than 120 meV as shown in panel d.
for W2 because the gap goes above 120 meV, Figs. S9c,d) This was certainly not captured
in our linear approximation. In order to estimate how much this affects our result, we study
the dispersion as a function of θ (θ defined in Fig. S10a,b). In the kx, ky plane, we see
that the energy gap at kx = 0 increase with θ(Fig. S10e-g). At θ = 26, the energy gap
reaches 120 meV. Doing this analysis in 3D k space yields a solid angle (Figs. S10c,d) in the
“bridge” region connecting two nodes. The gap between the two W1 Weyl bands is smaller
(larger) than 120 meV inside (outside) this solid angle. For W1 Weyl cones, this solid angle
is 13% of the 4π solid angle. Therefore, the phase area that is strongly affected by this
nonlinear correction is quite small.
We further consider whether a 120 meV optical transition may involve a 3rd band.
Fig. S11b shows the band structure of the W1 Weyl cone. Within a ±1 eV energy win-
15NATURE PHYSICS | www.nature.com/naturephysics 15
SUPPLEMENTARY INFORMATIONDOI: 10.1038/NPHYS4146
© 2017 Macmillan Publishers Limited, part of Springer Nature. All rights reserved.
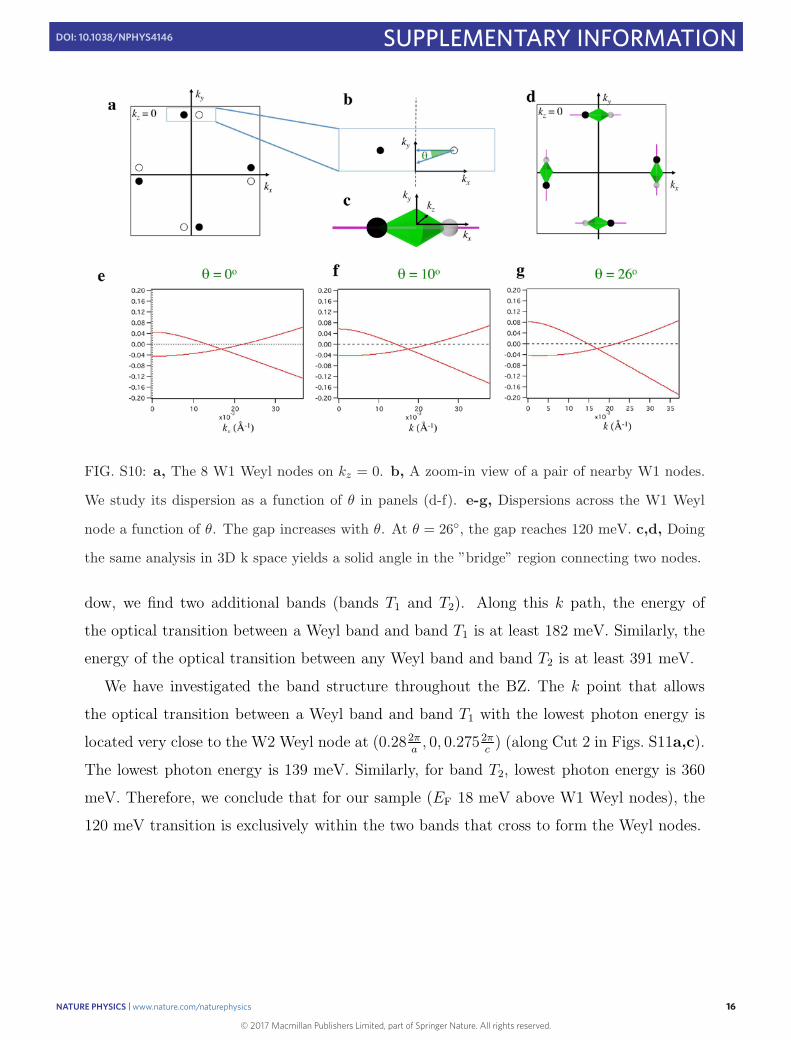
FIG. S10: a, The 8 W1 Weyl nodes on kz = 0. b, A zoom-in view of a pair of nearby W1 nodes.
We study its dispersion as a function of θ in panels (d-f). e-g, Dispersions across the W1 Weyl
node a function of θ. The gap increases with θ. At θ = 26, the gap reaches 120 meV. c,d, Doing
the same analysis in 3D k space yields a solid angle in the ”bridge” region connecting two nodes.
dow, we find two additional bands (bands T1 and T2). Along this k path, the energy of
the optical transition between a Weyl band and band T1 is at least 182 meV. Similarly, the
energy of the optical transition between any Weyl band and band T2 is at least 391 meV.
We have investigated the band structure throughout the BZ. The k point that allows
the optical transition between a Weyl band and band T1 with the lowest photon energy is
located very close to the W2 Weyl node at (0.282πa, 0, 0.2752π
c) (along Cut 2 in Figs. S11a,c).
The lowest photon energy is 139 meV. Similarly, for band T2, lowest photon energy is 360
meV. Therefore, we conclude that for our sample (EF 18 meV above W1 Weyl nodes), the
120 meV transition is exclusively within the two bands that cross to form the Weyl nodes.
16NATURE PHYSICS | www.nature.com/naturephysics 16
SUPPLEMENTARY INFORMATIONDOI: 10.1038/NPHYS4146

© 2017 Macmillan Publishers Limited, part of Springer Nature. All rights reserved.
FIG. S11: a, The 24 Weyl nodes of TaAs in the first BZ. The momentum space paths for the
dispersions shown in panels (b,c) are indicated by the green arrows. b, The dispersion of the
W1 Weyl node along Cut1. c, The dispersion along Cut2. Along this path, the optical transition
between Weyl bands and trivial band T1 has the lowest energy, 139 meV.
17NATURE PHYSICS | www.nature.com/naturephysics 17
SUPPLEMENTARY INFORMATIONDOI: 10.1038/NPHYS4146

© 2017 Macmillan Publishers Limited, part of Springer Nature. All rights reserved.
III.4. Methods for photocurrent calculations
We elaborate on the methods of photocurrent calculation. For a single Weyl node, the
photocurrent density due to a deviation of the electronic distribution δnl(q) = nl(q)− n0l (q)
is:
J = (−e)∑
q,l=±
vl(q)δnl(q) = (−e)∑
q
∆v(q)δn+(q), (S5)
where l = +,− represents the upper part (+) and lower part (−) of the Weyl cone, ∆v(q) =
v+(q)− v−(q) is the velocity of each particle-hole pair. Then, based on the relaxation time
approximation and Fermi’s golden rule, we have:
J = −2πe
∫
d3q
(2π)3∆v(q)|q+|V |q−|
2δ(∆E(q)− ω)(n0−(q)− n0
+(q)), (S6)
where A is the amplitude of the vector potential, V is the electron-light coupling responsible
for photoexcitations from |q− to |q+ and ∆E(q) = E+(q) − E−(q). We first numerically
extract an effective k · p Weyl Hamiltonian H(k) from ab-initio band structure calculation.
Then, by the Peierls substitution, the coupling Hamiltonian is calculated as V = H(k +
A(t))−H( A). Rewriting the integrand in dimensionless quantities,
J = C J
=
(
e3τI
16π22ǫ0c
)[∫
d3(
−vF q
ω
) ∆v(q)
vF|q+|
V
vFA/2|q−|
2δ
(
∆E(q)
ω− 1
)
(n0−(q)− n0
+(q))
]
.
(S7)
C determines the order of magnitude of the current. The dimensionless vector J , which
is of order one, determines the direction of the current. We note that terms in J depends on
system details. For example, δ(
∆E(q)ω
− 1)
and n0−(q)−n0
+(q) depend on the band structure
of the sample; q+|V
vFA/2|q− depends on both the wavefunctions of the WFs in the sample
and the properties of the light.
We first only focus on the dimensionless J . In Table S4, we show calculation results
of J in TaAs under different conditions measured in experiments. Indeed, we see that the
current along b is finite for a RCP along a. In the latter three cases, the current is zero due
to cancellation.
18NATURE PHYSICS | www.nature.com/naturephysics 18
SUPPLEMENTARY INFORMATIONDOI: 10.1038/NPHYS4146
© 2017 Macmillan Publishers Limited, part of Springer Nature. All rights reserved.
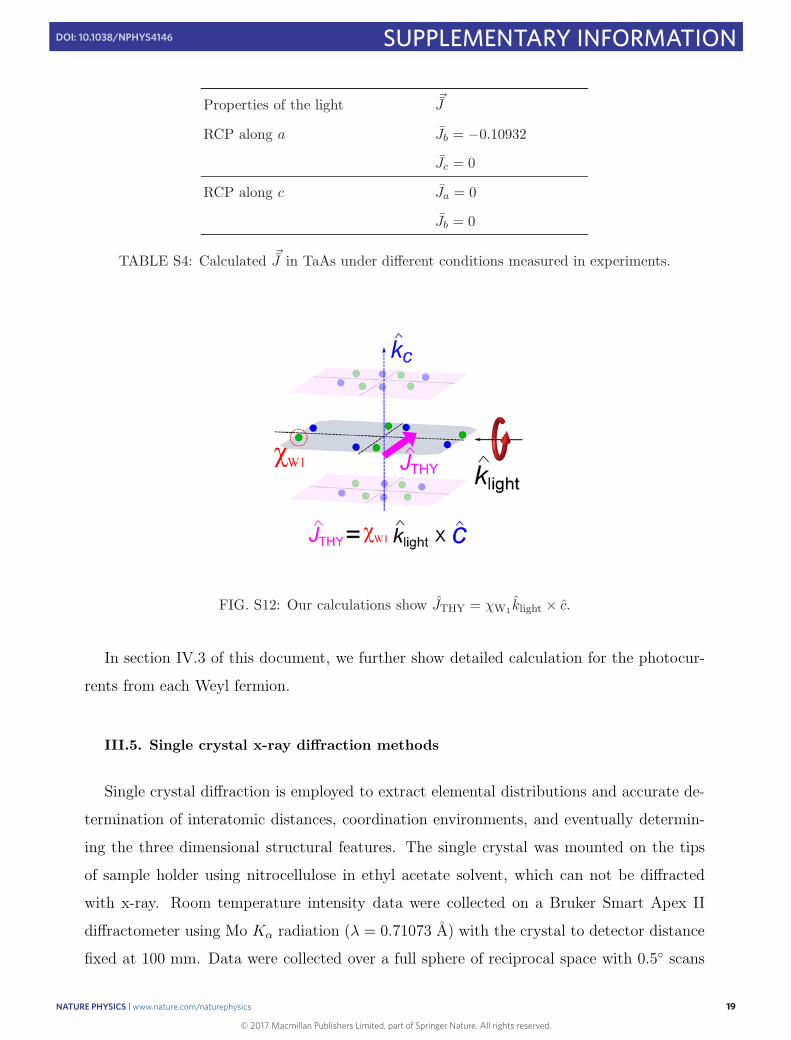
Properties of the light J
RCP along a Jb = −0.10932
Jc = 0
RCP along c Ja = 0
Jb = 0
TABLE S4: Calculated J in TaAs under different conditions measured in experiments.
FIG. S12: Our calculations show JTHY = χW1klight × c.
In section IV.3 of this document, we further show detailed calculation for the photocur-
rents from each Weyl fermion.
III.5. Single crystal x-ray diffraction methods
Single crystal diffraction is employed to extract elemental distributions and accurate de-
termination of interatomic distances, coordination environments, and eventually determin-
ing the three dimensional structural features. The single crystal was mounted on the tips
of sample holder using nitrocellulose in ethyl acetate solvent, which can not be diffracted
with x-ray. Room temperature intensity data were collected on a Bruker Smart Apex II
diffractometer using Mo Kα radiation (λ = 0.71073 A) with the crystal to detector distance
fixed at 100 mm. Data were collected over a full sphere of reciprocal space with 0.5 scans
19NATURE PHYSICS | www.nature.com/naturephysics 19
SUPPLEMENTARY INFORMATIONDOI: 10.1038/NPHYS4146

© 2017 Macmillan Publishers Limited, part of Springer Nature. All rights reserved.
with an exposure time of 5 s per frame to avoid strong absorption on Ta atoms. The 2θ
range extended from 4 to 70. The face-index was conducted based on the single crystal
reflections. Figure S13 illustrates the single-crystal XRD precession image of the (0kl) plane.
The crystalline directions determined by these XRD data are shown in Fig. S14.
FIG. S13: Single-crystal XRD precession image of the (0kl) plane in the reciprocal lattice of TaAs.
No diffuse scattering is seen. All the resolved spots have fitted the crystal lattice structure of
tetragonal I41md TaAs.
20NATURE PHYSICS | www.nature.com/naturephysics 20
SUPPLEMENTARY INFORMATIONDOI: 10.1038/NPHYS4146

© 2017 Macmillan Publishers Limited, part of Springer Nature. All rights reserved.
FIG. S14: Crystalline directions of our TaAs sample determined by single crystal XRD.
21NATURE PHYSICS | www.nature.com/naturephysics 21
SUPPLEMENTARY INFORMATIONDOI: 10.1038/NPHYS4146
© 2017 Macmillan Publishers Limited, part of Springer Nature. All rights reserved.
IV. DETAILS OF THE PHOTOCURRENT CALCULATIONS
IV.1. Intuitive explanations for the non-vanishing photocurrent in an inversion
breaking Weyl semimetal
IV.1.1. The chirality selection rule and asymmetric Pauli blockade
We first elaborate on the chirality selection rule and asymmetric Pauli blockade.
The chirality selection rule is a result of the conservation of angular momentum. The
simplest Weyl Hamitonian can be written as
HWeyl =∑
i=x,y,z
vikiσi (S8)
From this equation, we see that the two bands that cross to form the Weyl node has
angular momentum of ±12, respectively. Recall that right(left) circularly polarized light has
an angular momentum of ±1. Therefore, the optical transition via a circularly polarized
photon is allowed on one side of the Weyl cone but prohibited on the other depending on
the chirality of the WF and that of the photons.
Due to the Pauli exclusion principle, electrons must be excited from filled states to empty
states. Therefore, if the chemical potential is at the Weyl node (Figs. S15c,e), the excitation
is always allowed irrespective of the tilt of the cone. By contrast, if the chemical potential
is away from the Weyl point (Figs. S15d,f), Pauli exclusion occurs. Without the tilting
(Fig. S15d), the Pauli blockade is symmetric about the Weyl node. Finally, with tilting
(Fig. S15f), excitation becomes asymmetric because of the combination of Pauli exclusion
and energy conservation.
22NATURE PHYSICS | www.nature.com/naturephysics 22
SUPPLEMENTARY INFORMATIONDOI: 10.1038/NPHYS4146

© 2017 Macmillan Publishers Limited, part of Springer Nature. All rights reserved.
E
μ
v+v-
f
E
μ
c dE
μ
E
μ
v+v-
e
k
k k
k
E
kz
Optical selection rule
μ μ
χ =+1 χ = 1-a b
Pauli Blockade
FIG. S15: a,b, The Chirality selection rule of a WF arises from the conservation of angular
momentum. It happens at opposite k points for WFs of opposite chirality. c,e, If the chemical
potential is at the Weyl node, the excitation is always allowed irrespective of the tilt of the cone.
d,f, By contrast, if the chemical potential is away from the Weyl point, Pauli exclusion occurs.
Without the tilting (panel d), the Pauli blockade is symmetric about the Weyl node. Finally, with
tilting (panel f), the Pauli blockade becomes asymmetric, i.e., only one side of the Weyl cone is
excited because of the combination of Pauli exclusion and energy conservation.
23NATURE PHYSICS | www.nature.com/naturephysics 23
SUPPLEMENTARY INFORMATIONDOI: 10.1038/NPHYS4146

© 2017 Macmillan Publishers Limited, part of Springer Nature. All rights reserved.
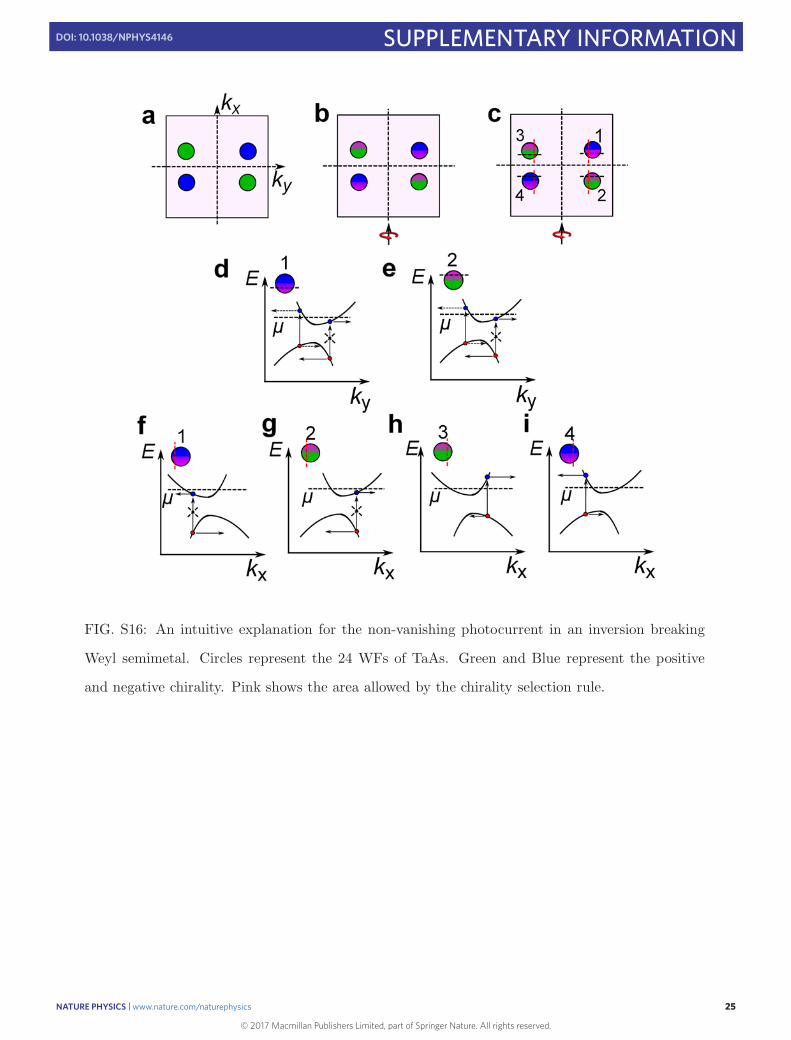
IV.1.2. Intuitive Explanation 1
We consider four Weyl nodes on the kz = 0 plane that are related by the mirror sym-
metries Mx and My and RCP light propagating along +kx (Figs. S16a,b). The chirality
selection rule means that, for a χ = +1 WF, the optical transition is allowed on the +kx side
but forbidden on the −kx side. For a χ = −1 WF, the selection rule is reversed (Fig. S16b).
We show that the total current along y does not cancel in the presence of tilt. We
start from the black dotted line 1, which cuts across the top-right Weyl cone. The mirror
symmetries Mx and My will relate the black dotted line 1 to black dotted lines 2-4, which
cut across the other three Weyl cones . Because these dotted lines do not cut across the
Weyl node, the band structures along them are gapped (Fig. S16d,e). Moreover, because
lines 1 and 2 are symmetric about the mirror plane Mx, the energy dispersion along 1 and 2
are identical (Fig. S16d,e). We also know that chirality selection rule allows the transitions
along both 1 and 2. Now we need to further consider the tilt of the WF. A finite tilt
means that the dispersions in Fig. S16d,e are not symmetric about the top (bottom) of the
valence (conduction) band. Thus, as seen in Fig. S16d,e, the Pauli blockade also becomes
asymmetric, and a finite current is obtained when summing up the contribution from the
black dotted lines 1 and 2. By contrast, the current from the black dotted lines 3 and 4
is zero because the transition there is forbidden by the chirality selection rule (Fig. S16c ).
Therefore, the total current from all black dotted lines 1-4 is nonzero. In order to fully cover
the Weyl cones, we sweep the black dotted line 1 along the kx direction. Because these four
lines are related by Mx and My, it is evident that the other 3 lines will be synchronized
to line 1 during the sweeping and hence all four Weyl cones are simultaneously covered.
Therefore, we argue that the total current along y is nonzero in the present of tilt.
By contrast, we show that the total current along x vanishes due to cancellation. The
arguments are similar to those above. We consider the four symmetry-related red dotted
lines along ky in Fig. S16c. Their band structures (Figs. S16f-i) are related by Mx and My.
For each line (e.g., red line 1 in Fig. S16f), the optical transition is only allowed on one side
because of chirality selection rule. Due to mirror symmetry Mx, we see that the currents
from red lines 1 and 2 (3 and 4) cancel each other. Therefore, the total current along x
vanishes due to cancellation.
24NATURE PHYSICS | www.nature.com/naturephysics 24
SUPPLEMENTARY INFORMATIONDOI: 10.1038/NPHYS4146
© 2017 Macmillan Publishers Limited, part of Springer Nature. All rights reserved.
FIG. S16: An intuitive explanation for the non-vanishing photocurrent in an inversion breaking
Weyl semimetal. Circles represent the 24 WFs of TaAs. Green and Blue represent the positive
and negative chirality. Pink shows the area allowed by the chirality selection rule.
25NATURE PHYSICS | www.nature.com/naturephysics 25
SUPPLEMENTARY INFORMATIONDOI: 10.1038/NPHYS4146
© 2017 Macmillan Publishers Limited, part of Springer Nature. All rights reserved.
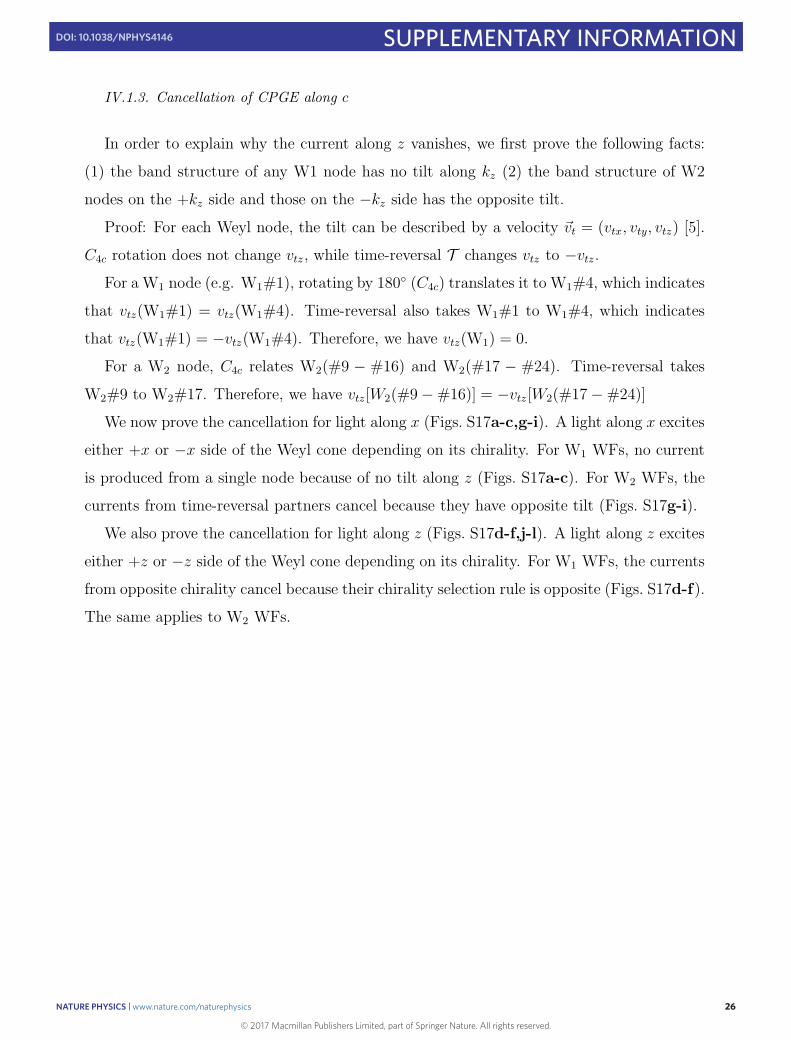
IV.1.3. Cancellation of CPGE along c
In order to explain why the current along z vanishes, we first prove the following facts:
(1) the band structure of any W1 node has no tilt along kz (2) the band structure of W2
nodes on the +kz side and those on the −kz side has the opposite tilt.
Proof: For each Weyl node, the tilt can be described by a velocity vt = (vtx, vty, vtz) [5].
C4c rotation does not change vtz , while time-reversal T changes vtz to −vtz.
For a W1 node (e.g. W1#1), rotating by 180 (C4c) translates it to W1#4, which indicates
that vtz(W1#1) = vtz(W1#4). Time-reversal also takes W1#1 to W1#4, which indicates
that vtz(W1#1) = −vtz(W1#4). Therefore, we have vtz(W1) = 0.
For a W2 node, C4c relates W2(#9 − #16) and W2(#17 − #24). Time-reversal takes
W2#9 to W2#17. Therefore, we have vtz[W2(#9−#16)] = −vtz [W2(#17−#24)]
We now prove the cancellation for light along x (Figs. S17a-c,g-i). A light along x excites
either +x or −x side of the Weyl cone depending on its chirality. For W1 WFs, no current
is produced from a single node because of no tilt along z (Figs. S17a-c). For W2 WFs, the
currents from time-reversal partners cancel because they have opposite tilt (Figs. S17g-i).
We also prove the cancellation for light along z (Figs. S17d-f,j-l). A light along z excites
either +z or −z side of the Weyl cone depending on its chirality. For W1 WFs, the currents
from opposite chirality cancel because their chirality selection rule is opposite (Figs. S17d-f).
The same applies to W2 WFs.
26NATURE PHYSICS | www.nature.com/naturephysics 26
SUPPLEMENTARY INFORMATIONDOI: 10.1038/NPHYS4146

© 2017 Macmillan Publishers Limited, part of Springer Nature. All rights reserved.
FIG. S17: Cancellation of CPGE along c. Circles represent the 24 WFs of TaAs. Green and Blue
represent the positive and negative chirality. Pink shows the area allowed by the chirality selection
rule.
27NATURE PHYSICS | www.nature.com/naturephysics 27
SUPPLEMENTARY INFORMATIONDOI: 10.1038/NPHYS4146

© 2017 Macmillan Publishers Limited, part of Springer Nature. All rights reserved.
IV.1.4. Current reversal upon rotating the sample
kc
kc
kc
ka
kb
kakb
kb
ka
d
f
e
ky
kx
kz
bc a
yz x C2z
c
C2xC2y
bc
a
b
ca
C2z
C2xC2y
ac
FIG. S18: Current reversal upon rotating the sample
We further explain why the CPGE reverses upon rotating the sample by 180 around a
or b while remaining the same upon rotating around c. This can be understood in both real
space and reciprocal space.
In real space, the +c and −c directions of the TaAs crystal are nonequivalent. Hence
rotating the sample by 180 around a or b would take +c to −c, while the system remains
invariant by a rotation around c.
Figs. S18d-f draw the k space defined by the laboratory coordinate (kx, ky, kz), rather
than the sample coordinate (ka, kb, kc). The laboratory coordinate corresponds to the WF
chirality seen by the light because the light direction remains unchanged in the lab. We see
that rotating the sample by 180 around a or b reverses the WF chirality seen by the light.
Therefore, both real space and reciprocal space analyses show that the CPGE reverses
upon rotating the sample by 180 around a or b while remaining the same upon rotating
around c.
28NATURE PHYSICS | www.nature.com/naturephysics 28
SUPPLEMENTARY INFORMATIONDOI: 10.1038/NPHYS4146

© 2017 Macmillan Publishers Limited, part of Springer Nature. All rights reserved.
IV.2. Symmetry analyses of the photocurrent
The second order photocurrent response tensor ηαβγ is defined through [11–13]:
Jα(ω = 0) = ηαβγ(ω,−ω)Eβ(ω)E∗
γ(ω), (S9)
where E∗γ(ω) = Eγ(−ω). Since J is real, the response tensor has to satisfy:
ηαβγ(ω,−ω) = η∗αγβ(ω,−ω). (S10)
Physically, the real and imaginary parts of ηαβγ correspond to the linear and circular pho-
togalvanic effects, respectively.
The 27 elements of ηαβγ have to obey the space group symmetry of the system. For a
circularly polarized light along a, the currents along b and c are given by
Jb = ηbbcEbE∗
c + ηbcbEcE∗
b (S11)
Jc = ηcbcEbE∗
c + ηccbEcE∗
b . (S12)
For a circularly polarized light along c, the currents along a and b are given by
Ja = ηaabEaE∗
b + ηabaEbE∗
a
Jb = ηbabEaE∗b + ηbbaEbE
∗a . (S13)
In TaAs, the presence of Ma and Mb forces ηαβγ to vanish when it contains an odd
number of momentum index a or b. Therefore, we see that symmetry does not force ηbbc
and ηbcb to be zero, which means nonzero Jb is symmetry allowed for light propagating along
a. ηcbc = ηccb = ηaab = ηaba = ηbab = ηbba = 0, which in turn proves Jc = 0 for light along
a (Eq. S12) and Ja = Jb = 0 for light propagating along c (Eq. S13). The above analyses
demonstrate the observed cancellations. As for the sign reversal in Fig. 3 in the main text,
since both ηbbc and ηbcb in Eq. S11 contains an odd number of c index, Jb should switch sign
if one changes from +c to −c. Indeed, this is achieved by a 180 rotation around a or b but
not around c.
IV.3. Calculated photocurrents from each Weyl fermion
In this subsection, we present the calculated photocurrent from each WF. We show the
dimensionless J in Eq. S7. This shows the direction of the current from each WF. It also
29NATURE PHYSICS | www.nature.com/naturephysics 29
SUPPLEMENTARY INFORMATIONDOI: 10.1038/NPHYS4146

© 2017 Macmillan Publishers Limited, part of Springer Nature. All rights reserved.
shows the relative contribution from the W1 and W2 WFs. The absolute amplitude of the
total photocurrent also depends on the constant C in Eq. S7 For clarity, in Fig. S19, we
assign a specific number to each Weyl node.
FIG. S19: Labeling of Weyl nodes in TaAs, used to calculate the current generated from each Weyl
node. The green dot is χ = +1 node and the blue dot is χ = −1 node.
Table S5 show the calculated currents Jn = (Jnx , J
ny , J
nz ) with right circularly polarized
(RCP) light along x (n denotes the nth WF as defined in Fig. S19). We see that the
photocurrents from W1 WFs are twenty times larger than those from W2. This is because
the chemical potential is close to the W2 Weyl nodes.
Table S6 show the calculated currents Jn = (Jnx , J
ny , J
nz ) with right circularly polarized
(RCP) light along z.
30NATURE PHYSICS | www.nature.com/naturephysics 30
SUPPLEMENTARY INFORMATIONDOI: 10.1038/NPHYS4146

© 2017 Macmillan Publishers Limited, part of Springer Nature. All rights reserved.
W1(kz = 0) Jx Jy Jz
1 -1.993 +0.100 0
2 +1.993 +0.100 0
3 +2.151 -0.0526 0
4 -2.151 -0.0526 0
5 +2.528 +0.342 0
6 -2.528 +0.342 0
7 -1.553 -0.447 0
8 +1.553 -0.447 0
Total (1-8) 0 -0.115 0
W2(kz > 0) Jx Jy Jz
9 +2.095 -0.000551 +0.000708
10 -2.095 -0.000551 +0.000708
11 -2.090 +0.00451 +0.00569
12 +2.090 +0.00451 +0.00569
13 -2.097 +0.00206 +0.00292
14 +2.097 +0.00206 +0.00292
15 +2.089 -0.00460 +0.00653
16 -2.089 -0.00460 +0.00653
W2(kz < 0) Jx Jy Jz
17 +2.090 +0.00451 -0.00569
18 -2.090 +0.00451 -0.00569
19 -2.095 -0.000551 -0.000708
20 +2.095 -0.000551 -0.000708
21 -2.089 -0.00460 -0.00653
22 +2.089 -0.00460 -0.00653
23 +2.097 +0.00206 -0.00292
24 -2.097 +0.00206 -0.00292
Total (9-24) 0 +0.00568 0
TABLE S5: Current components of W1 and W2 nodes when RCP is propagating along +a.
31NATURE PHYSICS | www.nature.com/naturephysics 31
SUPPLEMENTARY INFORMATIONDOI: 10.1038/NPHYS4146

© 2017 Macmillan Publishers Limited, part of Springer Nature. All rights reserved.
TABLE S5: The chemical potential is taken to be 17.8 meV aboveW1 and 4.8 meV aboveW2, which
is obtained from the magneto-transport measurement described in Section III. 2. The direction
refers to the hole current, which is the same as the measured current direction.
32NATURE PHYSICS | www.nature.com/naturephysics 32
SUPPLEMENTARY INFORMATIONDOI: 10.1038/NPHYS4146

© 2017 Macmillan Publishers Limited, part of Springer Nature. All rights reserved.
W1(kz = 0) Jx Jy Jz
1 +0.470 +0.570 -2.092
2 -0.470 +0.570 +2.092
3 +0.470 -0.570 +2.092
4 -0.470 -0.570 -2.092
5 +0.570 +0.470 +2.092
6 -0.570 +0.470 -2.092
7 +0.570 -0.470 -2.092
8 -0.570 -0.470 +2.092
Total (1-8) 0 0 0
W2(kz > 0) Jx Jy Jz
9 +0.00190 -0.00217 +2.097
10 -0.00473 -0.00537 -2.088
11 +0.00473 +0.00537 -2.088
12 -0.00190 +0.00217 +2.097
13 -0.00537 +0.00473 -2.088
14 +0.00217 +0.00190 +2.097
15 -0.00217 -0.00190 +2.097
16 +0.00537 -0.00473 -2.088
W2(kz < 0) Jx Jy Jz
17 -0.00473 +0.00537 +2.088
18 +0.00190 +0.00217 -2.097
19 -0.00190 -0.00217 -2.097
20 +0.00473 -0.00537 +2.088
21 +0.00217 -0.00190 -2.097
22 -0.00537 -0.00473 +2.088
23 +0.00537 +0.00473 +2.088
24 -0.00217 +0.00190 -2.097
Total (9-24) 0 0 0
TABLE S6: Current components of W1 and W2 nodes when RCP is propagating along +c.
33NATURE PHYSICS | www.nature.com/naturephysics 33
SUPPLEMENTARY INFORMATIONDOI: 10.1038/NPHYS4146

© 2017 Macmillan Publishers Limited, part of Springer Nature. All rights reserved.
TABLE S6: The chemical potential is taken to be 17.8 meV aboveW1 and 4.8 meV aboveW2, which
is obtained from the magneto-transport measurement described in Section III. 2. The direction
refers to the hole current, which is the same as the measured current direction.
34NATURE PHYSICS | www.nature.com/naturephysics 34
SUPPLEMENTARY INFORMATIONDOI: 10.1038/NPHYS4146

© 2017 Macmillan Publishers Limited, part of Springer Nature. All rights reserved.
IV.4. Theoretical estimation of the photocurrent amplitude in TaAs
As we have demonstrated above, the dimensionless vector J can be calculated based on
the properties of the light and the TaAs band structure.
In order to calculate the amplitude, we still need to know several other quantities. We
show below that, some of them are known whereas others are not. We discuss the major un-
known factors that prevent us to theoretically predict the photocurrent amplitude measured
in experiments.
Below is a list of quantities required to calculate the amplitude of the photocurrent
• Absorption coefficient α: We know α ≃ 30% at λ = 10.6 µm from Ref. [10].
• Skin-depth δ: We know δ ≃ 360 nm at λ = 10.6 µm by the formula δ = 1πσfµ
, where
f is the frequency of the light, µ is the absolute magnetic permeability, and σ is the
optical conductivity at λ = 10.6 µm which is obtained from Ref. [10].
• Relaxation time τ : We have J = C J , where C = e3τI16π22ǫ0c
. The relaxation time τ
measures the time scale for the following process: Exactly at the time when a laser-
pulse hits the sample, the selection rule requires that only one side of a Weyl node is
excited. At a finite time-delay after the laser,the photo-excited quasi-particles can be
relaxed to the other side of the Weyl node due to electron-electron scattering.
• Current distribution: We need to know whether all current generated by the light
are experimentally collected by the current meter. For example, a fraction of the
current may flow internally within the sample, which will not be detected by the
current meter.
We now discuss the major unknown factors.
• The thickness of the sample is 260 µm whereas the penetration depth is only 360 nm.
Hence the majority of the sample is not driven by light. This undriven part of the
sample has a resistance Rundriven sample ∼ 5× 10⁻⁴ Ω. On the other hand, the external
load (contacts, wires, etc) has a resistance Rexternal load ∼ 5 Ω. The total current
generated by light are distributed by the ratioIundriven sample
Iexternal load= Rexternal load
Rundriven sample∼ 104.
35NATURE PHYSICS | www.nature.com/naturephysics 35
SUPPLEMENTARY INFORMATIONDOI: 10.1038/NPHYS4146
© 2017 Macmillan Publishers Limited, part of Springer Nature. All rights reserved.
The measured current is Iexternal load, which is subject to a factor of 104 reduction by
considering this fact that most of the current is bypassed through the very metallic,
undriven part of the sample.
• The relaxation time has not directly measured.
• We assumed that all photons absorbed by the sample interact with electrons. On the
other hand, it is possible that a fraction of the photons directly interact with phonons.
Because of the above unknown factors, it is difficult to theoretically estimate the ampli-
tude of the photocurrent. By making the following crude estimation, we can calculate an
amplitude
• The relaxation time has been inferred from transport data (45 ps) [8] and not directly
measured.
• We assumed that all photons absorbed by the sample interact with electrons.
• We include this 104 reduction of current amplitude as discussed above.
By doing these approximations, and using laser power of 10 mW and lateral beam-size of
50 µm×50 µm, we obtain that the calculated current is 1.015×10⁻⁴ A. This is about 4 orders
of magnitude higher than of the experimentally measured value 40×10−9 A, which matches
theIundriven sample
Iexternal load= Rexternal load
Rundriven sample∼ 104 factor discussed above. While this geometrical factor
may play a major role, other unknown factors described above can also contribute to the
difference between the data and calculations in terms of the photocurrent amplitude.
36NATURE PHYSICS | www.nature.com/naturephysics 36
SUPPLEMENTARY INFORMATIONDOI: 10.1038/NPHYS4146

© 2017 Macmillan Publishers Limited, part of Springer Nature. All rights reserved.
V. Exclusion of other CPGE mechanisms
Below we discuss and rule out alternative CPGE mechanisms including its excitation in
trivial systems with strong spin-orbit and surface Rashba terms [11, 14, 15] and the photon
drag originating in trivial bulk bands [15, 16].
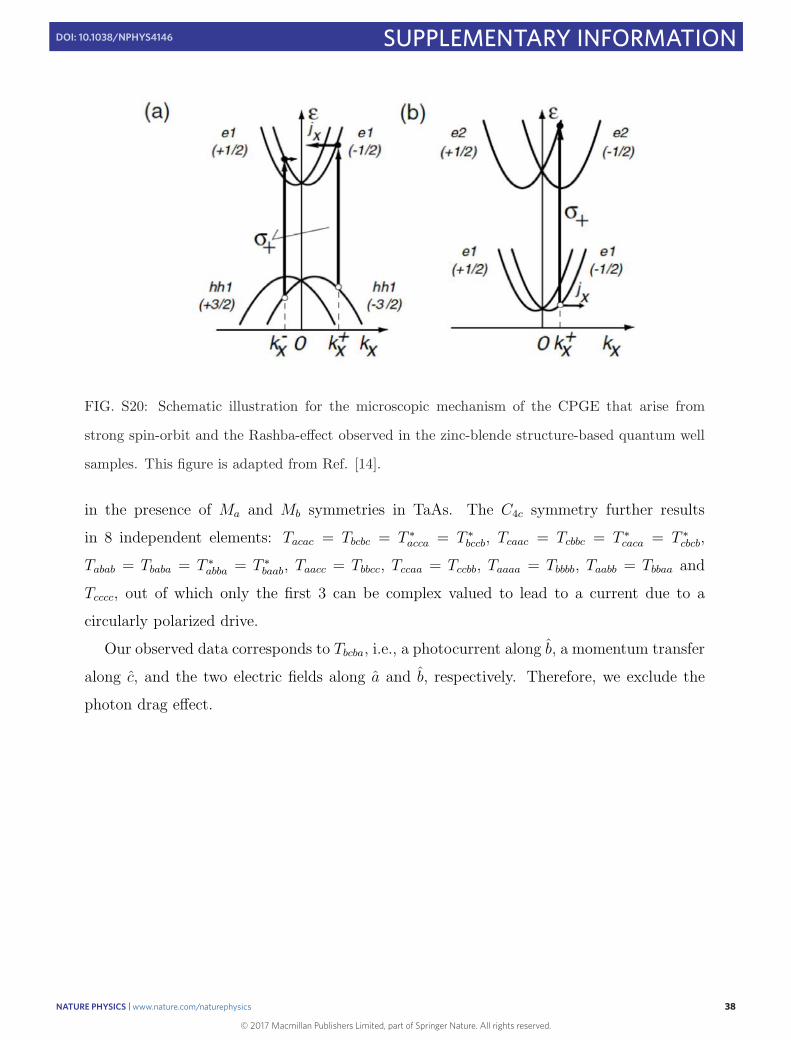
The CPGE due to the Rashba effect has been observed in semiconductor (such as
GaAs/AlGaAs quantum well samples). As explained in Refs. [11, 14] (Fig. S20), it re-
quires the following two key conditions: (1) Both the conduction and valence bands are
Rashba-split states; (2) The energy gap between conduction and valence equals the photon
energy (120 meV in our case). In our case, the lowest-lying two bands are the two bands
that cross and form Weyl nodes. They do not feature Rashba-split states. In addition, the
surface state band structure (as shown by ARPES) also does not feature Rashba-split states.
In fact, the surface states are localized on the top 1− 2 nm whereas our penetration depth
is 360 nm. Thus contribution from bulk states dominate over that from the surface states.
Therefore, we can rule out the possibility of the Rashba-origin for our CPGE.
The photon drag effect arises due to a momentum transfer from photons to free carriers.
As explained in Refs. [15, 16], photons with an oblique incidence has a finite in-plane
momentum, which can be transferred to electrons (Fig. S21), leading to a finite photocurrent
along the momentum-transfer direction. We can rule out this possibility because, in our
experiments, we shine light along c and observe a photocurrent along b. Since the photons
travelling along c do not have a finite momentum along b, the photon drag effect can be
excluded.
More quantitatively, the second order photocurrent due to the photon drag effect is given
by [15]:
Jdragλ = TλδµνqδEµE
∗ν , (S14)
with the condition:
Tλδµν = T ∗λδνµ. (S15)
Here qδ is the photon momentum responsible for the electron momentum transfer during
the interband optical excitation. The fourth rank response tensor Tλδµν also obeys the
space group symmetry of the system. Out of the 81 elements, 21 of them can be nonzero
37NATURE PHYSICS | www.nature.com/naturephysics 37
SUPPLEMENTARY INFORMATIONDOI: 10.1038/NPHYS4146
© 2017 Macmillan Publishers Limited, part of Springer Nature. All rights reserved.
FIG. S20: Schematic illustration for the microscopic mechanism of the CPGE that arise from
strong spin-orbit and the Rashba-effect observed in the zinc-blende structure-based quantum well
samples. This figure is adapted from Ref. [14].
in the presence of Ma and Mb symmetries in TaAs. The C4c symmetry further results
in 8 independent elements: Tacac = Tbcbc = T ∗acca = T ∗
bccb, Tcaac = Tcbbc = T ∗caca = T ∗
cbcb,
Tabab = Tbaba = T ∗abba = T ∗
baab, Taacc = Tbbcc, Tccaa = Tccbb, Taaaa = Tbbbb, Taabb = Tbbaa and
Tcccc, out of which only the first 3 can be complex valued to lead to a current due to a
circularly polarized drive.
Our observed data corresponds to Tbcba, i.e., a photocurrent along b, a momentum transfer
along c, and the two electric fields along a and b, respectively. Therefore, we exclude the
photon drag effect.
38NATURE PHYSICS | www.nature.com/naturephysics 38
SUPPLEMENTARY INFORMATIONDOI: 10.1038/NPHYS4146

© 2017 Macmillan Publishers Limited, part of Springer Nature. All rights reserved.
FIG. S21: Schematic illustration for the microscopic mechanism of the CPGE that arise from the
photon drag effect as observed in the zinc-blende structure-based quantum well samples. This
figure is adapted from Ref. [15].
39NATURE PHYSICS | www.nature.com/naturephysics 39
SUPPLEMENTARY INFORMATIONDOI: 10.1038/NPHYS4146

© 2017 Macmillan Publishers Limited, part of Springer Nature. All rights reserved.
VI. ADDITIONAL PHOTOCURRENT MEASUREMENTS
In Fig. S22, we show photocurrent data in addition to Fig. 3 in the main text. We see
that the photocurrent along c is zero irrespective of the rotation. This again confirms the
cancellation of photocurrent along c
FIG. S22: For a light along the a direction, no photocurrent is observed along c direction irrespective
of the rotation.
In Fig. S23, we show that photocurrent measurements on another TaAs sample. This
sample is purposely filed down so that the out-of-plane direction is c. This allows us to shine
normal incident light along c. As shown in Fig. S23, we observe zero current along both a
and b directions.
40NATURE PHYSICS | www.nature.com/naturephysics 40
SUPPLEMENTARY INFORMATIONDOI: 10.1038/NPHYS4146

© 2017 Macmillan Publishers Limited, part of Springer Nature. All rights reserved.
a
b
a
bc
A
a
bc
A
0 90 180 270 360
-40
-20
0
20
40
FIG. S23: When the light drives along the c axis, there is no chirality-dependent current generated
in both a and b directions.
41NATURE PHYSICS | www.nature.com/naturephysics 41
SUPPLEMENTARY INFORMATIONDOI: 10.1038/NPHYS4146

© 2017 Macmillan Publishers Limited, part of Springer Nature. All rights reserved.
VII. PREVIOUS TRANSPORT AND ARPES MEASUREMENTS ON WEYL
SEMIMETALS
Below, we explain why our measurements for the first time detected the WF chirality.
First we wish to emphasize that demonstrating the existence of two opposite chiralities
is different from detecting the chirality of individual Weyl nodes. The negative magneto-
resistance (MR) data due to the chiral anomaly [17, 18] arises because E · B pumps electrons
from Weyl cones of one chirality to the opposite. Therefore, the observation of a negative
MR due to the chiral anomaly clearly proves that there are two opposite chiralities. However,
this is fundamentally different from detecting the chirality of each individual WF.
FIG. S24: a,b, 4 Weyl nodes related by the Mx and My mirror planes. The two cases in panels
(a,b) have identical band structure. Only the chirality of the WFs is opposite. c,d, We imagine
two Weyl semimetal samples A and B with identical band structures. The only difference is that
samples A and B have opposite WF chirality configuration (I and II). We apply parallel electric
and magnetic fields on both samples ( E · B). We expect to see the same negative MR response.
Therefore, the negative MR response is insensitive to WF chirality.
42NATURE PHYSICS | www.nature.com/naturephysics 42
SUPPLEMENTARY INFORMATIONDOI: 10.1038/NPHYS4146

© 2017 Macmillan Publishers Limited, part of Springer Nature. All rights reserved.
To better illustrate our point, we consider two samples (A,B) with the same band struc-
ture that has 4 Weyl node related by the Mx and My mirror planes (Fig. S24). The only
difference is that the samples A and B have the opposite WF chirality configurations (I and
II) (Figs.S24a,b). By applying parallel electric and magnetic fields E · B, we expect the same
negative longitudinal MR response on both samples. This can be proven more rigorously
as follows: The negative longitudinal MR originates from an additional conduction channel
due to E · B. The total conductivity is given by
σ = σDrude + σchiral anomaly, (S16)
where σDrude is the normal Drude conductivity, and σchiral anomaly is the additional conduc-
tivity due to the chiral anomaly.
Ref. [19] showed that the chiral anomaly contribution σchiral anomaly can be calculated by
σchiral anomaly =e4τa
(2π44g)B2, (S17)
where τa is a relaxation time associated with the chiral anomaly, and g is the total density of
states for all Weyl cones near the Fermi level. We emphasize the two following aspects: 1. All
terms in the equation are positive. Thus, σchiral anomaly is always positive (σchiral anomaly > 0).
In other words, the chiral anomaly always contributes a positive magneto-conductivity and
therefore a negative MR, independent of the chirality configuration (I or II). 2. Samples A
and B have identical band structure and therefore density of states g. The relaxation time,
τa, also should not depends on the two chirality configurations I and II.
Therefore, we conclude that σchiral anomaly does not depend on the chirality of individual
Weyl nodes.
We now proceed to explain why ARPES measurements are not sensitive to the chirality
of individual WFs. This can be clearly seen from the following fact: Chirality is defined
based on Berry curvature, which is a property of the electron wavefunction, rather than
band structure. Specifically, the Berry curvature Ω is calculated by Ω = × in| |n,
where is |n the wavefunction. A Weyl node’s chirality is positive if the Berry curvature
points away from the node (i.e., a monopole), whereas it is negative if the Berry curvature
points toward the node (i.e., an anti-monopole) (Figs. S25).
For example, in Fig. S25a, we consider two Weyl fermions related by a mirror plane.
43NATURE PHYSICS | www.nature.com/naturephysics 43
SUPPLEMENTARY INFORMATIONDOI: 10.1038/NPHYS4146
© 2017 Macmillan Publishers Limited, part of Springer Nature. All rights reserved.
Although they have opposite chirality, their dispersion can be identical (Figs. S25b,c). This
fact highlights that chirality is a property of the wavefunction rather than the band structure,
which naturally explains why conventional ARPES measured band structure is not sensitive
to the chirality of each individual Weyl node. Therefore, although the linear dispersion
of bulk Weyl cones has been measured by conventional ARPES [20, 22, 23]. These band
structure measurements cannot discern the chirality of individual WFs.
Similarly, researchers have also measured the surface band structure [20, 21, 23, 24].
Measuring the surface is even more indirect, because any information about the bulk can
only be indirectly inferred via the bulk-surface correspondence. Nevertheless, the essential
problem is the same, i.e., the chirality is a property of the electron wavefunction. It cannot
be obtained by a measurement of the band structure, regardless of the bulk or the surface.
For example, although the two systems in Figs. S26a,b have opposite WF chirality, their
surface Fermi surfaces can be identical. Therefore, the surface Fermi surface measured by
ARPES cannot distinguish the two chirality configurations.
Ref. [25] proposed a way to measure the chirality via pump-probe ARPES, taking ad-
vantage of the same chirality selection rule as we used in our CPGE experiments. As shown
in Fig. S27, a circularly polarized mid-IR pump light only excites one side of the Weyl cone
due to the chirality selection rule. The imbalanced optical excitation can be observed by
measuring the transient spectral weight using time-resolved ARPES. One expects to see ex-
cited electrons above EF only on one side of the Weyl cone depending on the chirality of the
particular Weyl node. Similar to our CPGE, the key is the measurement of the imbalanced
excitation due to the chirality selection rule. Without the circularly polarized mid-IR pump
light, one would just measure the band structure of a Weyl cone, which cannot discern the
chirality of an individual WF.
44NATURE PHYSICS | www.nature.com/naturephysics 44
SUPPLEMENTARY INFORMATIONDOI: 10.1038/NPHYS4146

© 2017 Macmillan Publishers Limited, part of Springer Nature. All rights reserved.
FIG. S25: WF chirality is defined based on the Berry curvature near the Weyl node being a
monopole or an anti-monopole, which is a property of the electron wavefunction, rather than band
structure.
45NATURE PHYSICS | www.nature.com/naturephysics 45
SUPPLEMENTARY INFORMATIONDOI: 10.1038/NPHYS4146

© 2017 Macmillan Publishers Limited, part of Springer Nature. All rights reserved.
FIG. S26: For the two possible WF chirality configurations, their Fermi arc surface state Fermi
surface (e.g., connectivity, shape and other properties of the Fermi arcs) can be identical. Thus
surface Fermi arcs cannot be used to discern these two possible WF chirality configurations.
46NATURE PHYSICS | www.nature.com/naturephysics 46
SUPPLEMENTARY INFORMATIONDOI: 10.1038/NPHYS4146

© 2017 Macmillan Publishers Limited, part of Springer Nature. All rights reserved.
FIG. S27: Experimental setup of using pump-probe ARPES to detect chirality as proposed in Ref.
[25].
47NATURE PHYSICS | www.nature.com/naturephysics 47
SUPPLEMENTARY INFORMATIONDOI: 10.1038/NPHYS4146
© 2017 Macmillan Publishers Limited, part of Springer Nature. All rights reserved.
[1] Gabor, N. M. et al. Hot Carrier-Assisted Intrinsic Photoresponse in Graphene. Science 334,
648-652 (2011).
[2] Herring, P. K. et al. Photoresponse of an Electrically Tunable Ambipolar Graphene Infrared
Thermocouple. Nano Letter 14, 901-907 (2014).
[3] Zhang, C.-L. et al. Observation of the Adler-Bell-Jackiw chiral anomaly in a Weyl semimetal.
Preprint at https://arxiv.org/abs/1503.02630 (2015).
[4] Murakawa, H. et al. Detection of berrys phase in a bulk rashba semiconductor. Science 342
1490-1493 (2013).
[5] Chan, C.-K., Lindner, N. H., Refael, G. & Lee, P. A. Photocurrents in Weyl semimetals.
Preprint at https://arxiv.org/abs/1607.07839 (2016).
[6] Murray, J. J. et al. Phase relationships and thermodynamics of refractory metal pnictides:
The metal-rich tantalum arsenides. J. Less Common Met. 46, 311-320 (1976).
[7] Perdew, J. P., Burke, K. & Ernzerhof, M. Generalized Gradient Approximation Made Simple.
Phys. Rev. Lett. 77, 3865-3868 (1996).
[8] Zhang, C.-L. et al. Tantalum monoarsenide: an exotic compensated semimetal. Preprint at
http://arxiv.org/abs/1502.00251 (2015).
[9] Jonson, M. & Mahan, G. D. Mott’s formula for the thermopower and Wiedemann-Franz law.
Phys. Rev. B 21, 4223-4229 (1980).
[10] Xu, B. et al. Optical spectroscopy of the Weyl semimetal TaAs. Phys. Rev. B 93, 121110(R)
(2016).
[11] Ivchenko, E. L. & Ganichev, S. Spin-Photogalvanics. in Spin Physics in Semiconductors edited
by M. I. Dyakonov (Springer, 2008).
[12] Bel’kov, V. V. & Ganichev, S.D. Magneto-gyrotropic photogalvanic effects in semiconductor
quantum wells J. Phys.: Condens. Matter 17 3405-3428 (2005).
[13] Wu, L. et al. Giant anisotropic nonlinear optical response in transition metal monopnictide
Weyl semimetals. Nature Phys. doi:10.1038/nphys3969 (2016).
[14] Ganichev, S. D. & Prettl, W. J. Phys. Condens. Matter 15, R935-R983 (2003).
[15] Diehl, H. et al. New J. Phys. 9, 349 (2007).
[16] Danishevskii, A. M., Kastal’skii, A. A., Ryvkin, S. M. & Yaroshetskii, I. D. Dragging of free
48NATURE PHYSICS | www.nature.com/naturephysics 48
SUPPLEMENTARY INFORMATIONDOI: 10.1038/NPHYS4146
© 2017 Macmillan Publishers Limited, part of Springer Nature. All rights reserved.
carriers by photons in direct interband transitions in semiconductors. Sov. Phys. JETP 31,
292-295 (1970).
[17] Zhang, C. et al. Signatures of the Adler-Bell-Jackiw chiral anomaly in a Weyl semimetal.
Nature Commun. 7, 10735 (2016).
[18] Huang, X. et al. Observation of the chiral anomaly induced negative magneto-resistance in
3D Weyl semi-metal TaAs. Phys. Rev. X 5, 031023 (2015).
[19] Son, D. T. & Spivak, B. Z. Chiral anomaly and classical negative magnetoresistance of Weyl
metals. Phys.Rev. B 88, 104412 (2013).
[20] Xu, S.-Y. et al. Discovery of a Weyl fermion semimetal and topological Fermi arcs. Science
349, 613-617 (2015).
[21] Lv, B. Q. et al. Experimental discovery of Weyl Semimetal TaAs. Phys. Rev. X 5, 031013
(2015).
[22] Lv, B. Q. et al. Observation of Weyl nodes in TaAs. Nature Phys. 11, 724-727 (2015).
[23] Yang, L. X. et al. Weyl semimetal phase in the non-centrosymmetric compount TaAs. Nature
Phys. 11, 728-733 (2015).
[24] Belopolski, I. et al. Phys. Rev. Lett. 116, 066802 (2016).
[25] Yu, R. et al. Determine the chirality of Weyl fermions from the circular dichroism spectra of
time-dependent angle-resolved photoemission. Phys. Rev. B 93 205133 (2016).
49NATURE PHYSICS | www.nature.com/naturephysics 49
SUPPLEMENTARY INFORMATIONDOI: 10.1038/NPHYS4146


![semimetal - CIQMciqm.harvard.edu/uploads/2/3/3/4/23349210/ma2017.pdf · arXiv:1705.00590v1 [cond-mat.mtrl-sci] 1 May 2017 Direct optical detection of Weyl fermion chirality in a topological](https://img.pdfslide.us/doc/110x75/6058535a4826360d4e608f5c/semimetal-arxiv170500590v1-cond-matmtrl-sci-1-may-2017-direct-optical-detection.jpg)