Embed Size (px)
Citation preview
Direct Metal Laser Sintering (DMLS) Contour Parameter Optimization DOE 1
Prepared by Dustin Lindley10/24/13, last revised 10/28/13
https://ntrs.nasa.gov/search.jsp?R=20140012951 2020-02-05T09:21:34+00:00Z
Scan parameter basics
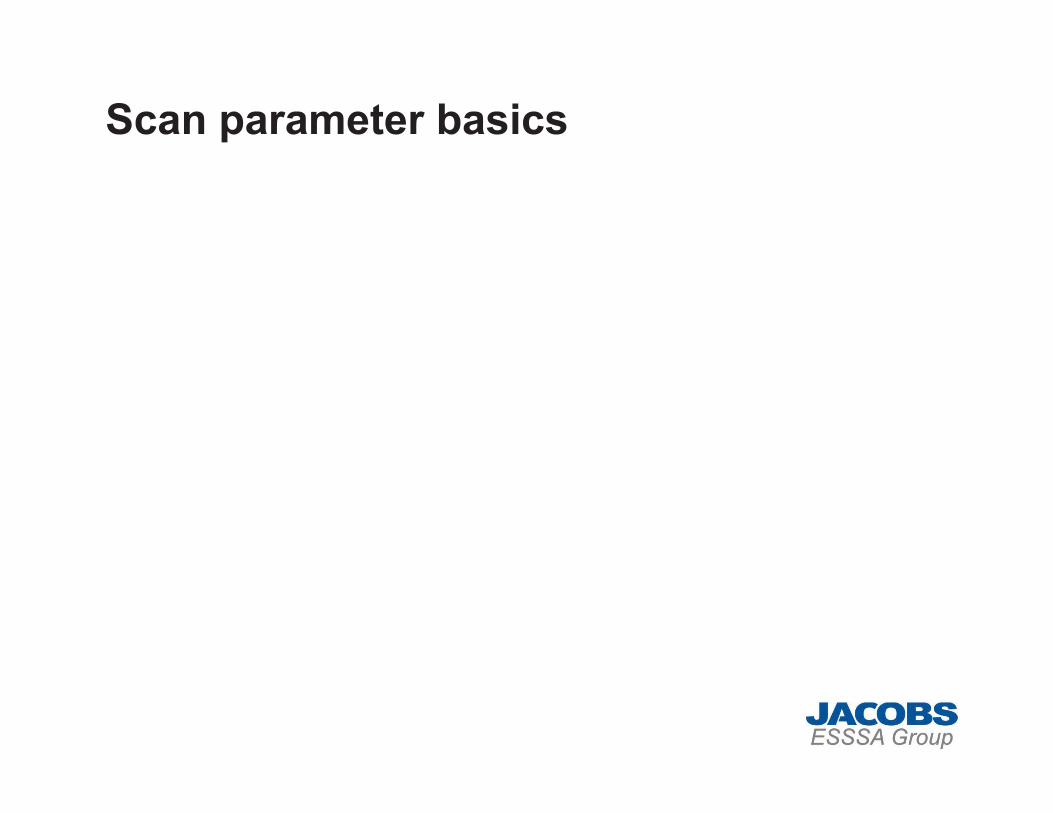
Scan styles
• Two basic scan types in a typical part layer– Area scans
• Also known as hatch or fill scans• Produce bulk of material in DMLS• Three critical parameters: beam speed (s,
mm/s), spacing between individual passes of laser (h, mm), and laser power (P, W)
– Line scans• Produce outer contours of parts and support
structures• Area scans are made up of many line scans• Three critical parameters: beam speed (s,
mm/s), beam diameter (d, mm), laser power (P, W)
d
h
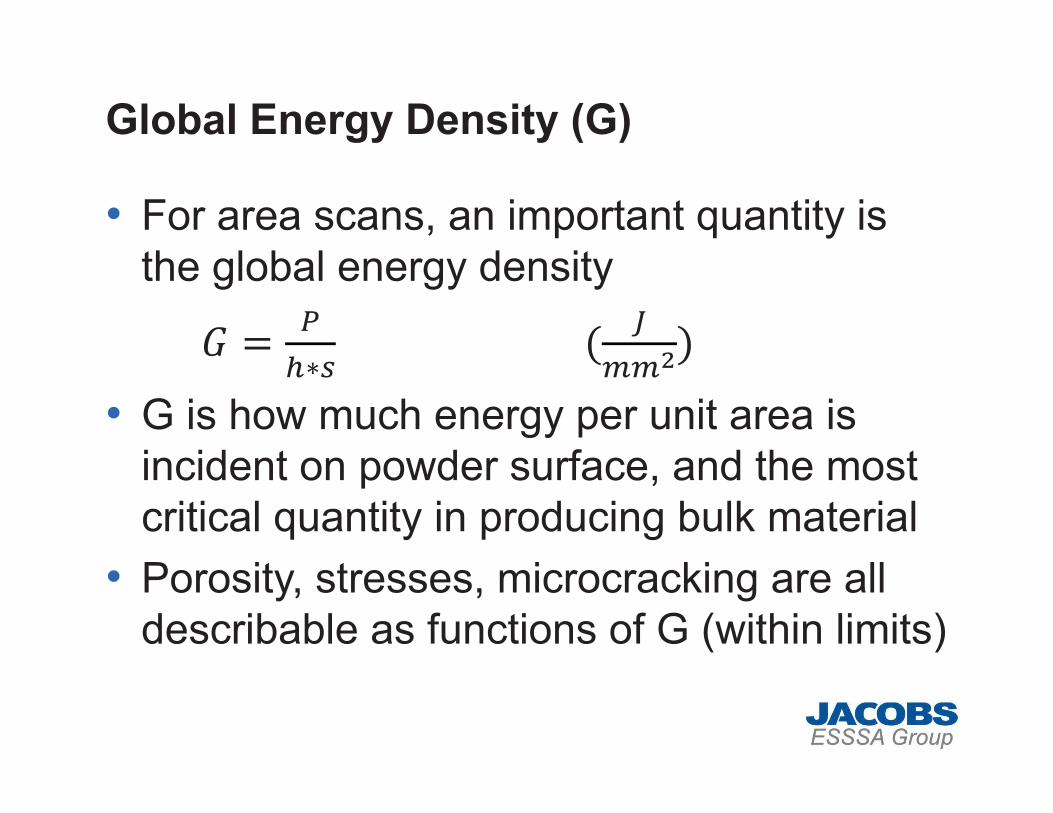
Global Energy Density (G)
• For area scans, an important quantity is the global energy density
�
���
�
���
• G is how much energy per unit area is incident on powder surface, and the most critical quantity in producing bulk material
• Porosity, stresses, microcracking are all describable as functions of G (within limits)
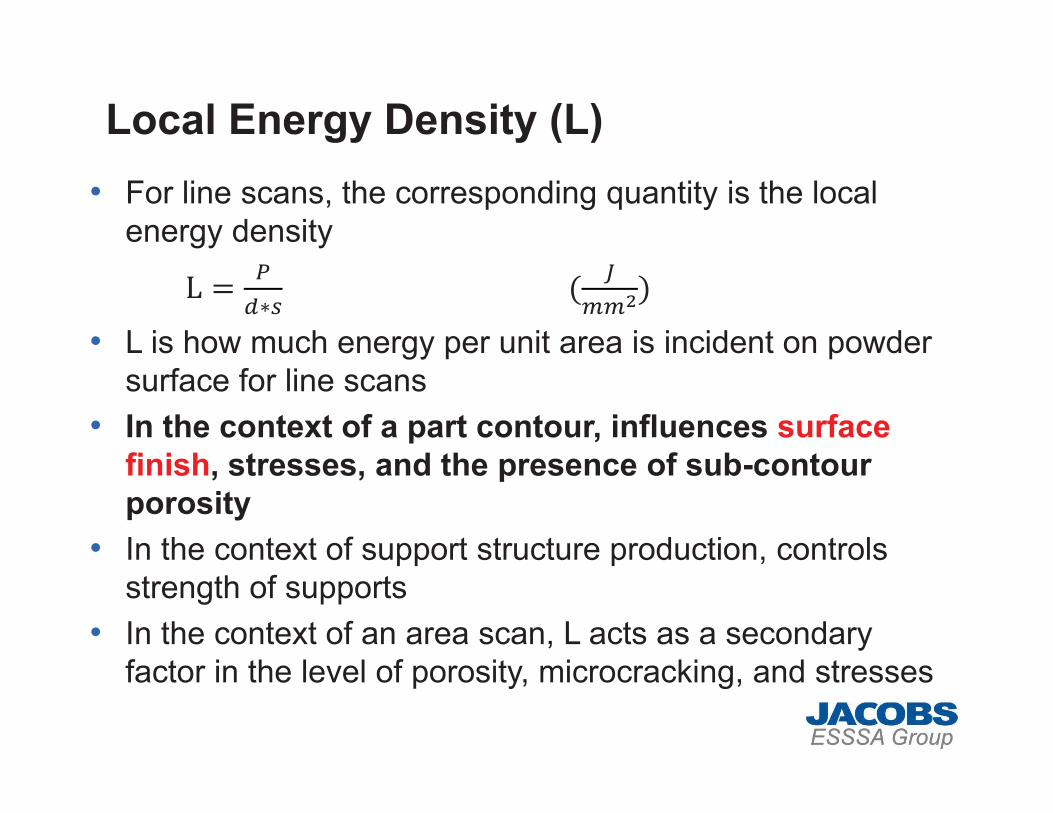
Local Energy Density (L)• For line scans, the corresponding quantity is the local
energy density
�
����
�
���
• L is how much energy per unit area is incident on powder surface for line scans
• In the context of a part contour, influences surfacefinish, stresses, and the presence of sub-contour porosity
• In the context of support structure production, controls strength of supports
• In the context of an area scan, L acts as a secondary factor in the level of porosity, microcracking, and stresses
Surface finish optimization example
Surface finish and parameters:Example from literature• “Investigation The Effect Of Particle Size
Distribution On Processing Parameters Optimisation In Selective Laser Melting Process” by Liu, et al from Loughborough University
• Presented at SFF 2011• Interestingly, they present an energy density that
is L as calculated for an area scan– Varied L by varying beam diameter and scanning
speed
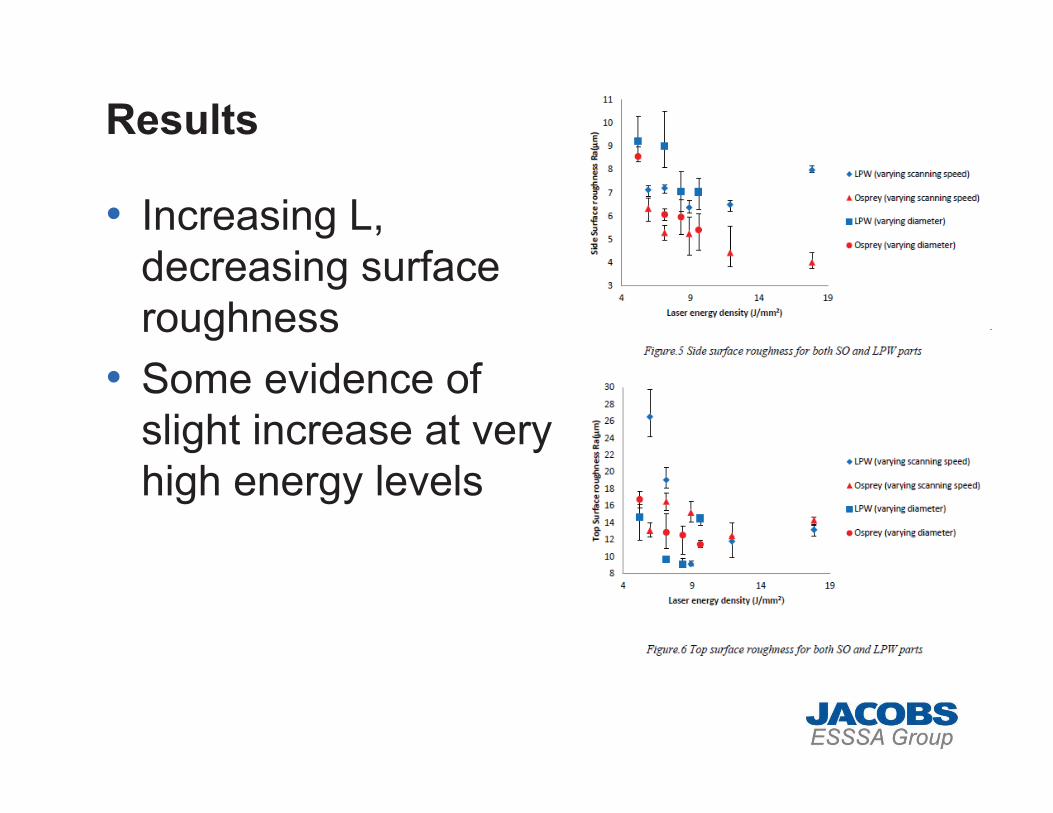
Results
• Increasing L, decreasing surface roughness
• Some evidence of slight increase at very high energy levels
Known surface finish issue
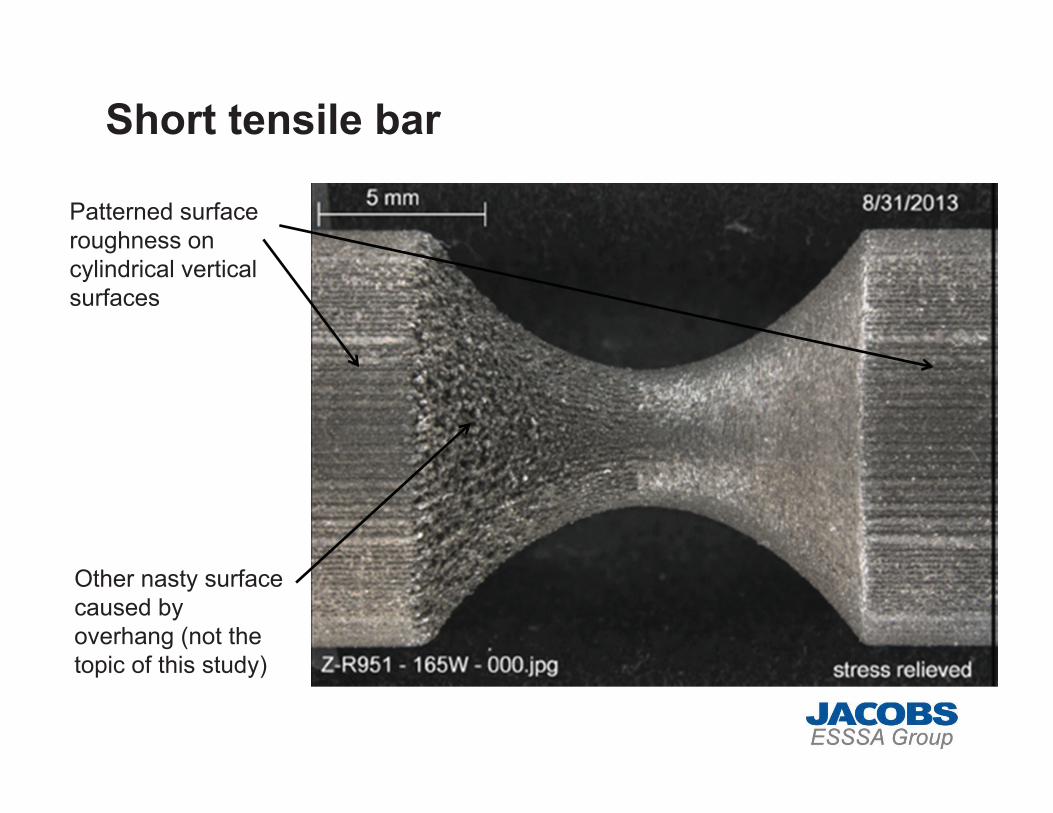
Short tensile bar
Patterned surface roughness on cylindrical vertical surfaces
Other nasty surface caused by overhang (not the topic of this study)

Tensile bar gauge section
Patterned surface texture on this end only
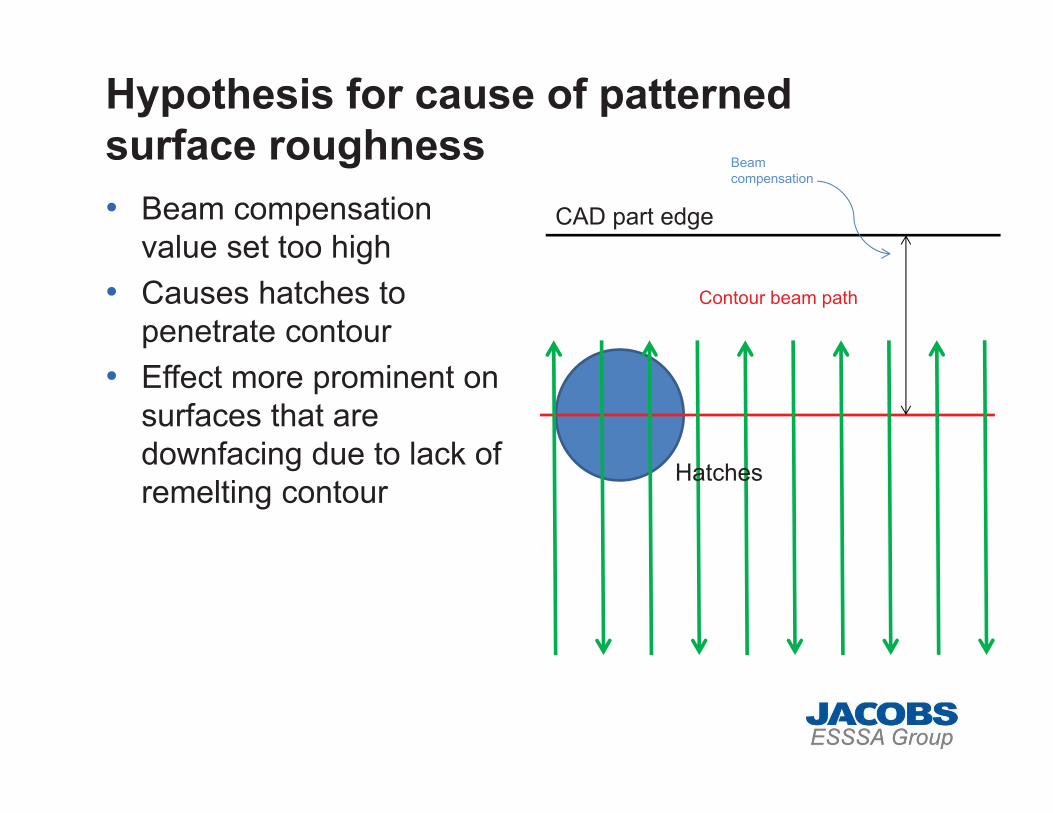
Hypothesis for cause of patterned surface roughness• Beam compensation
value set too high• Causes hatches to
penetrate contour• Effect more prominent on
surfaces that are downfacing due to lack of remelting contour
Contour beam path
CAD part edge
Beam compensation
Hatches
Contour Parameter Optimization DOE 1
Goals• Improve as-built surface finish• Better understand relationship between
contour scan L and surface finish• Determine if patterned surface finish
observed on tensile bars is a function of beam offset
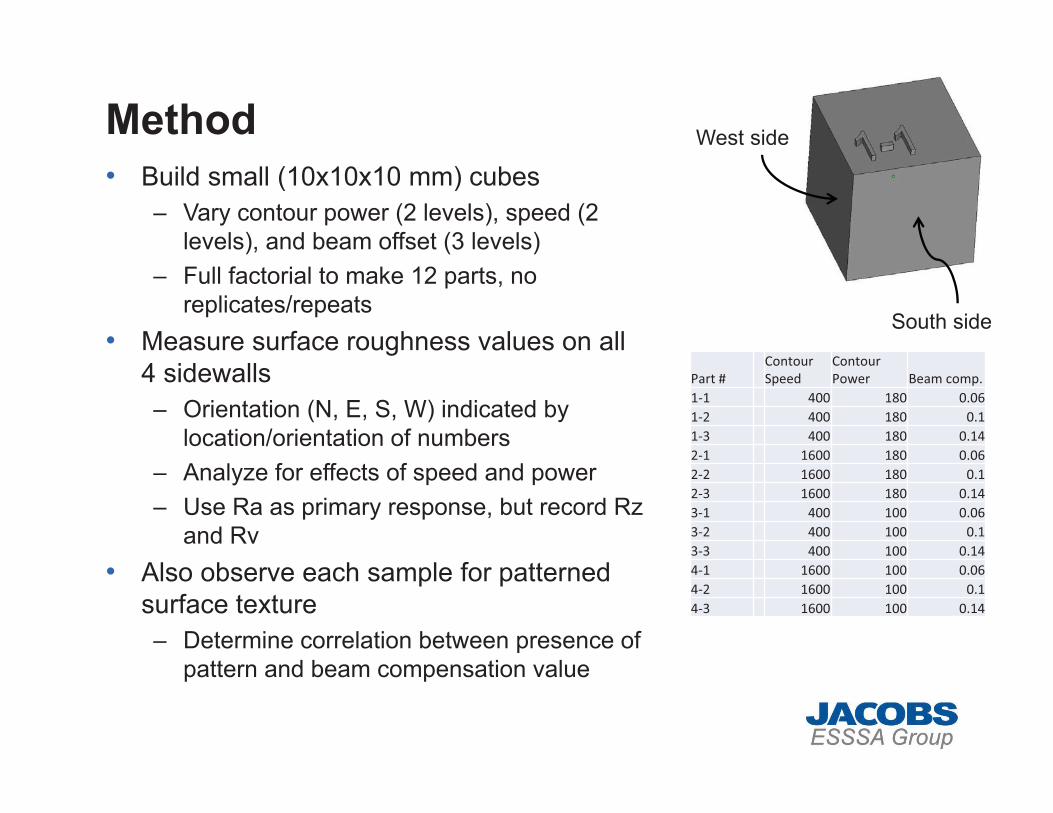
Method• Build small (10x10x10 mm) cubes
– Vary contour power (2 levels), speed (2 levels), and beam offset (3 levels)
– Full factorial to make 12 parts, no replicates/repeats
• Measure surface roughness values on all 4 sidewalls– Orientation (N, E, S, W) indicated by
location/orientation of numbers– Analyze for effects of speed and power– Use Ra as primary response, but record Rz
and Rv• Also observe each sample for patterned
surface texture– Determine correlation between presence of
pattern and beam compensation value
Part #ContourSpeed
Contour�Power Beam�comp.
1�1 400 180 0.061�2 400 180 0.11�3 400 180 0.142�1 1600 180 0.062�2 1600 180 0.12�3 1600 180 0.143�1 400 100 0.063�2 400 100 0.13�3 400 100 0.144�1 1600 100 0.064�2 1600 100 0.14�3 1600 100 0.14
South side
West side
Results
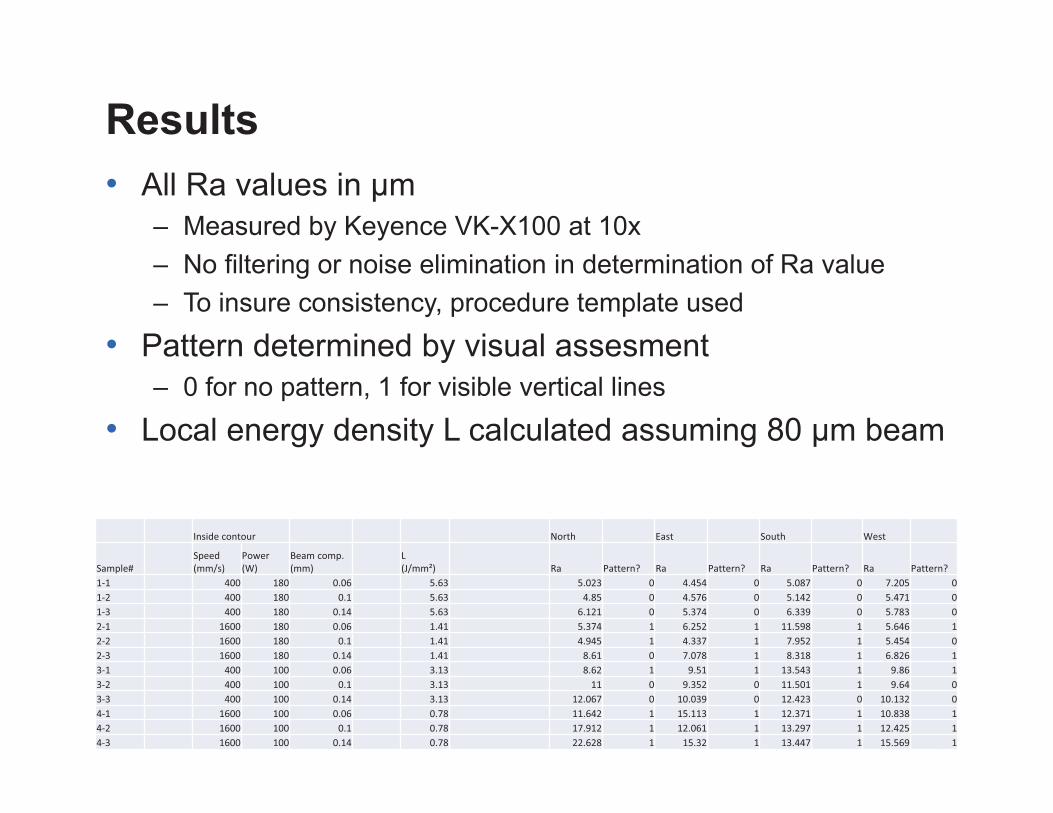
Inside�contour North East South West
Sample#Speed(mm/s)
Power(W)
Beam�comp.(mm)
L(J/mm²) Ra Pattern? Ra Pattern? Ra Pattern? Ra Pattern?
1�1 400 180 0.06 5.63 5.023 0 4.454 0 5.087 0 7.205 01�2 400 180 0.1 5.63 4.85 0 4.576 0 5.142 0 5.471 01�3 400 180 0.14 5.63 6.121 0 5.374 0 6.339 0 5.783 02�1 1600 180 0.06 1.41 5.374 1 6.252 1 11.598 1 5.646 12�2 1600 180 0.1 1.41 4.945 1 4.337 1 7.952 1 5.454 02�3 1600 180 0.14 1.41 8.61 0 7.078 1 8.318 1 6.826 13�1 400 100 0.06 3.13 8.62 1 9.51 1 13.543 1 9.86 13�2 400 100 0.1 3.13 11 0 9.352 0 11.501 1 9.64 03�3 400 100 0.14 3.13 12.067 0 10.039 0 12.423 0 10.132 04�1 1600 100 0.06 0.78 11.642 1 15.113 1 12.371 1 10.838 14�2 1600 100 0.1 0.78 17.912 1 12.061 1 13.297 1 12.425 14�3 1600 100 0.14 0.78 22.628 1 15.32 1 13.447 1 15.569 1
• All Ra values in μm– Measured by Keyence VK-X100 at 10x– No filtering or noise elimination in determination of Ra value– To insure consistency, procedure template used
• Pattern determined by visual assesment– 0 for no pattern, 1 for visible vertical lines
• Local energy density L calculated assuming 80 μm beam
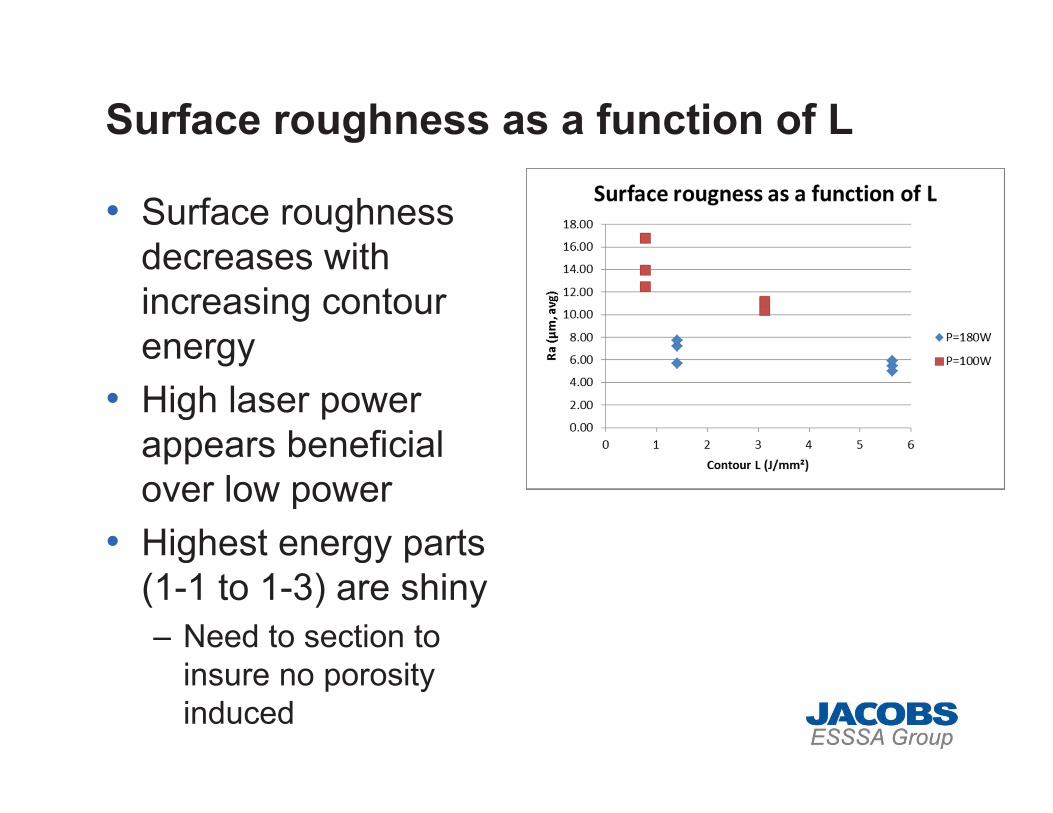
Surface roughness as a function of L
• Surface roughness decreases with increasing contour energy
• High laser power appears beneficial over low power
• Highest energy parts (1-1 to 1-3) are shiny– Need to section to
insure no porosity induced
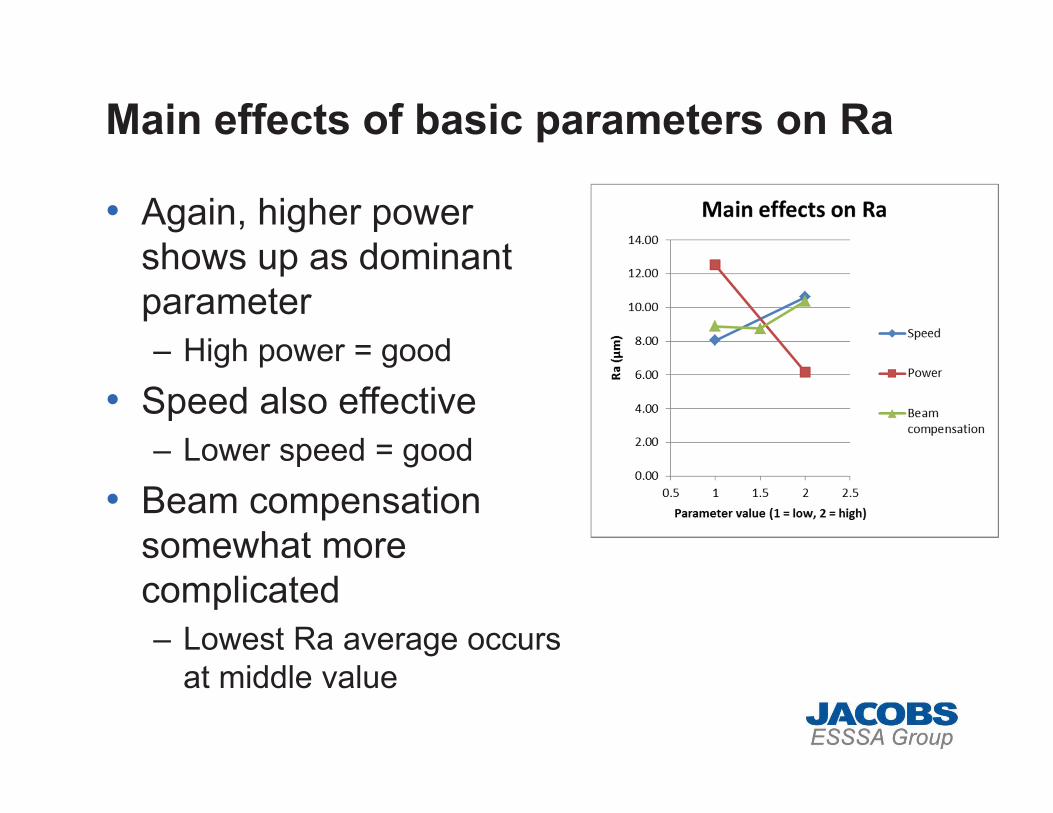
Main effects of basic parameters on Ra
• Again, higher power shows up as dominant parameter– High power = good
• Speed also effective– Lower speed = good
• Beam compensation somewhat more complicated– Lowest Ra average occurs
at middle value
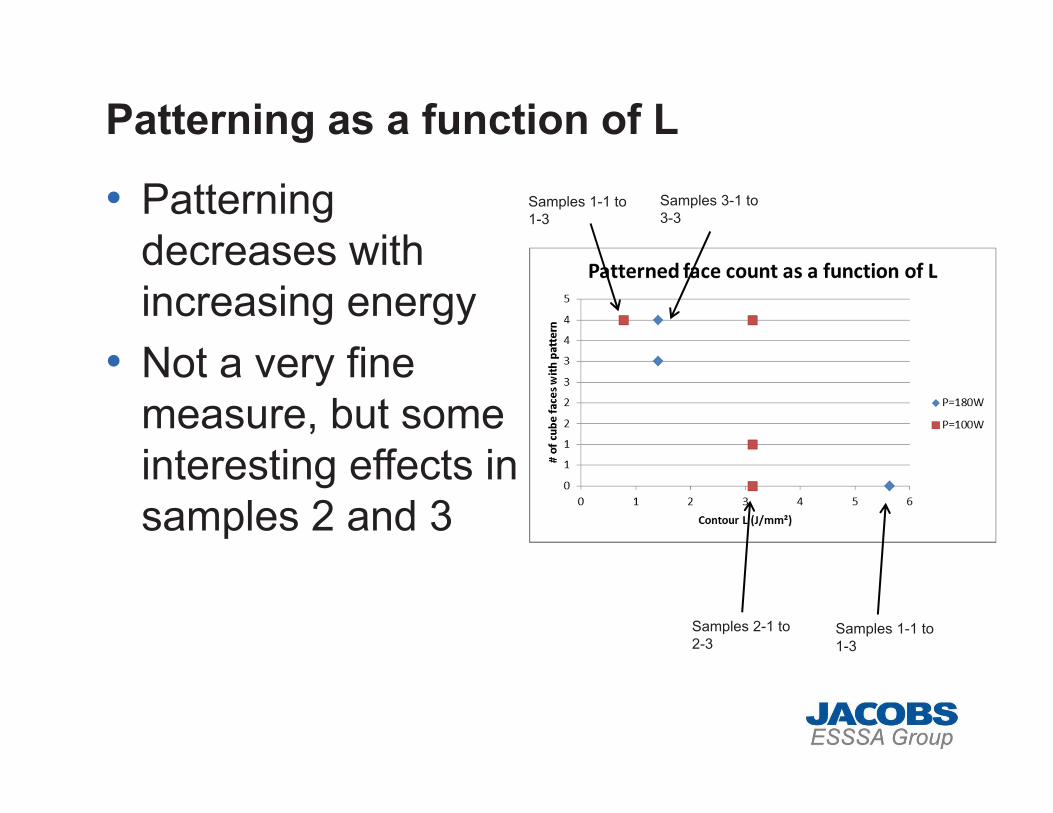
Patterning as a function of L
• Patterning decreases with increasing energy
• Not a very fine measure, but some interesting effects in samples 2 and 3
Samples 1-1 to 1-3
Samples 3-1 to 3-3
Samples 2-1 to 2-3
Samples 1-1 to 1-3
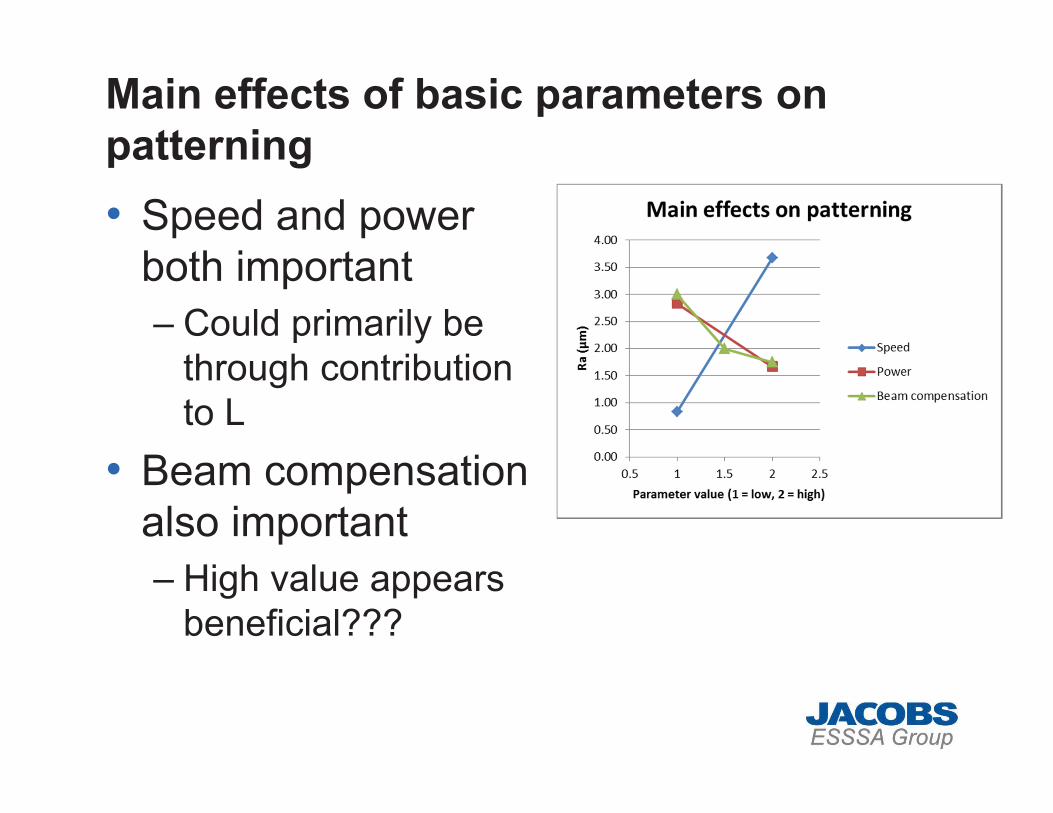
Main effects of basic parameters on patterning• Speed and power
both important– Could primarily be
through contribution to L
• Beam compensation also important– High value appears
beneficial???
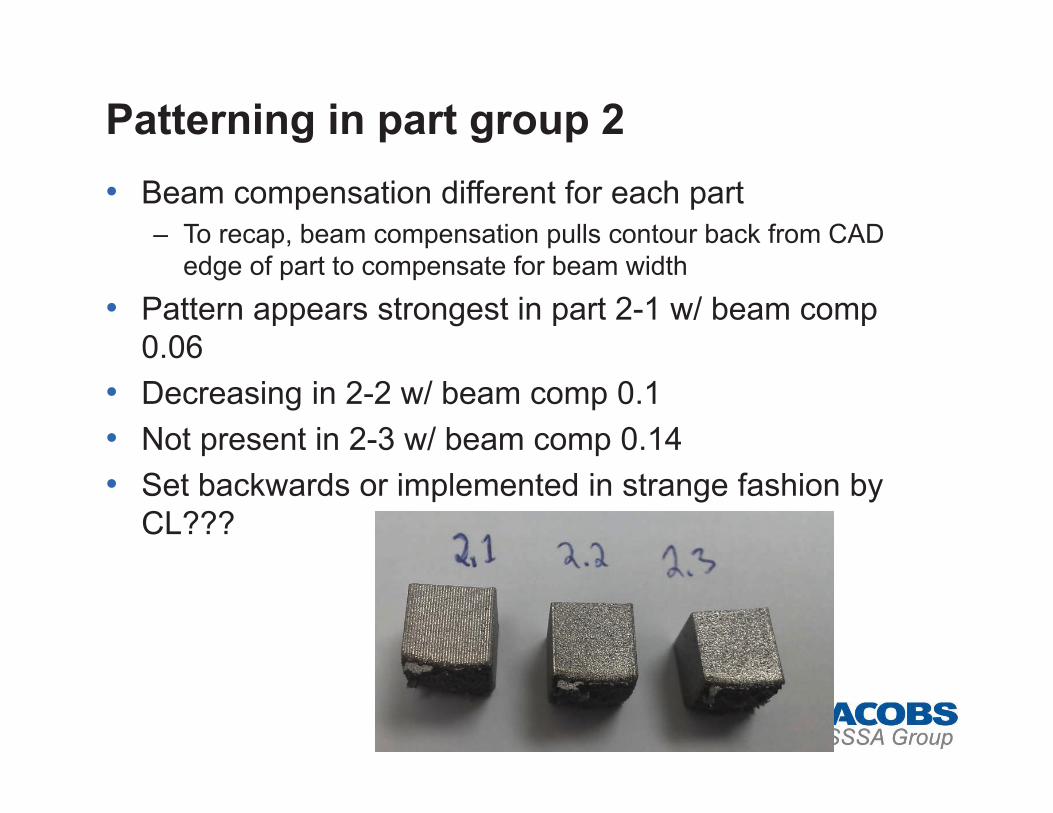
Patterning in part group 2• Beam compensation different for each part
– To recap, beam compensation pulls contour back from CAD edge of part to compensate for beam width
• Pattern appears strongest in part 2-1 w/ beam comp 0.06
• Decreasing in 2-2 w/ beam comp 0.1• Not present in 2-3 w/ beam comp 0.14• Set backwards or implemented in strange fashion by
CL???

Review of Predictions
• Higher local energy L will lead to lower Ra• Patterning will be prominent on samples
with high beam comp. (1-3, 2-3, 3-3, 4-3)– Opposite observed
• Patterning will be less prominent on higher contour scan energy
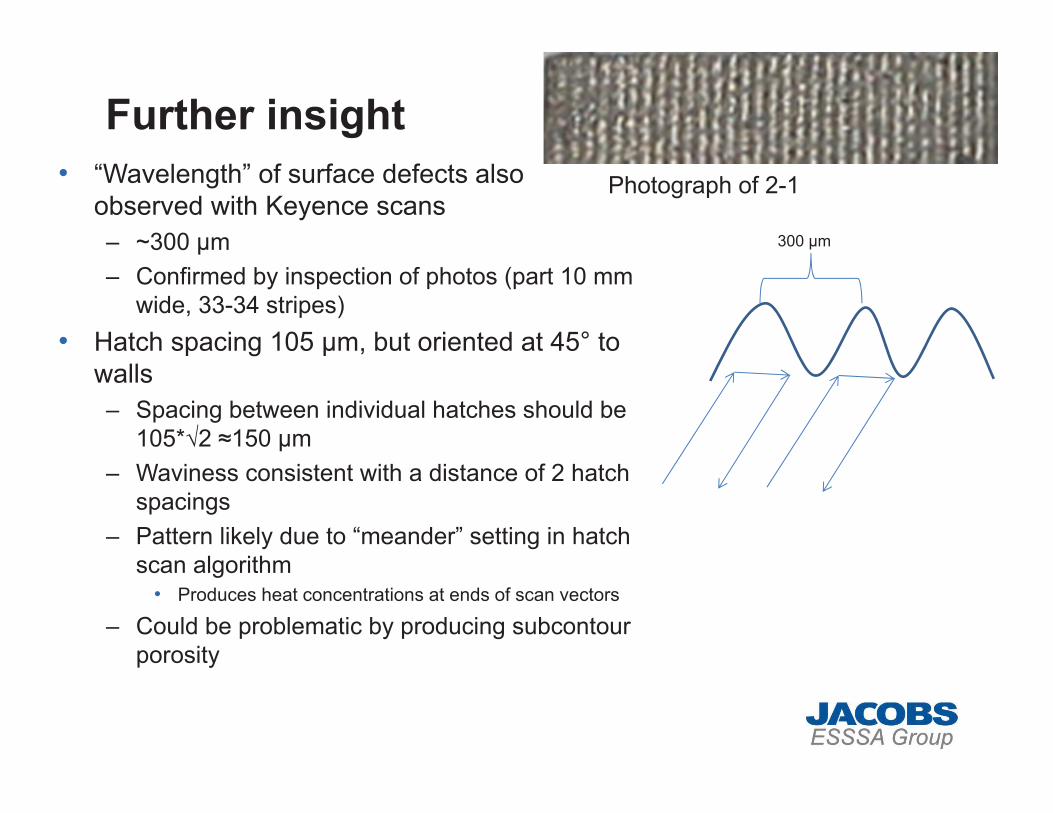
Further insight• “Wavelength” of surface defects also
observed with Keyence scans– ~300 μm– Confirmed by inspection of photos (part 10 mm
wide, 33-34 stripes)• Hatch spacing 105 μm, but oriented at 45° to
walls– Spacing between individual hatches should be
105*�2 �150 μm– Waviness consistent with a distance of 2 hatch
spacings– Pattern likely due to “meander” setting in hatch
scan algorithm• Produces heat concentrations at ends of scan vectors
– Could be problematic by producing subcontourporosity
300 μm
Photograph of 2-1
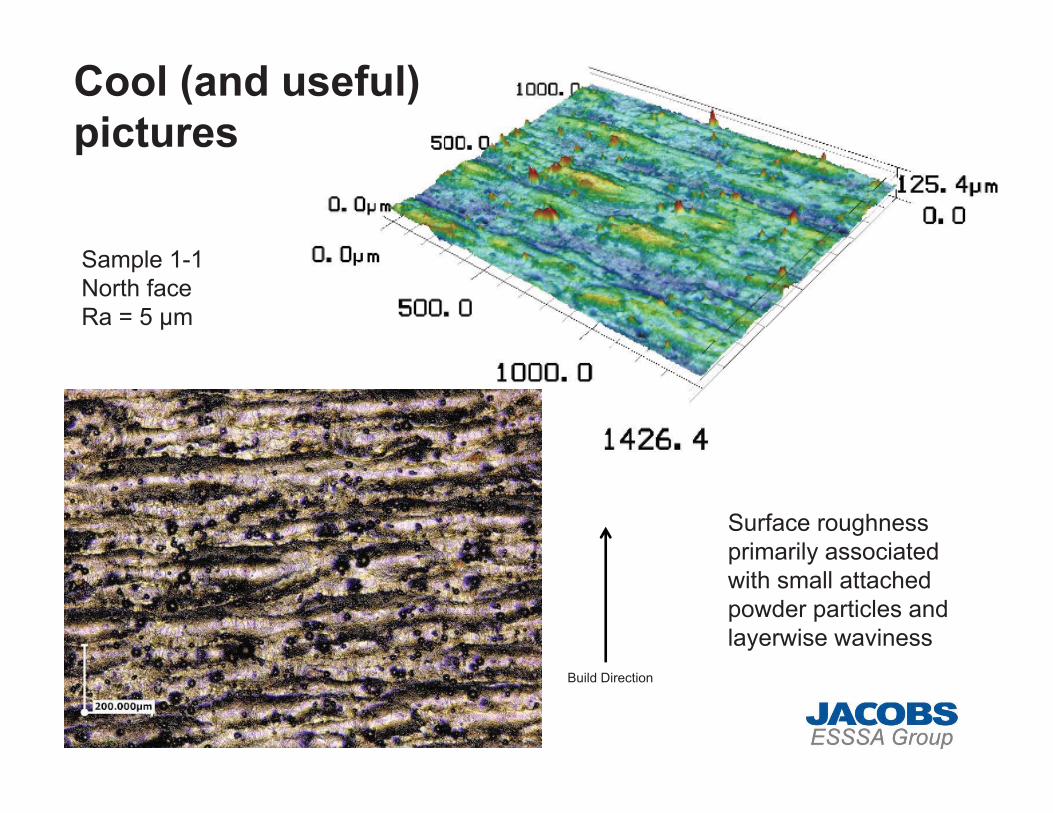
Cool (and useful)pictures
Build Direction
Sample 1-1North face Ra = 5 μm
Surface roughness primarily associated with small attached powder particles and layerwise waviness
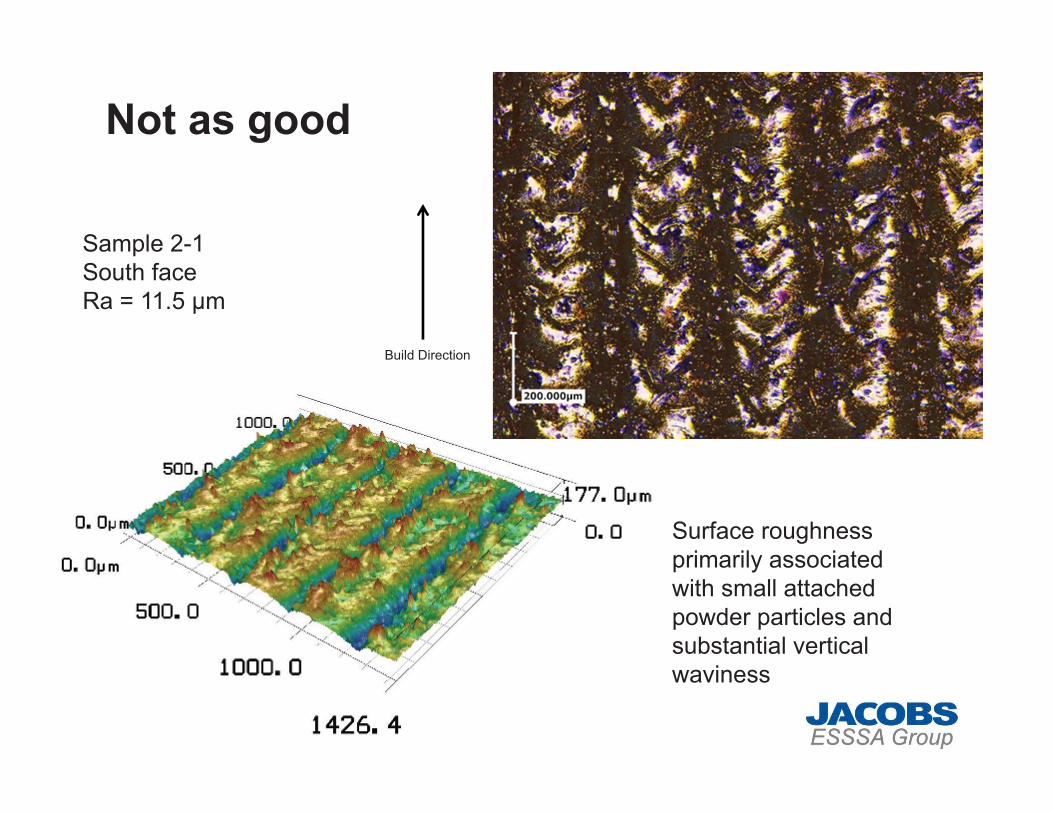
Not as good
Sample 2-1South face Ra = 11.5 μm
Surface roughness primarily associated with small attached powder particles and substantial vertical waviness
Build Direction
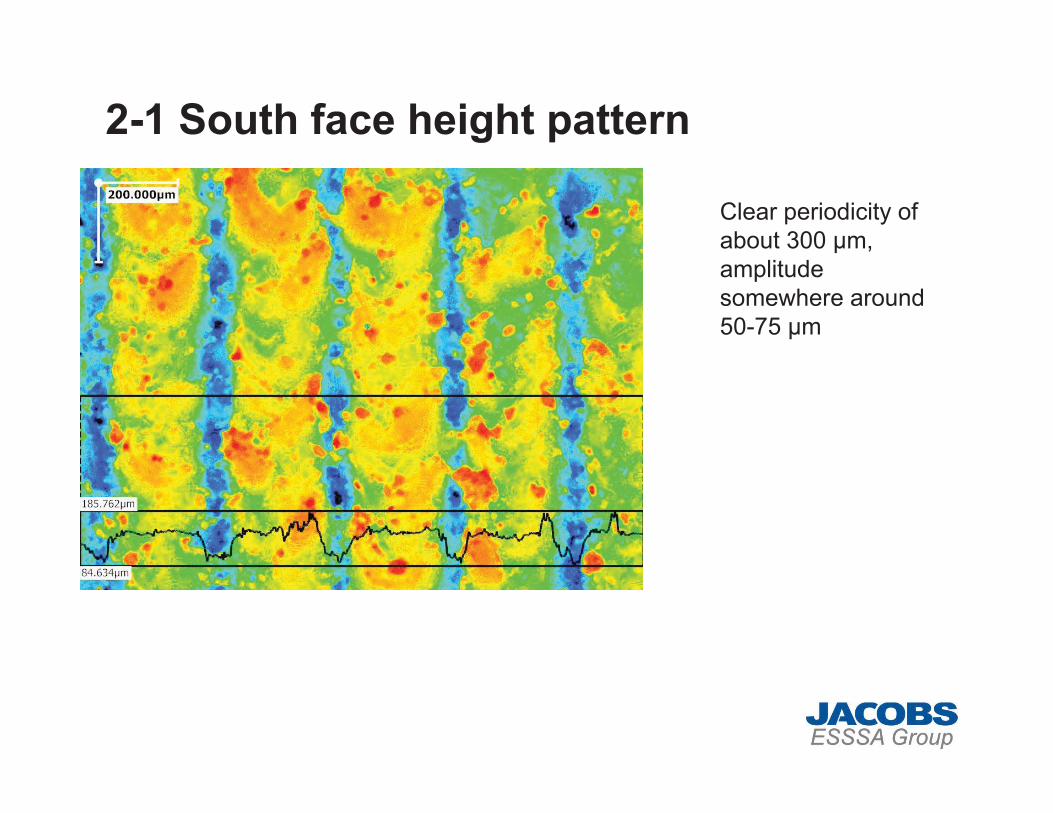
2-1 South face height pattern
Clear periodicity of about 300 μm, amplitude somewhere around 50-75 μm
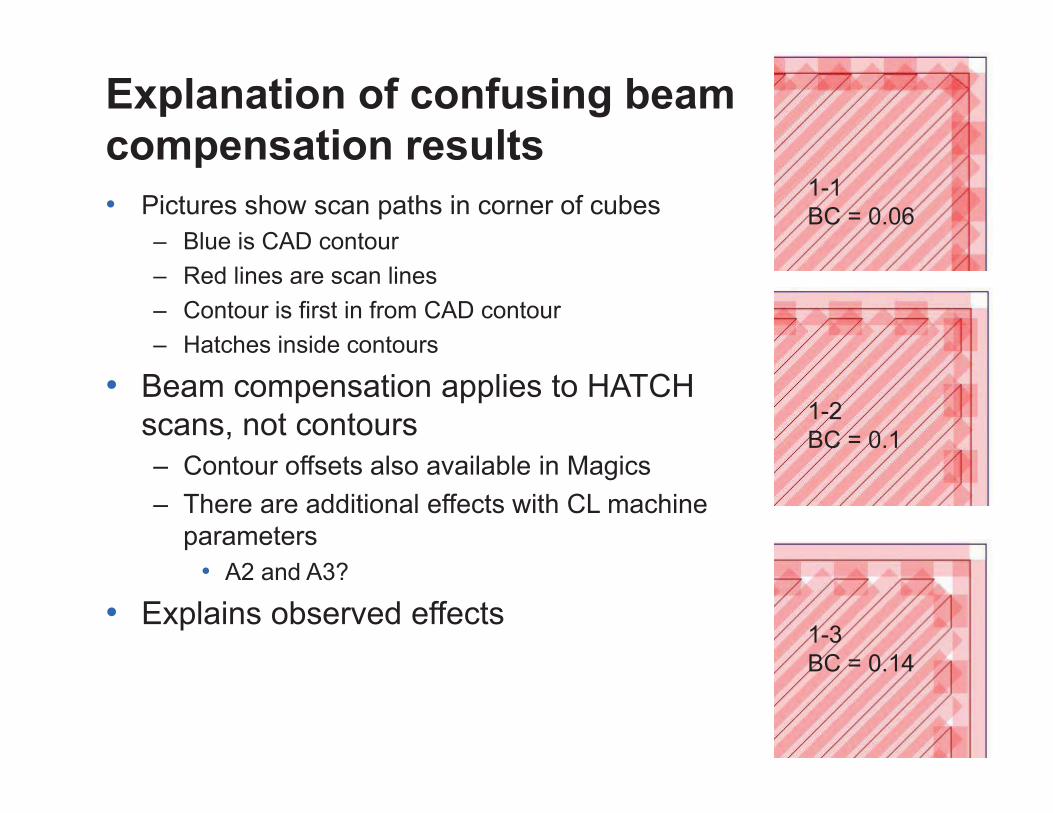
Explanation of confusing beam compensation results• Pictures show scan paths in corner of cubes
– Blue is CAD contour– Red lines are scan lines– Contour is first in from CAD contour– Hatches inside contours
• Beam compensation applies to HATCH scans, not contours– Contour offsets also available in Magics– There are additional effects with CL machine
parameters• A2 and A3?
• Explains observed effects
1-1BC = 0.06
1-2BC = 0.1
1-3BC = 0.14
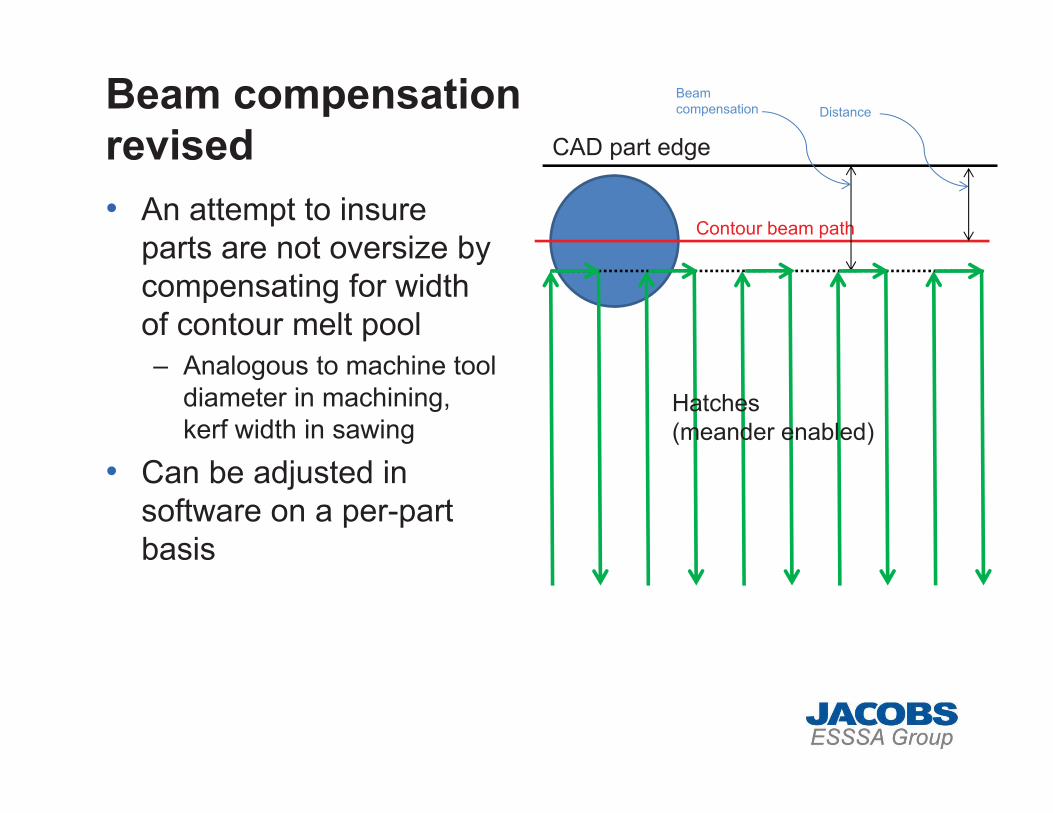
Beam compensationrevised• An attempt to insure
parts are not oversize by compensating for width of contour melt pool– Analogous to machine tool
diameter in machining, kerf width in sawing
• Can be adjusted in software on a per-part basis
Contour beam path
CAD part edge
Beam compensation
Hatches (meander enabled)
Distance
Next steps
• Determination of method to eliminate waviness– Build parts with hatch scan only (no contours!)– Evaluate default 45 μm parameters as compared to
custom parameters• Produce documentation for the effects of scan
parameters– Magics parameters Beam Compensation, Distance– Concept Laser Software parameters Trace Width, A1,
A2, A3 in Continuous scanning context