Embed Size (px)
Citation preview

Direct measurement of contraction force in cardiac tissue construct in 2D- plane using
dual axis cantilever sensor Juhani Virtanen1,*, Maria Koivisto2, Tarja Toimela2, Antti Vehkaoja1, Tuula Heinonen2, Sampo Tuukkanen1 1Faculty of Medicine and Health technology (MET), Tampere University (TAU), Tampere, Finland. 2FICAM (Finnish Center for Alternative Methods), Faculty of Medicine and Health Technology, Tampere University, Finland. *Corresponding author email: [email protected]
Abstract In this work, we present a technique for a dual axis contraction force measurement of human cell based cardiac tissue constructs. The cardiac tissue constructs consist of a vascular-like network and induced pluripotent stem cell derived cardiomyocytes. Before the force measurements, the cardiac tissue constructs were detached from the culture substrate to allow less restricted contraction. The in-house prepared force sensors are composed of piezoelectric sensing elements and a metallic cantilever for contacting the cardiac tissue constructs. Dedicated measurement platform with embedded signal processing software is used for data acquisition from the sensors. Dual axis force sensor results are compared with our previously developed single axis force sensor technique. Additionally, the proposed dual axis force measurement system is capable of measuring two dimensional displacement trajectories of the cantilever probe tip. We propose a pattern matching method for classification of the captured cardiac contraction cycle patterns and for extracting anomalies in the measured cycles. We demonstrate both single and dual axis peak cardiac construct contraction force measurement results ranging 3.4 - 6.7 µN and 9.4 - 10.6 µN, respectively. The relative standard deviation of the peak contraction force results varied between 1.0 and 4.1% in eight captured 60 second measurement sequences.
Introduction Cardiotoxicity is one of the main reasons for discontinuation of drug development processes and for post approval market withdrawals (Lasser et al. 2002; Li et al. 2016) In addition to ethical issues, the use of animal models is not optimal for predicting the drug effects in humans (Olson et al. 2000). To make more accurate test systems, human induced pluripotent stem cell (hiPSC) based cardiac in vitro models have been under active research. The cardiotoxicity of drugs can be studied in hiPSC derived cardiomyocytes by using for example patch clamp, microelectrode array (MEA), impedance and calcium dynamics measurements (Li et al. 2002). While they are valuable tools for measuring the electrophysiology and contractility of the cardiomyocytes in toxicity studies, they can not directly measure the contraction force of cardiomyocytes. The direct contraction force measurement would provide more useful information about the contraction force which cannot be obtained by action potential measurements.
Cardiac cell and tissue contraction force measurements have been earlier proposed with various approaches. Direct force measurements where the force signal is obtained by a force measurement system have been reported using atomic force microscope (Cogollo et al. 2011; Mathur et al. 2001; Vyas et al. 2017). Flexible sheet approach where cardiac cells are cultured on an elastic sheet and the cardiac contraction is measured from the deflection of the sheet during contraction has been proposed by Linder et al (Linder
1

et al. 2010) while Kim et al. (2017) used PDMS cantilevers. Contraction force measurement can also be conducted using video imaging. Balaban et al. (2001) proposed a microstructured substrate with elastic properties use with video imaging (Balaban et al. 2001). Mannhardt et al. (2016) proposed cardiac construct culture on fixed pillars and obtaining the reactive contraction force by video imaging. Imaging techniques can also be applied to cantilever based force measurement approaches (Sugiura et al. 2006; Myachina et al. 2018). Sugiura et al. have proposed a method where mechanical properties of a carbon fibre is used in the measurement by observing the displacement of the carbon fibre with video imaging and obtaining the force from this information.
In this paper, we present an improved technique compared to our previously reported single axis force measurement setup (Virtanen et al. 2020). We demonstrate a piezoelectric dual axis cantilever force sensor for direct contraction force measurement of cardiac tissue constructs. These constructs consist of vascular-like network and hiPSC- derived cardiomyocytes. Our approach utilizes a perforated silicone sheet and a detachment procedure in the cardiac tissue construct fabrication. The detachment enables less restricted contraction of the cardiac tissue construct as it is not attached to the culture substrate. We present in vitro contraction force measurement results on both single axis and dual axis approaches and compare their results.
Materials and methods
Force sensor design The single axis force measurements were carried out with a previously studied single axis force measurement probe. That consists of a single piezoelectric sensor element which is attached to a metal probe to form a cantilever force sensor. The sensor design and measurement setup is described in more detail in (Virtanen et al. 2020). A dual axis piezoelectric cantilever force sensor with two lead zirconate titanate (PZT) sensing elements was developed and studied in this work. The sensor itself consists of a brass plate with PZT sensor material on it. Dual axis sensing capability is achieved by assembling two piezoelectric sensor elements perpendicular to each other forming a L- shaped structure. While the end of the other sensor plate is used as a fixed attachment point of the sensor, the other plate is attached to a rigid cantilever beam whose tip is used for contacting the measured cardiac tissue construct. The operation of the sensing element is based on linear elastic behaviour of the brass plate plated with a piezoelectric PZT material on its surface. The dynamic behaviour of the sensor is determined by the mass and its location in the sensor and the spring constant of the cantilever as well as piezoelectric properties of the PZT material. When force is applied to the cantilever probe tip the piezoelectric material converts the resulting stress to electrical signal. The sensor design was optimised using COMSOL Multiphysics (Comsol AB, Stockholm, Sweden) finite element method (FEM) simulations. The simulations provide information about the expected charge-output/force-input behaviour for certain sensor dimensions and assembly. A hand-made prototype of the cantilever sensor was fabricated with a similar method that have been used previously (Virtanen et al. 2020). Commercial piezo discs were used as the sensing elements and their shape was tailored by cutting to match the simulated design. The L- shaped sensor structure and electrical contacts were soldered to form an electrically connected dual axis force sensor. An example of prepared dual axis force sensor is shown in Figure 1(a) and 1(b). A schematic drawing of the sensor concept is shown in Figure 1(c).
2

Figure 1. The L- shaped sensor construction. Front view and side view are shown in panels (a) and (b), respectively. Panel (c) shows a dimensioned drawing of the sensor prototype . It is necessary to have the cantilever sensor spring constant at a certain level to measure force instead of only displacement. Also the spring constant should not be too high affecting cardiac construct contractility behaviour. The spring constant value of the sensor was thus set as the main design parameter with target value of 5 N/m. This was to study the effect of larger (> 1 N/m) spring constant (i.e. more restriction to the movement of the cells) to the cardiac contraction force measurement results. Another aim was to have a higher resonant frequency margin compared to our previous single axis measurement probe which has a natural frequency of approximately 14 Hz (Virtanen et al. 2020). The calibration of the sensor was carried out using a texture analyser Stable Micro Systems TA.XTPlus (Stable Micro Systems Ltd, Surrey, United Kingdom). The calibration procedure has been presented in detail previously in (Virtanen et al. 2018, 2019, 2020). In short, the sensor was loaded with a sine wave sweep that has a defined displacement amplitude. Here the used displacement sweep amplitude was 100 µm and the implied force was recorded with both the texture analysator and with the proposed sensor. This procedure was performed with both of the axes. After the calibration measurements the axial tilt or distortion in the sensor output was corrected with software to fit the data on x- and y- axes. The impulse response measurement was carried out for both of the axes in order to ensure suitable frequency response band in the measurement system. The impulse excitation was done by creating by manually tapping the sensor probe tip. The frequency response was then obtained by fourier transforming the impulse response data.
Data acquisition platform The measurement hardware and embedded signal processing software is similar to our previous work (Virtanen et al. 2019), except that the embedded part of the digital electronics was implemented using Teensy 3.6 board (PJRC.COM LLC., Sherwood, USA) instead of Arduino Due which was used previously. The measurement electronics consists of a buffer amplifier with a gain of 1 and input impedance of 50 MΩ. The main difference affecting the measurement results between the Arduino Due and Teensy 3.6 is the analog to digital conversion resolution, which is 12- bits in Arduino Due and 16- bits in Teensy 3.6. The functionality of the software was retained and the program was only recompiled and programmed to Teensy 3.6 hardware. The embedded system first samples the sensor signal is at 6 kHz for each of the two channels. After the sampling, a seventh order digital filter is applied to the signal in order to limit the bandwidth and remove powerline interference and its harmonics. The signals are then averaged to reduce the sampling rate to 50 Hz. Finally data transferred to a personal computer via Universal Serial Bus (USB). As with the previous demonstration, the data is moved from the Teensy 3.6 platform to LabVIEW user
3

interface and data collection software. The signal processing methodology is described in more detail previously in (Virtanen et al. 2019).
Fabrication of cardiac tissue constructs The use of human adipose stromal cells (hASCs) obtained from surgical operations and human umbilical vein endothelial cells (HUVECs) from scheduled caesarean sections was approved by the Ethics Committee of the Pirkanmaa Hospital District (permit numbers R03058 and R08028, respectively).
The cardiac tissue constructs were fabricated by a technique adapted from previous work (Vuorenpää et al. 2014, 2017; Virtanen et al. 2020). A polydimethylsiloxane (PDMS, Sylgard 184, Dow Corning, USA) sheet (h = 1 mm) containing punched holes (d = 3 mm) was reversibly bonded to a temperature responsive cell culture dish (Nunc UpCell, Thermo Scientific). A fibrin gel was formed in the PDMS holes by mixing 1:1 an excess of a solution containing 5.5 mg/ml fibrinogen (Sigma Aldrich, F3879) and 38 µg/ml aprotinin (Sigma Aldrich, A1153) and an excess of thrombin (Sigma Aldrich, T7009), and leaving 5 µl of the mixture in each hole for polymerization in +37 °C. This method ensured that the fibrin was properly attached to the walls of the PDMS holes.
To produce vascular-like network base for cardiac tissue constructs, hASCs and HUVECs were propagated separately before seeding them as a co-culture onto the fibrin as previously described in (Toimela et al. 2017). The vascular-like network was allowed to form for 7 days in a serum-free stimulation medium (SFSM) consisting of DMEM/F12, 2.56 mM L-glutamine, 0.1 nM 3,3′,5-Triiodo-L-thyronine sodium salt, ITS™ Premix: 1.15 μM: 6.65 μg/ml insulin, 6.65 μg/ml Transferrin, 6.65 ng/ml selenious acid, 1% Bovine serum albumin, 2.8 mM Sodium pyruvate, 200 μg/ml Ascorbic acid, 0.5 μg/ml Heparin, 2 μg/ml Hydrocortisone, 10 ng/ml VEGF, and 1 ng/ml FGF-β as described in (Huttala et al. 2015). On day 8, hiPSC-derived cardiomyocytes (iCell², Cellular Dynamics) were seeded on top of the vascular-like network at 312000 cardiomyocytes/cm² in iCell Cardiomyocytes Plating Medium (Cellular Dynamics, M1001). After cardiomyocyte seeding, 1:1 iCell Cardiomyocytes Maintenance Medium (Cellular Dynamics, M1003) and SFSM were used. Cells were maintained in humidified incubator at +37 °C, 5% CO₂ and the medium was refreshed every 2 days.
The PDMS sheets containing the cardiac tissue constructs were detached from the original cell culture substrates 6 days after the cardiomyocyte seeding (Figure 2). The PDMS sheets were placed onto PDMS stands in a new cell culture dish. This resulted in a setup where the cardiac tissue is attached to the walls of the PDMS hole and is not in direct contact with the cell culture substrate anymore. This allows the tissue to contract more freely than when attached to the bottom of a cell culture dish. Contraction force measurements were performed 9 - 14 days after cardiomyocyte seeding. Leibovitz’s L-15 Medium (Gibco, 11415) was used during the measurements.
4

Figure 2. Detached cardiac tissue construct in a PDMS hole 10 days after cardiomyocyte seeding.
Contraction force measurements
For contraction force measurements, the cell culture dishes were placed on a heater plate set to +37 °C on an optical microscope (Zeiss Primovert, Carl Zeiss AG, Oberkochen, Germany). To improve the attachment between the force measurement cantilever tip and the cells, the cantilever tip was coated with 5.5 mg/ml fibrinogen and contacted with the cardiac tissue construct using a 3- axis linear micromanipulator (Newport Corporation, Irvine, USA) as previously described in (Virtanen et al. 2020). The measurement setup is illustrated in Figure 3 for single (b) and dual axis (c) measurements. The angle between the cardiac tissue and the cantilever was approximately 30 degrees for the single axis probe while the dual axis probe contacted the cardiac tissue vertically. Figure 4 describes schematically the side-view of dual axis cantilever in contact with the cardiac tissue construct and shows the microscopy view during the measurement.
Figure 3. (a) Measurement setup under microscope in (b) a single axis cantilever and (c) dual axis cantilever cases, showing the approach to the cardiac tissue with the sensor probes. The single axis sensor probe was used in approximately 30- degree tilt angle while the dual axis sensor probe was placed vertically to the cardiac tissue construct.
5

Figure 4. (a) Cross section of the detached cardiac tissue construct on a PDMS stand and the force measurement probe. (b) The force measurement cantilever tip is in contact with the cardiac tissue construct during dual axis force measurement. The diameter of the tip shown in the figure is 0.9 mm. Cardiac tissue construct contraction force measurements were carried out with both previously presented single axis (Virtanen et al. 2020) and the new L- shaped dual axis force measurement probe. For the comparison of the two force measurement approaches, four force measurements were carried out with both force measurement probes. Contraction force was recorded for 60 seconds during each of the eight measurements. In the data processing, the dual axis force measurement x- and y- force components were converted to show the measurement probe tip displacement trajectory. Also a total force magnitude curve was computed in order to have a comparable force representation with the single axis force measurement. This was carried out by first computing the magnitude and rotation angle of the reactive force and then projecting the force to the main axis where the zero level corresponded the zero value in the force magnitude. As the measured force signals were clean of artefacts and had high signal to noise ratio, a simple method of finding local maxima above an adaptive threshold was sufficient for locating the cycles with 100% sensitivity and specificity. The peak location data was used to obtain beat rate of the cardiac tissue construct by computing a time interval between consecutive peaks.
6

Cardiac contraction cycle pattern matching We propose the use of a pattern matching approach for further processing the measurement data. It is used to divide the measured cardiac cycles in two groups: the cycles closely resembling each other and the ones that contain any type of disturbance, either originating from the cell contraction itself or being caused by the environment, e.g. vibration or percussion. The purpose of dividing the data may be two fold: 1. to enhance the precision of the peak force measurement by removing cardiac cycles containing random variation and noise and 2. to automatically identify the cycles containing anomalies and separate them for further investigation. This method is principally presented in our previous work (Virtanen, Somppi et al. 2018) and it was further developed with the addition of peak detection and pattern template forming. In short, first the maximum force peaks are identified by differentiating the measured force signal from the 60 second data. Two consecutive peaks then locate a cardiac contraction cycles which are then used to compute pointwise average or median curve to be used as a template for the pattern matcher. In this work a median template was chosen. Since the identified peak does not initiate a cardiac cycle a certain offset was added to the template to represent a complete cycle. Cardiac cycle data is then compared to the template by first normalising it with the maximum value of one cardiac cycle. Then a squared sum of differences between the template and each data point represents a distance to the template. Here the thresholding level for the pattern matcher was heuristically obtained from a particularly successful sample set such that the thresholding would cause all the cycles in this dataset to be interpreted as matching cycles. Finally, the decision with the other cycle sets of either matching or discarding cycles was done by thresholding the computed distance values.
Results
Dual axis FEM and calibration measurement results The sensitivity and spring constant values of the dual axis probe were obtained both with FEM modeling and calibration measurements. The results obtained with modeling are listed in Table 1 along with the measured results. The spring constants of 8.8 N/m and 5.1 N/m were obtained in the simulation for the bending mode (corresponding to x- axis measurement) and twisting mode (corresponding to y- axis measurement), respectively. These spring constant values are comparable to the measured calibration values which were 8.8 N/m and 4.3 N/m for x- and y- axis, respectively. Similarly, the sensitivity values of 890 V/N in x- axis and 322 V/N in y- axis were obtained from the FEM computations. Calibration measurements show slightly different values of 863 V/N and 464 V/N for x- and y- axis, respectively. The FEM computing results of the displacement and electric potential in the piezoelectric material with 0.1 mN load are illustrated in Figures 5(a) and 5(b), respectively.
Table 1. Spring constant and Sensitivity results FEM and calibration.
x- axis (bend mode) y- axis (twist mode)
FEM Measured FEM Measured
Spring constant [N/m] 8.8 8.8 5.1 4.3
Sensitivity [V/N] 890 863 322 464
7

Figure 5. FEM simulation results (a) displacement, (b) electric potential [V] .
Due to the hand fabricated sensor the axes were not orthogonally aligned and there was a tilt error in both axes, which can be seen in Figure 6(a). Therefore the sensor calibration tilt error was corrected by rotating both axes according to the calibration data. Root mean square error (RMS) with respect to the corrected axis was then computed. The results of calibration performed with sine wave excitation are presented in Figure 6. The RMS error after the axial tilt correction was 3.0 µN in x- direction (0 degrees rotation) and 4.4 µN in y-direction (90 degrees rotation). These represent relative errors of 0.6% and 0.5% of the full sweep amplitude in x- and y- axes, respectively.
Figure 6. x- and y- axis calibration measurement results before tilt correction (a) and after tilt correction (b) .
Impulse and frequency response of the dual axis cantilever In order to ensure that the frequency range of the dual axis measurement system is applicable, an impulse response measurement was carried out in both x- and y- directions. This was done by manually inducing an impulse excitation to the sensor and recording the consequent response. The impulse response measurement result is shown in Figure 7(a) and the corresponding frequency response in Figure 7(b). From there it can be seen that the passband of the frequency response is at the desired range of 0.5 - 10 Hz in both directions. The frequency response of the single axis and dual axis sensor measurement systems have similar usable frequency range however the single axis probe has the first natural frequency at approximately 14 Hz.
8
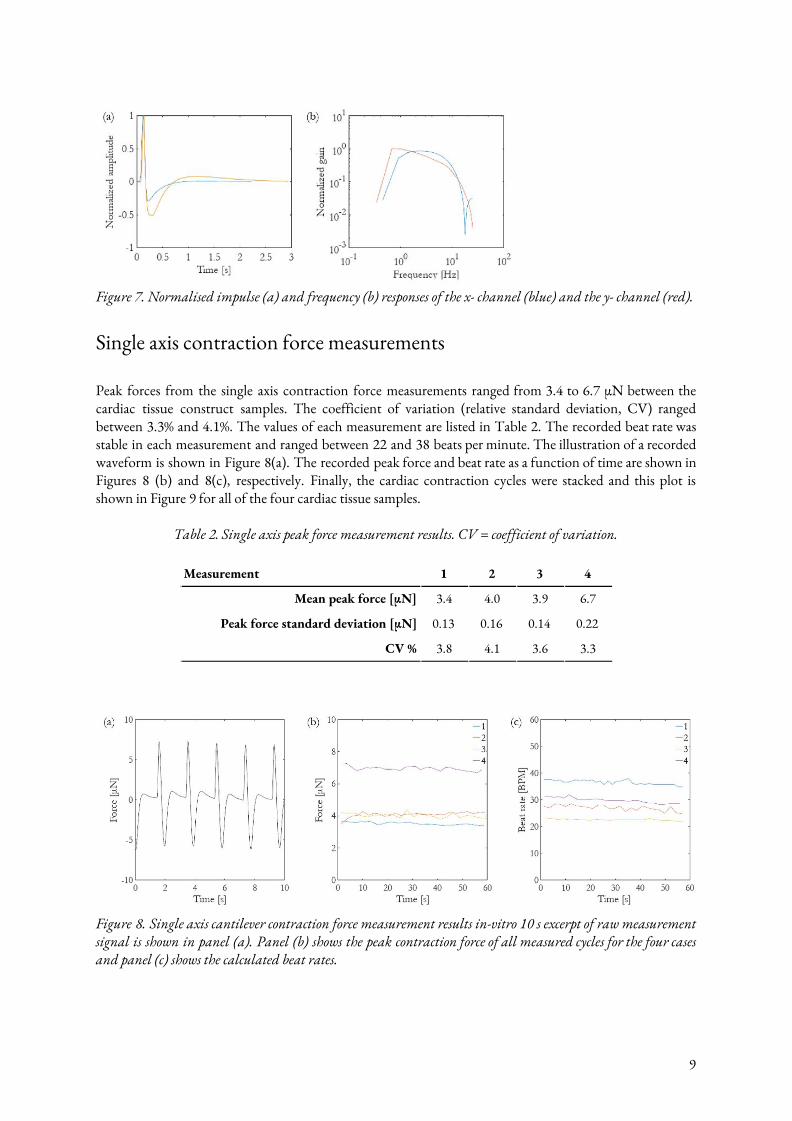
Figure 7. Normalised impulse (a) and frequency (b) responses of the x- channel (blue) and the y- channel (red).
Single axis contraction force measurements Peak forces from the single axis contraction force measurements ranged from 3.4 to 6.7 µN between the cardiac tissue construct samples. The coefficient of variation (relative standard deviation, CV) ranged between 3.3% and 4.1%. The values of each measurement are listed in Table 2. The recorded beat rate was stable in each measurement and ranged between 22 and 38 beats per minute. The illustration of a recorded waveform is shown in Figure 8(a). The recorded peak force and beat rate as a function of time are shown in Figures 8 (b) and 8(c), respectively. Finally, the cardiac contraction cycles were stacked and this plot is shown in Figure 9 for all of the four cardiac tissue samples.
Table 2. Single axis peak force measurement results. CV = coefficient of variation.
Measurement 1 2 3 4
Mean peak force [µN] 3.4 4.0 3.9 6.7
Peak force standard deviation [µN] 0.13 0.16 0.14 0.22
CV % 3.8 4.1 3.6 3.3
Figure 8. Single axis cantilever contraction force measurement results in-vitro 10 s excerpt of raw measurement signal is shown in panel (a). Panel (b) shows the peak contraction force of all measured cycles for the four cases and panel (c) shows the calculated beat rates.
9

Figure 9. Single axis cantilever stacked time domain force plots for the 60 s measurements with four different cardiac tissue populations (measurements 1-4) .
Dual axis contraction force measurements The proposed L- shaped probe was used in in vitro measurements and the results were compared with the measurements done with a previously presented single axis force measurement probe. The trajectory of the L- shaped force measurement probe tip was computed using the x- and y- direction spring constants and the measured sensor output signals. The peak force measurement results for each measurement are shown in Table 3. The peak forces ranged between 9.4 and 10.6 µN while the CV of the peak force ranged between 1.0% and 3.2%. An exemplary shape of a measured total force curve and its corresponding trajectory curve are shown in Figure 10 (a) and 10 (b), respectively. The displacement of the probe tip was approximately ±1 µm in x- direction and ±0.5 µm in y- direction. The trajectory loops in Figure 10 (b) appear as smaller and larger loops, where the larger loop corresponds to the maximum contraction force peak which can be seen from Figure 10 (a). The recorded peak force and the beat rate as a function of time are shown in Figures 10 (c) and 10 (d), respectively. The beat rate varied approximately between 19 and 25 beats per minute (BPM). Finally the cardiac contraction cycles were stacked and this plot is shown in Figure 11 for all of the four cardiac tissue populations.
Table 3. The dual axis peak force measurement results. CV = coefficient of variation. Measurement 5 6 7 8
Mean peak force [µN] 9.7 10.7 9.5 11.2
Peak force standard deviation [µN] 0.24 0.35 0.25 0.11
CV % 2.5 3.2 2.6 1.0
10

Figure 10. Dual axis force measurement results. 10 s excerpt of raw measurement data presented as total force magnitude signal (a) and probe tip location trajectory curve (b) computed from force measurement data using the spring constant values.The peak contraction force of all measured cycles for the four cases (c) and the calculated beat rates (d) .
Figure 11. Beat-by-beat force magnitude cycles of four 60-second recordings with different cardiac tissue populations stacked together (measurements 5-8).
Pattern matching and cycle analysis The threshold level for the pattern matcher was obtained from a particularly successful or ‘golden’ measurement which in this case was considered to be cycle set obtained from measurement 8. All the cycles in this ‘golden’ cycle group are considered to be acceptable or matching. The resulting threshold value was 2.80 (normalised units) which was then used in the method. Cardiac cycles of measurement 5 was further processed with the pattern matching technique. All the identified cycles were split into two categories regarding how closely they resembled the median template using threshold level above. This is illustrated in Figure 12, where (a) illustrates 60 second measurement with identified force peak locations marked with an asterisk, (b) shows the computed and normalised median curve which is used as the template for the pattern
11

matcher and (c) shows a stacked plot of all cycles. In (d), there are also the 60 second cycle set but now only the matching peaks are marked with the asterisk. Finally, (e) and (f) show stacked plots of the matching and discarded cardiac cycles respectively.
Figure 12. Processing of a cell culture force measurement data with the proposed method. (a) all cycles with peaks identified, (b) normalised template (median waveform), (c) all cycles stacked together, (d) closely matching cycles identified, (e) only matching cycles stacked, and (f) discarded cycles stacked. A mean and median force plots from the cycle set 5, from Figure 11, with 95% confidence levels are shown in Figure 13(a). In Figure 13(b) the same data is shown for the matching cycles, while (c) show the discarded cycles, respectively. The standard deviation and the coefficient of variation computed pointwise from the force curves of these three cases are listed in Table 4. The CV of the matching cycles was 2.4% while the discarded set had CV of 5.0%. CV of all the cycles was 4.6%. The main deviation of the cardiac cycle curves concentrate to the bottom peak at the start and also to the end of the cardiac cycle while there is little variation at the maximum force peaks.
Table 4. Pattern matcher parameters calculated from the data presented in Figure 12.
Cycles All Matching Discarded
Mean [µN] 0.00 0.00 0.00
Standard deviation [µN] 0.51 0.26 0.56
CV % 4.6 2.4 5.0
95% Confidence limit [µN] ±1.0 ±0.5 ±1.1
12

Figure 13. Mean and median cardiac cycle from the measurement set S5 together with its 95% confidence levels. All cycles are plotted in panel (a) and the closely matching and the discarded cycles in panels (b) and (c), respectively.
Discussion
Comparison of single and dual axis measurements Based on the results, both single and dual axis force measurement methods are capable of measuring contraction forces of cardiac tissue constructs with adequate capability at the desired force range. The coefficient of variation of the peak force was found relatively small within all test cases. With the single axis measurements the CV values varied between 3.3 and 4.1% while the CV values in the dual axis measurement varied between 1.0 and 3.2%, which indicates the dual axis method to be slightly more accurate. Exact quantitative estimation of the effect of the measurement setup itself on the variation is however difficult. It is not possible to know how large the actual peak contraction force variation is in the 60 s measurements. It should be emphasised that also other variation sources exist for the differences between the cardiac tissue samples, for example different peak contraction force capability of different tissue constructs. Despite the fact that all the measured cell populations originated from the same cell batches and were cultured with the same procedure, the size, location and orientation of the contracting tissue differ between populations. The recorded peak forces were higher in the dual axis measurements compared to the single axis measurements. This may be partially explained by the difference in the measurement days since the single axis measurements were performed on day 9 while the dual axis measurements were performed on days 10 and 14. In addition, the location and orientation of the cantilever tip attached to the cardiac tissue construct is likely to have an effect on the measurement results, especially in the case of the single axis measurements. The main contraction component of the construct is not necessarily aligned to the cantilever sensing orientation. And even if it does, more uncertainty may be induced by non-linear contraction trajectory. In this work we have shown that with the proposed dual axis force measurement concept the tip displacement trajectory has a circular shape and thus the movement and force caused by cell contraction is not in just one direction. The dual axis probe tip displacement trajectory curve presented in this paper appears to have two different sized circles or ellipses. Moreover, the mechanical properties of the measurement probes may influence the results, especially the spring constant of the measurement probe which was approximately 1 N/m in the single axis cantilever probe compared to the dual axis probe having spring constant of approximately 5 or 9 N/m, depending on the orientation. Too small spring constant may have caused the single axis measurement to be more of a displacement measurement than a force measurement if the cardiac tissue construct is not able to move with large enough amplitude.
13

During one cardiac cycle, cardiomyocyte contraction and relaxation occur once. In the dual axis force measurements, the force curve appears to have two after-peaks. The after-peaks may result from contraction and relaxation of cardiac tissue that is not immediately at the cantilever contact site from which the predominant peak originates. The contraction of the cardiac tissue may be conveyed along the tissue to the cantilever contact site where it causes the measured after-peaks. The measured contraction forces ranging 3.4 - 6.7 µN for the single axis measurements and 9.4 - 10.6 µN for the dual axis measurements fit to the wide range of contraction forces obtained from hiPSC-derived cardiomyocytes using various methods. Rodriguez et al. measured contraction force of approximately 15 nN from single cardiomyocytes using a micropost array (Rodriguez et al. 2014), Mannhardt et al. obtained contraction forces of 152 µN from their strip format engineered heart tissues (Mannhardt et al. 2016), and Sasaki et al. measured contraction forces of approximately 1 mN from their cardiomyocyte sheets (Sasaki et al. 2018). Possible factors affecting the different contraction force include e.g. amount of measured cardiomyocytes, maturity of the cells and cell orientation (Sasaki et al. 2018).
Conclusion Here, we have demonstrated a dual axis force measurement sensor which is capable of direct contraction force measurement from human cell based cardiac tissue constructs in the range of 1 - 10 µN. The sensor element is composed of a metallic cantilever probe connected to two piezoelectric force sensor elements. This approach allows observation of the force generation direction and the displacement of a particular point in the construct in xy- plane. The measurement results are critically analysed and compared with the results obtained with a previously developed single axis force sensor. The force measurements were performed on cardiac tissue constructs composed of a vascular-like network and induced pluripotent stem cell derived cardiomyocytes. The detachment of the cardiac tissue constructs form the culture substrate enabled less restricted contraction in the force measurements. The proposed technique allows an accurate analysis of the behaviour of human cardiac tissue construct for example under drug exposure and can be utilized in more accurate medicine development in comparison to conventional methods.
References Balaban, N. Q., Schwarz, U. S., Riveline, D., Goichberg, P., Tzur, G., Sabanay, I., ... & Geiger, B. (2001). Force and
focal adhesion assembly: a close relationship studied using elastic micropatterned substrates. Nature cell biology, 3(5), 466.
Cogollo, J. F. S., Tedesco, M., Martinoia, S., & Raiteri, R. (2011). A new integrated system combining atomic force microscopy and micro-electrode array for measuring the mechanical properties of living cardiac myocytes. Biomedical microdevices, 13(4), 613-621.
Huttala, O., Vuorenpää, H., Toimela, T., Uotila, J., Kuokkanen, H., Ylikomi, T., ... & Heinonen, T. (2015). Human vascular model with defined stimulation medium-a characterization study.
Kim, D. S., Jeong, Y. J., Lee, B. K., Shanmugasundaram, A., & Lee, D. W. (2017). Piezoresistive sensor-integrated PDMS cantilever: A new class of device for measuring the drug-induced changes in the mechanical activity of cardiomyocytes. Sensors and Actuators B: Chemical, 240, 566-572.
Lasser, K. E., Allen, P. D., Woolhandler, S. J., Himmelstein, D. U., Wolfe, S. M., & Bor, D. H. (2002). Timing of new black box warnings and withdrawals for prescription medications. Jama, 287(17), 2215-2220.
Li, X., Zhang, R., Zhao, B., Lossin, C., & Cao, Z. (2016). Cardiotoxicity screening: a review of rapid-throughput in vitro approaches. Archives of toxicology, 90(8), 1803-1816.
Linder, P., et al. "Contractile tension and beating rates of self-exciting monolayers and 3D-tissue constructs of neonatal rat cardiomyocytes." Medical & biological engineering & computing 48.1 (2010): 59.
Mannhardt, I., Breckwoldt, K., Letuffe-Brenière, D., Schaaf, S., Schulz, H., Neuber, C., ... & Klampe, B. (2016). Human engineered heart tissue: analysis of contractile force. Stem cell reports, 7(1), 29-42.
14

Mathur, A. B., Collinsworth, A. M., Reichert, W. M., Kraus, W. E., & Truskey, G. A. (2001). Endothelial, cardiac muscle and skeletal muscle exhibit different viscous and elastic properties as determined by atomic force microscopy. Journal of biomechanics, 34(12), 1545-1553.
Myachina, T., et al. "An Approach for Improvement of Carbon Fiber Technique to Study Cardiac Cell Contractility." IOP Conference Series: Materials Science and Engineering. Vol. 350. No. 1. IOP Publishing, 2018.
Olson, H., Betton, G., Robinson, D., Thomas, K., Monro, A., Kolaja, G., ... & Dorato, M. (2000). Concordance of the toxicity of pharmaceuticals in humans and in animals. Regulatory Toxicology and Pharmacology, 32(1), 56-67.
Rodriguez, M. L., Graham, B. T., Pabon, L. M., Han, S. J., Murry, C. E., & Sniadecki, N. J. (2014). Measuring the contractile forces of human induced pluripotent stem cell-derived cardiomyocytes with arrays of microposts. Journal of biomechanical engineering, 136(5).
Sasaki, D., Matsuura, K., Seta, H., Haraguchi, Y., Okano, T., & Shimizu, T. (2018). Contractile force measurement of human induced pluripotent stem cell-derived cardiac cell sheet-tissue. PloS one, 13(5).
Sugiura, Seiryo, et al. "Carbon fiber technique for the investigation of single-cell mechanics in intact cardiac myocytes." Nature protocols 1.3 (2006): 1453.
Toimela, T., Huttala, O., Sabell, E., Mannerström, M., Sarkanen, J. R., Ylikomi, T., & Heinonen, T. (2017). Intra-laboratory validated human cell-based in vitro vasculogenesis/angiogenesis test with serum-free medium. Reproductive Toxicology, 70, 116-125.
Virtanen, J., Pammo, A., Vehkaoja, A., & Tuukkanen, S. (2019). Piezoelectric dual axis cantilever force measurement probe. IEEE Sensors Journal.
Virtanen, J., Sariola, V., & Tuukkanen, S. (2018, August). Piezoelectric cantilever force sensor sensitivity measurements. In Journal of Physics: Conference Series (Vol. 1065, No. 4, p. 042005). IOP Publishing.
Virtanen, J., Somppi, S., Törnqvist, H., Jeyhani, V., Fiedler, P., Gizatdinova, Y., ... & Tuukkanen, S. (2018). Evaluation of dry electrodes in canine heart rate monitoring. Sensors, 18(6), 1757.
Virtanen, J., Toivanen, M., Toimela, T., Heinonen, T., & Tuukkanen, S. (2020). Direct measurement of contraction force in human cardiac tissue model using piezoelectric cantilever sensor technique. Current Applied Physics, 20(1), 155-160.
Vuorenpää, H., Ikonen, L., Kujala, K., Huttala, O., Sarkanen, J. R., Ylikomi, T., ... & Heinonen, T. (2014). Novel in vitro cardiovascular constructs composed of vascular-like networks and cardiomyocytes. In Vitro Cellular & Developmental Biology-Animal, 50(4), 275-286.
Vuorenpää, H., Penttinen, K., Heinonen, T., Pekkanen-Mattila, M., Sarkanen, J. R., Ylikomi, T., & Aalto-Setälä, K. (2017). Maturation of human pluripotent stem cell derived cardiomyocytes is improved in cardiovascular construct. Cytotechnology, 69(5), 785-800.
Vyas, V., Nagarajan, N., Zorlutuna, P., & Huey, B. D. (2017). Nanostethoscopy: atomic force microscopy probe contact force versus measured amplitude of cardiomyocytic contractions. Journal of Bionanoscience, 11(4), 319-322.
15