Embed Size (px)
Citation preview

DIRECT ASSESSMENT OF CONSUMER UTILITY FUNCTIONS:von Neumann-Morgenstern Utility Theory
Applied to Marketing
by
John R. Hauser
Working Paper 843-76
and Glen L. Urban
Revised January 1977
* Assistant Professor of Marketing and TransportationGraduate School of Management, Northwestern University
** Professor of Management ScienceSloan School of Management, M.I.T.

ABSTRACT
The design of successful products and services requires an understandingof how consumers combine perceptions of product attributes into preferencesamong products. This paper briefly reviews the existing methods of expectancyvliue, preference regression, conjoint analysis, and logit models with respectto underlying theory, functional form, level of aggregation, stimuli presentedto consumers, measures taken, estimation method, and specific strengths foruse in marketing. Building on this comparison von Neumman-Morgenstern theoryis presented for directly assessing consumer preferences. This method, new tomarketing, has the advantage of axiomatic specification of functional formenabling it to explicitly identify and incorporate risk phenomena, attributeinteractions, and other non-linearities. Preferences are measured on anindividual level with "indifference" questions. Its disadvantage is thenmeaurement task to which consumers are asked to respond.
This paper summarizes representative results of von Neumann-Morgensterntheory applicable to marketing and discusses measurement and estimation ofthe resulting consumer preference functions. Its advantages and disadvantagesfor use in marketing are carefully discussed and application situations areidentified where it is a promising method. A specific empirical example ispresented for the design of a new service. New empirical results are thengiven comparing von Neumann-Morgenstern theory to the selected existingtechniques of least squares and monotonic preference regression, logitanalysis, and a null model of unit weights.

1.
Since consumer preference is critical to the success of products and
services, considerable research has been applied to the task of determining how
consumers combine perceptions of product attributes into preference. Early
work was directed at applying psychological concepts developed by Fishbein [5].
In many of these applications a linear additive function of directly stated
"importances" of product attributes and ratings of product attributes were used to
predict a preference measure (Wilkie and Pessemier [28]). In contrast, Carroll
[61 used regression to fit a utility function to stated preference by specifying
the location of an "ideal point " based on the assumption of a utility function
form. Work in conjoint analysis used monotonic analysis of variance to estimate
"importances" based on stated rank order preferences with respect to various
prespecified product attributes (Green and Wind [11]). Stochastic modeling of
observed choice with the logit form also has been used to estimate the impor-
tances of attributes (McFadden [20, 21]).
Another technique that is directed at the problem of assessing utility
functions is von Neumann-Morgenstern utility theory [27]. Although this
technique has been applied to many prescriptive decision situations (Keeney,
1973 [16]), it has only recently been proposed for application to marketing
(Hauser and Urban [13]).The purposes of this paper are to (1) develop a
comparative structure to position von Neumann-Morgenstern relative to existing
methods, (2) present some new comparative empirical experience, and (3) assess
the usefulness of von Neumann-Morgenstern utility theory in marketing.
EXISTING TECHNIQUES
In order to assess the relevance of von Neumann-Morgenstern utility theory
in marketing, it is necessary to compare utility theory to the preference measure-
ment techniques now used in marketing. These techniques are quite varied but
can be effectively summarized with respect to the dimensions of theoretical
base, assumed form of the preference function, level of aggregation, measurement
III

2.
requirements, and estimation methods. See Table One.
TABLE ONE
COMPARISON OF TECHNIQUES OF DETERMINING CONSUMER PREFERENCES
IT
JUNDERLYINGI THEORY
IFUNCTIONALIFORM
LEVEL OFAG(. !'-GATION
STIMULI PRE-SENTED TO
:RESPONDENT
MEASURESTAKEN
ESTIMATIONMETHOD
EXPECTANCYVALUES
PSYCHOLOGY
LINEAR
INDIVIDUAL
ATTRIBUTESCALES
ATTRIBUTEIMPORTANCES
DIRECTCONSUMERINPUT
PREFERENCEREGRESSION
STATISTICS
LINEAR ANDNON-LINEAR
GROUP
ACTUAL AL-TERNATIVESOR CONCEPTS
ATTRIBUTERATINGS ANDPREFERENCE
REGRESSION
CONJOINTANALYSIS
MATHEMATICALPSYCHOLOGY
ADDITIVE
INDIVIDUAL
PROFILESOFATTRIBUTES
RANK ORDERPREFERENCE
MONOTONICANALYSIS OFVARIANCE
LOGITMODEL
STOCHASTICCHOICE
LINEAR INPARAMETERS
GROUP
OBSERVEDACTUALALTERNA-TIVES
OBSERVEDBEHAVIOR
MAXIMUMLIKLIHOOD
UTILITYTHEORY
AXIOMS,THEOREMS
RISK AVER-SIONNON-LINEARINTERACTIONS
INDIVIDUAL
PROFILESOFATTRIBUTES
LOTTERIESANDTRADEOFFS
DIRECTCALCULATION
Expectancy Value Models
Several multiattribute models have been proposed based on psychological
theories of attitude formation (Fishbein [8], Rosenburg [241). Although not
equivalent, the models are conceptually similar in that they define an attitude
towards an object as a linear additive function of an individual's reactions
to an object on an attribute scale multiplied by a measure of the effect of
I I
-___________.._,___ --------

3.
that attribute in the overall attitude formation.
These models have received considerable attention and have been subject
to various extensions (Wilke and Pessemier [28] and Ryan and Bonfield [25]).
For purposes of discussion we will adopt Wilkie and Pessemier's multi-attribute
de.. 3d formulation:
(1) i ijk ijk
where: x = individual i's belief as to the extent to which anijk attribute k is offered by choice alternative j
ik = "importance" weight specified by individual i forattribute k
Pi = predicted attitude of individual i for choicealternative j
Although methods of measurement vary, specific individual estimates of ik
and xij k are obtained from consumers. The predicted attitude PiJ is correlated
to a measure of the overall attitude to access validity. This overall measure
usually is preference for the choice alternative.
The model has been used by a number of market researchers. One of the
more successful applications is reported by Bass and Talarzyk [2]. They pre-
dict rank order preference for frequently purchased consumer goods based on
rank ordering of the importances of each scale and belief ratings of 1 to 6 on
pre-defined attribute scales. Correct first preference prediction occurred in
65 to 75% of the cases over 6 product classes. This compared favorably to a
naive model which assigned all choices proportional to market share and produced
35-55% first preference prediction. Other researchers have experienced varying
success and a range of fits has been reported. Bass and Wilkie [3] report cor-
relations of actual and predicted preference from .5 to .7 while Ryan and Bonfield
[25] report correlations as high as .7 and .8 for an extended version of Fishbein's
model.
The advantages of these models are the relatively simple consumer measurement
III

4.
task and the idiosyncratic measurement which allows for individual differences
in the importance parameters. A disadvantage is that the model is quite sensitive
to the consumer's ability to directly supply an accurate importance parameter.
Furthermore, the arbitrary linear functional form does not allow non-linear
efec s to be modeled and requires a complete and independent set of attributes.
Preference Regression
Statistical procedures have been used to recover importances (Carroll [6],
Urban [26], Beckwith and Lehmann [4]). In these approaches a measured preference
value is used as a dependent variable and attribute ratings are treated as inde-
pendent variables. This is in contrast to expectancy value models where impor-
tances are directly stated by consumers. Regression is used to fit an importance
parameter for the case of a linear additive function. The regression approach
allows non-linearity and interactions in the functional form. For example, in
Carroll and Chang's model,linear, quadratic, and quadratic with pairwise inter-
action forms are available. Carroll and Chang's and Beckwith and Lehmann's
procedures are idiosyncratic while Urban regresses across choice alternatives
and individuals.
Consumers provide attribute ratings and preference values (rank order or
constant sum) for existing brands or for concept descriptions of new brands. If
rank order preference is provided, monotonic regression is used to estimate the
parameters. If constant sum preference data is collected, standard regression
procedures may be followed.
Although the regression approach can be used to specify individual para-
meters, the measurement requirements indicated above in most applications realis-
tically limit the number of observations per individual to less than ten.
Therefore, the degrees of freedom available usually indicate the need to estimate
across individuals in a group. For comparability among individuals, ratings
should be standardized or normalized (Bass and Wilkie [3]). In these cases

5.
care must be taken to assure that the individuals included in the group are
homogeneous with respect to their underlying utility parameters. Clustering
and segmentation methods are available to carry out this task (Hauser and
Urban [13]).
In the linear case, the model is similar to equation (1) except that
lik becomes k' where k is the importance for attribute k in the group.
(2) P.(2) Pij ik Xijk + ij
Pij is the observed preference of real or simulated product j for individual i,
and x.jk are the perceptual attribute levels. In most cases xj k represents
a reduced space set of co-ordinates of the attributes obtained from factor
analysis or non-metric scaling of the perception data consisting of attribute
ratings or similarly judgements, respectively. ij is the error term.
This model has not been as widely used as the expectancy value model, but
has undergone considerable testing (Green and Rao [10], Urban [26]). Srinivasan
and Shocker [23] have developed an alternative fitting procedure utilizing
linear programming to minimize the errors in predicting pairwise preference
rank orders by a linear function of attributes.
The advantage of preference fitting methods is that the estimation provides
a direct link from preference to the importance weights. It allows flexibility
in functional form and uses generally available computer programs. Its
disadvantages are that in the individual case degrees of freedom are limited
and in the group case,importance weights must be estimated across consumers
with estimation techniques that require prior grouping for homogeneity.
Conjoint Analysis
Conjoint analysis draws upon work of mathematical psychologists such as
Krantz, Luce, Suppes, and Tversky [19]. Green and Wind [ll and Johnson 14]1
and other market researchers have taken a special case of this theory and
applied it to estimating consumer preference functions.
11

6.
The conjoint analysis model considers observed rank order preference as a
function of a set of prespecified independent variables. In the additive case:
(3a) Pij = Ik,k Z ikQ Xjk Eij
where X is the value individual i places on having the kth attribute at the
£ level and Xjkk is a (0, 1) variable which indicates whether stimulus j
has the kth attribute at the th level, and i.. is the error term. The function
is idiosyncratic. Sufficient degrees of freedom are obtained at the individual
level by presenting the consumer with many (n 30) stimuli. Each stimulus is
a statement of a factorial combination or profile of the attributes (x jk).
These may be presented on cards with one profile per card. The consumer's
task is to rank order the cards with respect to his or her preference. In most
analyses the number of attributes is large (6 to 10) and the consumer is presented
with a fractional factorial design. In practice, this limits the utility
function to the additive case even though in theory the conjoint model could
be more complex (Krantz, Luce, Seppes, Tversky [19]). The importance weights
are estimated by monotonic analysis of variance techniques.
Conjoint measurement has been used by Green and Wind [11] for brand choice
for frequently purchased goods and for flight transportation carriers, and by
Johnson [14] for automobile and "hard goods" brand choice. Reported fits are
quite good. Johnson reports a first preference recovery of 45%.
One strength of conjoint measurement is that it is based upon measurement
axioms which allow estimation of the preference function based on observing
certain preference judgements. Furthermore, it is idiosyncratic, which allows
for individual differences in the preference functions. One primary disadvantage
is that the measurement task is based on rankings of hypothetical attribute
profiles. This means attributes of the product must be pre-specified. While
this provides an advantage in that more nstrumental variables can be defined,
the issues of perception are not investigated as they are in the preference
�1______^__1��^_1·____�__·11_·11__^_____ _... �^.-�------�-��-

7.
regression approach where reduced space attribute ratings are processed as
independent variables. In the usual measurement scheme the model is assumed
to be linear or additive. This may be an oversimplification of the choice
Drocess and places a large burden on the researcher to pre-specify a linearly
independent and complete set of attributes.
Logit Models
Theoretical work on stochastic choice as represented in the Logit model
can be applied to marketing (Ashton [1]). This random utility model (McFadden [20,
21]) predicts choice probabilities by observing perceptions of all relevant
choice alternatives and estimating underlying preference functions to best
predict choice. The multinomial logit model posits choice as a result of
maximizing preference where preference is a combination of an observable part
and a random part. Under specific assumptions (McFadden [20]) this yields:
(4) Lij = exp (Pij) / I exp (P )iJ n in
where L.. is the probability that individual i chooses alternative j. In
practice, the preference is assumed to be a linear function of attributes of
each alternative:
(5) Pij k Xijk
where k are the importance weights for attribute k and xij k are the observed
attributes for individual i and stimulus j on attribute k. In this
model, choice (0, 1) and the attribute levels are directly observed
.nd importances (k) are estimated to meet the maximum likelihood conditions.
To achieve sufficient degrees of freedom, researchers have assumed that the
same parameters apply for all consumers. Therefore homogeneity within the
group must be assured by segmentation analysis or assumed to be true. Although
III

8.
preference is linear in the attributes (eq. 5), note that the probability of
choice itself is non-linear in the attributes (eq. 4).
Multinominal logit models have been most extensively used in transportation
modeling (Ben-Akiva [5]). In marketing, Silk and Urban [22] report good fits
cf the multinomial logit model for observed store choice of consumer brands as
a function of constant sum preference for brands.
The primary advantages of random utility models is the axiomatic specifica-
tion of choice probabilities. This allows calibration of "revealed preference"
by observing choice behavior and observed attribute values. This is also a
potential disadvantage because other market forces such as distribution and
promotion affect choice and often these effects on consumer preference cannot be
separated without direct measurement of stated preference. Other disadvantages
are that the importance weights are not idiosycratic and the preference function
usually is restricted to be linear.
Discussion and Evaluation
Each of the existing techniques produce estimates of importances of
attributes, but their methods are quite diverse in their theoretical bases,
functional forms, level of aggregation, measurement, and estimation (see Table 1).
Each has its strengths, its weaknesses, and particular applications where it
is the best possible technique.
Expectancy value is useful for exploratory or diagnostic work because the
respondent's task is simple and can be applied with a large number of attributes.
In addition, the specific measurement allows for individual variations in con-
sumers and for possible segmentation. However, an arbitrary linear functional
form is assumed and prior specification of the attributes must be made.
Preference regression circumvents the questions of direct specification
of importance weights by statistically estimating the importance weights based

9.
n stated preference. This estimation, combined with perceptual reduction of
the product's attribute space, allows the issues of psychological positioning
to be effectively addressed (Urban [26.]). But individual importances are
sacrificed. Thus prior segmentation on homogeneity of preference parameters is
required. The functional form could be linear or non-linear, but usually the
linear form s chosen. Thus effects such as decreasing returns, risk aversion,
iml attribute interaction are not modeled.
Conjoint analysis allows consideration of a pre-specified set of attributes
so in:;crumental variables such as price, package, and brand name can be defined.
This makes conjoint analysis a useful tool for physical design of products.
The mportances help define a best combination of product attributes. However,
conjoint measurment requires relatively extensive measurement -- individual's
ranking of many abstract alternatives. Careful prior measurement is required
to assure that the attributes adequately describe choice alternatives, are
independent, and are relatively small in number. Eight to ten attributes are
usually the limit since the number of abstract alternatives grows exponentially
in the number of attributes.
Logit models are based on observed choices rather than stated preference
so they provide an alternative view of attribute importances for marketing
decisions. This is particularly useful if resources are not available for more
extensive measurement. The Logit technique requires the functional form of
the preference functions and attributes to be specified prior to estimation.
?plications have tended to use linear function (Ben-Akiva [51).
As outlined above, each existing technique can be extremely powerful when
used in the proper context, but there are opportunities for improvement. None
of the existing techniques specify what mathematical forms should be used for the
preference function. No existing marketing technique explicitly measures
risk aversion or non-linear interactions and tradeoffs. Stated importances,
III

10.
observed behavior, and rank order preference are all used to measure preference
parameters,but no existing model has used "indifference" judgments as a measure-
ment method to uncover preference parameters. This gap can be filled with a
method new to marketing -- von Neumann-Morgenstern utility theory. This theory
is ax-r4atically based, specifies functional forms, and explicitly measures
r sk aversion and non-linear interactions. Individually specified preference
Iar:'rrters are directly calculated from "indifference" questions based on
lotteries and tradeoffs with respect to attribute levels (Review Table 1).
We will describe the underlying theory, give an example of a functional
foria, discuss measurement issues, critically evaluate the theory in marketing
terms, and present a comparative empirical example of measuring consumer pref-
erences for health care delivery systems.
A VON NEUMANN-MORGENSTERN BASED METHODOLOGY FOR DESCRIBING PREFERENCES
Underlying Theory
The theory is based on a set of axioms and theorems (von Neumann and
Morgenstern [27]) which deal with rational decision making (choice) under un-
certainty. Although the original axioms were for prescriptive choice in games,
equivalent axioms (Friedman and Savage [9]) argue for descriptive choice and
expanded axioms (Hauser [12]) develop an isomorphic theory for probabil-
istic choice. The axioms give testable behavioral conditions and the theorems
(existance and uniqueness) allow us to directly calculate parameters when a
functional form is known to be appropriate. Later theorems (reviewed by
Fraquiar [7] and Keeney and Raiffa [17]) based on independence conditions
specify when various functions are appropriate. This theory is complementary
to conjoint theory which examines when certain forms are measurable, and
stochastic choice theory (e.g. logit) which examines how preference once
measured predicts actual choice.

11.
Fuictional Form
As detailed in the references, utility functional forms are quite varied;
many omplex properties can be identified and appropriate functions derived.
We found one particular form, Keeney's [15] quasi-additive model, quite usable
for marketing applications. Keeney shows that under "utility independence"
(defined in the next section) the von Neumann-Morgenstern axioms lead to a
preference function which must be in a form equivalent to the following special
po yomial:
(6) C(xl, x2,.. .ix) Ak uk (xk) + k,U k(xk) u(xz)k k Z>k
+. 1,2,3,..K u1(x1) u2 (x2)...uk(xk)
where C(-) = preference function of attributes x1 to xk
uk(xk) = utility of attribute k at level xk
Ak = importance coefficient for attribute k
kA i' A Q m 1,2,3 K = importance coefficient for interactions ofattributes k and , of attributes k, and m,etc. up to interaction of all attributes.
The utility of an attribute, uk(xk), is a non-linear function of the attribute
level xk. These non-linear functions can also be derived from basic assumptions.
For example, if risk aversion with respect to xk does not depend upon the amount
of Xk already guaranteed, then the "constantly risk averse" form is the only
possible form. I.e.,
(7) Uk(xk) = a+b exp(-r Xk), where r is the risk aversion
coefficient (r > 0 risk averse, r < 0 risk seeking, r . 0 risk neutral).
The utility theoretic equations in 6 and 7 are idiosyncratic so each
individual is modeled separately. The utility theory forms allow non-linear
and interaction effects of attributes in the modeling of choice. One real
III

12.
advantage of the utility function is that the risk aversion coefficient
allows explicit measurement and inclusion of risk phenomena.
Consumer Measurement
Tradeoffs are measured by presenting consumers with two hypothetical
products in which one attribute level of one of the products is left unspecified.
TI} consumer's task is to select the attribute level such that he or she would
be indifferent between the two products. For example, in Figure 1 the consumer
must select the level of price that will make him or her indifferent between
health plan A and health plan B. Although the task is simple in concept, in
practice we found that great care must be taken in teaching the task to the
consumer and checking that he or she understands the task.
Plan A Plan B
Waiting time 20 minutes Waiting time 30 minutesPrice $10 Price
Figure 1: Schematic of Trade-Off Question
If the consumer's answer to this question is the same with other variables
such as quality at a "high" level in both plan A and B as with quality at a
"low" level in both plan A and B, "preferential independence" is said to be
satisfied.
In order to fully parameterize equation 6, risk phenomena must be
explicitly measured by presenting consumers with lotteries. This task is
simple in concept, but difficult in practice. We explain here the concept.
The stimulus is a game in which the respondent determines when he would be in-
different between a certain outcome and a gamble based on two uncertain events.
For example, Figure 2 is a schematic of a lottery given-to a consumer for a
choice of medical services. He or she must consider joining a health plan in
which the waiting time to see a doctor is in question. In plan 1 the waiting

13.
time is known to be 20 minutes. In plan 2 the time will be either 10 minutes
ur 60 minutes, but it is not certain which will occur. The task is to set
the probability so that the respondent is indifferent between the certain
event and the lottery. For example, at p = .999 he or she will prefer plan 2
and at p = .001 he or she will prefer plan 1. The consumer's task is to con-
tinually narrow the range until he or she neither prefers plan 1 nor plan 2.
In practice we use visual props (similar to carnival wheels) and warm-up
lotteries to make the task understandable to the average consumer. Furthermore,
we have found better consumer reaction to the task of selecting probabilities rather
than to the usual task of selecting psychological attribute levels for 50-50
lotteries (Keeney and Raiffa [17]).
Plan 2waiting time
Plan 1 10 minuteswaiting time20 minutes
Plan 2waiting time60 minutes
Figure 2: Schematic of Risk Aversion Question
By considering this lottery we can now define the conditions necessary for
utility independence that were required in deriving equation (6). If the lottery
was asked assuming that all other attributes (e.g., quality, price) were at
"high" levels, utility independence would exist if the indifference probability
did not change when all other attributes were changed to be at "low" levels.
14.
: timati .n
Ti utility theory the axiomatic structure allows the parameters to be
direct1v calculated. In the constantly risk averse form one lottery is con-
Ilictod for each attribute to calculate the risk aversion coefficient (see equa-
-ii 7). Tradeoff and other lottery questions are asked until the number of
parameters equal the number of observations. Additional observations may be
tak2n co test assumptions such as utility independence (i.e., an additional
lottery for each attribute) or to assure consistency by repeated measures.
Representative calculations are shown in Keeney and Raiffa [17].
Utility theory is substantially different from previous methods for esti-
mating importances (see Table 1) and it shows promise if it can be effectively
adapted to marketing.
USE IN MARKETING
Utility theory has many attractive features, but has not been applied to
marketing problems. In marketing we want to describe the consumer choice process
so that we can design a product or service which the market will view as attrac-
tive and buy. Alternatively we may wish to influence choice by changing the
consumer's utility function. For example, a possible marketing strategy for a
public transit authority might be to increase the perceived importance of costs
of driving autos to encourage use of mass transit. This is a different problem
than the usual utility theory application to a situation characterized by one
decision maker or a small group of decision makers. In these applications
,utility theory helps the decision maker rationally evaluate the alternatives
and quantitatively incorporate any uncertainty he has about the outcome of any
decision. Although these applications emphasize prescription (Keeney [16]) ,
they must reasonably describe a rational process. Since marketing models
require high levels of descriptive adequacy, applications must check the
��-�-�^-`�s�ll�"----��--�-- -
15.
underlying behavioral assumptions, and predictive ability of utility theory
(see next section for empirical example).
In applying utility theory to marketing, several issues are important and
require modification to usual utility theoretic approaches. First, marketing
reflects many diverse decision makers with varying preferences. It is necessary
A measure preferences for a sufficiently large sample of the population to
insure that the distribution of preferences is correctly characterized. Thus
the measurement must be administered by a standardized personal interview and
aggregate market representations developed to summarize information for managers.
Furthermore, in marketing the attribute measures are often psychological
rather than physical. In prescriptive utility theory the performance measures
are usually quantifiable (e.g. tons of hydrocarbons released into the air). In
consumer choice, hard to quantify psychological measures, (e.g., "quality" of
a health care plan) become important. In decision making, a manager may learn
to think of quality in health care as the number of MD's available, but will
the consumer? It is imperative in marketing to measure, characterize, and quantify
how consumers actually perceive the alternative products or services. Thus
psychometric techniques must be used prior to utility assessment to identify a
complete set of performance measures which include both psychological and
physical measures. The use of psychological attributes with the utility lotteries
and tradeoffs increases the burden and cost of measurement. When an individual
manager's career may rest on the outcome of a major decision, he will make
available the necessary time (e.g., 4-8 hours) to have his utility function
assessed. But will the consumer? Usually one hour would be the maximum time
for a market research interview. In a short 45-60 minute interview the consumer
must be motivated and educated to the lottery and tradeoff questions necessary
for assessment and respond to the assessment and verification questions.
Furthermore, the tasks cannot be too onerous or too complex, but must involve
the consumer so that he gives thoughtful answers which reflect reality. The
11

16.
cost of measurement will be substantial since a reasonable sample (e.g., n > 100)
must be taken to represent the diversity of consumers and allow an estimate of
market response.
Even with an adequate sample and a carefully refined measurement instrument,
response errors can be expected. There may be errors in measurement of per-
ception, understanding the tasks, mathematical model specification, neglecting
important effects, or random fluctuations in preferences. Thus the parameters
we obtain are only estimates of the true parameters. Ideally redundant questions
should be asked, but the measurement cost and time constraints may preclude this.
Each of these issues of diverse consumers, psychological performance
measures, measurement burden, and measurement error are non-trivial issues in
applying von Neumann-Morgenstern theory to marketing. We will present how we
addressed these issues in a particular problem of health service marketing. We
feel that this example highlights the issues and suggests a set of possible
solutions. Hopefully this example will facilitate discussion and encourage
researchers to develop more and better techniques to address these issues in
applying von Neumann-Morgenstern theory.
DIRECT EMPIRICAL ASSESSMENT OF VON NEUMANN-MORGENSTERN PREFERENCE FOR HEALTH
CARE DELIVERY SYSTEMS
Health Maintenance Organizations (HMO) have been proposed as a method of
reducing costs and increasing availability and quality of health services. Although
some HMO's have been successful, a major problem is gaining sufficient enrollment.
MIT was developing an HMO and provided the managerial setting. This marketing
problem was addressed as a product design and communication problem. We will
discuss how utility theory was applied in this case and provide empirical com-
parisons to alternative methods of estimating the importance of attributes.
,.� � ��s�·-------

17.
This discussion is restricted to student response. A managerial description
of the ease, the development of the psychological performance measures, and
initial preference modeling (including faculty and staff by standard marketing
methods) are detailed in Hauser and Urban [13].
Data was obtained by one hour interviews with a randomly selected sample
of eighty MIT students. The survey included measures of general health attitudes
and practices and specific questions to assess utility functions.
The first task was to identify the attribute or performance measures. Group
discussions with students clearly indicated the high degree of psychological
involvement. For example, concern was expressed about the level of trust in
the doctors, the red tape and "hassle" at the clinic, the friendliness of
personnel, and the personalness of care. As a result of these discussions 16
attitude scales were developed. In a preliminary student questionnaire, students
rated their existing health care and 3 concepts (MIT HMO, Harvard Community
Health Plan, and Massachusetts Health Foundation) with respect to these
statements by recording their level of agreement or disagreement on a 5 point
scale. Factor analysis of this data led to the definition of the four under-
lying psychological factors. These factors explained 55% of variance in the
data. The raw scales and the factor that they were most highly correlated
with are shown in Appendix I. The factors were named "quality", "personalness",
"value" (benefit vs. price), and "convenience". These four underlying factors
were used as attribute or performance measures (xk) in the utility model and
the factor scores were used as attribute values for alternate models.
We began with warmup questions to train the respondents to the meaning
of the lotteries. Then each student answered five lottery and three tradeoff
questions (see Figure 1 and 2 for simplified prototypes). Utility and prefer-
ential independence assumptions were investigated by repeated administration
of the lottery and tradeoff questions. Rank order preferences were recorded
11

18.
for the three new HMO alternatives and the respondent's existing health
service. The questionnaire closed with demographic questions.
Results
Importance weights were obtained by estimation of a special form of the
quasi-additive function shown in equation 6 that is called the multiplicative
form-
K
(8) 1 + A C(X1, X2' xK) = (1 + AXk uk (Xk))k=l
where A is the interaction coefficient (A > 0 implies compli-mentality, A < 0 implies substitution, and A = 0 impliesno interaction (i.e., additive))
Xk = importance coefficients
Uk(xk) = utility of attribute xk (see equation 7).
Table Two shows the average normalized weights (k/ZAk) for the sample.
Quality has the highest coefficient followed by value and convenience,
with personalness having the lowest value. There was considerable individual
variation. The interquartile ranges were for: quality +12.5% to -18% of the
median, personalness +45% to -31%, value +14% to -29%, and convenience +17%
to -23% of the median. The risk aversion coefficients (r in equation 7) were
rank ordered similarly to the importance coefficients (r = .693 for
quality, r2 = .332 for personalness, r3 = .424 for value, and r4 = .310 for
convenience). This suggests the hypothesis that the more important a
performance measure is, the less willing a consumer is' to take a chance on
its level. The full interquartile interval for the interaction coefficient (A )
was between -.99 and -.93, indicating strong substitution between attributes
for most consumers.
�IU·�Lln��l� II�P_� �i�- �I�I^XII___

19.
TABLE TWO
IMPORTANCE ESTIMATES AND GOODNESS OF FIT
MIT STUDENTS
Normalized Importance Weights
QualityA
PersonalI
ValueA
Preference Recovery
ConvenienceA
1st-,kniT _
allrhni-4o.
Method "1 "2 "3 "4 . IV . t L .LC.
Utility Assessment
Raw Importance .30 .19 .26 .25 .50 .47Weights
Marginal Weights .31 .25 .25 .19
Preference Regression
Least Squares .32 .09 .38 .21 .47 .51
Monotonic .34 .08 .31 .27 .45 .45
Logit Analysis .34 .16 .34 .16 .43 .47
Unit Weights .25 .25 .25 .25 .40 .44
The utility independence assumption was tested by repeated administration
of the lottery questions at alternate levels of attributes. The utility inde-
pendence assumption held exactly for quality in 51% of the cases, personalness
39%, value 55%, and convenience 53% of the cases. Satisfaction of the assumption
was defined as within + 10 percentage point deviation in the probability on
repetition of the lottery. Quality met this utility independence condition in 66%
of the cases, personalness in 71%, convenience in 68%, and value in 70% of the
cases. Although this represents the first time utility independence has been
tested for a consumer population, these results seem reasonable. We might point
III

20.
out however, that expectancy value, preference regression, conjoint analysis,
and logit implicitly assume utility independence with their choice of
functional form.
The multiplicative form (equation 8) also requires pairwise preferential
independence. This was tested with similar success and in 60% of the cases
preferential independence assumptions were met exactly.
In order to test the "goodness" of the estimates we used the criterion
of correct recovery of the stated rank order preferences. Table Two reports
that when the attribute ratings are substituted in equation 8, the estimated
utility function correctly predicts first preference among the 3 new HMO and
1 existing care alternatives 50% of the time. The correct prediction of
1, 2, 3 and 4th choice occurs in 47% of the cases. This is the percentage of
occurrence of diagonal entries in the matrix of predicted and actual rank
order of the four alternatives. These fits are satisfactory for a first
attempt, but clearly indicate the existence of measurement errors in the
utility theory input.
The importance weights themselves do not reflect relative importances
because of non-linearity, risk aversion, and interactions. To get a richer
measure of attribute response, the total marginal response to each attribute
was determined by the gradient at the point of the utility function represented
by the attribute ratings of the student's first choice health plan. The dif-
ferences between the linear weights and the marginal weights at the first choice
plan are that personalness is given higher weight and convenience is given
lower weight.
The utility results were compared to importance estimates obtained by other
selected methods. Preference regression analysis was conducted by treating the
rank order preference for the four alternatives as the dependent variable and the
normalized factor scores reduced from the ratings of each plan as the independent
variables.
�_1_ �I1I ·�llp_ �_I�_�II__�___·_I__I_---� ��-

21.
T was assumed that the students represented a homogeneous group and regression was
done across health alternatives and individuals with a linear function of the four
attribute factors (see equation 2). Regression was done by least squares and
monotonic regression. In the least squares case the importance coefficients
rank ordered the factors in terms of importance as quality, value, convenience,
and personalness. The coefficients were similar to the average utility theory
coefficients and the fits were equally good with utility fitting first preference
better and the regression fitting overall choices better. The use of monotonic
regression did not improve the fits, but did estimate the importance of convenience
as slightly higher and value as slightly lower than least squares regression.
The logit model was applied to the data by treating first preference as
an observed choice (see equation 4). The linear importance coefficients were
similar to the regression values. The fits were not quite as good in terms of
first preference or overall choices as the regression.
In examining the alternative methods it appeared that the fits did not
vary substantially over the space of importance estimates. To test this further,
unit weights were assigned to the four underlying factors. These weights were not
as good in predicting choice. 40% correct first choice fit for equal weights
versus 50% for utility theory and 44% correct overall choices for equal weights
versus 51% for least squares regression. The equal weights model serves as a
null model and the adequacy of the fits indicate that care should be taken in
concluding that weights are not equal for these four factors of quality,
nersonalness, value, and convenience.
On the basis of preference recovery, utility theory performed about as well
as other methods. Another measure of goodness was calculated by examining the
root mean squares error (RMSE) between predicted and actual market share of the
four health care alternatives presented to the students. This is not as
III
22.
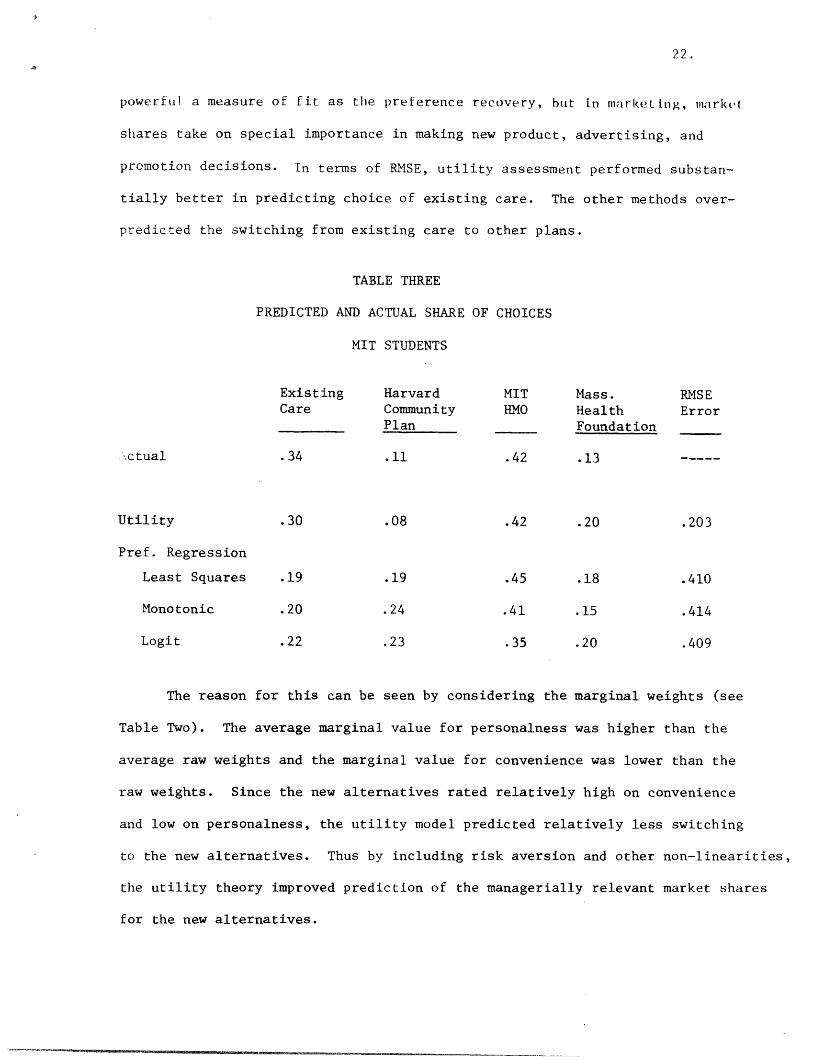
powerful a measure of fit as the preference recovery, but n marketing, markeXt_
shares take on special importance in making new product, advertising, and
promotion decisions. In terms of RMSE, utility assessment performed substan-
tially better in predicting choice of existing care. The other methods over-
predicted the switching from existing care to other plans.
TABLE THREE
PREDICTED AND ACTUAL SHARE OF CHOICES
MIT STUDENTS
Existing Harvard MIT Mass. RMSECare Community HMO Health Error
Plan Foundation
'ctual .34 .11 .42 .13
Utility .30 .08 .42 .20 .203
Pref. Regression
Least Squares .19 .19 .45 .18 .410
Monotonic .20 .24 .41 .15 .414
Logit .22 .23 .35 .20 .409
The reason for this can be seen by considering the marginal weights (see
Table Two). The average marginal value for personalness was higher than the
average raw weights and the marginal value for convenience was lower than the
raw weights. Since the new alternatives rated relatively high on convenience
and low on personalness, the utility model predicted relatively less switching
to the new alternatives. Thus by including risk aversion and other non-linearities,
the utility theory improved prediction of the managerially relevant market shares
for the new alternatives.
_ __^II___��_____�_

[II
23.
CONCLUSION
Utility theory was investigated for the potential benefits of utility
function specification, consideration of risk,and idiosyncratic estimation of
complex preference parameters. The data presented here indicates utility theory
is feasible for some consumer markets. Although the preference fits are not
uniformly superior for utility theory, they are equally good. The importance
of risk aversion is indicated by the superiority of utility theory in speci-
fying the share of choices for the existing service alternatives. This emphasizes
the value of more complex functions for combining attributes. The advantages
of utility theory were obtained at a substantial cost. The measurement
required a personal interview of 45 minutes and the execution of the difficult
lottery questions. In fact, in consumer groups characterized by low education
levels, it is doubtful that the lottery questions could be executed. We
conclude utility theory is a valuable tool for a marketing scientist to have
in his or her tool kit. It can be most effectively used if:
(1) risk aversion and interaction phenomena are deemed to be
important in the choice decision
(2) a sufficient budget is available to carry out extensive
personal interviews
(3) individual utility parameters are important to decisions, and
(4) consumers are well educated.
It would be particularly effective if the number of decision makers was small
and the purchase decision large . For example, purchase of large computers,
aircraft, automated machine tools or other industrial products would be situations
where extensive measurement could be done and risk aversion, non-linearities, and
interactions in attributes would be important in predicting choices.
24.
The appropriateness of utility theory in marketing could be improved through
further research. As cited earlier, utility theory methods directly calculate
parameters and do not explicitly acknowledge the concept of measurement error.including additional
Research is needed to allow degrees of freedom to be obtained by/lotteries and
tradeoffs in the estimation process. Maximum likelihood methods suggest themselves
as a likely candidate for processing this data. The costs of utility measurement
are high, but research might indicate more efficient methods for data collection.
For example, the findings reported here indicate that risk aversion correlates
with importance. If this is true it might be exploited so that only a subsample
would be required to answer the difficult lottery questions. If these research
tasks can be accomplished, utility theory will be more attractive and appropriate
for mass consumer markets. Our work indicates that in some situations utility
theory has advantages over other methods of assessing importances. It deserves
attention from marketing scientists.
������___
[c-. 1
References
1. Ashton, Winifred D., The Logit Transformation, Griffin Co., London, 1972.
2. Bass, Frank M. and W. Wayne Talarzk, "An Attitude Model for the Study of
Brand Preference," Journal of Marketing Research, 9, (February 1972),
pp. 93-96.
3. Bass, Frank M. and William L. Wilkie, "A Comparative Analysis of
Attitudinal Predictions of Brand Preference", Journal of Market-
ing Research, Vol. X (August 1973), pp. 262-9.
4. Beckwith, Neil E. and Donald R. Lehmann, "The Importance of Halo
Effects in Mutli-Attribute Attitude Models", Journal of Marketing
Research, Vol. XII (August 1975), pp. 265-75.
5. Ben-Akiva, M.E., Structure of Passenger Travel Demand Model, MIT, CivilEngineering, Ph.D. Thesis, 1973.
6. Carroll, J.D., "Individual Differences and Multidimensional Scaling," in
R.N. Shepard, A.K. Romney, and S. Nerlove, eds., Multidimensional
Scaling: Theory and Application in the Behavioral Sciences, Academic
Press, New York, 1972, pp. 105-157.
7. Farquhar, Peter, "A Survey of Multiattribute Utility Theory and Applications",
Management Science ,(forthcoming 1977).
8. Fishbein, M., "Attitudes and the Prediction of Behavior", in M. Fishbein,
ed., Readings in Attitude Theory and Measurement, John Wiley and
Sons, New York, 1967.
9. Friedman, M. and L.J. Savage, "The Expected-Utility Hypothesis and theMeasurability of Utility", Journal of Political Economy, Vol. 60,(1952), pp. 463-474.
10. Green, Paul E. and Vithala R. Rao, Applied Multidimensional Scaling, Holt,
Rinehart, and Winston, Inc.. Jew York, 1972, p. 125.
11. Green, Paul E. and Yoram Wind, Multiattribute Decisions in Marketing, The
Dryden Press, Hinesdale, Illinois, 1973.
12. Hauser, John R., "Consumer Preference Axioms: Behavioral Postulatesfor Describing and Predicting Stochastic Choice", Working Paper,
Dept. of Marketing, Northwestern University, Evanston, I., Nov.
1976 (submitted, Management Science).
13. Hauser, John R. and Glen L. Urban, "A Normative Methodology for Modeling
Consumer Response to Innovation", (forthcoming, Operations Research, 1977).
,I _ _ -_ II--.1 .. . ,. -I............., ,a
III

R-2
14. Johnson, Richard M., "Tradeoff Analysis of Consumer Values", Journal ofMarketing Research, Vol. II, (May 1974), pp. 121-127.
15. Keeney, Ralph L., "Multiplicative Utility Functions," Operations Research,Vol. 22, No. 1, Jan. 1974, pp. 22-33.
16. Keeney, Ralph L., "A Decision Analysis with Multiple Objectives: The MexicoCity Airport", Bell J. Economics and Marnl.,~ment Science, Vol. 4 (1973),pp. 101-117.
ii. Keeney, R.L. and H. Raiffa, Decision Analysis with Multiple ConflictingOjjectives, John Wiley and Sons, New York, 1976.
18. Koppelman, Frank, "Prediction of Travel Behavior With Disaggregate ChoiceModels", MIT CTS Report No. 75-7, Cambridge, MA, June 1975.
19. Krantz, David H., Duncan R. Luce, Patrick Suppes, and Amos Tversky,Foundations of Measurement. Academic Press, New York, 1971.
20. McFadden, D., "Conditional Logit Analysis of Qualitative Choice Behavior,"in Paul Zaremblea, ed., Frontiers in Econometrics, Academic Press,New York, 1970, pp. 105-142.
21. McFadden, D., "The Revealed Preferences of a Government Bureaucracy:Theory", The Bell Journal of Economics, Vol. 6, No. 2, Autumn 1975.
92. Silk, A.J. and G.L. Urban,"Pretest Market Evaluation of New Packaged Goods:A Model and Measurement Methodology," Working Paper, Alfred P. SloanSchool of Management, MIT, February 1976.
23. Srinivasan, V. and Allan Shocker, "Linear Programming Techniques forMultidimensional Analysis of Preferences," Psychometrica, Vol. 38,(September 1973), pp. 337-370.
24. Rosenberg, Milton J., "Cognitive Structure and Attitudinal Effect",Journal of Abnormal and Social Psychology, Vol. 53 (1956), pp. 367-72.
25. Ryan, Michael J. and E.H. Bonfield, "The Fishbein Extended Model andConsumer Behavior", Consumer Research, Vol. 2, No. 2 (Sept. 1975)pp. 118-136.
26. Urban, Glen L., "PERCEPTOR: A Model for Product Positioning," ManagementScience, VIII, (April 1975), pp. 858-71.
27. von Neumann, J. and O Morgenstern, The Theory of Games and EconomicBehavior, 2nd ed., Princeton University Press, Princeton, N.J.,1947.
28. Wilkie, William L. and Edgar A. Pessemier, "Issues in Marketings Use ofMulti-Attribute Attitude Models," Journal of Marketing Research, Vol.10, (November 1973), pp. 428-41.
--� ·-·---- ·· _D�___

A-1
APPENDIX ONE
Attitude Scales and Performance Measures*
Quality Personalness
I could trust that I am getting reallygood medical care.
The plan would help me prevent medicalproblems before they occurred.
I could easily find a good doctor.
The services would use the best possiblehospitals.
Highly competent doctors and specialistswould be available to serve me.
I would get a friendly, warm, andpersonal approach to my medical problems.
No one has access to my medical recordexcept medical personnel.
Not too much work would be done bynurses and assistants rather thandoctors.
There would be little redtape andbureaucratic hassle.
The service would use modern, up-to-datetreatment methods.
Value
I would not be paying too much for myrequired medical services.
There would be a high continuing interestin my health care.
It would be an organized and completemedical service for me and my family.
Convenience
I would be able to get medical serviceand advice easily any time of the dayand night.
The health services would be incon-veniently located and would be difficultto get to.
I would have to wait a long time to getservice.
*See Hauser and Urban [13] for detailed factor loadings.