Embed Size (px)
Citation preview

DISCUSSION PAPER SERIES
IZA DP No. 11538
Eric CardellaCharlene M. KalenkoskiMichael Parent
Less Is Not More: Information Presentation Complexity and 401(k) Planning Choices
MAY 2018
Any opinions expressed in this paper are those of the author(s) and not those of IZA. Research published in this series may include views on policy, but IZA takes no institutional policy positions. The IZA research network is committed to the IZA Guiding Principles of Research Integrity.The IZA Institute of Labor Economics is an independent economic research institute that conducts research in labor economics and offers evidence-based policy advice on labor market issues. Supported by the Deutsche Post Foundation, IZA runs the world’s largest network of economists, whose research aims to provide answers to the global labor market challenges of our time. Our key objective is to build bridges between academic research, policymakers and society.IZA Discussion Papers often represent preliminary work and are circulated to encourage discussion. Citation of such a paper should account for its provisional character. A revised version may be available directly from the author.
Schaumburg-Lippe-Straße 5–953113 Bonn, Germany
Phone: +49-228-3894-0Email: [email protected] www.iza.org
IZA – Institute of Labor Economics
DISCUSSION PAPER SERIES
IZA DP No. 11538
Less Is Not More: Information Presentation Complexity and 401(k) Planning Choices
MAY 2018
Eric CardellaTexas Tech University
Charlene M. KalenkoskiTexas Tech University and IZA
Michael ParentUniversity of Texas at Austin

ABSTRACT
IZA DP No. 11538 MAY 2018
Less Is Not More: Information Presentation Complexity and 401(k) Planning Choices*
This paper presents the results of an experiment that is designed to examine how information
presentation and complexity impact retirement-savings behavior. The experiment is
performed twice, using both a Qualtrics panel of new employees and a sample of business
school students. In this experiment, participants first were provided with either a long or
short description of a hypothetical employer-sponsored 401(k) plan. Then they were asked
whether they would enroll in the hypothetical plan and, if so, what percentage of their
salary they would contribute. If they chose to contribute, they were asked how they would
like to allocate their contribution between stocks and bonds. Participants were offered the
option to stick with pre-assigned default options such as a 4% contribution and a 50-50
stocks and bonds split. The hypothesis is that providing concise information with helpful
recommendations would improve choices over providing lengthy and detailed information.
However, controlling for demographic and other factors, this hypothesis was not supported
by the data, for either the new employees or the business school students. Thus, the data
suggest that simplifying the presentation of retirement-plan information to employees is
unlikely to result in vastly improved retirement-planning choices.
JEL Classification: G11, G41, H31, J32, D83, C90
Keywords: retirement planning, 401(k), information complexity, nudge, choice architecture
Corresponding author:Charlene M. KalenkoskiTexas Tech UniversityDepartment of Personal Financial Planning1301 Akron AveBox 41210Lubbock, TX 79409-1210USA
E-mail: [email protected]
* The authors thank Muna Alabed and Thomas Korankye for excellent research assistance.

2
1. Introduction
The vast majority of Americans do not save enough for retirement. According to Rhee (2013),
about 45 percent of U.S. households with heads aged 25 to 64 lack sufficient retirement savings
and, for working households about to retire, the median household’s retirement savings is just
$12,000. Weiner and Doescher (2008), Benartzi and Thaler (2013), Siedle (2013), Miller et al.
(2015), Vernon (2015), and Kirkham (2016) show similar numbers. The most recent, Kirkham
(2016), shows that about 33 percent of Americans do not have any retirement savings and, among
those who do have retirement savings, 23 percent of them do not have more than $10,000 saved.
Among those near retirement age, about 54 percent have retirement-savings amounts that fall
below the recommended threshold. Thus, many of these individuals will rely on Social Security, a
program that already is financially strained. Therefore, it is important to identify possible
mechanisms that can help people save more. This study investigates how changing the presentation
of 401(k) enrollment information impacts participation behavior. In particular, it examines whether
presenting plan information in a more compact and accessible way increases participation and
results in better investment decisions.
There are many reasons that Americans are not saving enough for retirement or doing so
inefficiently. One important potential explanation is the complexity of the decision-making
process, especially given the limited time typically available to make decisions regarding an
employer-sponsored retirement plan (Madrian & Shea, 2001; Iyengar et al., 2004; Beshears et al.,
2013). When individuals are hired by an employer, they often are faced with a mountain of
paperwork and a short deadline for deciding which retirement planning choice to make. In
addition, if they are offered a defined-contribution plan, which have become increasingly more
likely and now outnumber defined-benefits plans (see Campbell et al., 2011), they must decide

3
how much to contribute and in what financial products to invest. It can be quite challenging for
individuals to process the large amount of information provided to them within the short period of
time allowed, which might cause them to procrastinate (Madrian & Shea, 2001), simply fail to
enroll, or make inefficient planning decisions (Tang et al., 2010). Moreover, they often will resort
to using “rules of thumb” or rely on the choices or advice of others in making their retirement
decisions (Benartzi & Thaler, 2007), and often will stick with default options (e.g., contribution
rates and asset allocations) that are set by the employer, even if it is not optimal for the individual
(Choi et al., 2006; Beshears et al., 2013; Goda & Manchester, 2013).
A possible avenue through which retirement-planning choices might be impacted is the manner
by which information is provided (e.g., Tversky & Kahneman, 1981; Kahneman & Tversky, 2000).
Specifically, simplifying the complexity of the enrollment information provided to new
employees, which typically is very involved and complex, could impact enrollment decisions
(Beshears et al., 2013; Clark et al., 2014; Bateman et al., 2016).1 This type of information
intervention would fall broadly under the categorization of being a “nudge” (Thaler & Sunstein,
2008).2 In contrast to traditional economic levers such as taxes, subsidies, and regulation, nudges
alter the choice setting in a way that can predictably impact behavior (e.g., changing the default
options), while still preserving the choice set and underlying economic incentives (Sunstein &
Thaler, 2008). The focus of this study is to consider the extent to which “nudging” new employees
1 Similarly, Bhargava and Manoli (2015) find that reducing information complexity can increase the proportion of
eligible people who claim EITC benefits. 2 A particularly appealing aspect of using nudges is their liberty-preserving property, i.e., not restricting choices
or the cost of choice (Thaler & Sunstein, 2003; Camerer et al., 2003). As a way to improve retirement-planning decisions, both academic researchers and policy makers have supported the use of nudges, which we elaborate more on in the next section. Moreover, the growing research interest aimed at examining how, and the degree to which, non-price nudges can impact behavior spans well beyond retirement planning. The existing literature covers a host of other domains including: financial planning, education, health care, risky behaviors, consumption, and energy conservation. Interested readers are referred to Johnson et al. (2012), Madrian (2014), Benartzi et al. (2017), Loewenstein and Chater (2017), and Loewenstein et al., (2017) for discussions and reviews of this literature.

4
by presenting plan information in a more compact and suggestive way impacts some of the critical
retirement planning decisions – enrollment, salary contribution level, and portfolio allocation.
To do so, an experimental survey was conducted using a representative Qualtrics Panel of
recently hired employees. Respondents were provided with either a short-form or a long-form
description of information about a hypothetical, but realistic, employer-sponsored 401(k) plan, and
then were asked a series of questions related to their planned behavior, given the provided plan
information. These questions include (i) whether or not they would enroll in the plan and then,
conditional on enrolling, (ii) how much they would contribute, and (iii) how they would allocate
their contribution across asset classes. The main hypotheses were whether providing simplified
information that included recommendations would improve employees’ retirement planning
choices compared to providing complete and detailed information.
After, controlling for demographic and other factors, these hypotheses were not supported by
the data. Based on the results from the experimental survey, no significant differences were found
between the control group who received the long version and the treatment group who received
the short version in terms of their: enrollment rates, contribution rates, and portfolio allocations.
Moreover, we replicated the study using a sample of business school students who were expected
to have much less familiarity with the process of signing up for an employer-sponsored 401(k),
and the results were qualitatively similar. There is was essentially no effect of providing simplified
information on any planning choices.
2. Relevant Literature
Employer-sponsored 401(k) plans have become the primary means of private retirement savings,
yet planning behavior and investment choices are often inefficient (see Tang et al., 2010). In this
section, prior literature focusing on retirement-savings decisions and the factors that influence

5
plan-participation behavior is highlighted. Next, the prior literature related to how information
presentation and complexity specifically impact plan-participation behavior is discussed. Because
this study focuses on planning decisions with regard to an optional employee-sponsored 401(k)
plan, attention is restricted to literature that examines participation behavior and planning choice
in 401(k) plans or equivalent defined-contribution plans.
2.1. Enrollment Decisions
Several factors have been identified as determinants of employees’ enrollment in optional 401(k)
plans. These are age, level of education, job tenure, income, financial knowledge, plan features,
peer effects, and planning horizon. Prior research also suggests that automatic enrollment into a
plan (as the default) is very effective at increasing enrollment. In the United States, employees
have the right to choose their preferred retirement plan. However, in some organizations, automatic
enrollment is triggered if an employee fails to elect a retirement plan. Madrain and Shea (2001)
find that, when a 401(k) plan is set as the default option, enrollment numbers significantly increase
in the plan. Using data on employees in a large Fortune 500 corporation, the authors find that the
institution of automatic enrollment increased the participation rates of new employees by 86
percent, from a participation rate of 49 percent prior to its institution. Similarly, Choi et al. (2004)
extend Madrian and Shea’s (2001) research and find that automatic enrollment increases
participation in 401(k) plans by 85 percent. Prior to the institution of automatic enrollment, the
participation rate did not exceed 46% among a similar cohort of new employees. Thus, their
finding shows that the institution of automatic enrollment, with 401(k) as the default option,
produces high enrollment in 401(k) plans. Clark et al. (2014) examine the impact of providing
information to prospective participants about the potential future earnings from participating in a
401(k) plan and the importance of saving for the future. They find that providing new hires with

6
this information increases plan participation by an average of one percentage point, although this
aggregate effect is not significant. However, the authors report that the intervention was more
effective for males and younger employees who earn below $60,000.
A host of factors related to the specific plan attributes also have been shown to be important
determinants in retirement-plan-enrollment decisions. Notably, employer-matching funds provide
an incentive to enroll in 401(k) plans, and have been shown to stimulate enrollment (e.g., Papke
& Poterba, 1995; Bassett, 1998; Hansen, 1999; Micthell et al., 2007; Huberman et al., 2007; Clark
et al., 2014). Specifically, Hansen (1999) finds that the number of participants in 401(k) retirement
plans with an employer match exceeds the number of participants in 401(k) plans without a match.
Similarly, in a study involving 7,218 new employees of a large financial institution, Clark et al.
(2014) find that the likelihood of enrolling in the company’s 401(k) plan is 25 percent higher
among employees eligible for a match than among those who are not eligible for the match.
However, although an overall positive effect of an employer match on enrollment decisions has
been established, Basett et al. (1998) and Papke and Poterba (1995) note that, after a certain level,
participation rates increase at a decreasing rate as the employer match increases. Dworak-Fisher
(2011), using data from the National Compensation Survey, also show that the saving propensity
of participants in 401(k) plans diminishes as the employer match increases.
Besides plan features, peer effects also are believed to influence enrollment decisions in 401(k)
plans. Duflo and Saez (2002) find that the influence of colleagues’ choices on an employee’s
choice of retirement plan is significant; specifically, enrollment in a given retirement plan
increases by 2 percentage points when the participation rates of colleagues in the same department
increase by one percentage point. According to Manski (1993), the feeling of a sense of belonging
among members of a particular unit could be a contributing factor to the positive relationship

7
between peer effects and plan choice. Thus, participation rates in 401(k) plans are likely to increase
in environments where existing employees largely participate in 401(k) plans.
In addition to plan attributes, employee characteristics also impact plan participation. In
particular, age, which proxies for an individual’s life-cycle and labor-force position, is associated
positively with participation rates (Bassett et al., 1998; Madrian & Shea, 2001; Munnell et al.,
2001). This may be because younger individuals may not yet have access to jobs that offer 401(k)
plans, still may be obtaining an education, or just stepping onto the career ladder. As individuals
progress in their careers, they are more likely to be offered such plans and are less likely to have
educational debt that hinders retirement saving. A similar explanation may be used with respect to
the level of education as greater education improves access to a 401(k). Brown and Weisbenner
(2014), for example, show that employees in the State Universities Retirement System of Illinois
who have a Ph.D. are significantly more likely to opt for 401(k) plans than those without a
Bachelor’s degree. In addition, educated individuals may be more likely to recognize the value of
saving in such a plan. Another vital factor that also is associated with enrollment decisions in
401(k) plans is income (Bassett et al., 1998; Madrian & Shea, 2001; Brown & Weisbenner, 2014).
People without income wouldn’t have jobs with access to such plans. Alternatively, people with
low incomes, especially the young ones, may be overwhelmed with debt payments and other
budgetary constraints such that they feel that they cannot participate in 401(k) plans (Clark et al,
2014). Lastly, job tenure also has been found to affect enrollment in 401(k) plans. Bassett et al.
(1998), Madrian and Shea (2001), and Clark et al. (2014) find that employees with longer tenures
have a higher propensity to enroll in 401(k) plans than those with shorter ones.
Individuals’ financial knowledge is also significantly likely to influence their decision to enroll
in a 401(k) plan. According to Brown and Weisbenner (2014), financial knowledge positively

8
correlates with choosing 401(k) plans. Lusardi and Mitchel (2011) use data from the National
Financial Capability Study and find that individuals who are less financially literate are less likely
to bear the responsibility of planning for their retirement. As Bassett et al. (1998) and Benartzi and
Thaler (2007) point out, participating in a 401(k) plan shifts the responsibility of saving and
investing for retirement to the employee and, as the cost of making financial mistakes can be
enormous (Campbell, 2006), individuals with low financial knowledge may prefer to stay away
from participating in 401(k) plans (Brown & Weisbenner, 2014, Campbell, 2006). Finally, an
individual’s planning horizon also may be an important factor in explaining participation rates in
401(k) plans. Munnell et al. (2001) find that eligible employees with a planning horizon of less
than five years are less likely to participate in 401(k) plans than those with a planning horizon of
at least five years.
2.2. Contribution Decisions
Employees who enroll in 401(k) plans are also expected to choose their contribution rates. While
default options increase participation rates, research also shows that they affect contribution rates.
Madrian and Shea (2001) and Choi et al. (2004) report that the majority of new participants tend
to maintain the default saving rates associated with automatic enrollment. For instance, Madrian
and Shea find that 61 percent of automatically enrolled employees in their study continued to
maintain the default rate, likely because some participants take the default rate to be an investment
advice. However, some of this behavior may be attributed to inertia. The authors explain that,
because the default savings rates are low, this phenomenon tends to affect the retirement wealth of
the participants negatively. This view is largely supported by Benartzi and Thaler (2007) who
assert that participants who depend solely on the savings rate defaults in 401(k) plans are likely to
have insufficient retirement income. Thaler and Benartzi (2004) propose a novel solution to this

9
problem – the “Save More Tomorrow” program – which essentially defaults people into pre-
committing to allocating a portion of future raises into their retirement plan. Importantly, the
authors find that participation in the program successfully increases savings rates from 3.5% to
13.6% by the 4th pay raise, compared to about a 6% stable rate for those who did not participate.
The availability of an employer match also is expected to motivate 401(k) plan participants to
increase their saving rates. For example, Munnell et al. (2001) show that the availability of a match
increases contribution rates by 0.7 percentage points. However, the effect of match size on
contribution rates diminishes over time. Similarly, in an experiment involving employees above
59½ years in a certain organization, Choi et al. (2011) show that the contribution rates of 36 percent
of qualified participants fall below the employer match threshold. Surprisingly, while these
participants are vested in the plan and do not face a penalty for early withdrawals, they fail to take
advantage of these opportunities. By saving below the match threshold, Choi et al. (2011) deduce
that these employees, on average, lose arbitrage gain equivalent to 1.6 percentage points of their
yearly pay. The authors suggest that procrastination and a low level of financial knowledge may
cause this behavior and speculate that combining an employer match with another menu of
interventions may yield better results.
In addition to the presence of an employer match, an employee’s saving in 401(k) plans may
be influenced by the availability of borrowing opportunities. In Munnell et al. (2001), the authors
show that the ability of participants to borrow from their 401(k) contributions positively influences
contribution rates by 2.6 percentage points. They explain that borrowing opportunities particularly
may be an incentive for liquidity-constrained employees to enroll in their 401(k) plan.
In terms of employee characteristics, one factor that may influence the contribution rates of
401(k) participants is age. Clark et al. (2014), Huberman (2007), and Stawski (2007) all suggest
10
that contribution rates increase with age. This may be because younger individuals have more debt
and/or less goal clarity than older adults. Gender also is found to be a factor determining 401(k)
contribution rates. The contribution rates for men exceed those of women (Madrian and Shea,
2001; Clark et al., 2014). Huderman et al. (2007) suggests that this could be because, on average,
males earn higher incomes than females.
2.3. Asset-Allocation Decisions
Participants in 401(k) plans typically face the additional decision of how to structure their
portfolios, that is, in which assets to invest and how much to invest in each. According to Brinson
et al. (1995), asset allocation accounts for approximately 90 percent of the variation in security
returns. Yet, participants spend very little time choosing their asset allocations. In an experiment
involving University of Southern California’s staff employees, Benartzi and Thaler (1999) find
that many respondents spend no more than one hour in making their asset-allocation decisions
after being presented with a brochure containing information on different asset allocation choices.
In another experiment, Choi et al. (2011) find that people take, on average, 36 minutes to make
their asset-allocation decisions. Therefore, it is likely that some 401(k) participants do not
effectively utilize their employers’ allotted time for making retirement investment decisions.
Bernatzi and Thaler (2007) offer possible explanations as to why employees do not spend much
time making their asset-allocation decisions, given their complexity and importance. One
possibility is that some 401(k) participants prefer instead to rely on the advice of their peers,
friends, and family. Another is that some participants simply adopt the default investment option
associated with automatic enrollment. Another is that people have a naïve view of diversification
and thus choose to distribute their funds equally among the investment assets available in their
company’s 401(k) plan. Relatedly, Iyengar and Kamenica (2010) show that the number of
11
investment funds offered through a plan impacts asset allocation via the likelihood of contributing
to equity funds and the percentage contributed to equity funds.
Automatic enrollment also may affect 401(k) asset-allocation decisions. Research by Agnew et
al. (2003) shows the prevalence of inertia in asset-allocation decisions among automatically
enrolled 401(k) plan participants. Agnew et al. (2003) use data on a single plan’s 6,778 401(k)
accounts between April 1994 and August 1998 to document that automatically enrolled
participants tend to invest less in equities than those who purposefully elect to join the plan. They
explain that the automatically enrolled participants tend to stick to the default allocation which
usually is more conservative. Madrian and Shea (2001) and Choi et al. (2004) provide further
evidence to buttress this finding. Madrian and Shea (2001) analyze the savings behavior of 29,267
employees of a large U.S. corporation before and after the institution of automatic enrollment.
They show that, for every 10 automatically enrolled employees, six do not choose to deviate from
the default asset allocation which consists entirely of money-market securities. They attribute this
behavior to inertia and procrastination because, compared to automatically enrolled employees,
only one out of 16 non-automatically enrolled participants in their study had 100 percent of their
contributions allocated to the default fund. Choi et al. (2004) also suggest job tenure as another
major determinant of deviating from the default fund. They find that, as job tenure increases, the
number of participants choosing the default declines.
Framing also may influence participants’ choice of investment assets. Thus, the presentation of
the same information in multiple ways to individuals may yield different responses. Bernatzi and
Thaler (1999) use an experiment to compare the retirement-saving decisions of individuals who
are offered different information on security returns, either short-run or long-run returns. In this
experiment, people assigned 41 percent of retirement funds to stocks when shown one-year returns
12
for stocks and bonds. However, when presented with 30-year-simulated returns, people allocated
82 percent of their retirement assets to stocks. These results suggest that people’s preferences for
stocks increase when provided with information on long-run rather than short-run returns,
supporting the idea that how information on investment vehicles is presented matters to people’s
asset-allocation decisions.
Lastly, employee attributes also have been shown to shape asset allocations. Agnew et al.
(2003) show that 42.5 percent of males have allocations to stocks in their portfolios compared to
33.3 percent of females. Using brokerage account data on 35,000 households, Barber and Odean
(2001) also show that men invest more in common stocks than women. Neelakantan (2010) find
that men generally exhibit more risk tolerance than women in their retirement accounts. However,
Heo et al. (2016) show that risk preferences mediate gender and investment behavior. According
to Agnew et al (2003), married individuals also tend to allocate more funds to equities than single
adults. The authors attribute this to the fact that married individuals, unlike single adults, have
access to more than one source of employment income, making them potentially aggressive in
their 401(k) allocations. Another possible reason is that being married is more closely aligned with
intergenerational wealth transfers and hence a stronger desire to invest in long-term assets. Lastly,
Choi et al. (2004) identify income as a major determinant of participants sticking to the default
fund. In their study, the majority of low-income earners do not deviate from the money-market-
default allocation. Agnew et al. (2003) find that participants in high-income brackets invest a
greater proportion of their 401(k) wealth in equities compared to those in low-income brackets.
2.4. Information Presentation and Complexity
More closely related to the focus of this study, there are a few papers that investigate how
information presentation and complexity impact retirement planning decisions. Beshears et al.

13
(2013) argue that the complexity associated with plan-enrollment decisions can lead to
procrastination and a failure to enroll in the plan. They examine the impact of a “Quick
Enrollment” option that allows individuals to enroll in a retirement savings plan with a pre-selected
contribution rate and asset allocation. They find that reducing the complexity of the problem
through quick enrollment increases plan participation by about 10-20 percentage points. Moreover,
there is strong persistence of the pre-selected option with significantly more people contributing
at the pre-specified level (either 2% or 4%) and maintaining the pre-specified asset allocation.
However, these interventions reduce the choice set of individuals and the pre-selected contribution
rate and asset allocation may not be optimal for all employees. While Beshears et al. (2013)
consider a very extreme case of simplification, our study considers a subtler manipulation where
the information people receive is simplified but they do not face a restricted choice environment.
Clark et al. (2014) also examine the impact of reducing the complexity associated with plan
enrollment. In particular, they consider a manipulation where nonparticipating employees receive
a simplified flyer with information about participating in the plan, which includes some highlights
regarding the benefits of participation. They find that providing this simplified and encouraging
information did increase participation, especially for younger employees. Similar to this study, the
present paper examines how simplified information and recommendations impact plan
participation. In addition, it examines other decisions as well, including the contribution
percentage and the asset allocation. Dolls et al. (2018) document a similar effect that providing
information (by letter) about the expected returns in the German pension system increases private
retirement savings.
Kaufmann and Weber (2013) examine the effect of aggregating investment returns on
individual investors’ risk-taking behavior and find that more aggregation results in greater risk-

14
taking. The authors state that this is associated with a lower risk perception and a greater accuracy
in estimating the probability of a loss, suggesting that providing investors with more aggregated
information on returns results in more optimal investment choices. Thus, again, reducing
complexity (and the choice set) appears to improve financial decision making. Lastly, Bateman et
al. (2016) consider how the inclusion of asset-allocation information impacts investment choices,
finding that the inclusion of asset-allocation information impacts both diversification and the
riskiness of the chosen investment options.
3. Experimental Design
An online survey was conducted to examine how information complexity impacts retirement
planning decisions. The goal of this survey was to identify how the presentation of information
about an employer-sponsored, retirement-savings plan impacts planned decisions regarding: (i)
whether or not to enroll in the plan, (ii) if enrolled, how much to contribute and, (ii) if enrolled,
how to structure the portfolio allocation. In the survey, respondents were presented with
hypothetical, but realistic, retirement-savings-plan information. We systematically manipulated
whether the information was presented in either a short, simple format or a long, complex format,
and then asked a series of questions regarding their planned participation behavior, based on the
information provided.
3.1. Survey Procedure
After consenting to participate, respondents first were asked a series of general demographic
questions (age, gender, race, income). Information about general financial literacy was elicited
using five standard questions, which are provided in the Appendix. The respondents then were
presented with the retirement-savings scenario. In particular, they were asked to imagine that they
recently have started a new job (which the new employee sample members actually have done),

15
and that their employer is offering a sponsored 401(k) retirement savings plan with matching that
they are eligible to participate in. Respondents then were provided with some detailed hypothetical
information about the plan (discussed in detail in the next section). After presenting the plan
information, respondents were asked the following questions about their planned participation
behavior given the plan information:
1) Would you enroll in the plan?
2) How confident are you in your enrollment decision?
3) What percentage of your salary would you contribute to the plan (or stick with the default)?
4) How would you plan on investing their contribution (stick with the default allocation or
choose their own allocation)?
5) What percentages of your contribution would you invest in stocks and in bonds?
After answering the plan-participation questions, self-reported information about the actual
retirement planning experience of respondents was gathered. This information includes: (i) the age
they plan to retire; (ii) whether and what type of plan is offered by their current employer; (iii)
whether they participate in their employer’s sponsored plan if one is offered; and (iv) how much
they currently are saving for retirement. By collecting these data, possible heterogeneous treatment
effects and a better understanding of the possible moderating effects may be found.
3.2. Manipulation of the Presentation of the Plan
While the information provided about the retirement savings plan was hypothetical, the goal of the
experiment was to provide information that could reasonably approximate both the content and the
detail that employees might actually receive. Respondents were given information relating to the
following broad categories: overview of the plan, the enrollment process, investment options,
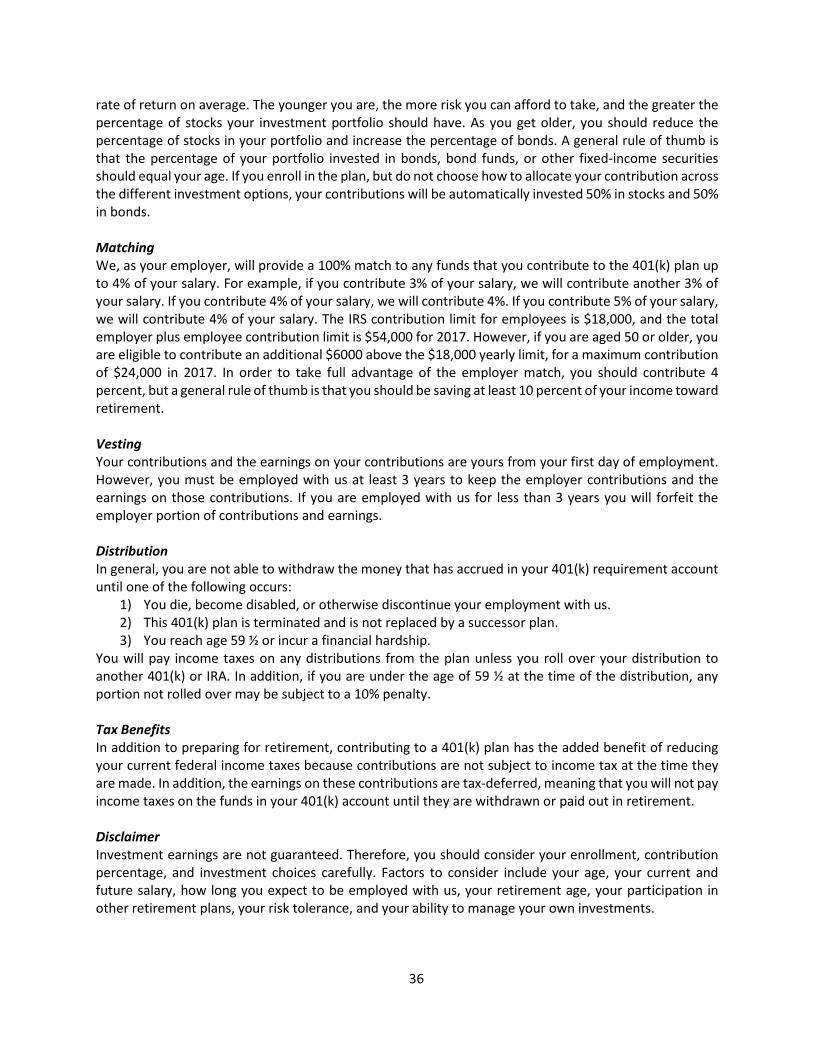
level of employer matching, vesting, distributions from the plan, tax benefits, and a general
16
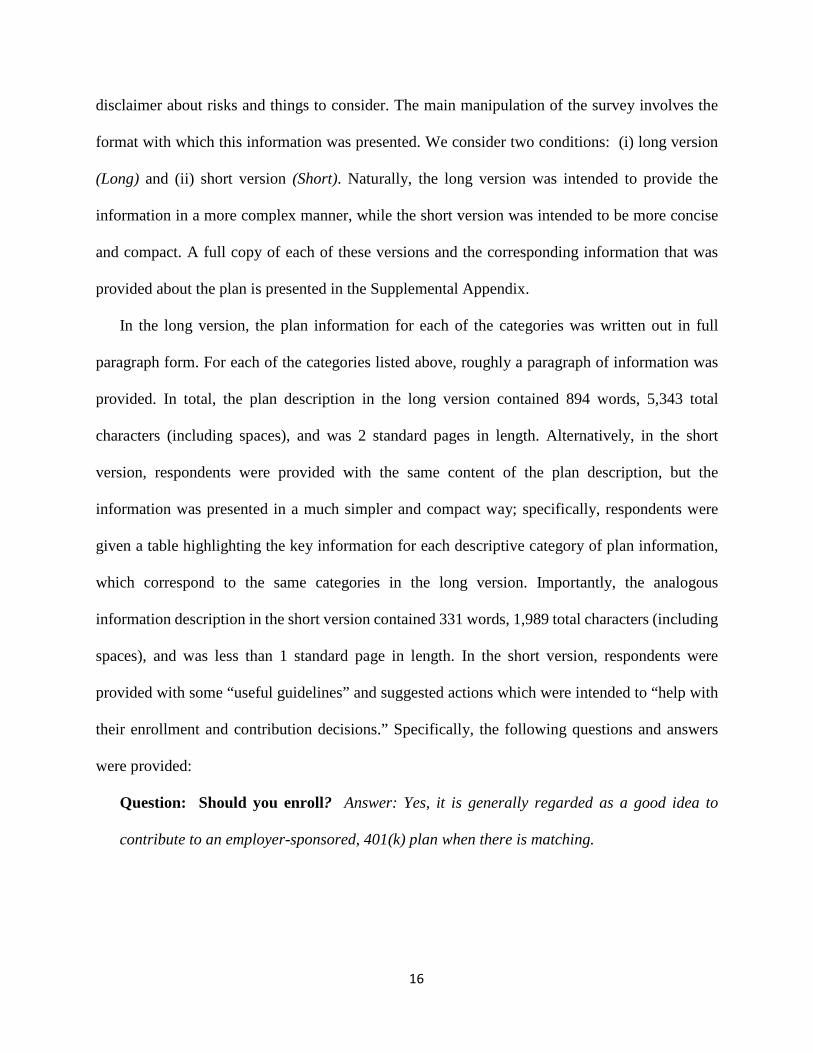
disclaimer about risks and things to consider. The main manipulation of the survey involves the
format with which this information was presented. We consider two conditions: (i) long version
(Long) and (ii) short version (Short). Naturally, the long version was intended to provide the
information in a more complex manner, while the short version was intended to be more concise
and compact. A full copy of each of these versions and the corresponding information that was
provided about the plan is presented in the Supplemental Appendix.
In the long version, the plan information for each of the categories was written out in full
paragraph form. For each of the categories listed above, roughly a paragraph of information was
provided. In total, the plan description in the long version contained 894 words, 5,343 total
characters (including spaces), and was 2 standard pages in length. Alternatively, in the short
version, respondents were provided with the same content of the plan description, but the
information was presented in a much simpler and compact way; specifically, respondents were
given a table highlighting the key information for each descriptive category of plan information,
which correspond to the same categories in the long version. Importantly, the analogous
information description in the short version contained 331 words, 1,989 total characters (including
spaces), and was less than 1 standard page in length. In the short version, respondents were
provided with some “useful guidelines” and suggested actions which were intended to “help with
their enrollment and contribution decisions.” Specifically, the following questions and answers
were provided:
Question: Should you enroll? Answer: Yes, it is generally regarded as a good idea to
contribute to an employer-sponsored, 401(k) plan when there is matching.
17
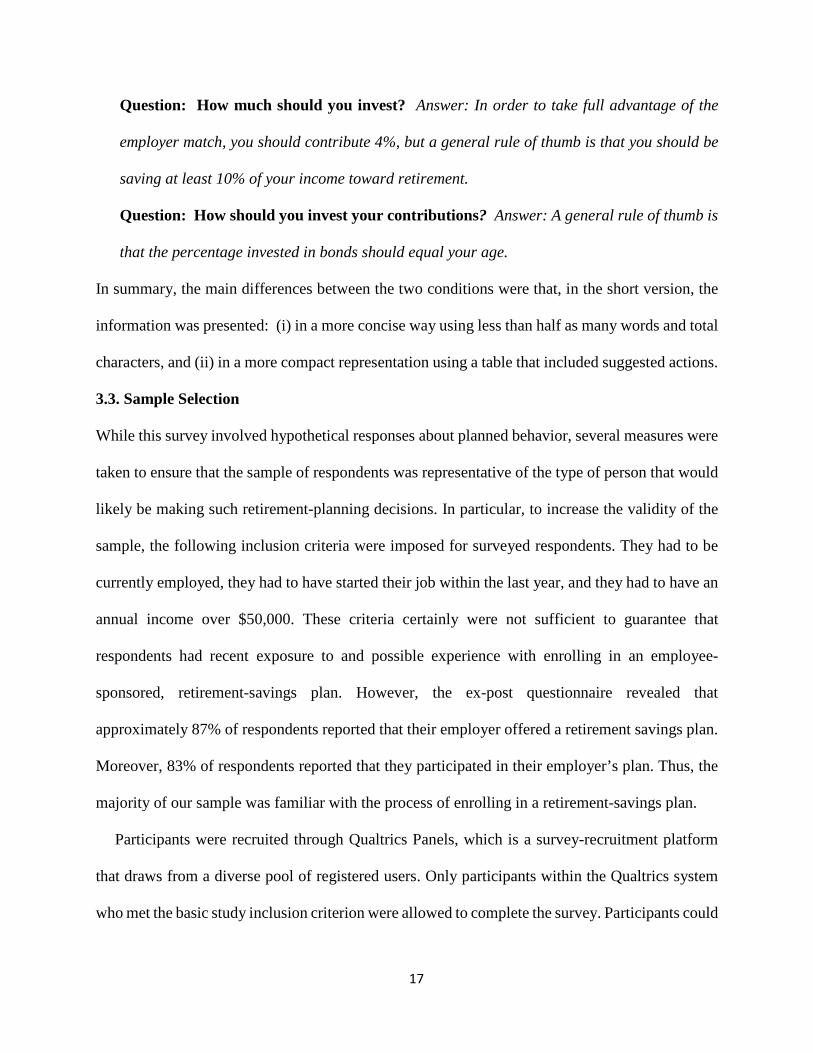
Question: How much should you invest? Answer: In order to take full advantage of the
employer match, you should contribute 4%, but a general rule of thumb is that you should be
saving at least 10% of your income toward retirement.
Question: How should you invest your contributions? Answer: A general rule of thumb is
that the percentage invested in bonds should equal your age.
In summary, the main differences between the two conditions were that, in the short version, the
information was presented: (i) in a more concise way using less than half as many words and total
characters, and (ii) in a more compact representation using a table that included suggested actions.
3.3. Sample Selection
While this survey involved hypothetical responses about planned behavior, several measures were
taken to ensure that the sample of respondents was representative of the type of person that would
likely be making such retirement-planning decisions. In particular, to increase the validity of the
sample, the following inclusion criteria were imposed for surveyed respondents. They had to be
currently employed, they had to have started their job within the last year, and they had to have an
annual income over $50,000. These criteria certainly were not sufficient to guarantee that
respondents had recent exposure to and possible experience with enrolling in an employee-
sponsored, retirement-savings plan. However, the ex-post questionnaire revealed that
approximately 87% of respondents reported that their employer offered a retirement savings plan.
Moreover, 83% of respondents reported that they participated in their employer’s plan. Thus, the
majority of our sample was familiar with the process of enrolling in a retirement-savings plan.
Participants were recruited through Qualtrics Panels, which is a survey-recruitment platform
that draws from a diverse pool of registered users. Only participants within the Qualtrics system
who met the basic study inclusion criterion were allowed to complete the survey. Participants could
18
voluntarily elect to complete the study and, if they did so, they would be directed to the online
survey. After completing the survey, the participants were compensated directly by Qualtrics based
on a pre-determined amount set by Qualtrics. In total, the sample consists of 600 respondents (split
between the two conditions). The average time to complete the survey was just over 6 minutes.
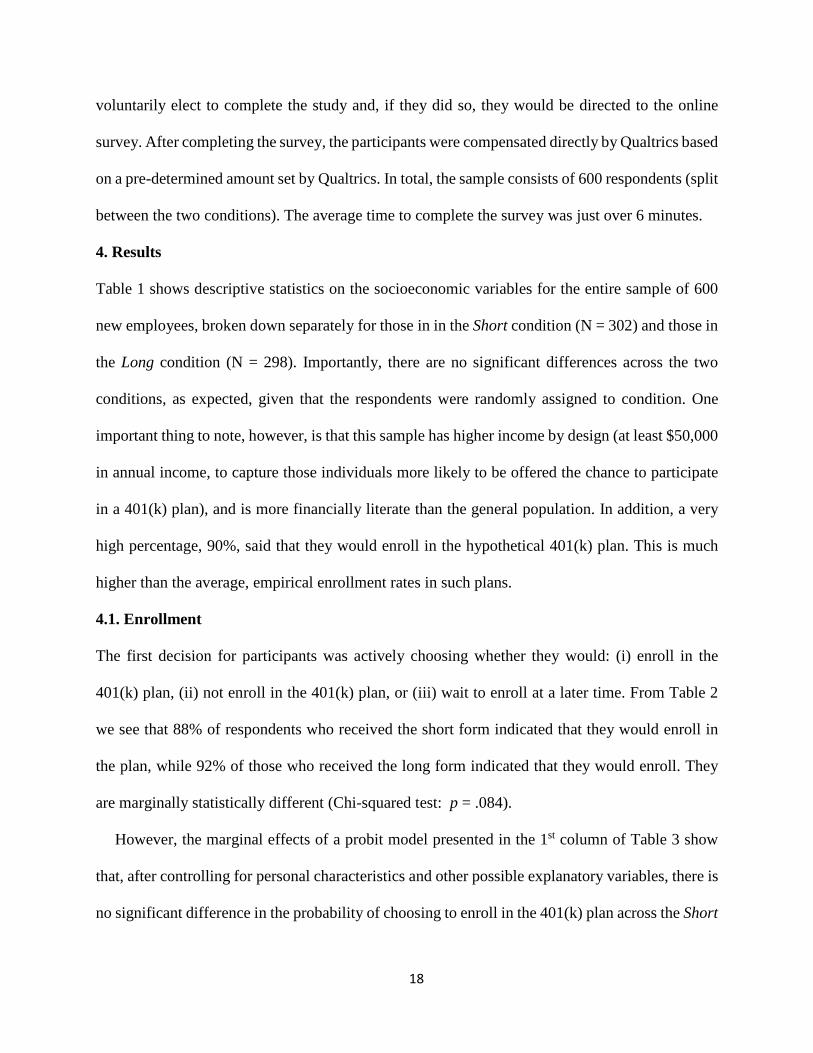
4. Results
Table 1 shows descriptive statistics on the socioeconomic variables for the entire sample of 600
new employees, broken down separately for those in in the Short condition (N = 302) and those in
the Long condition (N = 298). Importantly, there are no significant differences across the two
conditions, as expected, given that the respondents were randomly assigned to condition. One
important thing to note, however, is that this sample has higher income by design (at least $50,000
in annual income, to capture those individuals more likely to be offered the chance to participate
in a 401(k) plan), and is more financially literate than the general population. In addition, a very
high percentage, 90%, said that they would enroll in the hypothetical 401(k) plan. This is much
higher than the average, empirical enrollment rates in such plans.
4.1. Enrollment
The first decision for participants was actively choosing whether they would: (i) enroll in the
401(k) plan, (ii) not enroll in the 401(k) plan, or (iii) wait to enroll at a later time. From Table 2
we see that 88% of respondents who received the short form indicated that they would enroll in
the plan, while 92% of those who received the long form indicated that they would enroll. They
are marginally statistically different (Chi-squared test: p = .084).
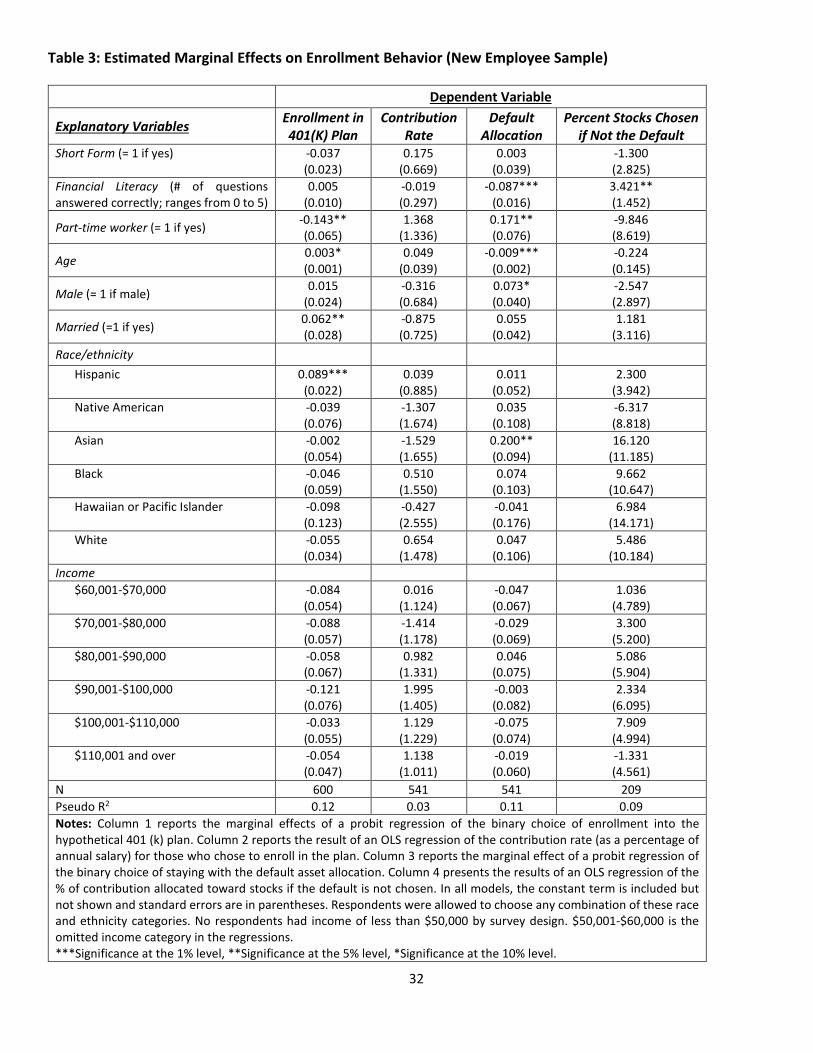
However, the marginal effects of a probit model presented in the 1st column of Table 3 show
that, after controlling for personal characteristics and other possible explanatory variables, there is
no significant difference in the probability of choosing to enroll in the 401(k) plan across the Short

19
and Long conditions. Many of the other explanatory variables also are not statistically significant.
However, those that are statistically significant are generally in line with what we might expect,
and thus provide additional confidence in the results. Namely, all else equal, part-time workers
have a 0.14 lower probability of enrolling in the hypothetical 401(k) plan than full-time workers.
An increase in age by 10 years increases the probability of enrollment by 0.03. Married workers
have a higher probability of enrollment than those who are not married by 0.06.
Overall, providing brief information and recommendations via the short description of the plan
had little impact on respondents’ hypothetical enrollment in the 401(k) plan. This suggests that the
briefer presentation of the employer’s 401(k) plan in the way described here may not have a sizable
impact on individuals’ 401(k) enrollment rates.
4.2. Contribution Rate
Those respondents who said that they would enroll in the hypothetical plan were then asked what
percentage of their salary they would contribute. The two options were to: (i) stick with the default
contribution level or (ii) write-in their desired contribution percentage. The plan information stated
that the default contribution level was 4 percent, the maximum amount that would be fully matched
by the employer. The short form also included a statement that a general rule-of-thumb is to save
10 percent of your salary toward retirement.
Table 2 shows that the average contribution rate was 6.7% in the Short condition and 6.4% in
the Long condition. These are not significantly different (t-test: p = .655). Column 2 of Table 3
shows the estimated coefficients from an OLS regression of the percentage of earnings contributed
to the plan on an indicator for the Short condition and other control variables. Of particular interest,
we also consider the percentage of respondents who stuck with the default 4 percent contribution
level or the suggested 10 percent level. Additional analysis of the choice data reveals that 68% of

20
respondents in the Short condition and 69% in the Long condition contributed at the 4 percent
level, which are not statistically different. Regarding the 10 percent suggested level, only 7.8% of
enrollees in the Short condition and 6.5% in the Long condition contributed at this level, which is
also not statistically different. These results confirm that receiving the short form did not affect
how much people who would enroll would contribute. Furthermore, none of the included
explanatory variables have a significant effect on contribution rates.
Overall, providing plan information in the shorter, more concise manner described here seems
to have had little impact on the amount contributed. Not surprisingly, the vast majority contributed
at the 4 percent default level, which was the maximum level that was matched by the employer.
Despite the fact that the short form included a highlighted suggestion that the rule-of-thumb is to
contribute 10 percent of salary toward retirement saving, there is essentially no difference across
conditions in the proportion of respondents choosing a 10 percent contribution level.
4.3. Asset Allocation
The final component of plan enrollment to be examined is asset allocation. Conditional on
choosing to enroll, respondents were asked how they would allocate their contributions between
stocks and bonds. Specifically, they had the following two options: (i) stick with the default
allocation (50% stocks and 50% bonds), or (ii) write in the percentages they would allocate toward
stocks and bonds (with the total between the two being required to sum to 100%).
Table 2 shows that, of all the respondents who chose to enroll in the plan, 61% chose the default.
Of the 39% of enrolled respondents who didn’t choose the default allocation, the average
percentage allocated to stocks was 57.7% in the Short condition and 59.3% in the Long condition.
These are not statistically different from each other (t-test: p = .548). Even though one of the
recommendations provided in the Short form was that the percentage that should be invested in

21
bonds is equal to a person’s age, very few respondents followed this recommendation, and this
was not different across the Short and Long conditions.
Column 3 of Table 3 shows the marginal effects and standard errors of a probit model of
choosing the default allocation of stocks and bonds, if enrolled. Consistent with the descriptive
statistics, the probit model results also show that the Short form condition has no meaningful effect
on choosing the default. However, higher financial literacy significantly reduces the likelihood of
choosing the default, as expected. Each additional financial literacy question correct decreases the
probability of choosing the default allocation by 0.09. Part-time workers have a 0.17 higher
probability of choosing the default option than do full-time workers. An increase in age by 10
years significantly decreases the probability of choosing the default by 0.09. Males have a higher
probability of choosing the default by 0.07, all else equal, than non-males.
Column 4 of Table 3 shows the results of an OLS regression of the percent stock allocation, if
enrolled and not choosing the default of 50 percent stocks and 50 percent bonds, on the Short
condition and other explanatory variables. Again, the Short condition has no effect on the
percentage of funds allocated to stocks. However, getting an additional financial literacy question
correct significantly increases the percentage of 401(k) contributions that is allocated to stocks by
3.42. Overall, providing the specific recommendations described here seems to have had little
impact on the percentages of contributions allocated to stocks and bonds.
5. Replication Using a Student Sample
The results presented in Section 4 were obtained using a representative Qualtrics panel of recently
employed adults. The intent was to collect data from a sample that was likely to have been exposed
to enrolling in an employer-sponsored retirement plan, which is a relevant population to examine
the possible behavioral impact of simplifying the presentation of plan information. After

22
documenting that reducing information complexity had no effect on the enrollment, contribution,
or asset-allocation decisions of this group, possible concerns about the robustness of this result
emerged. In particular, it is possible that respondents’ prior recent enrollment choices acted as an
anchor for their documented behavior in the survey, basically crowding out the possible influence
of the manipulation of the information presentation. To explore this possibility, and to ultimately
draw more robust conclusions about the possible impact of the manner in which plan information
is presented on enrollment behavior, the study was replicated using different sample of business-
school students that were less likely to have prior experience having the opportunity to enroll in
an employer-sponsored 401(k) plan. It was hypothesized that these students would be more
susceptible to being nudged by presenting information about the plan in a certain way as they
would not be anchoring their choices on prior experience. Perhaps even more importantly,
examining a student population is valuable because students represent the population of soon-to-
be employees who will be making retirement saving decisions regarding employer-sponsored
401(k) plans (or equivalents) in the near future.
5.1. Student Sample Selection
Students in this sample were enrolled in the Rawls College of Business at Texas Tech University.
The Rawls College maintains a database of students who voluntarily enroll to participate in
research studies. An email was sent to all participants in the database notifying them of the
availability of the survey and the designated window of time they had to complete the survey. In
return for their participation, students received research credits that counted toward class credit. In
total, 233 participants from this student database completed the survey. Importantly, this sample
of students is much different from the Qualtrics panel of new employees analyzed first. In
particular, only 21% reported that they currently save for retirement. Moreover, only 19% reported

23
that their current employer offers a retirement savings plan (401(k) or equivalent and only 6% of
the total sample actually participates in an employer-sponsored plan. Thus, this sample had little
exposure to retirement savings plans, as intended.
Table 4 shows the descriptive statistics for the sample of business school students, broken down
separately by whether they received the Short form or the Long form. While there is a little more
variation in some of the socioeconomic variables across the two conditions, there are no
statistically significant differences in any of these measures at the 10% level.
5.2. Results from the Student Sample
As with the analysis of the Qualtrics sample, the main focus of the analysis with the student sample
is on identifying if and to what extent providing plan information via the Short form impacted
desired participation behavior. Table 5 presents descriptive statistics for the four dependent
variables of interest – enrollment in 401(k) plan, contribution rate, default allocation, and asset
allocation if not the default – for each condition.
Importantly, the results from the student sample are very similar – both in terms of magnitude
and comparison across conditions – to the Qualtrics panel. Namely, from Table 5 we see that the
planned enrollment rate is 92% in the Short condition and 95% in the Long condition, and this
difference is not significant. Conditional on enrolling, the planned contribution rate is 6.86% in
the Short condition and 6.35% in the Long condition, which also are not significantly different. In
terms of asset allocation, 55% of those who would enroll indicated that they would stick with the
default in the Short condition and 45% in the Long condition, but this difference is not statistically
significant. For those who opted to pick their asset allocation, the average amount invested in
stocks was 62% in the Short condition and 61% in the Long condition. These appear to be higher
percentages, however, than the Qualtrics panel.

24
Table 6 shows the effect of receiving the short form while controlling for other possible
explanatory variables on each of these four dependent variables. Unexpectedly, those students who
received the Short form had a 0.12 higher probability of choosing the default. However, the
estimate is only marginally significant (at the 10% level). There are no statistically significant
effects of receiving the Short form on enrollment, contribution rate, or self-selected asset-
allocation. Like the results for the Qualtrics panel, only financial literacy seems to impact behavior.
As we would expect, higher levels of financial literacy lead to better decision making: higher
contribution rates and a higher percentage allocated toward stocks.
Overall, we see very similar results emerge with the student sample as with the Qualtrics
sample. Namely, the appears to be very little effect of providing shorter condensed plan
information and enrollment suggestions (via the Short form manipulation) on planned enrollment
behavior. As such, the fact that we see little impact of the Short form on reported behavior in both
a representative sample of newly hired employees with salaries over $50K (who presumably have
experience with retirement planning) and business students (who presumably have no experience
with retirement planning) provides a more robust conclusion about the plausibly limited impact of
simplified plan information on enrollment behavior.
6. Conclusion
This paper describes the results of an experiment using both a Qualtrics Panel of new employees
and a sample of business school students. Participants in both samples were provided with either
a long or short description of a 401(k) plan, and then asked to choose whether or not they would
like to enroll in the plan. If they decided to enroll, they were asked to indicate what percentage of
their salary they would like to contribute and how they would like to allocate their contribution
between stocks and bonds. The main hypothesis was that providing abbreviated information that

25
recommendations would improve plan participation choices over providing complete and detailed
information. However, controlling for demographic and other factors, this hypothesis was not
supported by the data, for either the new employee Qualtrics sample or the business school student
sample; namely, we found little difference in planned enrollment rates, contribution levels, and
asset allocations between those who received the long description and those who received the
compact shorter description.
Overall, the data do not support the idea that presenting optional 401(k) plan information in a
simpler, more compact way will improve employees’ retirement planning choices. Moreover, our
study casts some doubt on the potential effectiveness of implementing policies that would mandate
concise and more accessible information disclosures about optional, employee-sponsored
retirement plans in terms of improving retirement planning outcomes. However, we did find that
financial literacy was positively associated with better choices for both samples. This suggests that
increasing financial literacy – possibly through educational programs (as suggested by Tang et al.,
2010) – rather than changing the presentation of plan information would improve decision making
regarding 401(k) plans. In addition, given that so many people choose the default options, it may
be ideal to design those defaults in such a way as to improve individuals’ outcomes.

26
References
Agnew, J., Balduzzi, P., & Sundén, A. (2003), “Portfolio Choice and Trading in a Large 401 (k) Plan,” American Economic Review, 93(1), 193-215
Barber, Brad M., & Odean, Terrance. (2001), “Boys Will be Boys: Gender, Overconfidence, and Common Stock Investment,” Quarterly Journal of Economics, 116(1), 261.
Bassett, W. F., Fleming, M. J., and Rodrigues, A. P. (1998), “How workers use 401 (k) Plans: The Participation, Contribution, and Withdrawal Decisions,” National Tax Journal: 263-289
Bateman, H., Dobrescu, L. I., Newell, B. R., Ortmann, A., & Thorp, S. (2016). “As Easy as Pie: How Retirement Savers Use Prescribed Investment Disclosures,” Journal of Economic Behavior & Organization 121: 60-76.
Benartzi, S., Beshears, J., Milkman, K. L., Sunstein, C. R., Thaler, R. H., Shankar, M., ... & Galing, S. (2017). “Should Governments Invest More in Nudging?” Psychological Science DOI: 0956797617702501.
Benartzi, S., & Thaler, R. H. (2013). “Behavioral Economics and the Retirement Savings Crisis,” Science 339(6124): 1152-1153.
Benartzi, S. and Thaler, R. H. (2007), “Heuristics and Biases in Retirement Savings Behavior,” The Journal of Economic Perspectives 21(3): 81-104.
Benartzi, S. and Thaler, R. H. (1999), “Risk Aversion or Myopia? Choices in Repeated Gambles and Retirement Investments,” Management Science 45(3): 364-38.
Beshears, J., Choi, J. J., Laibson, D., & Madrian, B.C. (2013), “Simplification and Saving,” Journal of Economic Behavior and Organization 95: 130-145.
Beshears, J., Choi, J.J., Laibson, D., Madrian, B.C., & Milkman, K.L. (2015). “The Effect of Providing Peer Information on Retirement Savings Decisions,” The Journal of Finance 70(3): 1161-1201.
Bhargava, S., & Manoli, D. (2015). “Psychological Frictions and the Incomplete Take-up of Social Benefits: Evidence from an IRS Field Experiment,” American Economic Review 105(11): 3489-3529.
Brinson, G. P., Hood, L. R., & Beebower, G. L. (1995), “Determinants of Portfolio Performance,” Financial Analysts Journal 51(1): 133-138.
Brown, J. R., and Weisbenner, S. J. (2014), “Why do Individuals Choose Defined Contribution Plans? Evidence from Participants in a Large Public Plan,” Journal of Public Economics 116: 35-46.
Camerer, C., Issacharoff, S., Loewenstein, G., O'donoghue, T., & Rabin, M. (2003). “Regulation for Conservatives: Behavioral Economics and the Case for ‘Asymmetric Paternalism’,” University of Pennsylvania Law Review 151(3): 1211-1254.
Campbell, J. (2006), “Household Finance,” Journal of Finance, 61(4), 1553-1604.
Campbell, J. Y., Jackson, H. E., Madrian, B. C., & Tufano, P. (2011). “Consumer Financial Protection,” Journal of Economic Perspectives 25(1): 91-114.

27
Choi, J.J., Laibson, D., and Madrain, B.C. (2011), “$100 Bills on the Sidewalk: Suboptimal Investment in 401(k) Plans,” Review of Economics and Statistics 93(3): 748-763.
Choi, James J.; Laibson, David; Madrian, Brigitte; and Andrew Metrick (2006). “Saving for Retirement on the Path of Least Resistance,” Behavioral Public Finance, 304-51.
Choi, J. J., Laibson, D., Madrian, B. C., & Metrick, A. (2004), “For Better or for Worse: Default Effects and 401(k) Savings Behavior,” In Perspectives on the Economics of Aging (pp. 81-126). University of Chicago Press.
Clark, R., Maki, J., and Morrill, M. (2014), “Can Simple Informational Nudges Increase Employee Participation in a 401(k) Plan?” Southern Economic Journal 80(3): 677-701.
Dworak‐Fisher, K. (2011), “Matching Matters in 401 (k) Plan Participation,” Industrial Relations: A Journal of Economy and Society 50(4): 713-737.
Dolls, M., Doerrenberg, P., Peichl, A., & Stichnoth, H. (2018), “Do retirement savings increase in response to information about retirement and expected pensions?” Journal of Public Economics 158: 168-179.
Duflo, E. and Saez, E. (2002), “Participation and Investment Decisions in a Retirement Plan: The Influence of Colleagues’ Choices,” Journal of Public Economics 85(1): 121-148.
Goda, Gopi Shah and Colleen Flaherty Manchester (2013). “Incorporating Employee Heterogeneity into Default Rules for Retirement Plan Selection,” Journal of Human Resources 48(10): 198-235.
Hansen, F. (1999), “401(K)-How Good is Yours?” Management Review 88: 55-60.
Heo, W., Nobre, L., Grable, J., & Ruiz-Menjivar, J. (2016), “What Role Does Financial Risk Tolerance Play in Mediating Investing Behavior?” Journal of Financial Service Professionals 70(5): 42.
Huberman, G., Iyengar, S. S., and Jiang, W. (2007), “Defined Contribution Pension Plans: Determinants of Participation and Contributions Rates,” Journal of Financial Services Research 31(1): 1-32.
Huberman, G. and Sengmueller, P. (2004), “Performance and Employer Stock in 401 (k) Plans,” Review of Finance 8(3): 403-443.
Huberman, G. (2001), “Familiarity Breeds Investment,” Review of Financial Studies 14(3): 659-680.
Iyengar, S.S., Huberman, G., Jiang, W., (2004). “How Much Choice Is Too Much? Contributions to 401(k) Retirement Plans. In: Mitchell, O., Utkus, S. (Eds.), Pension Design and Structure: New Lessons from Behavioral Finance. Oxford University Press, Oxford, UK, pp. 83–96.
Iyengar, S. S., & Kamenica, E. (2010), “Choice proliferation, simplicity seeking, and asset allocation,” Journal of Public Economics, 94(7-8), 530-539.
Johnson, E. J., Shu, S. B., Dellaert, B. G., Fox, C., Goldstein, D. G., Häubl, G., ... & Wansink, B. (2012). “Beyond Nudges: Tools of a Choice Architecture,” Marketing Letters 23(2): 487-504.

28
Kahneman, D., & Tversky, A. (Eds.) (2000). Choices, Values, and Frames. Cambridge University Press.
Kaufmann, C. & Weber, M. (2013), “Sometimes Less Is More: The Influence of Information Aggregation on Investment Decisions,” Journal of Economic Behavior and Organization 95: 20-33.
Kirkham, E. (2016). “Retirement,” In MONEY: Personal Finance News and Advice. Available at time.com/money/4258451/retirement-savings-survey/
Loewenstein, G. and Chater, N. (2017). “Putting Nudges in Perspective,” Behavioural Public Policy 1(1): 26-53.
Loewenstein, G., Hagmann, D., Schwartz, J., Ericson, K., Kessler, J. B., Bhargava, S., ... & Nussbaum, D. (2017). “A Behavioral Blueprint for Improving Health Care Policy,” Behavioral Science & Policy 3(1): 53-66.
Lusardi, A., & Mitchell, O. S. (2011). “Financial Literacy and Retirement Planning in the United States,” National Bureau of Economic Research Working Paper No. w17108.
Madrian, B. C. (2014). “Applying Insights from Behavioral Economics to Policy Design,” Annual. Review of Economics 6(1): 663-688.
Madrian, B. C., & Shea, D. F. (2001), “The Power of Suggestion: Inertia in 401 (k) Participation and Savings Behavior,” The Quarterly Journal of Economics 116(4):1149-1187.
Miller, K., Madland, D., and Weller, E. C. (2015). “The Reality of the Retirement Crisis,” Center for American Progress. Available at https://www.americanprogress.org/issues/economy/reports/2015/01/26/105394/the-reality-of-the-retirement-crisis/
Manski, C. (1993), “Identification of Endogenous Social Effects: The Reflection Problem,” The Review of Economic Studies 60(204): 531.
Mitchell, O., Utkus, S., & Yang, T. (2007), “Turning Workers into Savers? Incentives, Liquidity, and Choice in 401 (k) Plan Design,” National Tax Journal 60(3): 469-489.
Munnell, A. H., Sunden, A., & Taylor, C. (2001), “What Determines 401(k) Participation and Contributions?” Social Security Bulletin 64(3): 64-75.
Neelakantan, U. (2010), “Estimation and Impact of Gender Differences in Risk Tolerance,” Economic Inquiry 48(1) 228-233.
Papke, L. E., and Poterba, J.M. (1995), “Survey Evidence on Employer Match Rates and Employee Saving Behavior in 401(k) Plans,” Economic Letters 49: 313-317.
Poterba, J. M. (2003), “Employer Stock and 401 (k) Plans,” The American Economic Review 93(2): 398-404.
Rhee, N. (2013). The Retirement Savings Crisis. Washington DC: National Institute on Retirement Security
Siedle, E. (2013). The Greatest Retirement Crisis in American History. Forbes. Available on: https://www.forbes.com/sites/edwardsiedle/2013/03/20/the-greatest-retirement-crisis-in-american-history/#367dcc1a55b6

29
Stawski, Robert S., Hershey, Douglas A., and Jacobs-Lawson, Joy M. (2007), “Goal Clarity and Financial Planning Activities as Determinants of Retirement Savings Contributions,” International Journal of Aging and Human Development, 64(1), 13-32.
Tang, N., Mitchell, O. S., Mottola, G. R., & Utkus, S. P. (2010), “The efficiency of sponsor and participant portfolio choices in 401 (k) plans.” Journal of Public Economics 94, 1073-1085.
Thaler, R. H., & Benartzi, S. (2004). “Save more tomorrow™: Using behavioral economics to increase employee saving.” Journal of Political Economy, 112(S1), S164-S187.
Thaler, R.H. & Sunstein, C. (2003), “Libertarian Paternalism,” American Economic Review 93(2): 175-179.
Thaler, R.H., Sunstein, C.R. (2008), Nudge: Improving Decisions about Health, Wealth, and Happiness, New Haven, CT, Yale University Press.
Tversky, A., Kahneman, D., 1981. The framing of decisions and the psychology of choice. Science 211 (4481), 453–458.
VanDerhei, J., Holden, S., Alonso, L., and Bass, S. (2016), “401(k) Plan Asset Allocation, Account Balances, and Loan Activity in 2014,” Pension Benefits 25(7): 1-2.
VanDerhei, J., Galer, R., Quick, C., and Rea, J. (2001), “401(k) Plan Asset Allocation, Account Balances, and Loan Activity in 1999,” Employee Benefit Research Institute Issue Brief 205:1-20.
Vernon, S. (2015). Why so Many Boomers Need a Retirement Reality Check. CBS News. Available on: https://www.cbsnews.com/news/why-so-many-boomers-need-a-retirement-reality-check/
Wiatrowski, W. J. (2008), “401 (k) Plans move away from Employer Stock as Investment Vehicle,” Monthly Labor Review 131: 3.
Wiener, J., & Doescher, T. (2008). A framework for promoting retirement savings. Journal of Consumer Affairs, 42(2), 137-164.

30

31
Table 1: Descriptive Statistics by Condition (New Employee Sample)
Socioeconomic Explanatory Variables Full Sample (n = 600)
Short Condition (n = 302)
Long Condition (n = 298)
Financial Literacy (# of questions answered correctly; ranges from 0 to 5) 3.31 3.28 3.34
Part-time worker (= 1 if yes) 0.09 0.08 0.10
Age 34.11 33.88 34.34
Male (= 1 if male) 0.51 0.48 0.55
Married (=1 if yes) 0.62 0.62 0.61
Race/ethnicity Hispanic 0.21 0.22 0.20 Native American 0.06 0.05 0.06 Asian 0.10 0.09 0.10 Black 0.14 0.14 0.14 Hawaiian or Pacific Islander 0.02 0.03 0.01 White 0.75 0.77 0.73
Income Level $60,001-$70,000 0.24 0.24 0.25 $70,001-$80,000 0.14 0.16 0.13 $80,001-$90,000 0.13 0.12 0.14 $90,001-$100,000 0.08 0.09 0.08 $100,001-$110,000 0.08 0.09 0.07 $110,001 and over 0.21 0.21 0.21
Notes: Respondents were allowed to choose any combination of these race and ethnicity categories. No respondents had income of less than $50,000 by survey design. $50,001-$60,000 is the omitted income category in the regressions.
Table 2: Comparison of Enrollment Behavior across Conditions (New Employee Sample)
Dependent Variables Full Sample Short Condition Long Condition p-value
Enrollment in 401(k) Plan (= 1 if yes) 0.90 (0.30)
0.88 (0.32)
0.92 (0.27) p = .084
Contribution Rate (% of salary contributed if enrolled)
6.56 (7.70)
6.74 (8.52)
6.44 (6.85) p = .655
Default Allocation (fraction choosing default of 50% stocks and 50% bonds)
0.61 (0.49)
0.62 (0.49)
0.61 (0.49) p = .893
Asset Allocation (% of contribution allocated to stocks if not default)
58.66 (20.10)
57.88 (21.30)
59.39 (18.95) p = .588
32
Table 3: Estimated Marginal Effects on Enrollment Behavior (New Employee Sample)
Dependent Variable
Explanatory Variables Enrollment in 401(K) Plan
Contribution Rate
Default Allocation
Percent Stocks Chosen if Not the Default
Short Form (= 1 if yes) -0.037 (0.023)
0.175 (0.669)
0.003 (0.039)
-1.300 (2.825)
Financial Literacy (# of questions answered correctly; ranges from 0 to 5)
0.005 (0.010)
-0.019 (0.297)
-0.087*** (0.016)
3.421** (1.452)
Part-time worker (= 1 if yes) -0.143** (0.065)
1.368 (1.336)
0.171** (0.076)
-9.846 (8.619)
Age 0.003* (0.001)
0.049 (0.039)
-0.009*** (0.002)
-0.224 (0.145)
Male (= 1 if male) 0.015 (0.024)
-0.316 (0.684)
0.073* (0.040)
-2.547 (2.897)
Married (=1 if yes) 0.062** (0.028)
-0.875 (0.725)
0.055 (0.042)
1.181 (3.116)
Race/ethnicity
Hispanic 0.089*** (0.022)
0.039 (0.885)
0.011 (0.052)
2.300 (3.942)
Native American -0.039 (0.076)
-1.307 (1.674)
0.035 (0.108)
-6.317 (8.818)
Asian -0.002 (0.054)
-1.529 (1.655)
0.200** (0.094)
16.120 (11.185)
Black -0.046 (0.059)
0.510 (1.550)
0.074 (0.103)
9.662 (10.647)
Hawaiian or Pacific Islander -0.098 (0.123)
-0.427 (2.555)
-0.041 (0.176)
6.984 (14.171)
White -0.055 (0.034)
0.654 (1.478)
0.047 (0.106)
5.486 (10.184)
Income $60,001-$70,000 -0.084
(0.054) 0.016
(1.124) -0.047 (0.067)
1.036 (4.789)
$70,001-$80,000 -0.088 (0.057)
-1.414 (1.178)
-0.029 (0.069)
3.300 (5.200)
$80,001-$90,000 -0.058 (0.067)
0.982 (1.331)
0.046 (0.075)
5.086 (5.904)
$90,001-$100,000 -0.121 (0.076)
1.995 (1.405)
-0.003 (0.082)
2.334 (6.095)
$100,001-$110,000 -0.033 (0.055)
1.129 (1.229)
-0.075 (0.074)
7.909 (4.994)
$110,001 and over -0.054 (0.047)
1.138 (1.011)
-0.019 (0.060)
-1.331 (4.561)
N 600 541 541 209 Pseudo R2 0.12 0.03 0.11 0.09 Notes: Column 1 reports the marginal effects of a probit regression of the binary choice of enrollment into the hypothetical 401 (k) plan. Column 2 reports the result of an OLS regression of the contribution rate (as a percentage of annual salary) for those who chose to enroll in the plan. Column 3 reports the marginal effect of a probit regression of the binary choice of staying with the default asset allocation. Column 4 presents the results of an OLS regression of the % of contribution allocated toward stocks if the default is not chosen. In all models, the constant term is included but not shown and standard errors are in parentheses. Respondents were allowed to choose any combination of these race and ethnicity categories. No respondents had income of less than $50,000 by survey design. $50,001-$60,000 is the omitted income category in the regressions. ***Significance at the 1% level, **Significance at the 5% level, *Significance at the 10% level.

33
Table 4: Descriptive Statistics by Condition (Student Sample)
Socioeconomic Explanatory Variables Full Sample (n = 233)
Short Condition (n = 116)
Long Condition (n = 117)
Financial Literacy (# of questions answered correctly; ranges from 0 to 5)
3.87
3.96
3.79
Not employed (=1 if yes) 0.47 0.42 0.52
Age 22.18 22.16 22.19
Male (= 1 if male) 0.45 0.50 0.40
Married (=1 if yes) 0.07 0.06 0.08
Race/ethnicity2
Hispanic 0.17 0.16 0.18
Native American 0.04 0.03 0.04
Asian 0.05 0.06 0.04
Black 0.04 0.04 0.04 White 0.88 0.88 0.88
Notes: Respondents were allowed to choose any combination of these race and ethnicity categories. Table 5: Comparison of Enrollment Behavior across Conditions (Student Sample)
Dependent Variables Full Sample Short Condition Long Condition p-value
Enrollment in 401(k) Plan (= 1 if yes) 0.94 (0.25)
0.92 (0.27)
0.95 (0.22) p = .413
Contribution Rate (% of salary contributed if enrolled)
6.60 (5.68)
6.86 (6.18)
6.35 (5.16) p = .506
Default Allocation (fraction choosing default of 50% stocks and 50% bonds)
0.50 (0.50)
0.55 (0.50)
0.45 (0.50) p = .136
Asset Allocation (% of contribution allocated to stocks if not default)
61.16 (18.35)
61.77 (18.42)
60.67 (18.42) p = .758

34
Table 6: Estimated Marginal Effects on Enrollment Behavior (Student Sample)
Dependent Variable
Explanatory Variables
Enrollment in 401(K) Plan
Contribution Rate
Default Allocation
Percent Stocks
Chosen if Not the Default
Short Form (= 1 if yes) -0.022 (0.032)
0.473 (0.785)
0.121* (0.066)
0.496 (3.618)
Financial Literacy (# of questions answered correctly; ranges from 0 to 5)
0.008 (0.016)
0.728* (0.408)
-0.022 (0.034)
5.155*** (1.871)
Not employed (=1 if yes) -0.014 (0.032)
-0.361 (0.783)
0.088 (0.066)
-0.080 (3.601)
Age 0.005 (0.007)
0.041 (0.098)
-0.009 (0.009)
-0.458 (0.352)
Male (= 1 if male) -0.033 (0.033)
-0.389 (0.803)
-0.107 (0.067)
3.899 (3.570)
Race/ethnicity
Hispanic -0.033 (0.052)
1.771 (1.123)
0.126 (0.094)
-2.184 (5.615)
Native American -0.293 (0.292)
-2.753 (4.318)
-0.112 (0.380)
11.745 (18.538)
Asian -0.388 (0.306)
-1.365 (4.354)
0.122 (0.387)
32.374 (26.408)
Black -0.168 (0.236)
-1.740 (4.799)
-0.361 (0.271)
19.117 (23.977)
White -0.049 (0.059)
-1.143 (4.365)
-0.170 (0.365)
17.745 (22.840)
N 233 218 218 109 Pseudo R2 0.106 0.033 0.060 0.022 Notes: Column 1 reports the marginal effects of a probit regression of the binary choice of (planned) enrollment into the 401 (k) plan. Column 2 reports the result of an OLS regression of the contribution rates (as a percentage of annual salary) for those who chose they would enroll in the plan. Column 3 reports the marginal effect of a probit regression of the binary choice of staying with the default asset allocation. Column 4 presents the results of an OLS regression of the % of contribution allocated toward stocks if the default is not chosen. In all models, constant term is included but not shown and standard errors are in parentheses. Respondents were allowed to choose any combination of these race and ethnicity categories. ***Significance at the 1% level, **Significance at the 5% level, *Significance at the 10% level.

35
Appendix A: Copy of Experimental Instructions Instructions Prior to Receiving Plan Info and Retirement Questions This survey has several parts. In the first part of the survey, we will ask you some hypothetical questions about what decisions you would make regarding an employer-sponsored retirement account. For this part of the survey, please imagine that you recently started a new job at a reputable company at the current salary you have now. Your new employer offers a retirement plan, which you are eligible to participate in if you choose. On the next page we will be providing you with some hypothetical information about the retirement plan that is representative of the type of information that you would actually receive from your employer at the time you start the job. After reading through the information about the plan, we are going to ask you some questions about whether you would enroll in the plan, how much you would contribute to the plan if you enrolled, and how you would invest your contributions. We kindly ask that you carefully consider all the information presented, that you seriously consider the options available, and that you answer honestly based on what decisions you think you would make given the specific information that is provided about the retirement plan. When thinking about what retirement planning decisions you would make for this study, please answer the questions based on what you would do based on your current life circumstances.
401(k) Plan Information – Long Version Condition
Overview As a condition of your employment, you are eligible to save for retirement through our optional, employer-sponsored, 401(k) plan. The 401(k) plan is an individualized defined-contribution plan with employer matching to which you will contribute a percentage of your salary each paycheck. If you participate, you will manage your own personal account and choose from a variety of different investment options that are offered through a company-authorized investment firm. Retirement benefits from participation in the 401(k) are a direct result of any amount contributed by you, the amount we, as your employer, contribute, and any returns you earn on the investments you select.
Enrollment If you desire to enroll in the plan, you will have 30 days from your date of hire to enroll, to choose what percentage of your salary you wish to contribute, and to make your investment choices. If you do not elect to enroll in the 30 day period, you will not be enrolled. If you do enroll but do not elect a contribution percentage, the default of 4% will be chosen for you. Changes to your enrollment status, your contribution percentage, and your investment choices can be made once a year during the open enrollment period. It is generally regarded as a good idea to contribute to an employer-sponsored 401(k) plan when there is matching. You contribution and the addition of the employer match increases the amount you are able to save for retirement.
Investment Options If you choose to enroll, you also will need to choose how to allocate these contributions. Your investment options include several mutual funds. A mutual fund is a collection of stocks and/or bonds. You, as an investor, purchase shares in this fund, and thus own a much more diversified (less risky) portfolio than you would if you purchased individual stocks or bonds. Stocks provide a higher rate of return than bonds on average but are riskier to hold. Bonds generally are considered less risky than stocks but offer a lower
36
rate of return on average. The younger you are, the more risk you can afford to take, and the greater the percentage of stocks your investment portfolio should have. As you get older, you should reduce the percentage of stocks in your portfolio and increase the percentage of bonds. A general rule of thumb is that the percentage of your portfolio invested in bonds, bond funds, or other fixed-income securities should equal your age. If you enroll in the plan, but do not choose how to allocate your contribution across the different investment options, your contributions will be automatically invested 50% in stocks and 50% in bonds.
Matching We, as your employer, will provide a 100% match to any funds that you contribute to the 401(k) plan up to 4% of your salary. For example, if you contribute 3% of your salary, we will contribute another 3% of your salary. If you contribute 4% of your salary, we will contribute 4%. If you contribute 5% of your salary, we will contribute 4% of your salary. The IRS contribution limit for employees is $18,000, and the total employer plus employee contribution limit is $54,000 for 2017. However, if you are aged 50 or older, you are eligible to contribute an additional $6000 above the $18,000 yearly limit, for a maximum contribution of $24,000 in 2017. In order to take full advantage of the employer match, you should contribute 4 percent, but a general rule of thumb is that you should be saving at least 10 percent of your income toward retirement.
Vesting Your contributions and the earnings on your contributions are yours from your first day of employment. However, you must be employed with us at least 3 years to keep the employer contributions and the earnings on those contributions. If you are employed with us for less than 3 years you will forfeit the employer portion of contributions and earnings.
Distribution In general, you are not able to withdraw the money that has accrued in your 401(k) requirement account until one of the following occurs:
1) You die, become disabled, or otherwise discontinue your employment with us. 2) This 401(k) plan is terminated and is not replaced by a successor plan. 3) You reach age 59 ½ or incur a financial hardship.
You will pay income taxes on any distributions from the plan unless you roll over your distribution to another 401(k) or IRA. In addition, if you are under the age of 59 ½ at the time of the distribution, any portion not rolled over may be subject to a 10% penalty.
Tax Benefits In addition to preparing for retirement, contributing to a 401(k) plan has the added benefit of reducing your current federal income taxes because contributions are not subject to income tax at the time they are made. In addition, the earnings on these contributions are tax-deferred, meaning that you will not pay income taxes on the funds in your 401(k) account until they are withdrawn or paid out in retirement.
Disclaimer Investment earnings are not guaranteed. Therefore, you should consider your enrollment, contribution percentage, and investment choices carefully. Factors to consider include your age, your current and future salary, how long you expect to be employed with us, your retirement age, your participation in other retirement plans, your risk tolerance, and your ability to manage your own investments.
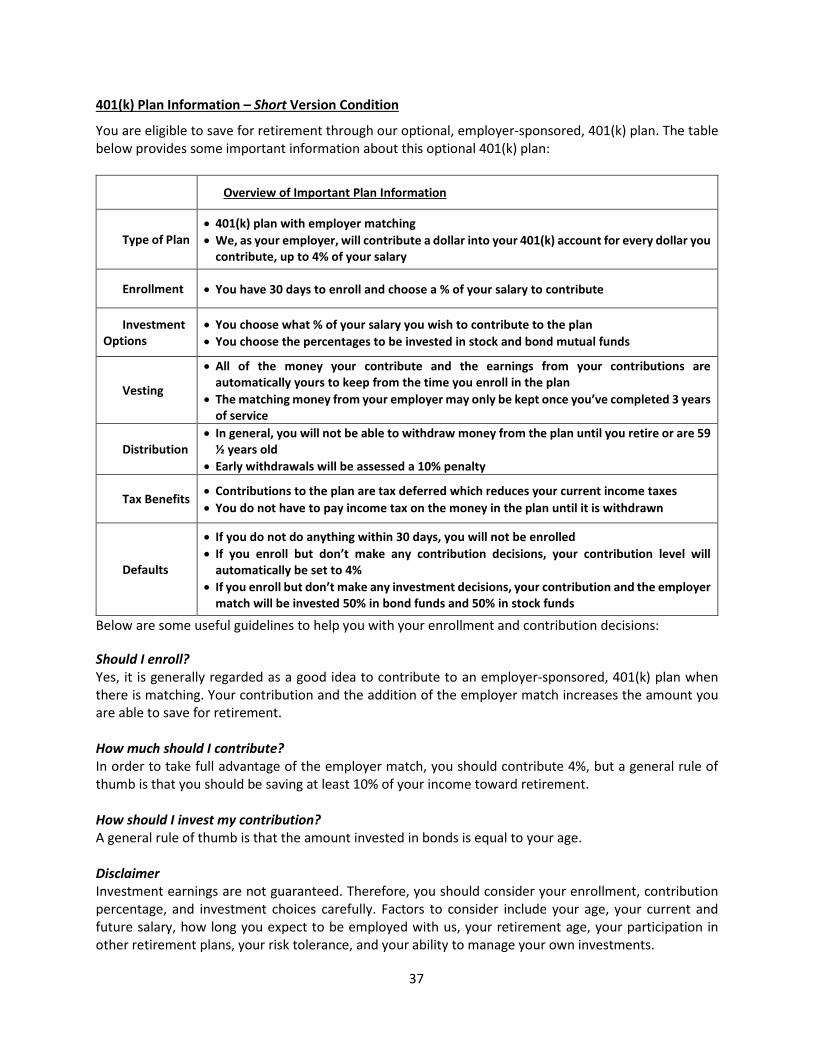
37
401(k) Plan Information – Short Version Condition
You are eligible to save for retirement through our optional, employer-sponsored, 401(k) plan. The table below provides some important information about this optional 401(k) plan:
Overview of Important Plan Information
Type of Plan • 401(k) plan with employer matching • We, as your employer, will contribute a dollar into your 401(k) account for every dollar you
contribute, up to 4% of your salary
Enrollment • You have 30 days to enroll and choose a % of your salary to contribute
Investment Options
• You choose what % of your salary you wish to contribute to the plan • You choose the percentages to be invested in stock and bond mutual funds
Vesting
• All of the money your contribute and the earnings from your contributions are automatically yours to keep from the time you enroll in the plan
• The matching money from your employer may only be kept once you’ve completed 3 years of service
Distribution • In general, you will not be able to withdraw money from the plan until you retire or are 59
½ years old • Early withdrawals will be assessed a 10% penalty
Tax Benefits • Contributions to the plan are tax deferred which reduces your current income taxes • You do not have to pay income tax on the money in the plan until it is withdrawn
Defaults
• If you do not do anything within 30 days, you will not be enrolled • If you enroll but don’t make any contribution decisions, your contribution level will
automatically be set to 4% • If you enroll but don’t make any investment decisions, your contribution and the employer
match will be invested 50% in bond funds and 50% in stock funds
Below are some useful guidelines to help you with your enrollment and contribution decisions:
Should I enroll? Yes, it is generally regarded as a good idea to contribute to an employer-sponsored, 401(k) plan when there is matching. Your contribution and the addition of the employer match increases the amount you are able to save for retirement.
How much should I contribute? In order to take full advantage of the employer match, you should contribute 4%, but a general rule of thumb is that you should be saving at least 10% of your income toward retirement.
How should I invest my contribution? A general rule of thumb is that the amount invested in bonds is equal to your age. Disclaimer Investment earnings are not guaranteed. Therefore, you should consider your enrollment, contribution percentage, and investment choices carefully. Factors to consider include your age, your current and future salary, how long you expect to be employed with us, your retirement age, your participation in other retirement plans, your risk tolerance, and your ability to manage your own investments.

38
Appendix B: Financial Literacy Questions
1. Suppose you have $100 in a savings account earning 2 percent interest a year. After five years, how much would you have?
o More than $102 o Exactly $102 o Less than $102
2. Imagine that the interest rate on your savings account is 1 percent a year and inflation is 2 percent
a year. After one year, would the money in the account buy more than it does today, exactly the same or less than today?
o More o Same o Less
3. If interest rates rise, what will typically happen to bond prices?
o Rise o Fall o Stay the same o No relationship
4. True or False: A 15-year mortgage typically requires higher monthly payments than a 30-year
mortgage but the total interest over the life of the loan will be less. o True o False
5. True or False: Buying a single company’s stock usually provides a safer return than a stock mutual
fund. o True o False