Embed Size (px)
Citation preview
Digital, Ultrasensitive, End-Point Protein Measurements with LargeDynamic Range via Brownian Trapping with DriftShencheng Ge,† Weishan Liu,† Travis Schlappi, and Rustem F. Ismagilov*
Division of Chemistry and Chemical Engineering, California Institute of Technology, 1200 East California Boulevard, Pasadena,California 91125, United States
*S Supporting Information
ABSTRACT: This communication shows that the con-cept of Brownian trapping with drift can be applied toimprove quantitative molecular measurements. It has thepotential to combine the robustness of end-point spatiallyresolved readouts, the ultrasensitivity of digital single-molecule measurements, and the large dynamic range ofqPCR; furthermore, at low concentrations of analytes, itcan provide a direct comparison of the signals arising fromthe analyte and from the background. It relies on thefinding that molecules simultaneously diffusing, drifting(via slow flow), and binding to an array of nonsaturablesurface traps have an exponentially decreasing probabilityof escaping the traps over time and therefore give rise toan exponentially decaying distribution of trapped mole-cules in space. This concept was tested with enzyme andprotein measurements in a microfluidic device.
Digital single-molecule measurements,1 such as digital PCR(dPCR)2 and digital immunoassays,3 compartmentalize
molecules of the target analyte and perform a detection reactionproviding an “on” or “off” signal for each compartment (digitalunit). Analyte concentration is then quantified by counting thesignals and using a Poisson distribution. This methodology hasbeen used in a wide range of applications to detect nucleic acidsand proteins with ultrasensitivity.4
One limitation of digital measurements is that the dynamicrange (i.e., the range between the lowest and highestconcentrations in a sample that can be measured) is limited bythe number of digital units in the assay. Quantitative real-timePCR (qPCR) has a much wider dynamic range because inputconcentration is calculated as an exponential function of theqPCR output; however, this method is less convenient than anend-point measurement. Dynamic range in dPCR can beincreased by introducing very large numbers of digital units(compartments)5 or using digital units of multiple sizes,6 whichincreases the dynamic range by more than ∼100-fold. However,the multivolume strategy is not as effective for digitalimmunoassays that lack the exponential amplification of PCR.One strategy to improve dynamic range for digital immunoassaysinvolves combining the digital readout with the analog readout,which has increased the dynamic range from 2.5 logs to 4.1 logs.7
Such improvement is desired, for example, in assays for thebiomarker glial fibrillary acidic protein (GFAP) in traumaticbrain injury.8
Our goal was to test whether it would be possible to combineinto a single measurement (i) the high sensitivity of digital assays,in which individual molecules give rise to on/off signals, (ii) thebroad dynamic range (∼108) characteristic of a technique likeqPCR, in which large changes in the input concentration give riseto logarithmically smaller changes in the output (Cq); in otherwords, input concentration is calculated as an exponentialfunction of the output; and (iii) a readout in which the inputnumber of molecules is quantified by an end-point spatial signal,which is more robust than the temporal signal from kinetic realtime assays.9
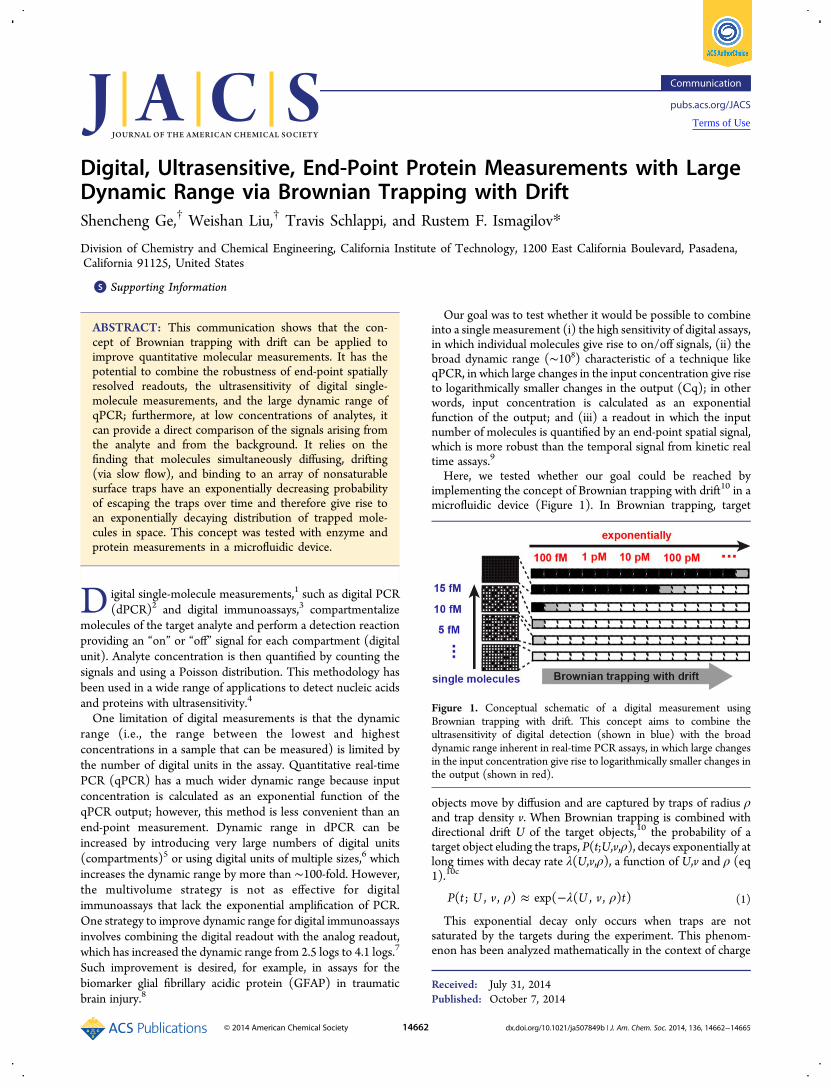
Here, we tested whether our goal could be reached byimplementing the concept of Brownian trapping with drift10 in amicrofluidic device (Figure 1). In Brownian trapping, target
objects move by diffusion and are captured by traps of radius ρand trap density v. When Brownian trapping is combined withdirectional drift U of the target objects,10 the probability of atarget object eluding the traps, P(t;U,v,ρ), decays exponentially atlong times with decay rate λ(U,v,ρ), a function of U,v and ρ (eq1).10c
ρ λ ρ≈ −P t U v U v t( ; , , ) exp( ( , , ) ) (1)
This exponential decay only occurs when traps are notsaturated by the targets during the experiment. This phenom-enon has been analyzed mathematically in the context of charge
Received: July 31, 2014Published: October 7, 2014
Figure 1. Conceptual schematic of a digital measurement usingBrownian trapping with drift. This concept aims to combine theultrasensitivity of digital detection (shown in blue) with the broaddynamic range inherent in real-time PCR assays, in which large changesin the input concentration give rise to logarithmically smaller changes inthe output (shown in red).
Communication
pubs.acs.org/JACS
© 2014 American Chemical Society 14662 dx.doi.org/10.1021/ja507849b | J. Am. Chem. Soc. 2014, 136, 14662−14665
Terms of Use
carriers in semiconductors,10a diffusion-controlled reactions inthe presence of a biasing field,10d and photoluminescence in thepresence of electrical bias,10b but has not been applied tomolecular analyses.To test Brownian trapping in a digital immunoassay (Figure
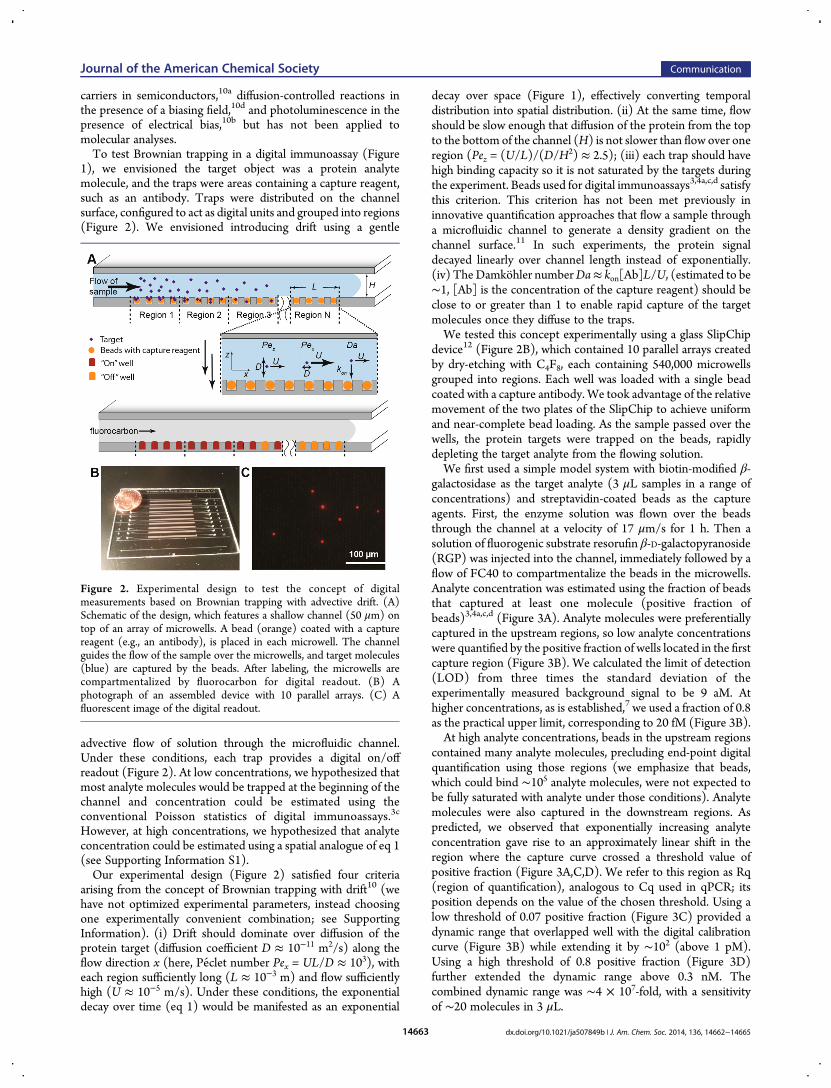
1), we envisioned the target object was a protein analytemolecule, and the traps were areas containing a capture reagent,such as an antibody. Traps were distributed on the channelsurface, configured to act as digital units and grouped into regions(Figure 2). We envisioned introducing drift using a gentle
advective flow of solution through the microfluidic channel.Under these conditions, each trap provides a digital on/offreadout (Figure 2). At low concentrations, we hypothesized thatmost analyte molecules would be trapped at the beginning of thechannel and concentration could be estimated using theconventional Poisson statistics of digital immunoassays.3c
However, at high concentrations, we hypothesized that analyteconcentration could be estimated using a spatial analogue of eq 1(see Supporting Information S1).Our experimental design (Figure 2) satisfied four criteria
arising from the concept of Brownian trapping with drift10 (wehave not optimized experimental parameters, instead choosingone experimentally convenient combination; see SupportingInformation). (i) Drift should dominate over diffusion of theprotein target (diffusion coefficient D ≈ 10−11 m2/s) along theflow direction x (here, Peclet number Pex = UL/D ≈ 103), witheach region sufficiently long (L ≈ 10−3 m) and flow sufficientlyhigh (U ≈ 10−5 m/s). Under these conditions, the exponentialdecay over time (eq 1) would be manifested as an exponential
decay over space (Figure 1), effectively converting temporaldistribution into spatial distribution. (ii) At the same time, flowshould be slow enough that diffusion of the protein from the topto the bottom of the channel (H) is not slower than flow over oneregion (Pez = (U/L)/(D/H2) ≈ 2.5); (iii) each trap should havehigh binding capacity so it is not saturated by the targets duringthe experiment. Beads used for digital immunoassays3,4a,c,d satisfythis criterion. This criterion has not been met previously ininnovative quantification approaches that flow a sample througha microfluidic channel to generate a density gradient on thechannel surface.11 In such experiments, the protein signaldecayed linearly over channel length instead of exponentially.(iv) TheDamkohler numberDa≈ kon[Ab]L/U, (estimated to be∼1, [Ab] is the concentration of the capture reagent) should beclose to or greater than 1 to enable rapid capture of the targetmolecules once they diffuse to the traps.We tested this concept experimentally using a glass SlipChip
device12 (Figure 2B), which contained 10 parallel arrays createdby dry-etching with C4F8, each containing 540,000 microwellsgrouped into regions. Each well was loaded with a single beadcoated with a capture antibody. We took advantage of the relativemovement of the two plates of the SlipChip to achieve uniformand near-complete bead loading. As the sample passed over thewells, the protein targets were trapped on the beads, rapidlydepleting the target analyte from the flowing solution.We first used a simple model system with biotin-modified β-
galactosidase as the target analyte (3 μL samples in a range ofconcentrations) and streptavidin-coated beads as the captureagents. First, the enzyme solution was flown over the beadsthrough the channel at a velocity of 17 μm/s for 1 h. Then asolution of fluorogenic substrate resorufin β-D-galactopyranoside(RGP) was injected into the channel, immediately followed by aflow of FC40 to compartmentalize the beads in the microwells.Analyte concentration was estimated using the fraction of beadsthat captured at least one molecule (positive fraction ofbeads)3,4a,c,d (Figure 3A). Analyte molecules were preferentiallycaptured in the upstream regions, so low analyte concentrationswere quantified by the positive fraction of wells located in the firstcapture region (Figure 3B). We calculated the limit of detection(LOD) from three times the standard deviation of theexperimentally measured background signal to be 9 aM. Athigher concentrations, as is established,7 we used a fraction of 0.8as the practical upper limit, corresponding to 20 fM (Figure 3B).At high analyte concentrations, beads in the upstream regions
contained many analyte molecules, precluding end-point digitalquantification using those regions (we emphasize that beads,which could bind ∼105 analyte molecules, were not expected tobe fully saturated with analyte under those conditions). Analytemolecules were also captured in the downstream regions. Aspredicted, we observed that exponentially increasing analyteconcentration gave rise to an approximately linear shift in theregion where the capture curve crossed a threshold value ofpositive fraction (Figure 3A,C,D). We refer to this region as Rq(region of quantification), analogous to Cq used in qPCR; itsposition depends on the value of the chosen threshold. Using alow threshold of 0.07 positive fraction (Figure 3C) provided adynamic range that overlapped well with the digital calibrationcurve (Figure 3B) while extending it by ∼102 (above 1 pM).Using a high threshold of 0.8 positive fraction (Figure 3D)further extended the dynamic range above 0.3 nM. Thecombined dynamic range was ∼4 × 10⁷-fold, with a sensitivityof ∼20 molecules in 3 μL.
Figure 2. Experimental design to test the concept of digitalmeasurements based on Brownian trapping with advective drift. (A)Schematic of the design, which features a shallow channel (50 μm) ontop of an array of microwells. A bead (orange) coated with a capturereagent (e.g., an antibody), is placed in each microwell. The channelguides the flow of the sample over the microwells, and target molecules(blue) are captured by the beads. After labeling, the microwells arecompartmentalized by fluorocarbon for digital readout. (B) Aphotograph of an assembled device with 10 parallel arrays. (C) Afluorescent image of the digital readout.
Journal of the American Chemical Society Communication
dx.doi.org/10.1021/ja507849b | J. Am. Chem. Soc. 2014, 136, 14662−1466514663
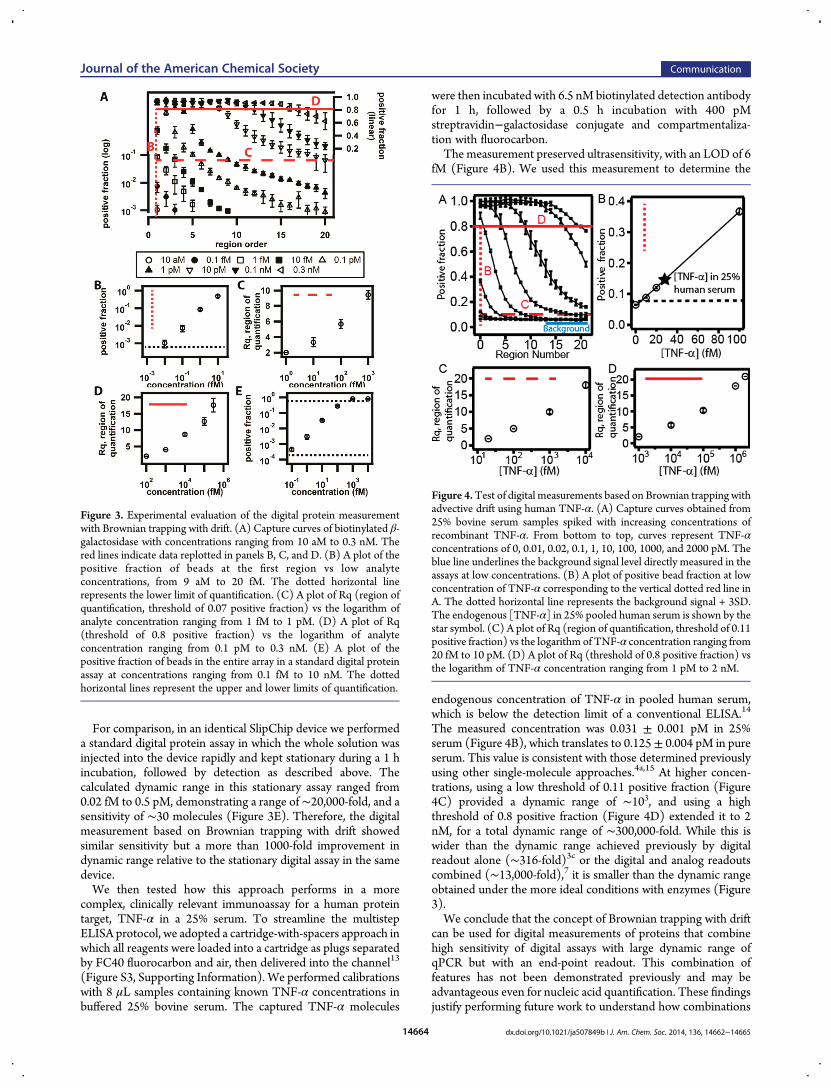
For comparison, in an identical SlipChip device we performeda standard digital protein assay in which the whole solution wasinjected into the device rapidly and kept stationary during a 1 hincubation, followed by detection as described above. Thecalculated dynamic range in this stationary assay ranged from0.02 fM to 0.5 pM, demonstrating a range of ∼20,000-fold, and asensitivity of ∼30 molecules (Figure 3E). Therefore, the digitalmeasurement based on Brownian trapping with drift showedsimilar sensitivity but a more than 1000-fold improvement indynamic range relative to the stationary digital assay in the samedevice.We then tested how this approach performs in a more
complex, clinically relevant immunoassay for a human proteintarget, TNF-α in a 25% serum. To streamline the multistepELISA protocol, we adopted a cartridge-with-spacers approach inwhich all reagents were loaded into a cartridge as plugs separatedby FC40 fluorocarbon and air, then delivered into the channel13
(Figure S3, Supporting Information). We performed calibrationswith 8 μL samples containing known TNF-α concentrations inbuffered 25% bovine serum. The captured TNF-α molecules
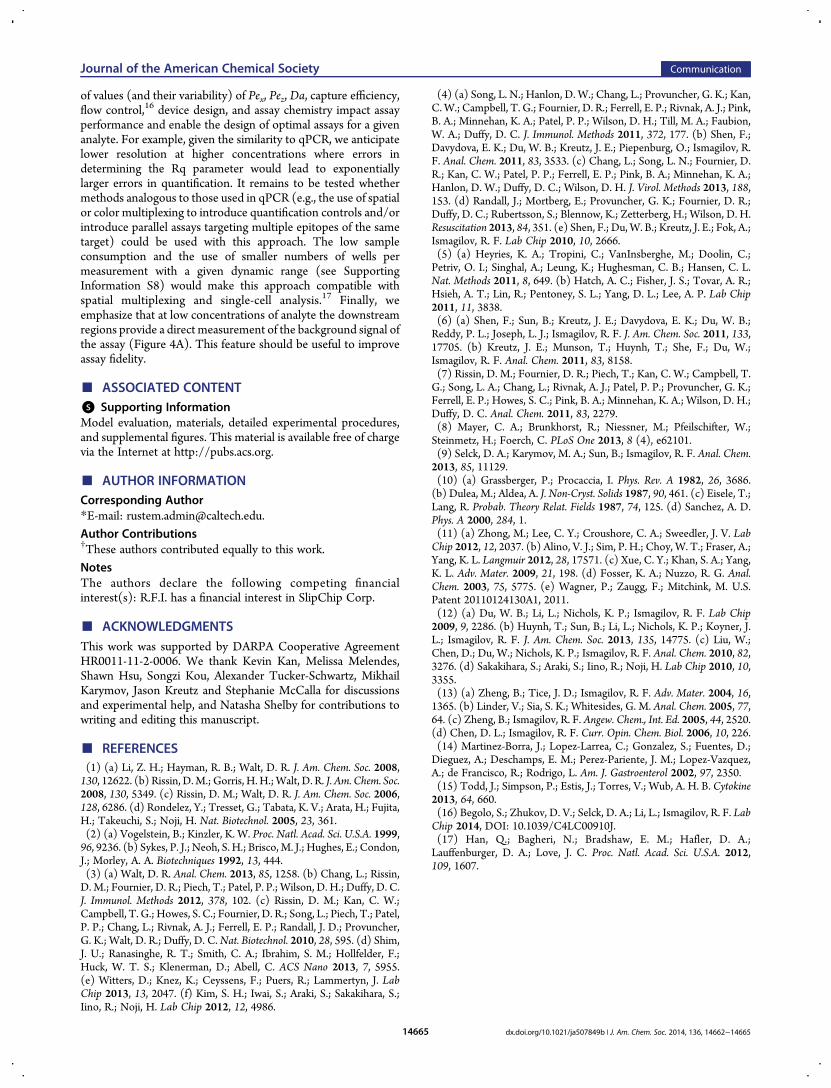
were then incubated with 6.5 nM biotinylated detection antibodyfor 1 h, followed by a 0.5 h incubation with 400 pMstreptravidin−galactosidase conjugate and compartmentaliza-tion with fluorocarbon.The measurement preserved ultrasensitivity, with an LOD of 6
fM (Figure 4B). We used this measurement to determine the
endogenous concentration of TNF-α in pooled human serum,which is below the detection limit of a conventional ELISA.14
The measured concentration was 0.031 ± 0.001 pM in 25%serum (Figure 4B), which translates to 0.125± 0.004 pM in pureserum. This value is consistent with those determined previouslyusing other single-molecule approaches.4a,15 At higher concen-trations, using a low threshold of 0.11 positive fraction (Figure4C) provided a dynamic range of ∼103, and using a highthreshold of 0.8 positive fraction (Figure 4D) extended it to 2nM, for a total dynamic range of ∼300,000-fold. While this iswider than the dynamic range achieved previously by digitalreadout alone (∼316-fold)3c or the digital and analog readoutscombined (∼13,000-fold),7 it is smaller than the dynamic rangeobtained under the more ideal conditions with enzymes (Figure3).We conclude that the concept of Brownian trapping with drift
can be used for digital measurements of proteins that combinehigh sensitivity of digital assays with large dynamic range ofqPCR but with an end-point readout. This combination offeatures has not been demonstrated previously and may beadvantageous even for nucleic acid quantification. These findingsjustify performing future work to understand how combinations
Figure 3. Experimental evaluation of the digital protein measurementwith Brownian trapping with drift. (A) Capture curves of biotinylated β-galactosidase with concentrations ranging from 10 aM to 0.3 nM. Thered lines indicate data replotted in panels B, C, and D. (B) A plot of thepositive fraction of beads at the first region vs low analyteconcentrations, from 9 aM to 20 fM. The dotted horizontal linerepresents the lower limit of quantification. (C) A plot of Rq (region ofquantification, threshold of 0.07 positive fraction) vs the logarithm ofanalyte concentration ranging from 1 fM to 1 pM. (D) A plot of Rq(threshold of 0.8 positive fraction) vs the logarithm of analyteconcentration ranging from 0.1 pM to 0.3 nM. (E) A plot of thepositive fraction of beads in the entire array in a standard digital proteinassay at concentrations ranging from 0.1 fM to 10 nM. The dottedhorizontal lines represent the upper and lower limits of quantification.
Figure 4.Test of digital measurements based on Brownian trapping withadvective drift using human TNF-α. (A) Capture curves obtained from25% bovine serum samples spiked with increasing concentrations ofrecombinant TNF-α. From bottom to top, curves represent TNF-αconcentrations of 0, 0.01, 0.02, 0.1, 1, 10, 100, 1000, and 2000 pM. Theblue line underlines the background signal level directly measured in theassays at low concentrations. (B) A plot of positive bead fraction at lowconcentration of TNF-α corresponding to the vertical dotted red line inA. The dotted horizontal line represents the background signal + 3SD.The endogenous [TNF-α] in 25% pooled human serum is shown by thestar symbol. (C) A plot of Rq (region of quantification, threshold of 0.11positive fraction) vs the logarithm of TNF-α concentration ranging from20 fM to 10 pM. (D) A plot of Rq (threshold of 0.8 positive fraction) vsthe logarithm of TNF-α concentration ranging from 1 pM to 2 nM.
Journal of the American Chemical Society Communication
dx.doi.org/10.1021/ja507849b | J. Am. Chem. Soc. 2014, 136, 14662−1466514664
of values (and their variability) of Pex, Pez, Da, capture efficiency,flow control,16 device design, and assay chemistry impact assayperformance and enable the design of optimal assays for a givenanalyte. For example, given the similarity to qPCR, we anticipatelower resolution at higher concentrations where errors indetermining the Rq parameter would lead to exponentiallylarger errors in quantification. It remains to be tested whethermethods analogous to those used in qPCR (e.g., the use of spatialor color multiplexing to introduce quantification controls and/orintroduce parallel assays targeting multiple epitopes of the sametarget) could be used with this approach. The low sampleconsumption and the use of smaller numbers of wells permeasurement with a given dynamic range (see SupportingInformation S8) would make this approach compatible withspatial multiplexing and single-cell analysis.17 Finally, weemphasize that at low concentrations of analyte the downstreamregions provide a direct measurement of the background signal ofthe assay (Figure 4A). This feature should be useful to improveassay fidelity.
■ ASSOCIATED CONTENT*S Supporting InformationModel evaluation, materials, detailed experimental procedures,and supplemental figures. This material is available free of chargevia the Internet at http://pubs.acs.org.
■ AUTHOR INFORMATIONCorresponding Author*E-mail: [email protected] Contributions†These authors contributed equally to this work.NotesThe authors declare the following competing financialinterest(s): R.F.I. has a financial interest in SlipChip Corp.
■ ACKNOWLEDGMENTSThis work was supported by DARPA Cooperative AgreementHR0011-11-2-0006. We thank Kevin Kan, Melissa Melendes,Shawn Hsu, Songzi Kou, Alexander Tucker-Schwartz, MikhailKarymov, Jason Kreutz and Stephanie McCalla for discussionsand experimental help, and Natasha Shelby for contributions towriting and editing this manuscript.
■ REFERENCES(1) (a) Li, Z. H.; Hayman, R. B.; Walt, D. R. J. Am. Chem. Soc. 2008,130, 12622. (b) Rissin, D.M.; Gorris, H. H.;Walt, D. R. J. Am. Chem. Soc.2008, 130, 5349. (c) Rissin, D. M.; Walt, D. R. J. Am. Chem. Soc. 2006,128, 6286. (d) Rondelez, Y.; Tresset, G.; Tabata, K. V.; Arata, H.; Fujita,H.; Takeuchi, S.; Noji, H. Nat. Biotechnol. 2005, 23, 361.(2) (a) Vogelstein, B.; Kinzler, K. W. Proc. Natl. Acad. Sci. U.S.A. 1999,96, 9236. (b) Sykes, P. J.; Neoh, S. H.; Brisco, M. J.; Hughes, E.; Condon,J.; Morley, A. A. Biotechniques 1992, 13, 444.(3) (a) Walt, D. R. Anal. Chem. 2013, 85, 1258. (b) Chang, L.; Rissin,D. M.; Fournier, D. R.; Piech, T.; Patel, P. P.; Wilson, D. H.; Duffy, D. C.J. Immunol. Methods 2012, 378, 102. (c) Rissin, D. M.; Kan, C. W.;Campbell, T. G.; Howes, S. C.; Fournier, D. R.; Song, L.; Piech, T.; Patel,P. P.; Chang, L.; Rivnak, A. J.; Ferrell, E. P.; Randall, J. D.; Provuncher,G. K.; Walt, D. R.; Duffy, D. C.Nat. Biotechnol. 2010, 28, 595. (d) Shim,J. U.; Ranasinghe, R. T.; Smith, C. A.; Ibrahim, S. M.; Hollfelder, F.;Huck, W. T. S.; Klenerman, D.; Abell, C. ACS Nano 2013, 7, 5955.(e) Witters, D.; Knez, K.; Ceyssens, F.; Puers, R.; Lammertyn, J. LabChip 2013, 13, 2047. (f) Kim, S. H.; Iwai, S.; Araki, S.; Sakakihara, S.;Iino, R.; Noji, H. Lab Chip 2012, 12, 4986.
(4) (a) Song, L. N.; Hanlon, D. W.; Chang, L.; Provuncher, G. K.; Kan,C.W.; Campbell, T. G.; Fournier, D. R.; Ferrell, E. P.; Rivnak, A. J.; Pink,B. A.; Minnehan, K. A.; Patel, P. P.; Wilson, D. H.; Till, M. A.; Faubion,W. A.; Duffy, D. C. J. Immunol. Methods 2011, 372, 177. (b) Shen, F.;Davydova, E. K.; Du, W. B.; Kreutz, J. E.; Piepenburg, O.; Ismagilov, R.F. Anal. Chem. 2011, 83, 3533. (c) Chang, L.; Song, L. N.; Fournier, D.R.; Kan, C. W.; Patel, P. P.; Ferrell, E. P.; Pink, B. A.; Minnehan, K. A.;Hanlon, D. W.; Duffy, D. C.; Wilson, D. H. J. Virol. Methods 2013, 188,153. (d) Randall, J.; Mortberg, E.; Provuncher, G. K.; Fournier, D. R.;Duffy, D. C.; Rubertsson, S.; Blennow, K.; Zetterberg, H.; Wilson, D. H.Resuscitation 2013, 84, 351. (e) Shen, F.; Du,W. B.; Kreutz, J. E.; Fok, A.;Ismagilov, R. F. Lab Chip 2010, 10, 2666.(5) (a) Heyries, K. A.; Tropini, C.; VanInsberghe, M.; Doolin, C.;Petriv, O. I.; Singhal, A.; Leung, K.; Hughesman, C. B.; Hansen, C. L.Nat. Methods 2011, 8, 649. (b) Hatch, A. C.; Fisher, J. S.; Tovar, A. R.;Hsieh, A. T.; Lin, R.; Pentoney, S. L.; Yang, D. L.; Lee, A. P. Lab Chip2011, 11, 3838.(6) (a) Shen, F.; Sun, B.; Kreutz, J. E.; Davydova, E. K.; Du, W. B.;Reddy, P. L.; Joseph, L. J.; Ismagilov, R. F. J. Am. Chem. Soc. 2011, 133,17705. (b) Kreutz, J. E.; Munson, T.; Huynh, T.; She, F.; Du, W.;Ismagilov, R. F. Anal. Chem. 2011, 83, 8158.(7) Rissin, D. M.; Fournier, D. R.; Piech, T.; Kan, C. W.; Campbell, T.G.; Song, L. A.; Chang, L.; Rivnak, A. J.; Patel, P. P.; Provuncher, G. K.;Ferrell, E. P.; Howes, S. C.; Pink, B. A.; Minnehan, K. A.; Wilson, D. H.;Duffy, D. C. Anal. Chem. 2011, 83, 2279.(8) Mayer, C. A.; Brunkhorst, R.; Niessner, M.; Pfeilschifter, W.;Steinmetz, H.; Foerch, C. PLoS One 2013, 8 (4), e62101.(9) Selck, D. A.; Karymov, M. A.; Sun, B.; Ismagilov, R. F. Anal. Chem.2013, 85, 11129.(10) (a) Grassberger, P.; Procaccia, I. Phys. Rev. A 1982, 26, 3686.(b) Dulea, M.; Aldea, A. J. Non-Cryst. Solids 1987, 90, 461. (c) Eisele, T.;Lang, R. Probab. Theory Relat. Fields 1987, 74, 125. (d) Sanchez, A. D.Phys. A 2000, 284, 1.(11) (a) Zhong, M.; Lee, C. Y.; Croushore, C. A.; Sweedler, J. V. LabChip 2012, 12, 2037. (b) Alino, V. J.; Sim, P. H.; Choy, W. T.; Fraser, A.;Yang, K. L. Langmuir 2012, 28, 17571. (c) Xue, C. Y.; Khan, S. A.; Yang,K. L. Adv. Mater. 2009, 21, 198. (d) Fosser, K. A.; Nuzzo, R. G. Anal.Chem. 2003, 75, 5775. (e) Wagner, P.; Zaugg, F.; Mitchink, M. U.S.Patent 20110124130A1, 2011.(12) (a) Du, W. B.; Li, L.; Nichols, K. P.; Ismagilov, R. F. Lab Chip2009, 9, 2286. (b) Huynh, T.; Sun, B.; Li, L.; Nichols, K. P.; Koyner, J.L.; Ismagilov, R. F. J. Am. Chem. Soc. 2013, 135, 14775. (c) Liu, W.;Chen, D.; Du, W.; Nichols, K. P.; Ismagilov, R. F. Anal. Chem. 2010, 82,3276. (d) Sakakihara, S.; Araki, S.; Iino, R.; Noji, H. Lab Chip 2010, 10,3355.(13) (a) Zheng, B.; Tice, J. D.; Ismagilov, R. F. Adv. Mater. 2004, 16,1365. (b) Linder, V.; Sia, S. K.; Whitesides, G. M. Anal. Chem. 2005, 77,64. (c) Zheng, B.; Ismagilov, R. F. Angew. Chem., Int. Ed. 2005, 44, 2520.(d) Chen, D. L.; Ismagilov, R. F. Curr. Opin. Chem. Biol. 2006, 10, 226.(14) Martinez-Borra, J.; Lopez-Larrea, C.; Gonzalez, S.; Fuentes, D.;Dieguez, A.; Deschamps, E. M.; Perez-Pariente, J. M.; Lopez-Vazquez,A.; de Francisco, R.; Rodrigo, L. Am. J. Gastroenterol 2002, 97, 2350.(15) Todd, J.; Simpson, P.; Estis, J.; Torres, V.; Wub, A. H. B. Cytokine2013, 64, 660.(16) Begolo, S.; Zhukov, D. V.; Selck, D. A.; Li, L.; Ismagilov, R. F. LabChip 2014, DOI: 10.1039/C4LC00910J.(17) Han, Q.; Bagheri, N.; Bradshaw, E. M.; Hafler, D. A.;Lauffenburger, D. A.; Love, J. C. Proc. Natl. Acad. Sci. U.S.A. 2012,109, 1607.
Journal of the American Chemical Society Communication
dx.doi.org/10.1021/ja507849b | J. Am. Chem. Soc. 2014, 136, 14662−1466514665


![Ultrasensitive detection of Ebola matrix protein in a ...Ultrasensitive detection of Ebola matrix protein in a memristor mode Bergoi Ibarlucea1,2 ( ), Teuku Fawzul Akbar ... [11–13]](https://img.pdfslide.us/doc/110x75/60ed508cc4aaa06c922e7020/ultrasensitive-detection-of-ebola-matrix-protein-in-a-ultrasensitive-detection.jpg)