Embed Size (px)
Citation preview

1/9/2013
1
Digital MammographyQuality Control
Advanced Health Education Center
Quality Assurance
• All-encompassing management program used toensure excellence in healthcare through thesystematic collection and evaluation of data.
• Patient scheduling, management techniques,departmental policies and procedures, technicaleffectiveness and efficiency, in -service educationand image interpretation
Quality Control
• Quality control is the part of the qualityassurance program that deals withtechniques used in monitoring andmaintenance of the technical elements ofthe systems that affect the quality of theimage.• Level I – Noninvasive and Simple• Level II – Noninvasive and Complex• Level III – Invasive and Complex
Quality Control
• Quality Control are simple checks that ensurethe digital system is operating to the standardsthat is was designed to do.
• The system is designed to detect any changesin settings that could compromise imagequality, and deterioration in the equipmentperformance over a period of time.
How is QC broken down for FFDM
• Indirect Conversion/Direct Conversion• Also per each manufacturer specific• FDA approved QC manual per Manufacturer.• Updated version # of QC Tests• State specific also
Why Quality Control
• Reduce exposure to patients andpersonnel• Consistent image quality• Detect and correct for potential
problems, before they impact imagequality

1/9/2013
2
Why quality control?
• Determination of what is “Normal”• Detection of what is “Abnormal”• Understanding of how to return to
“Normal” from “abnormal”.• In particular, in FFDM, how do you know you
are seeing is what it is suppose to be.
Universal QC for Digital Mammography
Not currently available
ACR is working on a universal manual FFDM
Currently manufacturer specific
We will discuss this at the end of class
Quality Control Tests-Other Modalities900.12(e)(6)
• “For systems with image receptor modalities otherthan screen-film, the quality assurance program shallbe substantially the same as the quality assuranceprogram recommended by the image receptormanufacturer, except that the maximum allowabledose shall not exceed the maximum allowable dosefor screen-film systems in paragraph (e)(5)(vi) of thissection”
Note:
• –For new unit: Must use most currentversion
• –For renewal unit: Can use olderversion (version used when testedpreviously)
Technologists Quality Control Procedures GE
• 1. Monitor Cleaning• 2. Viewing Conditions for the RWS• 3. Flat field and Image Quality Checks• 4. Phantom Image Quality and CNR• 5. Viewbox and Viewing Conditions Test• 6. MTF Measurement• 7. AOP Mode and SNR Check
Technologists Quality ControlProcedures Lorad Selenia
• 1. Laser Printer Quality Assurance• 2. Viewboxes and Viewing Conditions• 3. Softcopy Workstation QC• 4. Artifact Evaluation• 5. Signal-to-Noise and Contrast-to-Noise
Measurements

1/9/2013
3
Lorad Selenia™
• 6. Phantom Image• 7. Detector Flat-Field Calibration• 8. Visual Checklist• 9. Repeat Analysis• 10. Compression
Siemens Mammomat Novation QC
• Detector Calibration-Weekly and as needed• Artifact Detection-Weekly and as needed• Phantom image quality-daily-image phantom and
score• SNR and CNR Measurements-Weekly• Printer Check-when clinical images are to be printed-
Daily• Repeat Analysis-quarterly• Compression force-semi-annually
Technologists Quality ControlProcedures Fischer Senoscan
• 1. Detector Calibration and Flat Field Test• 2. Phantom Image Acquisition Test• 3. Phantom Image Quality Test• 4. System Resolution/Scan Speed Uniformity• 5. Image Display Monitor(s) Test• 6. System Operations• 7. Repeat Rate• 8. Compression• 9. Printer
MQSA Inspections and Selenia QC Manuals
Inspectors were requiring facility’s with Hologic Seleniaunits that they must have and work from the mostcurrent Selenia QC manual released by Hologic.
This is a misunderstanding and not a requirement. It isnot necessary to have a copy of the latest QC manualfor each system. There should be no penalties tofacilities using the QC manual that was shipped withtheir Selenia system or with subsequent systemupgrades.
Basis for this
• To date, all revisions to the Selenia QCmanuals have not increased any QC testperformance standard or action levelfrom those stated in earlier versions. Ifthis were to change in the future, Hologicwould first need to obtain FDA approvaland then notify all affected customers
Basis for this
• To date, none of the softwareupgrades have affected QCperformance criteria or action levels.If this were to change in the future,Hologic must notify the FDA and allaffected customers.

1/9/2013
4
Basis for this
• New system or upgrade to existing system-thenewest revision of the QC manual applicableto the model (tungsten or Molybdenum) isincluded.• If a site has multiple Selenia systems, different
revisions of the QC manual may be in placebased on the age of the systems and thestatus of system upgrades.
The facility can chose how toperform the QC procedures:
• Use the QC manual provided with theindividual Selenia system or systemupgrade.
• For the sake of simplicity choose tostandardize QC across all systems if usingthe same model type (tungsten or moly).
Hologic
If the facility has both tungsten and moly systems, theymust use the QC manual applicable to their model
Hologic has confirmed this understanding with the FDAand if a facility is told by an inspector they must haveand follow the latest revision they should ask theinspector to call the FDA hotline for clarification
GE Senograph DSQuality Control Procedures• Same as done on GE Senograph 2000D
EXCEPTAll QC tests are done internally- there is not
mathematical calculations done by thetechnologist, just documentation of results.
Prior to QC Procedures
• The detector temperature must be stabilized.• The unit must be turned on for a period of
time to get the detector temperatureappropriate.
Monitor Cleaning-GE
• Frequency: Daily/days when clinical image acquisitionor reviews are planned
Viewing Conditions Check for RWS-GE
Frequency: Daily/days whenimage reviews are planned
Objective: Ensure optimalviewing conditions

1/9/2013
5
Monitor Cleaning
• Do not use cleaning agents which attack the surface,such as petroleum (mineral) spirits.• The front panel is extremely sensitive to mechanical
damage. Avoid all scratches, knocks, etc.• Do not apply the cleaning liquid directly to the
monitor housing or screen.• Do not allow the cleaning liquid to enter the monitor
housing; be sure to dampen the cloth sparingly
Monitor Cleaning
• Daily
• Ensures good image review conditions
• Lightly dampen cloth with water/solution
• Clean with cloth or cleaning tissue toremove dust, finger prints and othermarks
• Record completion in book
Viewing Conditions Check ForThe Reading Rooms
• Each room has a data form that is filled out bythe Medical Physicist for the roomconfiguration.
• The medical physicist looks at the normalvalue of the ambient light in the room andmeasures it.
• If changes are made in the room such as smalllamp, new doors, room curtains, blinds, etc…
Flat Field-GE
• Frequency: Weekly• Objective: Five tests performed during Flat Field
test.• 1)brightness uniformity, 2)high frequency
modulation (HFM), 3)SNR uniformity, 4)bad ROI,5)bad pixel verification.
• First day of week/ first thing in the morning- imagereceptor retains ghost images taken during the week.• Technical factors-automatic• Two exposures
Brightness Uniformity
•Checks the magnitude oflow frequency structures orlarge shapes in defects
High Frequency Modulation(HFM)
•Looks at the magnitude ofhigh frequency structuresor small defects

1/9/2013
6
Signal-to-noise ratio (SNR)
•Uniformity, which is thevariation of the SNR overthe whole image
Bad Pixel Verification
•Measures the number ofpixels having signals muchdifferent from those oftheir neighbors and thedensity of the bad pixels
Bad Regions Of Interest (ROI)
•Counts the number ofregions of interestcontaining more thantwo bad pixels
The Ideal response of the Detector is auniform image with the following…
•No large or small defects
•No pixel having a signal muchhigher or much lower than itsneighbors.
• A uniform signal-to-noise ratio
If Test Fails look at the following…
• The compression paddle and grid cover havebeen removed• No object except the Flat Field test object is in
the field• The collimator is open to the largest field size• The tube arm angle is at “O” degrees• The Flat field test object is clean and free from
scratches or other imperfections• The surface of the image receptor is clean• The Flat Field test object fully covers the FOV
of the image receptor
TO MAKE SURE THAT THE IMAGE IS FREEOF UNDESIRABLE ARTIFACTS
(LORAD)
Artifact Evaluation

1/9/2013
7
Artifact Evaluation
• Select the First Flat Field view from the examination screenwindow on the Acquisition Workstation.
• Acquired an exposure• Make sure to change the Center and Width numbers to make
it darker• Do two exposures with Mo Filter and the second in Rhodium
Filter or one with Tungston filter and second image with Ag.Depends on what system you have.
• Pan across the whole image to look for artifacts. Movezoom/pan like your mowing the lawn.
• When image displays record the mAs value
Activate the Full Zoom/pan functionon the preview screen
If you want to establish a Mean PixelValue, click the ROI in preview toolsand click User draw. Then choose 64X 64 from the dropdown list. Clickthe center of the flat field image andthe ROI Statistics dialog box willappear. Take the Mean Pixel Valuewith the first three numbers for astart for the Center Setting.
An average center number is around500 and the average width setting isaround 600. But make sure it isn’ttoo dark or too light because therewill be artifacts that are missed. Soyou want a dark gray look to theimage
• If artifacts are present rotate the acrylic 180° andrepeat procedure• If the appearance of the artifacts changes location
between the two images they are in the phantomand there is not a system problem.• If the artifacts persist in the same location there is a
problem in either the x-ray system or the digitalreceptor
Case Study forFlat field check……
1/9/2013
8
DICOM Printer Artifact Evaluation
• Print a flat field pattern to the printer. Do not take aflat field image is not appropriate for this test.• Inspect the laser film for artifacts• If multiple FFDM’s only do this test from one of the
machines and use the same machine every time forconsistency.• After you have looked for artifacts on the film, then
record on the form.
Performance Criteria
• Artifacts traced to the digital imagereceptor or the x-ray unit shall beeliminated by a qualified serviceengineer within 30 days of the test
Siemens Artifact Detection
Objective-to determine if the detector is dusty,damaged or has other artifacts• Insert collimator mounted plexi phantom (40 mm
thick)• Insert compression plate simulator• Choose procedure QC raw• 28 kVp 90 mAs• Look at image for clinical relevant artifacts by
magnifying to full resolution• If the image has artifacts do calibration and repeat
Performance Criteria
• No clinically relevant artifacts should be seenon the image• Must be corrected prior to further
examinations
Inspection News GE FFDMPhantom QC RequirementsClarification of GE FFDM Phantom QC testing
requirements• QC manuals have phantom being done on
both the AWS monitor and the printer weekly• FDA contacted GE to clarify the printer
requirement if a facility only does soft copyinterpretation
GE Phantom
• GE-does not intend for a facility to perform routineweekly phantom QC on devices that are not used forimage interpretation• If a facility does its final interpretations using
softcopy only, it does not have to perform routineweekly phantom test evaluation using the printer.• The facility must still perform a phantom QC test
prior to printing final interpretation quality images.
1/9/2013
9
Phantom Image Quality on AWS, RWS,and Printer and CNR Test-GE
• Frequency: Weekly after establishing thebaseline for the Contrast-to-Noise Ratio (CNR)test.• Only after successful completion of the Flat
Field test.• Phantom Image quality test of the printer-run
only after successful completion of the dailyQC test for the printer
Phantom Image Quality
• Objective: CNR (Contrast to Noise Ratio) is ameasure of the detectors ability to distinguishbetween objects in an image and the image noise• Ensure adequate/consistent quality of images
acquired by the detector and displayed on the AWSand RWS monitors and the printer.• Contrast Resolution is the ability of an imaging
system to distinguish similarities of objects in animage.
Analog Phantom QC/DigitalPhantom QC Differences
• In film-screen mammography imagingsystems the phantom image test isfor the consistency of image contrastas represented by the density difference(DD) between the image of anadded test object (4mm thick acrylic disk)and the background density of the phantom.
Analog Phantom QC/DigitalPhantom QC Differences
• In GE’s digital imaging the relative level of asignal or contrast to the image noise is the morerelevant measure of image quality.Therefore, the measure of consistencyof CNR is used as a replacementfor the measure of consistency of DD.
• B. Change in CNR Measurement
• Operating level for the CNR ratio measurement mustbe established, CNRol.• 5 consecutive days to determine a 5 day average and
a CNR operating level.• Subsequent weekly measurements are compared to
this operating level.
CNR
• The following events require re-establishment ofthe CNRol:
• replacement of the x-ray tube• replacement of the Mo x-ray beam filter• replacement of the compression paddle• replacement of the phantom• replacement of the anti-scatter grid• replacement of the detector• re-calibration of detector gain
1/9/2013
10
Why the raw image?
• Tests depend on using numerical valuesthat are proportional to the amount of x-rays detected.
• Raw images provide image numbers thatbehave in the above manner.• Processed images are good for viewing but
are useless for the numerical tests.• The values used are ones that best
represent the incidental x-ray beam andthe response of the detector when rawimage is used.
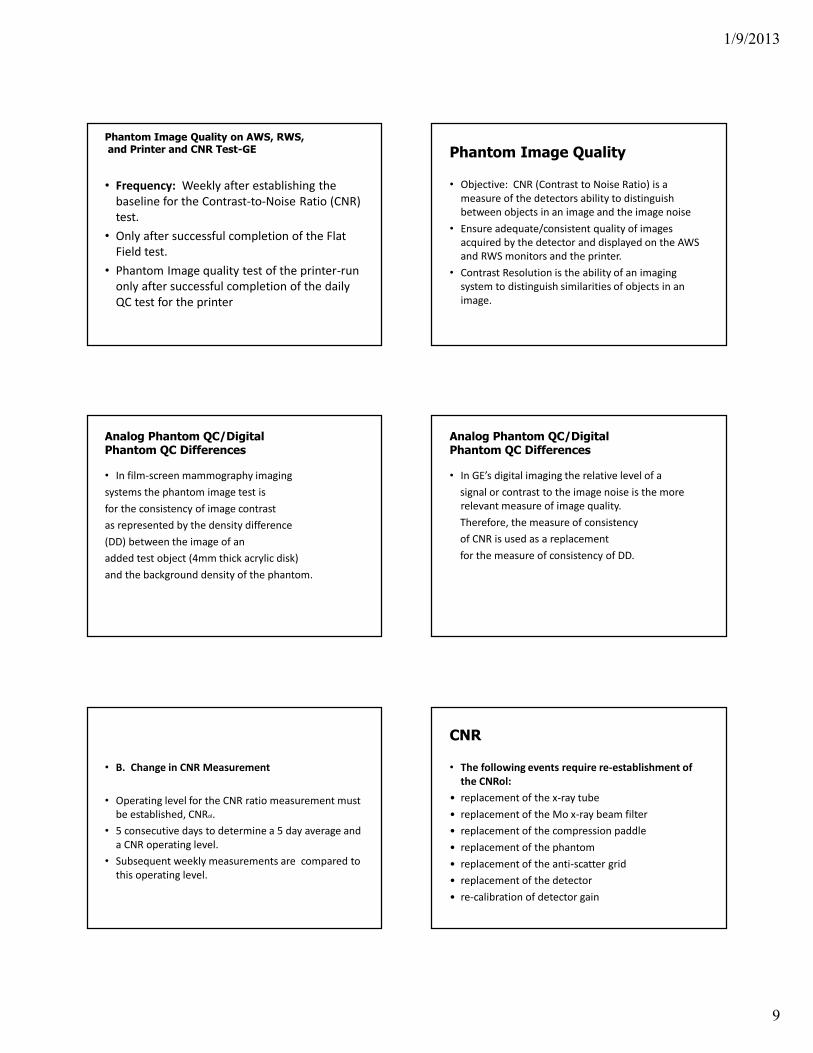
CNR
• B. CNR measurement change continued• Open the acquired raw image, zoom factor of 1, adjust
the WW and WL between 125 and 175 to achieve thebest contrast/object detectablity.
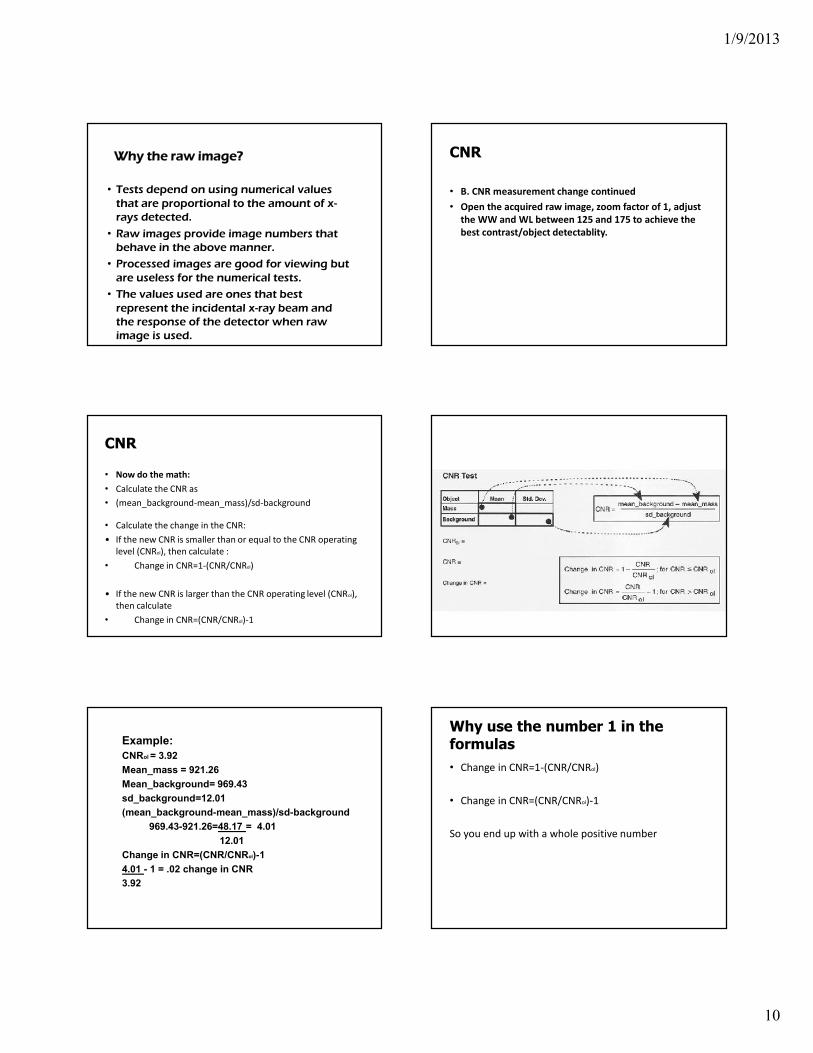
CNR
• Now do the math:• Calculate the CNR as• (mean_background-mean_mass)/sd-background
• Calculate the change in the CNR:• If the new CNR is smaller than or equal to the CNR operating
level (CNRol), then calculate :• Change in CNR=1-(CNR/CNRol)
• If the new CNR is larger than the CNR operating level (CNRol),then calculate
• Change in CNR=(CNR/CNRol)-1
Example:CNRol = 3.92Mean_mass = 921.26Mean_background= 969.43sd_background=12.01(mean_background-mean_mass)/sd-background
969.43-921.26=48.17 = 4.0112.01
Change in CNR=(CNR/CNRol)-14.01 - 1 = .02 change in CNR3.92
Why use the number 1 in theformulas• Change in CNR=1-(CNR/CNRol)
• Change in CNR=(CNR/CNRol)-1
So you end up with a whole positive number
1/9/2013
11
Contrast to Noise
• Define contrast to be the signaldifference between two tissues Aand B
CAB=SA-SB• We are assuming that SA > SB so that
contrast is always positive.
Mean
• An average of a group of numbersor data points.
• Action Limit:• The change in CNR must not exceed 0.2.• System fails- the source of the problem must be
identified and corrective action taken before anyfurther examinations are performed.
• Passes-proceed to next step…...score the phantom
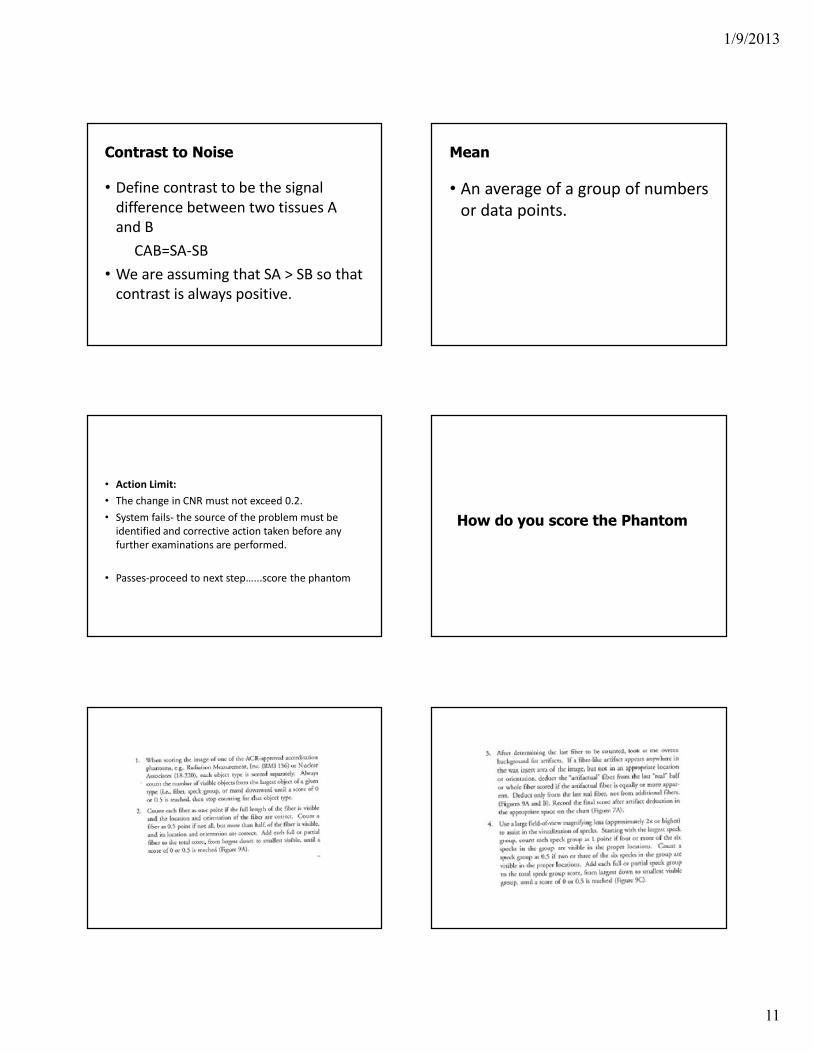
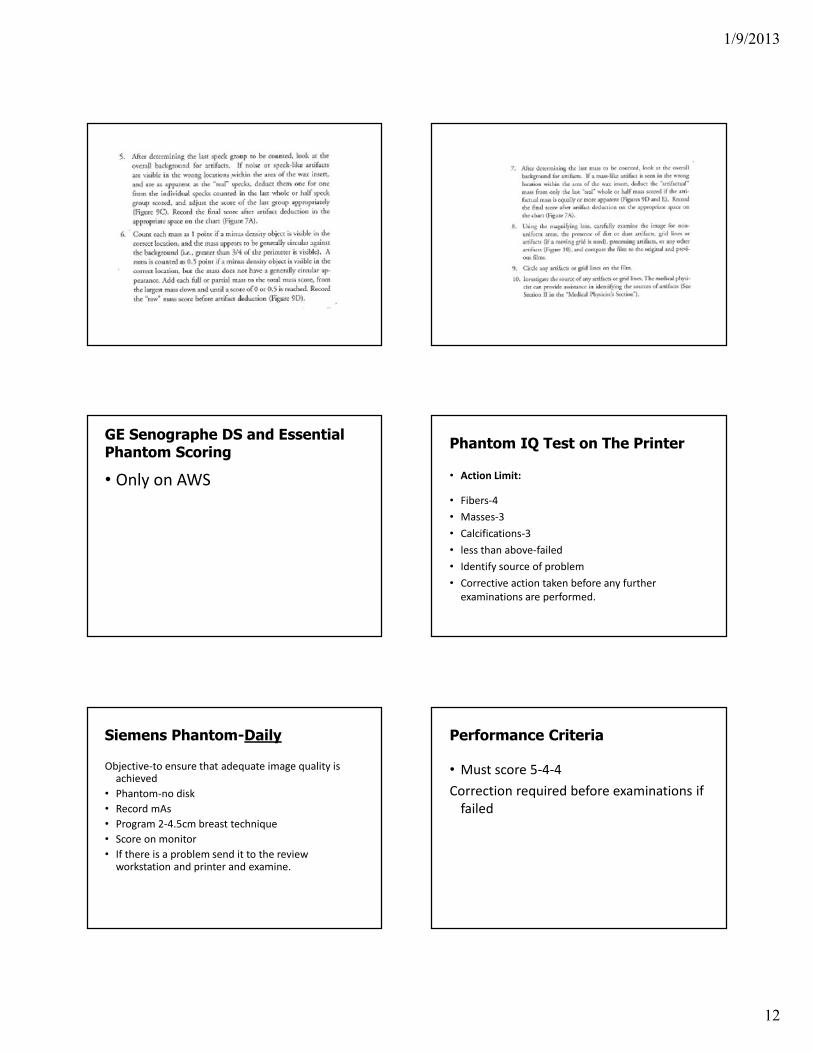
How do you score the Phantom
1/9/2013
12
GE Senographe DS and EssentialPhantom Scoring
• Only on AWS
Phantom IQ Test on The Printer
• Action Limit:
• Fibers-4• Masses-3• Calcifications-3• less than above-failed• Identify source of problem• Corrective action taken before any further
examinations are performed.
Siemens Phantom-Daily
Objective-to ensure that adequate image quality isachieved• Phantom-no disk• Record mAs• Program 2-4.5cm breast technique• Score on monitor• If there is a problem send it to the review
workstation and printer and examine.
Performance Criteria
• Must score 5-4-4Correction required before examinations if
failed
1/9/2013
13
Signal to Noise
• The power ratio between a signal(meaningful information) and thebackground noise.• Both signal and noise power must be
measured at the same or equivalent pointsin the system and within the samebandwidth (width or range of frequenciesthat an electronic signal uses on a giventransmission medium).
Signal to Noise
• Bandwidth-in computer networks it is asynonym for data transfer rate-the amountof data than can be carried from one pointto another in a given time period (bits ofdata per second).
• SNR=the ratio of the mean pixel value tothe standard deviation of the pixel values.
Standard Deviation
• In statistics-(the number you get forthe standard deviation is consideredstatistics) a measure of how muchthe data in a certain collection arescattered around the mean.
Siemens SNR and CNR
Objective-to assure proper functioning ofthe solid-state detector by evaluating theSNR and the CNR of the detector
Use the baseline values for SNR and CNRfor weekly testing consistency
.
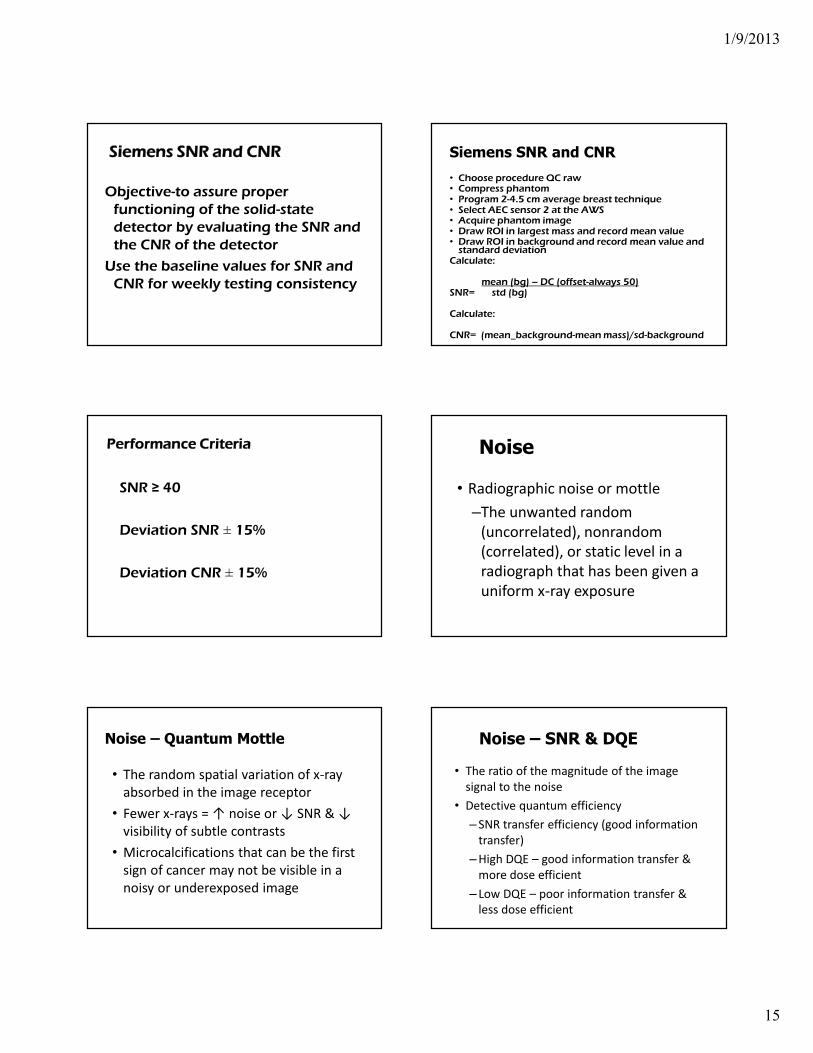
Siemens SNR and CNR
• Choose procedure QC raw• Compress phantom• Program 2-4.5 cm average breast technique• Select AEC sensor 2 at the AWS• Acquire phantom image• Draw ROI in largest mass and record mean value• Draw ROI in background and record mean value and standard deviationCalculate:
mean (bg) – DC (offset-always 50)SNR= std (bg)
Calculate:
CNR= (mean_background-mean_mass)/sd-background
Performance Criteria
SNR ≥ 40
Deviation SNR ± 15%
Deviation CNR ± 15%
1/9/2013
14
Signal-to-Noise and Contrast-to-NoiseMeasurements-LoRad
• Frequency: weekly• Objective: To assure consistency of the digital image
receptor• SNR (Signal to Noise Ratio) compares the level of the
desired signal to the level of background noise• phantom and disk• 18x24 compression paddle-on phantom as close to
4.5 cm as possible• Use clinically used exposure factors: (i.e. Auto Filter)
SNR and CNR Lorad
• Phantom image will appear on monitor.• ROI over disk slightly smaller than the disk-record
Mean Value (Mean)• Drag the previously drawn ROI next to the disk
toward the chest wall-record the Mean Value (Mean)and standard deviation (STD). Do not use the Signal-to-Noise ratio given by the ROI statistics box.
• Accept Image………..
Now SNR is automatic with the SNRbutton on monitor
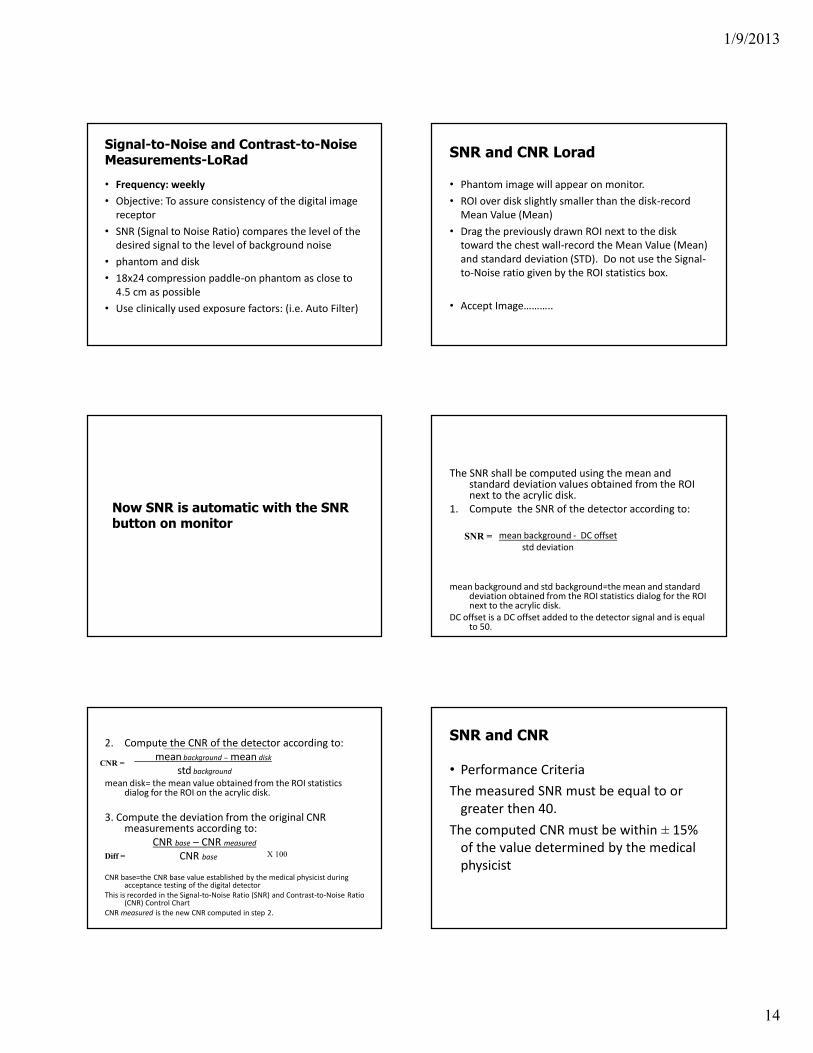
The SNR shall be computed using the mean andstandard deviation values obtained from the ROInext to the acrylic disk.
1. Compute the SNR of the detector according to:
mean background - DC offsetstd deviation
mean background and std background=the mean and standarddeviation obtained from the ROI statistics dialog for the ROInext to the acrylic disk.
DC offset is a DC offset added to the detector signal and is equalto 50.
SNR =
2. Compute the CNR of the detector according to:mean background – mean disk
std backgroundmean disk= the mean value obtained from the ROI statistics
dialog for the ROI on the acrylic disk.
3. Compute the deviation from the original CNRmeasurements according to:
CNR base – CNR measuredCNR base
CNR base=the CNR base value established by the medical physicist duringacceptance testing of the digital detector
This is recorded in the Signal-to-Noise Ratio (SNR) and Contrast-to-Noise Ratio(CNR) Control Chart
CNR measured is the new CNR computed in step 2.
CNR =
Diff = X 100
SNR and CNR
• Performance CriteriaThe measured SNR must be equal to or
greater then 40.The computed CNR must be within ± 15%
of the value determined by the medicalphysicist
1/9/2013
15
Siemens SNR and CNR
Objective-to assure properfunctioning of the solid-statedetector by evaluating the SNR andthe CNR of the detector
Use the baseline values for SNR andCNR for weekly testing consistency
Siemens SNR and CNR
• Choose procedure QC raw• Compress phantom• Program 2-4.5 cm average breast technique• Select AEC sensor 2 at the AWS• Acquire phantom image• Draw ROI in largest mass and record mean value• Draw ROI in background and record mean value and
standard deviationCalculate:
mean (bg) – DC (offset-always 50)SNR= std (bg)
Calculate:
CNR= (mean_background-mean mass)/sd-background
Performance Criteria
SNR ≥ 40
Deviation SNR ± 15%
Deviation CNR ± 15%
Noise
• Radiographic noise or mottle–The unwanted random
(uncorrelated), nonrandom(correlated), or static level in aradiograph that has been given auniform x-ray exposure
Noise – Quantum Mottle
• The random spatial variation of x-rayabsorbed in the image receptor• Fewer x-rays = ↑ noise or ↓ SNR & ↓
visibility of subtle contrasts• Microcalcifications that can be the first
sign of cancer may not be visible in anoisy or underexposed image
Noise – SNR & DQE
• The ratio of the magnitude of the imagesignal to the noise• Detective quantum efficiency– SNR transfer efficiency (good information
transfer)–High DQE – good information transfer &
more dose efficient– Low DQE – poor information transfer &
less dose efficient
1/9/2013
16
SNR – Detector Design
• Design & calibration of the detector &electronics for adequate dynamicrange & number of bits of digitizationare essential to precisely record theentire range of x-ray intensitiestransmitted by the breast
Noise – SDNR
• SDNR– Signal difference-to-noise ratio–A measure of the difference between a
signal & its background divided by thenoise– Indicator of reliably depicting a structure
in the breast in the presence of noise–Radiation dose depends on desired SDNR
Viewbox and Viewing Conditions
• Frequency:• Weekly• Objective:• To ensure good image review conditions by keeping the
viewboxes free of dust, finger prints, and other marks and theviewing conditions optimized.
• Procedure:• This test is not unique to digital mammography systems.• Follow accepted mammographic QC procedures• and action limits to complete this test.
Spatial Resolution
High Contrast
Spatial Resolution
• The ability of an imaging system to allow 2adjacent structures to be visualized asbeing separate, or the distinctness of anedge of the image (ie. Sharpness)
Spatial Resolution
• Loss most easily observed when imagingfine detail–Speculations radiating from a mass–Microcalcifications
1/9/2013
17
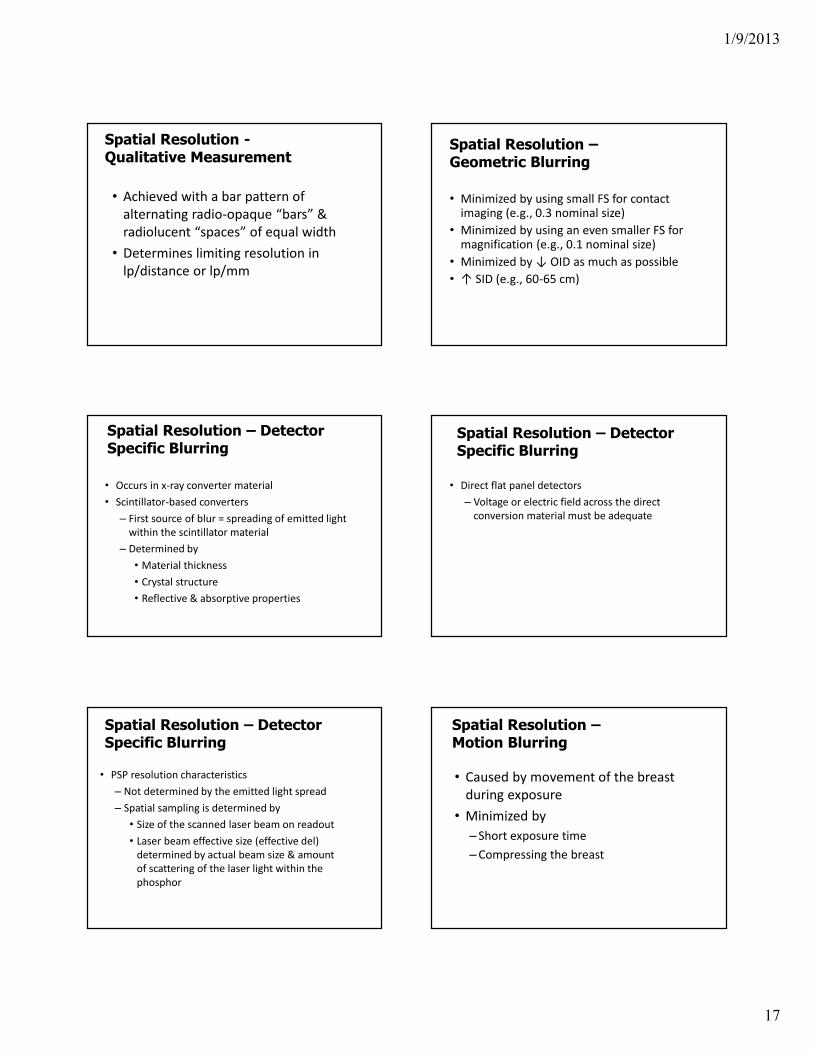
Spatial Resolution -Qualitative Measurement
• Achieved with a bar pattern ofalternating radio-opaque “bars” &radiolucent “spaces” of equal width• Determines limiting resolution in
lp/distance or lp/mm
Spatial Resolution –Geometric Blurring
• Minimized by using small FS for contactimaging (e.g., 0.3 nominal size)• Minimized by using an even smaller FS for
magnification (e.g., 0.1 nominal size)• Minimized by ↓ OID as much as possible• ↑ SID (e.g., 60-65 cm)
Spatial Resolution – DetectorSpecific Blurring
• Occurs in x-ray converter material• Scintillator-based converters– First source of blur = spreading of emitted light
within the scintillator material– Determined by• Material thickness• Crystal structure• Reflective & absorptive properties
Spatial Resolution – DetectorSpecific Blurring
• Direct flat panel detectors– Voltage or electric field across the direct
conversion material must be adequate
Spatial Resolution – DetectorSpecific Blurring
• PSP resolution characteristics– Not determined by the emitted light spread– Spatial sampling is determined by• Size of the scanned laser beam on readout• Laser beam effective size (effective del)
determined by actual beam size & amountof scattering of the laser light within thephosphor
Spatial Resolution –Motion Blurring
• Caused by movement of the breastduring exposure• Minimized by– Short exposure time–Compressing the breast
1/9/2013
18
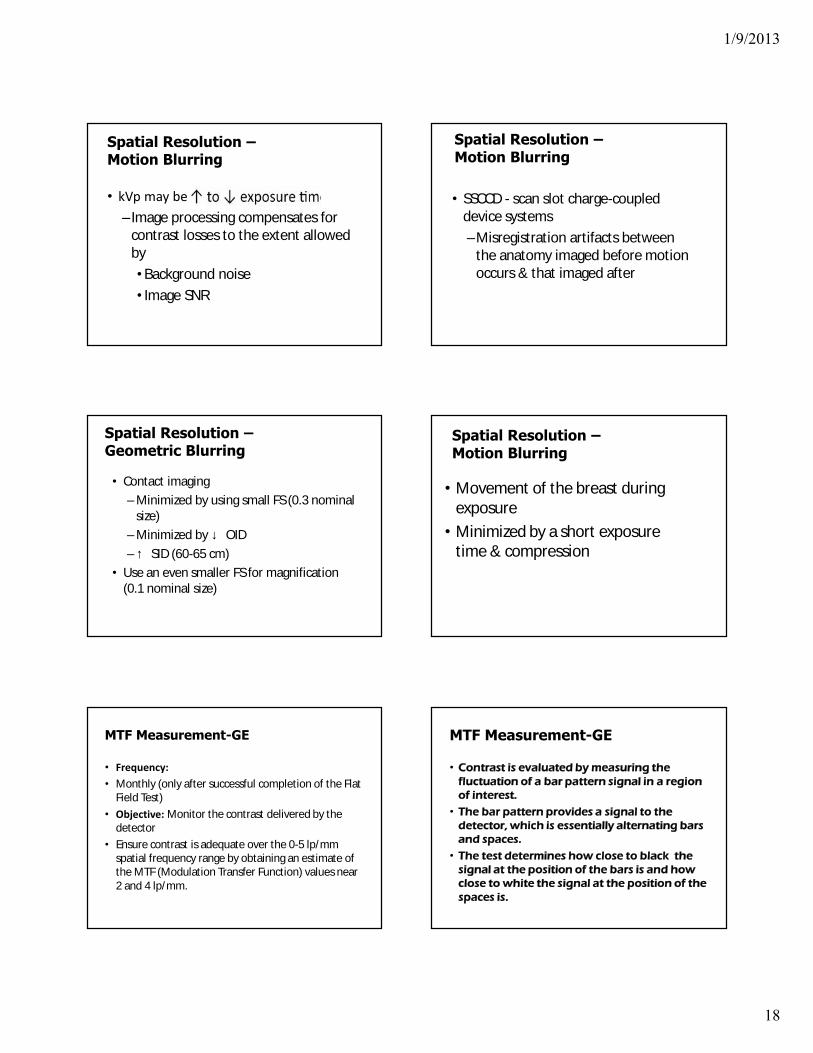
Spatial Resolution –Motion Blurring
• kVp may be–Image processing compensates for
contrast losses to the extent allowedby•Background noise• Image SNR
Spatial Resolution –Motion Blurring
• SSCCD - scan slot charge-coupleddevice systems–Misregistration artifacts between
the anatomy imaged before motionoccurs & that imaged after
Spatial Resolution –Geometric Blurring
• Contact imaging–Minimized by using small FS (0.3 nominal
size)–Minimized by ↓ OID–↑ SID (60-65 cm)
• Use an even smaller FS for magnification(0.1 nominal size)
Spatial Resolution –Motion Blurring
• Movement of the breast duringexposure• Minimized by a short exposure
time & compression
MTF Measurement-GE
• Frequency:• Monthly (only after successful completion of the Flat
Field Test)• Objective: Monitor the contrast delivered by the
detector• Ensure contrast is adequate over the 0-5 lp/mm
spatial frequency range by obtaining an estimate ofthe MTF (Modulation Transfer Function) values near2 and 4 lp/mm.
MTF Measurement-GE
• Contrast is evaluated by measuring thefluctuation of a bar pattern signal in a regionof interest.
• The bar pattern provides a signal to thedetector, which is essentially alternating barsand spaces.
• The test determines how close to black thesignal at the position of the bars is and howclose to white the signal at the position of thespaces is.
1/9/2013
19
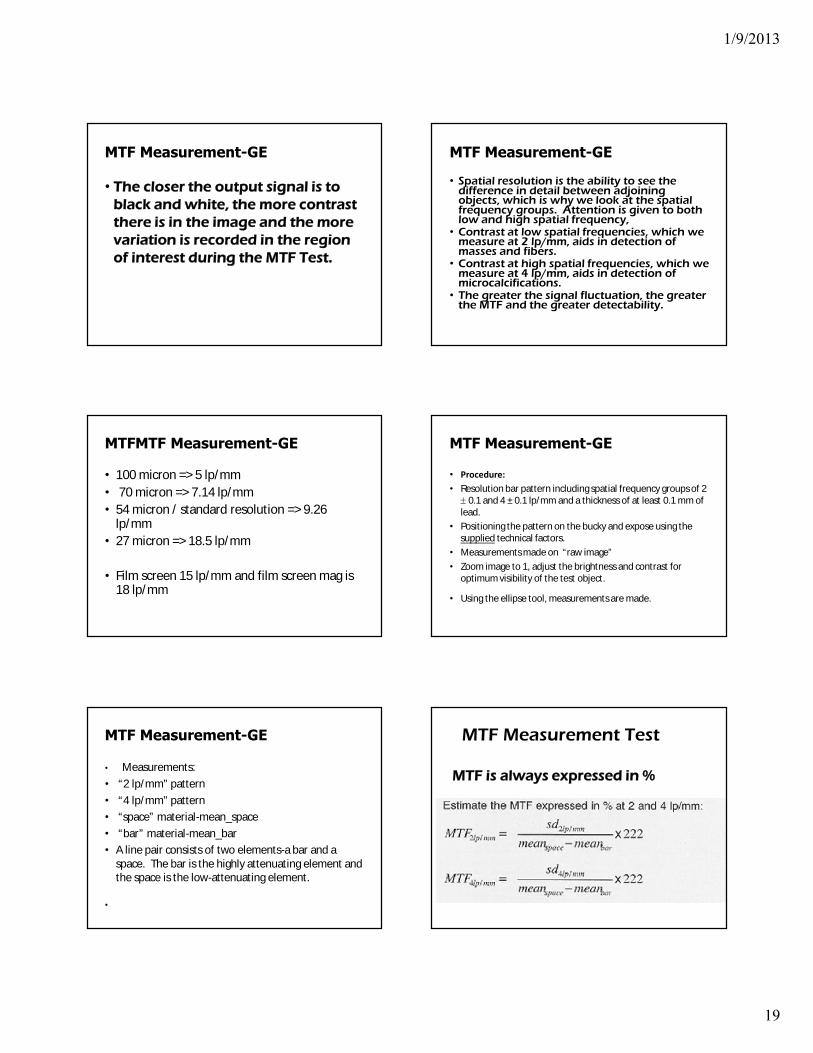
MTF Measurement-GE
• The closer the output signal is toblack and white, the more contrastthere is in the image and the morevariation is recorded in the regionof interest during the MTF Test.
MTF Measurement-GE
• Spatial resolution is the ability to see thedifference in detail between adjoiningobjects, which is why we look at the spatialfrequency groups. Attention is given to bothlow and high spatial frequency,• Contrast at low spatial frequencies, which we
measure at 2 lp/mm, aids in detection ofmasses and fibers.• Contrast at high spatial frequencies, which we
measure at 4 lp/mm, aids in detection ofmicrocalcifications.• The greater the signal fluctuation, the greater
the MTF and the greater detectability.
MTFMTF Measurement-GE
• 100 micron => 5 lp/mm• 70 micron => 7.14 lp/mm• 54 micron / standard resolution => 9.26
lp/mm• 27 micron => 18.5 lp/mm
• Film screen 15 lp/mm and film screen mag is18 lp/mm
MTF Measurement-GE
• Procedure:• Resolution bar pattern including spatial frequency groups of 2 0.1 and 4 ± 0.1 lp/mm and a thickness of at least 0.1 mm oflead.
• Positioning the pattern on the bucky and expose using thesupplied technical factors.
• Measurements made on “raw image”• Zoom image to 1, adjust the brightness and contrast for
optimum visibility of the test object.
• Using the ellipse tool, measurements are made.
MTF Measurement-GE
• Measurements:• “2 lp/mm” pattern• “4 lp/mm” pattern• “space” material-mean_space• “bar” material-mean_bar• A line pair consists of two elements-a bar and a
space. The bar is the highly attenuating element andthe space is the low-attenuating element.
•
MTF is always expressed in %
MTF Measurement Test
1/9/2013
20
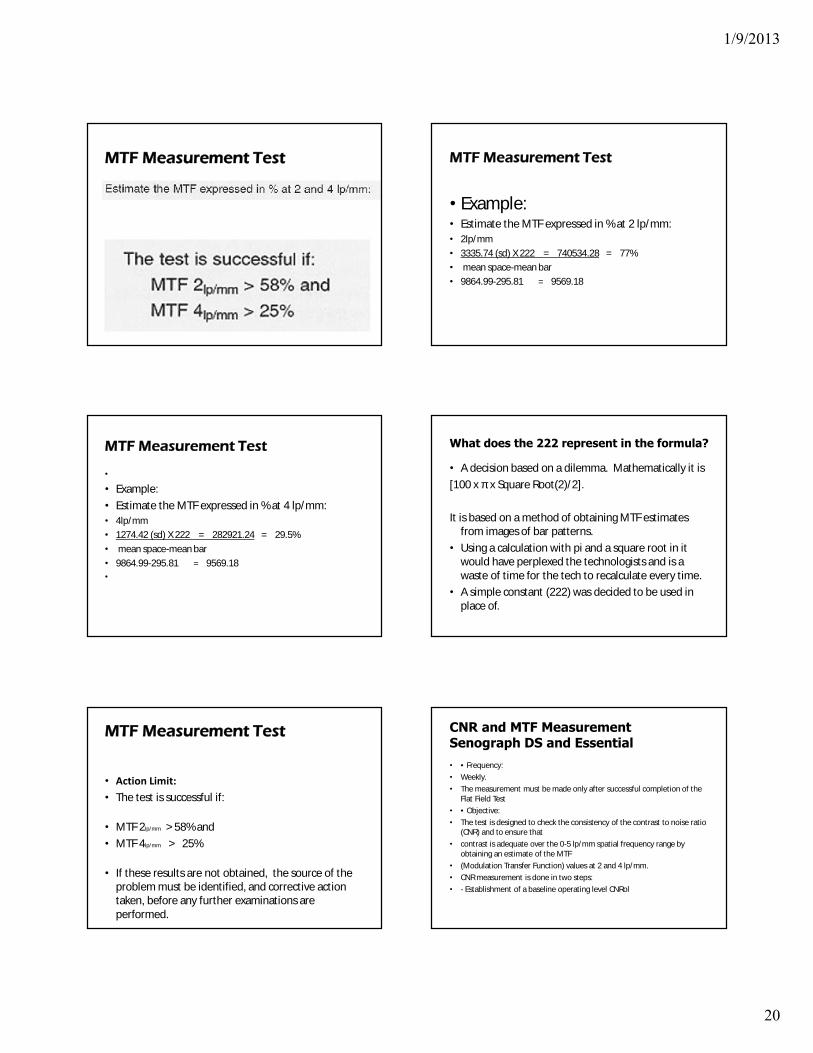
MTF Measurement Test MTF Measurement Test
• Example:• Estimate the MTF expressed in % at 2 lp/mm:• 2lp/mm• 3335.74 (sd) X 222 = 740534.28 = 77%• mean space-mean bar• 9864.99-295.81 = 9569.18
MTF Measurement Test
•
• Example:• Estimate the MTF expressed in % at 4 lp/mm:• 4lp/mm• 1274.42 (sd) X 222 = 282921.24 = 29.5%• mean space-mean bar• 9864.99-295.81 = 9569.18•
What does the 222 represent in the formula?
• A decision based on a dilemma. Mathematically it is[100 x π x Square Root(2)/2].
It is based on a method of obtaining MTF estimatesfrom images of bar patterns.• Using a calculation with pi and a square root in it
would have perplexed the technologists and is awaste of time for the tech to recalculate every time.• A simple constant (222) was decided to be used in
place of.
MTF Measurement Test
• Action Limit:• The test is successful if:
• MTF 2lp/mm > 58% and• MTF 4lp/mm > 25%
• If these results are not obtained, the source of theproblem must be identified, and corrective actiontaken, before any further examinations areperformed.
CNR and MTF MeasurementSenograph DS and Essential• • Frequency:• Weekly.• The measurement must be made only after successful completion of the
Flat Field Test• • Objective:• The test is designed to check the consistency of the contrast to noise ratio
(CNR) and to ensure that• contrast is adequate over the 0-5 lp/mm spatial frequency range by
obtaining an estimate of the MTF• (Modulation Transfer Function) values at 2 and 4 lp/mm.• CNR measurement is done in two steps:• - Establishment of a baseline operating level CNRol
1/9/2013
21
CNR and MTF MeasurementSenograph DS and Essential• 1. Click on the QAP button on the right column of the Browser window. A
list of tests is displayed.• Select the CNR and MTF test.• 2. Enter or verify the reference of the IQST device (Serial Number or SN,
written on the side of the• device) on the AWS screen, then click Start .• Note:• If the device reference entered is different from the previous one, you will
be asked if you want to• restart the calibration process with this new reference.• 3. Install the Bucky on the digital detector if it is not already installed.• 4. Remove the compression paddle.• 5. Position the IQST device on top of the Bucky.
CNR and MTF MeasurementSenograph DS and Essential• 6. The following parameters are selected automatically:
Rh/Rh/30kV/56mAs.• 7. Perform one exposure.• 8. After the image has been captured, the results of the tests are
displayed:• - The values of MTF at 2 lp/mm and MTF at 4 lp/mm.• - The value of the change in CNR, computed as follows:• Change in CNR = |CNR - CNRol| / CNRol• where CNRol = the CNR Operating Level as described above.• If CNRol has not been calculated yet, the change in CNR is computed as
follows:• Change in CNR = |CNR - mean| / mean• where mean = the mean of the CNR values previously stored
AOP Mode and SNR Check-GE
• Frequency:• Monthly
• Objective:• Checks the following aspects of system operation:• -correct choice of parameters in AOP (Automatic
Optimization of Parameters) mode• -correct level of SNR (Signal-to-Noise Ratio) in the
image
AOP Mode and SNR Check-GE
• Procedure:• A set of acrylic plates (minimum size 20 cm 20 cm)
allowing thicknesses of 25 ± 0.1 mm, 40 ± 0.1 mmand 60 ± 0.1 mm used with 5 deca newtonscompression force
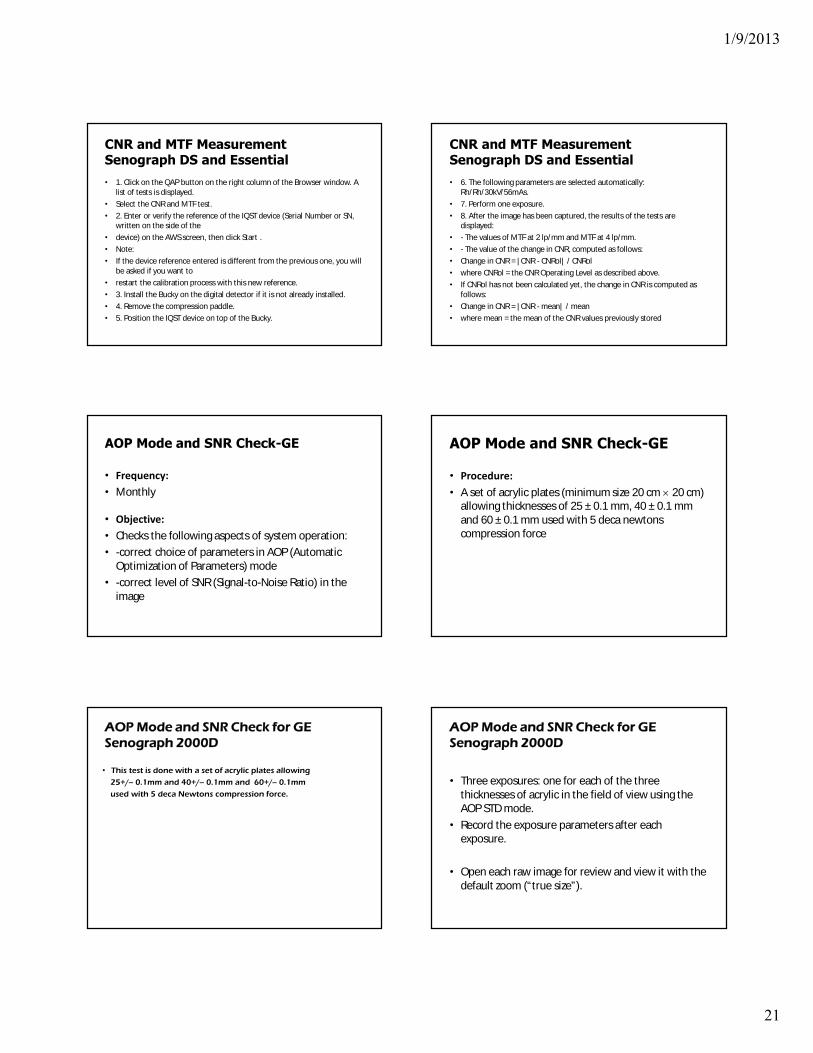
AOP Mode and SNR Check for GESenograph 2000D
• This test is done with a set of acrylic plates allowing
25+/-- 0.1mm and 40+/-- 0.1mm and 60+/-- 0.1mm
used with 5 deca Newtons compression force.
AOP Mode and SNR Check for GESenograph 2000D
• Three exposures: one for each of the threethicknesses of acrylic in the field of view using theAOP STD mode.• Record the exposure parameters after each
exposure.
• Open each raw image for review and view it with thedefault zoom (“true size”).
1/9/2013
22
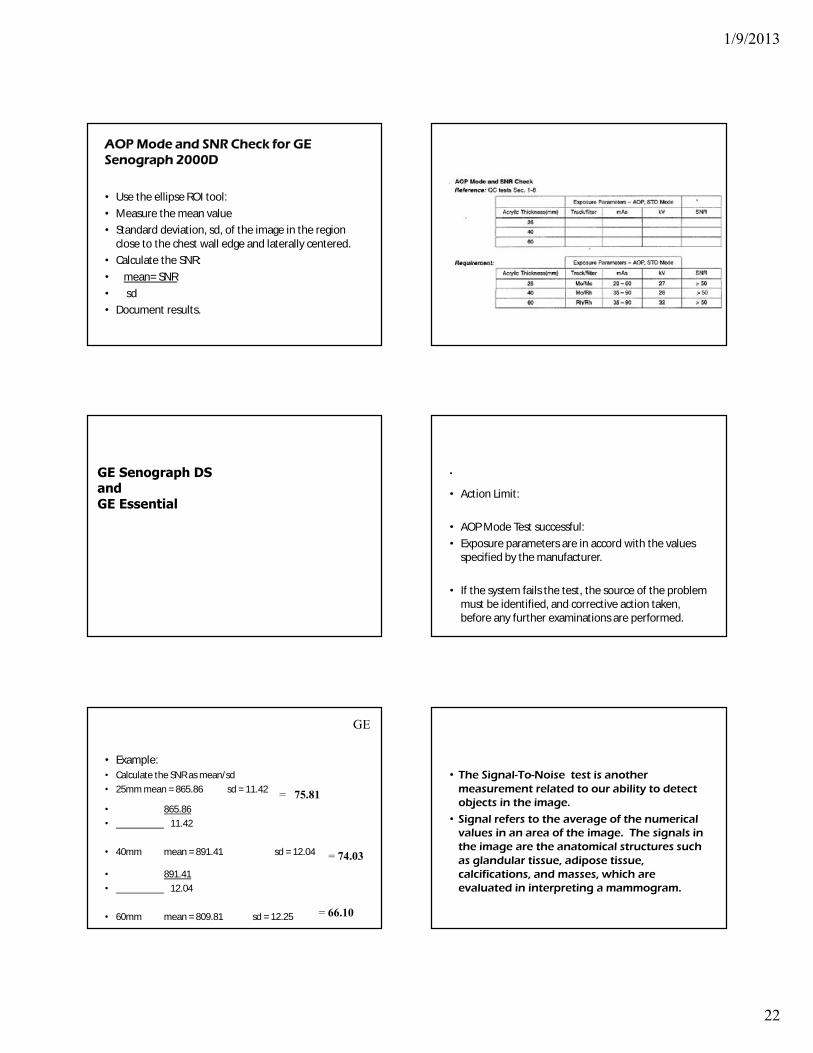
AOP Mode and SNR Check for GESenograph 2000D
• Use the ellipse ROI tool:• Measure the mean value• Standard deviation, sd, of the image in the region
close to the chest wall edge and laterally centered.• Calculate the SNR:• mean= SNR• sd• Document results.
GE Senograph DSandGE Essential
•
• Action Limit:
• AOP Mode Test successful:• Exposure parameters are in accord with the values
specified by the manufacturer.
• If the system fails the test, the source of the problemmust be identified, and corrective action taken,before any further examinations are performed.
• Example:• Calculate the SNR as mean/sd• 25mm mean = 865.86 sd = 11.42
• 865.86• 11.42
• 40mm mean = 891.41 sd = 12.04
• 891.41• 12.04
• 60mm mean = 809.81 sd = 12.25
GE
= 75.81
= 74.03
= 66.10
• The Signal-To-Noise test is anothermeasurement related to our ability to detectobjects in the image.
• Signal refers to the average of the numericalvalues in an area of the image. The signals inthe image are the anatomical structures suchas glandular tissue, adipose tissue,calcifications, and masses, which areevaluated in interpreting a mammogram.
1/9/2013
23
• Noise refers to the random variation of thesignal.• This random variation can obscure the
clinical information the observer is trying todetect.• The signal-to-noise ratio is a measure of the
relative strengths of the signal and noise.That is, the signal, or useful imageinformation, divided by the noise, orrandom information.
• When the signal-to-noise ratio islarge, then noise does not obscurethe objects of interest in the image.
• When the SNR is small, objects andnoise can be confused and theobjects of interest; for example,masses and calcifications, may bedifficult to detect.
• The SNR is also important because it setsthe limit on the amount of contrastenhancement you can use to try to makethe objects easier to see. Suchenhancement generally increases both thesignal and the noise and reduces the SNR.If the initial SNR is not sufficiently high, theenhancement lowers the SNR to the pointwhere the contrast-enhanced noiseeventually obscures the objects of interest.
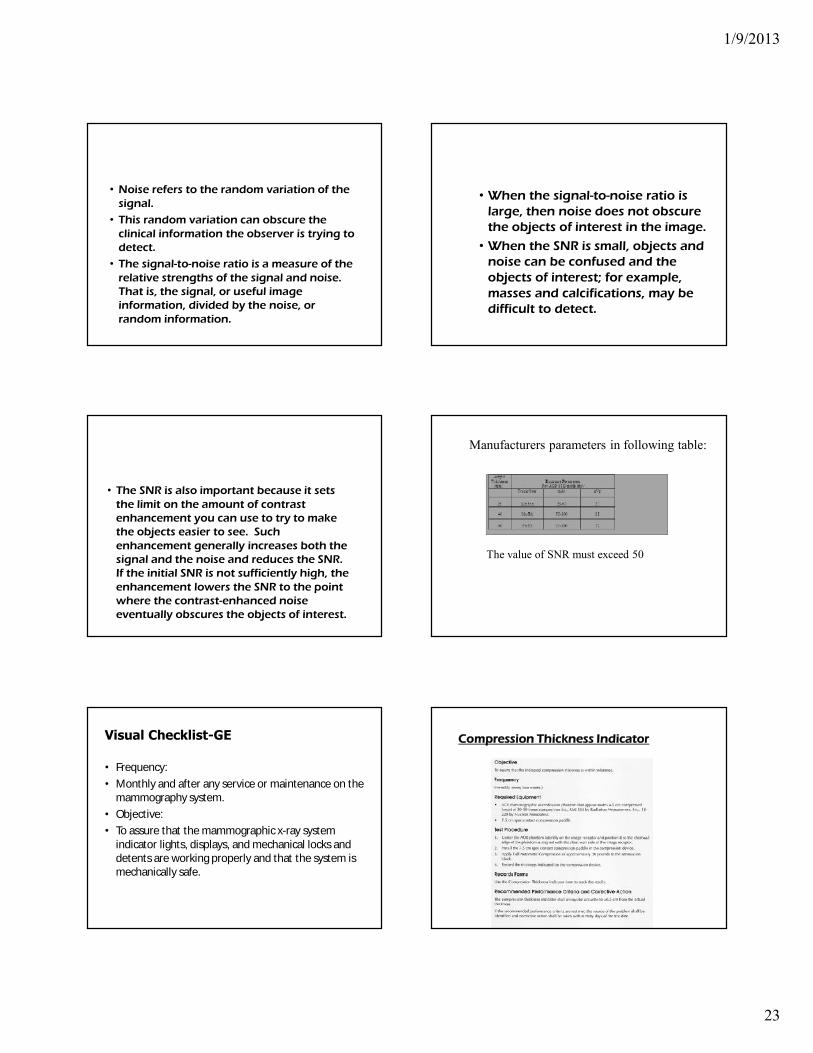
The value of SNR must exceed 50
Manufacturers parameters in following table:
Visual Checklist-GE
• Frequency:• Monthly and after any service or maintenance on the
mammography system.• Objective:• To assure that the mammographic x-ray system
indicator lights, displays, and mechanical locks anddetents are working properly and that the system ismechanically safe.
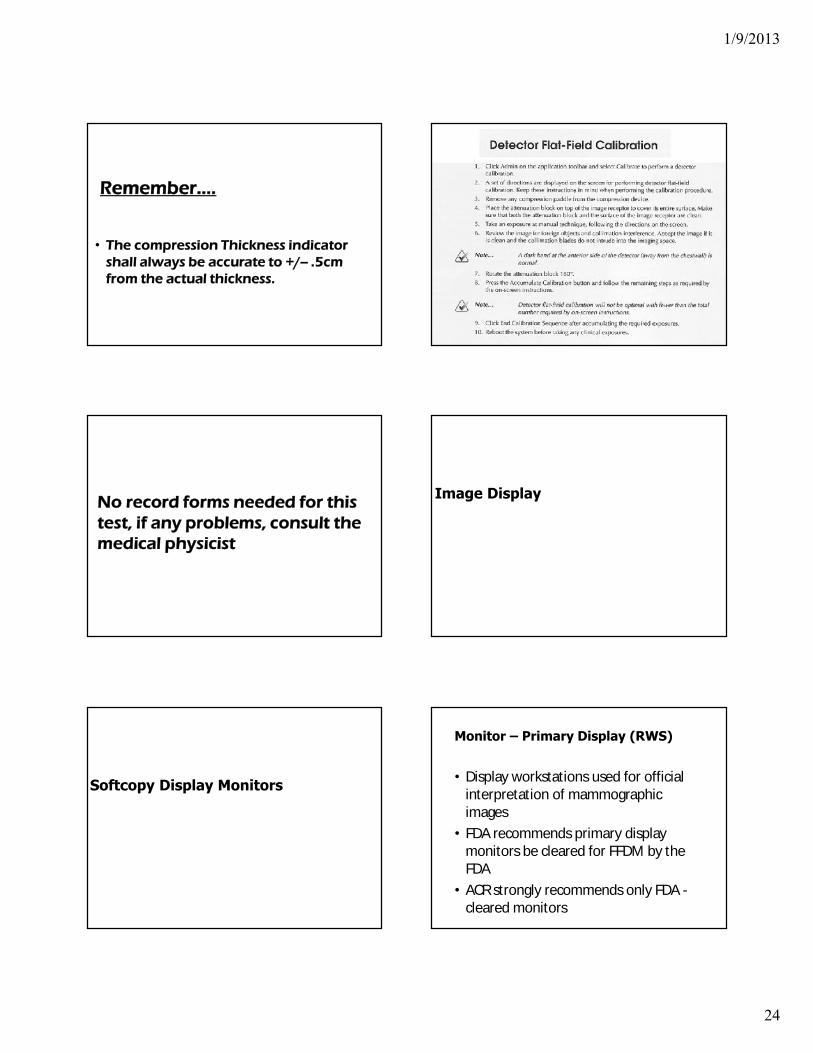
Compression Thickness Indicator
1/9/2013
24
Remember….
• The compression Thickness indicatorshall always be accurate to +/-- .5cmfrom the actual thickness.
No record forms needed for thistest, if any problems, consult themedical physicist
Image Display
Softcopy Display Monitors
Monitor – Primary Display (RWS)
• Display workstations used for officialinterpretation of mammographicimages• FDA recommends primary display
monitors be cleared for FFDM by theFDA• ACR strongly recommends only FDA -
cleared monitors
1/9/2013
25
Monitor – Primary Display (RWS)
• Once a display has been purchased &calibrated, it should be tested regularlyby the medical physicist to maintaincompliance• 5 megapixel monitor (2,000 x 2,500
Pixel samples in the horizontal &vertical directions for portraitorientation) preferred
Monitor – Primary Display (RWS)
• Maximum luminance of grayscale monitors@ least 450 cd/m2
• Reflected ambient light from the displaysurface should be included in luminancemeasurement• Minimum of 8 bit luminance resolution (bit
depth) is required• Two-monitor portrait set up
Monitor – Primary Display (RWS)
• Ability to select image sequence &display format (hanging protocols)• Ability to accurately associate the patient
& study demographic information withthe images of the study performed• Eyeglasses specifically for viewing
distances (15 – 60 cm)
Monitor – Primary Display (RWS)
• During readout all images should be viewedat 1:1 or 100% size• Pixel size (or pitch) should be less than
~200microns• Display device specifications should match
as closely as possible the acquisition matrixsize
Monitor – Primary Display (RWS)
–Window & level adjustment tools mustbe available–Zoom (magnification) & pan (roaming)
capabilities must be available–Rotation & Flipping tools are essential–Calculation & display of linear
measurements, ROI & pixel valuedetermination should be possible
Monitor – Primary Display (RWS)
–All images acquired in the studyneed to be fully accessible duringinterpretation
1/9/2013
26
Monitor – Primary Display (RWS)
– Clinically relevant technical parameters of theacquired image data should be accessible• mAs• kVp• Bit depth• Exposure time• Matrix size• Exposure values to assess technique for
dose, quality, & feedback for technologists
Monitor – Primary Display (RWS)
– Sufficient for viewing all types of CR/DRimages
Monitor – Primary Display (RWS)
–Reflections from ambient light sourcesshould be kept at a minimum• Indirect & backlight incandescent lights with
dimmer switches rather than fluorescent• Color tint should be uniform across the
display area• Monitor pairs should be color matched from
the same manufacturing batch
Monitor – Primary Display (RWS)
• Optimize viewing conditions–Control reading room lighting–Eliminate reflection on the monitor–Lower ambient lighting level as much
as feasible
Monitor – Primary Display (RWS)
–Ambient lights should NOT be turnedoff completely nor turned upcompletely–20 lux is generally sufficient
Softcopy Display Monitors –Other Guidelines
• Displays must be able to– Display mammography CAD marks when CAD is
implemented– Apply marks on the displayed image
corresponding to all findings encoded in theDICOM mammography CAD strured reporting(SR) objects– Display images in “true” size
1/9/2013
27
Softcopy Display Monitors –Other Guidelines
• Displays must be able to–Display images in “same” display size
even if from different acquisition stationswith different pixel sizes–Annotate image information, image
identification, & technical factorinformation–Display simultaneously a set of current &
prior conventional four-view screeningmammogram images
Display Device Calibration Check-GE
• Frequency:• Monthly
• Objective:• Assure the monitor is calibrated• Brightness and contrast settings are at an
appropriate level for the reading of the images onthe review workstation.
• Procedure:• At the RWS the “Start Calibration” is selected.
Display Device Calibration Check-GE
• The pattern is examined carefully for the followingfeatures:
• verify that the 0%-5% contrast is visible• verify that the 95%-100% contrast is visible• verify that each gray level step from 0% to 100% can be
distinguished from the adjacent squares. For example,that you can distinguish the 0% square from the 10%square , etc.
• verify that the line-pair images at the center and cornersof the SMPTE pattern are distinguishable.
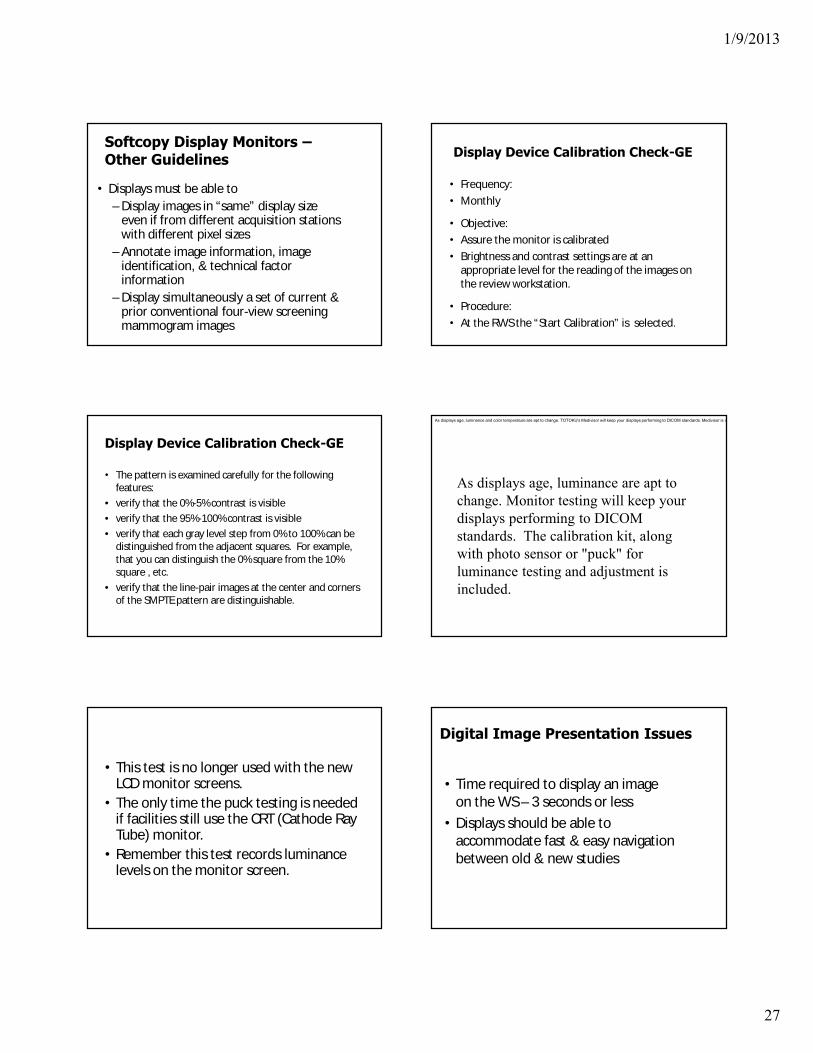
As displays age, luminance and color temperature are apt to change. TOTOKU's Medivisor will keep your displays performing to DICOM standards. Medivisor is included in the calibration kits, along with photo sensor or "puck" for luminance testing and adjustment.
As displays age, luminance are apt tochange. Monitor testing will keep yourdisplays performing to DICOMstandards. The calibration kit, alongwith photo sensor or "puck" forluminance testing and adjustment isincluded.
• This test is no longer used with the newLCD monitor screens.• The only time the puck testing is needed
if facilities still use the CRT (Cathode RayTube) monitor.• Remember this test records luminance
levels on the monitor screen.
Digital Image Presentation Issues
• Time required to display an imageon the WS – 3 seconds or less• Displays should be able to
accommodate fast & easy navigationbetween old & new studies
1/9/2013
28
Digital Image Presentation Issues
• Hanging protocols should be–Flexible–Tailored to user preferences–Specifically for mammography
with proper labeling & orientationof images
Digital Image Presentation Issues
• WS software tools must include–Window/level–Zoom/pan
• Specific recommendations regardingtypes of tools to be used & how touse them most effectively do notexist
Digital Image Presentation Issues
• WS should accommodate &display images from severalmodalities
Monitor – Secondary Display (TWS)
• Technologist’s workstations used to judge imagequality during acquisition should be as similar aspossible to the RWS• Resolution (may have less)• Maximum & minimum luminance• Contrast ratio• Ambient lighting• Conformance to DICOM• Zoom & pan
Monitor – Clinician WS
• Used to review images as an adjunct to theofficial interpretation by a radiologist• May not need as high resolution as RWS
Repeat Analysis Check
• Frequency:• Quarterly. For the repeat rate to be meaningful, an analysis
period that yields a patient volume of at least 250 patients or1,000 exposures is needed.
• Objective:• To determine the number and cause of repeated digital
mammograms. Analysis of this data can help identify ways toimprove system efficiency and reduce digital retakes andpatient exposure.
1/9/2013
29
Repeat Analysis check
• The applicable MQSA Quality Mammography Standard is:900.12(e)(3)(ii)
• Quarterly quality control tests. Facilities with screen-film systems shallperform the following quality
• control tests at least quarterly:• (ii) Repeat analysis. If the total repeat or reject rate changes from the
previously determined rate bymore than 2.0 percent of the total films included in the analysis, thereason(s) for the change shall be determined.Any corrective actions shall be recorded and the results of these correctiveactions shall be assessed.
• Action Limit:• If the total repeat rate changes from the rate
determined for the previous analysis period by morethan 2.0% of the total exposures included in theanalysis, the reasons for the change must bedetermined. Any corrective actions taken must berecorded and an assessment must be made of theireffectiveness.
Compression Force Test
• Frequency:• Initial installation and then every 6 months.
• Objective:• To assure that the mammographic system can
provide adequate compression in power driven andmanual modes and that the equipment does notallow too much compression to be applied.
Breast Compression
• Breast compression is equally important for digitalmammography as it is for film screen. It contributesto digital image quality by immobilizing the breast(reduces motion unsharpness), producing a moreuniform, thinner tissue (lowers scatter radiation,more even penetration of x-rays, less magnificationor geometric blurring, less anatomicalsuperimposition), and lowering dose
Compression force test
• Procedure:• This test is not unique to digital mammography
systems.• Follow accepted mammographic QC procedures to
perform this test.• Record the results.• Action Limit-GE &Lorad• The maximum compression force for the initial
power drive must be between 11 and 20 daN• (25-45 lb.)
Printer
• Objective:• To ensure optimal quality of the film printer output,
follow the QC developed by the manufacturer of thedevice.
• If the printer is used with a film processorincorporating wet chemistry processing, follow theQC program developed by the manufacturer of theprinter.
1/9/2013
30
Hardcopy Printing - Considerations
• FDA recommends only printersspecifically cleared for FFDM by theFDA’s ODE (Office of DeviceEvaluation)• MQSA does allow other printers to be
used• ACR strongly recommends only FDA -
cleared printers be used for digitalmammography
Hardcopy Printing - Considerations
• FDA requires the ability to print FFDMimages of final interpretation qualityto film• Manufacturer’s guidelines should be
followed
Hardcopy Printing - Considerations
• FDA requires all printers used with an FFDMunit–Comply with a quality assurance program
that is substantially the same as thatrecommended by the FFDMmanufacturer–That they pass the phantom & clinical
image review process of the facility’saccreditation body
Hardcopy Printing - Considerations
• At present, no accreditation body reviewssoftcopy images• FDA recommends– Softcopy images be of such quality that if
they were submitted they would pass thephantom & clinical image review processof the facility’s accreditation body
• Procedure:• Follow the manufacturers recommended quality
control procedure.• Chart results.
QC testing for printers and monitorswithout QC manuals
• In some cases the QC manual for the digitalmammography unit instructs the facility to testmonitors and printers according to the component’sQC manual.• In these cases, it is the responsibility of the facility to
ensure that it obtains and follows the component’sQC manual for its monitors and printers
1/9/2013
31
Same printer or monitor with FFDM unitsfrom different manufacturers
For facilities using FFDM units fromdifferent manufacturers, each withits own QC requirements for printersand monitors, there is someuncertainty regarding the QC tests toperform on these components.
DICOM Printer Quality Control
• For Lorad Selenia’s
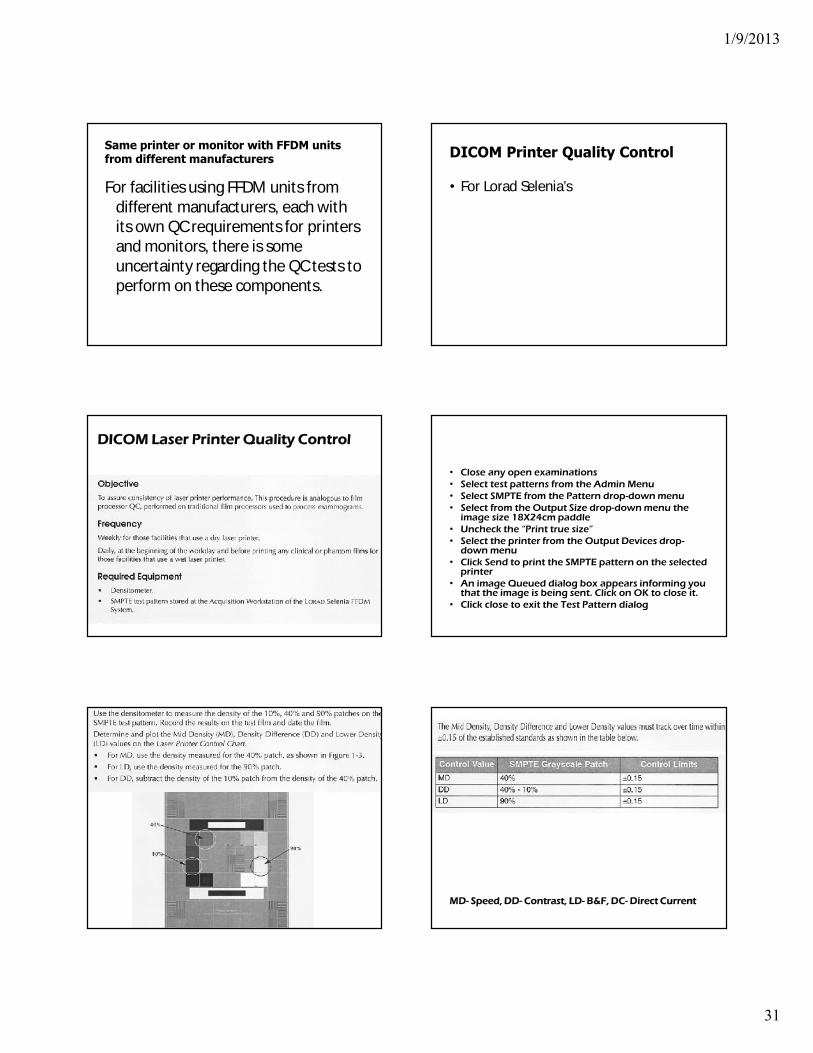
DICOM Laser Printer Quality Control
• Close any open examinations• Select test patterns from the Admin Menu• Select SMPTE from the Pattern drop-down menu• Select from the Output Size drop-down menu the
image size 18X24cm paddle• Uncheck the “Print true size”• Select the printer from the Output Devices drop-
down menu• Click Send to print the SMPTE pattern on the selected
printer• An image Queued dialog box appears informing you
that the image is being sent. Click on OK to close it.• Click close to exit the Test Pattern dialog
MD- Speed, DD- Contrast, LD- B&F, DC- Direct Current
1/9/2013
32
• Most printers are dry laser printerscompared to wet chemistry printers. Thesedevices were introduced in 1996. Theyrequire specialty film which isphotothermographic that uses silverbehenate rather than silver halide toproduce the image and is processedthermally rather than with liquid developerand fixer.
• The film is exposed with a scanning laser. Afterexposure, the film is heated to a temperature of120 degree’s for 24 seconds to process the image.• After the image has been recorded, the film,
immediately after it is ejected from the printer, isstill in the processing image development.• Light from the viewbox illuminator can cause
slight changes in the optical density.
Example 1
• Each FFDM manufacturer QC manual requiresthat the same or equivalent test be done, butat different time frequencies.– In this case facilities need to perform the
test at the more stringent frequency.
Example 2
• Each FFDM manufacturer QC manual requires thatdifferent but equivalent test be done.– In this case facilities may perform only one of the tests at
the more stringent frequency. The medical physicistshould provide a written statement for the facility’s QCrecords, indicating that in his or her opinion, the two testsare equivalent.
Example 3
• Each FFDM manufacturer QC manual requiresthat different test (not equivalent) be done.– In this case facilities need to perform each
test at the frequency required in therespective FFDM manufacturer QC manual.
FUJI CR QC
Baseline Tests-first measurement for each test• Printer QC• Monitor QC• CNR Weekly Check• Image Quality• S Value Confirmation• System Resolution• CR Reader Scanner performance• AEC system performance assessment• Imaging plate fog• System artifact evaluation• Dynamic range• Primary erasure• Inter-plate consistency• Dose

1/9/2013
33
Image Plate Erasure
• Using secondary erasure erase each plate first thing each morning
FUJI CR QC
WEEKLY• CNR• Phantom Image• Printer QC• Monitor QC
FUJI CR QC
Monthly• Visual ChecklistQuarterly• Repeat AnalysisSemi-annual• Compression• Imaging Plate Fog
Fuji CNR Check
Objective:To establish an operating level of Contrast-to-
Noise Ratio (CNR) at a specific exposure andweekly confirm that the CNR remainsconsistent, within limits over time at the sameexposure setting.
Establish a baseline CNR with 5 day average of theCNR values…when doing the 5 day averageremove and replace the aluminum betweenexposures since positioning of it may have someeffect on the calculated CNR from week to week.
• Erase dedicated QC cassette using secondaryerasure
4 cm acrylic on bucky with 0.2 mm thickaluminum object on top positioned as shown indiagram.
Compression paddle in contactExposure: Mo/Mo 26 kVp @125mAs
Interval processing time-control timeinterval between X-ray exposure andreading of the IP. It must beconsistent to Reduce the influence ofIP fading characteristics on the test.5 or 10 minutes
1/9/2013
34
Reestablish (5 day average) new baseline if:
• X-ray tube replacement• Filter replacement• Replacement of compression paddle• Change in phantom used• Change of IP/and or cassette used• Change of grid• Change of x-ray generator• Change of CR reader calibration
Performance Criteria CNR
• Must be within ± 20% of the baselineimage (CNR) established
• If failed must be corrected before anyfurther examinations
Fuji Phantom Image
Objective:To assure that contrast, uniformity and image quality
(due to the x-ray exposure system, image reader andprinter and workstation) are maintained at optimumlevels.
Done hardcopy and softcopy……
• Expose on technique used for 50/50breast (this was auto filter-LoRad unit)• Photocell in center of wax insert and in
same place every time• Same compression thickness every time• Send to printer once processed
Phantom Hardcopy
• Background density center of phantom no lessthan 1.20• Density difference in disc and adjacent to disk
and subtract• Plot on chart and plot mAs• Score subtracting for artifacts
Phantom Softcopy
• Plot the S value from the exposureon the S value range line on chart• Score subtracting for artifacts
1/9/2013
35
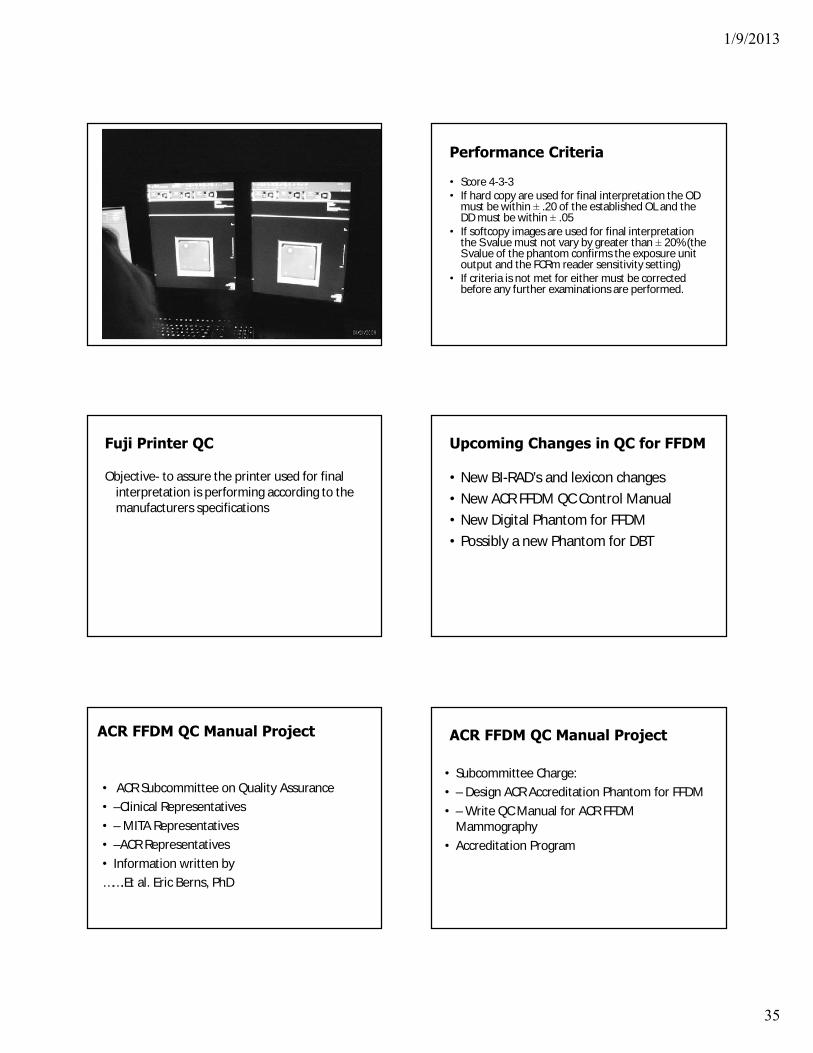
Performance Criteria
• Score 4-3-3• If hard copy are used for final interpretation the OD
must be within ± .20 of the established OL and theDD must be within ± .05• If softcopy images are used for final interpretation
the S value must not vary by greater than ± 20% (theS value of the phantom confirms the exposure unitoutput and the FCRm reader sensitivity setting)• If criteria is not met for either must be corrected
before any further examinations are performed.
Fuji Printer QC
Objective- to assure the printer used for finalinterpretation is performing according to themanufacturers specifications
Upcoming Changes in QC for FFDM
• New BI-RAD’s and lexicon changes• New ACR FFDM QC Control Manual• New Digital Phantom for FFDM• Possibly a new Phantom for DBT
ACR FFDM QC Manual Project
• ACR Subcommittee on Quality Assurance• –Clinical Representatives• – MITA Representatives• –ACR Representatives• Information written by…….Et al. Eric Berns, PhD
ACR FFDM QC Manual Project
• Subcommittee Charge:• – Design ACR Accreditation Phantom for FFDM• – Write QC Manual for ACR FFDM
Mammography• Accreditation Program

1/9/2013
36
ACR Digital QC Manual
• Structure of Manual:• – Radiologist’s Section• – Clinical Image Quality Section• – Radiologic Technologist’s Section• – Medical Physicist’s Section• – Educational, Guidance, and Troubleshooting Section• – Glossary• – References• – Index
What will be New?
• Tech Section• – Enhanced positioning and image quality section• – New Test: Monitor QC for the Radiologist• – New Test: Facility QC Review• – New Format: Corrective Action Log• – New Documentation: Facility Equipment Inventory• – Instructions for Mobile Units• – Eliminating calculations (Yet to be determined)
The ACR FFDM Phantom 24 X 30
Design Summary
• Differences from screen-film phantom• • Eliminate subtraction for artifacts• • Add “Fail” for artifacts• • Improve specific rules for scoring• • Change pass/fail criteria from• – 4,3,3 to 2,3,2• – **But, objects are the same (effective) size as SFM
Phantom
ACR Digital QC Manual
• • Benefits of Phantom Design• – Provides view of entire detector – artifact evaluation• – W/L optimized for test objects optimizes for artifact eval• – Finer gradations of test objects• – Test objects go to smaller sizes• – AGD measurement & limit same as SFM – Meets MQSA• – Provides single image/exposure for evaluation(s)• – Minimal training (~ 25,000 Techs currently trained)• – Provides basis for monitor and laser printer QC• – ACR Physics Reviewers• • Can see scores and artifacts on single submitted film (or image)• • Do not need different WW/WL settings
1/9/2013
37
• The CIRS Model 020 BR3D MammographyPhantom was designed to assess detectabilityof various size lesions within a tissueequivalent, complex, heterogeneousbackground. This phantom provides morerealistic challenges for standard screen andFFDM mammography systems as well asTomosynthesis and breast ComputedTomography.
CIRS Model 020 BR3D MammographyPhantom
• The phantom consists of a set of six (6) slabs made ofheterogeneous breast equivalent material thatexhibits characteristics of real breast tissue anddemonstrates how underlying targets can beobscured by varying glandularity. Each slab containstwo tissue equivalent materials mimicking 100%adipose and gland tissues “swirled” together in aapproximate 50/50 ratio by weight. One of the slabscontains an assortment of micro-calcifications, fibrilsand masses.
That’s enough QC!!