Embed Size (px)
Citation preview
Digital Image Processing using MATLAB and STATISTICA
Emilia Dana Seleţchi 1, Octavian G. Duliu 1
1University of Bucharest, Faculty of Physics, Department of Atomic and Nuclear Physics, Bucharest, ROMANIA
E-mail: [email protected]
Abstract By using MATLAB 7.0.1., in a wide range of applications including image processing and visualizing data we performed statistical function such as: mean median, range and standard deviation, displaying image histogram and plotting the profile of intensity values on an X-ray CT scan. The plot fits panel allowed us to visually explore multiple fits to the current histogram data. We have been also created 2-D Stem Plots, Bar Plots (Plotmatrix), Polar Plots, Contour Plot, Vector Fields Graphs(Feather Graph and Compass Graph) and 3-D Surface Plot. STATISTICA 7.0 has been used to generate Normal Probability Plots, Scatter Icon Plots, 3-D Sequential graphs (Surface Plot and Contour Plot) and to apply multiple exploratory techniques such as Cluster Analysis. Keywords: Stem Plot, Plotmatrix, Polar Plot, Feather Graph, Compass Graph, Normal Probability Plot, Scatter Icon Plot, Cluster Analysis
1. Introduction
MATLAB is a high-level technical language and interactive environment for data analysis and mathematical computing functions such as: signal processing, optimization, partial differential equation solving, etc. It provides interactive tools including: threshold, correlation, Fourier analysis, filtering, basic statistics, curve fitting,, matrix analysis, 2D and 3D plotting functions. The operations for image processing allowed us to perform noise reduction and image enhancement, image transforms, colormap manipulation, colorspace conversions, region-of interest processing, and geometric operation. The toolbox functions implemented in the open MATLAB language can be used to develop the customized algorithms. STATISTICA software provides advances linear/nonlinear models, multivariate exploratory techniques (Cluster and Canonical Analysis), Industrial Statistics and Six Sigma Methods. The digital images processing were performed on medicine studies. 2. MATLAB 7.0.1. Applications 2.1. Image Processing
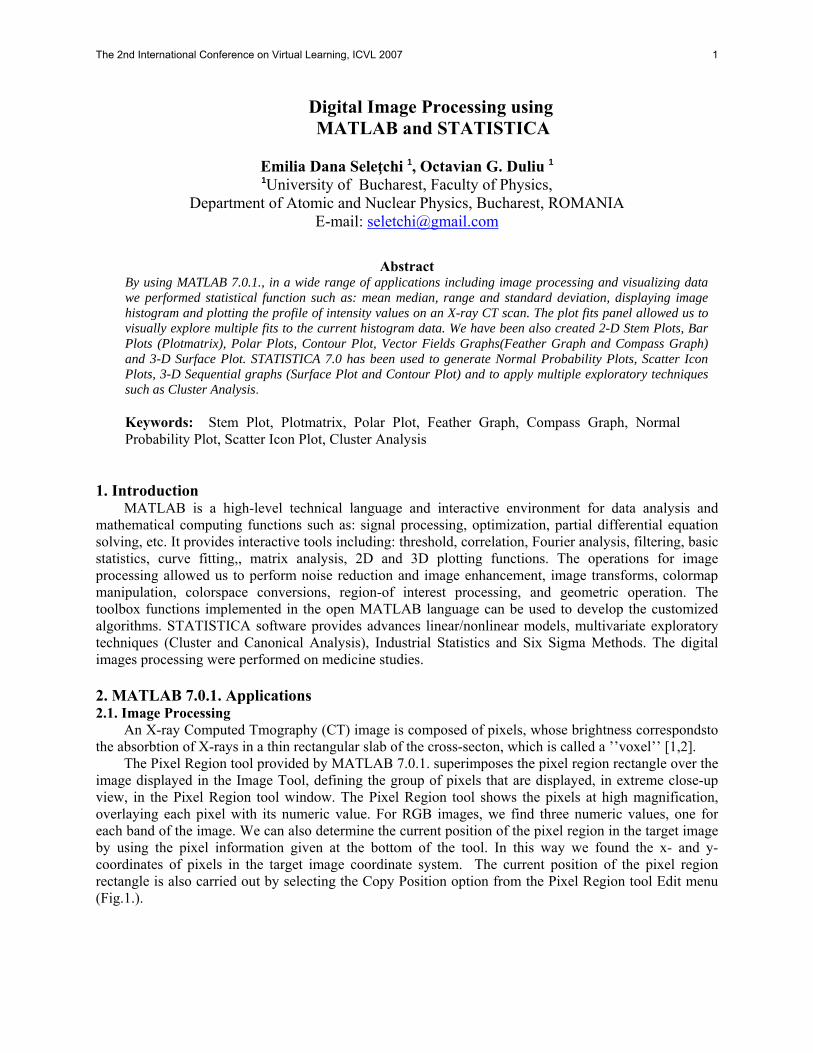
An X-ray Computed Tmography (CT) image is composed of pixels, whose brightness correspondsto the absorbtion of X-rays in a thin rectangular slab of the cross-secton, which is called a ’’voxel’’ [1,2].
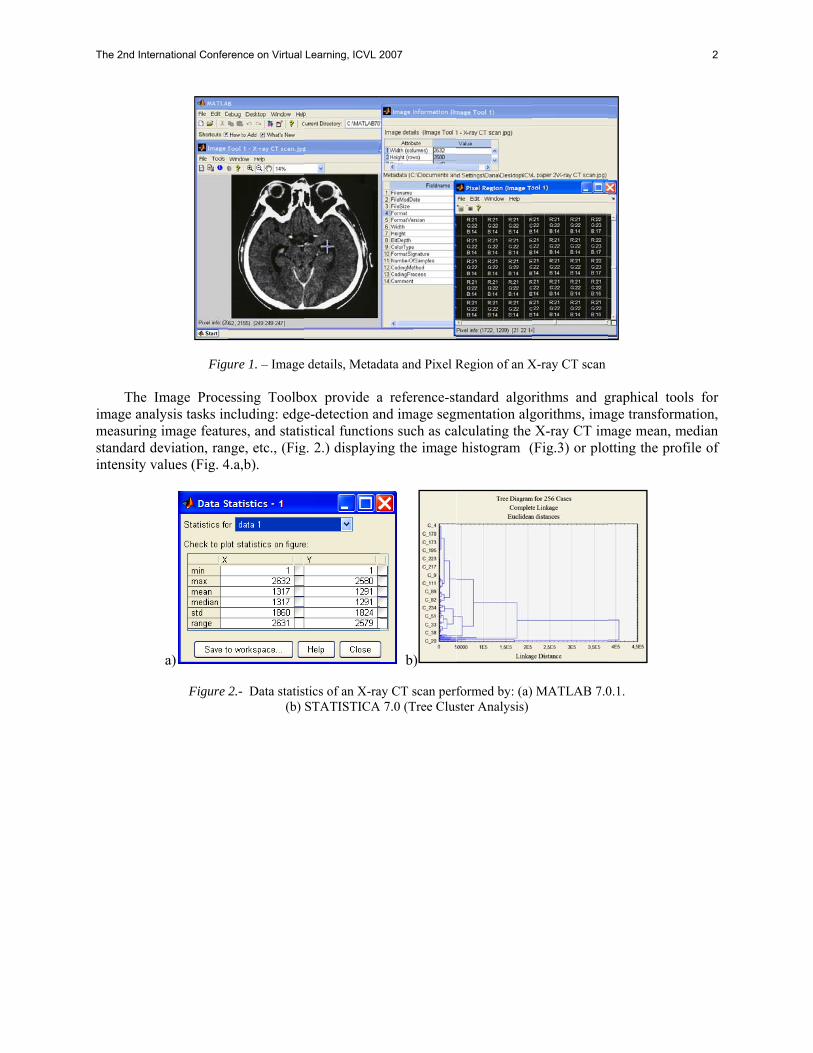
The Pixel Region tool provided by MATLAB 7.0.1. superimposes the pixel region rectangle over the image displayed in the Image Tool, defining the group of pixels that are displayed, in extreme close-up view, in the Pixel Region tool window. The Pixel Region tool shows the pixels at high magnification, overlaying each pixel with its numeric value. For RGB images, we find three numeric values, one for each band of the image. We can also determine the current position of the pixel region in the target image by using the pixel information given at the bottom of the tool. In this way we found the x- and y-coordinates of pixels in the target image coordinate system. The current position of the pixel region rectangle is also carried out by selecting the Copy Position option from the Pixel Region tool Edit menu (Fig.1.).
The 2nd International Conference on Virtual Learning, ICVL 2007 1
The
image anameasuringstandard dintensity v
Figu
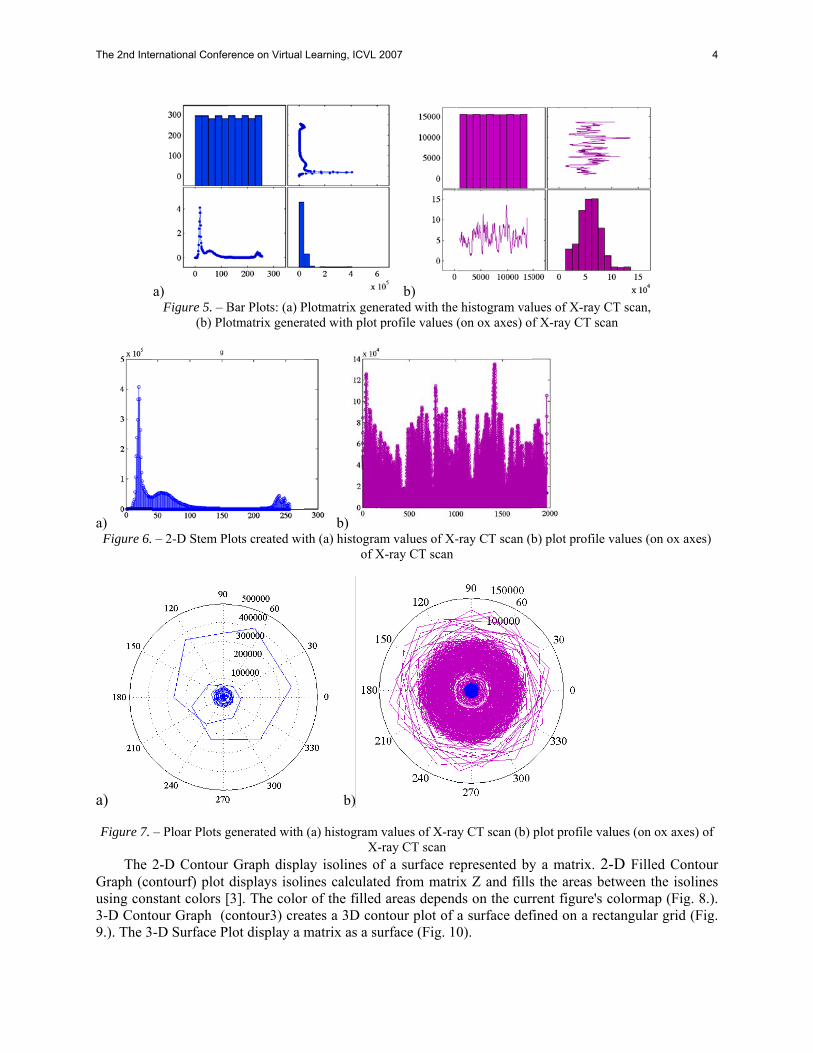
Image Procealysis tasks ing image featudeviation, ranvalues (Fig. 4
a)
Figure
ure 1. – Image
essing Toolboncluding: edgures, and statinge, etc., (Fig4.a,b).
2.- Data statis(b)
details, Metad
ox provide ae-detection anstical functio
g. 2.) displayi
stics of an X-raSTATISTICA
data and Pixel R
a reference-stnd image segns such as cang the image
b)
ay CT scan perf 7.0 (Tree Clus
Region of an X
tandard algormentation alg
alculating the e histogram (
formed by: (a)ster Analysis)
X-ray CT scan
rithms and ggorithms, imaX-ray CT im
(Fig.3) or plo
MATLAB 7.0
graphical tooage transform
mage mean, motting the prof
0.1.
ls for mation, median file of
The 2nd International Conference on Virtual Learning, ICVL 2007 2
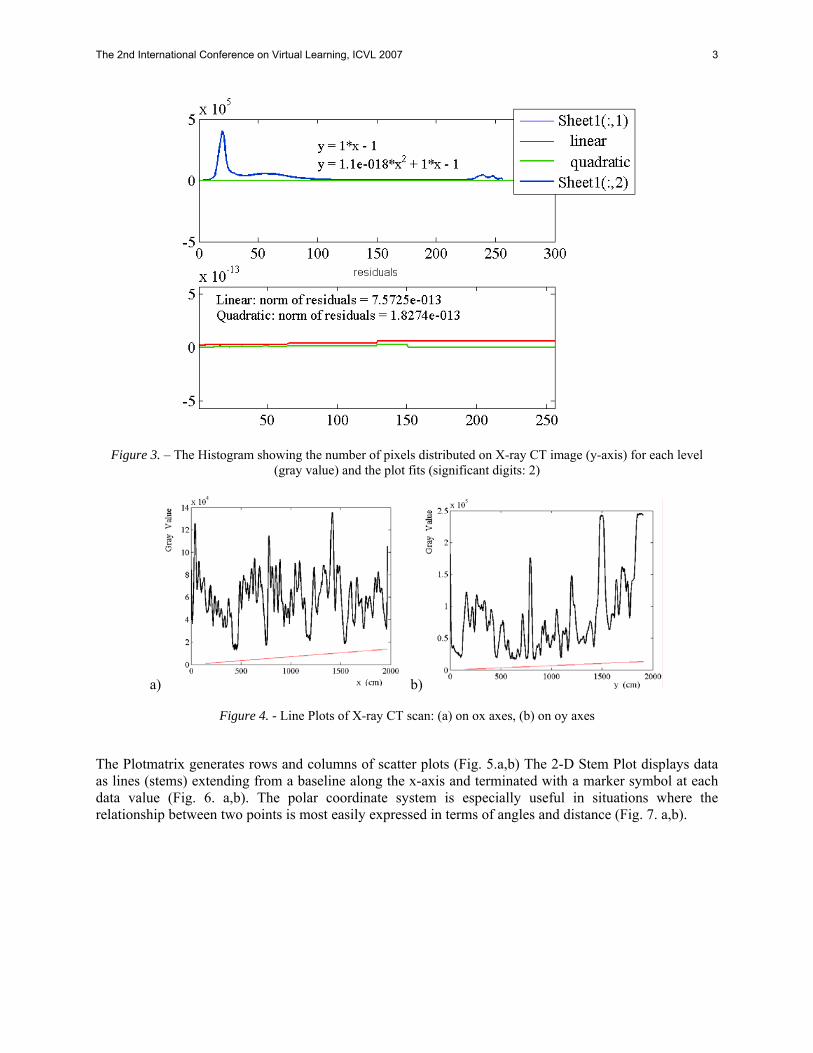
Figure 3. – The Histogram showing the number of pixels distributed on X-ray CT image (y-axis) for each level (gray value) and the plot fits (significant digits: 2)
a) b)
Figure 4. - Line Plots of X-ray CT scan: (a) on ox axes, (b) on oy axes
The Plotmatrix generates rows and columns of scatter plots (Fig. 5.a,b) The 2-D Stem Plot displays data as lines (stems) extending from a baseline along the x-axis and terminated with a marker symbol at each data value (Fig. 6. a,b). The polar coordinate system is especially useful in situations where the relationship between two points is most easily expressed in terms of angles and distance (Fig. 7. a,b).
The 2nd International Conference on Virtual Learning, ICVL 2007 3
a)Figure 6.
a) Figure 7.
The Graph (cousing con3-D Conto9.). The 3
a)Figure 5. – B
(b) Plo
– 2-D Stem Pl
– Ploar Plots g
2-D Contour ontourf) plot nstant colors [our Graph (c-D Surface P
Bar Plots: (a) Potmatrix genera
lots created wi
generated with
Graph displadisplays isoli
[3]. The colorcontour3) crelot display a m
Plotmatrix geneated with plot p
b)ith (a) histogram
of X
b)
(a) histogram X-
ay isolines oines calculater of the filledates a 3D conmatrix as a su
b)erated with theprofile values
m values of X-X-ray CT scan
values of X-ra-ray CT scan f a surface reed from matrid areas dependntour plot of urface (Fig. 1
e histogram val(on ox axes) o
-ray CT scan (b
ay CT scan (b)
epresented byix Z and fillsds on the curra surface def0).
lues of X-ray Cf X-ray CT sca
b) plot profile v
plot profile va
y a matrix. 2s the areas berent figure's c
fined on a rec
CT scan, an
values (on ox a
alues (on ox axe
-D Filled Coetween the isocolormap (Figctangular grid
axes)
es) of
ontour olines g. 8.).
d (Fig.
The 2nd International Conference on Virtual Learning, ICVL 2007 4
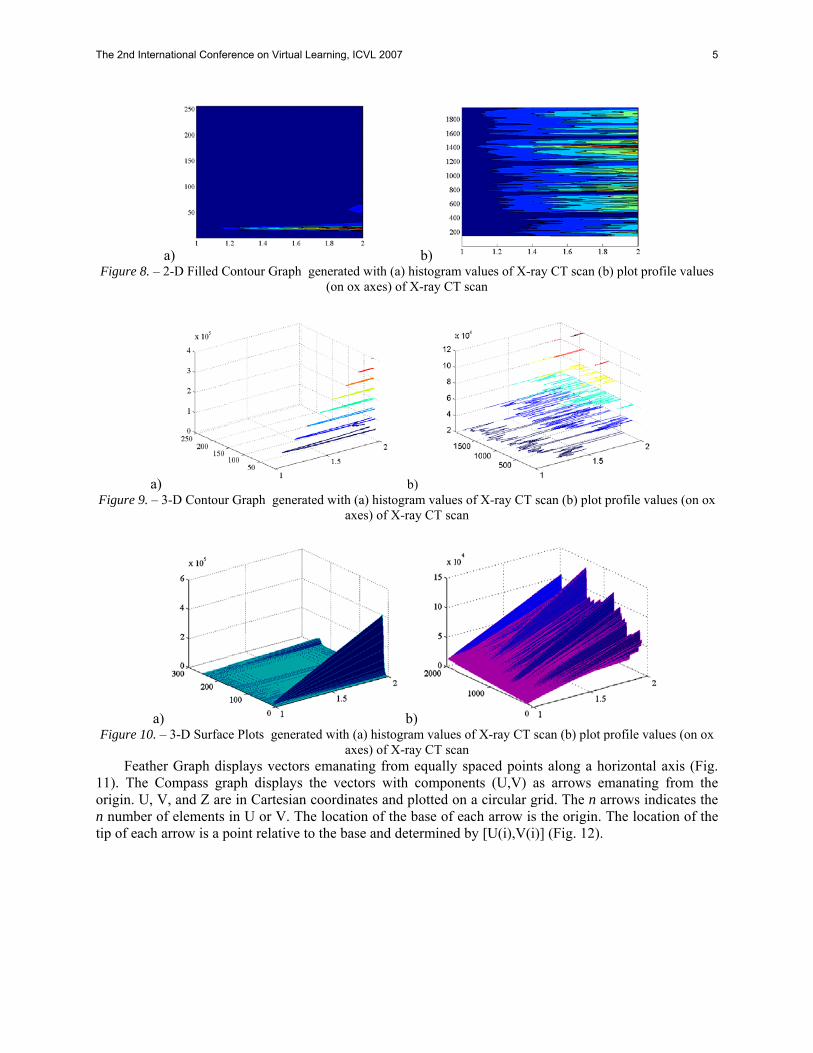
Figure 8.
aFigure 9. –
Figure 10
Feath11). The origin. U,n number tip of each
a)– 2-D Filled C
a)– 3-D Contour
a)0. – 3-D Surfac
her Graph disCompass gra
, V, and Z areof elements
h arrow is a p
Contour Graph
r Graph genera
e Plots genera
splays vectoraph displays e in Cartesianin U or V. Th
point relative t
generated wit
(on ox axe
ated with (a) hiaxes) o
ated with (a) hiaxes) o
s emanating the vectors
n coordinates he location oto the base an
b) h (a) histogram
es) of X-ray CT
b) istogram valueof X-ray CT sc
b) istogram valueof X-ray CT scfrom equallywith componand plotted of the base of nd determined
m values of X-rT scan
es of X-ray CT an
s of X-ray CT an
y spaced poinnents (U,V) on a circular geach arrow is
d by [U(i),V(i
ray CT scan (b
scan (b) plot p
scan (b) plot p
nts along a hoas arrows emgrid. The n ars the origin. Ti)] (Fig. 12).
b) plot profile v
profile values (
profile values (o
orizontal axismanating fromrrows indicatThe location
values
(on ox
on ox
s (Fig. m the es the of the
The 2nd International Conference on Virtual Learning, ICVL 2007 5
a)Figure 1
Figure 12
3. STAT
STATThese meor final revariety of
Icon variables circular icicon and ito explore
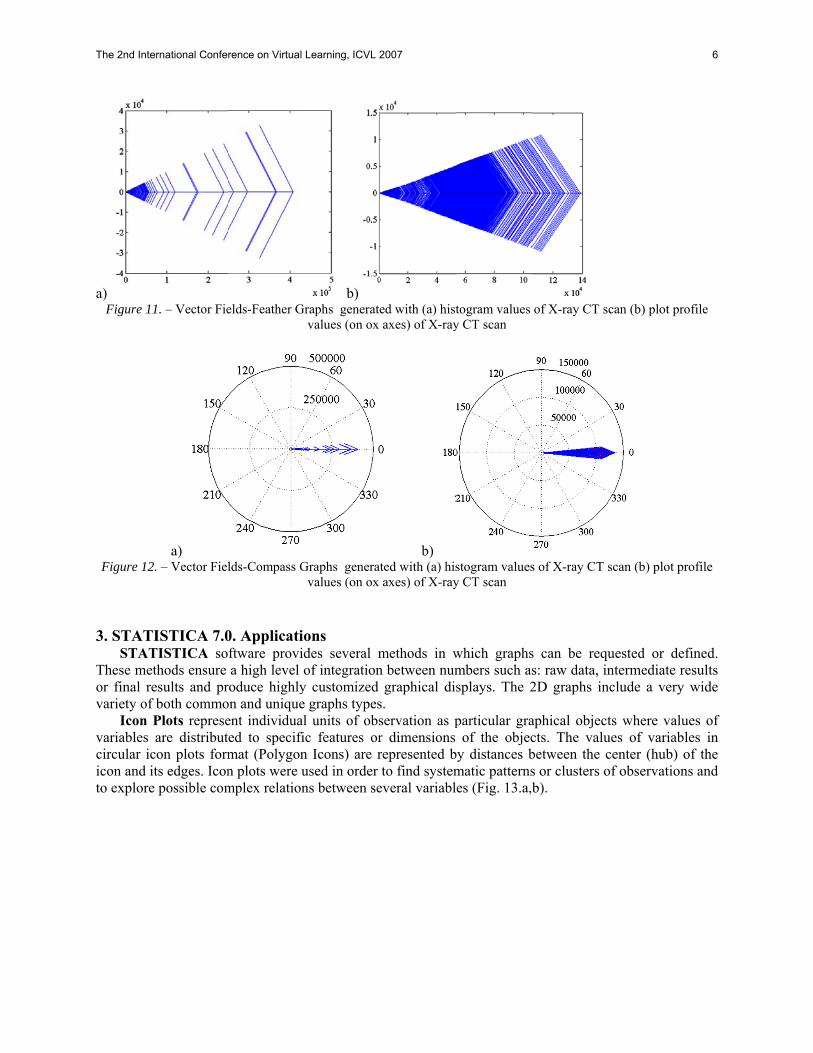
1. – Vector Fie
a)2. – Vector Fiel
TISTICA 7.0TISTICA soethods ensure esults and prf both commoPlots represeare distribut
con plots formits edges. Icone possible com
elds-Feather G
lds-Compass G
0. Applicatioftware provida high level o
roduce highlyon and uniqueent individualed to specifimat (Polygonn plots were umplex relation
b)Graphs generate
values (on ox
Graphs generatvalues (on ox
ons des several mof integration
y customized e graphs typesl units of obsic features orn Icons) are rused in order ns between se
ed with (a) histaxes) of X-ray
b)ted with (a) hisaxes) of X-ray
methods in wn between num
graphical diss. servation as pr dimensions represented bto find system
everal variabl
togram values y CT scan
stogram valuesy CT scan
which graphsmbers such assplays. The 2
particular graof the objec
by distances bmatic patternses (Fig. 13.a,b
of X-ray CT s
s of X-ray CT s
s can be requs: raw data, in2D graphs in
aphical objectcts. The valubetween the cs or clusters ob).
can (b) plot pro
scan (b) plot pr
uested or dentermediate r
nclude a very
ts where valuues of variabcenter (hub) oof observation
ofile
rofile
fined. results
wide
ues of les in of the ns and
The 2nd International Conference on Virtual Learning, ICVL 2007 6
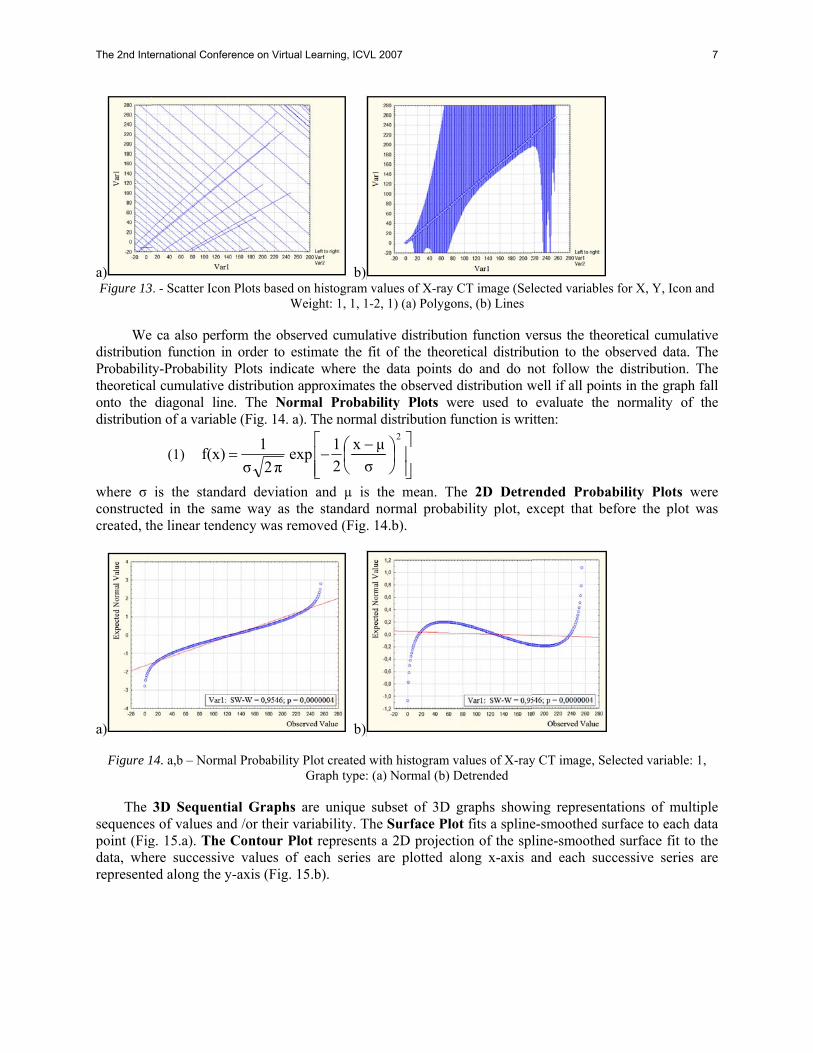
a)Figure 13
We
distributioProbabilittheoreticaonto the distributio
where σ constructecreated, th
a)
Figure 1
The
sequencespoint (Figdata, wherepresente
. - Scatter Icon
ca also perfoon function inty-Probability al cumulative
diagonal lineon of a variabl
(1) f(x)
is the standaed in the samhe linear tend
14. a,b – Norma
3D Sequentis of values ang. 15.a). The ere successived along the y
n Plots based onWe
orm the obsern order to est
Plots indicatdistribution ape. The Normle (Fig. 14. a)
= exπ2σ
1
ard deviationme way as thdency was rem
al Probability P
ial Graphs and /or their vaContour Ploe values of y-axis (Fig. 15
b)
n histogram vaeight: 1, 1, 1-2
rved cumulatitimate the fitte where the
approximates tmal Probabi. The normal
⎢⎢⎣
⎡⎜⎝⎛ −
−σμx
21p
n and µ is the standard nmoved (Fig. 1
b)
Plot created wiGraph type: (a
are unique suariability. Theot represents each series a5.b).
alues of X-ray , 1) (a) Polygo
ive distributiot of the theor
data points the observed lity Plots wdistribution fu
⎥⎥⎦
⎤⎟⎠⎞
2μ
the mean. Thnormal proba4.b).
ith histogram va) Normal (b) D
ubset of 3D e Surface Ploa 2D projecti
are plotted al
CT image (Selons, (b) Lines
on function vretical distribudo and do ndistribution w
were used to unction is wri
he 2D Detreability plot, e
values of X-rayDetrended
graphs showot fits a splineion of the spllong x-axis a
lected variable
ersus the theoution to the onot follow thewell if all poin
evaluate theitten:
ended Probaexcept that be
y CT image, Se
ing represente-smoothed suline-smoothedand each suc
s for X, Y, Ico
oretical cumuobserved datae distributionnts in the grape normality o
ability Plotsefore the plo
elected variable
tations of muurface to eachd surface fit tccessive serie
on and
ulative a. The n. The ph fall of the
were ot was
e: 1,
ultiple h data to the es are
The 2nd International Conference on Virtual Learning, ICVL 2007 7
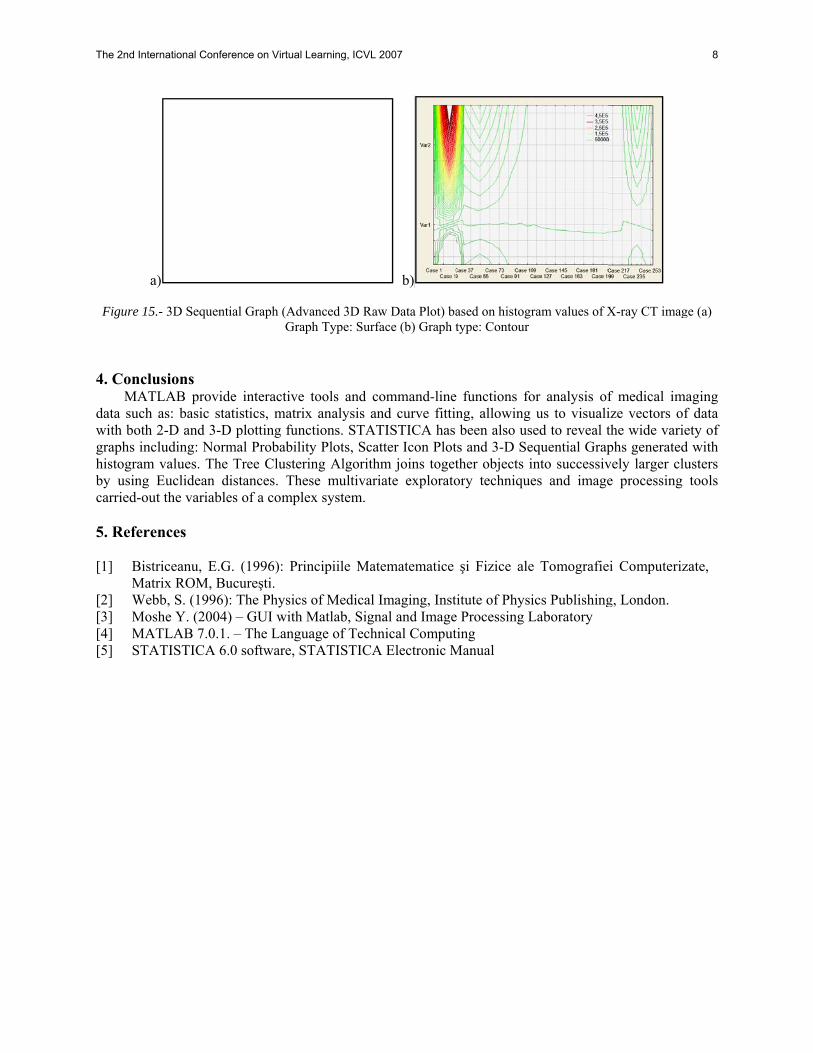
a Figure 15
4. Concl
MATdata suchwith bothgraphs inchistogramby using carried-ou 5. Refere [1] Bist
Mat[2] Web[3] Mo[4] MA[5] STA
a)
5.- 3D Sequent
usions TLAB providh as: basic sta 2-D and 3-Dcluding: Norm
m values. The Euclidean d
ut the variable
ences
triceanu, E.Gtrix ROM, Bubb, S. (1996)she Y. (2004)
ATLAB 7.0.1.ATISTICA 6.
tial Graph (AdvGra
de interactiveatistics, matriD plotting funmal Probabili
Tree Clusterdistances. Thees of a compl
G. (1996): Priucureşti. : The Physics) – GUI with . – The Langu.0 software, S
vanced 3D Rawaph Type: Surfa
tools and coix analysis annctions. STATity Plots, Scatring Algorithmese multivariex system.
incipiile Mat
s of Medical IMatlab, Sign
uage of TechnSTATISTICA
b)
w Data Plot) baace (b) Graph t
ommand-linend curve fittinTISTICA has tter Icon Plotm joins togetiate explorato
ematematice
Imaging, Instnal and Imagenical Comput
A Electronic M
ased on histogrtype: Contour
functions fong, allowing been also us
ts and 3-D Sether objects iory technique
şi Fizice ale
titute of Physie Processing Lting Manual
ram values of X
or analysis ofus to visualied to reveal t
equential Grapinto successives and image
e Tomografie
ics PublishingLaboratory
X-ray CT imag
f medical imize vectors ofthe wide variephs generatedvely larger clue processing
ei Computeriz
g, London.
ge (a)
maging f data ety of d with usters tools
zate,
The 2nd International Conference on Virtual Learning, ICVL 2007 8