Embed Size (px)
Citation preview

INTERNATIONAL JOURNAL OF GEOMATICS AND GEOSCIENCES
Volume 3, No 3, 2013
© Copyright by the authors - Licensee IPA- Under Creative Commons license 3.0
Review article ISSN 0976 – 4380
Submitted on January 2013 published on March 2013 645
Digital image processing and geospatial analysis of landsat 7 ETM+ for
mineral exploration, Abidiya area, North Sudan Sami O. El Khidir, Ibrahim A.A.Babikir
Faculty of Petroleum & Minerals, Al Neelain University, Khartoum, Sudan
ABSTRACT
Digital data of Landsat Enhanced Thematic Mapper Plus (ETM+7) was used in mineral
exploration investigations for the area around Abidiya area, North Sudan. The studied area
consists of Precambrian crystalline basement rocks. The oldest geologic unit comprises basic
and ultrabasic rocks associated with metacherts overlain by island arc-related
metavolcanosedimentary sequences, these units have been overlain by supracrustal
metasediments and intruded by magmatic granitic intrusions. Regional structures manifested
by the Nakasib suture and Keraf shear zones. Several digital image processing “DIP”
techniques applied on the multispectral bands (1, 2, 3, 4, 5 & 7) were demonstrated in the
context of geological mapping and mineral exploration. Dual techniques of analyses have
been carried-out to enhance and delineate the alteration zones related to gold mineralization.
Mineralization zones can be identified by their spectral signatures of the alteration products
iron oxides, hydroxyl-bearing minerals, carbonates and quartz-feldspars minerals. Alteration
map have been produced based on the band ratio techniques produced from Sabin’s band
ratio color composite image (bands 5/7, 3/1 and 3/5 in the R G B, respectively). Another
alteration map produced by using the Feature Oriented Principal Selection technique (FPCS),
named as Crosta alteration color composite image. The Crosta image based on a selective
principal component analysis for some bands. Both alteration images have been supervised
classified and vectorized. Geospatial analysis of the vectorized layers proved to support the
demarcation of the mineralization zones. These zones are aligned with the sheared and
metamorphosed basic and ultrabasic and metacherts, and controlled by the shear fractures.
The metasomatic replacements associated with the shear activities could be responsible for
enhancing the mineralization in this area, which gave high signals in the alteration map.
Keywords: Landsat 7, Spectral enhancement, image transformation, FPCS, alteration zone,
geospatial analysis.
1. Introduction
Remote sensing has been widely used in natural sciences since the last century. It has been
used in many geological applications as geological mapping, mineral exploration,
geotechnical and hydrogeological investigations. In Sudan many researches involve the
optical and radar remote sensing data have been conducted (Abdelsalam, et al., 1995; Kenea,
1997; Mohamed, 1997, Elsayed, 2002; Ali, 2005; El Khidir, 2006 and Babikir, 2006).
Exploitation of remote sensing images in mineral exploration is well understood by
enhancing geological mapping, mapping the regional lineaments and structural trends,
mapping local fracture and faults to delineate localized ore deposits and recognize
hydrothermally altered rocks by their spectral signatures (Sabins, 1997, 1999).
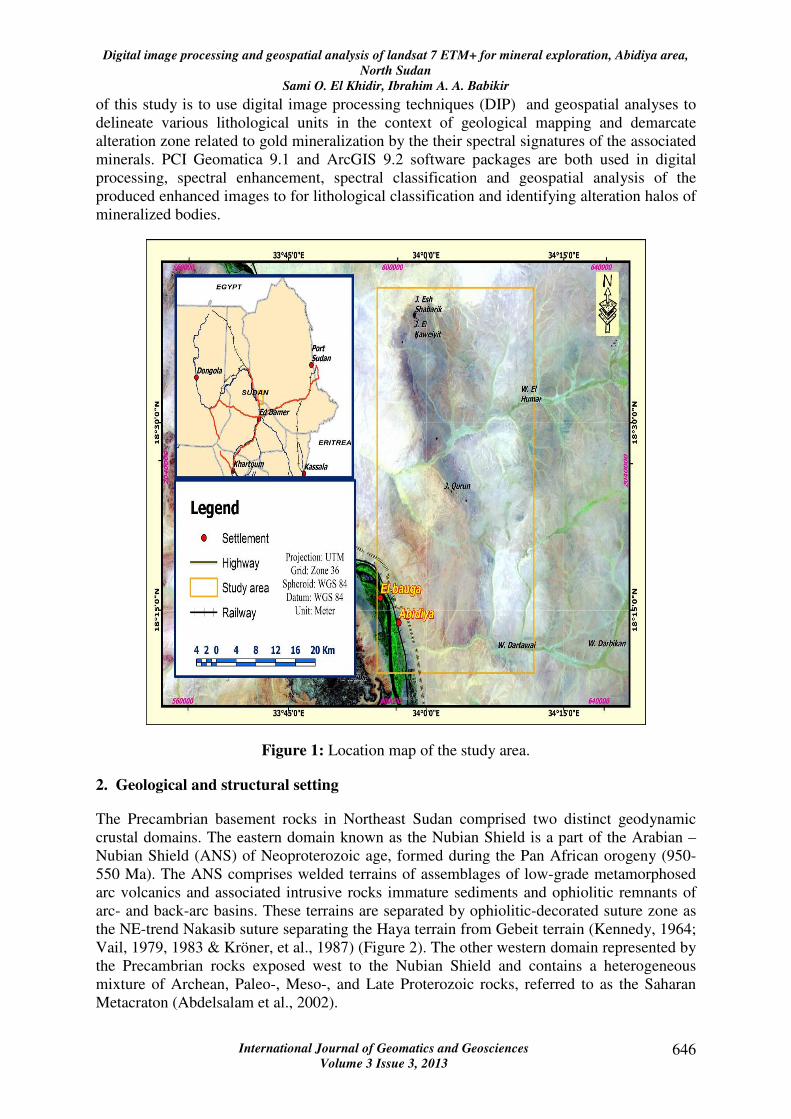
The study area lies east of Abiydia town, River Nile State, North Sudan. It is bounded by
Latitudes 18º 10` and 18º 40` N and longitudes 33º 55` and 34º 10` E (Figure 1). The purpose
Digital image processing and geospatial analysis of landsat 7 ETM+ for mineral exploration, Abidiya area,
North Sudan
Sami O. El Khidir, Ibrahim A. A. Babikir
International Journal of Geomatics and Geosciences
Volume 3 Issue 3, 2013 646
of this study is to use digital image processing techniques (DIP) and geospatial analyses to
delineate various lithological units in the context of geological mapping and demarcate
alteration zone related to gold mineralization by the their spectral signatures of the associated
minerals. PCI Geomatica 9.1 and ArcGIS 9.2 software packages are both used in digital
processing, spectral enhancement, spectral classification and geospatial analysis of the
produced enhanced images to for lithological classification and identifying alteration halos of
mineralized bodies.
Figure 1: Location map of the study area.
2. Geological and structural setting
The Precambrian basement rocks in Northeast Sudan comprised two distinct geodynamic
crustal domains. The eastern domain known as the Nubian Shield is a part of the Arabian –
Nubian Shield (ANS) of Neoproterozoic age, formed during the Pan African orogeny (950-
550 Ma). The ANS comprises welded terrains of assemblages of low-grade metamorphosed
arc volcanics and associated intrusive rocks immature sediments and ophiolitic remnants of
arc- and back-arc basins. These terrains are separated by ophiolitic-decorated suture zone as
the NE-trend Nakasib suture separating the Haya terrain from Gebeit terrain (Kennedy, 1964;
Vail, 1979, 1983 & Kröner, et al., 1987) (Figure 2). The other western domain represented by
the Precambrian rocks exposed west to the Nubian Shield and contains a heterogeneous
mixture of Archean, Paleo-, Meso-, and Late Proterozoic rocks, referred to as the Saharan
Metacraton (Abdelsalam et al., 2002).

Digital image processing and geospatial analysis of landsat 7 ETM+ for mineral exploration, Abidiya area,
North Sudan
Sami O. El Khidir, Ibrahim A. A. Babikir
International Journal of Geomatics and Geosciences
Volume 3 Issue 3, 2013 647
Figure 2: Sketch map of the main tectonic domains, Precambrian structures, major shear and
suture zones of the Arabian- Nubian shield “ANS” (Modified after Ali, 2005).
The boundary between the two domains is still a matter of debate; Bailo (2000) suggested
that the N trending Keraf shear zone (KSZ) in northern Sudan defines the northern boundary
between those two Precambrian crusts. While Kuster and Liegeois (2000) based on
geochemical and geochronological data argued that the eastern boundary of the East Saharan
Craton lie below or more to the west. The NE trending Nakasib Suture Zone (NSZ) represent
the most prominent suture zone in the Red Sea Hills (Abdelsalam and Stern 1990). The study
area comprises different lithological units (Ali, 2005; El Khidir, 2006). Based on the
geological and structural situation the ophiolitic mafic-ultramafic sequences represent the
oldest rock unit. Ali (2005) reported and described in details the mafic ultramafic masses in
the intersection area between the Keraf Shear Zone and the Nakasib Suture Zone. The new
masses are located in the same trend of the Oshib ophiolitic rocks decorating the Nakasib
suture zone (Abdelrahman, 1993). The basic-ultrabasic rocks associated with layers of low

Digital image processing and geospatial analysis of landsat 7 ETM+ for mineral exploration, Abidiya area,
North Sudan
Sami O. El Khidir, Ibrahim A. A. Babikir
International Journal of Geomatics and Geosciences
Volume 3 Issue 3, 2013 648
grade metachert sediments, overlain by metavolcanosedimentary sequences, which comprise
a series of basic to intermediate island arc volcanic assemblage and supracrustal
metasediments. The above units were intruded by syn- to late- and post-orogenic intrusions.
Cretaceous sediments represented by Nubian Sandstone group is the Phanerozoic units in the
area. Quaternary and recent deposits are manifested in the alluvial wadi deposits, Nile silts
and the superficial aeolian sediments (Figure 3).
3. Digital Image Processing
Digital image processing of the multispectral remotely sensed data is carried –out in order to
improve the appearance of the images and enhance information extraction in the geological
context. In this perspective the various techniques adopted here is improve the visual
geological interpretation and automated spectral signatures extraction related to the altered
halos of the mineralized bodies.
Figure 3: Geological map of the study area
3.1 Image enhancement techniques
Image enhancement techniques adopted in this study compromised different spectral
techniques. Spectral enhancement can be carried by simple contrast stretching technique to
enhance certain spectral characteristic features in the digital images. Contrast stretching is
one of the most simple, important and widely used methods. It deals with rescaling of grey
levels to the entire digital number (DN) range so that features of interest are better shown in
Digital image processing and geospatial analysis of landsat 7 ETM+ for mineral exploration, Abidiya area,
North Sudan
Sami O. El Khidir, Ibrahim A. A. Babikir
International Journal of Geomatics and Geosciences
Volume 3 Issue 3, 2013 649
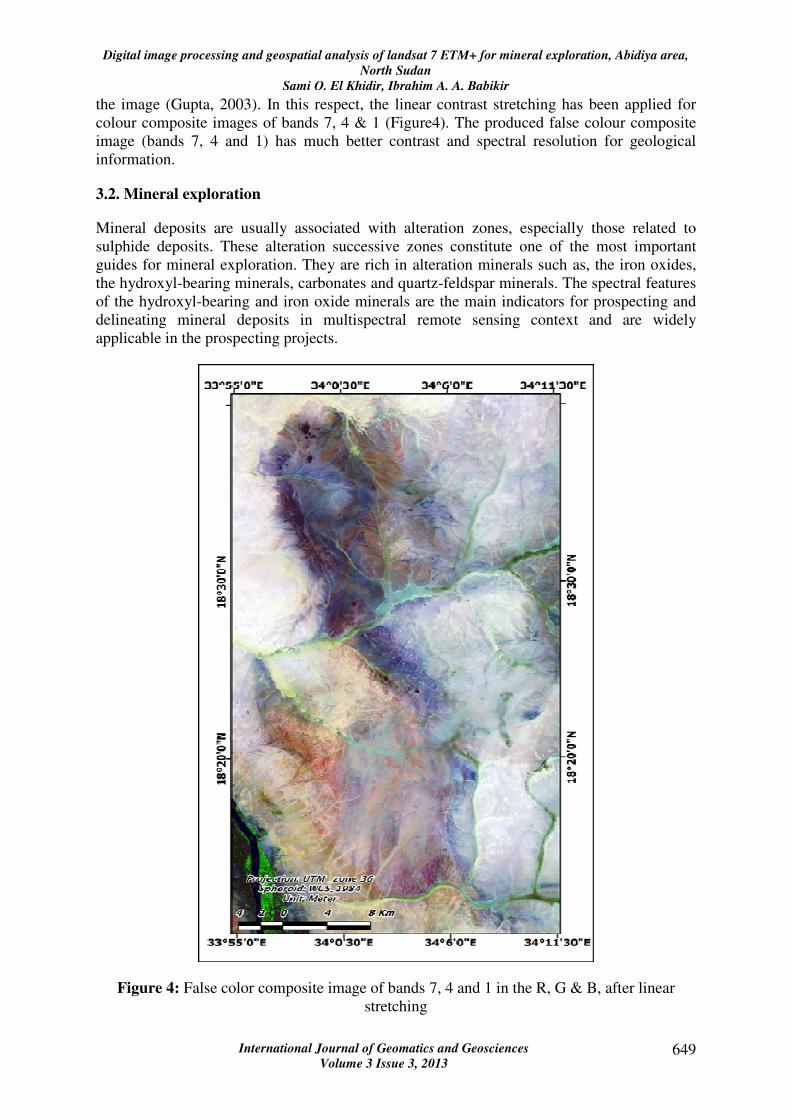
the image (Gupta, 2003). In this respect, the linear contrast stretching has been applied for
colour composite images of bands 7, 4 & 1 (Figure4). The produced false colour composite
image (bands 7, 4 and 1) has much better contrast and spectral resolution for geological
information.
3.2. Mineral exploration
Mineral deposits are usually associated with alteration zones, especially those related to
sulphide deposits. These alteration successive zones constitute one of the most important
guides for mineral exploration. They are rich in alteration minerals such as, the iron oxides,
the hydroxyl-bearing minerals, carbonates and quartz-feldspar minerals. The spectral features
of the hydroxyl-bearing and iron oxide minerals are the main indicators for prospecting and
delineating mineral deposits in multispectral remote sensing context and are widely
applicable in the prospecting projects.
Figure 4: False color composite image of bands 7, 4 and 1 in the R, G & B, after linear
stretching

Digital image processing and geospatial analysis of landsat 7 ETM+ for mineral exploration, Abidiya area,
North Sudan
Sami O. El Khidir, Ibrahim A. A. Babikir
International Journal of Geomatics and Geosciences
Volume 3 Issue 3, 2013 650
In this context, digital image processing directed towards enhancing the alteration zones
related to gold mineralization in the study area. The techniques adopted to pinpoint
mineralized zones by their spectral signatures of the alteration mineral products, can be
summarized as follows
1. Image transformation by band ratio technique; examines the results of band
ratioing image related to iron oxide and hydroxyl-bearing minerals alterations.
2. Creation of false color composite (FCC) image from ratio bands technique
{Sabin’s ratio image}. Identifying alteration zone by the spectral characteristics
of the iron oxide and hydroxyl-bearing minerals alterations.
3. Image transformation by Feature Oriented Principal Component Selection
(FPCS). This method is to map the iron oxides minerals and hydroxyl- bearing
minerals by unadjusted principal component analysis for some selected bands;
examine the results of FPCS image as set as F-image (iron oxide alteration), H-
image (hydroxyl-bearing minerals) images.
4. Creation of FCC from the FPCS products (F-images, {F + H image}, H-image
in the R, G and B, respectively).
5. Supervised classification for both FCC images to delineate alterations to
produced two thematic maps.
6. GIS-based geospatial analysis for vectorized thematic supervised classified
maps. The geo-spatial analysis used to illuminate the alteration zones.
3.2.1 Band ratioing images
A band ratio image is created by dividing brightness values, pixel by pixel, of one band by
another. The primary purpose of such ratios is to enhance the contrast between objects by
dividing brightness values at peaks and troughs in a spectral reflectance curve. This tends to
enhance spectral differences and suppress illumination (topographical) differences. Ratios
can be used to differentiate objects if those objects have characteristic spectra. A false color
composite can then be made in which each ratio band is assigned one of the three primary
colors with the lighter parts (high DN values) of the band contributing more color to the
composite.
In mineral exploration band ratioing is widely used to enhance the spectral feature of the
alteration zones depending on the absorption bands of their altered minerals. For example
iron oxides (ferrous and ferric oxides) minerals are illuminated by band ratio 3/1, 3/5 and 5/4,
while band ratio 5/7 is used for detecting high values of the hydroxyl-bearing minerals
(kaolinite, illunite, muscovite, epidotes, chlorites, amphiboles) (Gupta, 2003). In this context,
band ratioing techniques have been applied to obtain indicator in the form of iron oxides
alteration image by dividing the DN of band 3 over DN of band 1, additionally, ferrous
oxides alteration supported by another band ratio of band 3/band 5. Similar technique adopted
to acquire criteria of the altered hydroxyl-bearing minerals related to mineralization zones.
This image produced in the form of DN band 5/ DN of band 7. The results of band ratioing
have been subjected to low-pass filter, smoothing is used to eliminate small zones lesser that
90x90 m. Simple linear stretching produce a pleasant grey-scale images. These alteration
zones have evidently depicted by grey scale images of the band ratio ones. A false coloured

Digital image processing and geospatial analysis of landsat 7 ETM+ for mineral exploration, Abidiya area,
North Sudan
Sami O. El Khidir, Ibrahim A. A. Babikir
International Journal of Geomatics and Geosciences
Volume 3 Issue 3, 2013 651
image have been created by combine the results of band ratioing in the form of (R=5/7, G=
3/1, B=3/5), which is called Sabins's ratio coloured image (Figure5). The obtained image
portrays gossans and alteration zones in crimson reddish hues due to high contents of their
iron oxides and clay minerals (Sabins, 1997).
3.2.2 Principal Component Analysis (Feature Oriented Principal Component Selection
“FPCS”
Feature Oriented Principal Component Selection (FPCS) is a method to select some bands of
the image not all to run a principal component transformation. The selected bands are
believed to exhibit spectral information over an intended target (Crosta and Mc. Moore,
1989). This method developed by Loughlin (1991) to map alteration zones and it is well
known by Crosta image. Theoretically, it is known that the iron oxides minerals and
hydroxyl- bearing minerals display absorption bands in range of bands 1 and 7 in the ETM+7
data, respectively. Hence, two sets of four selected bands are transformed by unadjusted
principal component analysis. The eigenvector loadings are carefully examined to define
which Principal Components (PCs) contain information related to the target objects.
Figure 5: Band ratio transformations images (A) Iron oxides alteration map (band ratio3/1),
(B) Hydroxyl-bearing minerals alteration (band ratio 5/7) (C) Sabin’s color composite image
(bands 5/7, 3/1 and 3/5 in the R, G and B) showing alteration zones in crimson reddish hues.
Usually, in the principal component transformation the first and the second components are
excluded, since they reflect the general albedo and topography for the first PCA and the
second component differentiate between the VNIR bands against the SWIR bands. Special
smoothing techniques applied to the higher order components, displaying the desired
information, as they often contain noises. The result is grey-scale image that depicted the
target object in contrasting response.

Digital image processing and geospatial analysis of landsat 7 ETM+ for mineral exploration, Abidiya area,
North Sudan
Sami O. El Khidir, Ibrahim A. A. Babikir
International Journal of Geomatics and Geosciences
Volume 3 Issue 3, 2013 652
Following Crosta technique to map alteration zones (Crosta and Mc. Moore, 1989). The ETM
bands 1, 3, 4 and 7 are transformed to obtain the PCs, which are defining iron oxides richer
zones. The obtained PC image is called F-image, while the ETM bands 1, 4, 5 and 7 are
transformed to depict zones richer in hydroxyl-bearing minerals (H-image). These images are
produced after examining the eigenvector loading for both sets (Tables 1 and 2), which are
PC4 in both produced images.
An obtained F- and H- grey scale images are used to examine the displayed zones. A false
colour composite image "Crosta alteration image" is produced after displaying the
hydroxyl delineating image (H-image) in the red channel, the iron oxide defining image (F-
image) in the blue channel and the mathematical added image (H-image + F-image) in the
green channel after smoothing by low-pass filter: The image defines alteration zones usually
in terms of their iron oxides and clay minerals richer zones by reddish yellowish hues The
filtering operation is carried in order to remove or subdue effects of the incorporated
significant noise from the high-order PCs as it is often expected and then result in improving
the hues in the data (Figure 6).
Table 1: Eigenvectors of covariance matrix (bands 1, 3, 4 and 7), for mapping the iron oxide
minerals alteration zones in the study area
PC / bands Band 1 Band 3 Band 4 Band 7
Mean 37.14 94.68 112.82 100.73
Stand. Dev. 8.21 18.48 19.14 17.36
PC1 0.24235 0.57341 0.57824 0.52736
PC2 - 0.07327 - 0.27598 - 0.31637 0.53678
PC3 - 0.53034 0.54009 - 0.18672 - 0.62624
PC4 - 0.80910 0.55076- - 0.17127 - 0.20391
Table 2: Eigenvectors of covariance matrix (bands 1, 4, 5 and 7), for mapping the hydroxyl –
bearing minerals alteration in the study area
PC / bands Band 1 Band 4 Band 5 Band 7
Mean 37.14 112.82
107.12 100.73
Stand. Dev. 8.21 19.14 17.88 17.36
PC1 0.23723 0.58191 0.56233 0.53748
PC2 0.04131 0.78261 -0.31637 -0.53454
PC3 -0.96864 0.16672 0.17127 0.06786
PC4 0.06119 -0.14531 0.74455 -0.64848

Digital image processing and geospatial analysis of landsat 7 ETM+ for mineral exploration, Abidiya area,
North Sudan
Sami O. El Khidir, Ibrahim A. A. Babikir
International Journal of Geomatics and Geosciences
Volume 3 Issue 3, 2013 653
Figure 6: Results of the FPCS transformations, (A) F-image for iron oxides alteration map
by FPCS of bands 1, 3, 4 and 7. (B) H-image for Hydroxyl-bearing minerals
alteration by FPCS of bands 1, 4, 5 and 7. (C) Crosta’s color composite image (H-
image in red, (H-image + F-image) in green and F-image in blue) showing alteration
zones in yellowish orange-red hues.
3.2.3 Supervised classification
Supervised classified maps were produced from the Sabins's and Crosta’s colour composite
images. Maximum likelihood algorithm have adopted for both images after providing
adequate eight training areas. The separability between the training areas is good and shows
results lesser than 2 and is 1.5 in average, which indicate the presence of good spectral
signatures for each class. The resultant maps have been filtered by sieve filter to eliminate the
small noisy areas to produce pleasant maps. These maps clarify the alteration zoned class
from the unaltered fresh rocks classes and the River Nile one (Figure 7).
4. GIS Geospatial Analysis
The obtained classified maps (Figure 7) are vectorized to polygon feature class and
reclassified, whereby alterations layers from both maps are extracted to two new layers.
Geospatial overly analysis by intersect processing give new alteration map. This final GIS
layer directly depicts alteration zones from both original images (Figure 8).

Digital image processing and geospatial analysis of landsat 7 ETM+ for mineral exploration, Abidiya area,
North Sudan
Sami O. El Khidir, Ibrahim A. A. Babikir
International Journal of Geomatics and Geosciences
Volume 3 Issue 3, 2013 654
(A) (B)
Figure 7: Supervised classified maps of the Sabin’s color composite image, (A), and Crosta
colored alteration image (B).
Figure 8: Alteration map produced after the spatial analysis of the classified transformed
images, overlay on the satellite imagery and the geological map.

Digital image processing and geospatial analysis of landsat 7 ETM+ for mineral exploration, Abidiya area,
North Sudan
Sami O. El Khidir, Ibrahim A. A. Babikir
International Journal of Geomatics and Geosciences
Volume 3 Issue 3, 2013 655
5. Results and discussion
The results obtained from band transformations process in Figure (5 a), shows the band ratio
3/1 in grey-scale, the image depicts high iron oxide minerals signature on alteration areas as
well as on sedimentary rock and alluvial wadi deposits. This is attributed to the ferruginous-
capping of the sedimentary sandstones and the richness of these minerals in the alluvial wadi
deposits. On the other hand, hydroxyl-bearing minerals images (Figure5 b) exhibits high
signature in similar alteration zones. Similarly, high signals displayed over the Nile silts and
alluvial wadi deposits, which attributed to their high contents of clay minerals. It is clear that
both band ratio images are not enough in displaying the alteration zones in term of the grey-
scale image (Figure 5(a) and (b)). The produced Sabins’s ratioing colour composite image
(band ratios 5/7 in red, 3/1 in green and 3/5 in blue) displays target zones in distinguishable
crimson red hues (Figure 5 c). Some of these alterations attributed to the alteration zones and
others related to weathering products of the ferruginous sandstones and basic-ultrabasic rocks.
Statistical results of eigenvectors loading of the Principal Component transformation for the
four selected bands 1, 3, 4 and 7, show that the PC4 has good contrast in the values between
band 3 and band 1 to differentiate areas with high content of iron oxide minerals of alteration
zones (Table 1). However, the obtained F-image is unsatisfactory (Figure 6 a), high values of
iron oxide minerals in many parts, on alteration zones, in alluvial sediments, the
metasediments and parts of the sedimentary sandstones. In another hand, H-image that
defining the hydroxyl-bearing minerals have been generated after the Principal Component
analysis being applied to the selected bands 1, 4, 5 and 7. Statistics show that the PC4 has
good contrast in the values between band 5 and band 7 to differentiate areas with high content
of clay minerals of alteration zones (Table 2). The obtained H-image (Figure 6.b) displayed
high values on alluvial deposits and over many other places. The Crosta’s color image
portrays the suspected alteration zones in brighter yellowish orange and whitish hues (Figure
6. C). High signals define extended alteration zones. Undesirable similar hues resulted from
the alluvial sediments in drainage system; this attributed to their high contents of the clay
minerals.
Simple supervised classification have been carried out on both colored composite images
(Sabin’s and Crosta’s), the high separability of the training areas encourage using the
maximum likelihood algorithms. The classified maps define eight main classes. Raster to
vector conversion produced eight-class polygon layer. The geo-spatial analyses have been run
on the extracted alteration zones class layers. A new intersected alteration zones layer
expresses the correlated high signals in both images.
Figure (8) exhibits the result of the digital image enhancement of remotely sensed data and
the geospatial analysis for the study area, which portrays alteration zones related to gold
mineralization. These alterations appear as extended zone aligned parallel to Jebel Qurun –
Jebel El Kaweiyit, highly associated with the basic and ultrabasic rocks and the associated
metacherts in the area. Other small alteration spots appear in the southern area at alluvial
wadis, these related here to the weathering products of the weathered metabasites and the
carbonate rocks.
5.1 Conclusions
This work demonstrate that the utilizing of remote sensing and GIS techniques in geological
mapping and mineral exploration. It proved that digital image processing can afford
exploration criteria for quick and fast exploration projects. In this study Landsat 7 ETM +

Digital image processing and geospatial analysis of landsat 7 ETM+ for mineral exploration, Abidiya area,
North Sudan
Sami O. El Khidir, Ibrahim A. A. Babikir
International Journal of Geomatics and Geosciences
Volume 3 Issue 3, 2013 656
data was used to study the area around Abiydia town, the River Nile State, North Sudan. Dual
transformation methods were applied for mineral exploration. The band ratioing technique is
generated to enhance the mineralized areas by spectral signatures of iron oxide and clay
minerals in the alteration zones. Feature Oriented–Principle Component transformations
(Crosta’s image) have been utilized for the same purpose. Two lithological maps
demonstrating different lithological units associated alteration zone have been produced after
supervised classification. The depicting of alteration zone is carried by GIS-geospatial
analysis in both maps. The resultant map shows that these zones are associated with basic and
ultrabasic rocks and the associated metacherts.
However, these technique is should be taken with cautious because some lithologies possess
similar spectral signatures, such a drawdown can be overcome by integrating the structural
data in the geospatial analyses.
Acknowledgements
The authors highly acknowledge the Faculty of Petroleum and Minerals, Al Neelain
University to sponsor and facilitate the study. Remote Sensing group of Prof. List at FU-
Berlin are acknowledged for providing satellite data and facilities of digital image processing.
Rida Mining Company is thanks for hosting during fieldwork.
6. References
1. Abdelrahman, E. M., (1993), Geochemical and geotectonic controls of the
metallogenic evolution of selected Ophiolite complexes from the Sudan. Berliner
Geowiss. Abh. A. 145, pp 175.
2. Abdelsalam, M. and Stern, R., (1990), Structure and tectonic evolution of the Late
Proterozoic Nakasib Suture, Red Sea Hills, Sudan-15th Colloq. Of African Geol.,
Nancy, Abstract, Centre Internet. Pour la Formation et les Exchange Geologiques,
Occ. Publ., 20, pp 240.
3. Abdelsalam, M. G., Stern, R.J., Schandelmeier, H., Sultan, M., (1995),
Deformation history of the Keraf Zone in NE Sudan, revealed by Shuttle Imaging
Radar. Journal of Geology. 103, pp 475-491.
4. Abdelsalam, M.G., Abdelrahman, E. M., El-Faki, E. M., Al-Hur, B., El-Bashier, F.,
Stern, R. J. and Thurmond, A. K., (2002), Neoproterozoic deformation in the
northeastern part of the Saharan Metacraton, northern Sudan. Precambrian
Research. 123, pp 203-221.
5. Ali, E. A., (2005), The Geology and structural evolution of the area around the
River Nile Between Atbara and Abidiya, Nile State, Sudan; remote Sensing,
structural and geochemical approaches. (M. Sc. Thesis). Al Neelain University,
Khartoum, Sudan.
6. Babikir, I, A, A. (2006), Digital Image Processing of Landsat7 data and GIS
Application for Geological Investigation in Jebel Erba Area, Red Sea Hills, NE
Sudan. (Ph. D. Thesis). Al Neelain University, Khartoum, Sudan.

Digital image processing and geospatial analysis of landsat 7 ETM+ for mineral exploration, Abidiya area,
North Sudan
Sami O. El Khidir, Ibrahim A. A. Babikir
International Journal of Geomatics and Geosciences
Volume 3 Issue 3, 2013 657
7. Bailo, T. (2000), Keraf Shear Zone, NE Sudan: Geodynamic characteristics of the
Nile Craton-Nubian Shield boundary (Ph. D. thesis). Technical University Berlin.
8. Crosta, A. P. and McM. Moore, J.: (1989), Enhancement of Landsat Thematic
Mapper Imagery for Residual Soil Mapping in SW Minais Gerais State, Brazil: A
Prospecting Case History in Greenstone Belt Terrain. Proceedings of the 7th
(ERIM) Thematic Conference: Remote Sensing for Exploration Geology. Calgary,
2-6 Oct, pp. 11733-1187.
9. El Khidir, S. O., (2006), Remote Sensing and GIS Applications in Geological
Mapping, prospecting for minerals deposits and groundwater Berber Sheet Area,
Northern Sudan. (Ph. D. Thesis). Al Neelain University, Khartoum, Sudan.
10. El Sayed, K.A., (2002), Application of remote sensing in geological mapping,
hydrogeological investigation and mineral exploration, Red Sea Hills northeastern
Sudan. (M.Sc. Thesis). Geology Department, University of Khartoum, Sudan.
11. Gupta, R. P. (2003), Remote sensing Geology. 2nd edition, Springer, Germany.
12. Kenea, N.H., (1997), Digital enhancement of Landsat data, spectral analysis and
GIS integration for geological studies of the Derudeb area, southern Red Sea Hills,
Sudan. Berliner. Geowissenschaftliche. Abhandlungen, D, 14, pp 116.
13. Kennedy, W.Q., (1964), The structural differentiation of Africa in the Pan-African
tectonic episode. Research Institute of African Geology, University of Leeds
Annual Report 8, pp 197- 225.
14. Kröner, A., Greiling, R., Reischmann, T., Hussein I. M., Stern, R.J. Durr, S.,
Kruger, J. and Zimmer, M., (1987), Pan- African crustal evolution in the Nubian
segment of the northeast Africa. In: Kröner, A. (ed.), Proterozoic lithospheric
evolution. American Geophysical Union, Geodynamics Series, 17, pp 235-257,
Washington.
15. Kuster, D., and Liegeois, J. P., (2001), Sr, Nd isotopic and geochronological study
of high-grade metamorphic lithologies from Bayuda Desert, Sudan-New insights
into the Neoproterozoic evolution of the East Saharan Ghost Craton. Precambrian
Research, 109, pp 1-23.
16. Loughlin, W. P. (1991), Principal Component Analysis for Alteration Mapping.
Photogrammetric Engineering & Remote sensing, Vol. 57(9), pp 1163-1169.
17. Mohamed, A. A., (1997), Digitally Processed Landsat Thematic Mapper (TM) as
advanced technique for geological mapping, North Kordofan State, Sudan.
University of Khartoum, Sudan. (M. Sc. Thesis).
18. Sabins, (1997), Remote Sensing; Principals and Interpretation, 4th ed., pp. 449, San
Francisco (Freeman).
19. Sabins, (1999), Remote Sensing for Mineral Exploration, Ore Geology Reviews, 14,
pp 157-183, Elsevier.

Digital image processing and geospatial analysis of landsat 7 ETM+ for mineral exploration, Abidiya area,
North Sudan
Sami O. El Khidir, Ibrahim A. A. Babikir
International Journal of Geomatics and Geosciences
Volume 3 Issue 3, 2013 658
20. Vail, J. R., (1979), Outline of geology and mineralization of the Nubian Shield east
of the Nile Valley, Sudan. In: TAHON, S. A. (ed.), Evolution and mineralization of
the Arabian- Nubian Shield, Proceed. Symp. 2, pp 97-107, Oxford (Pergamon
press).
21. Vail, J. R., (1983), Pan-African crustal accretion in north-east Africa, Journal of
African Earth Science., 1, pp 3-4.