Embed Size (px)
Citation preview

NTIA Report 89-247
Digital European BackbonePerformance:
A 12-Month Summaryfor the Frankfurt North Segment
J. A. HoffmeyerT. J. Riley
u.s. DEPARTMENT OF COMMERCERobert A. Mosbacher, Secretary
Janice Obuchowski, Assistant Secretaryfor Communications and Information
August 1989


PREFACE
Certain commercial equipment, instruments, or materials are identified in this report to
adequately specify the experimental process. In no case does such identification imply recom
mendation or endorsement by the National Telecommunications and Information
Administration, nor does it imply that the material or equipment identified is necessarily the
best available for this application.
11l


CONTENTS
Page
LIST OF FIGURES
ABSTRACf
VI
1
1. INTRODUCfION 1
2. NPC/LPCDATAACQUISmONSYSTEM 4
3. DRAFT MIL-SID-188-323 PERFORMANCE OBJECfIVES 6
4. SUMMARY OF MEASUREMENT RESULTS AND COMPARISON WITH 9MIL-SID OBJECTIVES
4.1 Analysis of Individual Links 94.1.1 Schwarzenborn-to-Feldberg (SBN-FEL) Link Analysis 94.1.2 Berlin-to-Bocksberg (BLN-BBG) Link Analysis 164.1.3 Bocksberg-to-Koeterberg (BBG-KBG) LinkAnalysis 194.1.4 Koeterberg-to-Rothwesten (KBG-RWN) Link Analysis 224.1.5 Rothwesten-to-Schwarzenborn (RWN-SBN) Link Analysis 224.1.6 Linderhofe-to-Koeterberg (LDF-KBG) Link Analysis 22
4.2 End-To-End Channel Analysis 224.2.1 Linderhofe-to-Feldberg (LDF-FEL) Channel 264.2.2 Berlin-to-Feldberg (BLN-FEL) Channel 26
5. CONCLUSIONS 29
6. ACKNOWLEDGMENTS 32
7. REFERENCES 33
v
LIST OF FIGURES
Page
Figure 1. Frankfurt North Phase I segment of DEB. 3
Figure 2. NPC/LPC data acquisition system inputs and outputs. 5
Figure 3. Schwarzenborn-Feldberg errored seconds and unavailability time. 11
Figure 4. Schwarzenborn-Feldberg errored second performance and number of 12seconds that the received signal level is below the rsl threshold forDRAMA radios.
Figure 5. Summary of the numberff errored seconds and the number of seconds the 13rsl is less than the 1x 10- BER threshold.
Figure 6. Schwarzenborn-Feldberg received signal levels recorded by TRAMCON. 15
Figure 7. Schwarzenborn-Feldberg received signal levels recorded by NPC/LPC data 15acquisition equipment.
Figure 8. Schwarzenborn-Feldberg rsI's for the receiver on line. 17
Figure 9. Berlin-Bocksberg errored seconds and unavailability time. 18
Figure 10. Berlin-Bocksberg rsI's recorded by LPMS System. 20
Figure 11. Bocksberg-Koeterberg rsI's recorded by TRAMCON. 21
Figure 12. Koeterberg-Rothwesten rsI's recorded by TRAMCON. 23
Figure 13. Rothwesten-Schwarzenborn rsI's recorded by TRAMCON. 24
Figure 14. Linderhofe-Koeterberg rsI's recorded by TRAMCON. 25
Figure 15. Linderhofe-Feldberg errored seconds and unavailability time. 27
Figure 16. Berlin-Feldberg errored seconds and unavailability time. 28
VI

DIGITAL EUROPEAN BACKBONE PERFORMANCE:
A 12-MONTH SUMMARY FOR THE FRANKFURT NORTH SEGMENT
*J. A. Hoffmeyer and T. J. Riley
This report describes the interim results of an 18-month digitalmicrowave transmission network performance and propagation measurementproject that was conducted on a portion of the Defense Communications System(DCS) in West Germany. Only the first 12 months of data are summarized inthis report. More than 3 gigabytes of data were collected between April 1988and March 1989. The report provides the results of bit error rate measurementsmade at the 56-kb/s user level on one long (99-km) line-of-sight (LOS) link andat the 64-kb/s user level on two end-to-end channels consisting of multiple LOSand/or troposcatter radio links. The report also provides summaries of12 months of received-signal-level (rsl) measurements on five LOS links andone troposcatter link.
Keywords: DEB; digital radio performance; DRAMA; LOS propagation; militarystandard (MIL-SID); multipath fading; propagation measurements; radiooutages; transmission system performance standards; troposcatter
1. INTRODUCTION
This report describes the interim results of a digital transmission network performance
and propagation measurement program on the Frankfurt North Phase I (FKT-Nl) segment
of the Digital European Backbone (DEB). The report provides the results of two separate,
but highly interrelated, projects:
• Defense Communications System (DCS) Network Performance Characterization(NPC)
• Schwarzenborn-Feldberg Link Performance Characterization (LPC)
The goals of the NPC project are to obtain long-term (18-month) end-to-end perfor
mance data on two 64-kb/s channels and to measure or estimate the contributions to error
performance from each ofthe individual links in the end-to-end channel. The goals of the LPC
project are to characterize Digital Radio and Multiplexer Acquisition (DRAMA) radio
performance on a long line-of-sight (LOS) link and to provide specific measurements to
support the NPC project.
*The authors are with the Institute for Telecommunication Sciences, NationalTelecommunications and Information Administration, U.S. Department of Commerce,Boulder, CO 80303-3328

The data resulting from the NPC/LPC measurements will be used to refine DCS digital
transmission criteria, link modeling and design methods, and to quantify DRAMA equipment
performance on tandem LOS links (see Thomas et aI., 1979, for a description of the DRAMA
equipment). There is no existing data base on long-term DRAMAperformance. The data also
will be used to determine if improvements to the DRAMA radio are required.
The DEB is a U.S.-owned and -operated digital transmission network that stretches
across the European theater from the United Kingdom to Italy. The majority of the links are
LOS microwave radio links that utilize DRAMA radios and multiplexers. Two of the links are
troposcatter radio links. Figure 1 depicts the FKT-N1 Segment of DEB.
The NPC measurements consist of end-to-end digital performance measurements on
two 64-kb/s channels. The first channel, from Berlin to Feldberg (BLN-FEL), consists of one
troposcatter link in tandem with four LOS microwave links. The second channel, from
Linderhofe to Feldberg (LDF-FEL), consists of four tandem LOS links. As can be seen in
Figure 1, three of the LOS links are common to both the BLN-FEL and LDF-FEL channels.
The LPC error performance and propagation measurements are made on the
Schwarzenborn-to-Feldberg (SBN-FEL) LOS microwave link. The LPC data are integrated
with the NPC data in a common data base. Both parts of this integrated data set are needed
to characterize the system performance of the FKT-N1 segment of DEB and to compare this
performance with that specified by draft MIL-STD-188-323 (DCEC, 1985; Smith and
Cybrowski, 1985).
This measurement program was not conducted as a retest of the FKT-N1 segment of
DEB. Instead, the joint measurement program is considered to be a characterization of actual
64 and 56-kb/s user performance achieved on a portion of the DCS. A major purpose of this
characterization is to determine the adequacy of draft MIL-STD-188-323 for the performance
specification of transmission networks within the DCS. The criteria and allocations contained
in draft MIL-STD-188-323 require validation with performance data from actual operational
tandem links. Prior to this effort, there was no existing data base on long-term 64 and 56-kb/s
user end-to-end performance in a multi-tandem digital link network. It should be emphasized
that draft MIL-STD-188-323 contains design objectives that may be more stringent than the
operational specifications that may be found in the Defense Communications Agency Cir
culars such as DCAC-300-175-9 entitled DCS-Operating-Maintenance Electrical Perform
ance Standards (DCA, 1986).
A second major purpose of the measurement program i~ to quantify the DRAMA radio
performance on an actual link within the DCS rather than on a test link such as the one at
2


Pt. Mugu (Hubbard, 1983). Both the NPC and the LPC projects are long-term (18-month)
measurement programs in contrast to the DEB link tests, which are 72-hour tests.
The general objectives of the NPC/LPC Program are to
• verify existing DCS link design methods, models, and criteria• compare measured performance with draft MIL-STD-188-323• compare measured performance with CCITT Recommendation G.821• quantify DRAMA radio performance on long LOS links and investigate alternative
methods of DRAMA radio space diversity switching
To achieve these objectives, the Institute for Telecommunication Sciences installed
equipment at the following DEB sites: Berlin, Bocksberg, Linderhofe, Schwarzenborn, and
Feldberg. The following section provides a summary of the data acquisition system.
2. NPC/LPC DATA ACQUISITION SYSTEM
Figure 2 depicts all of the inputs to the NPC/LPC data acquisition system, which is
located at the DEB site at Feldberg, GE. In addition to bit-error-rate test-set (BERTS)
information, data collected on the NPC/LPC projects include data obtained from two monitor
systems: the Transmission Monitor and Control (TRAMCON) System and the
Berlin-Bocksberg (BLN-BBG) Link Performance Monitor System (LPMS). (See Farrow and
Skerjanec, 1986 for a description ofTRAMCON. The LPMS system is described in the manual,
"Link performance monitoring system program manual" prepared for U.S. Air Force Systems
Command, Electronic Systems Division by the developer, REL, Inc. under contract no.
F19628-86-C-0037 (March 1987).)
The data summarized in this report includes the following:
• BER data sampled five times per second• SBN-FEL rsl data sampled five times per second• TRAMCON rsl data on five links (sampled once every 100 seconds)• LPMS rsl data on the BLN-BBG troposcatter link based on an average of48 samples
per second for each of the four receiver/antenna configurations
The BERTS are placed on the two end-to-end channels (BLN-FEL and LDF-FEL) and
on the SBN-FELlink. The two end-to-end channel measurements are made on 64-kb/s mission
channels, while the SBN-FEL link performance measurement is made on a 56-kb/s service
channel. The BERTS transmitters interface with the FCC-98 multiplexer through multirate,
digital data cards at Berlin, Linderhofe, and Schwarzenborn. The BERTS receivers interface
with the FCC-98 multiplexer data cards at Feldberg.
The TRAMCON data for the entire FKT-N1 segment of DEB are integrated into the
NPC/LPC data base. This report will summarize the rsl portion of the TRAMCON data only.
The five links for which TRAMCON rsl data are summarized in this report are
4

DRAMA RADIOSTATUS SIGNALS
1 J
TRAMCON
CHANNEL B~~~TFS~LPROBE LDF-FEL
SBN-FEL
,...NPC/LPC
DATA ACQUISITION I I LPMSSYSTEM
VI
• ~
~
I~
METEOROLOGICALDATA
, ,
~ ...oIIIl
50-MBYTE DATA TAPE 800-K-CHAR DATA TAPE DAILY PRINTOUTSPRODUCED EACH WEEK PRODUCED EACH WEEK
Figure 2. NPC/LPC data acquisition system inputs and outputs.

• Bocksberg to Koeterberg (BBG-KBG)• Koeterberg to Rothwesten (KBG-RWN)• Rothwesten to Schwarzenborn (RWN-SBN)• Schwarzenborn to Feldberg (SBN-FEL)• Linderhofe to Koeterberg (LDF-KBG)
Normally, the TRAMCON rsl data are saved in histogram form for a period of24 hours
only. For the NPC/LPC program, a special modificationwas made to the TRAMCON software
that permits the transfer of data from the TRAMCON Master computer at Feldberg to the
NPC/LPC data acquisition system, allowing the NPC/LPC system to archive the TRAMCON
data for the entire data collection period (April 1988 through September 1989).
The LPMS System is a special monitoring system that was designed to provide rsl
measurements on each of the four receivers on the BLN-BBG troposcatter link and estimates
of the following:
• signal-to-noise ratio (SNR)• bit-error-ratio (BER) performance of mission bit-stream• number of errored seconds• multipath dispersion• multipath fade rate• multipath fade duration• intersymbol interference (lSI)
Only the rsl data from the LPMS system will be described in this report. This system,
which was not designed by ITS, suffered a number offailures during the course ofthis program,
resulting in incomplete LPMS data.
This interim report does not summarize the multipath fading data on the SBN-FEL link
obtained from the channel probe and spectrum analyzers or the meteorological data, which
are useful in the detailed analysis of specific multipath fading periods. The DRAMA radio
signals (signal quality monitor voltages, samples of the DRAMA radio receiver spectrum, and
measures of the spectral amplitude distortion) and space-diversity improvement information
are not described in this report. These data will be summarized in the final report.
3. DRAFT MIL-STD-188-323 PERFORMANCE OBJECTIVES
The draft MIL-STD-188-323, entitled "System Design and Engineering Standards for
Long Haul Digital Transmission System Performance, "provides individual and tandem link
performance objectives for unavailability (VA) time, errored seconds, transmission delay,
jitter, and mean-time-to-loss-of bit count integrity. Data relevant to all of these parameters
were recorded during the NPC/LPC program. Only the VA time and errored seconds design
objectives and measured data are reported in this interim report. It should be emphasized that
6

Unavailability:
Propagation ES:
Equipment ES:
draft MIL-STD-188-323 contains design objectives that are more stringent than the
operational specifications found in Defense Communications Agency Circulars such as
DCAC-300-175-9, entitled "DCS Operating-Maintenance Electrical Performance Standards"
(DCA, 1986).
The CCITT (International Consultative Committee for Telephone and Telegraph) has
standards that are somewhat similar to draft MIL-STD-188-323. Comparisons with this
international standard will not be made in this report. However, it should be noted that the
CCITT performance standards (CCITT, 1980) and draft MIL-STD-188-323 are equally
demanding.
UA time is defined in draft MIL-STD-188-323 as "any loss of continuity or excessive
channel degradation (average BER greater than 10(-4) on the 64 kb/s voice and data user
channel, which occurs for a period of 60 consecutive seconds (one minute) or greater ...)." The
errored seconds that fall into the UA time category are subtracted from the total number of
recorded errored seconds to find the errored seconds (ES) performance quality parameter,
l.e.:
ES quality parameter = total errored seconds - unavailability time errored seconds.
As shown in Table 1, the design objectives for UA time and errored seconds (ES) are
li2S Tropo
2.47 x 10⁻⁴ 8.54 x 10⁻⁴
(6.25 x 10⁻⁷) • D (7.1875 x 10⁻⁶) • D
5.8375 x 10⁻⁵ 7.7 x 10⁻⁵
D = link distance in km
The above numbers represent the fraction of time that a user channel on a link is allowed
to contain errors. For example, the unavailability design objective for an LOS link for 1 year
IS
(2.47 x 10-4) x (24 hours/day) x (365 days/year) = 2.1 hours per year.
The errored-second design objective for propagation is distance-dependent as a result of the
"D" parameter in the above ES allocations.
Table 1 applies the draft MIL-STD-188-323 UA and ES allocation design objectives
summarized above to the LOS and troposcatter link data from the FKT-N1 segment of DEB.
A comparison ofthese UA and ES design objectives with the 12 months of NPC/LPC measured
data is provided in the next section.
7

00
Table 1. Proposed M1L-STD-188-323 Unavailability and Quality (ES) Objectives for FKT- N1
Patb Type Una'VoUabUityQuality (ES per year)
Patb u-natb 01 Objective Commenta(Iun) link (bouro) Propa&alion Equipment End-lo-End
Objectl¥'e Objcclive Objeclive
64 kb/s userBerlin- Feldberg
467.4One tropo and
16.1452.466
9,79262,258 channel be-
(BLN-FEL) tour LOS links (14.57 hours) (17.29 hours) tween Berlinand Feldberg
64 kb/s user
Linderhote-Feldberg Four LOS 11,590channel
(LDF-FEL) 214.4tandem links 8.65 4.226 7.364 (3.22 hours)
betweenLinderhofe
and Feldberg
Berlin- Bocksberg209.0 Tropo 7.46
47.3732,428
49.801(BLN-BBG) (13.16 hours) (1383 hours)
Bocksberg - Koeterberg72.0 LOS 2.16 1.419 1,841 3,260(BBG-KBG)
Koeterberg - Rothwesten31.0 LOS 216 611 1.841 2,452(KBG-RWN)
Rothwesten-Schwarzenborn56.0 LOS 2.16 1,104 I.B41 2,945(RWN-SBN)
56 kb/s serviceSchwarzenborn-Feldberg
99.4 LOS 2.16 1.959 1.841 3,800channel between
(SBN-FEL) Schwarzenbornand Feldberg
. Linderhote-Koelerberg2B.0 LOS 2.16 552 I,B41 2.393(LDF-KBG)
LOS: Unavailability = 2.47 x 10-'Propagation ES = 6.25 X 10-7 x 0Equipment ES = [(1-0.999533)/8.01
D = distance in km
TROPO: Unavailability = 8.54 x 10-Propagation ES = 7.1875 x 10.... x 0Equipment ES = [(1.0-0.999456)-(1.0-0.999533)]
= 7.7 x 10 -6

4. SUMMARY OF MEASUREMENT RESULTS AND COMPARISON WITH MIL-STD
OBJECTIVES
This section summarizes 12 months of rsl and error-performance data. This is done first
for the individual links in th~ FKT-Nl segment of DEB and then for the two end-to-end
channels (LDF-FEL and BLN-FEL). The rsl data include TRAMCON and LPMS data as well
as direct measurements from the NPC/LPC system for the SBN-FEL link.
During the period from April 1988 through March 1989, the NPC/LPC data acquisition
system recorded 7,866 hours of data. The total number of hours during a year is 8,760, so the
7,866 hours of recorded data represent 89.8% of the maximum hours possible in a year. The
NPC/LPC data acquisition system has proven to be a very reliable system.
4.1 Analyses of Individual Links
Data were collected on one troposcatter link and five LOS links in the FKT-Nl segment
of DEB. The troposcatter link is from Berlin to Bocksberg, West Germany. The LOS links are
BBG-KBG, KBG-RWN, RWN-SBN, SBN-FEL, and LDF-KBG. Rsl data in the reverse
direction (e.g., KBG-LDF) from the TRAMCON and LPMS systems are available but are not
analyzed in this report.
The only individual link for which link-error-performance measurements were made is
the SBN-FEL link. Ideally, one would like to make error-performance measurements on each
individual link comprising the end-to-end channel. This would have been a difficult and
expensive undertaking for this segment of DEB because there are no "breakouts" to 64-kb/s
user channels at several of the nodes (Bocksberg, Koeterberg, Rothwesten, and Schwarzen
born). Measurements on each individual link would require the installation of FCC-99 and
FCC-98 multiplexers at those sites. Additional data acquisition equipment also would be
required.
4.1.1 Schwarzenborn-to-Feldberg (SBN-FEL) Link Analysis
The DRAMA radio performed well on the SBN-FEL link. Figure 3 is a plot of the total
errored seconds and VA time for each month from April 1988 through March 1989. The left
vertical axis provides the scale for errored seconds, while the right vertical axis provides the
scale for VA time.
Only 2,347 errored seconds were recorded during the year. Of the 2,347 total errored
seconds, only 788 seconds (0.22 hours) were identified as being unavailable (60 consecutive
seconds each having a I-second average BER of 1x 10⁻⁴ or worse). As Figure 3 shows, periods
9

of unavailability occurred in April 1988 and February 1989 only. The 0.22 hours of VA time
are well within the draft MIL-STD-188-323 design criteria of 2.16 hours for this link (see
Table 1 for application of the draft MIL-STD-188-323 to the SBN-FEL link).
There were 1,559 errored seconds remaining after subtracting the unavailable seconds.
The long-term (annual) ratio of seconds that are errored to the 7,866 hours of recorded data
is 5.5 x 10⁻⁵. Since the MIL-STD design objective is 3,800 errored seconds for this link (see
Table 1), the measured data fall well within both the VA time and errored seconds criteria for
this link.
In Figure 3, it is of interest to note the months in which significant errored seconds
occurred. January was the worst month with 955 errored seconds, followed by September with
212 errored seconds. This reduced performance is due to multipath fading on this link as seen
from plots of rsl data from TRAMCON and the NPC/LPC system.
Figure 4 is a dual plot of errored-second data and rsl data. The errored-second bars
represent seconds in which at least one error occurred. One error in one second for the 56-kb/s
service channel corresponds to a BER of 1.79 x 10⁻⁹. The rsl bars represent the number of
seconds in which the DRAMA radio receiver-on-line (ROL) is below the rsl minimum
threshold and an error occurred on the ROL. The rsl threshold is -73 dBm for a 1x 10⁻² BER
for a 26-Mb/s quadrature partial response (QPR) DRAMA radio (CECOM, 1984, p. 1-6).
The DRAMA radio is a space-diversity radio. For purposes of discussion, we refer to
the two diversity receivers as Rx A and Rx B. The ROL is the receiver (A or B) that has been
selected by the DRAMA space-diversity switching algorithm. Figure 4 shows that the months
with the greatest number of errored seconds (January and September) also have the largest
number of seconds in which the ROL rsl is below the 10-2 threshold. The difference between
the two numbers for any given month is most likely due to the different BER thresholds (10-2
for the rsl data and 10-5 for the errored-second data). For a particular month, the difference
between the number of errored seconds and the number of seconds below the 10-2 threshold
also could be due to either frequency-selective fading or short (less than 60 seconds) equip
ment-caused error events. Frequency-selective fading results in signal distortions causing
errors in digital radios even though the rsl is well above the minimum required signal level.
(The effects of selective fading on a DRAMA radio performance are described in "Evaluation
of DRAMA radio performance in a simulated fading environment" (Hoffmeyer, J. A., and L.
E. Pratt (1987), NTIA Tech. Mem. 87-120).)
Figure 5 is a 12-month summary of
• the number of errored seconds that occurred in each receiver (ROL, Rx A, and Rx B)• the number of seconds that ROL, Rx A, and Rx B rsl's are individually below the
minimum signal level, and an error occurred in that receiver.

UA
ES
LEGEND
~
•LaJ:Ii=
~::Jiii:s:c(
~~::>
,-....~D::::>C):I:---
164 , 0
-------------------~.9
--------------------.6
--------------------.~
-------------------~.4
--------------------.2
--------------------.3
--------------------.7
~OO~-------------------------------------------------- ---------------
300--------------------------------------------------- ---------------
400T-----~-----------------------------------------------------------
900~-------------------------------------------------- ---------------
600~-------------------------------------------------- ---------------
o I LL.!
200 -- ------------------------------------
800+-------------------------------------------------- ---------------~~------------------_t.8
100-----
~ 700T-----------------------------------------------------------------Cl~C)~~~
~~C)~~~
~C)
~~
CD:I=>~
1-1~0~~----- I 1.0
I
P--'l->
APR MAY JUN JUL AUG SEP OCT NOV DEC JAN FEB MARNPC/LPC DATA MEASUREMENT PERIOD (1988 - 1989)
L_________________ ES:Allowed-3800. Wea.ured-1.5S8: UA:A"owed..~.1. hrw. Wea.ured-O.22 hrw. I
Figure 3. Schwarzenborn-Feldberg errored seconds and unavailability time.

I 1200, ------ ... -, LEGEND
1000 -------------_._--------_._--------------.-----------------------_.----- ~
~
•ES
RSL SEC < BER TH.
..•
•0' '4 ... .;;..... -..... ... LL
~O+·--··---------·----·-----·-·--·------·-····--·--···---...-------------.
800~-------------------·--------------------··-----··-.---~--------- .. -----
200r------······-·--------·---·---!
enc:z:C) .oo~-----------------------------------------------------(.)l.I.Ien~
tv
APR JUN AUG OCT DEC FEB
MAY JUL SEP NOV JAN MARj NPC/LPC DATA MEASUREMENT PERIOD (1988 - 1989)ISP'-U-_TH .
Figure 4. Schwarzenborn-Feldberg errored second performance and number ofseconds that the received signal level is below the rsl threshold forDRAMA radios.

SUMMARY OF ERRORED SECOND AND RSL THRESHOLD STATISTICS
12000 i I
SEC < -73 dBrn
ES~
•t-
~r~~------------------
---------------------------------cn---------------------------------------DOenen~
o J Y£?«
1200 +- - -- -- - - - -- -V/,..</.,f.
2400 +- -------------en- -------------~/~IL1IL1
7200 +-- --- --- --- -- - -- - ------ ---- --- -fC/"/rA-
4800 +- -- - --- - --- --- - --- -- -- - -- -- - - -V~A
3600 +- ------- --- --- --- --- -- -- --- - --¥/A
8400 +- --- -- - - - - -- -- --- ---- - - - - -- -- -~"'/~
9600+------------------------------~~,,~------------------------------------
10800
enc~ 6000 +- - - - - - - - - - - - - - - - - - - - - - - - - - - - - - ¥/r"..............UL&Jen
"""'l..N
ROL Rx A Rx B
ItSL DATA ARE THE HU...1It 0,. SECONDS RSL < -75 ..am WHEN QUIIO" OCCUltED IH 1lIx.
Figure 5. Summary of the number:pf errored seconds and the number of seconds ther51 is less than the 1x 10- BER threshold.

Each receiver is treated independently. The errored-second ROL bar is the sum of the monthly
errored-second data provided in Figure 4.
In Figure 5, each bar for the rsl-below-threshold data represent the number of seconds
that a receiver's rsl was less than the minimum signal threshold when an error occurred in that
receiver. For example, there were 6,151 seconds during the year in which an error occurred in
Rx B and. the signal level for Rx B was below the minimum threshold. Obviously, errors also
can occur when the rsl is above the 10-2 BER threshold. The ROL bar for rslless than -73 dBm
is the sum of the 12 rsl bars shown on the previous figure.
The data provided by this figure can be used to calculate the space-diversity improve
ment factor since there are many more errors in either Rx A or Rx B than in the ROL. For
example, the ratio of the number of errors for Rx A to the number of errors for the on-line
receiver (9,989/1,559) is 6.4: 1. The ratio for Rx B to ROL(8,117/1,559) is 5.2: 1. Other measures
of the space-diversity improvement factor could be calculated. However, these data suggest
that a space-diversity improvement factor of ~pproximately6 can be used as a rule of thumb
for the DRAMA radio. The System Engineering Plan for the FKT-N1 Digital Upgrade Project
calculates a diversity improvement factor of 2,109 (CEEIA, 1981). However, Smith (1985,
p. 403) reports space-diversity improvement factors for other systems range from 6 to 38. Smith
and Cormack (1984) report a diversity improvement factor of 14.2 for a 90-Mb/s radio.
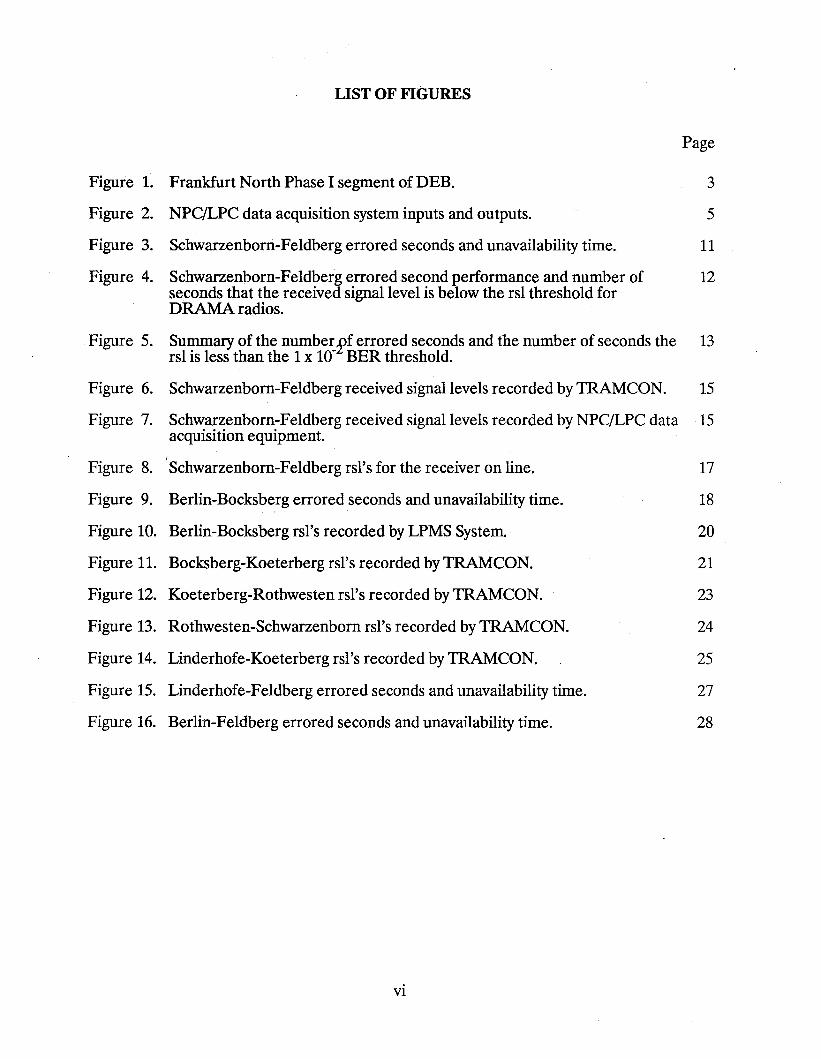
Figure 6 displays a 12-month summary of the rsl's recorded by TRAMCON on the
SBN-FEL link. Five curves are shown - two for each of the DRAMA radio's two space-diver
sity receivers and a horizontal line that shows the predicted unfaded threshold. The latter was
taken from the Systems Engineering Plan for FKT-N1 (CEEIA, 1981). The curves labeled
50% depict the monthly median rsl's, i.e., 50% of the rsl samples were greater than the monthly
value plotted and 50% of the rsl samples were less than the monthly value plotted. The 99.9%
data point indicates the monthly value at which 99.9% of the received signals were above and
0.1% of the received signals were below that level.
There are several points of interest regarding Figure 6. First,the rsl curves for Rx A and
Rx B are fairly close, indicating the antennas are properly aligned at both ends of the link.
Second, there is very little variation in the median (50%) values from month to month since
signal fading occurs a relatively small fraction of the time. Third, the worst fading months of
September, January and February were also the months with the worst error performance on
the SBN-FEL link (see Figure 4). Fourth, the median (50%) rsl is about 8 dB less than the
unfaded rsl predicted in the Systems Engineering Plan (CEEIA, 1981, p. 47).
14
-ao~-'----------------------,
-10 •••••••••••••••••••••••••••••••••••••••••••••••••••••••••••••••••••••••••••••••••
.........................................................................................
...........................................................................................:', ~-..\" ,r ~" .&
\\ // ~ //,, ill ' t ': ':l\/ ~ ~ 1,-' ~ •..........x '1~'" "" "J""""" Ji ·············.., .
.," '1~ 1 \ "~ # ; J.~ !{- \,.(,-70 1""' ~ # ... ~·:':'::i
_.0J.-_--+--__- __- ~_-__-_~
APR MAY JUN JUL AUG SEP OCT NOV DEC JAN FEB MARTRAMCON DATA MEASUREMENT PERIOD (15I1'S-lgSg)
LEGEND
)C Rx A (SO";)
o Rx B (SO~)
a Rx A (99.9~)
.. Rx B (99.9~)
• PREDICTED
Figure 6. Schwarzenborn-Feldberg received signal levels recorded by TRAMCON.
-ao~---------------------,
-10 •••••••••••••••••••••••••••••••••••••••••••••••••••••••••••••••••••••••••••••••••••
.........................................................................................
i -40 ....~.:;.....:t".:::....:1t.:::a::.........7....S4I:ie:~~.......:!.
...................................................................................,~..;::~\" ,~
.... ... ",A f i1011'* \ ,! It'w" \ f"'~: t
·································..\······t'f"···...······~~·············7~·····~, I ~\ I'.\/.' .\ I.~/ \\ I
-70 ........................................................••••• \~••••••••J••.••••••••.\ i~;'/.&.....l..._-........- __-_-__- - __--I
APR MAY JUN JUL AUG SEP OCT NOV DEC JAN FEB MARNPC/LPC DATA MEASUREMENT PERIOD. (ass - asg)
LEGEND
)C Rx A: SO.O";
o Rx B: SO.O";
.. Rx B: 99.1";
• PREDICTED
Figure 7. Schwarzenborn-Feldberg received signal levels recorded by NPC/LPC dataacquisition equipment.
15

Figures 6 and 7 are similar except that the former is a plot of rsl data measured by
TRAMCON while the latter is a plot of rsl data measured by the NPC/LPC system. The
TRAMCON system samples rsl on every link once every polling cycle. The length of the polling
cycle varies depending on the number of nodes in the DEB segment being monitored by the
TRAMCON master. For the FKT-N1 segment, the TRAMCON polling cycle is approximately
100 seconds long and the resolution of the TRAMCON rsl measurement is 1 dB. The
NPC/LPC rsl measurement equipment samples the rsl every 200 ms with a resolution of less
than 0.1 dB. This higher resolution and sample rate is required for the special objectives of the
NPC/LPC Program. As a result of the differences in the sampling rate between TRAMCON
and the NPC/LPC rsl measurement equipment, TRAMCON may miss a small number of
fading events that the NPC/LPC system would detect.
It should be noted that the rsl's recorded byTRAMCON (Figure 6) were about the same
for January and February but the number of errored seconds were 955 and 95, respectively
(see Figure 4). There is a possible explanation for this 10:1 errored-second ratio despite the
similarities in rsl's between the 2 months. Careful examination of Figures 6 and 7 for the
TRAMCON data and the NPC/LPC data for the 2 months shows slight differences between
the results from the two measurement systems. The TRAMCON rsl's are approximately
-72.5 dBm for both months, above the 10-2 BER threshold of -73 dBm. The NPC/LPC rsl's are
approximately -78 dBm at the 99.9% level for January (below the threshold) and -72 dBm for
February (above the threshold). The NPC/LPC system's measured rsl appears to be a more
accurate indicator of error performance than TRAMCON's measured rsl when dynamic fading
is a factor.
Figure 8 displays the SBN-FEL link's rsl for the ROL. The rsl's for Rx A and Rx Bare
sampled five times per second; however, the rsl for the ROL can be determined only when the
DRAMA radio status data are available. Status signals, which include an indication of which
DRAMA receiver is on-line, are recorded once every 60 seconds ill if an error occurred on
either Rx A, Rx B, or ROL. Because of this difference in the data base for the rsl data, caution
should be exercised in comparing Figures 7 and 8.
4.1.~ Berlin-to-Bocksberg (BLN-BBG) Link Analysis
Figure 9 is a plot of errored seconds and VA time for the BLN-BBG troposcatter link.
The data for this plot were obtained through a process of allocating end-to-end channel errors
to individual links which comprise the channel. For example, if an error occurred on the
BLN-FEL channel and nut on the LDF-FEL channel, it is assumed that the source of the error
was either the BLN-BBG troposcatter link or the BBG-KEG LOS link since the other links
16

-30. I
/3. - - - -& - - - - 0 - - - - 00- - - - -&- - - - 00- -- - -0-----0-"' - - - 0 -- - - -G- - - - -E)- - - - - £ILEGEND
......:l
-40
,-..E
D:I -50"0-.......JL&J
~...J< -80:zCo:)
iiicL&J>W0-70L&J£k::
-80
~-----. ----;)4~-~~~~
K _~ tt ~ _-----------.
. ---1\ _
1-1-----------.. -. ~----.-- ..--1\-.---.---------------:; \-------.--.-- 7 \ / \ J \
/ / ./ \ -----------'"", / \ \ r -----------T-----------'d \ __ L.---~-------T-- I------------------.-----\ I \ I \ !.
II \ I \ L _~ ----1------·-------------\- ,I-------------------------, / \ ,----------- \ \ /
\ I \_1.. _~ ·--------·----------it---_.---------------------------------------
x ROL: 50.0%
o ROL: 99.9%
c PREDICTED
-80 I I I I I I I I I I I I I I
APR MAY JUN JUL AUG SEP OCT NOV DEC JAN FEB MARNPC/LPC DATA MEASUREMENT PERIOD (1988 - 1989)
I RSL-ROL
Figure 8. Schwarzenborn-Feldberg rsl's for the receiver on line.

300000 I 130LEGEND
•
.......(Xl
250000~-------------------------------------------------------------------------------------
(/)CZ 200000------------------------------------------------------------------------------oULaJ(/)
CLaJD::oD:: 150000 -to- - - - - - - - - - - - - - - - - - - - - - - -v_--------------------------------------------------D::LaJ
u..oD::LaJm::::E 100000 ....- -::::)Z
:10000 ....---
0' r~ U
APR MAY JUN JUL AUG SEP OCT NOV DEC JAN FEB MAR
NPC/LPC MEASUREMENT PERIOD (1988 - 1989)
25
---..(/)
20 D::::::)o:::I:-...LaJ::::Ei=
15 ~
;!
:s4(
~10 Z:::)
5
o
~
•ES
UA
••-O-UA Allowoel annual ESt ......01: allowoel annual UAt 7.S hou,...
Figure 9. Berlin-Bocksberg errored seconds and unavailability time.

(KEG-RWN, RWN-SBN, and SBN-FEL) are common to both end-to-end channels and would
cause errors to occur on both channels. TRAMCON data were further utilized to allocate the
errors between these two links.
Application of draft MIL-STD-188-323 to the BLN-BBG troposcatter link result in a
design objective of 7.48 hours VA time and 49,801 errored seconds on an annual basis. The
total VA time estimate was 49.81 hours. The total errored seconds estimate was
1,101,551 seconds. Figure 9 shows the distribution of these numbers for each month from April
1988 through March 1989.
Due to the lack of a calibration procedure, the TRAMCON rsl data for the BLN-BBG
link were unreliable and could not be used. As a result, the rsl data for this link were taken
from the LPMS. Figure 10 presents the rsl's recorded by the LPMS at Bocksberg. The LPMS
rsl is a 1 second average of the outputs of each space-diversity receiver sampled at 48 times
per second. Two curves representing the 50% and 99.9% levels are displayed for each of the
four quad-space diversity receivers. The data are incomplete for the 12-month period of this
report because of failures with the LPMS. As stated earlier, ITS was not responsible for the
design, development, installation, operation, or maintenance of the LPMS.
There appears to be a difference ofseveral decibels between the rsl's of the four receivers
at Bocksberg. Because the maximum rsl difference is not always between the same two receiver
pairs, it is possible that the rsl differences between the receivers are due to inaccurate
calibration curves in the LPMS. The differences may also be due to differences in length of
waveguide runs to the receivers or misalignment of the antennas.
Note that the median and 99.9% rsl's are well below corresponding levels predicted in
the FKT-Nl System Engineering Plan (CEEIA, 1981, p. 90). Reasons for these differences are
under investigation.
Itshould be noted that the BLN-BBG link was not designed using the draft MIL-STD
188-323 performance criteria objectives but rather the current fade outage probability criteria
(DEB MEP, 1980). The fade outage criteria was met during the link acceptance testing.
4.1.3 Bocksberg-to-Koeterberg (BBG-KBG) Link Analysis
Figure 11 presents the rsl's for the BBG-KEG link obtained from TRAMCON. Two
curves (50% and 99.9%) are provided for each DRAMA radio receiver (Rx A and Rx B). With
the exception of the 99.9% data points for June 1988, the two receiver rsl's are very close,
indicating good antenna alignment. The Rx B 99.9% data point for June is an anomaly and is
due to a statistical artifact. As noted in Section 4.1.1, the worst rsl fading months for the
SBN-FEL link were September, January and February. The worst rsl fading months for the
19

--------_._-- ,-80 T------------------------------.I LEGEND
... 1, 50.0'1
_ _ Rx 2. 50.0'1
_ _ _ _ _ _ _ Rx 3. 50.0'1
_ _ _ Rx .... 50.0'1
.......... Rx 1. 88.8'1
_ _ _ Rx 2. 88.8'1
____ Rx 3. 88.8'1
_ ____ Rx .... 88.8'1
PREDICTED 50.0%
-- PREDICTED 99.9%
/-" ---------------------/ "- ---------- .... -----------~- ----.;:, -=;...~.- "--:.:.=/ ' '.~ .---------- /- /-- ~-_.~~~
L' __-: _-,-' --t --=::--=:: --=::. -- --------- -- --::.::::.::::_----------.---.::::-- --.::::_-- --- ---- i:....:,.: ------I :' . _
/\ --./. --------------"~~------------- 'l------.---------,7/;\\\ ",_,----- " i/ \ -\~":4~" J
•'" ;, . \ \ / •~:J-._..". / ..... \''--; .... '" ----
-----------~::~~:~---_ ..~:~..~~:~------_._-------------._---------_.-
-90
-70 +- --------------;. ---------------------------. --(!- -----------------------------,,
"
-80
-110
-100
tvo
-120' I I I I I I I I I I I I I
APR MAY JUN JUL AUG SEP OCT NOV DEC JAN FEB MARLPMS DATA MEASUREMENT PERIOD (1988 - 1989)
ftSL-IIII-L
Figure 10. Berlin-Bocksberg rsl's recorded by LPMS system.

N-
- 2°T----------------------------.I
-30+-----. • • .....-:::--~-----~ • ~~---------
...... JI'--,,~ ...-- ......... s/ -.
,:,A III .~ '\0 \
..Y' j,' ..'1!f'.......... ,·······+~·· .. ·+· .. ·I:~ ···+···· .. ·+· +·· .. ·..+..·\ ..+· ·.+ + +
~ -~o -------------~~.------ri--------~---------------------~--------------------------.... I / I •
--- '\' " ,.,Q-J ~ /: 'p-rL:-..'\~LLJ • 'k I ,.> ' I ' "'"1.1 ., "..... " ,"-J ~ : a:.:.--"0-J • I --a~ -50 ----------------~----~------------------------------------------------------------Z • I..... ' I- • I__ • I
en , I• I
'"' • I..... ,ILLJ • I> I'__ • I
LLJ .'~ -eo ------------------it--------------------------------------------------------------LLJ0:::
-70~----------------------------------------------------------------------------------
-80 I I I I I I I I I I I I I I
APR MAY JUN JUL AUG SEP OCT NOV DEC JAN FEB MARTRAM CON DATA MEASUREMENT PERIOD (1988 - 1989)
:Figure 11. Bocksberg-Koeterberg rsl's recorded by TRAMCON. i
LEGEND
x Rx A (50%)
0 Rx B (50%)
CJ Rx A (99.9%)
t:.. Rx B (99.9%)
+ PREDICTED

BBG-KBG link were June, February and March. Note that the median rsl's were well above
the 10-2 BER threshold provided in the FKT-N1 System Engineering Plan (CEEIA, 1981,
p.71).
4.1.4 Koeterberg-to-Rothwesten Link (KBG-RWN) Analysis
Figure 12 is a plot of TRAMCON rsl data for the KBG-RWN link. The two DRAMA
space-diversity receivers appear to track very well, as indicated by the closeness of the rsl's.
The worst signal fading month was December, but even during this month the Rx A and Rx B
rsl's were well above the DRAMA radio flat fade threshold. The median rsl's were slightly
below the unfaded rsl provided by the FKT-N1 SystemEngineering Plan (CEEIA, 1981, p. 56).
4.1.5 Rothwesten-to-Schwarzenborn Link (RWN-SBN) Analysis
Figure 13 is a plot of TRAMCON rsl data for the RWN-SBN link. Rsl's on the two
diversity receivers were nearly identical. January was the only month that appeared to have
any multipath fading activity. Even during this month the Rx A and Rx B rsl's at the 99.9%
level were well above the DRAMA radio flat fade threshold. The median rsl's were slightly
below the unfaded rsl provided by the FKT-N1System Engineering Plan (CEEIA, 1981, p. 51).
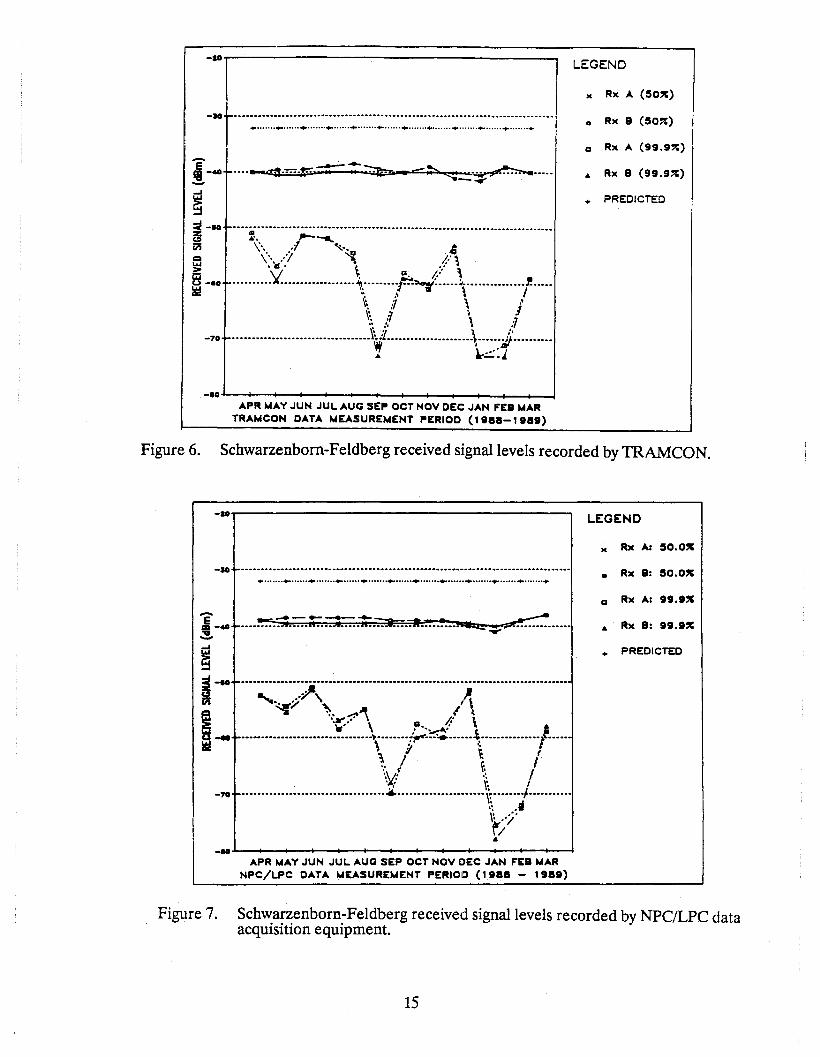
4.1.6 Linderhofe-to-Koeterberg (LDF-KBG) Link Analysis
Figure 14 is a plot of TRAMCON rsl data for the LDF-KBG link. In contrast to the
TRAMCON rsl data for other links, the Rx A and Rx B rsl's for the LDF-KBG link differ
significantly. There appears to be a consistent difference of about 4 or 5 dB between the rsl's
for the two receivers. The rsl differences may be due to antenna misalignment. This does not
appear to be a problem for this short (28-km) link because the rsl's remain well above the
DRAMA radio flat fade threshold. The median rsl's were slightly below the predicted unfaded
rsl provided by the FKT-N1 System Engineering Plan (CEEIA, 1981, p. 61).
4.2 End-To-End Channel Analyses
Channel measurements were made on two 64-kb/s mission channels: one from Linder
hofe to Feldberg (LDF-FEL) and one from Berlin to Feldberg (BLN-FEL). The reason for
the choice of the latter channel is that it provided a unique opportunity to make end-to-end
performance measurements on tandem LOS.and troposcatter links. The LDF-FEL channel
is comprised of only LOS links and can be used as a comparison between end-to-end channels
with and without a troposcatter link.

- 2 °T'------------------------------"
NW
-30
...-...E
CD -.0"0-...-JL&J>-~-I-< -50Z~
Vl
ClL&J
~L&J(.) -eoL&Ja:::
+·······+·······+·······+······~·:..:..:.··T·······+·······+· + ~.~ +-----...--..--......---&~~--~-~--~--e~-------------:.e-----
-~_.... ..... .IiI,
6 '" ,..-- ..... ' "-._ -·Iil \ / .£:1',.-......4--'~0r::4 ..
13- , ' ~ ./... \ ~ __ ...>' ~ p-,"-::--o'h/ _.- , 'A
----------------~'D~~-:=~--------------------------\-----------~~--------------
'\\ t.o", p, f
\'m"1'\/
--------------------------------------------------------~------------------------
LEGEND
x Rx A (50%)
0 Rx 8 (50%)
0 Rx A (99.9%)
A Rx 8 (99.9%)
+ PREDICTED
-70~------------------------------------·---------------------------------------------
-80..1...- I II I I I I ~=-~--+---+-- .I I I I I
APR MAY JUN JUL AUG SEP OCT NOV DEC JAN FEB MAR
L TRAMCON DATA MEASUREMENT PERIOD (1988 - 1989).__ ._. ._~ . " ..- • -----.. - . . ---.J
Figure 12. Koeterberg-Rothwesten rsl's recorded byTRAMCON.

•-20.....-
-30
.....-Em-40"1:11-."
-JL&J>~
+ + -t- + -t- + -t- + -t- :I-; -t- +
~-----------
--- .......-iii --a ", '-....: - -.. JA- -...-' -- , '"• """r -. - -lIIw-:: -. - O-----DI --EJ\ + '"....... ..,.... .. ..m- ... - ... - ",~ L.,
-----------~-_.-------------------------------------------~~--Jl------~~~-----
''M'
LEGEND
x Rx A (50%)
0 Rx B (50%)
0 Rx A (99.9%)
~ Rx B (99.9%)
+ PREDICTED
~
-J~ -50~----------------------------------------------------------------------------------
encL&J>Gjo -80 T- - - - - - - - - - - - --~ --------------------------------------,-----------------------------
-70·----------------------------------------------------------------------------------
. -80 I I I I I I I I I I I I I I
I APR MAY JUN JUL AUG SEP OCT NOV DEC JAN FEB MAR
IRSL-RS-T TRAMCON DATA MEASUREMENT PERIOD (1988 - 1989)
Figure 13. Rothwesten-Schwarzenbom rsl's recorded by TRAMCON. '._-- ---_.__._.__ .
LEGEND
x Rx A (50%)
0 Rx B (50%)
[J Rx A (99.9%)
A Rx B (99.9%)
+ PREDICTED
'»..
.................... -t- -t- -t- -t- -t- +
-----~--------• _ ..... __...-----e..-=-:"_~ --0.--. ---_._-----~-~----------------------
~- ---_..- - ~-- -- ----..,-:;.-------~
-30
-J
~-J-< -50Zot.iicL&J>Gj(.) -80L&J0:::
..........E
1:0-40"'0-
1°
NU\
-70 .....- - -- - - - -- - - - - - - - --- -- ----- .. - - -- -" -- - - - -- - -- - -- ----- -- .-- -- -- - -- - -- ---- - - -- -- - -- ---
-80 I I I I I I I I I I I I I I
APR MAY JUN JUL AUG SEP OCT NOV DEC JAN FEB MARTRAMCON DATA MEASUREMENT PERIOD (1988 - 1989)
IItSL-LJ(-TI ._. _ --_.._-----Figure 14. Linderhofe-Koeterberg rsl's recorded by TRAMCON.

4.2.1 Linderhofe-to-Feldberg (LDF-FEL) Channel
Figure 15 provides a summary of the monthly errored seconds and VA time for the
LDF-FEL channel. This end-to-end circuit does not meet draft MIL-SID-188-323 design
objectives. Application of the MIL-SID to this circuit results in design objectives of
11,590 errored seconds and 8.64 hours for VA time annually (see Table 1).
The errored seconds for each of three months (June, October, and November)
individually exceed the objective for the entire year. The total errored seconds for the year are
81,412 seconds. This errored seconds total is seven times the design objective. The
81,412 errored seconds represents a long-term (annual) errored seconds ratio of 2.87 x 10⁻³
for the 7,866 hours of recorded data.
The total VA time for the year is 11.07 hours. This total exceeds the design objective of
8.64 hours.
It does not appear likely that the effects of propagation (i.e., multipath fading) were the
primary cause of the degradation of performance on this end-to-end channel. One would
expect that the SBN-FEL link would make the largest contribution to outages due to fading
because it is by far the longest link of the four LOS links that comprise the LDF-FELchannel.
One would also expect the contribution to outage time due to equipment failures would be
approximately the same for each of the four links. As noted in Section 4.1.1, the performance
of the SBN-FEL link does meet the MIL-SID design objectives for both errored seconds and
unavailability.
It is interesting to compare Figure 15 with Figure 3 on a month-by-month basis. In
making this comparison, note that the vertical scales are not the same. The largest number of
errored seconds for the LDF-FEL channel is November (22,611 seconds). The same month
has the smallest number of errored seconds for the SBN-FEL link (2 seconds). The reason for
the large number of errored seconds on the end-to-end LDF-FEL channel is currently under
investigation.
4.2.2 Berlin-to-Feldberg (BLN-FEL) Channel
Figure 16 provides a summary of the monthly errored seconds and VA time for the
BLN-FEL channel. The figure shows this end-to-end circuit does not meet draft MIL-STD
188-323 design objectives. Application of the MIL-SID to this circuit results in design
objectives of 62,258 seconds and an VA time of 16.12 hours annually. The errored seconds for
each month of the year individually exceeds the annual errored-second design objective. The
total number of errored seconds for the BLN-FEL channel is 1,905,530 seconds. This is
31 times the design objective. The 1.9 million errored seconds represent a long-term (annual)
26

30000 I 18LEGEND
250001r-----------------------------------------------------------------------------------------r5
~
•ES
UA
o
----------.... 2
N~
enQ~ 20000(.,)LaJenQLaJ0:::o0::: 150000:::LaJ
I.&..o0:::LaJIn:::I! 10000:Jz:
5000 _. - - - - - - -- - - - -----
0' L&
-------------- ~___________________ oA-. D::
::lo:::t:""--'
LaJ:::I!i=
-------oA-3 >---- I-
::J
~
~;::)
APR ~AY JUN JUL AUG SEP OCT NOV DEC JAN FEB ~AR
NPC/LPC MEASURE~ENT PERIOD (1988 - 1989)LI"-U-UA Allowed onnuol ES: 11 .580: ollowed onnuol UA: 8.8 houre.
FiQure 15. Linderhofe-FeldberQ errored seconds and unavaiJahilitv tirnp

300000 .,.r---· -----,-.30LEGEND
N00
enozo(..)L&JenoL&JD:::oD:::D:::L&J
250000----------------------------------------------------------
200000
150000 -. - - - -. - - -. - - - - - - -.-
100000----
50000----
o L «,.. LL,
25
-en------20 D:::
::>o::I:-..-L&J:::I~
15 ~
:::Jm::s:c:<10. Z::>
5
o
~
•ES
UA
."-ES-UA
APR MAY JUN JUL AUG SEP OCT NOV DEC JAN FEB MARNPC/LPC MEASUREMENT PERIOD (1988 - 1989)
Alloweell annual ES: 82.258; alloweell annual UA: 18.1 houn.I ~_ I
Figure 16. Berlin-Feldberg errored seconds and unavailability time: -

errored-second ratio of 6.04 x 10⁻². The total VA time for the year for the BLN-FEL channel
is 94.39 hours. Since the design objective for this channel is 16.12 hours, the measured
unavailability exceeds the design objective unavailability by a factor of 5.8. There is no
explanation at this time for the excessive unavailability time on this channel or the large
month-to-month difference in unavailability time. The cause is currently under investigation.
Several statements regarding the performance of the BLN-FEL channel should be
made. First, it was apparent from field observations that the quality of the BLN-BBG
troposcatter link was greatly enhanced by the switchover from analog to digital equipment.
Subjective evaluations of the voice quality were made by both operational personnel and ITS
field personnel. There is a consensus that the quality of the order-wire circuit is adequate for
carrying voice traffic and that the quality is much improved over the original analog system.
However, the error performance noted above suggests the use of channel coding techniques
(such as forward error correction) to improve performance for data traffic. Channel coding
results in reduced throughput, but enhanced accuracy of the received data.
Second, performance of the BLN-FEL troposcatter link is likely to improve when new,
low-noise amplifiers are installed. This is expected to improve the signal-to-noise ratio by
about 3 to 6 dB and will result in improved digital error performance.
Finally, the current digit,al modem is a modified engineering development model and
will be replaced by newly designed production modems in the near future. Improvements in
digital error performance may result from the upgrade to the production modems.
5. CONCLUSIONS
Table 2 presents a summary of the error performance data that have been discussed in
this report. Clearly, the DRAMAradio performance on the long (99.4-km) SBN-FEL link met
the design objectives of draft MIL-SID-188,..323 for this link during the measurement period.
The performance ofthe two end-to-end channels (LDF-FEL and BLN-FEL) did not meet the
MIL-SID design objectives. However, it should be emphasized that draft MIL-STD-188-323
contains design objectives that are more stringent than the operational specifications that ~re
found in the Defense Communications Agency Circulars such as DCAC-300-175-9, entitled
"DeS Operating-Maintenance Electrical Performance Standards" (DCA,1986).
29

Table 2. Summary of Error Performance
SBN-FEL
LINKAnnual unavailability time (hours)
Design objective 2.16
Measured 0.22
LDF-FEL
CHANNEL
8.64
11.07
BLN-FEL
CHANNEL
16.12
94.39
Annual total errored seconds
Design objective
Measured
3,800
(1.21 x 10⁻⁴)
1,559
(5.51 x 10⁻⁵)
11,590(3.68 x 10⁻⁴
)
81,412
(2.87 x 10⁻³)
62,258
(1.97 x 10⁻³)
1,905,530
(6.73 x 10⁻²)
Note: The measured fraction, shown in parenthesis, is the fraction of errored seconds based on thetotal hours of data recorded (7,866).
At this time it is unclear what caused the excessive errors on the LDF-FEL channel. The
performance is particularly unexpected since the performance of the SBN-FEL link, which is
the longest of the four tandem LOS links comprising this channel, was well within MIL-STD
criteria. Investigation of this issue is continuing and will be described further in the final report
on this project. It should be noted, however, that the measured performance was only slightly
under the design objectives obtained by the application of draft MIL-STD-188-323 to this
channel.
The performance of the BLN-FEL channel was significantly worse than the design
objectives of the MIL-STD. The measured VA time was 6.7 times worse than the design
objective, and the measured number of errored seconds was 31 times greater than the design
objective.
It has been reported that year-to-year variability of outage is considerable and that the
measured outage (or errored seconds) can change by a factor of 5 to 6 from year to year
(AT&T/Harris,1988).
Comparisons can be made between the two end-to-end channels. Each of these two
channels contain four LOS links. Three of the LOS links are COmmon to each channel. The
LDF-FELchannel includes the LDF-KEG link (28.0 km), which is not part of the BLN-FEL
channel. The BLN-FELchannel includes the BBG-KEG link (72-km), which is not part of the
30

LDF-FEL channel. From this, one might intuitively expect that the contribution to digital
errors from the LOS portion of the BLN-FEL channel would be approximately the same as
the digital errors measured on the end-to-end LDF-FEL channel (it would be expected to be
slightly greater because the BBG-KBG LOS link is longer than the LDF-KBG LOS link). A
logical cqnclusion is that most of the difference between performance of the two end-to-end
channels probably is due to the troposcatter link that is part of the BLN-FEL channel, but not
the LDF-FEL channel.
The following observations are made about the BLN-BBG troposcatter link:
• the modem being used on this link is an engineering development model that will bereplaced in the near future; performance may improve when the new modem isinstalled.
• the low-noise tunnel-diode amplifiers in the modified Army Tactica AN/GRC-143radio receivers will be replaced, which will result in about a 3 dB signal-to-noise ratioimprovement; this will result in improved digital error performance.
• users of the troposcatter link have noted a significant improvement in voice qualityas the result of the replacement of the analog system with the digital system.
• channel coding (e.g., forward error correction) may be required to obtam satisfactoryperformance for data communications traffic that is passed over troposcatter links.
Channel coding will cause some loss of throughput because of the overhead bits
associated with such coding. However, the accuracy of the received data would be enhanced.
Further analysis of the need for channel coding and its impact on system performance is
recommended.
The LOS rsl's recorded during the first 12 months of this project show that multipath
fading occurred only during a few months of the year. Fading caused some degradation of
DRAMA radio performance on the SBN-FELlink, but not enough to cause the link to exceed
MIL-SID design objectives. The space-diversity improvement factor (DIF) for the DRAMA
radio was found to be between 5.2 and 6.4. This is slightly lower than the DIF that has been
reported on other systems; DRAMA diversity performance may be explained by the type of
combiner used (selective combining theoretically is worse than IF combining) and the algo
rithm used for selection of Rx A or Rx B.
The TRAMCON system has proven to be a valuable source of rsl data. Normally,
TRAMCON rsl and other data are not kept beyond 24 hours. It is recommended that the
TRAMCON software be modified to permit the creation of monthly summaries of rsl and
other data.
31

Additional analyses of the data collected as part of the NPC/LPC project are in progress.
A final report will provide the results of these analyses and will provide final conclusions and
recommendations. The measurements made during this project and the analysis of the
resultant data do not in any way negate the results obtained during the cutover testing of any
links in FKT-Nl.
6. ACKNOWLEDGMENTS
The network and link performance characterization projects were conducted by the
Institute for TelecommunicationSciences under funding support by the Defense Communica
tions Agency and the U.S. Air Force Systems Command Electronic Systems Division. The
measurement programs were also coordinated with the U.S. Army Information Systems
Engineering Command.
The authors wish to thank Mr. Walt Cybrowski and Dr. Dave Smith of the Defense
Communications Engineering Center and Major Anida Wishnietsky and Capt. Bruce Beane
of the U.S. Air Force Electronic Systems Division (ESD) for their program management
support and technical guidance on this project. We also wish to thank Messrs. Steve Matsuura,*Francis Cheng , and Dave Laida of the U.S. Army Information Systems Engineering and
Integration Center for their technical support and guidance. We want to thank and recognize
the many contributions made to this project by the following employees of ITS: Larry Hause,
Dick Skerjanec, Joe Farrow, Greg Hand, Bob McLean, Rick Statz, Chris Behm, and
Lauren Pratt.
This measurement program could not have been completed without the outstanding
support provided by numerous individuals from several organizations. We want to thank
Mr. Bob Neiffer of ESD for his assistance in obtaining equipment and for logistics support,
Colonel Mount of the 1945th Communications Group (CG) for his interest in and support of
this program, Mr. Jim Grogan of the 1945th CG for his administrative support,
Capt. M. Medina and SMSGT Ramon Mosqueda of the 1945th CG for their support during
the installation of the equipment at the field sites, and Mr. Tom Dommershausen of GTE for
his support of the LPMS system. Finally, we want to thank Mr. John Dunham of the Berlin
Command for his support during this project.
*Mr. Francis Cheng is now with the Defense Communications Engineering Center.
32

7. REFERENCES
AT&TIHarris (1988), LOS link design enhancement and validation (Task 6, Subtask 1), DCA100-88-C-0015, Defense C<?mmunications Engineering Center, Reston, VA 22090.
CCITT (1980), Error performance of an international digital connection forming part of anintegrated services digital network, Recommendation G.821, Geneva, 1980.
CECOM, 1984, Operator's, organizational, and direct support maintenance manual for radiosets AN/FRC-17X, U.S. Army Communications-Electronics Command, Ft. Monmouth,NJ07703.
CEEIA (1981), System engineering plan for the Frankfurt North Phase I Digital UpgradeProject, U.S. Army Communications-Electronics Engineering Installation Agency,Ft. Huachuca, AZ 85613.
DCA (1980), Management/engineering plan for the Digital European Backbone (DEB),Defense Communications Agency, Code B420, Washington, DC 20305
DCA (1986), DCS operating-maintenance electrical performance standards, DCA Circular300-175-9, Defense Communications Agency, Washington, DC 20305.
DCEC (1985), System design and engineering standards for long haul digital transmissionsystem performance, MIL-STD-188-323, 8 JUL 1985 (draft).
Farrow, J. E., and R. E. Skerjanec (1986) Transmission monitoring and control of strategiccommunication systems, IEEE J. Sel. Areas in Commun. SAC-4, No.2, March, pp. 308312.
Hoffmeyer, J. A., and L. E. Vogler (1987), Measurement, modeling and simulation of LOSmicrowave channels, NATO Advisory Group for Aerospace Research and DevelopmentConf. Proceedings No. 419.
Hubbard, R. W. (1983), Digital microwave transmission tests at the Pacific Missile Test Center,Pt. Mugu, California, NTIA Report 83-126, June (NTIS Order No. PB 83-251454).
Smith, D. R. (1985), Digital Transmission Systems (Van Nostrand Reinhold Company,New York).
Smith, D. R., and J; J. Cormack (1984), Improvement in digital radio due to space diversityand adaptive equalization, GLOBECOM '84, paper No. 45.6, Atlanta, GA.
33

Smith, D. R., and W. J. Cybrowski (1985), Performance standards for military long haul digitaltransmission system design, GLOBECOM '85, paper no. 17.1, New Orleans, LA.
Thomas, C. M., J. E. Alexander, and E. W. Rahneberg (1979), A new generation of digitalmicrowave radios for U.S. military telephone networks, IEEE Trans. Commun.COM-27, No. 12, pp.1916-1928.
34

FORM NTIA-29 U.S. DEPARTMENT OF COMMERCE(4-80) NAT'L. TELECOMMUNICATIONS AND INFORMATION ADMINISTRATION
BIBLIOGRAPHIC DATA SHEET
1. PUBLICATION NO. 2. Gov't Accession No. 3. Recipient's Accession No.
NTIA Report 89-247
4. TITLE AND SUBTITLE 5. Publication Date
Digital European Backbone Performance: AUgust 1989A l2-Month Summary for the Frankfurt North Segment 6. Performing Organization Code
NTIA/ITS7. AUTHOR(Sj 9. Project/Task/Work Unit No.J. A. Hoffmeyer and T. J. Riley
8. PERFORMING ORGANIZATION NAME AND ADDRESS
National Telecommunications & Information AdministrationInstitute for Telecommunication Sciences 10. Contract/Grant No.
325 BroadwayBoulder, CO 80303
11. Sponsoring Organization Name and Address 12. Type of Report and Period Covered
Defense Communications AgencyDefense Communications Engineering Center1860 Wiehle Avenue, Reston, VA 22090-5500 13.
14. SUPPLEMENTARY NOTES
15. ABSTRACT (A 200-word or less factual summary of most significant informatiDn. If document includes a significant bibliDgraphy Dr literaturesurvey, mentiDn it here.)
This report describes the interim results of an l8-month digital microwavetransmission network performance and propagation measurement project that wasconducted on a portion of the Defense Communications System (DCS) in West Germany.Only the first 12 months of data are summarized in this report. More than 3gigabytes of data were collected between April 1988 and March 1989. The reportprovides the results of bit error rate measurements made at the 56-kb/s user levelon one long (99-km) line-of-sight (LOS) link and at the 64-kb/s user level on twoend-to-end channels consisting of multiple LOS and/or troposcatter radio links.The report also provides summaries of 12 months of received-signal-level (rsl)measurements on five LOS links and one troposcatter link.
16. Key WDrds (Alphabetical Drder, separated by semicDIDns)
DEB; digital radio performance; DRAMA; LOS propagation; military standard (MIL-STD);multipath fading; propagation measurements; radio outages; transmission systemperforamnce standards; troposcatter
17. AVAILABILITY STATEMENT 18. Security Class. (This repDrt) 20. Number Df pages
tiil UNLIMITED. Unclassified 4019. Security Class. (This page) 21. Price:
0 FOR OFFICIAL DISTRIBUTION.Unclassified
of< u.s. Government Printing Office: 1980-678-495/529