Embed Size (px)
Citation preview
Digital Dialogue: New Hampshire High Technology Industry
August 27, 2002
Ross Gittell, James R. Carter Professor
Whittemore School of Business & Economics, UNH
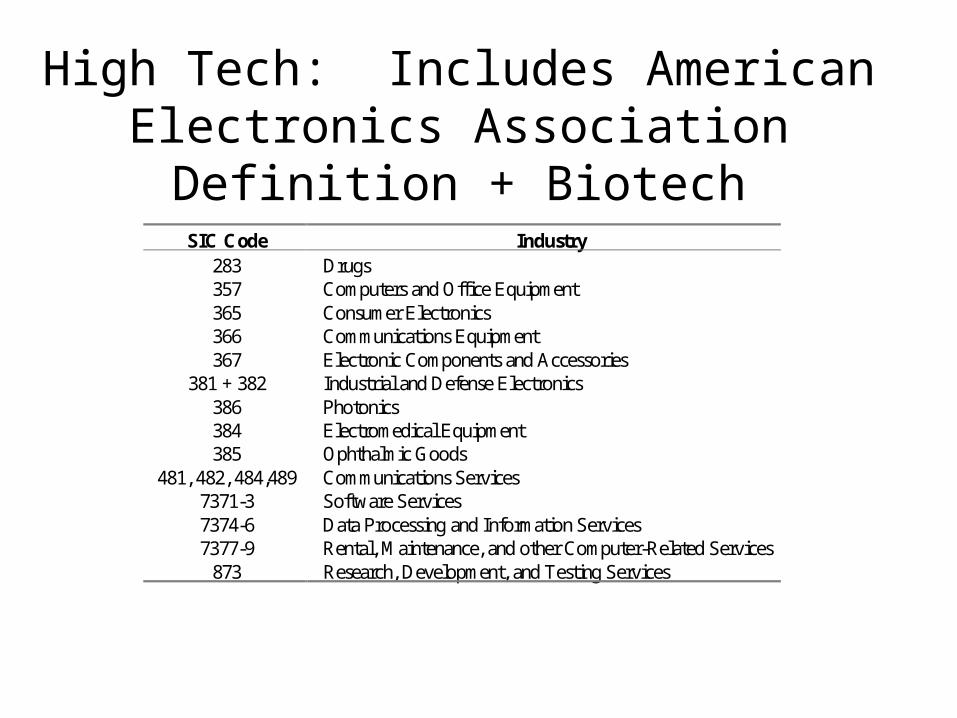
High Tech: Includes American Electronics Association Definition + Biotech
SIC Code Industry 283 Drugs 357 Computers and Office Equipment 365 Consumer Electronics 366 Communications Equipment 367 Electronic Components and Accessories
381 + 382 Industrial and Defense Electronics 386 Photonics 384 Electromedical Equipment 385 Ophthalmic Goods
481, 482, 484,489 Communications Services 7371-3 Software Services 7374-6 Data Processing and Information Services 7377-9 Rental, Maintenance, and other Computer-Related Services
873 Research, Development, and Testing Services
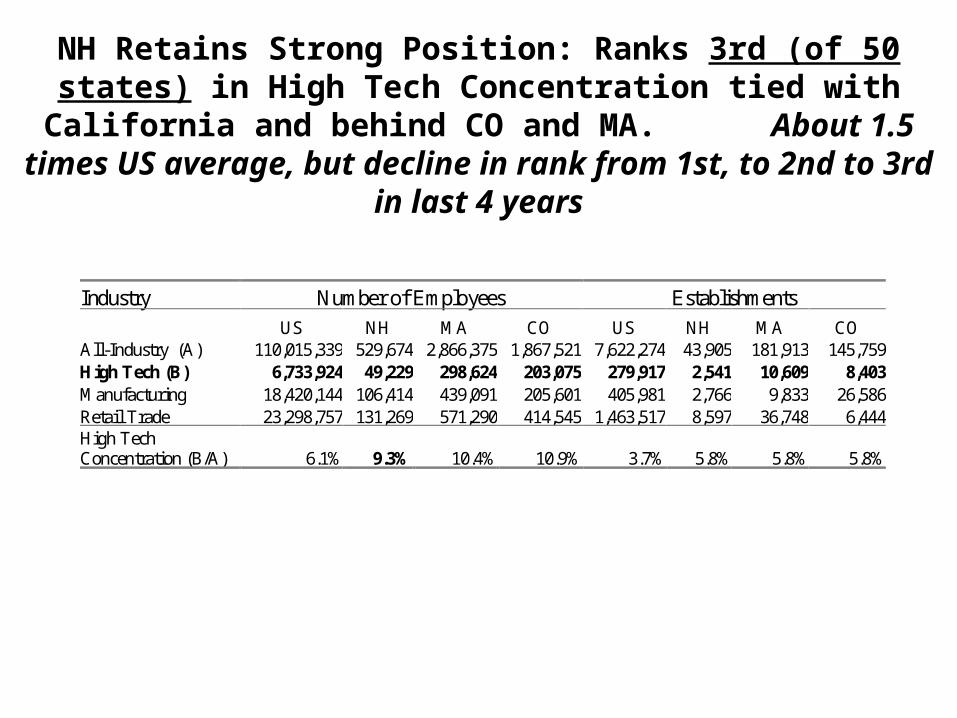
NH Retains Strong Position: Ranks 3rd (of 50 states) in High Tech Concentration tied with California and behind CO and MA.
About 1.5 times US average, but decline in rank from 1st, to 2nd to 3rd in last 4 years
Industry Number of Employees Establishments
US NH MA CO US NH MA CO All-Industry (A) 110,015,339 529,674 2,866,375 1,867,521 7,622,274 43,905 181,913 145,759 High Tech (B) 6,733,924 49,229 298,624 203,075 279,917 2,541 10,609 8,403 Manufacturing 18,420,144 106,414 439,091 205,601 405,981 2,766 9,833 26,586 Retail Trade 23,298,757 131,269 571,290 414,545 1,463,517 8,597 36,748 6,444 High Tech Concentration (B/A) 6.1% 9.3% 10.4% 10.9% 3.7% 5.8% 5.8% 5.8%
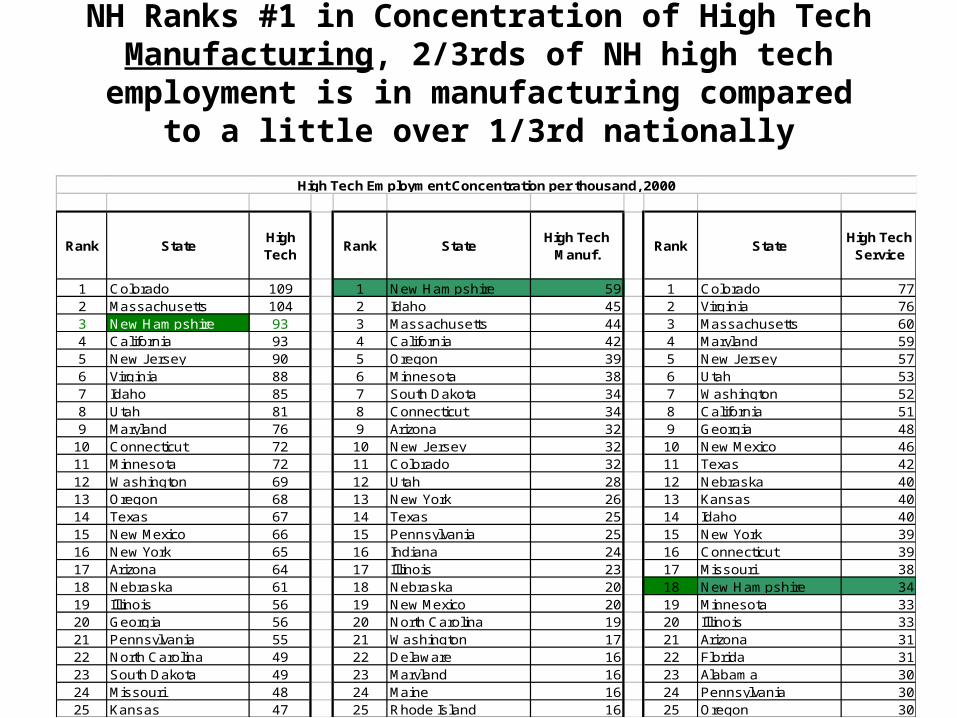
NH Ranks #1 in Concentration of High Tech Manufacturing, 2/3rds of NH high tech employment is in manufacturing compared to a little over 1/3rd nationally
Rank StateHigh Tech
Rank StateHigh Tech
Manuf.Rank State
High Tech Service
1 Colorado 109 1 New Hampshire 59 1 Colorado 772 Massachusetts 104 2 Idaho 45 2 Virginia 763 New Hampshire 93 3 Massachusetts 44 3 Massachusetts 604 California 93 4 California 42 4 Maryland 595 New Jersey 90 5 Oregon 39 5 New Jersey 576 Virginia 88 6 Minnesota 38 6 Utah 537 Idaho 85 7 South Dakota 34 7 Washington 528 Utah 81 8 Connecticut 34 8 California 519 Maryland 76 9 Arizona 32 9 Georgia 48
10 Connecticut 72 10 New Jersey 32 10 New Mexico 4611 Minnesota 72 11 Colorado 32 11 Texas 4212 Washington 69 12 Utah 28 12 Nebraska 4013 Oregon 68 13 New York 26 13 Kansas 4014 Texas 67 14 Texas 25 14 Idaho 4015 New Mexico 66 15 Pennsylvania 25 15 New York 3916 New York 65 16 Indiana 24 16 Connecticut 3917 Arizona 64 17 Illinois 23 17 Missouri 3818 Nebraska 61 18 Nebraska 20 18 New Hampshire 3419 Illinois 56 19 New Mexico 20 19 Minnesota 3320 Georgia 56 20 North Carolina 19 20 Illinois 3321 Pennsylvania 55 21 Washington 17 21 Arizona 3122 North Carolina 49 22 Delaware 16 22 Florida 3123 South Dakota 49 23 Maryland 16 23 Alabama 3024 Missouri 48 24 Maine 16 24 Pennsylvania 3025 Kansas 47 25 Rhode Island 16 25 Oregon 30
High Tech Employment Concentration per thousand, 2000
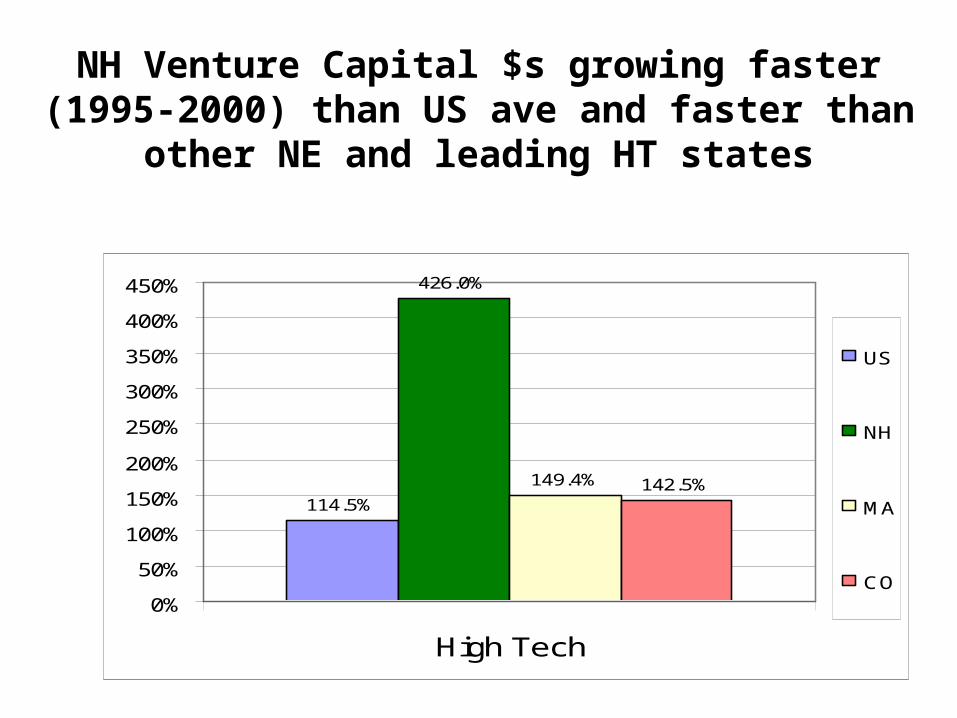
NH Venture Capital $s growing faster (1995-2000) than US ave and faster than other NE and leading HT states
114.5%
426.0%
149.4% 142.5%
0%
50%
100%
150%
200%
250%
300%
350%
400%
450%
High Tech
US
NH
MA
CO
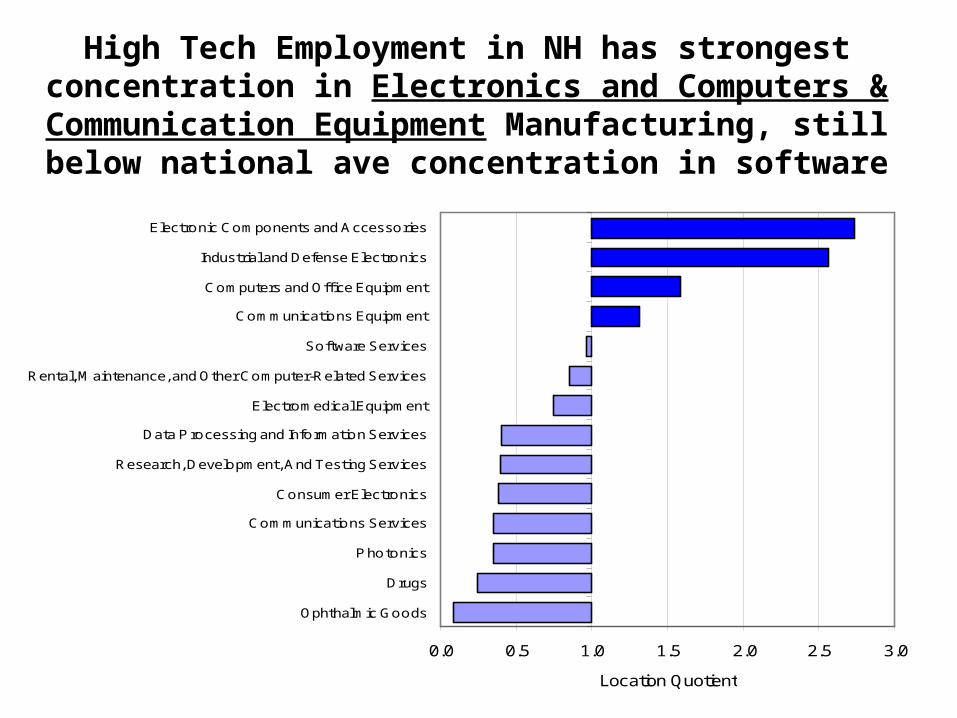
High Tech Employment in NH has strongest concentration in Electronics and Computers & Communication Equipment
Manufacturing, still below national ave concentration in software
0.0 0.5 1.0 1.5 2.0 2.5 3.0
Ophthalmic Goods
Drugs
P hotonics
Communications Services
Consumer Electronics
Research, Development, And Testing Services
Data P rocessing and Information Services
Electromedical Equipment
Rental, Maintenance, and Other Computer-Related Services
Software Services
Communications Equipment
Computers and Office Equipment
Industrial and Defense Electronics
Electronic Components and Accessories
Location Quotient
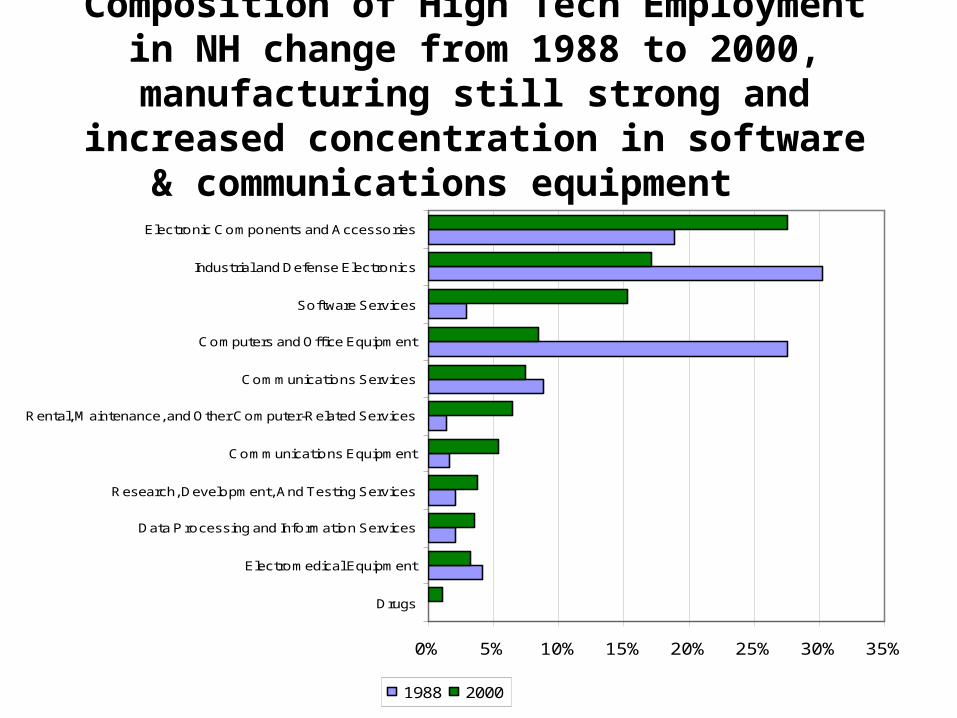
Composition of High Tech Employment in NH change from 1988 to 2000, manufacturing still
strong and increased concentration in software & communications equipment
0% 5% 10% 15% 20% 25% 30% 35%
Drugs
Electromedical Equipment
Data P rocessing and Information Services
Research, Development, And Testing Services
Communications Equipment
Rental, Maintenance, and Other Computer-Related Services
Communications Services
Computers and Office Equipment
Software Services
Industrial and Defense Electronics
Electronic Components and Accessories
1988 2000
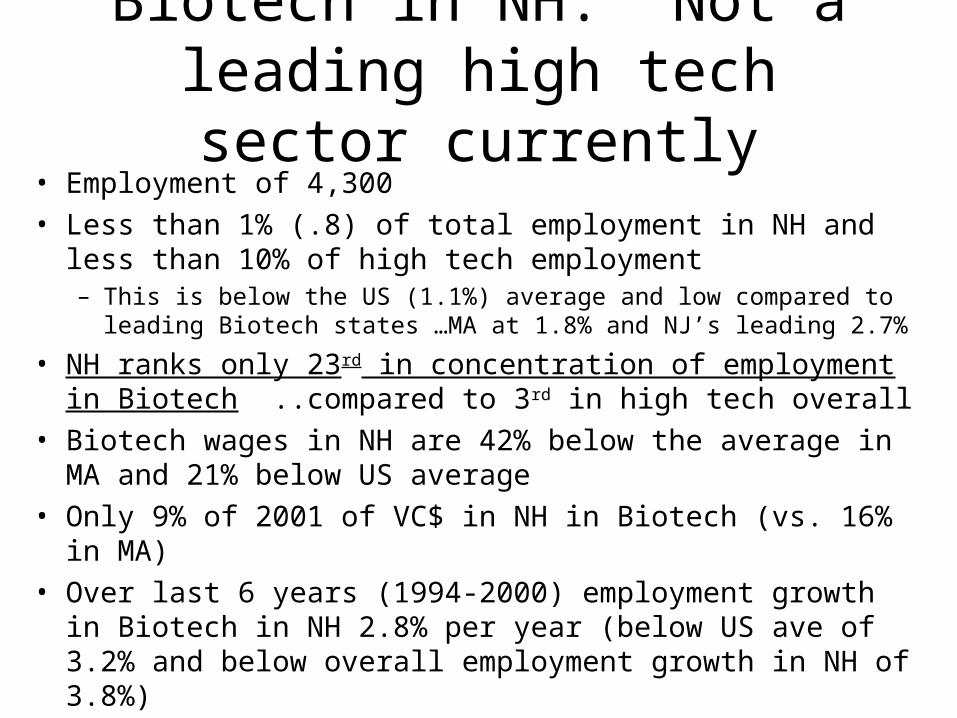
Biotech in NH: Not a leading high tech sector currently
• Employment of 4,300
• Less than 1% (.8) of total employment in NH and less than 10% of high tech employment– This is below the US (1.1%) average and low compared to leading Biotech
states …MA at 1.8% and NJ’s leading 2.7%
• NH ranks only 23rd in concentration of employment in Biotech ..compared to 3rd in high tech overall
• Biotech wages in NH are 42% below the average in MA and 21% below US average
• Only 9% of 2001 of VC$ in NH in Biotech (vs. 16% in MA)
• Over last 6 years (1994-2000) employment growth in Biotech in NH 2.8% per year (below US ave of 3.2% and below overall employment growth in NH of 3.8%)

NH’s Biotech Industries
• Medical equipment Manufacturing (with 54% of total Biotech employment) in NH is by far the largest sector in the New Hampshire’s Biotech industry.
• Pharmaceutical and medicine employed 3% of the less than 1% of total employment that Biotech in NH represents and this is one of leading sectors within Biotech elsewhere.
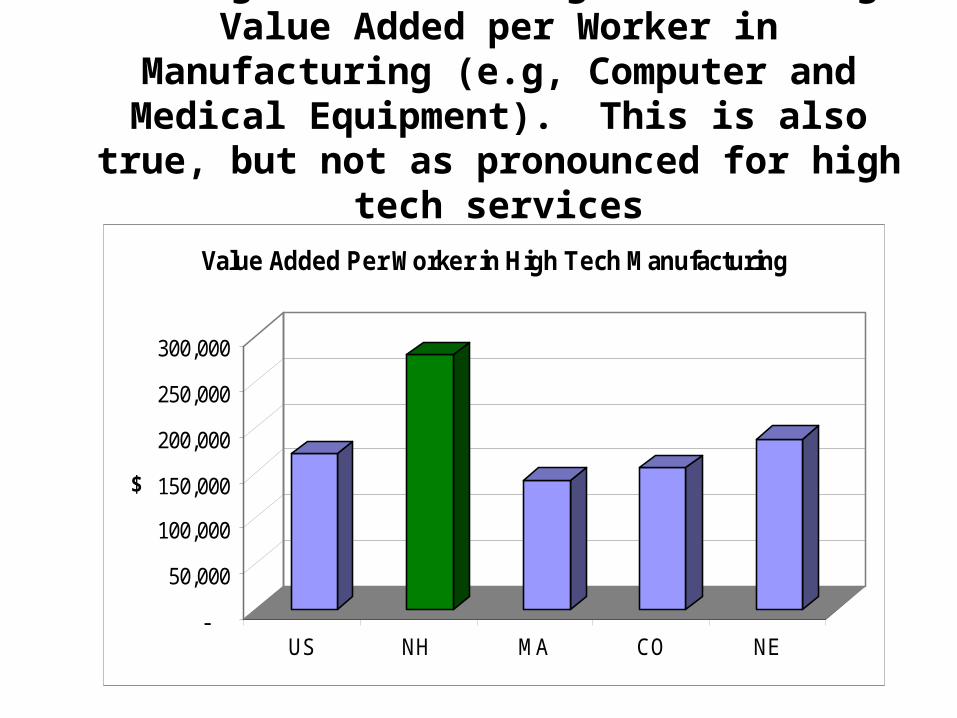
The High Tech Advantage in NH: High Value Added per Worker in Manufacturing (e.g,
Computer and Medical Equipment). This is also true, but not as pronounced for high tech services
-
50,000
100,000
150,000
200,000
250,000
300,000
$
US NH MA CO NE
Value Added Per Worker in High Tech Manufacturing
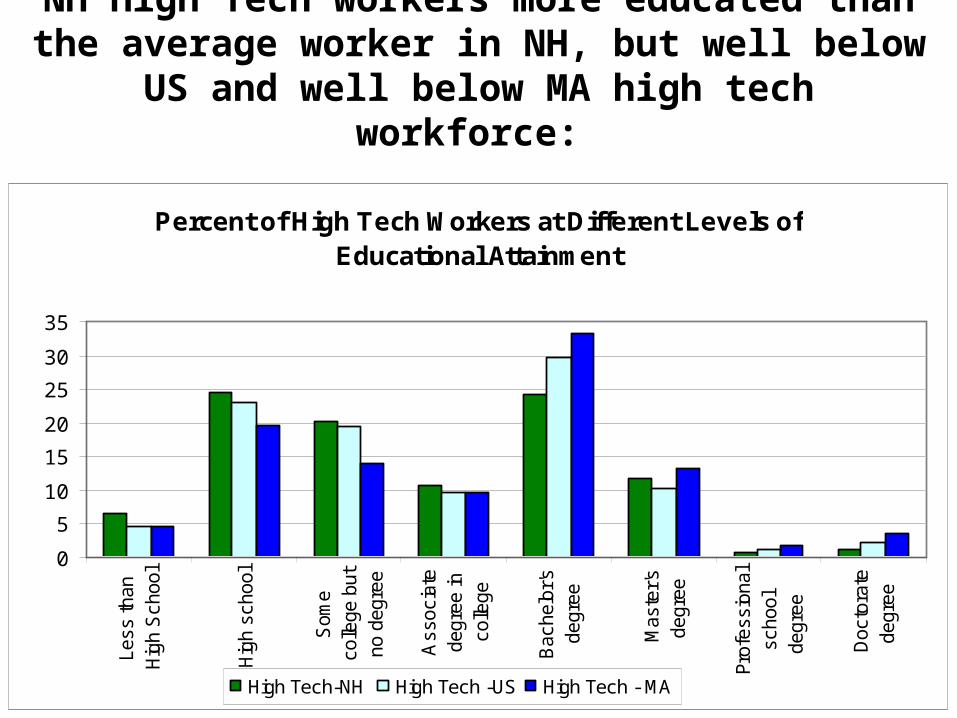
NH High Tech workers more educated than the average worker in NH, but well below US and well below MA
high tech workforce:
Percent of High Tech Workers at Different Levels of Educational Attainment
0
5
10
15
20
25
30
35
Less
than
Hig
h S
cho
ol
Hig
h sc
hool
Som
eco
llege
but
no d
egre
e
Ass
ocia
tede
gre
e in
colle
ge
Bac
helo
r's
degre
e
Mas
ter's
degre
e
Prof
essi
onal
schoo
lde
gre
e
Doc
tora
tede
gre
e
High Tech-NH High Tech -US High Tech - MA
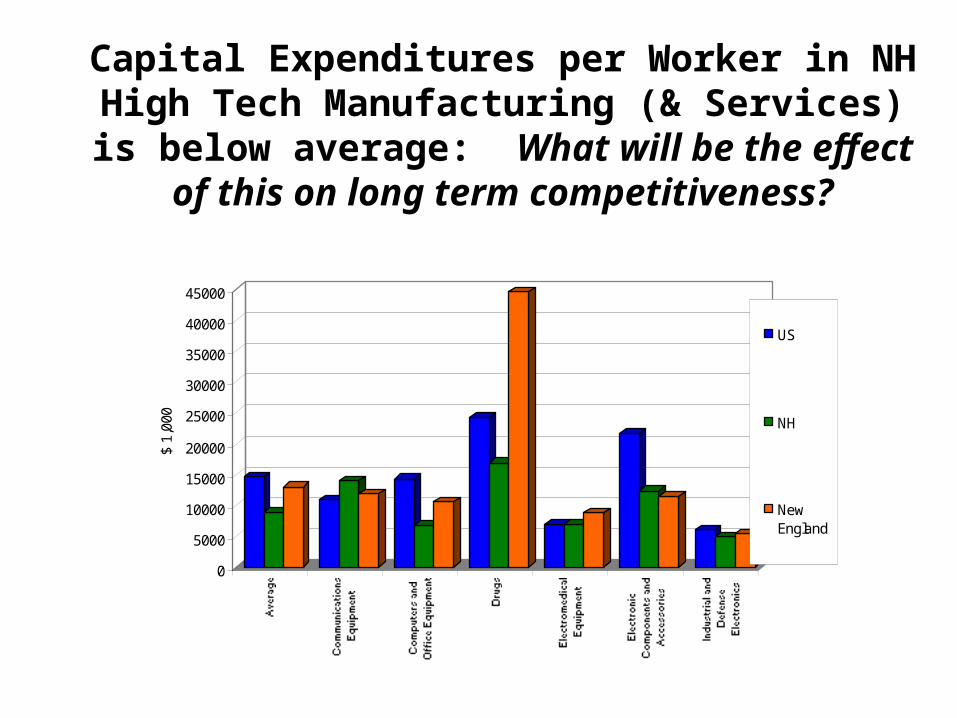
Capital Expenditures per Worker in NH High Tech Manufacturing (& Services) is below average: What will be the effect of this on long term competitiveness?
0
5000
10000
15000
20000
25000
30000
35000
40000
45000
$ 1,
000
US
NH
NewEngland
Employment Trends
NH compared to US average and other high technology leaders
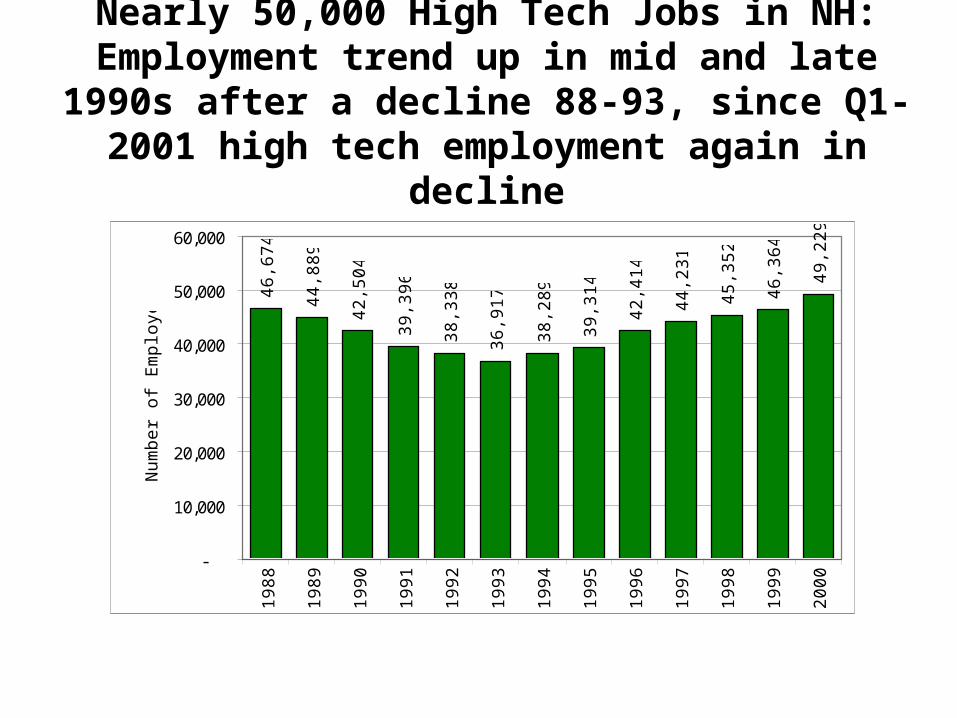
Nearly 50,000 High Tech Jobs in NH: Employment trend up in mid and late 1990s after a decline 88-93, since Q1-2001 high tech employment again in decline
46,6
74
44,8
89
42,5
04
39,3
96
38,3
38
36,9
17
38,2
89
39,3
14
42,4
14
44,2
31
45,3
52
46,3
64
49,2
29
-
10,000
20,000
30,000
40,000
50,000
60,000
1988
1989
1990
1991
1992
1993
1994
1995
1996
1997
1998
1999
2000
Num
ber
of E
mpl
oyee
s
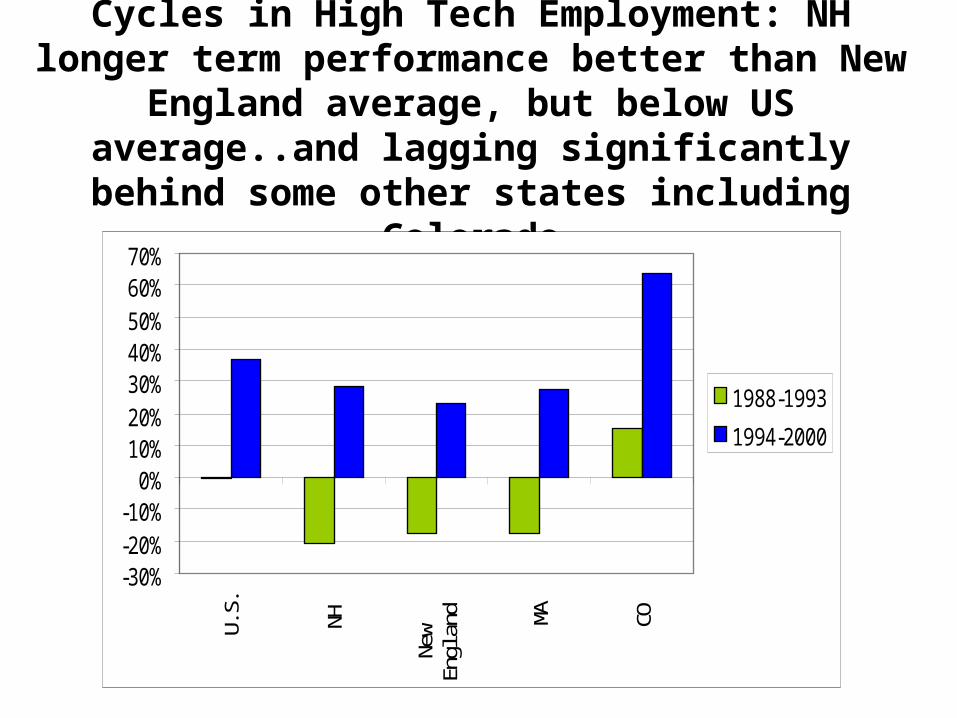
Cycles in High Tech Employment: NH longer term performance better than New England average, but below US average..and lagging significantly behind
some other states including Colorado
-30%-20%-10%
0%10%20%30%40%50%60%70%
U.S
.
NH
New
Engl
and M
A
CO
1988-1993
1994-2000
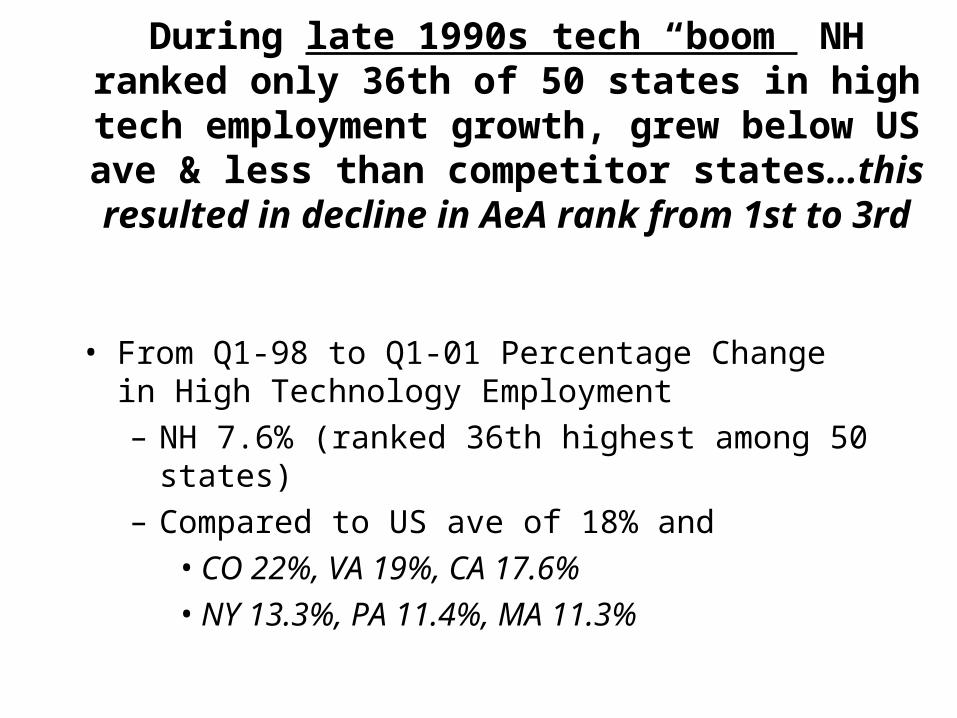
During late 1990s tech “boom” NH ranked only 36th of 50 states in high tech employment growth, grew below US ave & less than competitor states…this
resulted in decline in AeA rank from 1st to 3rd
• From Q1-98 to Q1-01 Percentage Change in High Technology Employment
– NH 7.6% (ranked 36th highest among 50 states)
– Compared to US ave of 18% and
• CO 22%, VA 19%, CA 17.6%
• NY 13.3%, PA 11.4%, MA 11.3%
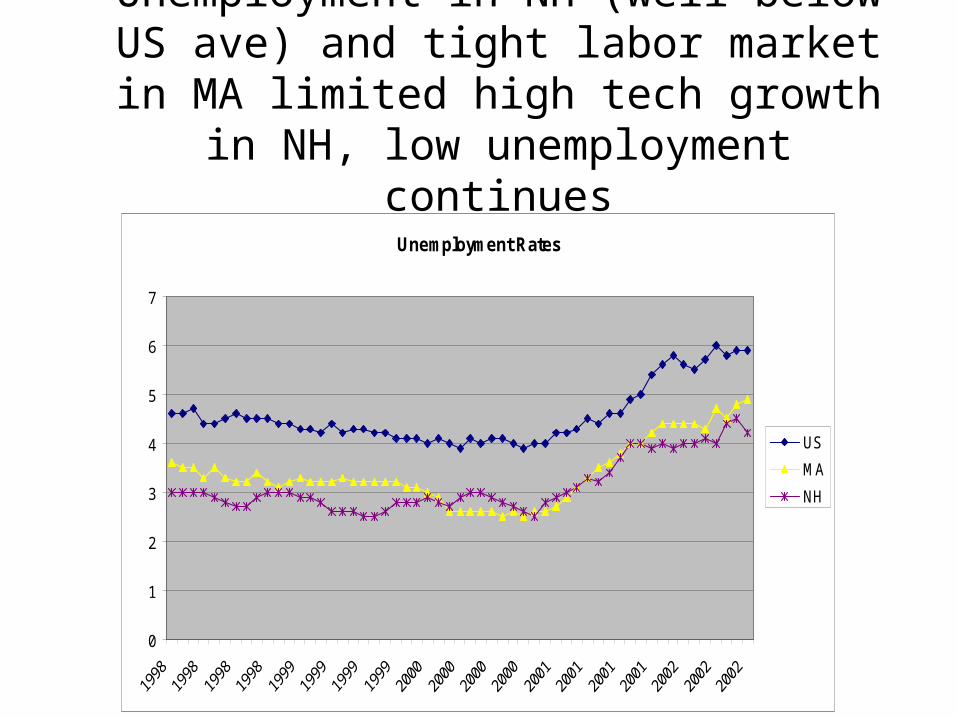
Unemployment in NH (well below US ave) and tight labor market in MA limited high tech
growth in NH, low unemployment continues
Unemployment Rates
0
1
2
3
4
5
6
7
US
MA
NH
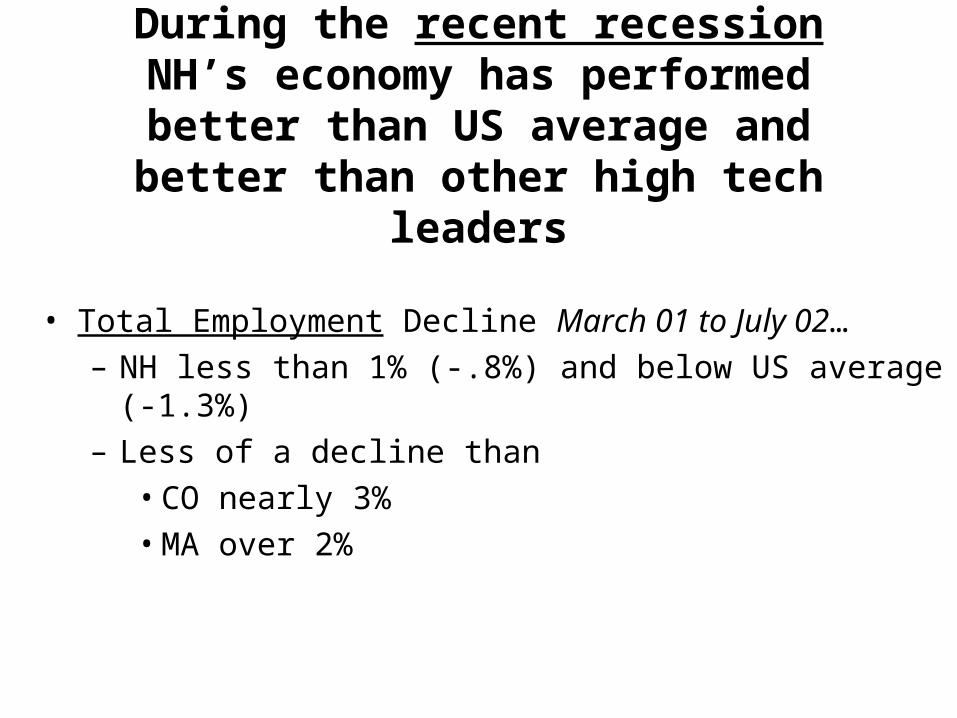
During the recent recession NH’s economy has performed better than US average and
better than other high tech leaders
• Total Employment Decline March 01 to July 02…
– NH less than 1% (-.8%) and below US average (-1.3%)
– Less of a decline than
• CO nearly 3%
• MA over 2%
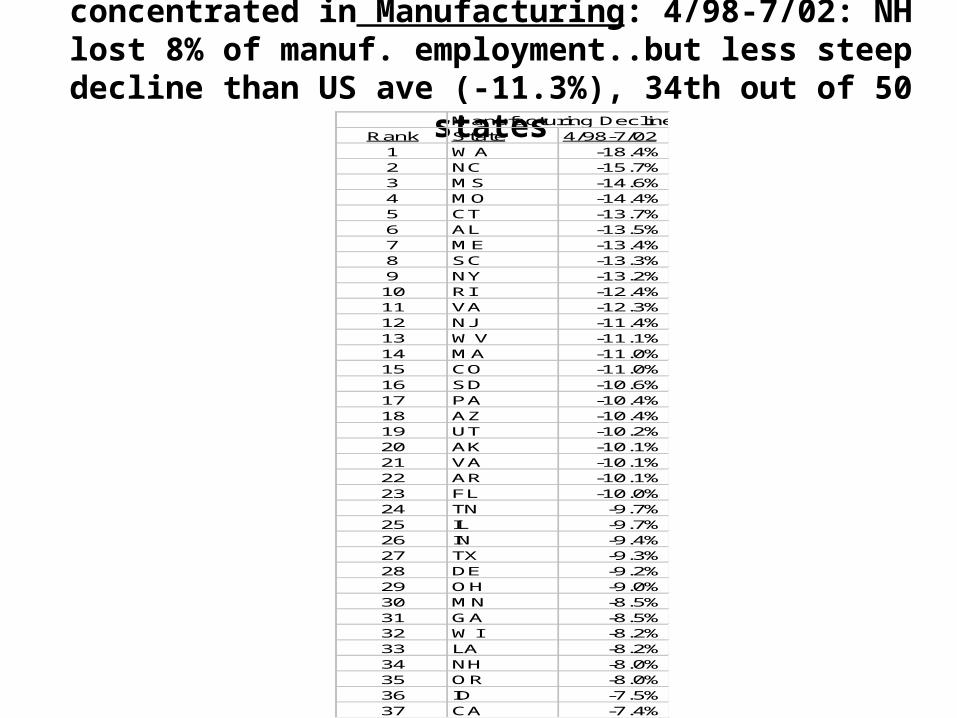
The recent recession nationally and in NH is concentrated in Manufacturing: 4/98-7/02: NH lost 8% of manuf. employment..but
less steep decline than US ave (-11.3%), 34th out of 50 statesManufacturing Decline
Rank State 4/98-7/021 WA -18.4%2 NC -15.7%3 MS -14.6%4 MO -14.4%5 CT -13.7%6 AL -13.5%7 ME -13.4%8 SC -13.3%9 NY -13.2%10 RI -12.4%11 VA -12.3%12 NJ -11.4%13 WV -11.1%14 MA -11.0%15 CO -11.0%16 SD -10.6%17 PA -10.4%18 AZ -10.4%19 UT -10.2%20 AK -10.1%21 VA -10.1%22 AR -10.1%23 FL -10.0%24 TN -9.7%25 IL -9.7%26 IN -9.4%27 TX -9.3%28 DE -9.2%29 OH -9.0%30 MN -8.5%31 GA -8.5%32 WI -8.2%33 LA -8.2%34 NH -8.0%35 OR -8.0%36 ID -7.5%37 CA -7.4%
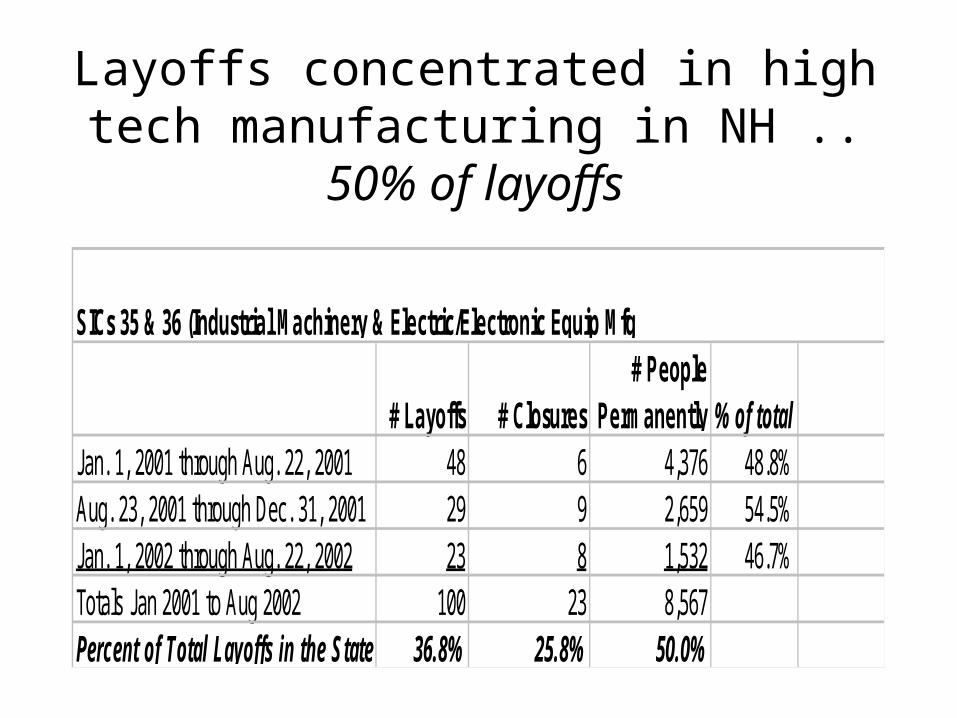
Layoffs concentrated in high tech manufacturing in NH .. 50% of layoffs
# Layoffs # Closures# People
Permanently % of totalJan. 1, 2001 through Aug. 22, 2001 48 6 4,376 48.8%Aug. 23, 2001 through Dec. 31, 2001 29 9 2,659 54.5%Jan. 1, 2002 through Aug. 22, 2002 23 8 1,532 46.7%Totals Jan 2001 to Aug 2002 100 23 8,567Percent of Total Layoffs in the State 36.8% 25.8% 50.0%
SICs 35 & 36 (Industrial Machinery & Electric/Electronic Equip Mfg
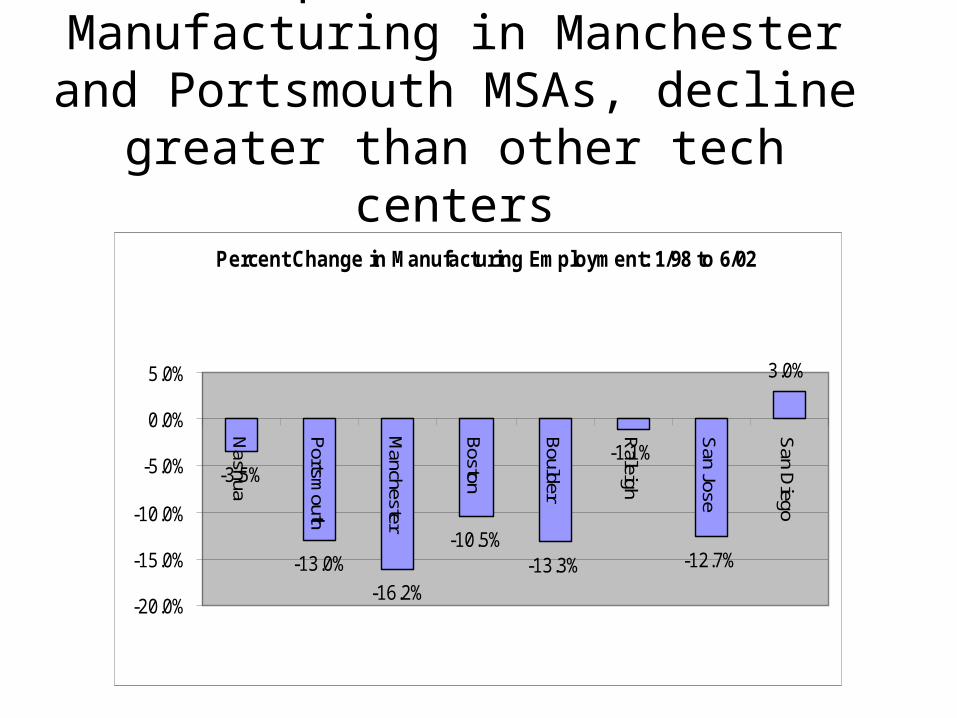
Steepest Decline in Manufacturing in Manchester and Portsmouth MSAs, decline
greater than other tech centers
Percent Change in Manufacturing Employment: 1/98 to 6/02
-3.5%
-13.0%
-16.2%
-10.5%-13.3%
-1.1%
-12.7%
3.0%
-20.0%
-15.0%
-10.0%
-5.0%
0.0%
5.0%
Nashua
Portsm
outh
Manchester
Boston
Boulder
Raleigh
San Jose
San D
iego
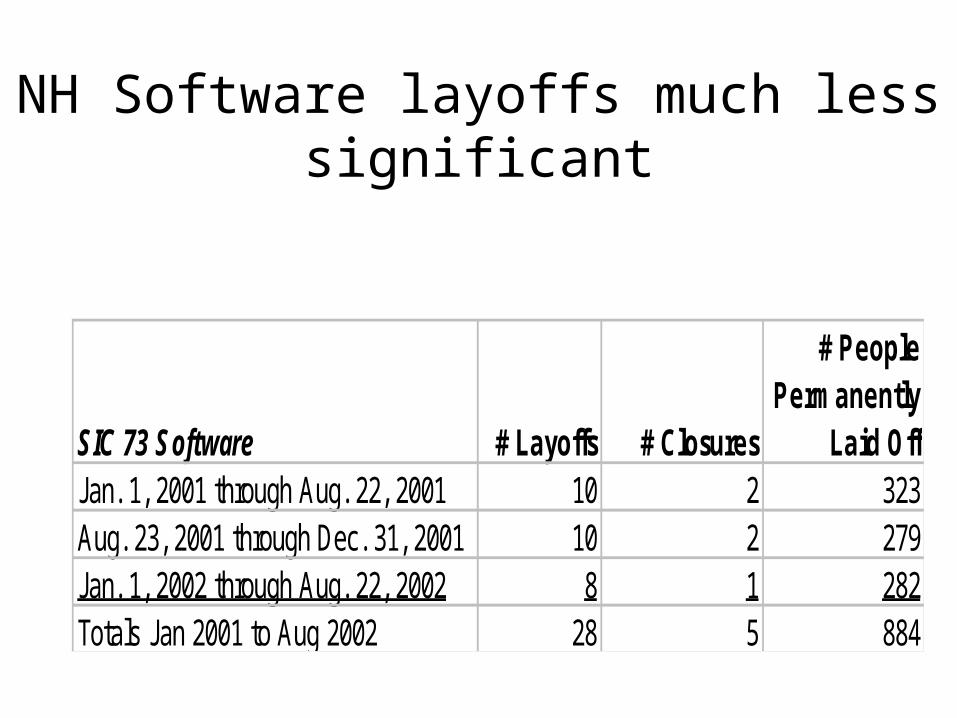
NH Software layoffs much less significant
SIC 73 Software # Layoffs # Closures
# People Permanently
Laid OffJan. 1, 2001 through Aug. 22, 2001 10 2 323Aug. 23, 2001 through Dec. 31, 2001 10 2 279Jan. 1, 2002 through Aug. 22, 2002 8 1 282Totals Jan 2001 to Aug 2002 28 5 884
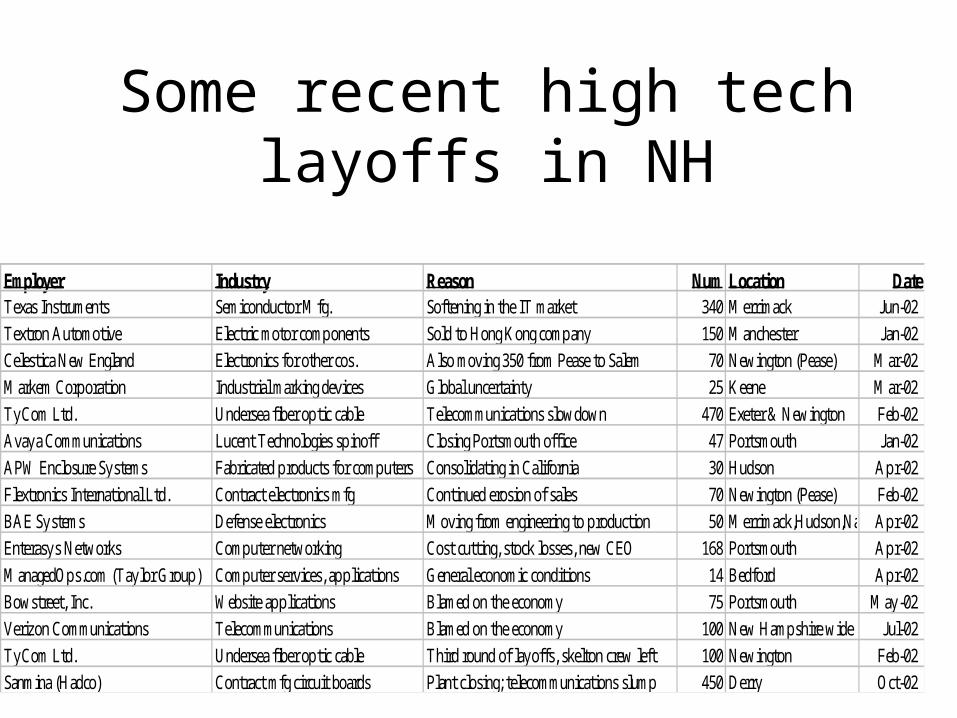
Some recent high tech layoffs in NH
Employer Industry Reason Num Location DateTexas Instruments Semiconductor Mfg. Softening in the IT market 340 Merrimack Jun-02
Textron Automotive Electric motor components Sold to Hong Kong company 150 Manchester Jan-02
Celestica New England Electronics for other cos. Also moving 350 from Pease to Salem 70 Newington (Pease) Mar-02
Markem Corporation Industrial marking devices Global uncertainty 25 Keene Mar-02
TyCom Ltd. Undersea fiber optic cable Telecommunications slowdown 470 Exeter & Newington Feb-02
Avaya Communications Lucent Technologies spinoff Closing Portsmouth office 47 Portsmouth Jan-02
APW Enclosure Systems Fabricated products for computers Consolidating in California 30 Hudson Apr-02
Flextronics International Ltd. Contract electronics mfg Continued erosion of sales 70 Newington (Pease) Feb-02
BAE Systems Defense electronics Moving from engineering to production 50 Merrimack,Hudson,NashuaApr-02
Enterasys Networks Computer networking Cost cutting, stock losses, new CEO 168 Portsmouth Apr-02
ManagedOps.com (Taylor Group) Computer services, applications General economic conditions 14 Bedford Apr-02
Bowstreet, Inc. Website applications Blamed on the economy 75 Portsmouth May-02
Verizon Communications Telecommunications Blamed on the economy 100 New Hampshire wide Jul-02
TyCom Ltd. Undersea fiber optic cable Third round of layoffs, skelton crew left 100 Newington Feb-02
Sanmina (Hadco) Contract mfg circuit boards Plant closing; telecommunications slump 450 Derry Oct-02
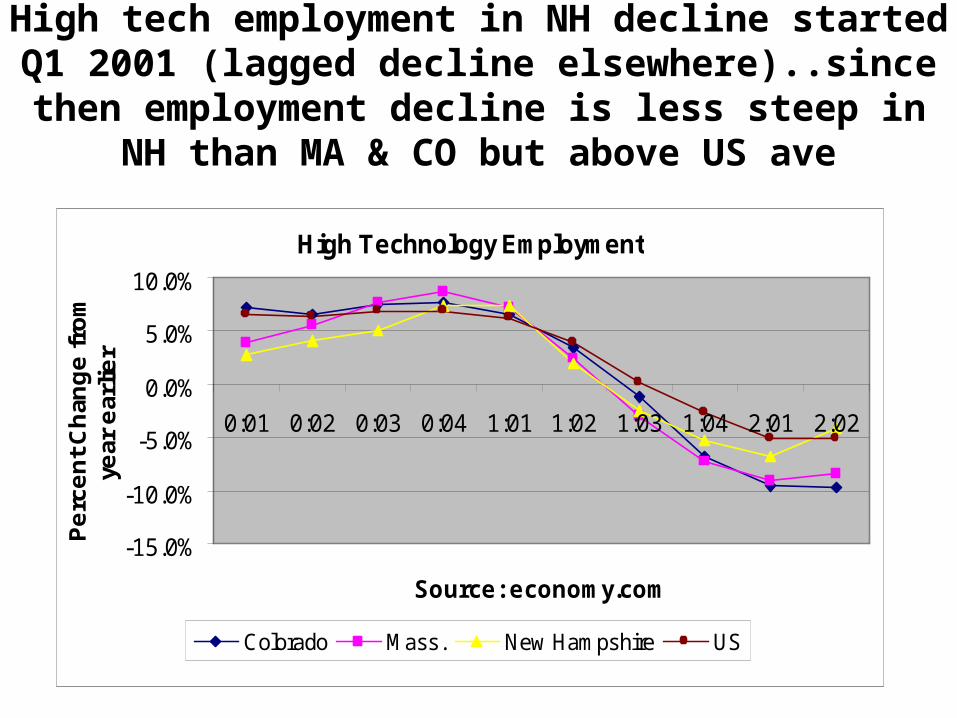
High tech employment in NH decline started Q1 2001 (lagged decline elsewhere)..since then employment decline
is less steep in NH than MA & CO but above US ave
High Technology Employment
-15.0%
-10.0%
-5.0%
0.0%
5.0%
10.0%
0:01 0:02 0:03 0:04 1:01 1:02 1:03 1:04 2:01 2:02
Source: economy.com
Pe
rce
nt
Ch
ang
e f
rom
ye
ar e
arlie
r
Colorado Mass. New Hampshire US
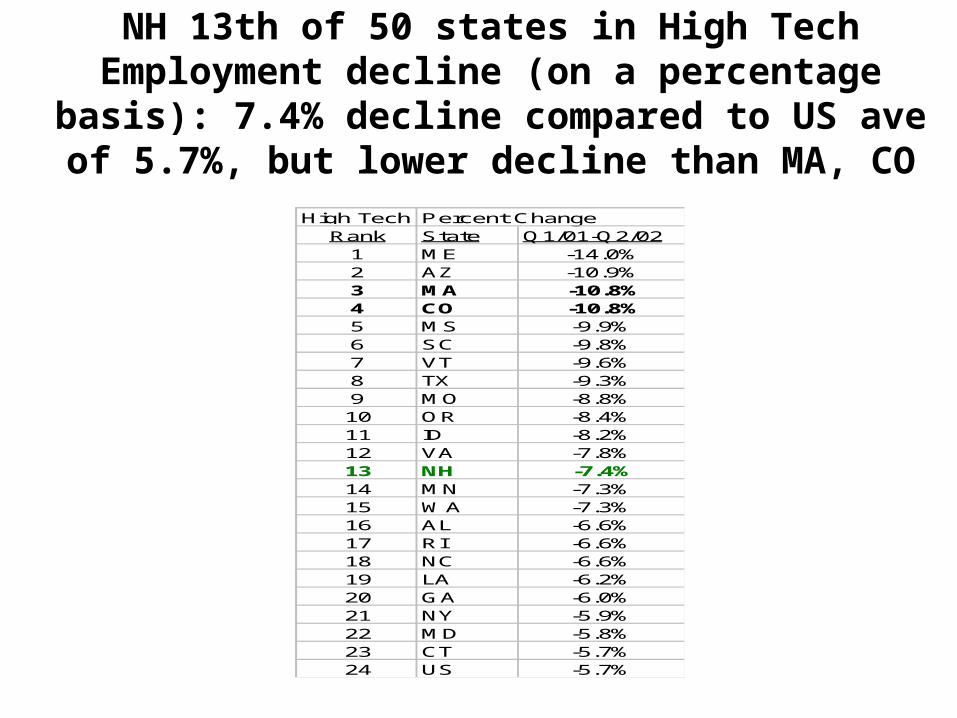
NH 13th of 50 states in High Tech Employment decline (on a percentage basis): 7.4% decline compared to US
ave of 5.7%, but lower decline than MA, CO
High Tech Employment Precent changePercent ChangeRank State Q1/01-Q2/02
1 ME -14.0%2 AZ -10.9%3 MA -10.8%4 CO -10.8%5 MS -9.9%6 SC -9.8%7 VT -9.6%8 TX -9.3%9 MO -8.8%10 OR -8.4%11 ID -8.2%12 VA -7.8%13 NH -7.4%14 MN -7.3%15 WA -7.3%16 AL -6.6%17 RI -6.6%18 NC -6.6%19 LA -6.2%20 GA -6.0%21 NY -5.9%22 MD -5.8%23 CT -5.7%24 US -5.7%
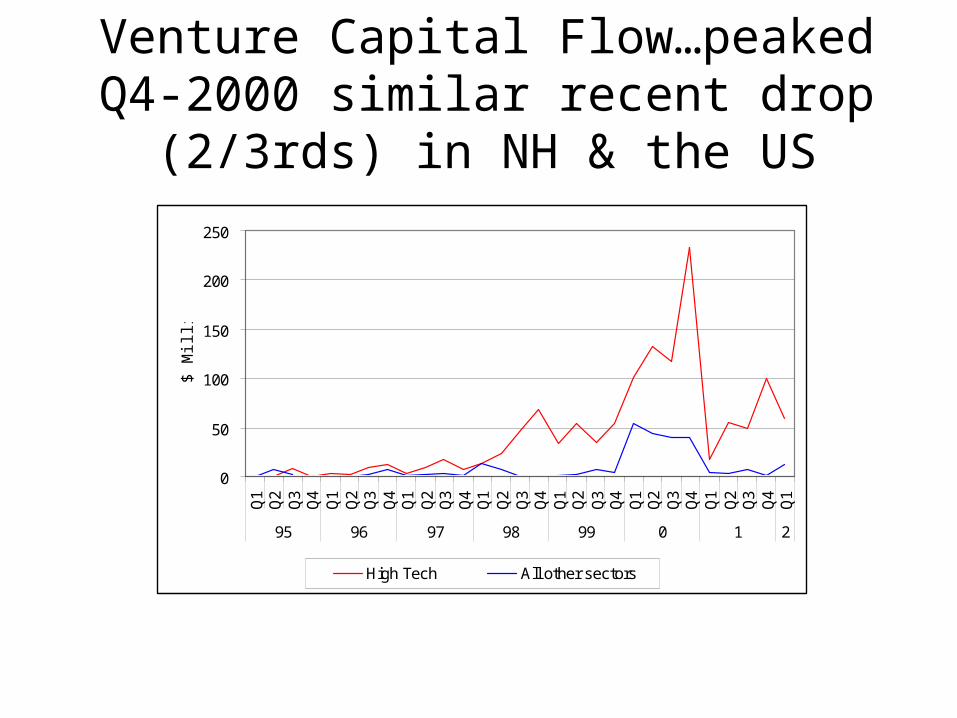
Venture Capital Flow…peaked Q4-2000 similar recent drop (2/3rds) in NH & the US
0
50
100
150
200
250
Q1
Q2
Q3
Q4
Q1
Q2
Q3
Q4
Q1
Q2
Q3
Q4
Q1
Q2
Q3
Q4
Q1
Q2
Q3
Q4
Q1
Q2
Q3
Q4
Q1
Q2
Q3
Q4
Q1
95 96 97 98 99 0 1 2
$ M
illio
n
High Tech All other sectors
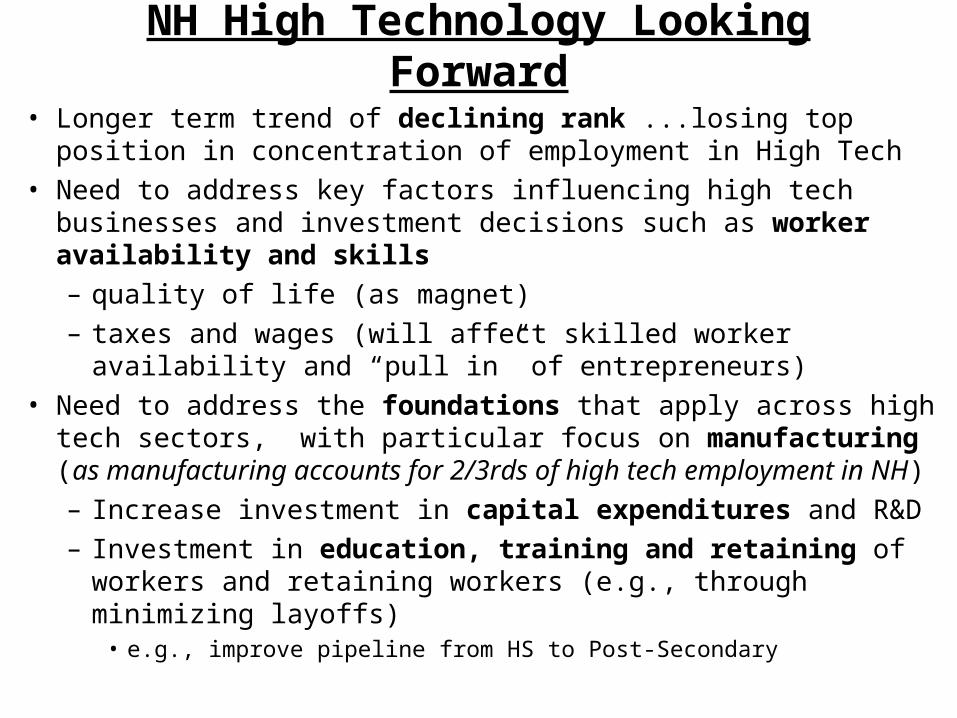
NH High Technology Looking Forward
• Longer term trend of declining rank ...losing top position in concentration of employment in High Tech
• Need to address key factors influencing high tech businesses and investment decisions such as worker availability and skills
– quality of life (as magnet)
– taxes and wages (will affect skilled worker availability and “pull in” of entrepreneurs)
• Need to address the foundations that apply across high tech sectors, with particular focus on manufacturing (as manufacturing accounts for 2/3rds of high tech employment in NH)
– Increase investment in capital expenditures and R&D
– Investment in education, training and retaining of workers and retaining workers (e.g., through minimizing layoffs)
• e.g., improve pipeline from HS to Post-Secondary