Embed Size (px)
Citation preview
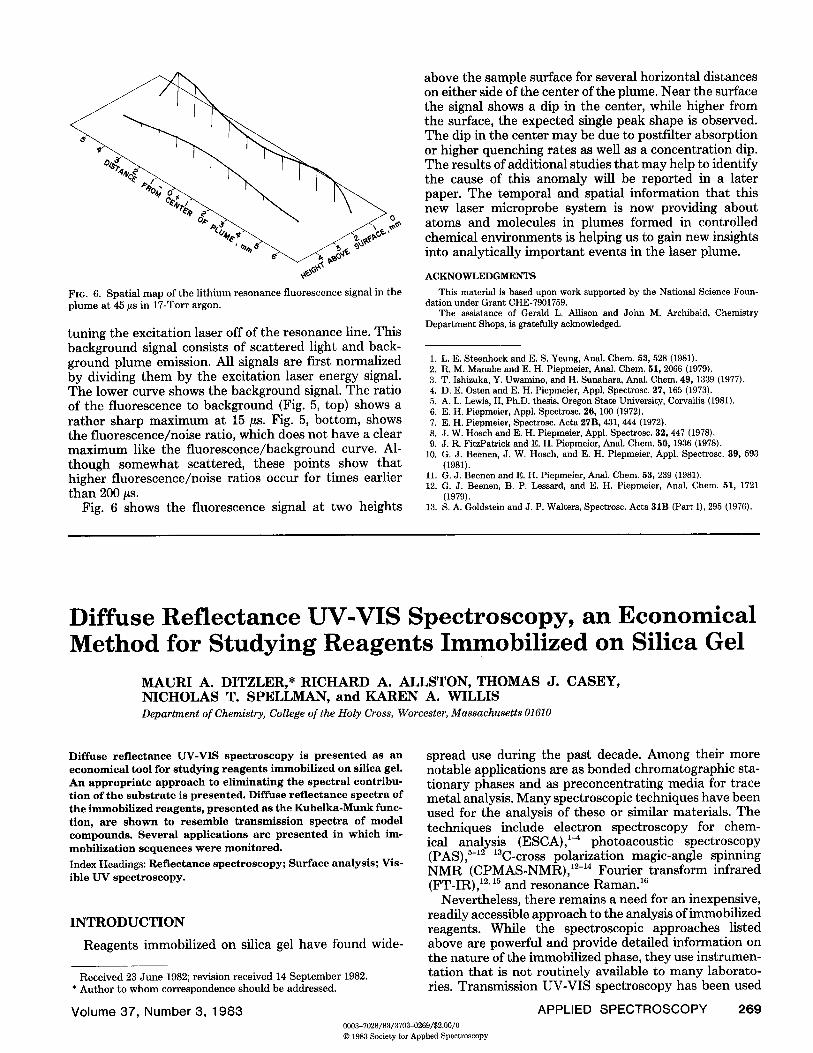
FIG. 6. Spatial map of the lithium resonance fluorescence signal in the plume at 45 #s in 17-Torr argon.
tuning the excitation laser off of the resonance line. This background signal consists of scattered light and back- ground plume emission. All signals are first normalized by dividing them by the excitation laser energy signal. The lower curve shows the background signal. The ratio of the fluorescence to background (Fig. 5, top) shows a rather sharp maximum at 15 ~s. Fig. 5, bottom, shows the fluorescence/noise ratio, which does not have a clear maximum like the fluorescence/background curve. Al- though somewhat scattered, these points show that higher fluorescence/noise ratios occur for times earlier than 200/~s.
Fig. 6 shows the fluorescence signal at two heights
above the sample surface for several horizontal distances on either side of the center of the plume. Near the surface the signal shows a dip in the center, while higher from the surface, the expected single peak shape is observed. The dip in the center may be due to postfilter absorption or higher quenching rates as well as a concentration dip. The results of additional studies that may help to identify the cause of this anomaly will be reported in a later paper. The temporal and spatial information that this new laser microprobe system is now providing about atoms and molecules in plumes formed in controlled chemical environments is helping us to gain new insights into analytically important events in the laser plume.
ACKNOWLEDGMENTS
This material is based upon work supported by the National Science Foun- dation under Grant CHE-7901759.
The assistance of Gerald L. Allison and John M. Archibald, Chemistry Department Shops, is gratefully acknowledged.
1. L. E. Steenhoek and E. S. Yeung, Anal. Chem. 53, 528 (1981). 2. R. M. Manabe and E. H. Piepmeier, Anal. Chem. 51, 2066 (1979). 3. T. Ishizuka, Y. Uwamino, and H. Sunahara, Anal. Chem. 49, 1339 (1977). 4. D. E. Osten and E. H. Piepmeier, Appl. Spectrose. 27, 165 (1973). 5. A. L. Lewis, II, Ph.D. thesis, Oregon State University, Corvallis (1981). 6. E. H. Piepmeier, Appl. Spectrosc. 26, 100 (1972). 7. E. H. Piepmeier, Spectrosc. Acta 27B, 431, 444 (1972). 8. J. W. Hosch and E. H. Piepmeier, Appl. Spectrosc. 32, 447 (1978). 9. J. R. FitzPatrick and E. H. Piepmeier, Anal. Chem. 50, 1936 (1978).
10. G. J. Beenen, J. W. Hosch, and E. H. Piepmeier, Appl. Spectrosc. 39, 593 (1981).
11. G. J. Beenen and E. H. Piepmeier, Anal. Chem. 53, 239 (1981). 12. G. J. Beenen, B. P. Lessard, and E. H. Piepmeier, Anal. Chem. 51, 1721
(1979). 13. S. A. Goldstein and J. P. Waiters, Spectrosc. Acta 31B (Part I), 295 (1976).
Diffuse Ref lectance UV-VIS Spectroscopy, an Economical Method for Studying Reagents Immobil ized on Silica Gel
MAURI A. DITZLER,* RICHAR D A. ALLSTON, THOMAS J. CASEY, NICHOLAS T. SPELLMAN, and KAREN A. WILLIS Department of Chemistry, College of the Holy Cross, Worcester, Massachusetts 01610
Diffuse re f lec tance UV-VIS s p e c t r o s c o p y is p r e s e n t e d as an e c o n o m i c a l too l for s t u d y i n g reagent s immobi l i zed on s i l ica gel. An appropr ia te approach to e l iminat ing the spectra l contribu- t ion o f the subs tra te is presented . Dif fuse re f l ec tance spectra of the immob i l i z ed reagents , p r e s e n t e d as the Kube lka -Mu n k func- t ion, are s h o w n to re semble t r a n s m i s s i o n spectra of mode l compounds . Severa l appl icat ions are p r e s e n t e d in which im- mobi l iza t ion s e q u e n c e s w e r e moni tored . Index Headings: Ref lec tance spec troscopy; Surface analys i s ; Vis- ible U V spec troscopy .
INTRODUCTION
Reagents immobilized on silica gel have found wide-
Received 23 June 1982; revision received 14 September 1982. * Author to whom correspondence should be addressed.
Volume 37, Number 3, 1983
spread use during the past decade. Among their more notable applications are as bonded chromatographic sta- tionary phases and as preconcentrating media for trace metal analysis. Many spectroscopic techniques have been used for the analysis of these or similar materials. The techniques include electron spectroscopy for chem- ical analysis (ESCA), 1-4 photoacoustic spectroscopy (PAS), 5-12 l~C-cross polarization magic-angle spinning NMR (CPMAS-NMR), 12-~4 Fourier transform infrared (FT_iR),12.1~ and resonance Raman. 16
Nevertheless, there remains a need for an inexpensive, readily accessible approach to the analysis of immobilized reagents. While the spectroscopic approaches listed above are powerful and provide detailed information on the nature of the immobilized phase, they use instrumen- tation that is not routinely available to many laborato- ries. Transmission UV-VIS spectroscopy has been used
APPLIED SPECTROSCOPY 269 0003-7028/83/3703-0269/$2.00/0 © 1983 Society for Applied Spectroscopy
with slurries of the modified silica gel in a solvent with an appropriate refractive index. 12 Although this provides a simple procedure, the solvent may modify intermolec- ular or surface-chromophore interactions that are often of interest. This report describes the analysis of immo- bilized phases as powders or pressed pellets with a routine ultraviolet-visible spectrophotometer equipped with a diffuse reflectance accessory. Since reflectance spheres are available at a modest cost for most commercial UV- VIS spectrophotometers this approach should be acces- sible to most laboratories.
Diffuse reflectance UV-VIS spectroscopy has long been used to study organic molecules adsorbed on silica gelJT, is Since the surface coverage by the bonded phases is much higher than that normally encountered in ad- sorption studies, this technique should provide sufficient sensitivity to study even minor side reactions. Although the UV-VIS spectrum obtained is generally not as rich in information as the spectra from some of the other tech- niques used (CPMAS-NMR or FT-IR), this study illus- trates that it is often useful in characterizing immobilized systems. This is consistent with the demonstrated value in this field of the analogous, but less widely available technique of UV-VIS PAS. 7-12
It has been widely shown that diffuse reflectance spec- tra resemble classical transmission spectra when the reflectance spectra are presented in terms of the Ku- belka-Munk function and the transmission spectra are presented in terms of adsorbance. 17' 18 Eq. (1) defines the Kubelka-Munk function, F(R~') , where R J represents the absolute reflectance of an infinitely thick sample.
(1 - R~') 2 F ( R J ) - (1)
2RJ
Absolute reflectance values (R J) are generally not ob- tained directly since the output from most commercial spectrometers is the reflectance of the sample relative to a reference material. In spectral regions where the sub- strate has minimal absorbance and thus gives nearly total reflection, it can be used as the spectroscopic ref- erence and R~' approximated by the experimentally de- termined relative reflectance of the immobilized phase. Since silica gel absorbs in the ultraviolet region this approach is not applicable here. Thus, the relative reflec- tance values are not a good approximation of the absolute reflectance and the experimentally determined values must be corrected to obtain values applicable to the Kubelka-Munk function. This can be accomplished as shown in Eq. (2)
R~' = (R~i)(Roo2)((Istd) (2)
where R~o~ is the experimentally determined reflectance of the immobilized system relative to silica gel, R~2 is the experimentally determined reflectance of silica gel rela- tive to BaS04 (a well-characterized reference), and astd is the absolute reflectance of BaS04, which is obtainable from the literatureJ 9 However, when corrected in this fashion, the F(RoJ) spectrum will contain information on both the reagent and substrate. Generally, it will be only the bonded reagent that is of interest so the substrate contributions must be eliminated by subtracting the Ku- belka-Munk function of the substrate from that for the reagent-substrate system as shown in Eq. (3).
2 7 0 Volume 37, Number 3, 1983
F(Roo' reagent) = F(R~lR~o2Ostd) - - F(Roc2crstd) (3)
It is important to note that this process is not mathe- matically equivalent to merely calculating the Kubelka- Munk function for the reflectance of the substrate-re- agent relative to the substrate (R®i), an approach which would be analogous to that used in transmission spec- troscopy.
I. EXPERIMENTAL
All spectra were obtained with a Perkin-Elmer model 559 UV-VIS spectrophotometer. The BaSO4-1ined inte- grating sphere accessory to this instrument was used to obtain the diffuse reflectance spectra.
All immobilized systems were diluted with silica gel prior to analysis. Systems represented in Figs. 1 to 3 were analyzed in the form of a 2.8-cm by 2-nun pellet pressed in a Carver pellet press at 4000 psi. The system repre- sented by Fig. 4 was obtained as a powder in a quartz cell with a cavity 2-ram deep. The reflectance spectra of the immobilized systems were measured relative to silica gel. The silica gel was measured relative to pressed SaSO4 plates. Absolute reflectance values of SaSO4 were inter- polated from the data presented in Ref. 19. These data were used to calculate F(R~' ) values as shown in Eq. (3).
Transmission spectra of model compounds were ob- tained in methanol.
The immobilized phases were prepared with type H Silica Gel, particle size 10 to 40 ftm, obtained from Sigma Chemical Company. The systems represented in Figs. 1, 2, and 4 were prepared in a manner analogous to that of Weetall. 2° However, in all cases but one (see "Dis- cussion"), the additional base, triethylamine, was deleted. The system represented in Fig. 3 was prepared as de- scribed by Lochm~ller et al. s Model compounds were prepared in a manner similar to that used for the corre- sponding immobilized system except n-butylamine was used in place of the immobilized n-propylamine. Also, reduction of the aromatic nitro compound to the corre-
0.8
8
LI.,
0.4
-0~ U 0 /-o0)S i- C-C-C-N-~ C-~> NO,
0 O O 0
! p 220 280
Wave length ~m]
°°i°°°Oooooo@ 34O
C
FIa. 1. Diffuse reflectance spectrum (Q) of the immobilized system diluted 7:1 in silica gel compared to the transmission spectrum ( ) of the model compound N-butyl-p-nitrophenylacetamide in methanol.
sponding amine was accomplished by hydrogenat ion with a P d / C catalyst instead of the sodium dithionite used for the immobilized system.
H. D I S C U S S I O N
Reflectance spectra of a series of immobilized reagents are shown in Figs. 1 to 4. In each case the transmission spect rum of a solvated, nonimmobilized, model com- pound is included for comparison. The model compounds are similar to the immobilized reagents except tha t the alkyl chain is not anchored. Except for solvent effects,
0,6'
0.3'
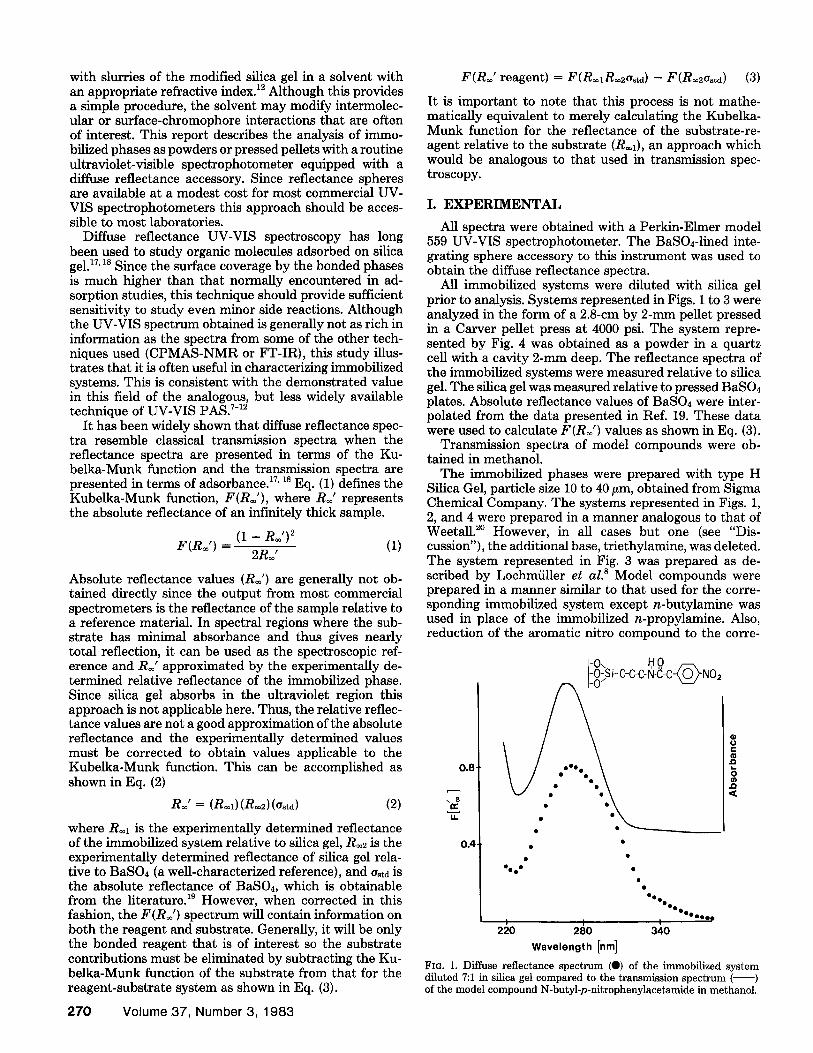
I-0\ I.;I Q /~XN H
OoooOOOOoo0
01
•lOll 2~o 28o 3~o 36o
Wavelength [nm]
FIG. 2. Diffuse reflectance spectrum (0) of the immobilized system. diluted 7:1 in silica gel compared to the transmission spectrum ( ) of the model compound N-butyl-p-aminophenylacetamide in methanol.
1.0
U.
0.5"
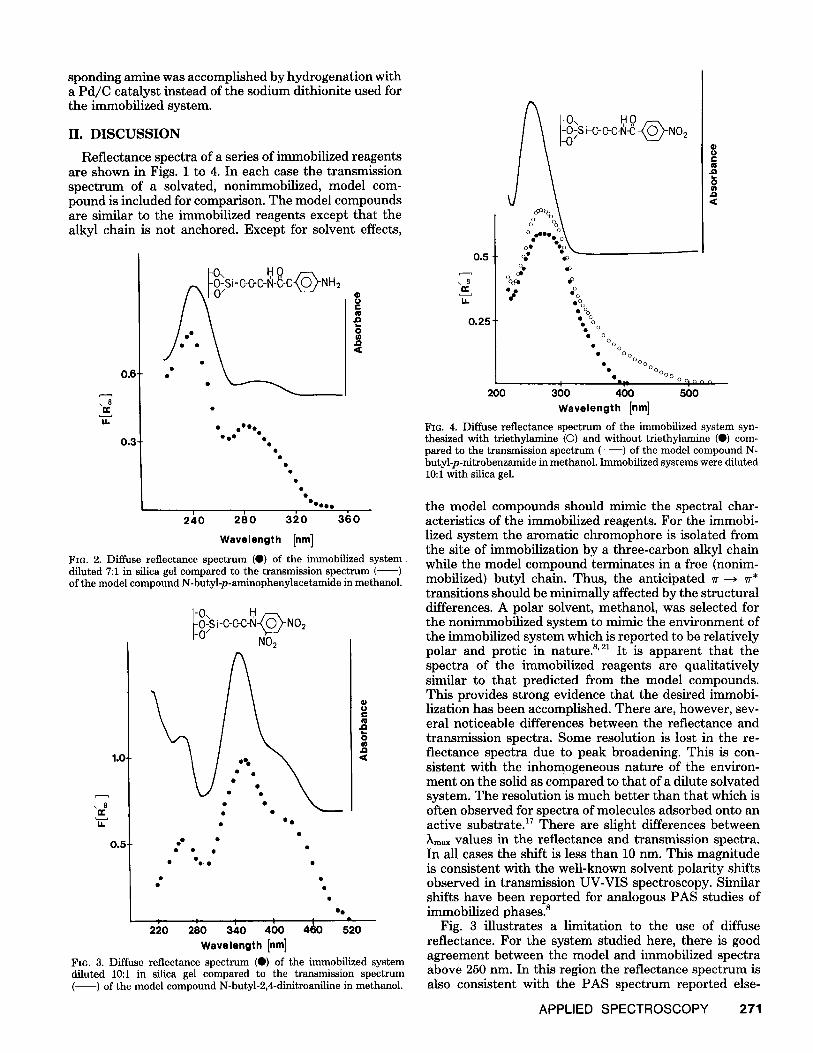
-0\ ~t 00 i- - -C-N NO2 NO2
• l •
o• •
• ° o • •
: •
0 C
0
,D
O l
0 = I I I • 220 280 340 400 460 520
Wavelength [nm] Fro. 3. Diffuse reflectance spectrum (O) of the immobilized system diluted 10:1 in silica gel compared to the transmission spectrum ( ) of the model compound N-butyl-2,4-dinitroaniline in methanol.
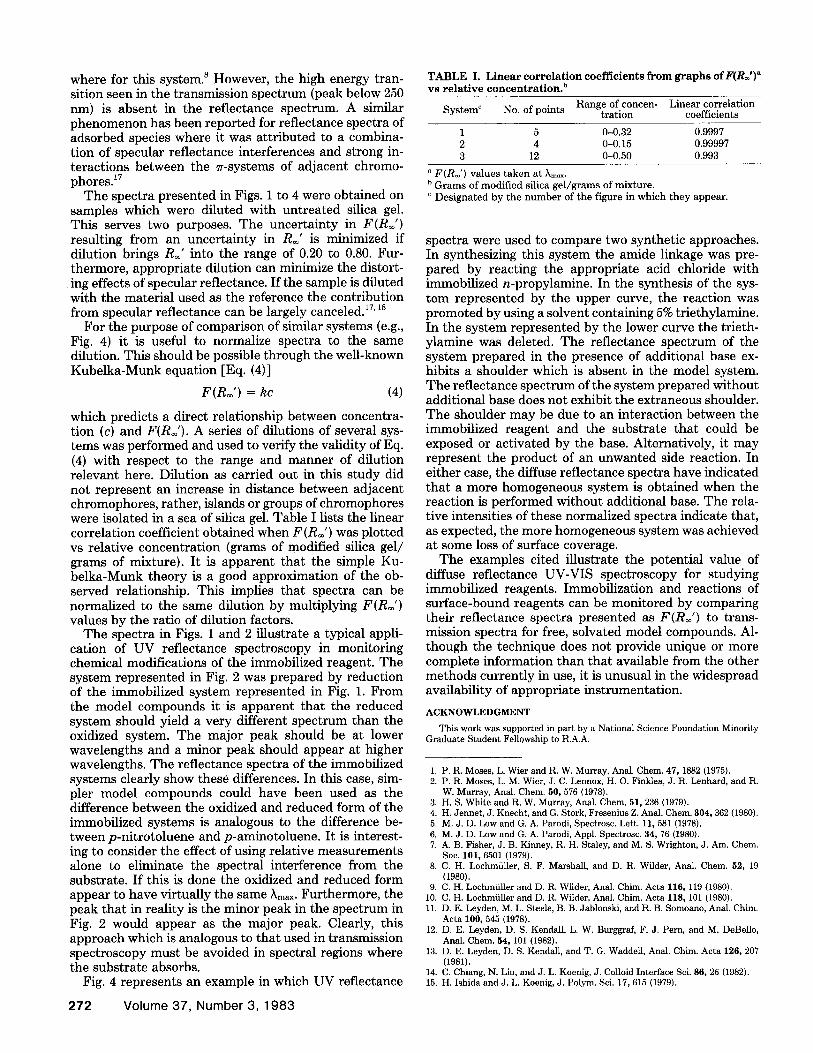
•1 -0\ ~ 0 :g s i-c-c-c-N- @NO
ffl
o• %°k._ 0.5 ~•
o ~ 8 ode qP = %.. .%
o% o%
0.25 ~%o • 0
G o • O
• 0 G °Ooo
o• Ooo ° I ° • l e ° q , n n n
200 300 400 500 Wavelength [nm]
FiG. 4. Diffuse reflectance spectrum of the immobilized system syn- thesized with triethylamine (©) and without triethylamine (O) com- pared to the transmission spectrum ( ) of the model compound N- butyl-p-nitrobenzamide in methanol. Immobilized systems were diluted 10:1 with silica gel.
the model compounds should mimic the spectral char- acteristics of the immobilized reagents. For the immobi- lized system the aromatic chromophore is isolated from the site of immobilization by a three-carbon alkyl chain while the model compound terminates in a free (nonim- mobilized) butyl chain. Thus, the anticipated ~r --~ vr* transit ions should be minimally affected by the structural differences. A polar solvent, methanol, was selected for the nonimmobilized system to mimic the environment of the immobilized system which is repor ted to be relatively polar and protic in nature, s'21 It is apparent tha t the spectra of the immobilized reagents are qualitatively similar to tha t predicted from the model compounds. This provides strong evidence tha t the desired immobi- lization has been accomplished. There are, however, sev- eral noticeable differences between the reflectance and transmission spectra. Some resolution is lost in the re- flectance spectra due to peak broadening. This is con- sistent with the inhomogeneous nature of the environ- men t on the solid as compared to tha t of a dilute solvated system. Th e resolution is much bet te r than tha t which is often observed for spectra of molecules adsorbed onto an active substrate} 7 The re are slight differences between kmax values in the reflectance and transmission spectra. In all cases the shift is less than 10 nm. This magnitude is consistent with the well-known solvent polari ty shifts observed in transmission UV-VIS spectroscopy. Similar shifts have been repor ted for analogous PAS studies of immobilized phases. 8
Fig. 3 illustrates a l imitation to the use of diffuse reflectance. For the system studied here, there is good agreement between the model and immobilized spectra above 250 nm. In this region the reflectance spectrum is also consistent with the PAS spectrum reported else-
APPLIED SPECTROSCOPY 271
where for this system, s However, the high energy tran- sition seen in the transmission spectrum (peak below 250 nm) is absent in the reflectance spectrum. A similar phenomenon has been reported for reflectance spectra of adsorbed species where it was attributed to a combina- tion of specular reflectance interferences and strong in- teractions between the at-systems of adjacent chromo- phores. 1~
The spectra presented in Figs. 1 to 4 were obtained on samples which were diluted with untreated silica gel. This serves two purposes. The uncertainty in F(R~') resulting from an uncertainty in R~' is minimized if dilution brings R J into the range of 0.20 to 0.80. Fur- thermore, appropriate dilution can minimize the distort- ing effects of specular reflectance. If the sample is diluted with the material used as the reference the contribution from specular reflectance can be largely canceled. 17' is
For the purpose of comparison of similar systems (e.g., Fig. 4) it is useful to normalize spectra to the same dilution. This should be possible through the well-known Kubelka-Munk equation [Eq. (4)]
F(R=') = kc (4)
which predicts a direct relationship between concentra- tion (c) and F(R~'). A series of dilutions of several sys- tems was performed and used to verify the validity of Eq. (4) with respect to the range and manner of dilution relevant here. Dilution as carried out in this study did not represent an increase in distance between adjacent chromophores, rather, islands or groups of chromophores were isolated in a sea of silica gel. Table I lists the linear correlation coefficient obtained when F(R~') was plotted vs relative concentration (grams of modified silica gel/ grams of mixture). It is apparent that the simple Ku- belka-Munk theory is a good approximation of the ob- served relationship. This implies that spectra can be normalized to the same dilution by multiplying F(RJ) values by the ratio of dilution factors.
The spectra in Figs. 1 and 2 illustrate a typical appli- cation of UV reflectance spectroscopy in monitoring chemical modifications of the immobilized reagent. The system represented in Fig. 2 was prepared by reduction of the immobilized system represented in Fig. 1. From the model compounds i t is apparent that the reduced system should yield a very different spectrum than the oxidized system. The major peak should be at lower wavelengths and a minor peak should appear at higher wavelengths. The reflectance spectra of the immobilized systems clearly show these differences. In this case, sim- pler model compounds could have been used as the difference between the oxidized and reduced form of the immobilized systems is analogous to the difference be- tween p-nitrotoluene and p-aminotoluene. It is interest- ing to consider the effect of using relative measurements alone to eliminate the spectral interference from the substrate. If this is done the oxidized and reduced form appear to have virtually the same k . . . . Furthermore, the peak that in reality is the minor peak in the spectrum in Fig. 2 would appear as the major peak. Clearly, this approach which is analogous to that used in transmission spectroscopy must be avoided in spectral regions where the substrate absorbs.
Fig. 4 represents an example in which UV reflectance
272 Volume 37, Number 3, 1983
T A B L E I. Linear corre la t ion coeff ic ients from graphs ofF(R=')" vs re la t ive concentrat ion , b
Range of concen- Linear correlation System ¢ No. of points tration coefficients
1 5 0-0.32 0.9997 2 4 0-0.15 0.99997 3 12 0-0.50 0.993
" F ( R ~ ' ) values taken at km~. Grams of modified silica gel/grams of mixture.
c Designated by the number of the figure in which they appear.
spectra were used to compare two synthetic approaches. In synthesizing this system the amide linkage was pre- pared by reacting the appropriate acid chloride with immobilized n-propylamine. In the synthesis of the sys- tem represented by the upper curve, the reaction was promoted by using a solvent containing 5% triethylamine. In the system represented by the lower curve the trieth- ylamine was deleted. The reflectance spectrum of the system prepared in the presence of additional base ex- hibits a shoulder which is absent in the model system. The reflectance spectrum of the system prepared without additional base does not exhibit the extraneous shoulder. The shoulder may be due to an interaction between the immobilized reagent and the substrate that could be exposed or activated by the base. Alternatively, it may represent the product of an unwanted side reaction. In either case, the diffuse reflectance spectra have indicated that a more homogeneous system is obtained when the reaction is performed without additional base. The rela- tive intensities of these normalized spectra indicate that, as expected, the more homogeneous system was achieved at some loss of surface coverage.
The examples cited illustrate the potential value of diffuse reflectance UV-VIS spectroscopy for studying immobilized reagents. Immobilization and reactions of surface-bound reagents can be monitored by comparing their reflectance spectra presented as F(R=') to trans- mission spectra for free, solvated model compounds. Al- though the technique does not provide unique or more complete information than that available from the other methods currently in use, it is unusual in the widespread availability of appropriate instrumentation.
ACKNOWLEDGMENT
This work was supported in part by a National Science Foundation Minority Graduate Student Fellowship to R.A.A.
1. P. R. Moses, L. Wier and R. W. Murray, Anal. Chem. 47, 1882 (1975). 2. P. R. Moses, L. M. Wier, J. C. Lennox, H. O. Finktea, J. R. Lenhard, and R.
W. Murray, Anal. Chem. 50, 576 (1978). 3. H. S. White and R. W. Murray, Anal. Chem. 51, 236 (1979). 4. H. Jennet, J. Knecht, and G. Stork, Fresenius Z. Anal. Chem. 304, 362 (1980). 5. M. J. D. Low and G. A. Parodi, Spectrosc. Lett. 11, 581 (1978). 6. M. J. D. Low and G. A. Parodi, Appl. Spectrosc. 34, 76 (1980). 7. A. B. Fisher, J. B. Kinney, R. H. Staley, and M. S. Wrighton, J. Am. Chem.
Soc. 101, 6501 (1979). 8. C. H. Lochmtiller, S. F. Marshall, and D. R. Wilder, Anal. Chem. 52, 19
(1980). 9. C. H. Lochmililer and D. R. Wilder, Anal. Chim. Acta 116, 119 (1980).
I0. C. H. LochmtiUer and D. R. Wilder, Anal. China. Acta 118, i01 (1980). ii. D. E. Leyden, M. L. Steele, B. B. Jablonski, and R. B. Somoano, Anal. Chim.
Aeta 100, 545 (1978). 12. D. E. Leyden, D. S. Kendall, L. W. Burggraf, F. J. Pern, and M. DeBello,
Anal. Chem. 54, 101 (1982). 13. D. E. Leyden, D. S. Kendall, and T. G. WaddeU, Anal. Chim. Acta 126, 207
(1981). 14. C. Chiang, N. Liu, and J. L. Koenig, J. Colloid Interface Sci. 86, 26 (1982). 15. H. Ishida and J. L. Koenig, J. Polym. Sci. 17,615 (1979).
16. H. Ishida, J. L. Koenig, and M. E. Kenney, Proceedings of the 34th Annual Conference on Reinforcement Plastic Composition Institute, Society of Plas- tics Industrialists, 17B (1979); Chem Abstr 91, 212041t.
17. G. Kortum, Reflectance Spectroscopy (Springer-Verlag, New York, 1969). 18. R. W. Frei and J. D. MacNefl, Diffuse Reflectance Spectroscopy in Environ-
mental Problem.Solving (CRC Press, Cleveland, O, 1973). 19. F. Grum and T. E. Wightman, Appl. Opt. 16, 2776 {1977). 20. H. H. Weetall, Biochim. Biophys. Acta 212, 489 {1974). 21. C. H. Lochmfiiler, D. R. Wilder, and D. B. Marshall, Anal. Chim. Acta 130,
31 (1981).
The Application of Fast Fourier Transform and Convolution Techniques to Picosecond Continuum Spectroscopy
K. L. SALA, R. W. YIP, and R. LeSAGE National Research Council of Canada, Division of Chemistry, Ottawa, Ontario, Canada KIA OR6
The use of the fast Fourier transform in the processing of photographic data obtained from picosecond continuum spec- troscopy is described. The resulting reduction in the complexity and computation time has permitted all of the data acquisition and processing to be carried out with an eight-bit microcom- puter. Specific examples of some key problems in the data processing that are peculiar to this spectroscopic technique and methods of overcoming these problems arc discussed. Exper i - m e n t a l results that serve to illustrate both the experimental technique itself as wel l as the versatility and reliability of the data processing algorithm are presented for the transient ab- s o r p t i o n of a Cr(III) complex in solutions. Index Headings: Time-resolved spectroscopy; Computer, appli- cations.
INTRODUCTION
The measurement of transient absorption spectra by means of a picosecond continuum 1 generated by an in- tense ultrashort laser pulse, picosecond continuum spec- troscopy, has established itself as a valuable and broadly applicable spectroscopic technique in a relatively short period. 2-4 Indeed, there are many instances in which the direct measurement of such transient spectra is possible by no other means. As spectroscopic techniques fare, however, picosecond continuum spectroscopy is charac- terized by an apparently unavoidable need to collect and process inordinately large amounts of data in order to arrive at a final result possessing even modest accuracy. As an example, with the now familiar pump-probe ge- ometry with a multi-step echelon to time resolve the changing spectrum, the measurement of a single relaxa- tion time constant may involve several laser shots with each producing a series of spectra with individual widths of several thousand angstroms. With the ultimate relia- bility of the final result depending largely on how accu- rately one can correlate the complete sequence of spectra in the face of inevitable variations in such parameters as the shot-to-shot laser pulse and continuum intensities as well as spatial variations across the beam profiles, the
Received 16 July 1982; revision received 6 October 1982.
Volume 37, Number 3, 1983
level of confidence in the interpretation of measurements by this technique is principally determined by the degree of sophistication and control in the data processing rou- tine. It is not altogether surprising, therefore, that, in many instances past, the desire to keep the complexity and the time required for data processing to a pragmat- ically reasonable level has resulted in the application of the technique being as much qualitative as quantitative in its findings.
Building on a thorough understanding of the detailed characteristics of the nature of the picosecond contin- uum,~. 6 the present authors undertook to develop a ver- satile and powerful hardware/software system that would automate, simplify, and greatly speed up both the data acquisition and data processing tasks. The subject of this paper is the description, in judicious detail, of the essential characteristics of both the hardware implemen- tation and the algorithm design which realize the objec- tives mentioned above. As a measure of the success of the system implementation, a reduction by more than 1 order of magnitude in the total processing time has been realized to the point where the actual processing of the data is now, from the user's point of view, the simplest, fastest, and most reliable facet of the overall experimen- tal process.
I. EXPERIMENTAL DESIGN
The experiment uses a Nd:glass (silicate) laser, rod size 6 in. by ¾ in., which is passively mode locked by a 3-mm thick dye cell containing Kodak 9740 dye and set at the Brewster angle. The approximately 1-m long cavity is formed by a plane, partially reflecting output mirror and a 5-m radius of curvature spherical mirror, the latter being a 100% reflector and adjacent to the dye cell. An intracavity iris is used to partially limit the extent of the transverse mode structure and beam divergence. The laser oscillator produces a train of picosecond pulses with a duration of typically 400 ns (-~60 pulses) and with individual 1060 nm picosecond pulse energies of approx- imately 1 mJ. Immediately following the oscillator, a conventional Pockels cell/crossed polarizers/laser trigger
APPLIED SPECTROSCOPY 273 0003-7028/83/3703-0273/$2.00/0 © 1983 Society for Applied Spectroscopy

![Multi-Step Application of Immobilized Reagents and ... · application of the asymmetric Mukaiyama aldol reaction de-veloped by Kiyooka (Scheme 3).[33] Aldol reaction, mediated by](https://img.pdfslide.us/doc/110x75/5f07e4017e708231d41f4531/multi-step-application-of-immobilized-reagents-and-application-of-the-asymmetric.jpg)